
Submitted:
12 December 2025
Posted:
17 December 2025
You are already at the latest version
Abstract
The incidence of technologies created with the support of federal funding at universities and federal laboratories that are transferred to the private sector is nowhere close to its potential. The literature suggests that technology maturity level can possibly be a useful lever to increase the incidence of technology transfer. Orthodox approaches to technology transfer research have significant limitations that negatively impact their usefulness for investigating this issue. This paper presents a theoretical framework to address this gap and the results of a study that applied this framework in combination with Bayesian analysis to understand whether technology maturity level holds promise as a lever that practitioners and policymakers can use to substantially increase the incidence and societal benefits of technology transfer from universities and federal laboratories. The results of the study indicate that there is about a 55% probability that insufficient maturity is the primary reason that private sector organizations do not pursue 5% or more of available university and federal laboratory technologies. Thus, implementing public policies, programs, and initiatives to further mature technologies created at universities and federal laboratories that private sector firms would otherwise eschew because of insufficient maturity is likely to increase the overall incidence of technology transfer slightly but even a slight increase could produce substantial societal benefits. The potential economic benefits of commercializing such technologies are roughly 1.7 to 2.4 times greater than strategically redistributing the research funding used to create them to induce consumption and spur economic activity.
Keywords:
science policy
; technology policy
; university technology transfer
; federal laboratory technology transfer
; technology transfer frameworks
; theories
; and models
; technology transfer research methodologies
; supply-side perspective
; Bayesian analysis
Introduction
Despite the advances in our understanding of technology transfer as a phenomenon, the incidence of technologies created with the support of federal funding by universities and federal laboratories that are transferred to the private sector for use that benefits society is nowhere close to its potential (see Figure 1). It is estimated that no more than 5% of such technologies were licensed prior to 1980 (Schacht, 2012). This only increased to roughly 18% by the end of the first two decades of the 21st century (see Table 1). But this estimate likely overstates the number of technologies that have positively impacted the lives of people and society because not every licensed technology is a commercial success.
The natural question that this observation raises is why has technology transfer research not led to a significantly higher incidence of successful technology transfer? A reasonable conjecture is that the theoretical paradigms that guide and facilitate orthodox technology transfer research are not sufficient. They likely do not explain enough of the factors that contribute to the conveyance to the private sector of technologies created at universities and federal laboratories.
An area where scholars have argued that further effort is desperately needed in research on aspects of invention and innovation, such as technology transfer, is the incorporation of sociological factors. Economics based theories are prevalent in technology transfer research. However, various problems in applying classical economics to studying innovation reveal that “…sociological data may be urgently needed for economic analysis of inventive activity” (Nelson, 1962, p. 8). This seems to be lacking in most studies of university technology transfer.
This theoretical gap is not trivial. It likely has far-reaching implications for technology transfer research, which in turn can influence public policy and practice. While theories function as explanations of phenomena, they also can constrict the focus of research and the perspective from which research is pursued, which creates empirical gaps. Theories, frameworks, and models (i.e., analytical paradigms) also constrain the methodologies that one can employ to conduct studies, which can limit scholars’ investigations of various aspects and dimensions of technology transfer.
These theoretical limitations are likely a primary reason that most university technology transfer research seems to focus either on studying the phenomenon from the perspective of universities and research institutions or examining intra-organizational technology transfer within large multinational private sector firms, while relatively few efforts have been made to investigate university technology transfer from the demand-side perspective (Bengoa et al., 2020). University technology transfer from the perspective of private sector firms, particularly small and medium-sized enterprises, seems to be understudied.
One area where this theoretical gap has produced a void in the technology transfer literature relates to what causes private sector firms not to license a given technology. In other words, what causal factors determine whether decision makers in private sector firms will decide to license a technology and pursue its commercialization or not? Exploring this question has the potential to improve our understanding of what is needed to increase the incidence and societal benefit of technology transfer from universities and federal laboratories.
In addition to anecdotal evidence from practitioners, there is some evidence in the literature to suggest that technology maturity level is an important but understudied causal factor for the occurrence of technology transfer that may play a significant role in whether decision makers in private sector firms decide to license and pursue the commercialization of technologies created at federal laboratories and universities (see e.g., Thursby & Thursby, 2001; Townes, 2022, 2024). However, the literature is remarkably silent on the topic of technology maturation practices and their association with successful technology transfer (Battaglia et al., 2021). Much is still not understood and has not been examined about technology maturity level and its implications for technology transfer policy and practice. For example, what potential impact can university and federal laboratory administrators have on the incidence and societal benefits of technology transfer with programs and initiatives that aim to further mature the technologies that researchers in their organizations create? The answer to this question has significant implications for the practice of technology transfer and the formulation of technology transfer policy. This paper presents the results of a study that explored this question. It also details a new theoretical framework that was used to facilitate the investigation.
Literature Review
Much of the literature concerning technology maturity level in the context of technology transfer focuses on defining what it is, how to measure it, and whether it is important for the occurrence of technology transfer (see e.g., Mohammad et al., 2017; Munteanu, 2012; Nolte, 2008; Queiroz et al., 2022; Townes, 2022, 2024). Examinations of technology maturity level are often context specific (see e.g., Lopez et al., 2023; Nassani et al., 2024; Rybicka et al., 2016). Few studies have delved into understanding how important (i.e., the degree of significance) the maturity level of a technology is in private sector decision makers’ judgements about whether to license a technology or the degree to which insufficient maturity encumbers the incidence of technology transfer.
Townes (2022) provides some insight into the question of how important technology maturity level is for decision makers in private sector firms. This study demonstrated that a maturity level that is the equivalent of at least level 6 or greater on the NASA technology readiness level (TRL) scale is likely an INUS condition for the conveyance of technologies created at universities to private sector firms. However, the analysis also indicated that there were likely other scenarios in which the maturity level of a technology was not a consideration. This suggests that a minimum technology maturity level may not be a criteria for decision makers in all private sector firms or in all situations.
The analytical paradigms currently used to investigate technology transfer are not well suited to understanding what potential impact university and federal laboratory administrators can have on the incidence of technology transfer with programs and initiatives that aim to further mature the technologies that researchers in their organizations create (see Table 2). These analytical paradigms have significant epistemological implications because they establish the boundaries for what phenomena can be examined, how those phenomena are examined, and how results are interpreted.
At its core, technology transfer is a psycho-sociological phenomenon with economic implications. The study of technology transfer can likely be made significantly more effective with multidisciplinary approaches. However, a cursory review of the literature reveals that most methodologies tend to stress the perspective of a single discipline over all others. There is also a heavy emphasis on economics-based theory that is often applied in ways that can obscure true underlying causal factors and often do not lend themselves to examining the psycho-sociological dimensions of technology transfer.
Although various analytical paradigms have been applied to provide different insights into the phenomenon of technology transfer, they all have significant limitations as it relates to the focus of this investigation and examinations of other aspects of technology transfer (see Table 1). Most of the analytical paradigms that are used tend to emphasize the perspective of supply-side actors (e.g., universities, research organizations, federal laboratories) even in the cases where demand-side actors are taken into consideration. They also seem to push studies of technology transfer towards a focus on factors exogeneous to the technology transfer process and the technology itself. Various applications of orthodox technology transfer research paradigms often seem to be exemplars of the idiom about forcing square pegs into round holes. While the peg will indeed “fit” if the hole is made big enough, the fit will not be good and there will be gaps between the peg and the hole.
Most of the analytical paradigms identified seem primarily suited to either descriptive or correlational research. Descriptive research is limited to communicating the characteristics of technology transfer related phenomena without concern for causal explanations. At the other end of the analytical spectrum, multiple regression analysis is a popular method for correlational research on technology transfer. However, such analyses can only establish associations among variables and cannot alone establish reliable claims about causation. What are frequently identified in the literature as determinants of successful technology transfer are often simply conditions that tend to correlate with measures used as proxies for the occurrence of technology transfer or its outcomes. The adage that correlation does not mean causation often seems to be forgotten when it comes to efforts to apply the results of such research to practice. Consequently, the causal factors identified from studies that employ such methods are potentially spurious, which has significant epistemological implications. At best, such correlational research can only present causal postulations.
In addition to being heavily biased towards economics-based approaches, the predominant analytical paradigms often take the organization as the unit of analysis and employ the “organization as organism” metaphor. While the “organization as organism” metaphor was a seminal advancement in organization studies, it has inherent limitations which have spurred debate about its analytical value. Critiques of the representation note that it tends to oversimplify the complexity of organizations and actually hinders conceptual advancements, particularly in contexts where understanding the role of human agency is vital (see e.g., Barter & Russell, 2013; Cummings & Thanem, 2002). Technology transfer is such a context.
Inquiries that take the organization as the unit of analysis and apply the “organization as organism” metaphor either minimize or altogether eliminate the human element. In doing so, they ignore the psycho-sociological dimensions of technology transfer. This has the potential to detrimentally distort our understanding of technology transfer and greatly limits the ability of scholars, policymakers, and practitioners to identify options and pursue initiatives that will increase the incidence of technology transfer from universities and federal laboratories.
Model development is a predominant stream of inquiry in technology transfer research and scholars have developed a plethora of models to examine technology transfer in various contexts (see Arenas & González, 2018; Barros et al., 2020). The literature describing these models generally does not explicitly specify the underlying theories from which the models are derived. Instead, they typically only outline the concepts that support them. In fact, the models themselves tend to be conceptual frameworks rather than theoretical explanations.
Conceptual frameworks are structures of connected concepts that delineate the relationships among variables within a specific research study (Jabareen, 2009). In contrast, theoretical frameworks are more structured analytical points of view that are rooted in accepted theory and form the basis for formulating hypotheses, steering research designs, and interpreting study results (French et al., 2012; Grant & Osanloo, 2014). In short, conceptual frameworks emphasize connections among concepts while theoretical frameworks concentrate on explanations of the mechanisms of phenomena applying the latest accepted theories (Andrews & Boklage, 2023; Grant & Osanloo, 2014).
The models presented in the literature on the transfer of technology from research organizations to private sector firms tend to be standalone representations that focus on small, distinct facets of the technology transfer phenomenon. This is in marked contrast to the grand theories of the natural and physical sciences that tend to absorb or supplant previous theories while expanding the frontier of the phenomena within a discipline that can be understood and explained. The technology transfer models found in the literature often examine technology transfer in a very fragmented piecemeal manner without necessarily contributing to a holistic view.
Although model development is a predominant stream of inquiry for technology transfer research, it is not the same as theory development. The systematic reviews of the technology transfer literature do not identify theory development as a major line of inquiry in technology transfer research (see e.g., Anatan, 2015; Barros et al., 2020; Bengoa et al., 2020). This fact in conjunction with the proliferation of models in technology transfer research that are largely conceptual frameworks rather than theoretical explanations suggests that there is a need for research that aims to develop unifying grand theories with broad explanatory power to better understand and predict technology transfer phenomena.
Consequently, the prevalent analytical paradigms used to study technology transfer are somewhat lacking as theoretical groundings for an investigation that aims to understand what potential impact university and federal laboratory administrators can have on the incidence and societal benefits of technology transfer with programs and initiatives that aim to further mature the technologies that are created at their organizations and for which these organizations have both a legal and moral responsibility to facilitate their application for the betterment of society. If a significant number of firms decline to license university or federal laboratory technologies because the technologies are insufficiently mature and if insufficient maturity has consistently been a primary reason that firms have eschewed university and federal laboratory technologies over the years, then it stands to reason that increasing the maturity level of technologies created at universities and federal laboratories would result in firms choosing to license more of such technologies and pursue their commercialization. As such, to determine whether technology maturity level holds promise as a lever that practitioners and policymakers can use to increase the incidence and societal benefits of university technology transfer, this inquiry focused on examining the following hypotheses:
H1.
The historical probability () that a solicited private sector firm would decline to license and pursue the commercialization of (i.e., eschew) a technology created at a federal laboratory or university in the USA because the technology was insufficiently mature () has historically been a consequential encumbrance on the incidence of technology transfer (). This is denoted as follows:
H2.
The current probability () that a solicited private sector firm will eschew a technology created at a federal laboratory or university in the USA because the technology is insufficiently mature (
) remains a consequential encumbrance on the incidence of technology transfer ( ). This is denoted as follows:
H3.
The potential societal benefit (PSB) of technologies created at federal laboratories and universities in the USA which solicited private sector firms eschew because the technologies are insufficiently mature () is consequential (i.e., greater than or equal to the PSB of alternative uses of the federal research funding). This is denoted as follows:
In each of the hypotheses above, the concept of “consequential” needed to be operationalized. For H1 and H2, greater than or equal to 0.05 was established as the criteria for consequential based on the tradition of p-value in academic research. In applying frequentist statistics to determine the significance of research results, a p-value of 0.05 is traditionally the least restrictive benchmark and is interpreted as representing the probability of observing a result as extreme or more extreme as that which one has obtained assuming the null hypothesis is true. By similarity, if the probability that a solicited private sector firm will eschew a technology for a given reason is greater than or equal to 0.05, the reason is considered a consequential encumbrance on the incidence of technology transfer.
In the case of H3, consequential was operationalized in terms of relative potential societal benefit (PSB), which was implemented in two ways. The first operationalization used economic impact. For the purposes of the study, economic impact was measured in terms of the potential final demand output (PFDO). The criterion for consequential was established based on consideration of the PFDO that could be generated from maturing and licensing technologies that private sector firms would otherwise eschew because of insufficient maturity compared to the PFDO that could be generated if the amount of federal funding provided to create the technologies was strategically redistributed to constituents to spur consumption. Thus, the first operationalization of H3 is more precisely specified as follows:
H3a.
The second operationalization of PSB used job creation. For the purposes of the study, job creation was measured using potential final demand employment (PFDE). The criterion for consequential was established by considering the PFDE that could be generated from maturing and licensing technologies that private sector firms would otherwise eschew because of insufficient maturity compared to the PFDE that could be generated if the federal government strategically redistributed the amount of funding provided to create the technologies to constituents to spur consumption, which would increase overall economic activity. Theoretically, this increased overall economic activity would induce job creation. Thus, the second operationalization of H3 is more specifically stated as follows:
H3b.
Examining the hypotheses above facilitated answering the question of whether implementing programs and initiatives that aim to increase the maturity level of technologies is a reasonable approach for increasing the incidence and societal impact of technology transfer from universities and federal laboratories. This will help provide practitioners and policymakers with clarity regarding their options for specific actions to increase the effectiveness of technology transfer activities in the USA.
Data and Methods
This section describes the methodology used for the study. It begins by defining the constructs of technology and technology transfer as applied in the study. It then explains the theoretical framework used to ground the investigation and interpretation of the analytical results. Finally, the data that were used in the study and the methods used to analyze the data are described.
Defining Technology and Technology Transfer
For the purposes of this examination, technology was defined as culturally influenced information that social actors use to pursue the objectives of their motivations, and which is embodied in such a manner to enable, hinder, or otherwise control its access and use (see Townes, 2022, 2024, 2025). University technology transfer was defined as technology (as specified above) created by university or federal laboratory researchers through their use of systematic methods and practices of inquiry in their role as employees of their universities or federal laboratories that is knowingly and willingly conveyed to other parties with the expectation that the technology will be applied in a setting or context in which it has not previously been applied to achieve an end (see Townes, 2022).
A Human-Centered Framework
Given the critiques of the analytical paradigms used in orthodox technology transfer research, a new theoretical framework was developed to facilitate the investigation of technology maturity level as a potential lever for increasing the incidence and societal benefits of technology transfer. A framework that specifically draws from sociology, organization studies, and behavioral economics was used for this examination. To ground the study and facilitate interpretation of the results, a theoretical framework that accommodates the psycho-sociological dimensions of university technology transfer was desired. Thus, the framework is human centered by necessity. However, developing a framework that also aligns with the results of other investigations that successfully and correctly explain various facets of technology transfer was also a goal.
This theoretical framework (henceforth referred to as the human-centered framework or HCF for convenience) is built upon several core premises. First, humans create institutions (i.e., rules, values, beliefs, and patterns of social behavior) and organizations to perform coordinated actions that impact the physical and social world in such a way as to produce an actual future reality that resembles a desired future reality as closely as possible. Second, all activities attributed to organizations manifest through the activities of the members of the organization. Thus, technology transfer and other actions attributed to organizations are psycho-sociological phenomena at their most fundamental level. Third, the scientific examination of sociological phenomena requires understanding the “contextual meaning of action” and thus necessitates explanations of the behavior of human individuals because human individuals are the “sole understandable agents of meaningfully oriented action” (Weber, 1921-1922/2019, pp. 90-91). Fourth, macro-level organizational phenomena manifest through micro-level factors. Finally, the ideal theoretical framework is one that accurately represents the phenomena of consideration while stripping away unnecessary complexity and aligns with the results of other frameworks, theories, and models that correctly explain various facets of the phenomena.
Organizational decision-making is at the heart of this inquiry into the usefulness of technology maturity as a lever to increase the incidence and societal benefits of technology transfer. It is a multifaceted process, and scholars have explored many of its dimensions. But the approaches that most organizational theorists use to study organizational decision-making often obscure its psycho-sociological factors. However, several theorist have broached this issue.
Although more recent publications often receive more interest than older works, the insights of previous generations of scholars are particularly useful for the inquiry at hand. One such work is the administrative theory that Simon (1945/1997) proposed, which is a seminal contribution in organization studies. It sought to deepen our understanding of phenomena attributed to organizations. This verbal conceptual framework focused on the decision processes that organization members employ. The organization as a construct is conceptualized as a pattern of communications and human relations formed to carry out two primary functions – making decisions and taking actions (Simon). Deciding and acting are inextricably linked, somewhat analogous to entangled quantum particles in physics. When particles have entangled quantum states, measuring one particle’s quantum state provides complete information about the other particles quantum state (Musser, 2015). Likewise, knowledge of organizational actions and their consequences provides information about organizational decisions and their underlying decision premises and vice versa.
The behavioral theory of the firm (BTF) is another landmark work that is particularly useful for this inquiry. The BTF sought to explain the economic decision making of businesses in a way that connects economic research and organization research (Cyert & March, 1963). The theory as originally presented is also a verbal conceptual theory which comprises three core concepts that function as variable categories which are connected by four relational concepts (see Figure 2).
Although both Simon’s administrative theory (SAT) and the BTF make strides to address the psycho-sociological nature of organizational decision making and offer compelling concepts, they are not without their shortcomings. While SAT offers a more accurate representation of decision making in organization contexts which makes it a more suitable for understanding and examining real-world scenarios (Goolkasian, 1996), its critics argue that empirical demonstration of its concepts is limited, it oversimplifies organizational decision-making, and it ignores power dynamics (see Cunha, 2022; Estrada, 2010; Schumacher & Thysen, 2022). Critiques of the BTF have noted that it does not adequately consider the influence of extra-organizational factors, ignores collaborative coalitions in organizational decision making, and presents a somewhat static conception of the firm (Akard, 1995; Hayward & Broady-Preston, 1994; Holdsworth, 2011).
The HCF builds upon SAT and the BTF by considering the causal flow of decisions that lead to actions attributed to organizations. It aims to recognize the human element of organization without disappearing the organization construct all while enabling one to examine and understand macro-level organizational phenomena without reifying the organization construct and disregarding the human element. Considering the causal flow of decisions and actions that individuals take in the name of an organization raises two central questions. First, what triggers the need or desire for organization members to make any number and type of decisions? Second, what are the essential mechanisms and conditions in the causal pathway between the need or desire to make any given decision and the subsequent organizational action that results from it, such as licensing a university technology and pursuing its commercialization?
The HCF is comprised of several interrelated and interconnected elements that address the two questions posed above (see Figure 3). The main causal pathway that connects organizational decisions with organizational action starts with “Motivations of Decision Makers” and runs through “Goals of Decision Makers”, “Perceived Strategic and Tactical Options for Actions”, “Strategic and Tactical Decisions”, and “Actions to Effectuate Decision” in sequence. Each element in the main causal path of the HCF feeds into the next unidirectionally. Two additional elements, “Consequences of Actions” and “Assessments of Consequences”, follow “Actions to Effectuate Decision” and play roles in the feedback mechanism to facilitate organizational learning. This causal chain helps explain what triggers the need or desire for organization members to make organizational decisions that are ultimately coupled with organizational action as well as how and why organizational members learn and institute changes in the actions of the organizations and within organizations themselves.
Motivations of Decision Makers, the first of the HCF’s elements, directly addresses the question of what triggers the need or desire for organization members to make decisions on behalf of the organization in the first place. Motives are one of several factors than can cause an individual to pursue a course of action (Simon, 1945/1997). If one accepts that all organization activity manifests itself through human activity and all human activity is driven by human behavior which is often, but not always, determined by human motivations compelled by human needs (Maslow, 1943), then organization activity is largely determined by the human needs of its members.
In the current state of civilization and under normal conditions, the most predominant basic human needs (physiological, safety, and love as categorized and defined by Maslow) tend to be significantly satisfied and therefore can usually be considered non-existent when trying to understand what truly motivates human behavior (Maslow). As such, esteem and self-actualization needs are the primary motivators of human behaviors (Maslow) and thus are likely the primary motivators of activity ascribed to organizations. However, this is not always the case. It is easy to contemplate that safety and love needs can present themselves quite forcefully as motivators for actions taken on behalf of an organization. Thus, in large part, the motivations of organization members drive the goals of an organization.
The literature recognizes goals as a core element of organizational actions (see e.g., Gagné, 2018; Steinmann et al., 2018; Sung & Kim, 2021). According to SAT, goals are an element in establishing the equilibrium of the organization (Simon, 1945/1997). In the BTF, goals drive organizational decisions and the need to make them. They are one of three core concepts that explain the actions of organizations and serve to align organizational actions with desired outcomes (Cyert & March, 1963). The challenge is to specify the goals of an organization without “postulating an ‘organizational mind’” (Cyert & March, 1963, p. 26) and reifying the organization construct. Such reification obscures the underlying complexity and true causal mechanisms of organizational actions. The influence of those for whom the success of the organization provides some utility, which includes both members and non-members of the organization (e.g., customers of a for-profit commercial enterprise), also influences the goals of an organization (Simon). For many private sector organizations, economic profit is the core goal, but not always the only goal. One can argue that any goal established by an organization member who commits organization resources to achieve it is a goal of the organization.
In the HCF, several other elements function as mediators and moderators of the relational connections between the elements of the primary causal pathway. Chief among these is Simon’s (1945/1997) concept of “decision premises” which was a vital conceptual advancement in organization studies. Decision premises express the beliefs of members of the organization and take one of two forms. Etiological decision premises, what Simon called factual decision premises, are essentially assertions or propositions about existence and the nature of cause-and-effect relationships among events and phenomena of the physical and social world in which the individual employing the assertion or proposition genuinely believes that it corresponds with reality. However, etiological decision premises may or may not be objectively true. In contrast, normative decision premises, what Simon called values decision premises, denote beliefs about the way things “ought” to be. Normative decision premises are often the decisions of individuals in the upper levels of an organizational hierarchy. Other organization members lower in the hierarchy abide by them primarily because of the established norms and patterns of behavior of the organization.
In addition to decision premises, communication and other psycho-sociological factors act a mediators between the core elements of the HCF, except for the link between “Actions to Effectuate Change” and “Consequence of Actions”. Factors associated with the organization as a collectivity and the environment in which the organization operates drive the motivations of decision makers, influence their options for action, and shape the consequences of organizational actions. But they also act as moderators of the relationships between core elements along the primary causal pathway.
Once the goals of the organization are established, the issue becomes what course of action needs to be taken to achieve those goals. Applying the principle of equifinality (Gresov & Drazin, 1997; von Bertalanffy, 1969), one can surmise that many, if not most, organization goals can be attained by multiple possible means. These multiple possible means constitute the options for action available to the members of the organization for attaining the goals. Some options for action will be readily apparent to organization members. Others will present themselves only through an active search for alternatives. However, the principle of bounded rationality suggests that the options for action that organization decision makers consider will not be comprehensive because various factors will constrain the number of options that they can and will consider (Simon, 1955, 1957, 1972, 1982).
Goal decisions lead to a perceived set of options for achieving them through the mediating influence of decision premises, communication, and other psycho-sociological factors. Decision premises provide guiderails for determining which options are acceptable and thus serve to constrain the options that decision makers consider. Additionally, psycho-sociological factors influence how organization members interpret and respond to organization goals and thus help shape what options organization decision makers include in the choice set. In the organizational context, communication plays an important role in how organization decision makers obtain, perceive, and interpret the data and information that goes into formulating and assessing the options for actions.
Given a set of options to achieve the specified organizational goals, decision makers choose the option they believe will lead to the desired future state. Decision premises, communication, and psycho-sociological factors mediate the choice which is made according to the institutions of the organization. Once the relevant organization members decide on a course of action to attain the goals ascribed to the organization, various members perform tasks necessary to implement the action. The action either produces consequences, some of which may be unanticipated and contrary to the goals of the organization, or they have no effect at all in bringing about the desired future state that the organization’s decision makers sought. Thus, organization members make assessments about the results of the action taken. Once again, decision premises, communication, and psycho-sociological factors surface as the means for transitioning from one element to another – in this case consequences are translated into assessments of the appropriateness and usefulness of the action taken. These assessments feed back into the motivations and goals of the organization’s decision makers as well as the perceived options for action as part of the learning mechanism of the organization.
Study Data
The study used three core sets of data. The first was data reported in Thursby and Thursby (2001). To collect this data, the investigators mailed questionnaires to a total of 1,385 business units that had autonomous authority to in-license technology. Additionally, the investigators held telephone conversations with relevant personnel from several business units to help ensure adequate data quality. The data were collected during 1998 and 1999 from 300 respondents. The data of interest for this study were from respondents in business units that had in-licensed technologies but had either not in-licensed from universities since 1993 or had never in-licensed from universities. The data used in this study were from the 182 responses to the question “Which of the following are reasons why you have not licensed-in U.S. university technologies since 1993?” and the 175 responses to the question “Which of the explanations [from the question above] is the most important reason for your not licensing-in from universities?”. The responses in which the reply indicated that university research is not sufficiently mature were extracted for this examination (see Table 3). Respondents who indicated their business units rarely in-licensed research or technologies from any source were excluded from the data for the most important reason for the business unit not in-licensing research and technology from universities.
The second and third sets of data were obtained from an R1 research university in the USA. The second data set consisted of data from technology marketing campaigns aimed at soliciting potential licensees for university technologies. Dyads consisting of a technology and a solicited company constituted observations for the purposes of the study. The technologies the university offered in the solicitations were invention and software disclosures. Observations in which the company indicated it was not interested in the technology and where the record contained notes about the reasons for the company’s disinterest were collected. To determine if an insufficient maturity level was the reason for the company’s disinterest in pursuing the technology, the notes field in the data set was first skimmed to get a sense of the data. Then, an R script was prepared (see Supplemental Information S1) and used to screen the notes for each observation using words and phrases that would be likely be indicative of statements communicating insufficient maturity as the reason for disinterest (see Table 4).
After the observations were screened, the notes for the identified observations were then manually reviewed to verify that insufficient technology maturity was the reason for the company’s disinterest. After manually reviewing the notes, the screening words and phrases were updated. This process was repeated several times to ensure that all target observations were identified, and that no off-target observations were included. All told, data for 1,665 observations covering roughly a 16-year period from 2007 through 2023 were collected. Of those observations, 84 instances were identified in which an insufficient maturity level was the reason that a solicited private sector firm was not interested in pursuing a license for the technology at the time of solicitation (see Table 5).
The third data set comprised data on the total amount of licensing revenue generated for the university from each licensed technology over the life of the licenses. The data included 889 unique licensed technologies. The raw data provided the cumulative licensing revenue that the university received in nominal U.S. dollars during the term of the license agreement for each technology. The data included cases in which the technologies were commercially successful and unsuccessful. To estimate the total licensing revenue in constant 2024 U.S. dollars, the total licensing revenue of each technology was apportioned to each year between the first transaction date and last transaction date based on calendar days. Historical average consumer price index data (see Federal Reserve Bank of Minneapolis, 2025) were used to convert the licensing revenue in nominal U.S. dollars to constant 2024 U.S. dollars which were then aggregated.
Analytical Methods
A Bayesian approach was used to analyze the data. In contrast to the methods of frequentist statistics which assume that parameters are fixed but unknown constants, the study applied the Bayesian principle of treating the parameters of interest as random variables described by probability distributions. This approach enables prior knowledge to be considered in analyses and makes it possible for one to update conclusions as new data is collected. The Bayesian approach produces probabilistic statements that reflect the uncertainty in parameter estimates. This generates more nuanced and robust inferences, particularly when small sample sizes are used in the analysis.
The technique was used in the study employed a series of Markov Chain Monte Carlo (MCMC) simulations to analyze the data and determine the posterior probabilities for the phenomena being examined. It also enabled the testing of various posterior hypotheses. The analysis involved creating a hierarchical Bayesian model to simulate hypothetical draws from probability distributions to estimate the parameter of interest (see Figure 4). The R programming language (The R Foundation, 2023) in the RStudio integrated developer environment (Posit Team, 2025) was used to create the simulations (see Supplemental Information S2). The rjags package (Plummer et al., 2023) was used to run the simulations. Additionally, R scripts were written to customize the autocorr.plot function from the coda package (Plummer et al., 2020) to enable printing autocorrelation plots with titles containing the parameter names for visual inspection (see Supplemental Information S3).
For the simulation using the first data set, each respondent was treated as a trial. Both the parameter of interest (hereinafter referred to as theta for simulations 1 and 2) and the likelihood were assumed to be generated from a binomial distribution with the theta parameter indicating the number of occurrences in which insufficient maturity is the primary reason the business unit did not license university technology. A prior probability with beta distribution hyperparameters set at 3 for alpha and 4 for beta was used because evidence in the literature indicates that a sufficient maturity level is, at the very least, an insufficient but necessary condition of one or more configurations of unnecessary but sufficient conditions (i.e., an INUS condition) for private sector firms to license and pursue commercialization of university technology. Three (3) chains of 100,000 iterations with a burn-in of 1,000 iterations each were simulated. Functions from the coda package (Plummer et al., 2020) were used to calculate convergence diagnostics. These included autocorrelation, effective sample size, Gelman diagnostics, Raftery diagnostics, trace plots, and density plots.
For the second data set, each observation (i.e., technology-company dyad) was treated as a trial. Again, both the likelihood and theta parameter were assumed to be generated from a binomial distribution. The expected value of the posterior probability from the first simulation was used as the prior probability for the second simulation. Three (3) chains of 100,000 iterations with a burn-in of 5,000 iterations were simulated. The same convergence diagnostics performed in the first simulation were done for the second simulation.
An MCMC simulation was also used to analyze the third data set to estimate the posterior probability distribution for the total amount of royalty-based licensing revenue generated by technologies for universities over the duration of the commercial lives of the technologies. The licensing revenue data were extremely skewed and appeared to be zero inflated (see Figure 5). Nearly 95% of the technologies generated less than US$1 million (in constant 2024 U.S. dollars) in cumulative licensing revenue and a substantial number of licensed technologies generated no licensing revenue at all. Therefore, a two-step process was used to model the licensing revenue (see Figure 6). It was assumed that two separate processes generated the data. The first process determined whether an observation was structurally zero. The parameter of interest (again called theta in the model) for the first process was the probability of a structural zero and was assumed to be generated from a binomial distribution. The second process generated the licensing revenue value for non-zero observations (the lambda parameter in the model) from a Poisson distribution. The R programming language in the RStudio integrated developer environment was again used to create the simulation and the rjags package was used to run the simulation.
Using the estimated posterior distribution, the licensing revenue amount for which there was a 90% probability a licensed university technology would generate for the university (Licensing Revenue) was determined. Because the data included technologies that were both commercially successful and unsuccessful, the Licensing Revenue estimate took into consideration the distribution of commercially successful and unsuccessful licensed technologies.
Licensing deals for university technologies typically include multiple revenue components such as non-refundable upfront payments, patent reimbursement expenses, milestone payments, and royalty payments. Royalty payments were used as a proxy indicator of whether the licensee had successfully commercialized the technology and thus generated economic activity that impacted final demand output. The amount of Licensing Revenue that was derived from royalties (Royalty Revenue) was estimated as 60% of the total Licensing Revenue to the university (see Arqué-Castells et al., 2016; Norman & Eisenkot, 2017). To estimate the amount of revenue the technologies generated for the licensees (Incremental Income), the Royalty Revenue was divided by 0.03, which is the typical royalty rate for university technologies (see Gotham et al., 2016; Shah et al., 2023). RIMS II methodology (see U.S. Bureau of Economic Analysis, 2011) was then applied to estimate the potential societal benefit (PSB) of the technologies in terms of the potential final demand output (PFDO) and potential final demand employment (PFDE). Because RIMS multipliers for industries are state-specific, the total Incremental Income for each technology was apportioned to each state in the USA based on the state’s pro rata share of 2024 gross domestic product (see U.S. Bureau of Economic Analysis, 2025, March 28). Aggregate industry code 50 (professional, scientific, and technical services) was used as a proxy for the industries represented by the licensees of technologies to estimate the PFDO and PFDE if the technologies that private sector firms eschewed because of insufficient maturity level were further matured by universities and federal laboratories and then subsequently licensed for commercialization.
To estimate the PSB from strategically redistributing the federal funding provided to create eschewed technologies to instead spur consumption, the mean research funding per technology was estimated using the total amount of research funding that the U.S. government provided from fiscal year 2015 to 2019 for intramural research, federally funded research laboratories, and universities (American Association for the Advancement of Science, 2022) and the estimated number of technologies created at federal laboratories and universities during the same period (see Table 1). RIMS II methodology was applied using aggregate industry code 30 (general merchandise stores) to calculate the PFDO and PFDE from strategic redistribution of the federal research funding. The PFDOs and PFDEs for commercialization and redistribution were then compared according to the benchmarks established for the study.
Analysis and Results
This sections presents the results of the analysis. It first explains how the HCF was applied in the study. It then presents the results of the MCMC simulations. The section concludes with a presentation of the estimated potential economic impact of licensing and commercializing technologies that private sector firms eschew because of insufficient maturity and the potential economic impact had the federal research funding that was used to create those technologies been strategically redistributed to spur consumption and induce economic activity.
Applying the Human-Centered Framework
Applying the HCF, one can model university technology transfer from either the supply side or the demand side. In the case of this inquiry, the HCF was used to derive a demand-side model of the research questions being explored and frame how one thought about the phenomenon being examined (Figure 7).
Creating the demand-side causal model facilitated the formulation of the hierarchical Bayesian models for the analysis. The causal model framed how the problem was considered and aided in thinking through the analysis, which influenced the assumptions made and parameters of interest selected for the analysis. For estimating the probability that a private sector firm would eschew a technology because of insufficient maturity, it was assumed that the parameter of interest theta (i.e., the number of observations in which a private sector firm eschewed university technology relative to the total number of observations) follows a binomial distribution and that the outcomes of all observations are independent and identically distributed in the distribution. For the analysis of the potential societal benefit, it was assumed that the parameter of interest lambda (i.e., the licensing revenue generated by a licensed technology) was determined by a two-step process and that a Poisson distribution generated the revenue amount.
The Bayesian models were used to generate simulated data that behaves like the observed data. In fitting the model, the Bayesian approach accounts for the uncertainty in the parameters of interest (i.e., theta, lambda) directly by using probability. It treats them as random variables with their own prior probability distributions. The likelihood describes how the observed data might be generated given the unknown parameter of interest. The prior probability describes the uncertainty associated with the parameter. Using the observed data and the prior probability, one can make inferences about the parameters by calculating the posterior probabilities using the laws of conditional probability. The posterior distributions provide the probability distributions of the parameters of interest given the observed data.
MCMC Simulation 1 Results
The R code for the MCMC model and simulations are provided as a supplemental resource to this paper (see Supplemental Resource S2). The MCMC sampler effectively explored the posterior distribution in a random but stable manner, and the simulation converged rapidly to the posterior distribution. The trace plot of the iterations exhibited random scatter around the mean value (see Figure 8). Chains appeared to mix well as the simulation explored the posterior distribution. The trace plot exhibited rapid up-and-down variation around the mean. Moreover, the trace plot did not exhibit any clear increasing or decreasing trends or sudden jumps, oscillations, or stuck chains. The model simulation did not exhibit any autocorrelation. For each chain, autocorrelation dropped to roughly zero at a lag of less than 5 steps.
The Gelman-Rubin convergence diagnostic calculated a scale reduction factor close to 1 for the model simulation, indicating that the simulation effectively converged. Additional diagnostics also indicated that the simulation effectively converged to the posterior distribution (see Table 6). The effective sample size was nearly 183,300 samples. Essentially, this is the number of independent samples that would be required to obtain the same information. The Raftery-Lewis diagnostic calculated the dependence factor for the chains which ranged from about 1.52 to about 1.55 while autocorrelation plots showed that autocorrelation dropped to roughly zero after about 5 lags. This indicated that autocorrelation was acceptably low (see Raftery & Lewis, 1996). The estimated number of iterations required to be 95% confident in estimating the 0.025 quantile with an accuracy of ± 0.005 percentage points for the chains ranged from approximately 5,690 to approximately 5,810 iterations. The minimum sample size required if there was no autocorrelation in the chains was 3,746 observations. This is about 21 times the number of actual observations in the data set. Thus, the effective sample size was more than sufficient to produce a reliable estimate for the outer edges of the distribution, which enabled a dependable estimate for a 95% posterior distribution interval.
Given the diagnostic results, one can be reasonably confident that the Markov chain converged. Thus, it was safe to treat the Markov chain as though it was a Monte Carlo sample from the posterior distribution. Therefore, Bayesian modeling techniques could be used to calculate posterior quantities from the samples directly.
The density plot visually depicts the probability distribution of how likely a given probability is for an insufficient maturity to be the primary reason that a private sector firm eschews a technology created at a university in the USA given the date (see Figure 9). The analysis indicates that the 95% credible interval for the probability of insufficient maturity being the primary reason that a private sector firm declined to license and pursue the commercialization of a university technology prior to the year 2000 was between 17.7% and 30.0% given the data (see Table 7).
MCMC Simulation 2 Results
The MCMC sampler effectively explored the posterior distribution in a random but stable manner, and the simulation converged rapidly to the posterior distribution for the second simulation. Again, the trace plot of the iterations exhibited random scatter around the mean value (see Figure 10). Chains appeared to mix well as the simulation explored the posterior distribution. The trace plot exhibited rapid up-and-down variation around the mean. Once more, the trace plot did not exhibit any clear upward or downward trends or sudden jumps, oscillations, or stuck chains. As with the first simulation, the autocorrelation for each chain in the second simulation effectively dropped to zero around a lag of 5 steps.
As with the first simulation, the Gelman-Rubin convergence diagnostic for the second simulation calculated a scale reduction factor close to 1 indicating that the simulation converged sufficiently. Additional diagnostics also indicated that the simulation effectively converged to the posterior distribution (see Table 8). The effective sample size was roughly 185,250 iterations. Again, this is the number of independent samples that would be required to obtain the same information. The Raftery-Lewis diagnostic calculated dependence factors between 1.53 and 1.57 for the chains indicating that autocorrelation was acceptably low. The number of iterations required to be 95% confident in estimating the 0.025 quantile with an accuracy of ± 0.005 percentage points ranged between about 5,730 iterations and 5,880 iterations for the chains. The minimum sample size required if there was no autocorrelation in the chains was 3,746 observations, which was about 2.2 times as many observations in the actual data set. Thus, the effective sample size for the second simulation was also more than sufficient to produce a reliable estimate for the outer edges of the distribution thus enabling a dependable estimate for a 95% posterior distribution interval.
The diagnostics results for the second simulation also indicated that the Markov chain converged and thus it was reasonable to treat the Markov chain as though it was a Monte Carlo sample from the posterior distribution. Accordingly, Bayesian modeling techniques could once again be confidently used to calculate posterior quantities directly from the samples for the second simulation.
The density plot for the second simulation visually depicts the probability distribution of the probability of an insufficient maturity being the reason that a solicited private sector firm will eschew a technology created at a U.S. university at the time of solicitation during the period of 2007 to 2023 (see Figure 11). The analysis indicated that the 95% credible interval for the probability of an insufficient maturity being the primary reason that a private sector firm declined to license and pursue the commercialization of a university technology was between about 4.1% and 6.2% for the period given the data (see Table 9).
The third MCMC simulation estimated the posterior probability distribution of licensing revenue to universities over the commercial life of licensed technologies. Another hierarchical Bayesian model consisting of a likelihood, prior probability, and posterior probability was developed for the analysis. It is assumed that the mean licensing revenue to universities generated by licensed university technologies followed a Poisson distribution and that the observed outcomes are independent and identically distributed in the distribution. Once again, a Bayesian model was used to generate simulated data that behaves like the observed data.
All diagnostics indicated that the third simulation also converged effectively (see Figure 12 and Figure 13, and Table 10). The analysis indicated that the 90% credible interval for the amount of licensing revenue to the university generated by a technology over its commercial life was between about US$617,083 and US$617,172 (in constant 2024 U.S. dollars) given the data in the sample (see Table 11). The licensing revenue amount for which there was a 90% probability that a licensed technology would generate at the very least for a university over the course of its commercial life was about US$617,080 in constant 2024 U.S. dollars.
The mean Incremental Income generated for the organization that licensed a technology over the technology’s commercial life was estimated to be $12.3 million in constant 2024 U.S. dollars. The potential final demand output of technologies that private sector firms eschewed because of insufficient maturity was estimated to be about $115.1 billion in constant 2024 U.S. dollars and the potential final demand employment was estimated to be nearly 684,470 million jobs. The potential final demand output of redistributing the research funding provided to create the technologies was estimated to be about $48.7 billion in constant 2024 U.S. dollars and the potential final demand employment was estimated to be roughly 410,950 jobs.
Discussion
This section of the paper provides an interpretation of the results presented in the preceding section. First, it discusses the merits of the HCF and how it facilitated the study. It then interprets the output of the MCMC simulations. Various caveats about the analysis are then highlighted. Finally, recommendations for future research are presented.
Merits of the Human-Centered Framework
The HCF holds promise as a useful tool to advance technology transfer research based on the criteria of empirical adequacy, internal consistency, simplicity, parsimony, and testability (see e.g., Bacharach, 1989; Coppedge, 2012; Fawcett, 2005; Wilton & Harley, 2018). The HCF seems to integrate other frameworks and models for technology transfer research and reasonably accounts for observed technology transfer phenomena. Its foundational assumptions and propositions appear to logically cohere without internal contradictions. Moreover, the HCF is built on a limited number of core premises and thus lends itself to being more easily comprehended and applied. At the same time, it appears to provide more explanatory breadth and depth than many of the conceptual frameworks and models that have been developed to study technology transfer.
Additionally, the HCF seems to more accurately represent the technology transfer process and other organizational phenomena. Some scholars take solace in the position expressed by Milton Friedman who argued that the goal of theory is not to accurately represent or reproduce phenomena (e.g., social, economic) but to develop propositions that can be analyzed (Cyert & March, 1963). For these scholars, predictive adequacy and the stimulation of intellectual discourse are the relevant yardsticks for evaluating theory. However, this seems a bit shortsighted and limiting. Accurate representation of phenomena is necessary for a theory to optimally explain and predict sociological behavior, which is a theory’s primary function (Felin & Foss, 2009). Representational accuracy cultivates theoretical validity and facilitates our understanding of empirical reality (Bergenholtz & Busch, 2015). Theory that does not accurately represent phenomena can only provide an inaccurate, and quite possibly misguided, understanding of phenomena. Thus, its usefulness will always be knowingly limited to an unknown degree. For example, the Ptolemaic model of the solar system had substantial predictive power in accounting for the motion of the planets despite being an Earth-centered model that did not accurately represent the solar system (Benson, 2012). If the scientists and philosophers of an earlier era had not discarded the Ptolemaic model in favor of a model that more accurately represented the solar system, it is unlikely that civilization could have made many of the advancements that have improved humanity’s situation. One can argue that in the long run theories and models that do not accurately represent the phenomena they aim to explain will be less useful than those that do. But this is not to say that accuracy agnostic theories have no use.
The HCF represents not only a more accurate theoretical explanation (as opposed to a conceptual framework) of technology transfer, but it is also quite useful for structuring one’s reasoning about investigations of organizational phenomena in a way that the analytical paradigms that have traditionally been employed in orthodox technology transfer research likely cannot. Creative application of the HCF can overcome many of the limitations of other traditional analytical paradigms such as the neglect of sociological factors, oversimplification of the technology transfer process, and normative biases. Thus, the HCF potentially can enable researchers to pursue inquiries for which traditional analytical paradigms are not well suited. The HCF expands the aspects of technology transfer that can be investigated and the kinds of questions that one can examine, such as the potential effectiveness of using technology maturity as a lever for increasing the incidence and societal benefit of technology transfer.
Interpretation of MCMC Simulation Results
The results provided substantial support for H1 and H3 but only weak support for H2. However, the degree to which insufficient maturity encumbered the incidence of technology transfer prior to the year 2000 may not be as high as the results of the analysis H1appear to suggest.
H1.
The analysis results indicate there is a 95% chance that prior to the year 2000 the probability that a private sector firm which had not in-licensed university technology in the prior 6 years had not done so primarily because the technologies were not sufficiently mature was between a 17.8% and 30.1% given the observed data. Based on the data at hand, it is a virtual certainty that the probability was greater than or equal to 5 percent. Thus, the Bayes factor for the probability being greater than or equal to 5% compared to the hypothesis that the probability was less than 5% is undefined. However, this likely overestimates the degree to which insufficient maturity encumbered the incidence of technology transfer prior to the year 2000 for the reasons discussed below.
H2.
The results of the analysis indicate that there is a 95% chance that between 2007 and 2023 the probability that a university technology offered to a private sector firm would be eschewed because the technology was not sufficiently mature was between a 4.1% and 6.2% given the observed data. There is about a 55% chance that the probability was 5% or greater. The Bayes factor for the probability being greater than or equal to 5% compared to the hypothesis that the probability was less than 5% was approximately 1.2, which is interpreted as weak evidence in support of H2 (see Kass & Raftery, 1995).
H3a.
The results indicate that the potential final demand output from internally maturing and licensing technologies that private sector firms eschewed during the period 2015 through 2019 because of insufficient maturity was about $115.1 billion in constant 2024 U.S. dollars while the potential final demand output from strategic redistribution of the funding that the federal government provided to create those technologies to spur consumption was about $48.7 billion in constant 2024 U.S. dollars. Thus, the analysis indicates that potential economic benefits of commercializing those technologies were nearly 2.4 times greater than the potential economic benefits of strategic redistribution of the research funding to stimulate economic activity through increased consumption.
H3b.
The analysis estimated that the potential final demand employment from internally maturing and licensing technologies that private sector companies eschewed during the period 2015 through 2019 because of insufficient maturity was about 684,470 jobs while the potential final demand employment from strategic redistribution of the federal funding that the government provided to create those technologies to induce economic activity that ultimately increases employment was about 410,950 jobs. As such, the study results indicate that the potential employment from further maturing and licensing that portfolio of technologies was nearly 1.7 times greater than the potential employment from strategic redistribution of the research funding to stimulate economic activity through increased consumption that ultimately spurs job creation.
Meaning of Results
The study results suggest that the incidence of technology transfer can be slightly increased through policies and programs that focus on increasing the maturity of technologies created at universities and federal laboratories. However, even such a slight increase is still likely to result in substantial societal benefits as measured by the economic indicators of final demand output and final demand employment. But it is important to note that this does not account for the increase in the standard of living and quality of life that the commercialization of such technologies is also likely to produce.
At first glance, it might appear that the degree to which insufficient maturity encumbers the incidence of technology transfer has significantly declined from the period prior to the year 2000 to the period between 2007 and 2023, but this is not necessarily the case. The large difference between the values of theta calculated in simulation 1 and simulation 2 appears to be an artefact of the different nature of the two data sets and their specific units of analysis. The two parameter estimates get at the same core concept, but there is an important nuance that makes them distinctly different. Nevertheless, taken together, they help triangulate the answer to the question of whether programs and policies that aim to mature university and federal laboratory technologies are likely to increase the overall incidence and societal benefits of technology transfer.
In the first data set, the unit of analysis was the organization whereas a solicitation (i.e., technology-company dyad) was the unit of analysis in the second data set. Additionally, the first data set included only cases of the non-occurrence of technology licensing within a specified period. Consequently, the theta parameter in the first simulation reveals the probability that a private sector firm that had not in-licensed a university technology in the 6 years prior to when the survey was taken had not done so primarily because the university technologies available to it were not sufficiently mature. This does not take into consideration the number of technologies vetted by each company that responded to the survey. Therefore, it is possible that a company considered numerous technologies during the period and declined them for a variety of reasons, but insufficient maturity was the reason the company most often declined to pursue the technologies it considered. Moreover, each respondent is given the same weight regardless of differences in the quantity of technologies considered (see Table 12). Thus, the first simulation probably overestimates the degree to which insufficient maturity encumbers the incidence of technology transfer.
The second data set contained cases of disinterest in the technology offered as well as cases in which a final decision about whether to pursue the technology had not yet been made and explicitly communicated. Therefore, the theta parameter in the second simulation indicates the probability that a university technology that is offered to a private sector firm will be eschewed specifically because the technology is not sufficiently mature from the perspective of the decision maker in the private sector firm. This estimate is probably a closer reflection of the true degree to which insufficient maturity encumbers the incidence of technology transfer.
Implications
Although the current percentage of technology transfer opportunities that are not realized because of an insufficient technology maturity level appears small, the potential impact from focusing on increasing the maturity level of such technologies is substantial. Based on data available for the period covering federal fiscal years 2015 through 2019, it is estimated that programs focused on maturing technologies had the potential to increase the incidence of licensed university technologies between 3,427 and 4,858 additional transactions. Assuming similar dynamics for technologies created at federal laboratories, there was the potential for technology maturation programs to increase the incidence of licensed federal technologies between 549 and 778 additional transactions (see Figure 14). These numbers represent sizable amounts of potential economic activity, employment opportunities, and lives positively impacted. However, it is also clear that programs and policies that aim to increase the maturity of technologies created at universities and federal laboratories are unlikely to be sufficient to completely realize the potential upside from the vast amount of unlicensed, uncommercialized technologies that academic and federal researchers create every year.
The results of the study also support the conjecture that multiple factors may be the cause for private sector firms to eschew the remaining number of unlicensed technologies that are available. Moreover, it is likely the case that many, if not most of these factors, are related to characteristics of the private sector organizations. Therefore, the key to unlocking further opportunities to increase the incidence and societal benefits of technology transfer may largely reside in a better understanding of the demand-side perspective of technology transfer. This can be achieved in part through research that applies methods more appropriate for investigating phenomena that are subject to causal complexity and emphasizes psycho-sociological aspects of technology transfer.
Limitations
There are several caveats for the study presented in this paper. To begin, the HCF is an unproven theoretical explanation of organizational phenomena such as technology transfer. To rise to the level of true theory, it must be challenged and tested. This will entail others using the HCF to derive hypotheses that can be empirically examined. Only through such extensive hypothesis derivation and testing can the usefulness of the HCF be validated.
Another caveat is that the data from Thursby and Thursby (2001) was primarily based on the recollections of respondents. The data were not verified through examination of documents or other records. It is possible that the recollections of respondents were not accurate. In addition, the impact of non-response bias is not known. It is possible that respondents from business units that eschewed university technologies primarily because the technologies were insufficiently mature were either more or less likely to respond to the survey.
Regarding the second data set, in many cases the respondent from the private sector firm communicated that there was no interest in the technology but did not provide a clear reason for the disinterest. It is possible that in at least some of the cases of unspecified disinterest, insufficient maturity was indeed the reason for the lack of interest. Additionally, the impact of non-response bias is also not known. It is also possible that solicitation recipients were more inclined not to respond at all if the technology being offered was not sufficiently mature. If either of these possibilities are true to a significant degree, then the degree to which insufficient maturity encumbers the incidence of technology transfer could be appreciably higher than what the estimate for the parameter value in the second simulation suggests.
The data for the second and third MCMC simulations were obtained from a single university. The university’s technology transfer activities likely engaged a reasonably representative sample of private sector organizations given the size of the university’s research operations and technology portfolio. But it is possible that the data do not adequately represent the nature of technologies and technology portfolios across the spectrum of U.S. research universities and federal laboratories. If this is so, and if typical maturity levels of such technologies depend on the nature of the research, then the percentage of cases in which private sector firms decline to license and pursue commercialization of university and federal laboratory technologies primarily because of insufficient technology maturity levels could be significantly different than the study results suggest. However, the Bayesian approach used in the study makes it possible for the study results to be combined with additional data to generate updated parameter estimates.
Additionally, the licensing agreements for many of the technologies in the third data set used to estimate the licensing revenue per technology were still active. Thus, the licensing revenue generated by these technologies over their commercial life is likely to increase, which will raise the overall average licensing revenue per technology in the future. The result of this will be to further increase the benefits of internally maturing and licensing technologies that the private sector would otherwise eschew compared to redistributing the research funding provided to create such technologies to induce economic activity.
Finally, the analysis assumed that all university technologies were created with at least some federal funding. While the federal government does provide a substantial amount of the funding that university researchers use to conduct research and create technologies, it is certainly not the only source of funding. The study also assumed that technology transfer from universities is highly similar to technology transfer from federal laboratories and thus it is reasonable to generalize from one to the other. If this is not the case, then the results of the study cannot necessarily be generalized to the federal laboratory context because only university data were used in the analysis.
Recommendations for Future Research
There are several possibilities to extend the research presented in this paper. First, one can conduct a conceptual replication. This could consist of a study in which the methods are applied to a different data set. Modifications to address the other limitations of this study can also be made. Additionally, one could use the results of this study as the prior probability for subsequent MCMC simulations and other Bayesian analyses.
The results of this study raise new questions whose answers may have significant implications for technology transfer policy and practice. One such question is exactly how decision makers at private sector firms measure and characterize the maturity level of technologies? That is, how do private sector firm decision makers know when a technology is sufficiently mature? The answer to this question would likely have a significant influence on how technology transfer practitioners at universities and federal laboratories choose to structure and operate programs and initiatives that aim to increase the maturity level of technologies created at their organizations.
The study also raised a measurement issue that would be worthy of further investigation. How does one measure the change in the standard of living and quality of life that many technologies produce? These outcomes are important to consider but the study could not explicitly factor them into the analysis. The development of pragmatic methods and instruments for measuring these phenomena would be a significant contribution to both technology transfer researchers and practitioners.
A final suggestion for future research is to apply the HCF to examine various aspects of university and federal laboratory technology transfer or other macrolevel organizational phenomena. This could include revisiting previously published research and applying the HCF to re-examine those phenomena to see if the results are consistent or if new insights are revealed. Such efforts would help to either validate, improve, or disprove the HCF as a useful and accurate theoretical explanation for technology transfer and other macrolevel organizational phenomena.
Conclusions
This paper presented a study that aimed to understand the potential impact university and federal laboratory administrators can have on the incidence of technology transfer with programs and initiatives intended to further mature technologies created at their organizations. The study examined three hypotheses. The first hypothesis was that insufficient maturity has historically been a consequential encumbrance on the incidence of technology transfer. The second hypothesis was that insufficient maturity is currently a consequential encumbrance on the incidence of technology transfer. The third hypothesis was that the potential societal benefit of investing resources to mature technologies that private sector firms would otherwise eschew because they are not sufficiently mature is consequential.
To facilitate the inquiry, a human-centered framework (HCF) was developed for investigating organizational phenomena such as university technology transfer. The HCF provides a broad explanation of organization phenomena that appears to align with other major frameworks, theories, and models used to study technology transfer. It is a theoretical explanation rather than a conceptual framework and enables the study of technology transfer from both the supply-side and demand-side perspectives. It also may mitigate the tendency of technology transfer research to ignore psycho-sociological factors. One can use the HCF as an aid to formulate hypotheses and research designs or as a scaffold for evaluating research studies post hoc. Furthermore, it accommodates the examination of technology transfer as a complex psycho-sociological phenomenon subject to causal complexity and may support other types of quantitative analysis beyond multiple regression as well as qualitative investigations. Thus, the HCF can potentially advance the field by enabling a different, deeper understanding of technology transfer.
Using the HCF, a model was developed to understand why insufficient maturity causes decision makers at private sector firms to eschew technologies. This model was then used to help frame and structure a Bayesian analysis consisting of Markov Chain Monte Carlo (MCMC) simulations to test the hypotheses. The results of the analysis provided substantial support for two of the hypotheses and weak support for the other hypothesis. Thus, the study results suggest that federal laboratory and university administrators in the USA can slightly increase the overall incidence of technology transfer by implementing programs and initiatives to further mature technologies created at their organizations that private sector firms would otherwise eschew because of insufficient maturity. However, the potential societal benefits of internally maturing and licensing such technologies are about 1.7 to 2.4 times greater than the potential benefits from strategic redistribution of the federal funding provided to create those technologies to induce consumption and spur economic activity.
Supplementary Materials
The following supporting information can be downloaded at: Preprints.org.
Acknowledgments
None.
Funding sources
The author did not receive funding from any organization to assist with this work or the manuscript.
Competing interests
The author has no relevant financial or non-financial interests to disclose.
Data availability
The author has withheld certain data used in this study because the data are the proprietary and confidential intellectual property of third parties. All other data used in this study are publicly available from the sources cited in the paper.
Ethics Statement
This research did not comprise any studies performed by the author involving human participants or animals as subjects.
Declaration regarding artificial intelligence (AI) and AI-assisted technologies
During the preparation of this work the author did not use AI or AI-assisted tools to write any text and takes full responsibility for the content of this paper.
References
- Afonso, O., Monteiro, S., & Thompson, M. J. R. (2010). A growth model for the quadruple helix innovation theory [Working paper]. Retrieved June 30, 2025 from http://www3.eeg.uminho.pt/economia/nipe/docs/2010/NIPE_WP_12_2010.pdf.
- Akard, P. (1995). The return of the market?: Reflections on the real “conservative tradition” in U.S. policy discourse. Sociological Inquiry, 65(3-4), 286-308. [CrossRef]
- Aksom, H., & Tymchenko, I. (2020). How institutional theories explain and fail to explain organizations. Journal of Organizational Change Management, 33(7), 1223-1252. [CrossRef]
- Allard, G., Miner, J., Ritter, D., Stark, P., & Stevens, A. J. (2021). AUTM U.S. licensing activity survey, 2020: A survey report of technology licensing and related activity for U.S. academic and nonprofit research institutions and technology investment firms. Association of University Technology Managers. Retrieved January 23, 2024 from https://autm.net/AUTM/media/SurveyReportsPDF/FY20-US-Licensing-Survey-FNL.pdf.
- American Association for the Advancement of Science. (2022). Federal R&D and facilities funding by performer, 1967-2021 [Data set]. Retrieved June 11, 2025 from https://www.aaas.org/programs/r-d-budget-and-policy/historical-trends-federal-rd.
- Anatan, L. (2015). Conceptual issues in university to industry knowledge transfer studies: A literature review. Procedia - Social and Behavioral Sciences, 211, 711-717. [CrossRef]
- Andersén, J., Jansson, C., & Ljungkvist, T. (2019). Can environmentally oriented CEOs and environmentally friendly suppliers boost the growth of small firms? Business Strategy and the Environment, 29(2), 325-334. [CrossRef]
- Andrews, M., & Boklage, A. (2023). Supporting inclusivity in STEM makerspaces through critical theory: A systematic review. Journal of Engineering Education, 113(4), 787-817. [CrossRef]
- Arenas, J. J., & González, D. (2018). Technology transfer models and elements in the university-industry collaboration. Administrative Sciences, 8(2), 1-17. [CrossRef]
- Arqué-Castells, P., Cartaxo, R. M., García-Quevedo, J., & Godinho, M. M. (2016). Royalty sharing, effort and invention in universities: Evidence from Portugal and Spain. Research Policy, 45(9), 1858-1872. [CrossRef]
- Bacharach, S. B. (1989). Organizational theories: Some criteria for evaluation. Academy of Management Review, 14(4), 496-515. [CrossRef]
- Barney, J. (1991). Firm resources and sustained competitive advantage. Journal of management, 17(1), 99-120. [CrossRef]
- Barney, J., Wright, M., & Ketchen Jr, D. J. (2001). The resource-based view of the firm: Ten years after 1991. Journal of management, 27(6), 625-641. [CrossRef]
- Barros, M. V., Ferreira, M. B., do Prado, G. F., Piekarski, C. M., & Picinin, C. T. (2020). The interaction between knowledge management and technology transfer: A current literature review between 2013 and 2018. The Journal of Technology Transfer, 45(5), 1585-1606. [CrossRef]
- Barter, N., & Russell, S. (2013). Organisational Metaphors and Sustainable Development: Enabling or Inhibiting? Sustainability Accounting Management and Policy Journal, 4(2), 145-162. https://www. [CrossRef]
- Battaglia, D., Paolucci, E., & Ughetto, E. (2021). The role of Proof-of-Concept programs in facilitating the commercialization of research-based inventions. Research Policy, 50(6), 104268. [CrossRef]
- Battistella, C., De Toni, A. F., & Pillon, R. (2016). Inter-organisational technology/knowledge transfer: A framework from critical literature review [Periodical]. Journal of Technology Transfer(5), 1195. [CrossRef]
- Bengoa, A., Maseda, A., Iturralde, T., & Aparicio, G. (2020). A bibliometric review of the technology transfer literature. The Journal of Technology Transfer, 46, 1514-1550. [CrossRef]
- Benson, D. (2012). The ballet of the planets: A mathematician’s musings on the elegance of planetary motion. Oxford University Press.
- Bergenholtz, C., & Busch, J. (2015). Self-fulfillment of social science theories. Philosophy of the Social Sciences, 46(1), 24-43. [CrossRef]
- Borge, L., & Bröring, S. (2017). Exploring Effectiveness of Technology Transfer in Interdisciplinary Settings: The Case of the Bioeconomy. Creativity and Innovation Management, 26(3), 311-322. [CrossRef]
- Bozeman, B. (2000). Technology transfer and public policy: A review of research and theory. Research Policy, 29(4,5), 627-655. [CrossRef]
- Bozeman, B., Rimes, H., & Youtie, J. (2015). The evolving state-of-the-art in technology transfer research: Revisiting the contingent effectiveness model. Research Policy, 44(1), 34. http://. [CrossRef]
- Cai, Y. (2015). What contextual factors shape ‘Innovation in Innovation’? Integration of insights from the Triple Helix and the institutional logics perspective. Social Science Information, 54(3), 299-326. [CrossRef]
- Cai, Y., & Amaral, M. (2021). The triple helix model and the future of innovation: A reflection on the triple helix research agenda. Triple Helix, 8(2), 217-229. [CrossRef]
- Campanella, F., Peruta, M. R. D., Bresciani, S., & Dezi, L. (2017). Quadruple Helix and firms’ performance: An empirical verification in Europe. The Journal of Technology Transfer, 42(2), 267-284. [CrossRef]
- Carayannis, E. G., Barth, T. D., & Campbell, D. F. J. (2012). The Quintuple Helix Innovation Model: Global warming as a challenge and driver for innovation. Journal of Innovation and Entrepreneurship, 1(1), 2. [CrossRef]
- Carayannis, E. G., & Campbell, D. F. (2010). Triple Helix, Quadruple Helix and Quintuple Helix and how do knowledge, innovation and the environment relate to each other?: A proposed framework for a trans-disciplinary analysis of sustainable development and social ecology. International Journal of Social Ecology and Sustainable Development (IJSESD), 1(1), 41-69. [CrossRef]
- Cloitre, A., Dos Santos Paulino, V., & Theodoraki, C. (2023). The quadruple/quintuple helix model in entrepreneurial ecosystems: An institutional perspective on the space case study. R&D Management, 53(4), 675-694. [CrossRef]
- Coppedge, M. (2012). Criteria for evaluating causal theories. In Democratization and Research Methods (pp. 49-75). Cambridge University Press. [CrossRef]
- Costa, L. s. A., Cool, K., & Dierickx, I. (2012). The competitive implications of the deployment of unique resources. Strategic Management Journal, 34(4), 445-463. [CrossRef]
- Cummings, S., & Thanem, T. (2002). Essai: The Ghost in the Organism. Organization studies, 23(5), 817-839. [CrossRef]
- Cunha, E. P. (2022). Herbert Simon’s epistemological itinerary on the limits of rationality. Organizações & Sociedade, 29(103), 614-637. [CrossRef]
- Curado, C., & Bontis, N. (2006). The knowledge-based view of the firm and its theoretical precursor. International Journal of Learning and Intellectual Capital, 3(4), 367-381. [CrossRef]
- Cyert, R. M., & March, J. G. (1963). A behavioral theory of the firm. Prentice-Hall.
- Deakin, M. (2022). Triple, Quadruple and N-Tuple Helices: The RIS3 and EDP of a Higher-Order Policy Model. Triple Helix Journal, 9(1), 32-42. [CrossRef]
- DiMaggio, P. J., & Powell, W. W. (1983). The iron cage revisited: Institutional isomorphism and collective rationality in organizational fields. American Sociological Review, 48(2), 147-160. [CrossRef]
- Eðvarðsson, I. R., & Óskarsson, G. K. (2011). Outsourcing in knowledge-based service firms. International Journal of Knowledge-Based Organizations, 1(3), 39-55. [CrossRef]
- Estrada, F. (2010). Economics and rationality of organizations: An approach to the work of Herbert A. Simon. SSRN Electronic Journal. [CrossRef]
- Fawcett, J. (2005). Criteria for evaluation of theory. Nursing Science Quarterly, 18(2), 131-135. [CrossRef]
- Federal Reserve Bank of Minneapolis. (2025). Consumer price index, 1913-present: Historical data from the era of the modern U.S. consumer price index (CPI) [Data set]. Retrieved June 1, 2025 from https://www.minneapolisfed.org/about-us/monetary-policy/inflation-calculator/consumer-price-index-1913-.
- Felin, T., & Foss, N. J. (2009). Social reality, the boundaries of self-fulfilling prophecy, and economics. Organization Science, 20(3), 654-668. [CrossRef]
- French, S., Green, S., O’Connor, D., McKenzie, J. E., Francis, J., Michie, S.,... Grimshaw, J. (2012). Developing theory-informed behaviour change interventions to implement evidence into practice: A systematic approach using the theoretical domains framework. Implementation Science, 7(1). [CrossRef]
- Gagné, M. (2018). From strategy to action: Transforming organizational goals Into organizational fehavior. International Journal of Management Reviews, 20(S1). [CrossRef]
- Ghoshal, S., & Moran, P. (1996). Bad for practice: A critique of the transaction cost theory. The Academy of Management Review, 21(1), 13-47. [CrossRef]
- Goolkasian, P. (1996). Picture-word differences in a sentence verification task. Memory & Cognition, 24(5), 584-594. [CrossRef]
- Gotham, D., Meldrum, J., Nageshwaran, V., Counts, C., Kumari, N., Martín, M. d. M.,... Post, N. (2016). Global health equity in United Kingdom university research: A landscape of current policies and practices. Health Research Policy and Systems, 14(1). [CrossRef]
- Grant, C., & Osanloo, A. F. (2014). Understanding, selecting, and integrating a theoretical framework in dissertation research: Creating the blueprint for your “house”. Administrative Issues Journal Education Practice and Research, 4(2). [CrossRef]
- Grant, R. M. (1996). Toward a knowledge-based theory of the firm. Strategic Management Journal, 17, 109-122. [CrossRef]
- Gresov, C., & Drazin, R. (1997). Equifinality: Functional equivalence in organization design. The Academy of Management Review, 22(2), 403-428. [CrossRef]
- Hardt, Ł. (2011). An inquiry Into the explanatory virtues of transaction cost economics. Journal of Philosophical Economics, Volume V Issue 1(Articles). [CrossRef]
- Hayward, T., & Broady-Preston, J. (1994). Macroeconomic change: Information and knowledge. Journal of information science, 20(6), 377-387. [CrossRef]
- Holdsworth, D. G. (2011). Economics and the limits of optimization: Steps towards extending Bernard Hodgson’s moral science. Journal of business ethics, 108(1), 37-48. [CrossRef]
- Jabareen, Y. (2009). Building a conceptual framework: philosophy, definitions, and procedure. International journal of qualitative methods, 8(4), 49-62.
- Kass, R. E., & Raftery, A. E. (1995). Bayes factors. Journal of the American Statistical Association, 90(430), 773-795. [CrossRef]
- Keen, S. (2001). Debunking economics: The naked emperor of the social sciences. Zed Books.
- Keen, S. (2011). Debunking economics: The naked emperor dethroned? Zed Books Ltd.
- König, J., Suwala, L., & Delargy, C. (2020). Helix models of innovation and sustainable development goals. In W. Leal Filho, A. Azul, L. Brandli, A. Lange Salvia, & T. Wall (Eds.), Industry, Innovation and Infrastructure. Encyclopedia of the UN Sustainable Development Goals (pp. 473-487). Springer.
- Kunwar, R. R., & Ulak, N. (2024). Extension of the Triple Helix to Quadruple to Quintuple Helix Model. Journal of Apf Command and Staff College, 7(1), 241-280. 10.3126/japfcsc.v7i1.67006.
- Leydesdorff, L., & Etzkowitz, H. (1996). Emergence of a Triple Helix of university—industry—government relations. Science and Public Policy, 23(5), 279-286. [CrossRef]
- Leydesdorff, L., & Etzkowitz, H. (1998). Triple Helix of innovation: Introduction. Science and Public Policy, 25(6), 358-364. [CrossRef]
- Leydesdorff, L., & Smith, H. L. (2022). Triple, Quadruple, and higher-order helices: Historical phenomena and (neo-)evolutionary models. Triple Helix Journal, 9(1), 6-31. [CrossRef]
- Lopez, N. R., Cabal, J. V. A., Cuinas, M. C., & Fernndez, F. O. (2023). Applicability of technology maturity level evaluation methodologies within small- and medium-sized organizations: Prospects and proposals. Systems, 11(8), 387. [CrossRef]
- Mahoney, J. T. (2001). A resource-based theory of sustainable rents. Journal of management, 27(6), 651-660. [CrossRef]
- Marcinkowska, E. (2015). Concept of transaction costs and its influence on the development of offshore outsourcing. China-Usa Business Review, 14(3). [CrossRef]
- Maslow, A. H. (1943). A theory of human motivation. Psychological review, 50(4), 370. [CrossRef]
- McInerney, C. R. (2002). Knowledge management and the dynamic nature of knowledge. Journal of the American society for information science and technology, 53(12), 1009-1018. [CrossRef]
- Meier, C., & Jäckli, U. (2023). Linking business ecosystems and transaction cost theory: Between market and hierarchy and the role of power. International Journal of Management Knowledge and Learning, 12. [CrossRef]
- Meyer, J. W., & Rowan, B. (1977). Institutionalized organizations: Formal structure as myth and ceremony. The American journal of sociology, 83(2), 340-363. [CrossRef]
- Mineiro, A. A. d. C., Arantes, R. d. C., Vieira, K. C., Castro, C. C., Carvalho, E. G., & Amaral, M. G. d. (2021). Business practices for strengthening the Quadruple and Quintuple Helix: A study using structural equation modeling. International Journal of Innovation Science, 15(1), 1-18. [CrossRef]
- Miranda, S. M., & Kim, Y. M. (2006). Professional versus political contexts: Institutional mitigation and the transaction cost heuristic in information systems outsourcing. Mis Quarterly, 30(3), 725-753. [CrossRef]
- Mohammad, I., Ronggo, A., & Akhmad, F. (2017). Maturity level of information technology using Cobit framework 4.1 (Case study: Cloud computing service provider). Jurnal Ilmiah Kursor: Menuju Solusi Teknologi Informasi, 9(2). [CrossRef]
- Mulder, P., & Bergh, J. C. J. M. v. d. (2001). Evolutionary economic theories of sustainable development. Growth and Change, 32(1), 110-134. [CrossRef]
- Munteanu, R. (2012). Stage of development and licensing university inventions. International Journal of Management and Enterprise Development, 12(1). [CrossRef]
- Musser, G. (2015). Spooky action at a distance: The phenomenon that reimagines space and time--and what it means for black holes, the Big Bang, and theories of everything. Macmillan.
- Mutlu, C., & Arikboga, F. Ş. (2023). Evolution of Triple and Quadruple Helix Model to Qintuple Helix Model: A bibliometic analysis. International Journal of Western Black Sea Social and Humanities Sciences, 7(2), 246-272. [CrossRef]
- Nassani, L. M., Javed, K., Amer, R. S., Pun, M. H. J., Abdelkarim, A. Z., & Fernandes, G. V. O. (2024). Technology readiness level of robotic technology and artificial intelligence in dentistry: A comprehensive review. Surgeries, 5(2), 273-287. https://dor.org/10.3390/surgeries5020025.
- National Institute of Standards and Technology. (2022). Federal laboratory technolgy transfer fiscal year 2019: Summary report to the President and the Congress. U.S. Department of Commerce. Retrieved November 1, 2023 from https://www.nist.gov/system/files/documents/2022/09/29/FY2019%20Federal%20Technology%20Transfer%20Report.pdf.
- In The rate and direction of inventive activity: Economic and social factors, 1 ed.; Nelson, R. R. (Ed.). (1962). The rate and direction of inventive activity: Economic and social factors (1 ed., Vol. 1925). Princeton University Press. https://www.nber.org/books-and-chapters/rate-and-direction-inventive-activity-economic-and-social-factors.
- Nolte, W. L. (2008). Did I ever tell you about the whale?: Or measuring technology maturity. Information Age Publishing.
- Norman, G. A. V., & Eisenkot, R. (2017). Technology transfer: From the research bench to commercialization. JACC: Basic to Translational Science, 2(2), 197-208. [CrossRef]
- Noya, S., Taneo, S. Y. M., Melany, M., & Widyaningrum, S. (2024). Collaboration with Triple Helix: The mediating effect of mass media in expanding SMEs’ information access. Quality Innovation Prosperity, 28(1), 67-87. [CrossRef]
- Plummer, M., Best, N., Cowles, K., Vines, K., Sarkar, D., Bates, D.,... Magnusson, A. (2020). coda: Output analysis and diagnostics for MCMC (Version 0.19-4.1) [Software]. The R Foundation. Retrieved January 21, 2024 from https://cran.r-project.org/web/packages/coda/index.html.
- Plummer, M., Stukoalov, A., & Denwood, M. (2023). rjags: Bayesian graphical models using MCMC (Version 4-15) [Software]. The R Foundation. Retrieved April 2, 2025 from https://mcmc-jags.sourceforge.io.
- Posit Team. (2025). RStudio: Integrated development environment for R (Version 2025.05.01 Build 513) [Software]. Posit Software, PBC. Retrieved June 8, 2025 from https://www.posit.co.
- Prodan, I., Drnovsek, M., & Ulijn, J. (2009). A conceptual framework for studying a technology transfer from academia to new firms. In R. Oakey, A. Groen, G. Cook, & P. van der Sijde (Eds.), New Technology-Based Firms in the New Millennium: The Production and Distribution of Knowledge (Vol. 7, pp. 185-203). Emerald Group Publishing Limited. [CrossRef]
- Puzon, K., & Gisselquist, R. M. (2023). Theoretical models of inequality: Examples From rational choice theory and behavioural economics. International Social Science Journal, 73(248), 325-338. [CrossRef]
- Queiroz, M. M., Fosso Wamba, S., Chiappetta Jabbour, C. J., Lopes de Sousa Jabbour, A. B., & Machado, M. C. (2022). Adoption of Industry 4.0 technologies by organizations: A maturity levels perspective. Annals of Operation Research, 1-27. [CrossRef]
- Raftery, A. E., & Lewis, S. M. (1996). Implementing MCMC. In W. R. Gilks, D. J. Spiegelhalter, & S. Richardson (Eds.), Markov chain Monte Carlo in practice (pp. 115-130). Chapman & Hall.
- Rybicka, J., Tiwari, A., & Leeke, G. A. (2016). Technology readiness level assessment of composites recycling technologies. Journal of Cleaner Production, 112, 1001-1012. 10.1016/j.jclepro.2015.08.104.
- Schacht, W. H. (2012). The Bayh-Dole act: selected issues in patent policy and the commercialization of technology. (RL30276). Washington, DC: Library of Congress. Retrieved January 9, 2020 from http://crsreports.congress.gov.
- Schumacher, H., & Thysen, H. C. (2022). Equilibrium contracts and boundedly rational expectations. Theoretical Economics, 17(1), 371-414. [CrossRef]
- Scott, W. R. (2005). Institutional theory: Contributing to a theoretical research program. In K. G. Smith & M. A. Hitt (Eds.), Great minds in management: The process of theory development. Oxford University Press. Retrieved June 29, 2025 from https://www.researchgate.net/profile/W-Scott/publication/265348080_Institutional_Theory_Contributing_to_a_Theoretical_Research_Program/links/54de42450cf2966637857c60/Institutional-Theory-Contributing-to-a-Theoretical-Research-Program.pdf.
- Shafeey, T. E., & Trott, P. (2014). Resource-based competition: Three schools of thought and thirteen criticisms. European Business Review, 26(2), 122-148. [CrossRef]
- Shah, P., Vaughan, G., & Ledley, F. D. (2023). Comparing the economic terms of biotechnology licenses from academic institutions with those between commercial firms. PLoS ONE, 18(3), e0283887. [CrossRef]
- Simon, H. A. (1945/1997). Administrative behavior: A study of decision-making processes in administrative organization 4th ed., Vol. [Non-fiction]. The Free Press. (Original work published 1945).
- Simon, H. A. (1955). A behavioral model of rational choice. The Quarterly Journal of Economics, 69(1), 99-118. http://www.suz.uzh.ch/dam/jcr:ffffffff-fad3-547b-ffff-fffff0bf4572/10.18-simon-55.pdf.
- Simon, H. A. (1957). Models of man, social and rational: Mathematical essays on rational human behavior in society setting. John Wiley and Sons.
- Simon, H. A. (1972). Theories of bounded rationality. In C. B. McGuire & R. Radner (Eds.), Decision and organization: A volume in honor of Jacob Marschak (pp. 161-176). North-Holland Publishing Company.
- Simon, H. A. (1982). Models of bounded rationality. MIT Press.
- Smart, J., & Benaroya, H. (2016). An examination of non-linear and passive technology transfer in the space sector: Consideration of the Contingent Effectiveness Model as a basis for formal modeling. Space policy, 38, 39-47. [CrossRef]
- Srivastava, B., & Mir, R. (2022). The knowledge based view of the firm: An assessment. Journal of Organizational Psychology, 22(3). [CrossRef]
- Steinmann, B., Klug, H. J. P., & Maier, G. W. (2018). The path is the goal: How transformational leaders enhance followers’ job attitudes and proactive behavior. Frontiers in Psychology, 9. [CrossRef]
- Sung, W., & Kim, C. (2021). A study on the effect of change management on organizational innovation: Focusing on the mediating effect of members’ innovative behavior. Sustainability, 13(4), 2079. 10.3390/su13042079.
- The R Foundation. (2023). The R project for statistical computing (Version 4.2.3) [Software]. The R Foundation. https://www.R-project.org.
- Thursby, J. G., & Thursby, M. C. (2001). Industry perspectives on licensing university technologies: Sources and problems. Industry and Higher Education, 15(4), 289-294. [CrossRef]
- Townes, M. S. (2022). The influence of technology maturity level on the incidence of university technology transfer and the implications for public policy and practice (Publication Number 29209868) [Doctoral dissertation, Saint Louis University]. ProQuest.
- Townes, M. S. (2024). The role of technology maturity level in the cccurrence of university technology transfer. Journal of the Knowledge Economy. [CrossRef]
- Townes, M. S. (2025). The conceptualisation of techology in scholarly research and public policy regarding university technology transfer. International Journal of Technology Transfer and Commercialisation, 21(3). [CrossRef]
- U.S. Bureau of Economic Analysis. (2011). Regional input-output modeling system (RIMS II): An essential tool for regional developers and planners. Washington, D.C., United States of America: U.S. Department of Commerce. Retrieved May 29, 2025 from https://www.bea.gov/resources/methodologies/RIMSII-user-guide.
- U.S. Bureau of Economic Analysis. (2025, March 28). Gross domestic product by state and personal income by state, 4th quarter 2024 and preliminary 2024 [Data set]. U.S. Department of Commerce. Retrieved May 29, 2025 from https://www.bea.gov/data/gdp/gdp-state.
- Valentinov, V., & Iliopoulos, C. (2024). The idea of adaptation in transaction cost economics: An application to stakeholder theory. Society and Business Review, 19(3), 473-495. https://10.1108/sbr-03-2023-0072.
- Valentinov, V., & Roth, S. (2024). Relationality in transaction cost economics and stakeholder theory: A new conceptual framework. Business Ethics the Environment & Responsibility, 33(3), 535-546. [CrossRef]
- von Bertalanffy, L. (1969). General system theory: Foundations, development, applications. George Braziller, Inc.
- Walker, A., & Wing, C. K. (1999). The relationship between construction project management theory and transaction cost economics. Engineering Construction & Architectural Management, 6(2), 166-176. [CrossRef]
- Weber, M. (1921-1922/2019). Economy and society K. Tribe, Ed. & Trans. Harvard University Press. (Original work published 1921-1922).
- Williamson, O. E. (1998). Transaction cost economics: How it works; where it is headed. De economist, 146(1), 23-58. [CrossRef]
- Williamson, O. E. (2013). The transaction cost economics project: The theory and practice of the governance of contractual relation. Edward Elgar Publishing.
- Wilton, R., & Harley, T. (2018). The criteria used for choosing between competing theories. In Science and Psychology (pp. 43-60). Routledge. [CrossRef]
- Wright, P. M. (2001). Human resources and the resource based view of the firm. Journal of management, 27(6), 701-721. [CrossRef]
Figure 1.
Estimated Percentage of Federal Laboratory and University Technologies That Are Licensed. Note. Figure created by author. Data sources: Schacht, 2006; Author’s analysis.
Figure 1.
Estimated Percentage of Federal Laboratory and University Technologies That Are Licensed. Note. Figure created by author. Data sources: Schacht, 2006; Author’s analysis.
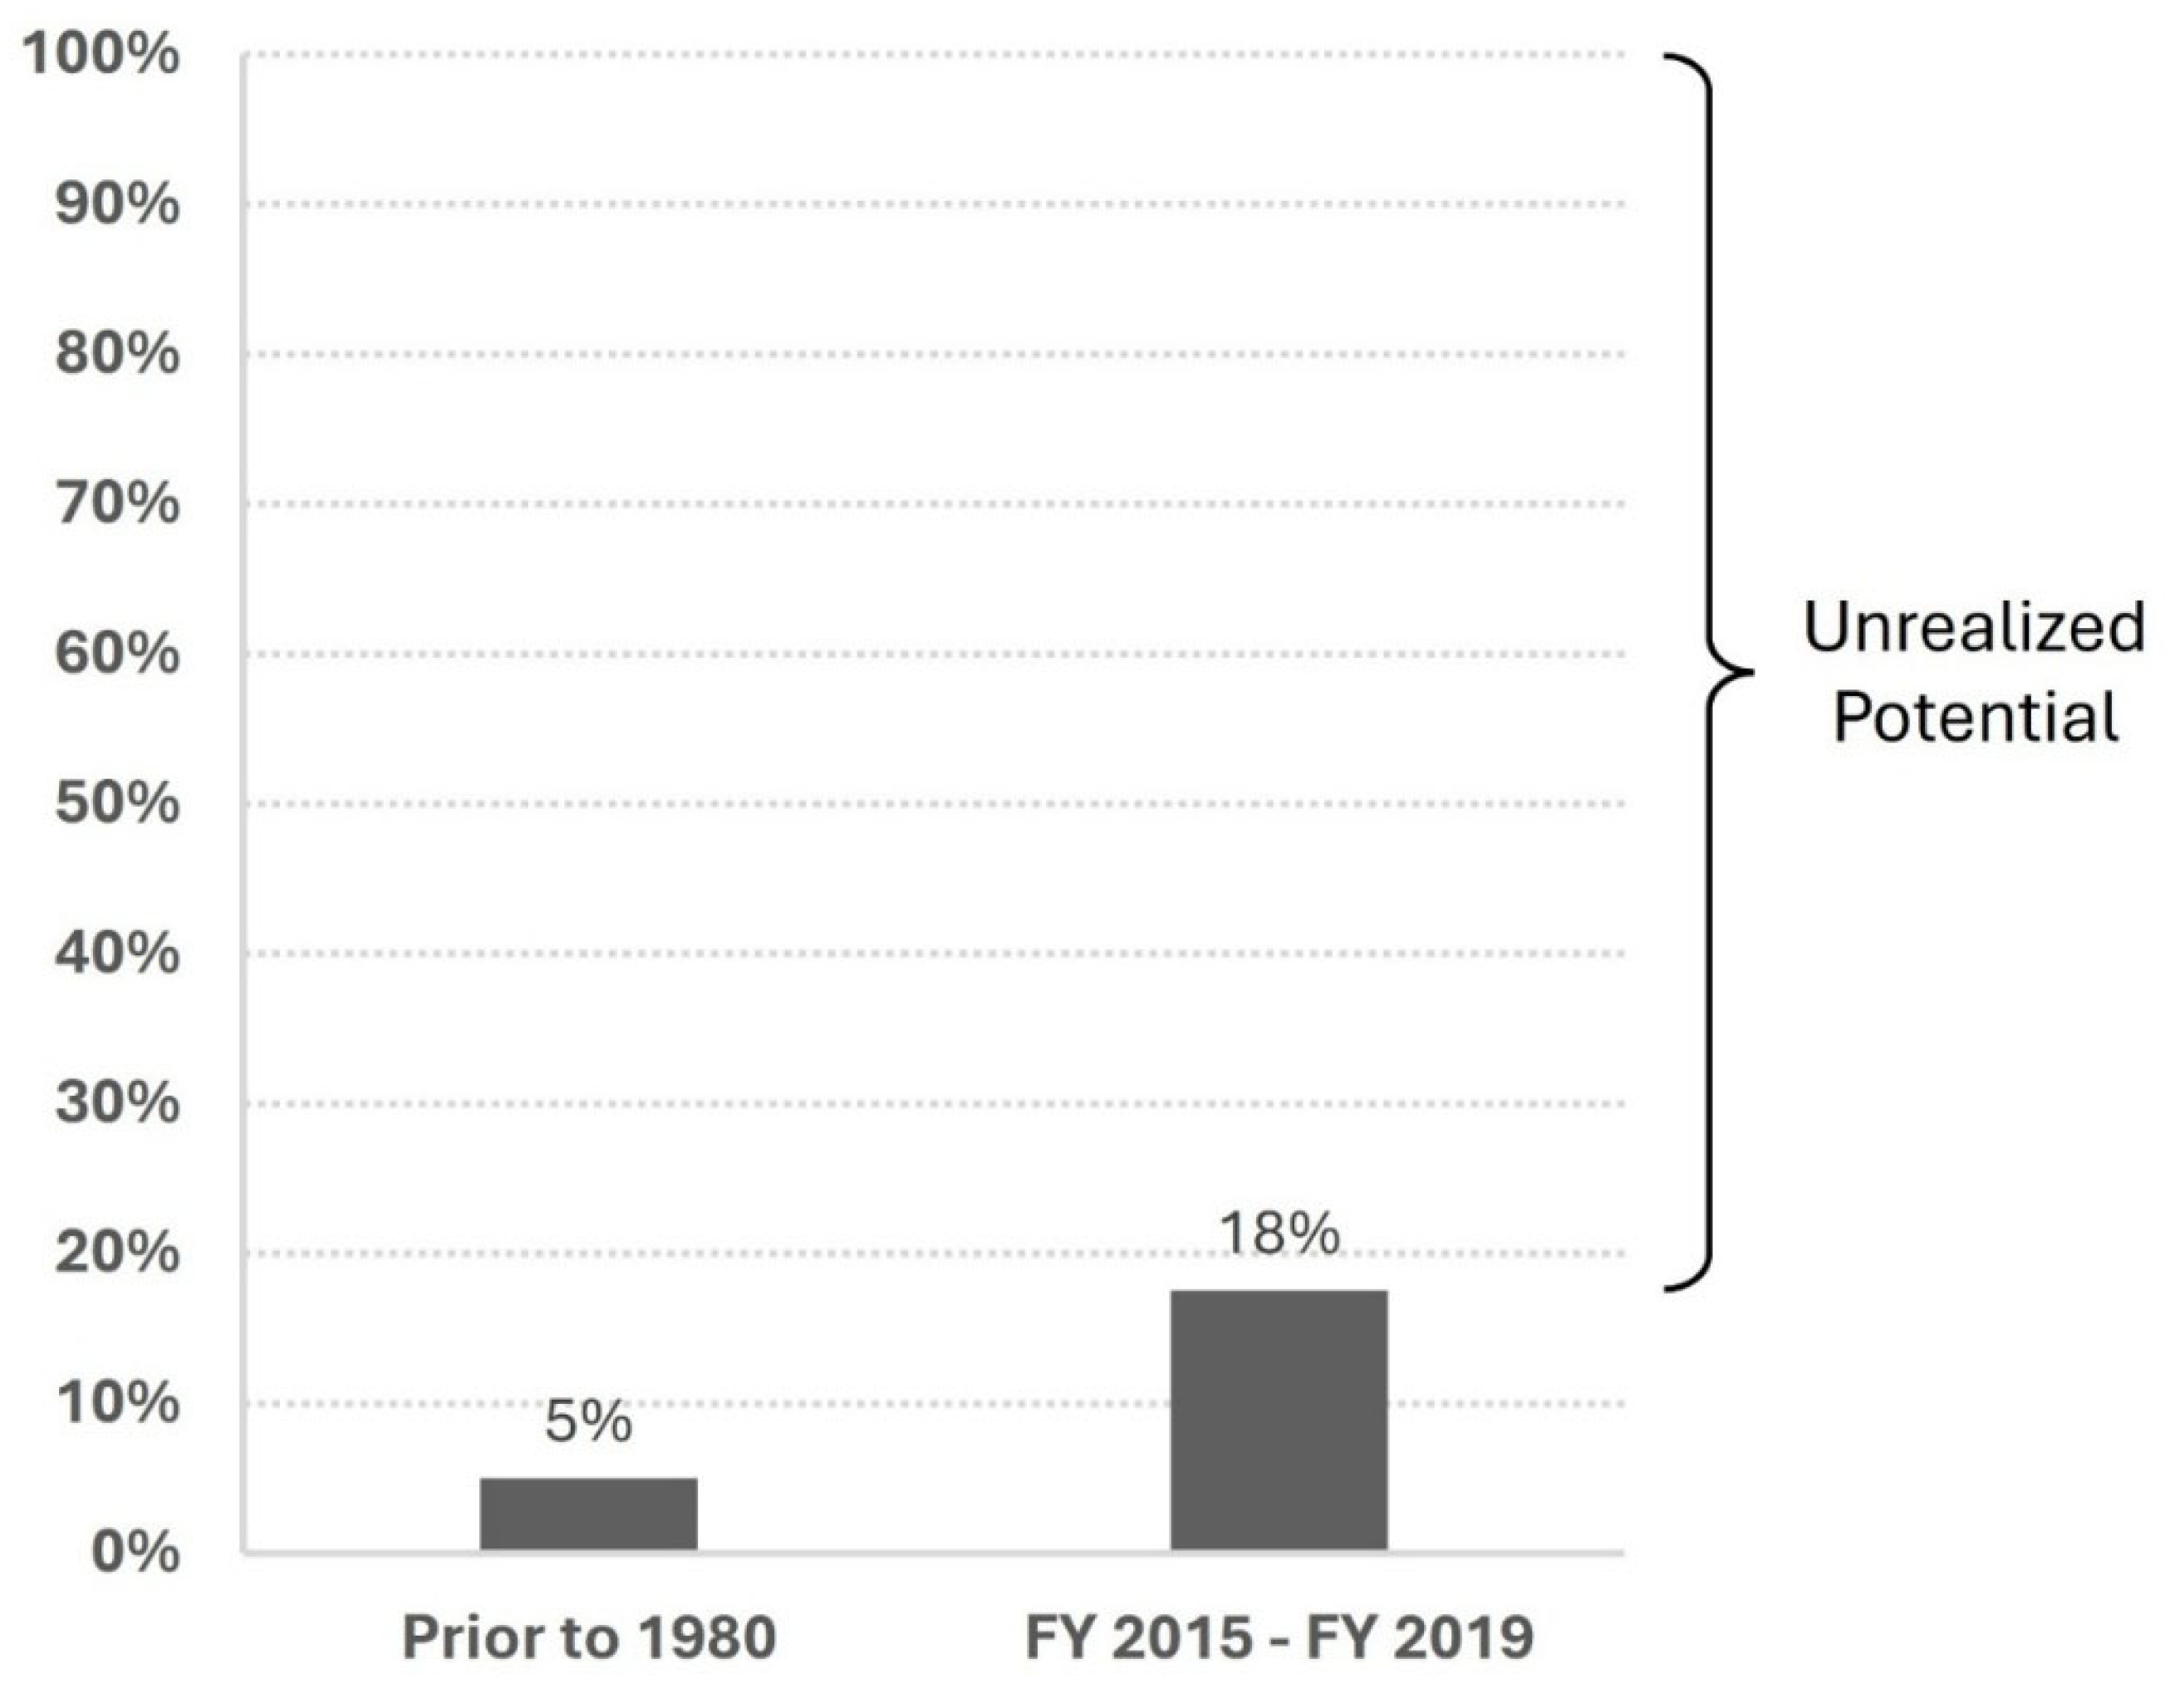
Figure 2.
Diagrammatic Interpretation of the Behavioral Theory of the Firm. Note. Figure created by author.
Figure 2.
Diagrammatic Interpretation of the Behavioral Theory of the Firm. Note. Figure created by author.
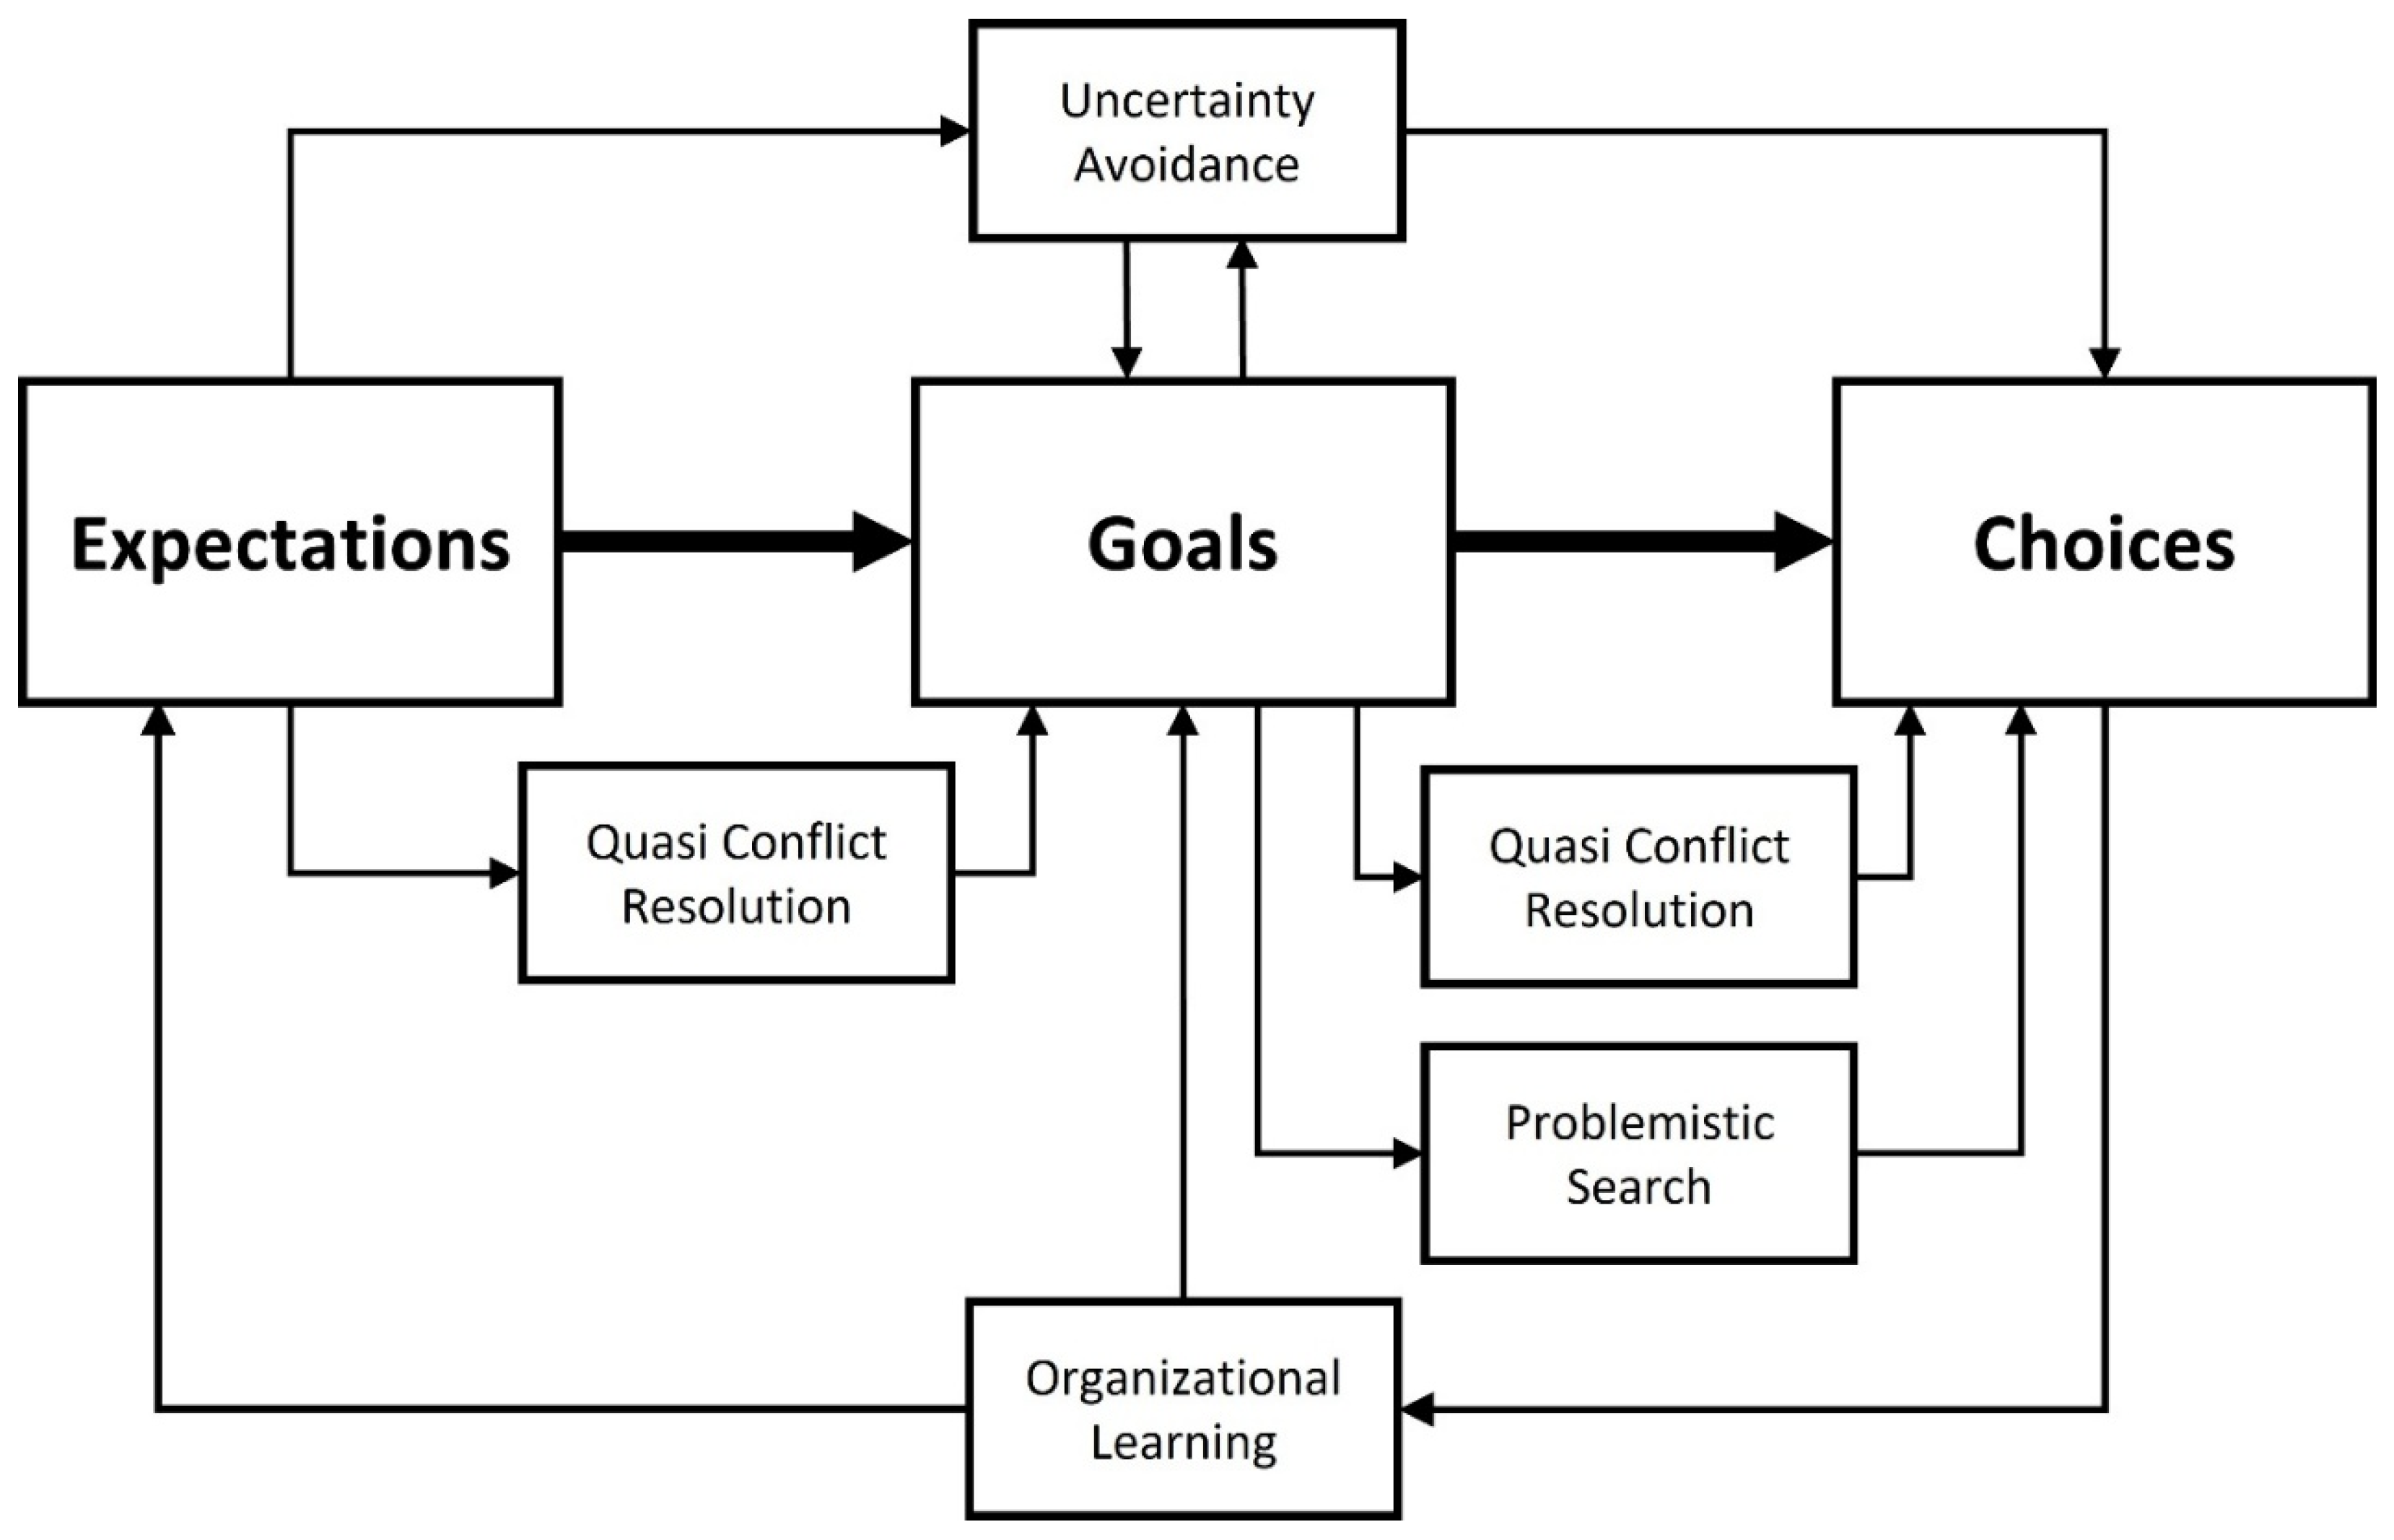
Figure 3.
Human-Centered Framework. Note. Figure created by author.
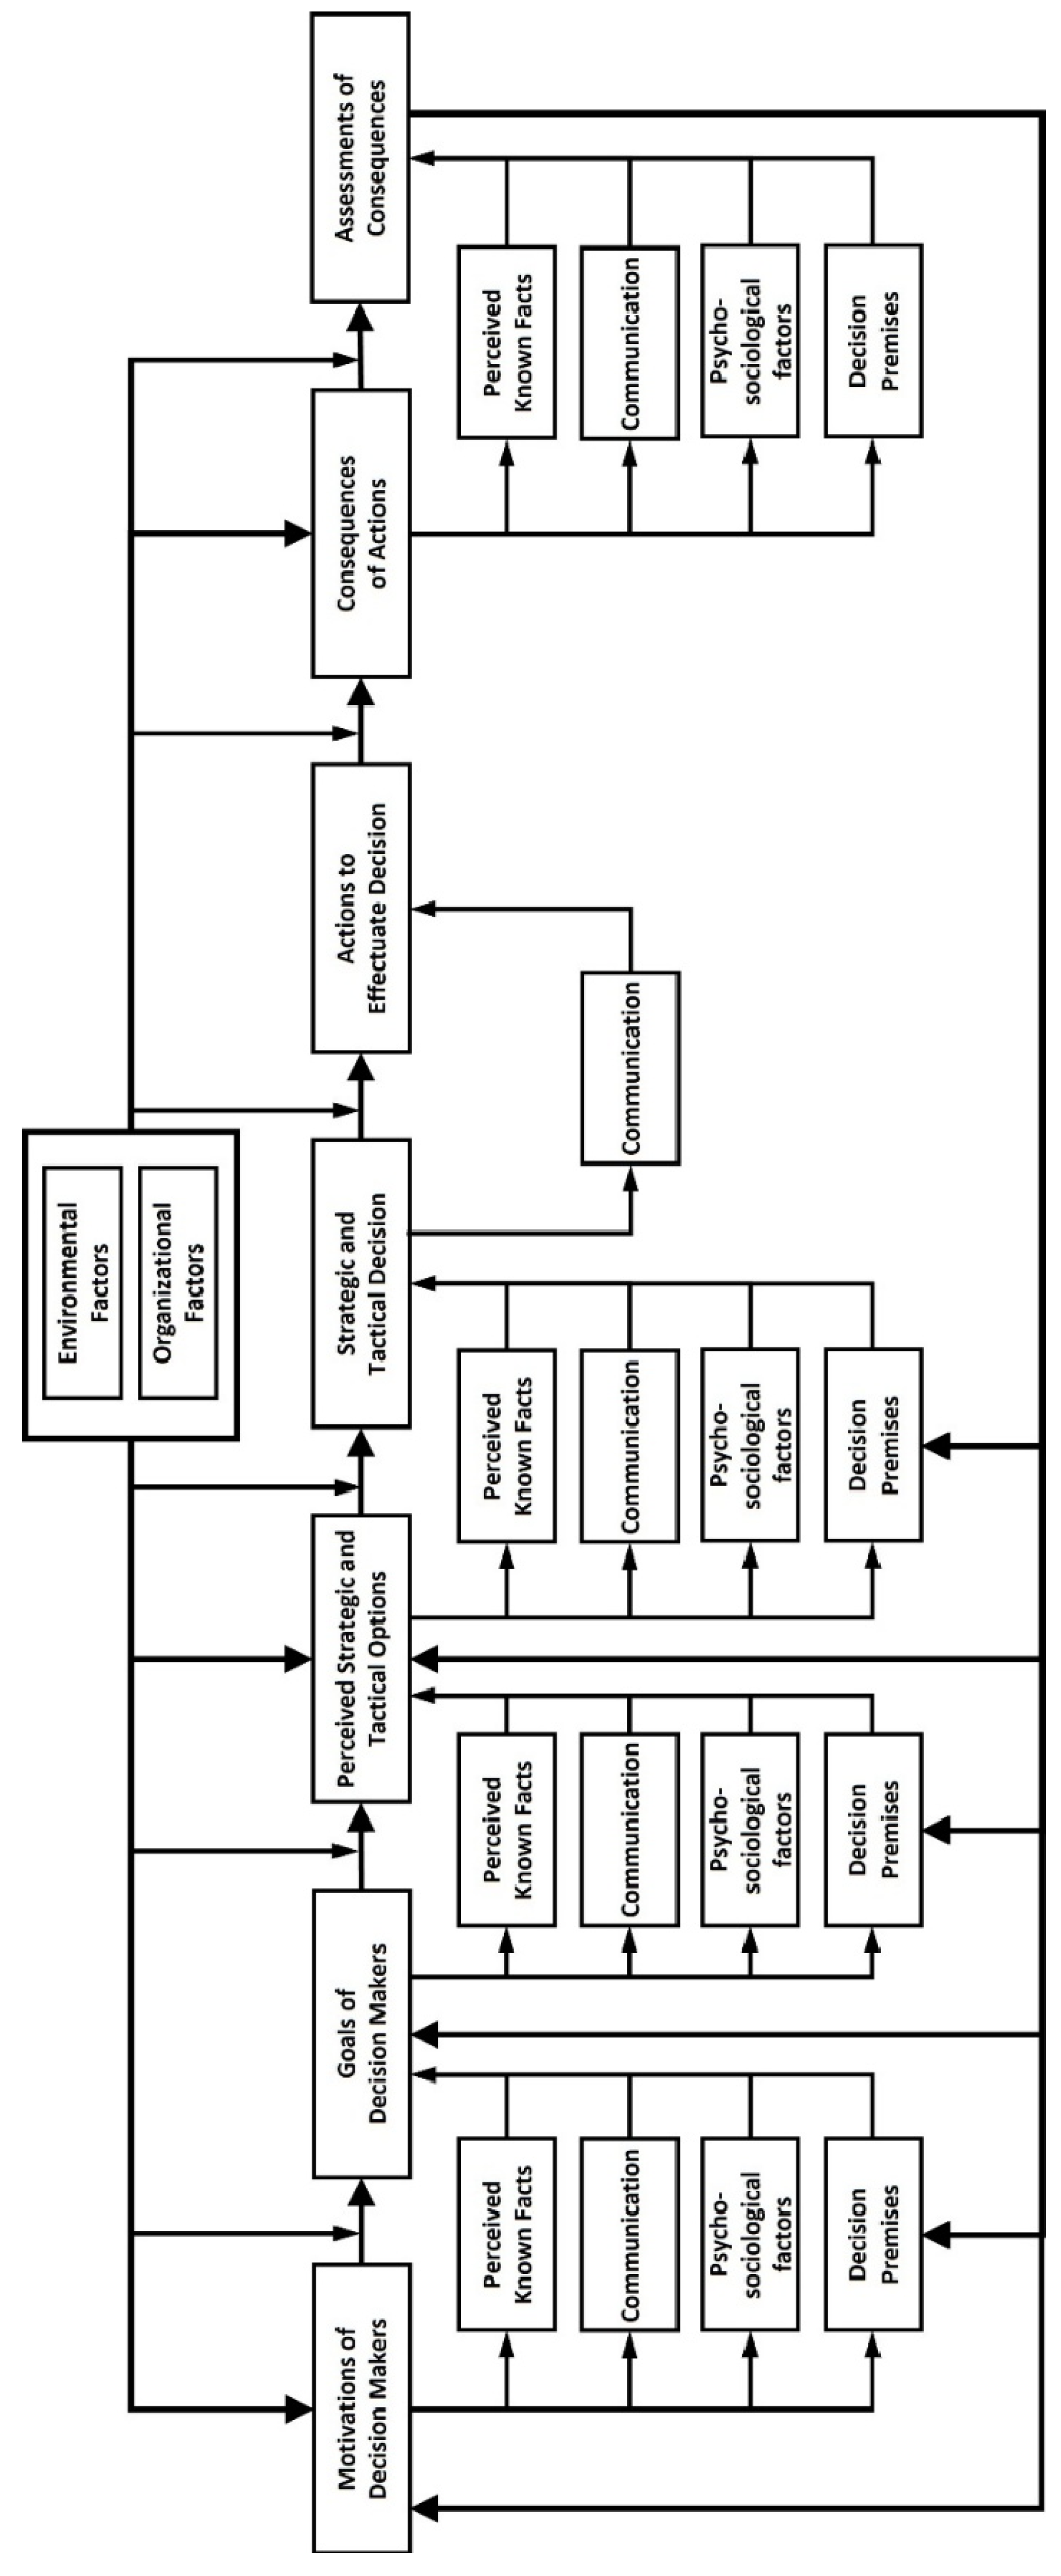
Figure 4.
Hierarchical Bayesian Model for the Occurrence of a Technology Licensing Event. Note. Figure created by author.
Figure 4.
Hierarchical Bayesian Model for the Occurrence of a Technology Licensing Event. Note. Figure created by author.
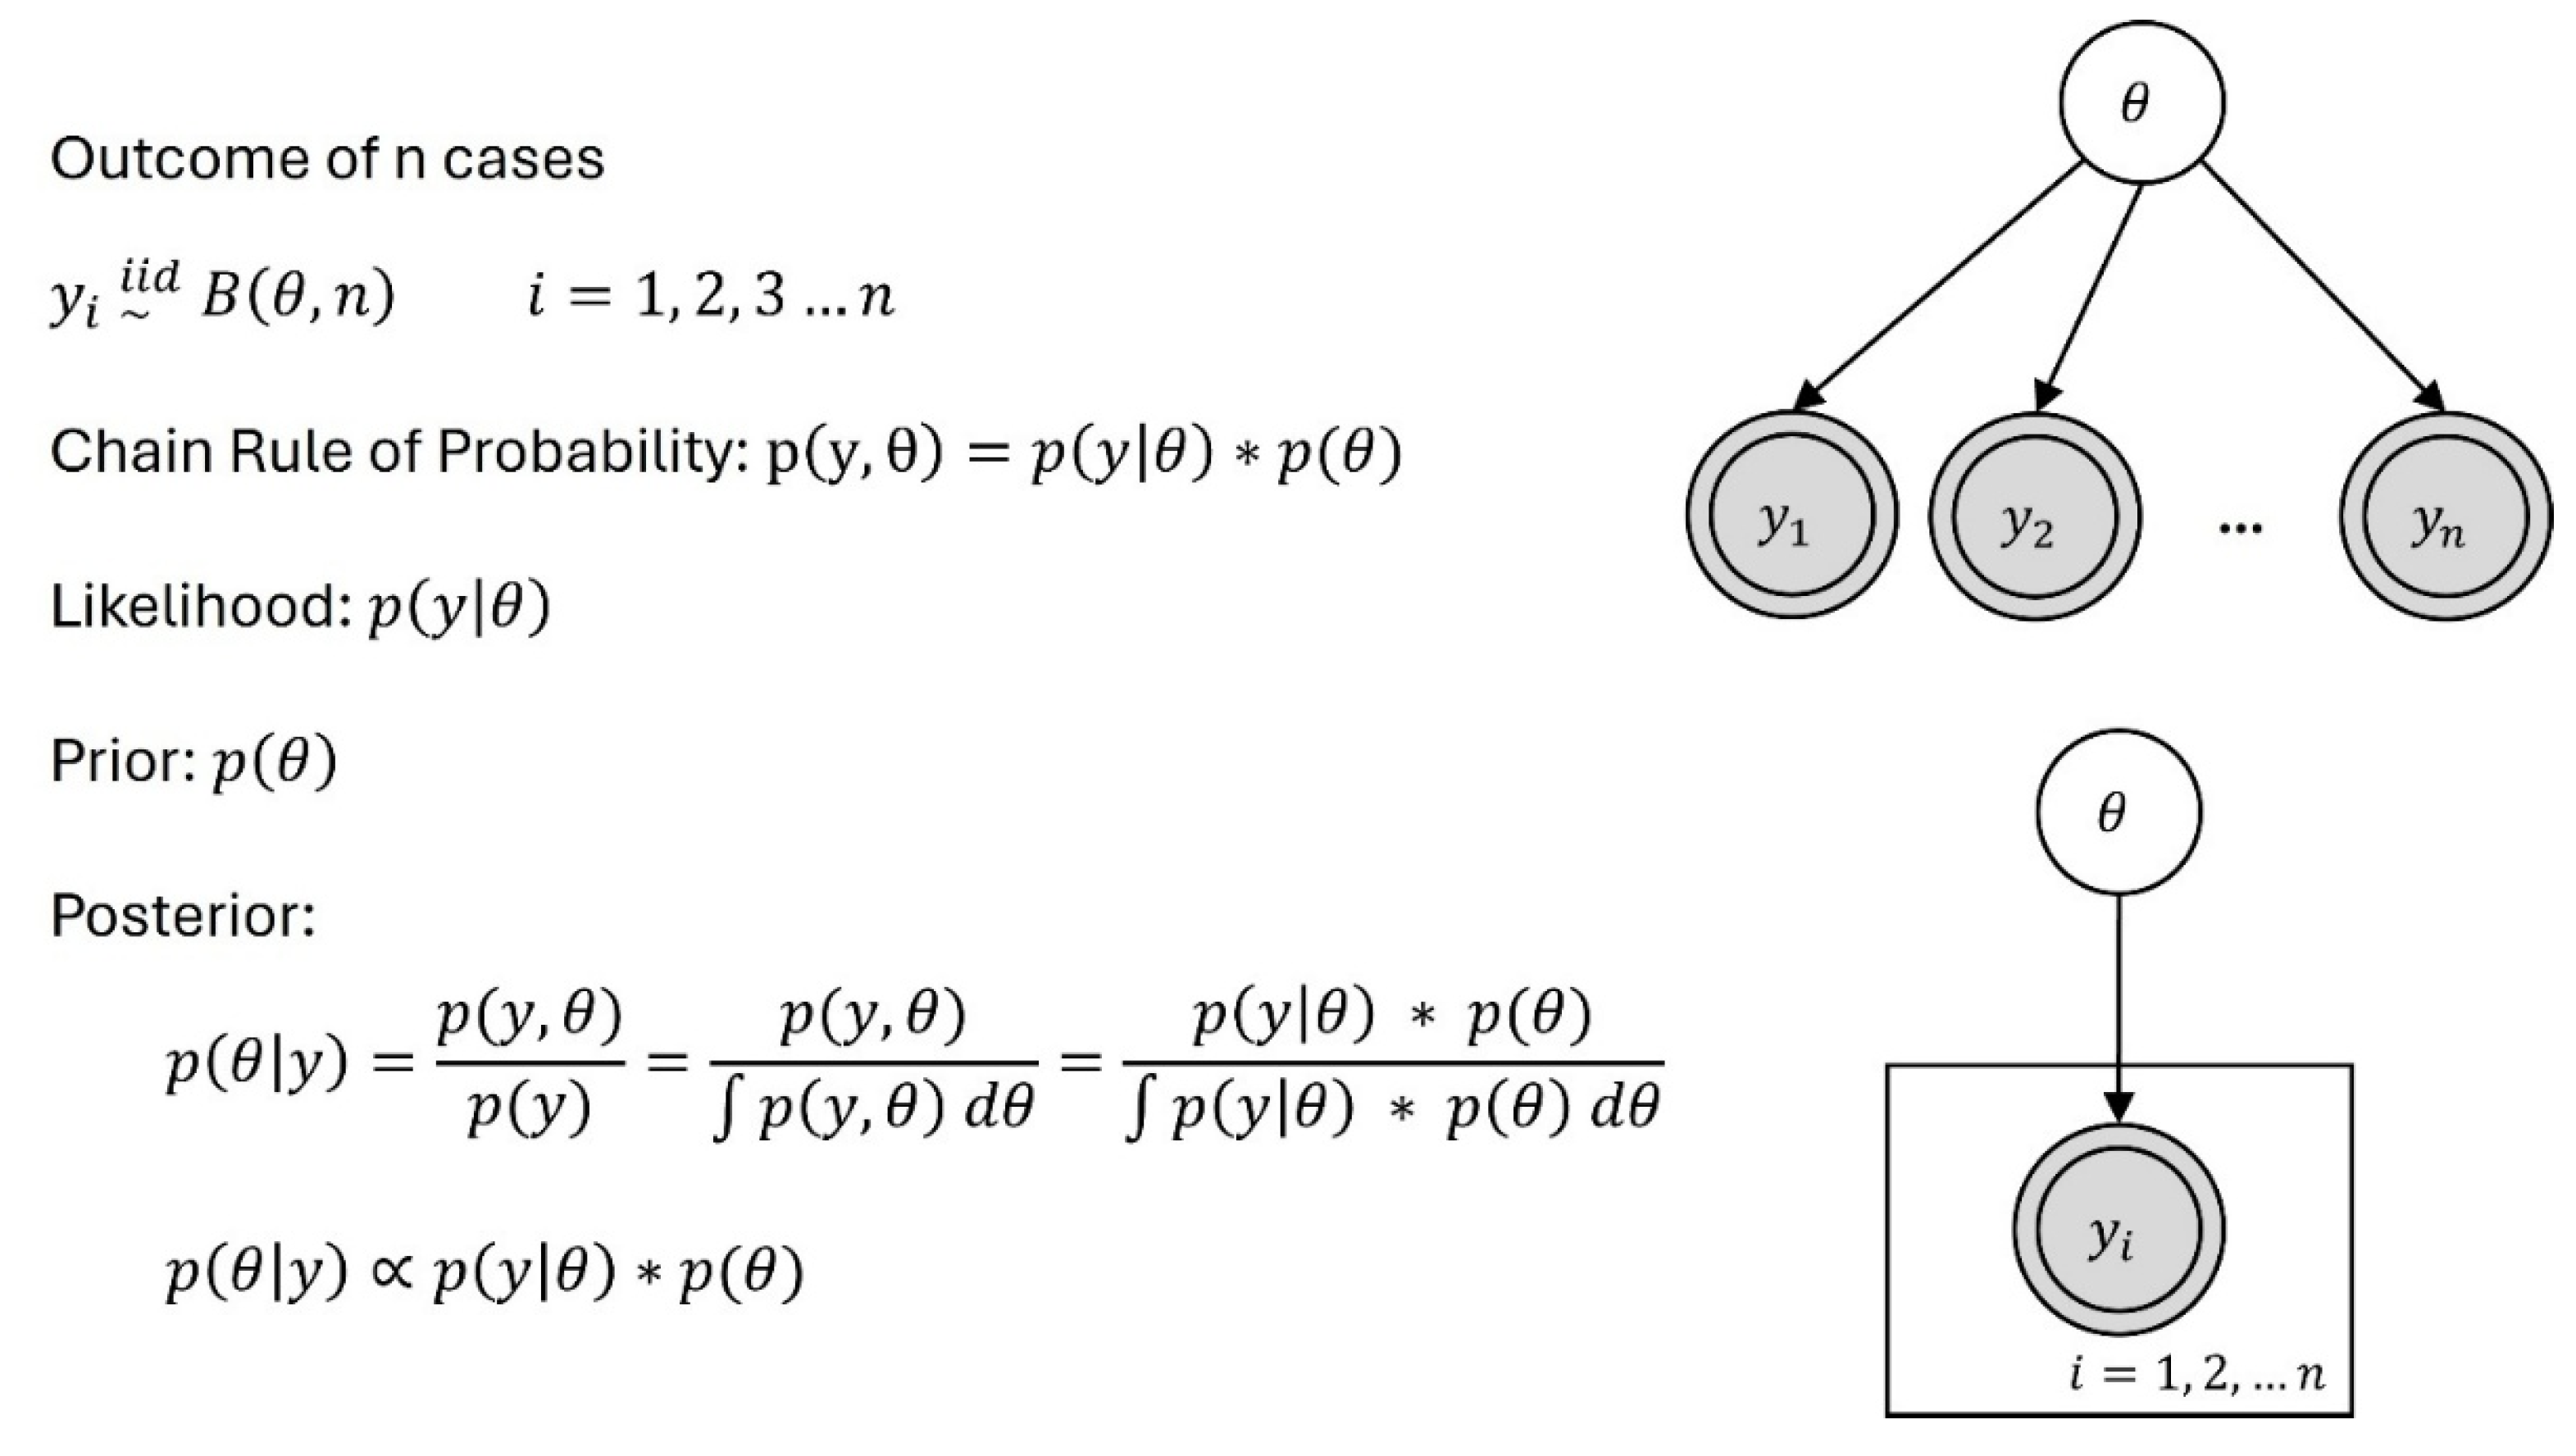
Figure 5.
Histograms of Licensing Revenue Data. Note. Figure created by R package. Figure 4b,c exclude certain values to better illustrate the distribution of licensing revenue. Before calculating the natural logarithm in Figure 4d, one dollar was added to the licensing revenue of each observation to avoid undefined values in the transformation.
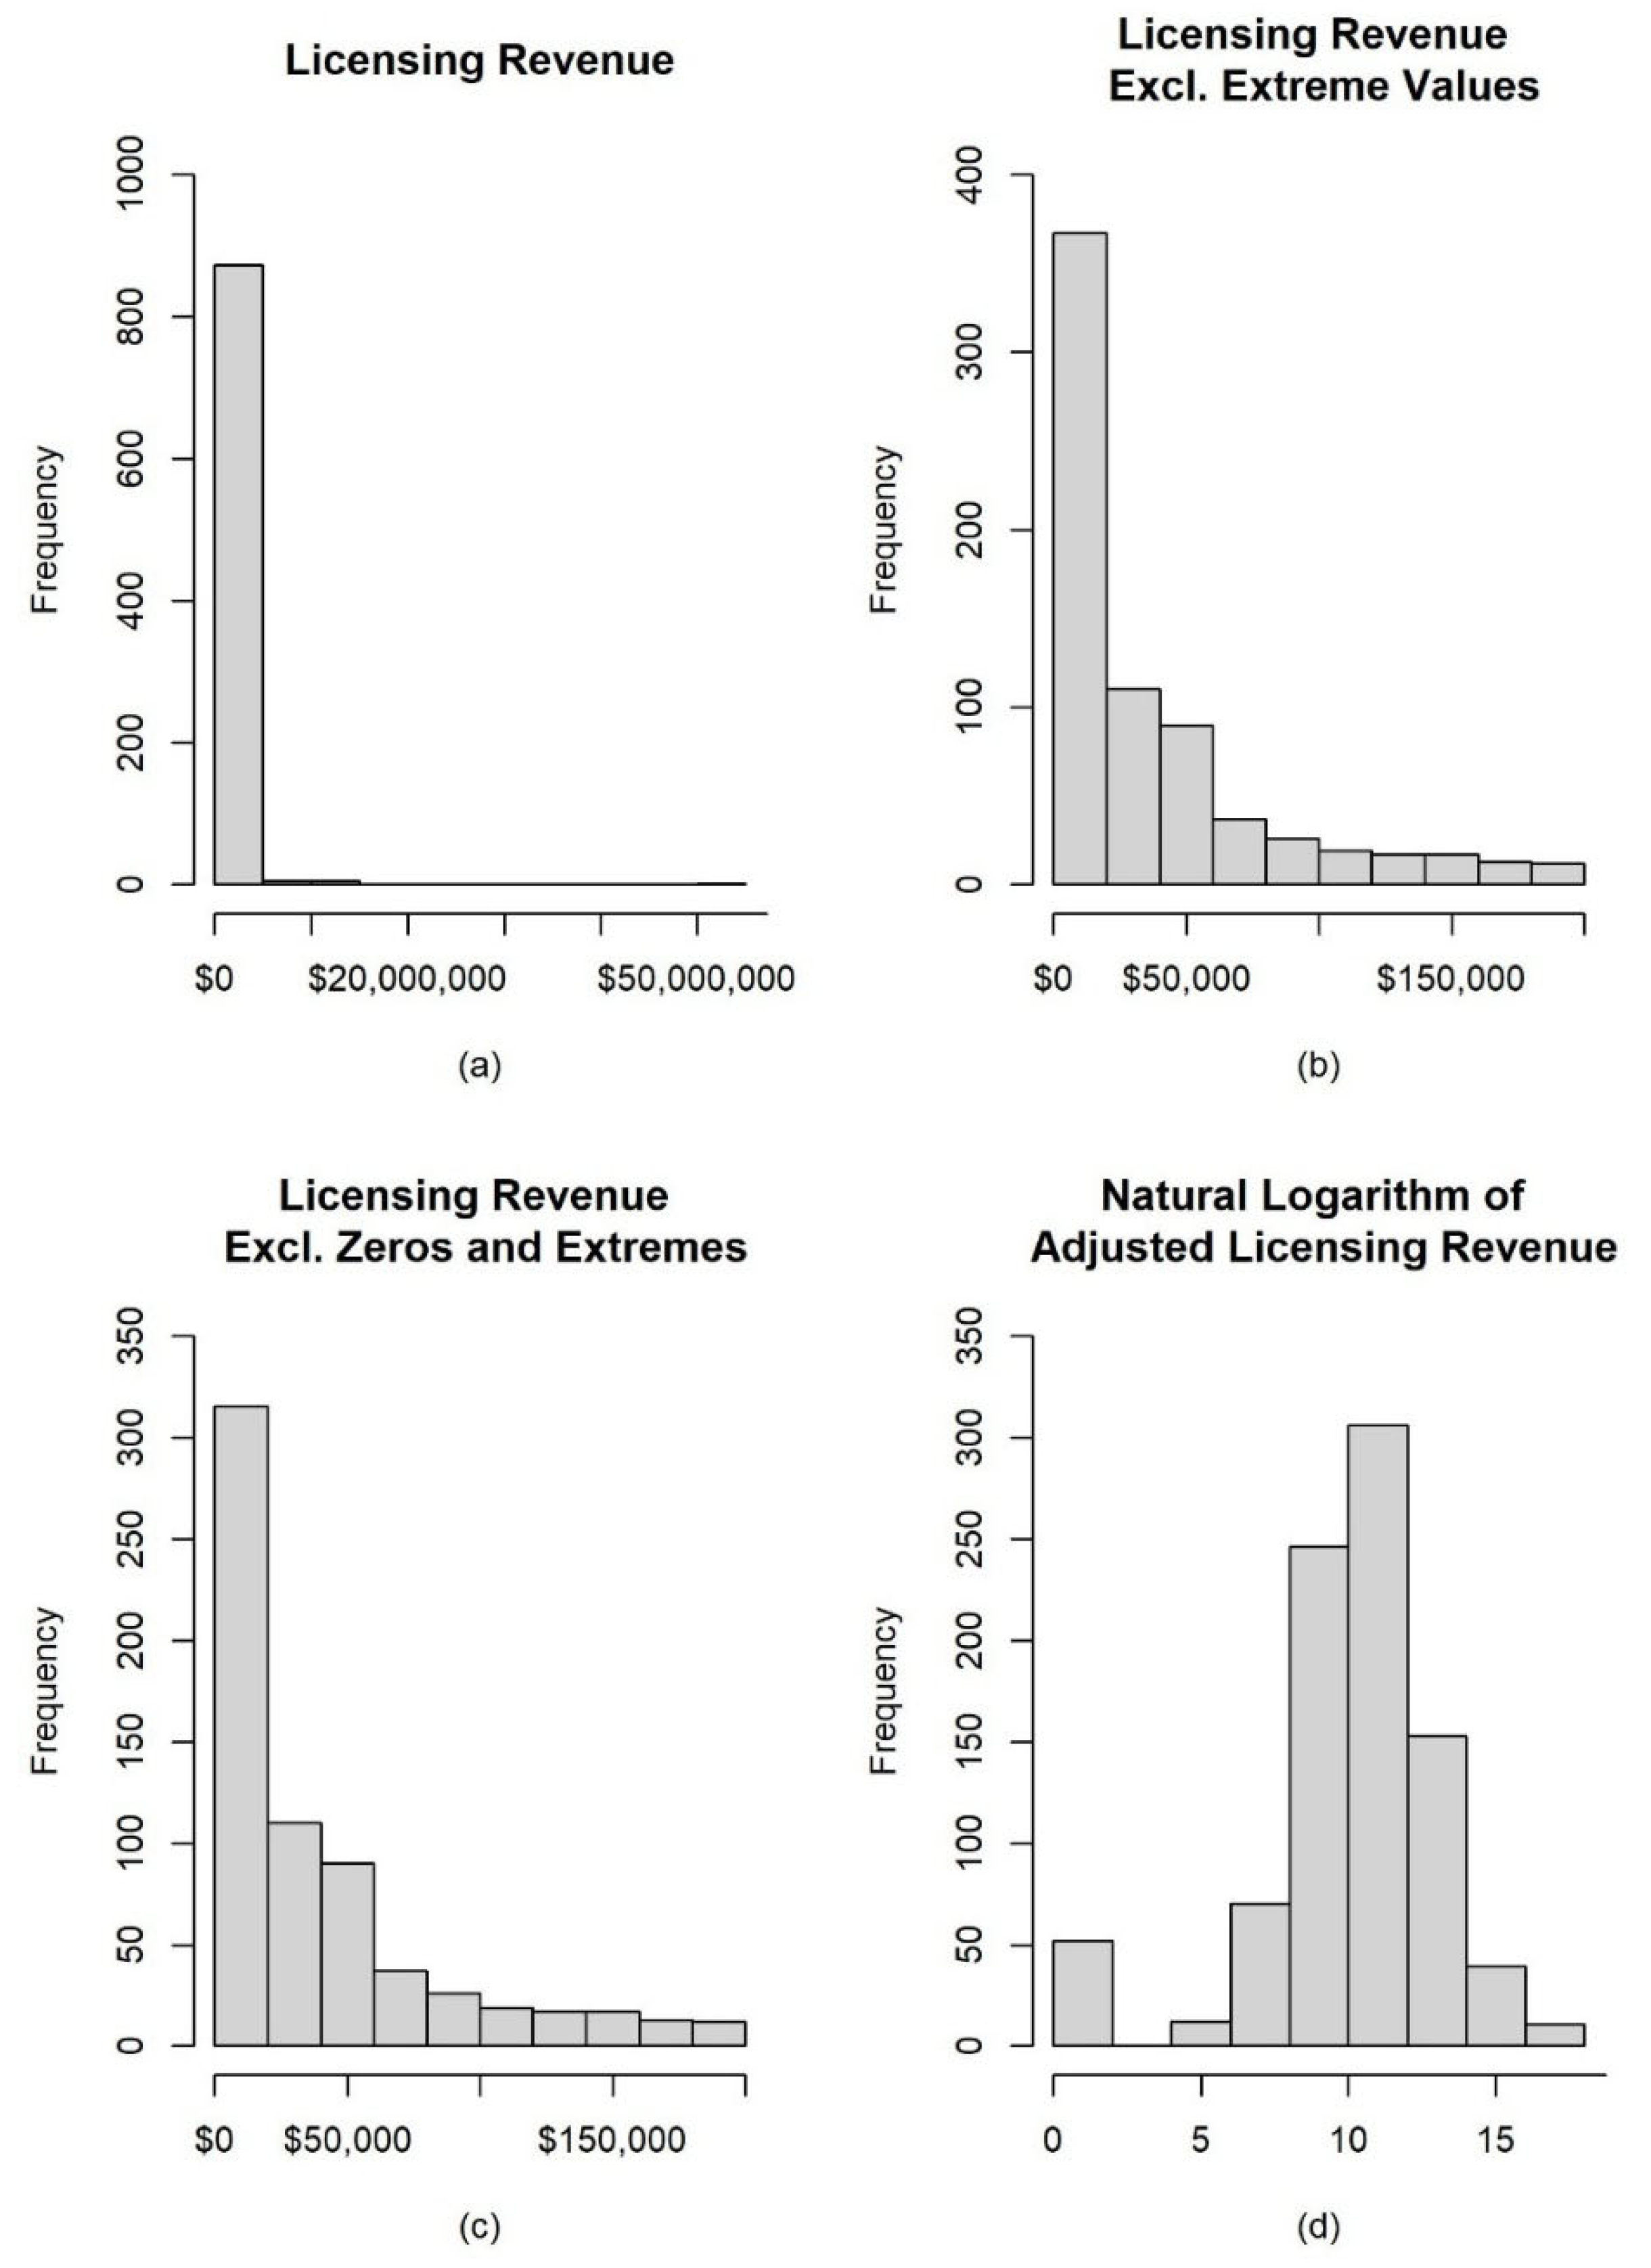
Figure 6.
Hierarchical Bayesian Models for MCMC Simulation of Licensing Revenue. Note. Figure created by author.
Figure 6.
Hierarchical Bayesian Models for MCMC Simulation of Licensing Revenue. Note. Figure created by author.
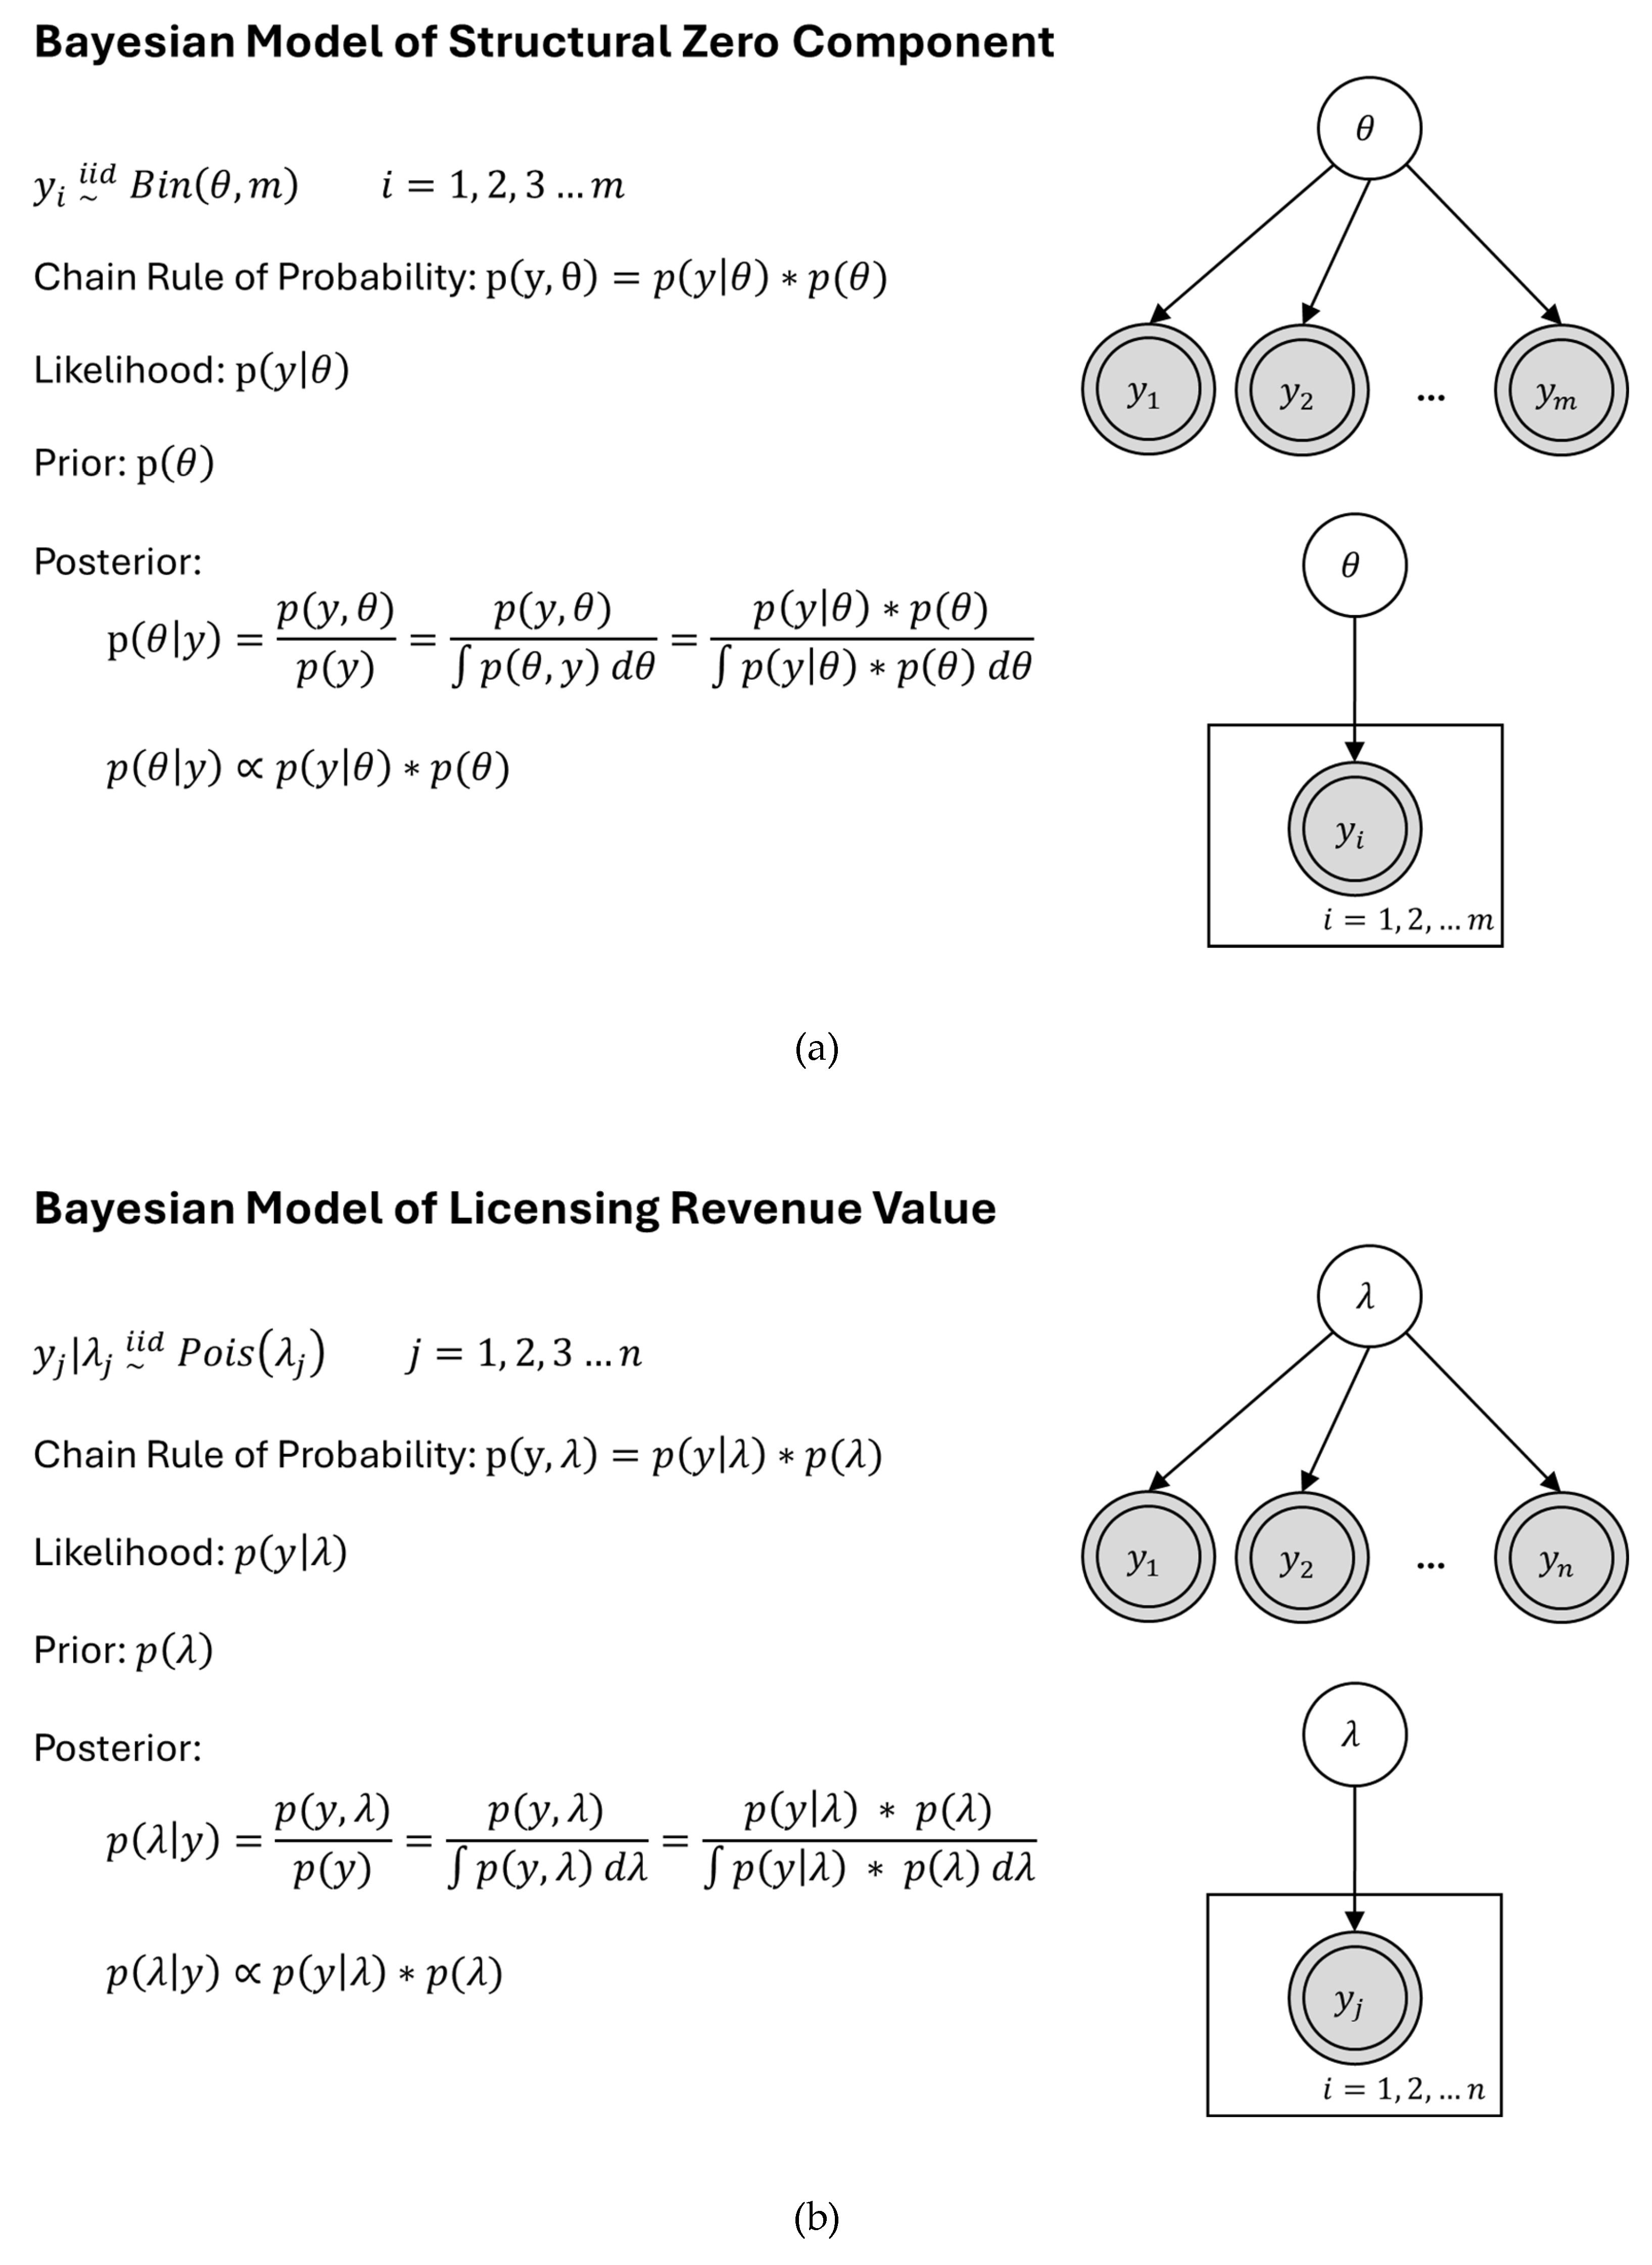
Figure 7.
Demand-Side Model Derived from the Human-Centered Framework. Note. Figure created by author.
Figure 7.
Demand-Side Model Derived from the Human-Centered Framework. Note. Figure created by author.
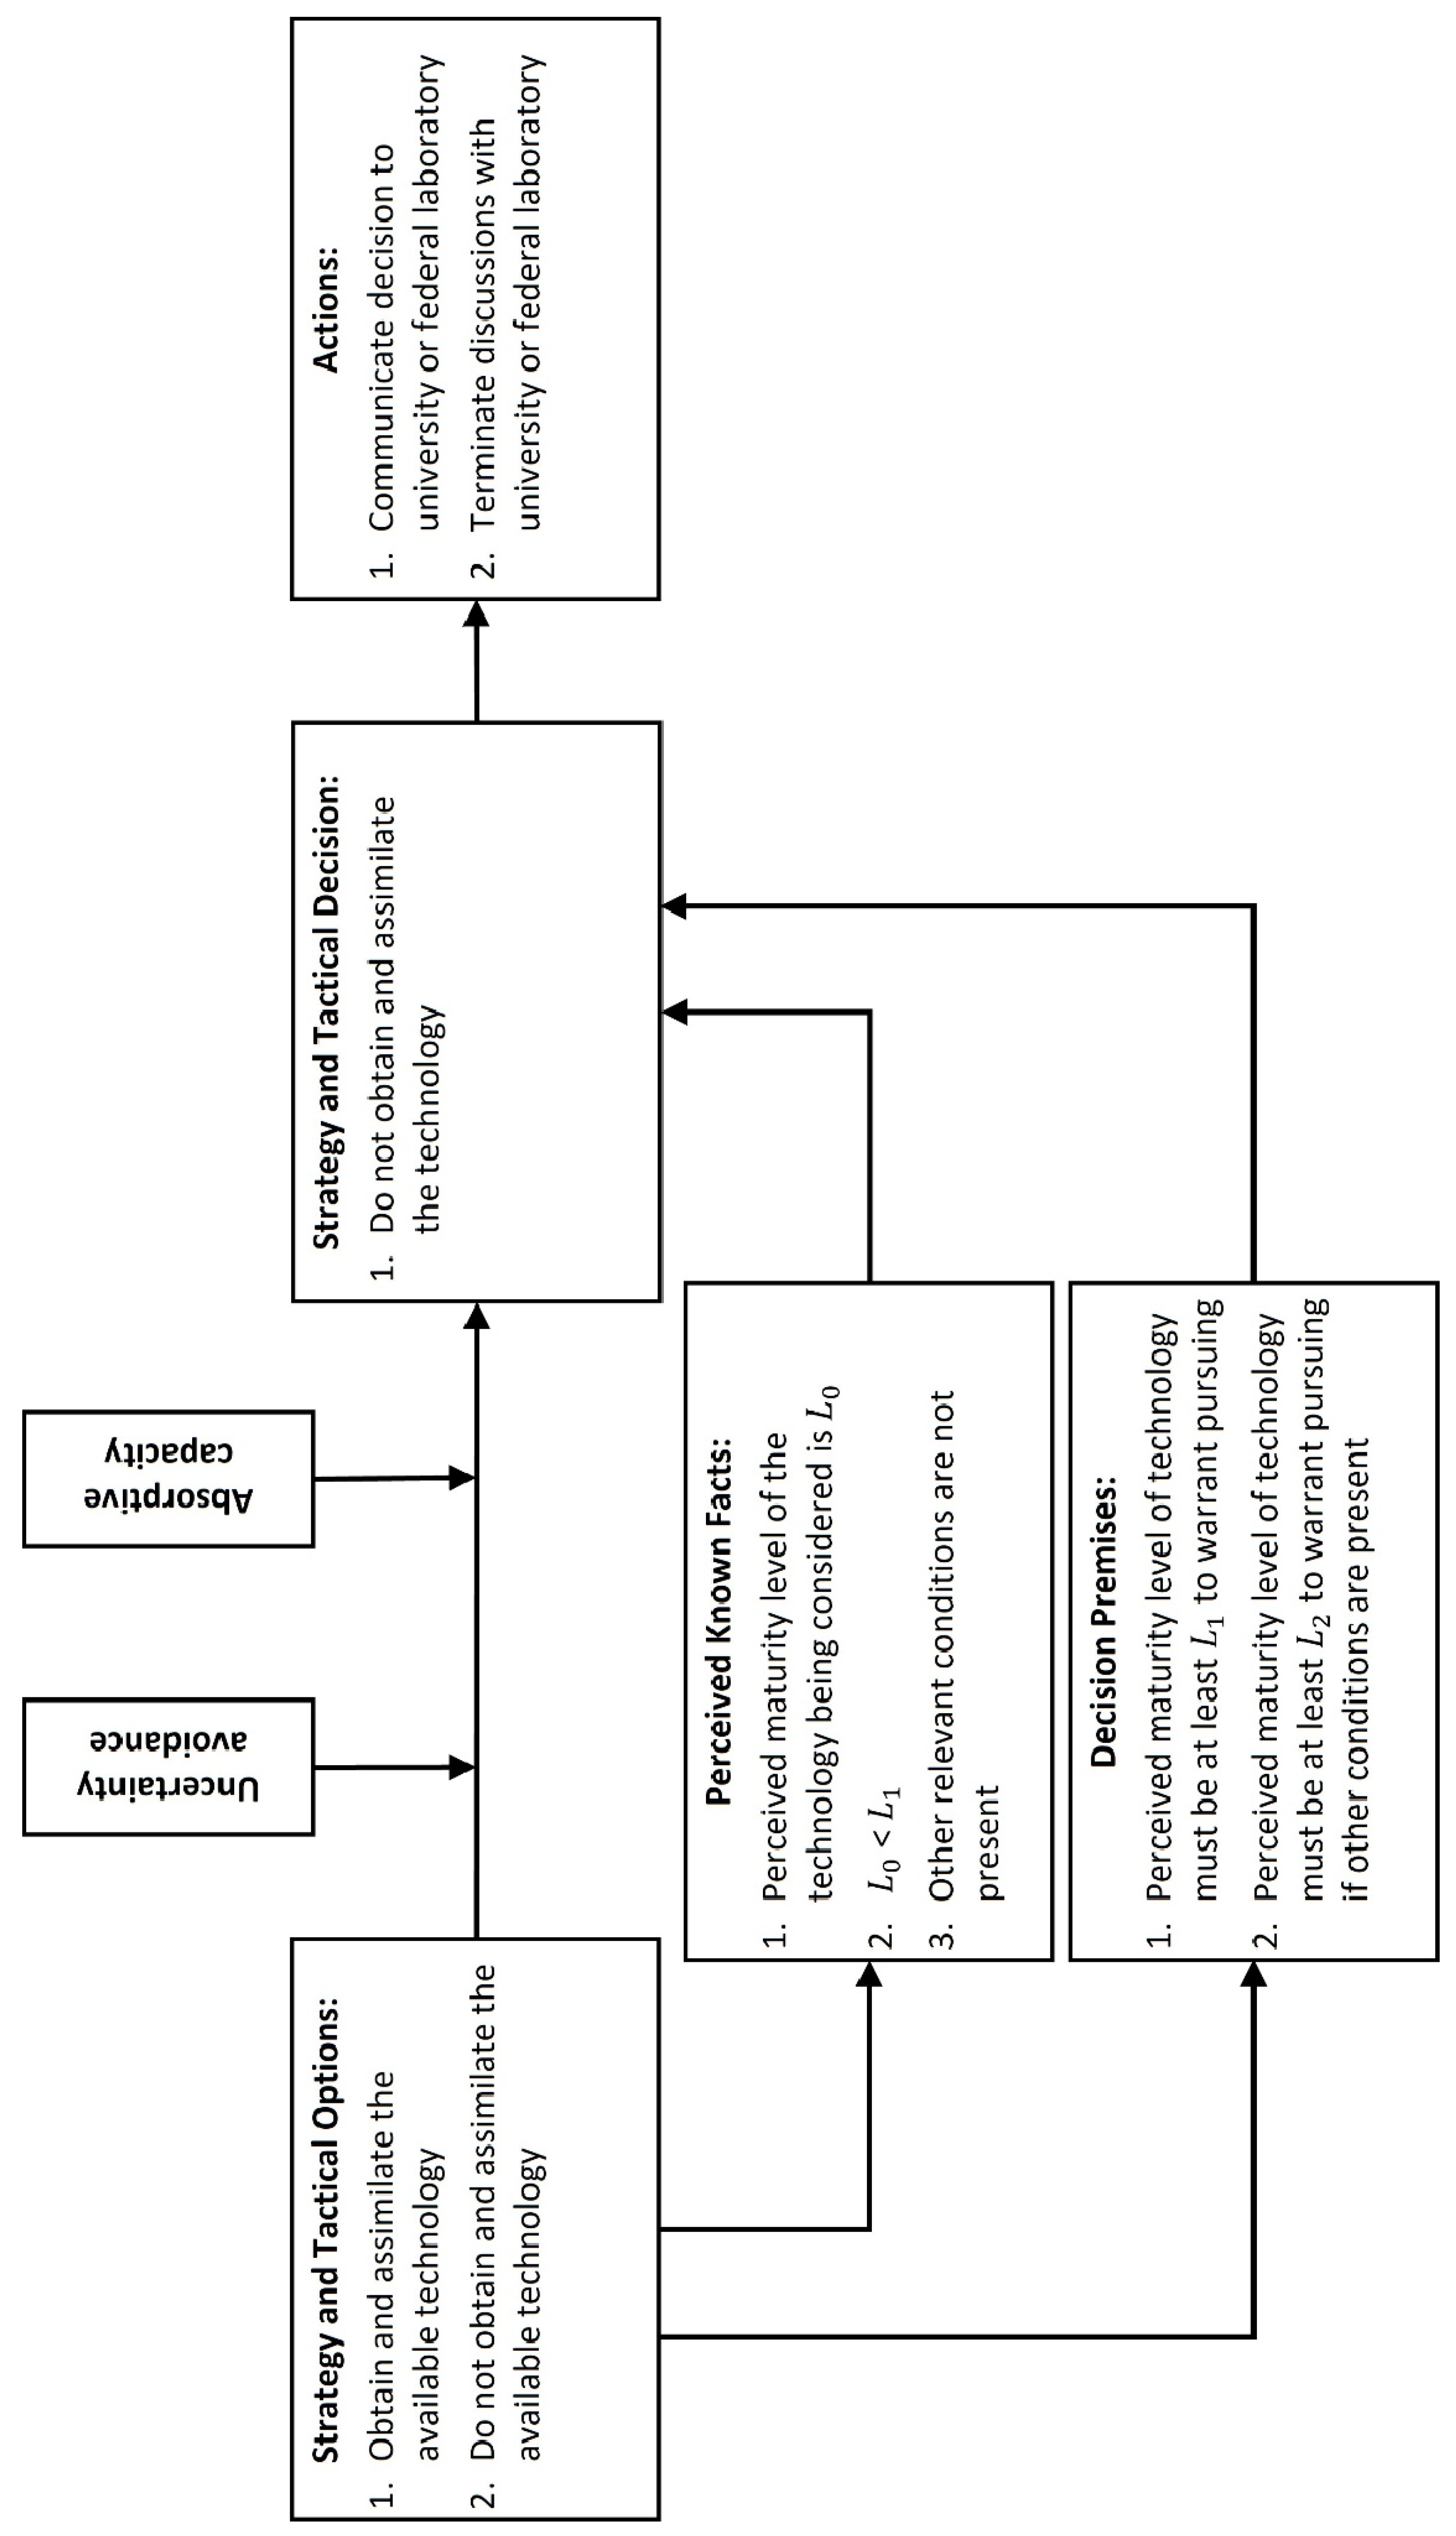
Figure 8.
Trace Plot of the Chains for Simulation 1. Note. Chart produced by R package.
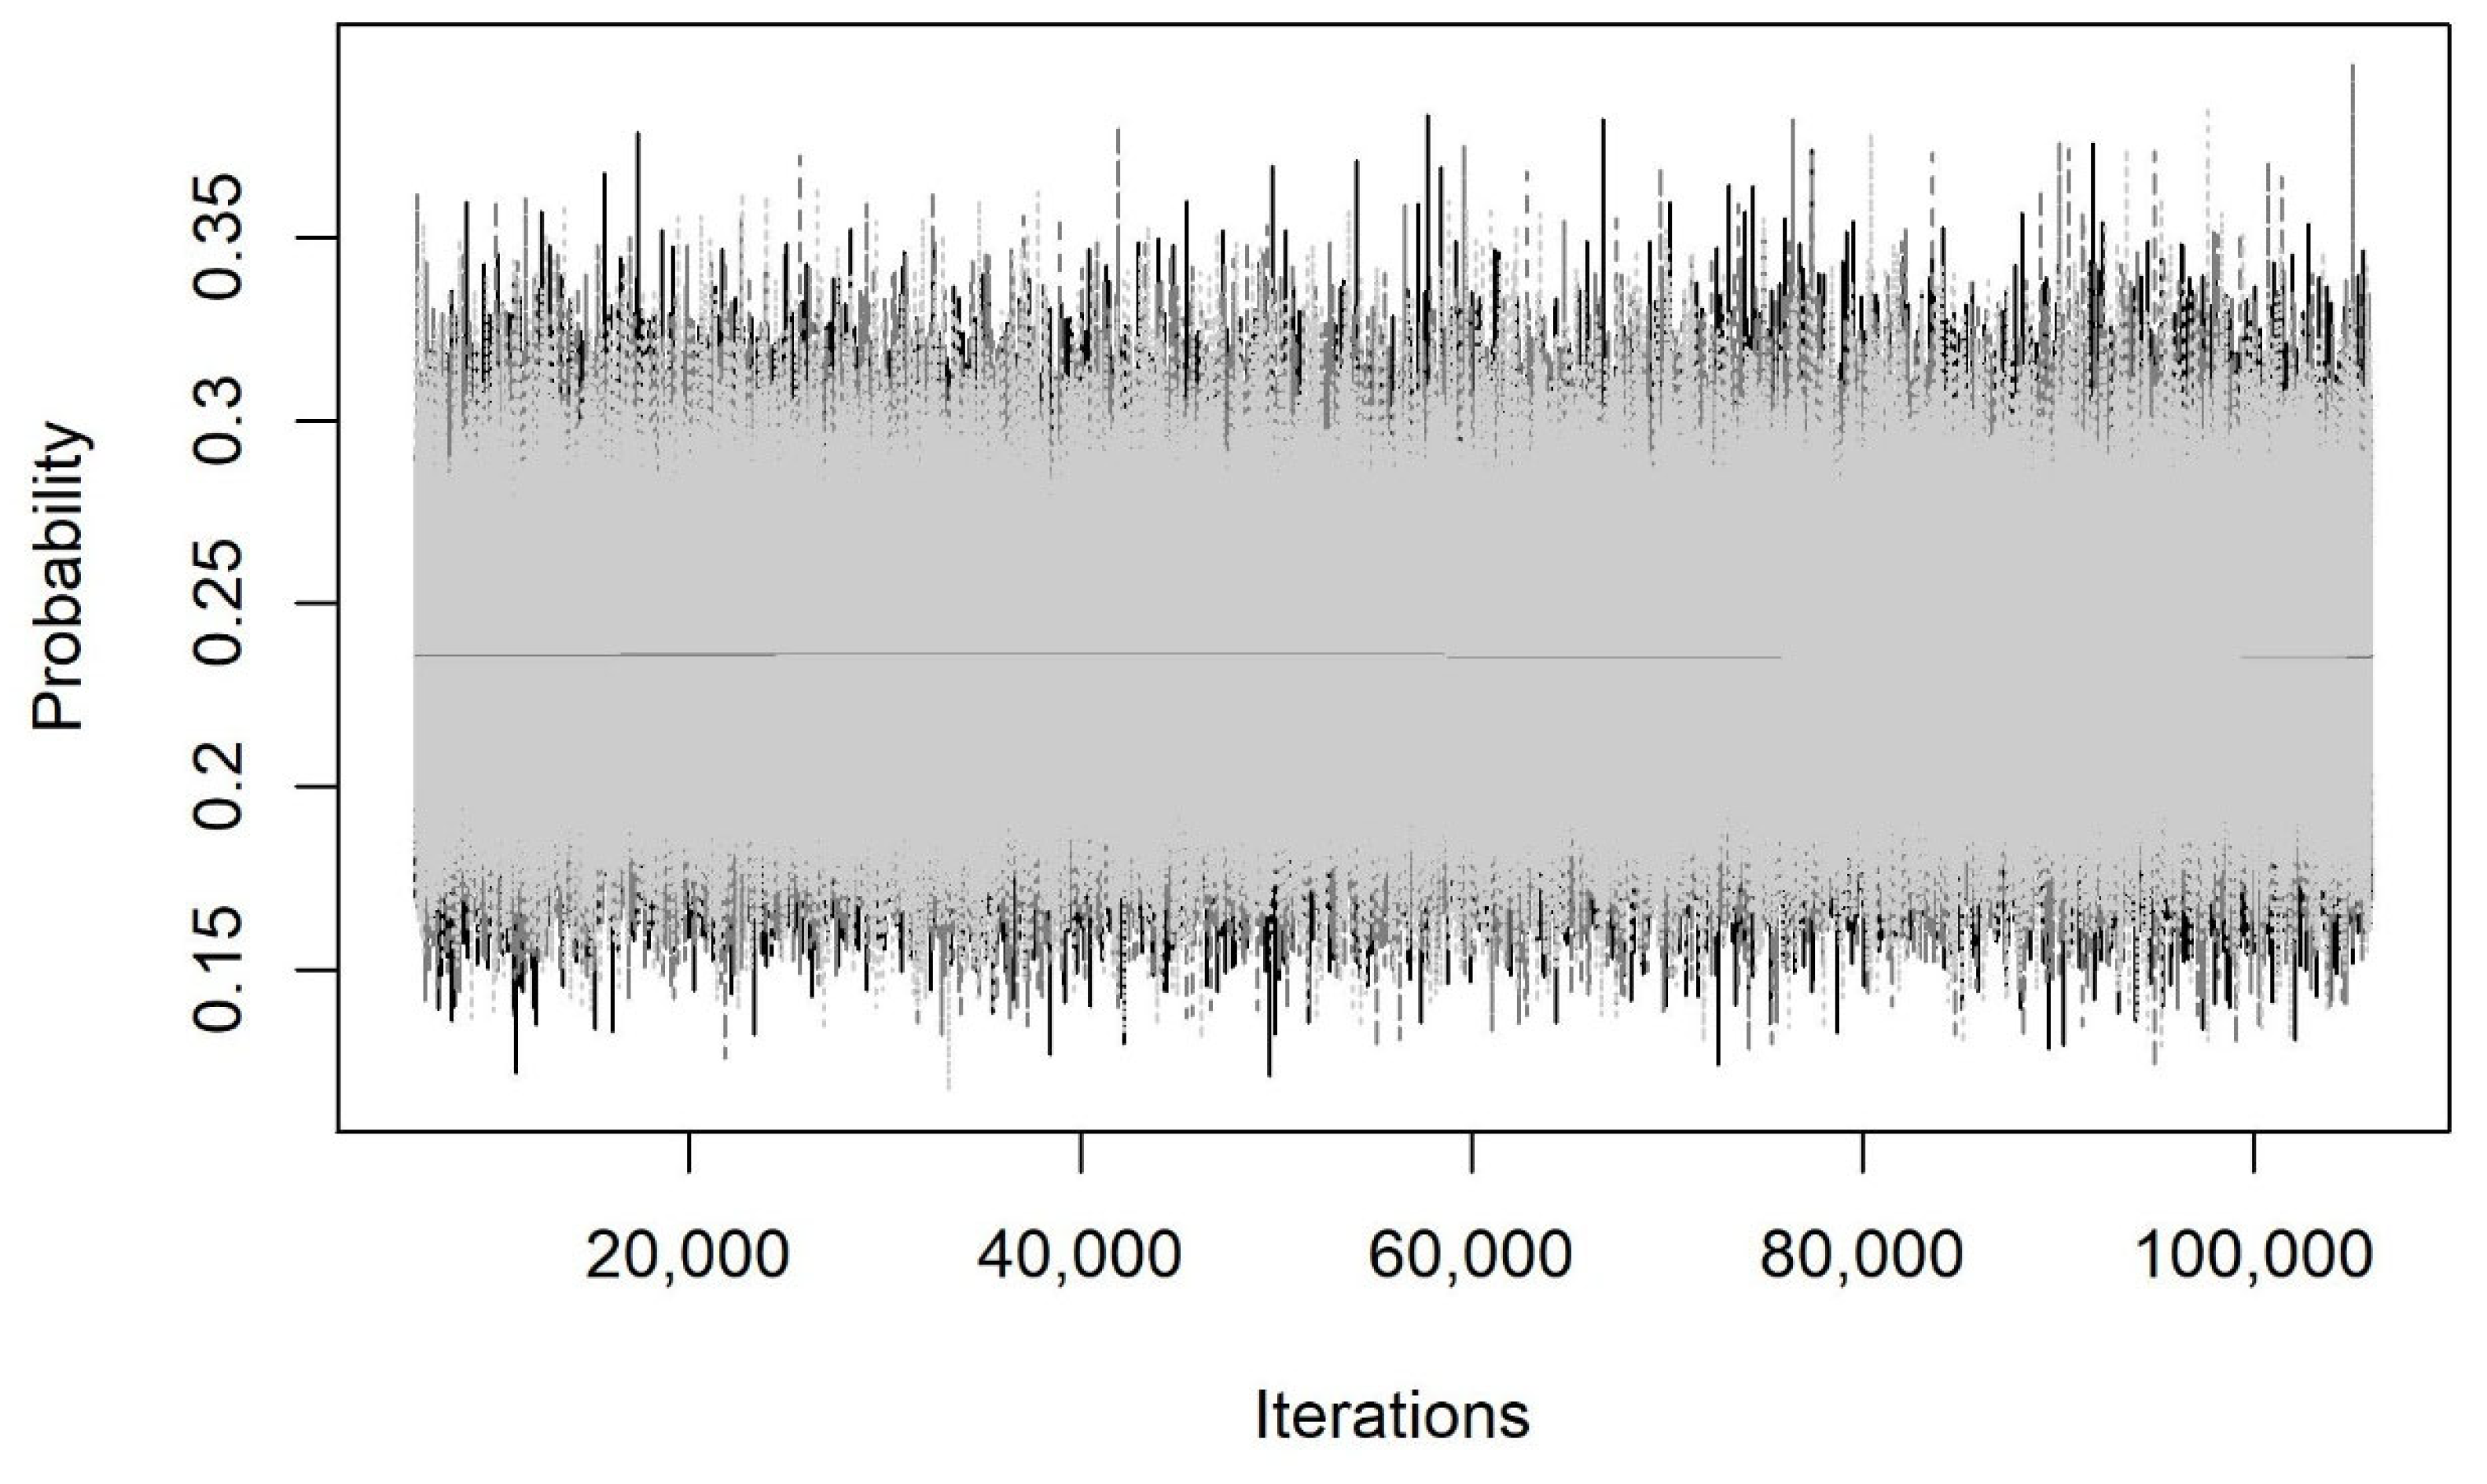
Figure 9.
Density Plot of the Parameter for Simulation 1. Note: Figure created by R package.

Figure 10.
Trace Plot for Simulation 2. Note. Chart produced by R package.
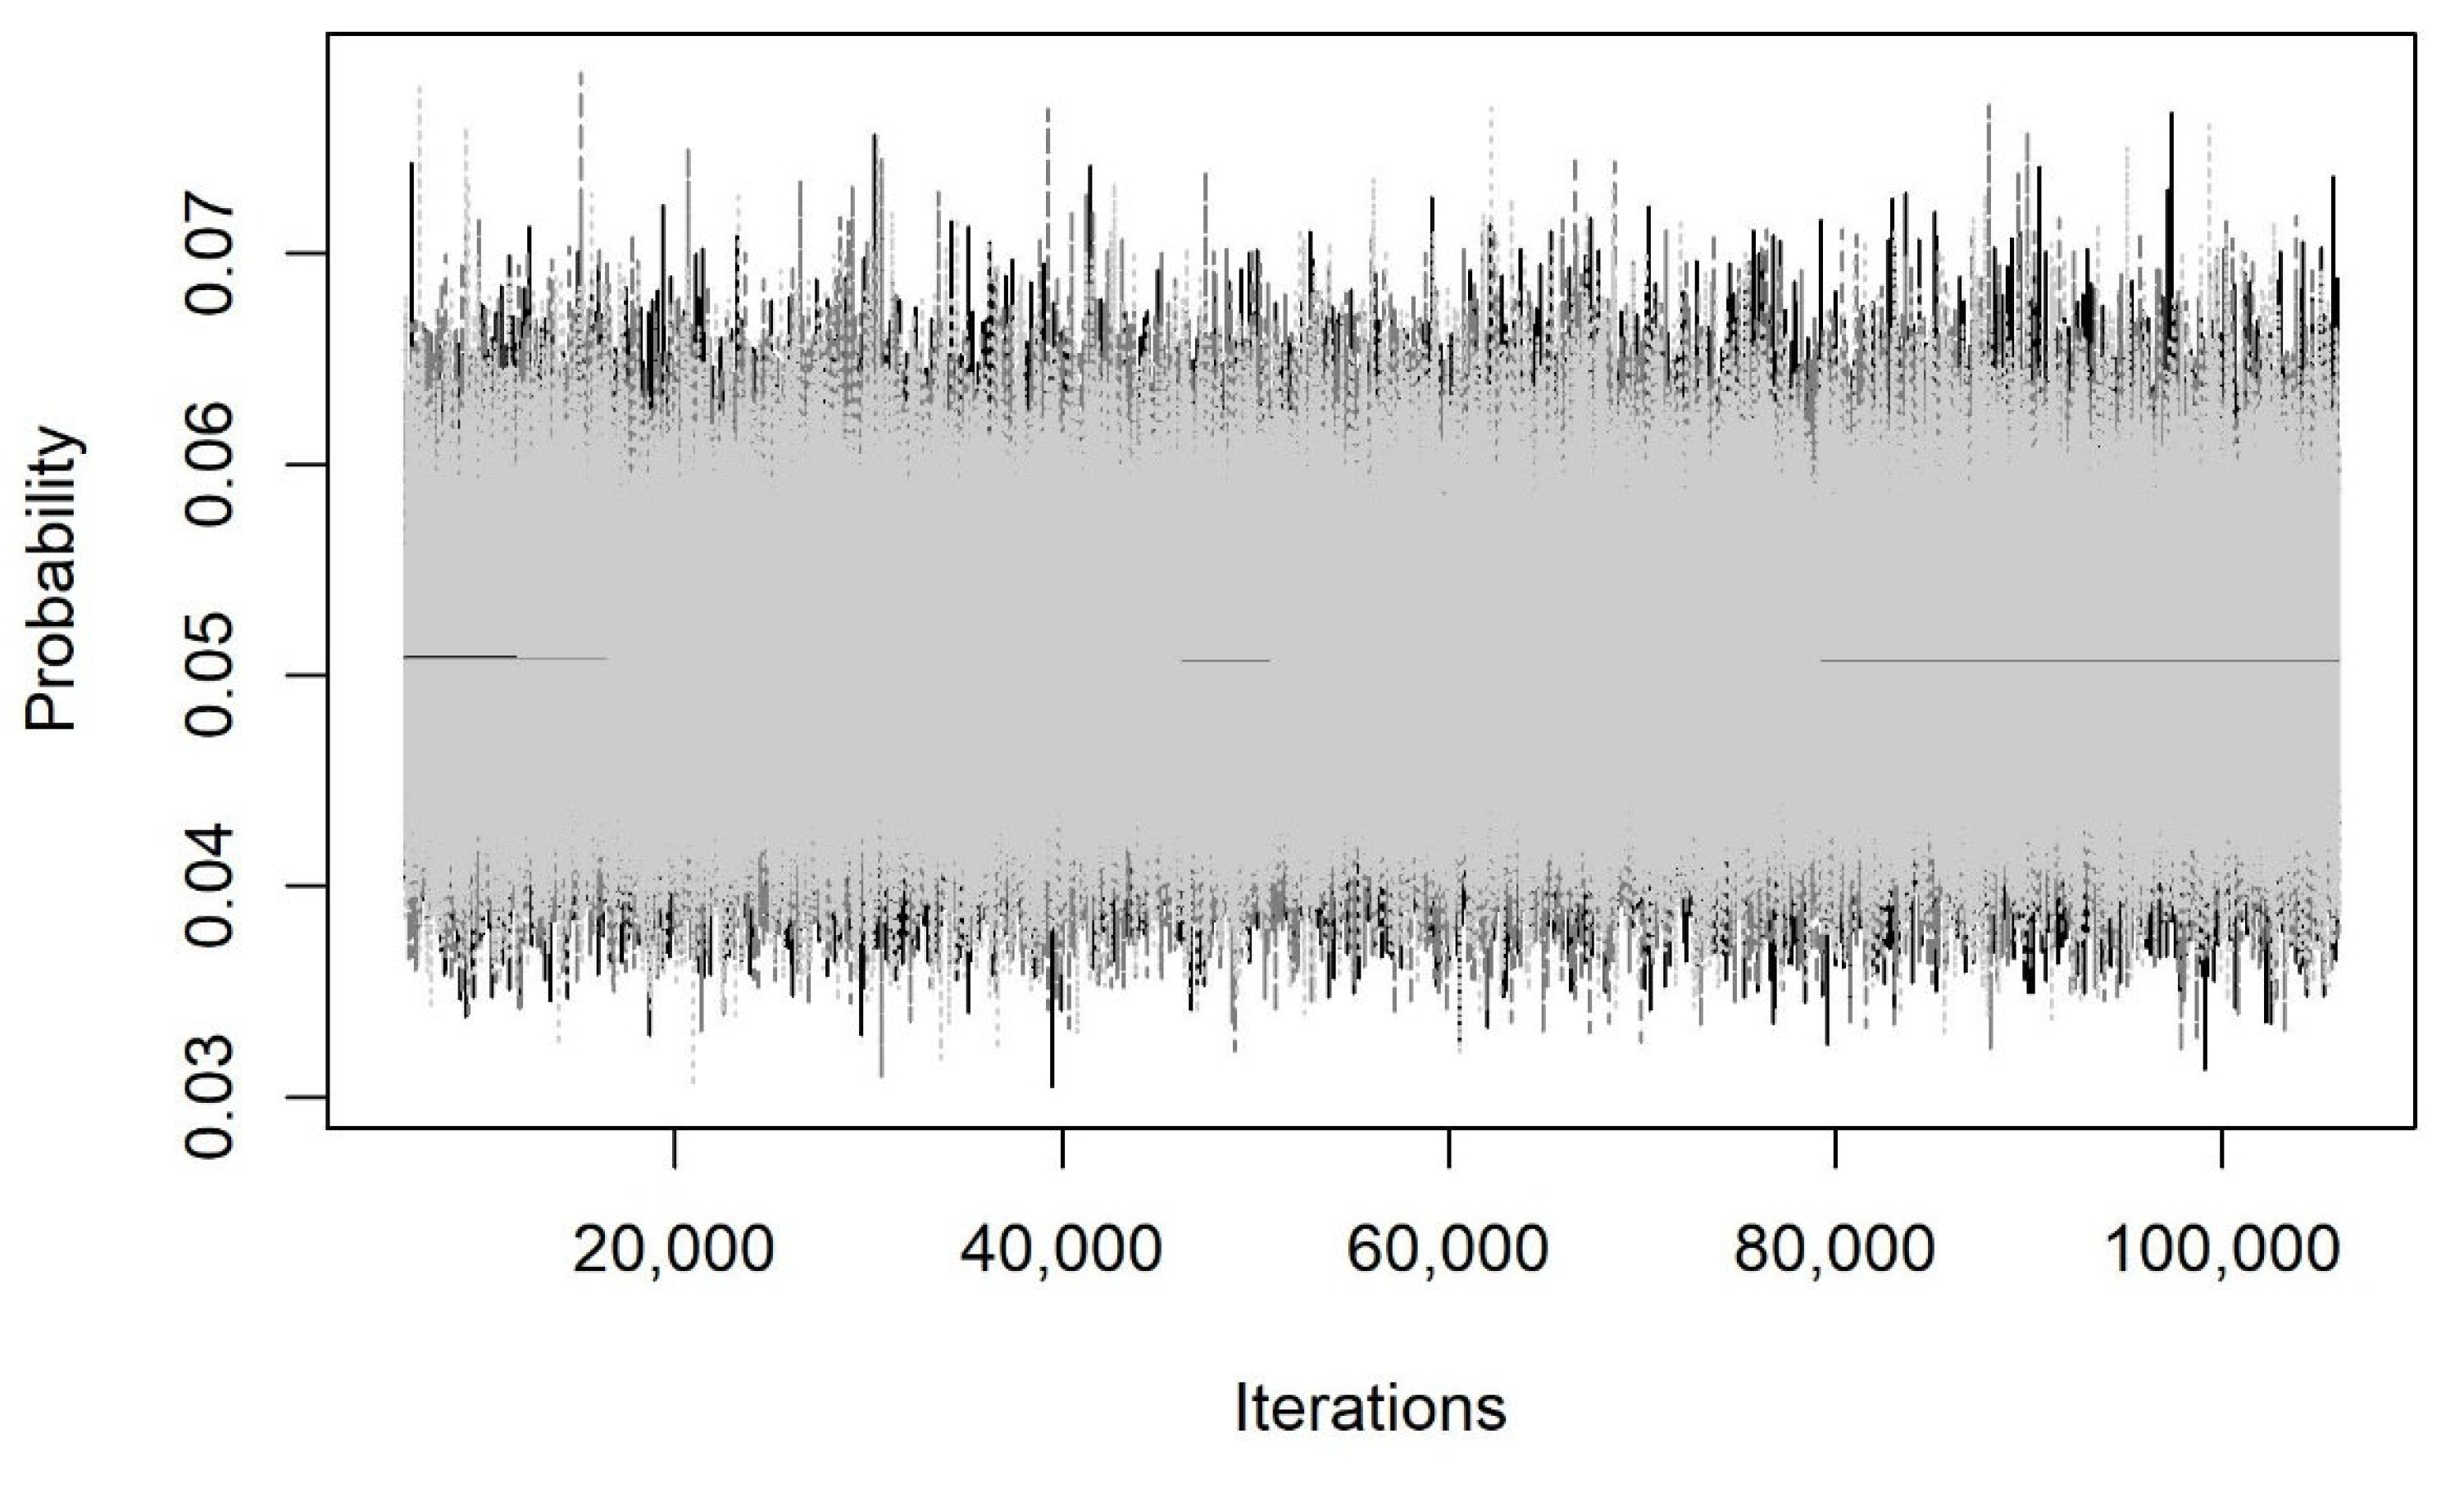
Figure 11.
Density Plot of the Parameter for Simulation 2. Note: Figure created by R package.
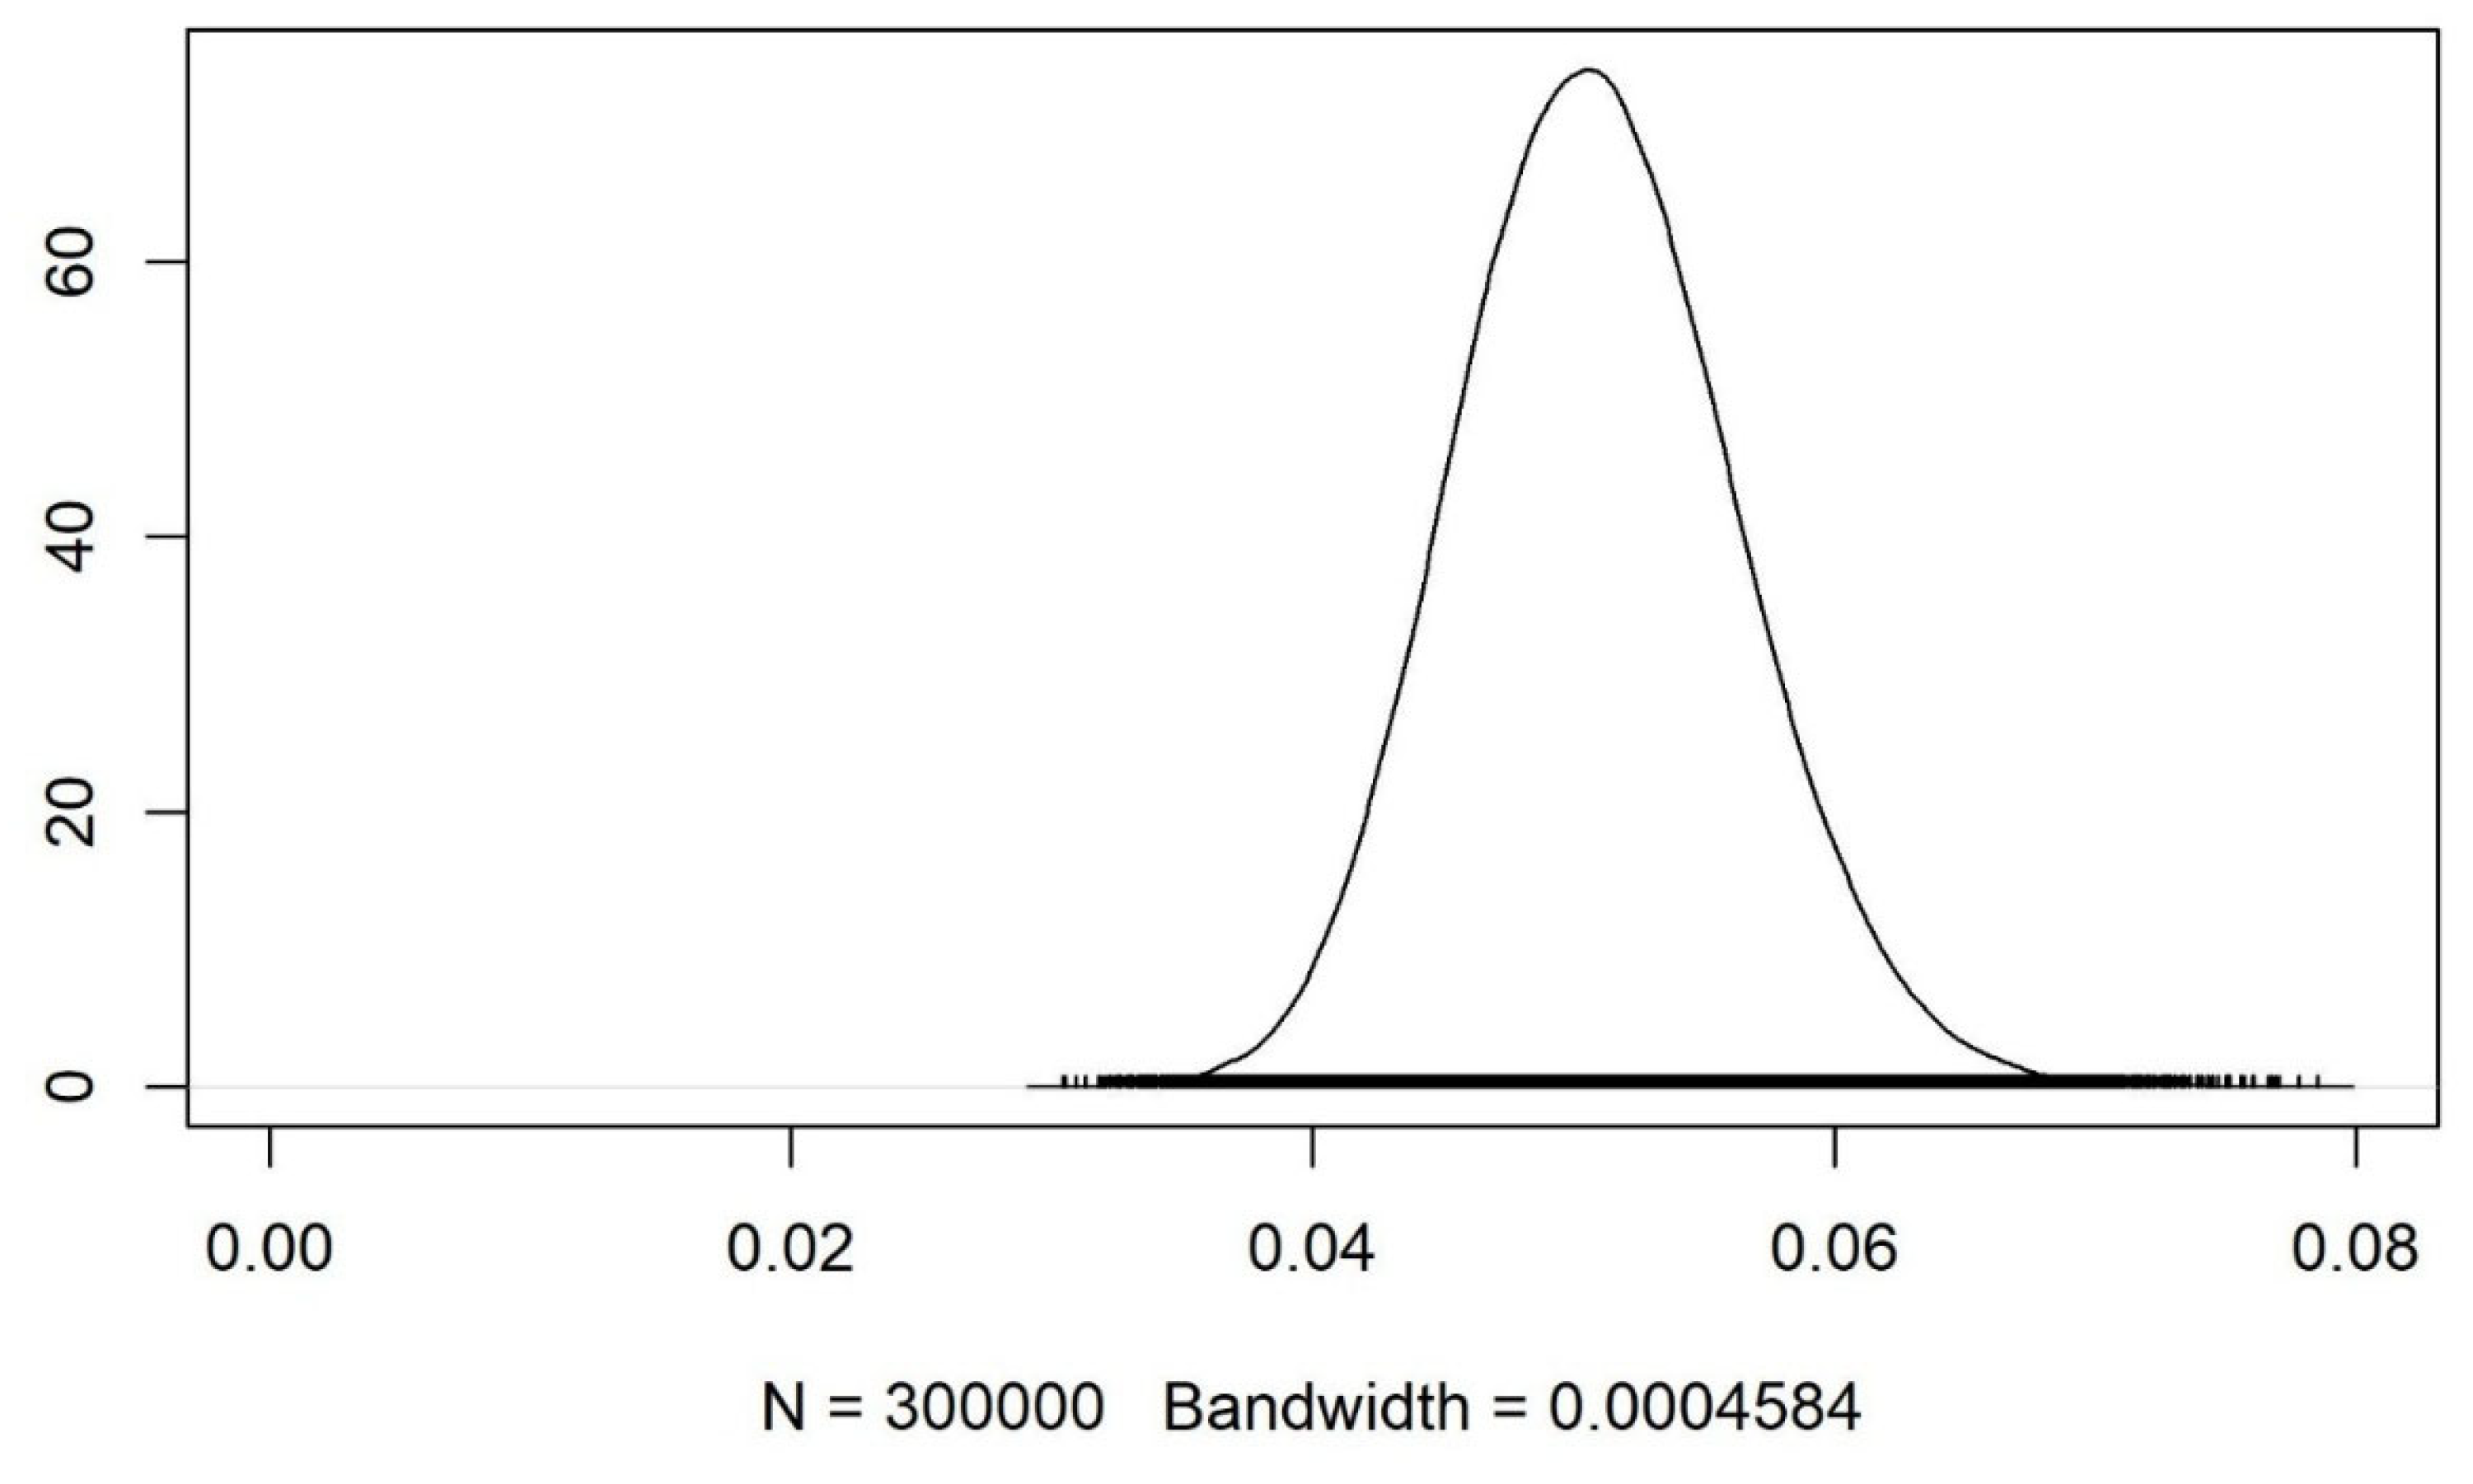
Figure 12.
Trace Plots for the Parameters in Simulation 3. Note. Figure created by R package.
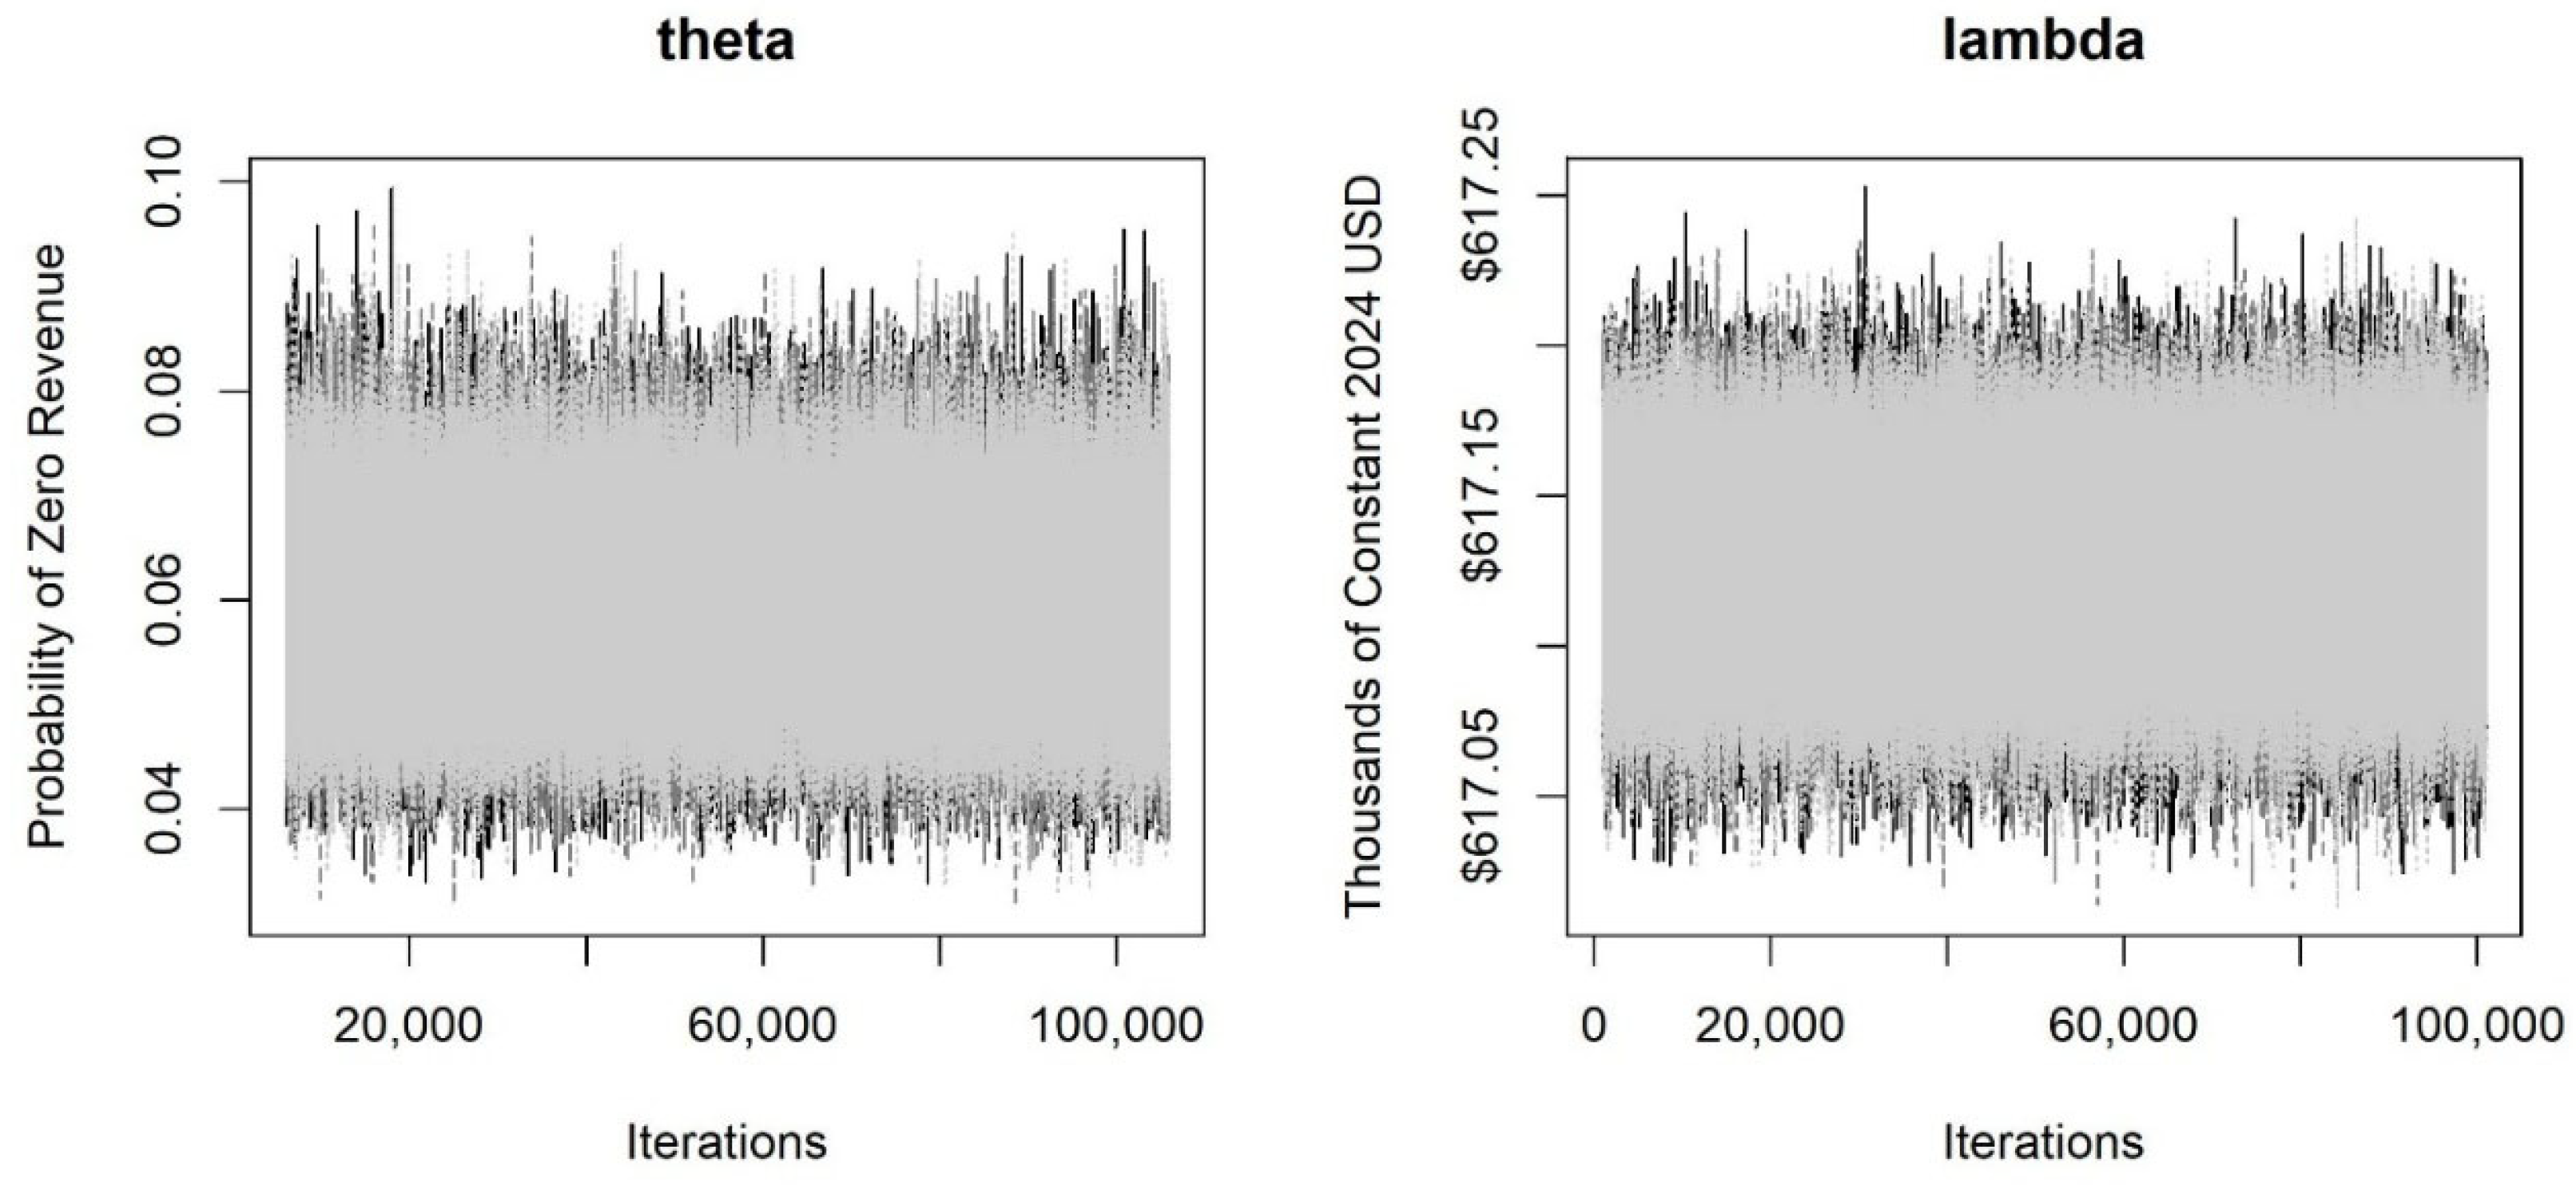
Figure 13.
Density Plots for the Parameters in Simulation 3. Note. Figure created by R package.
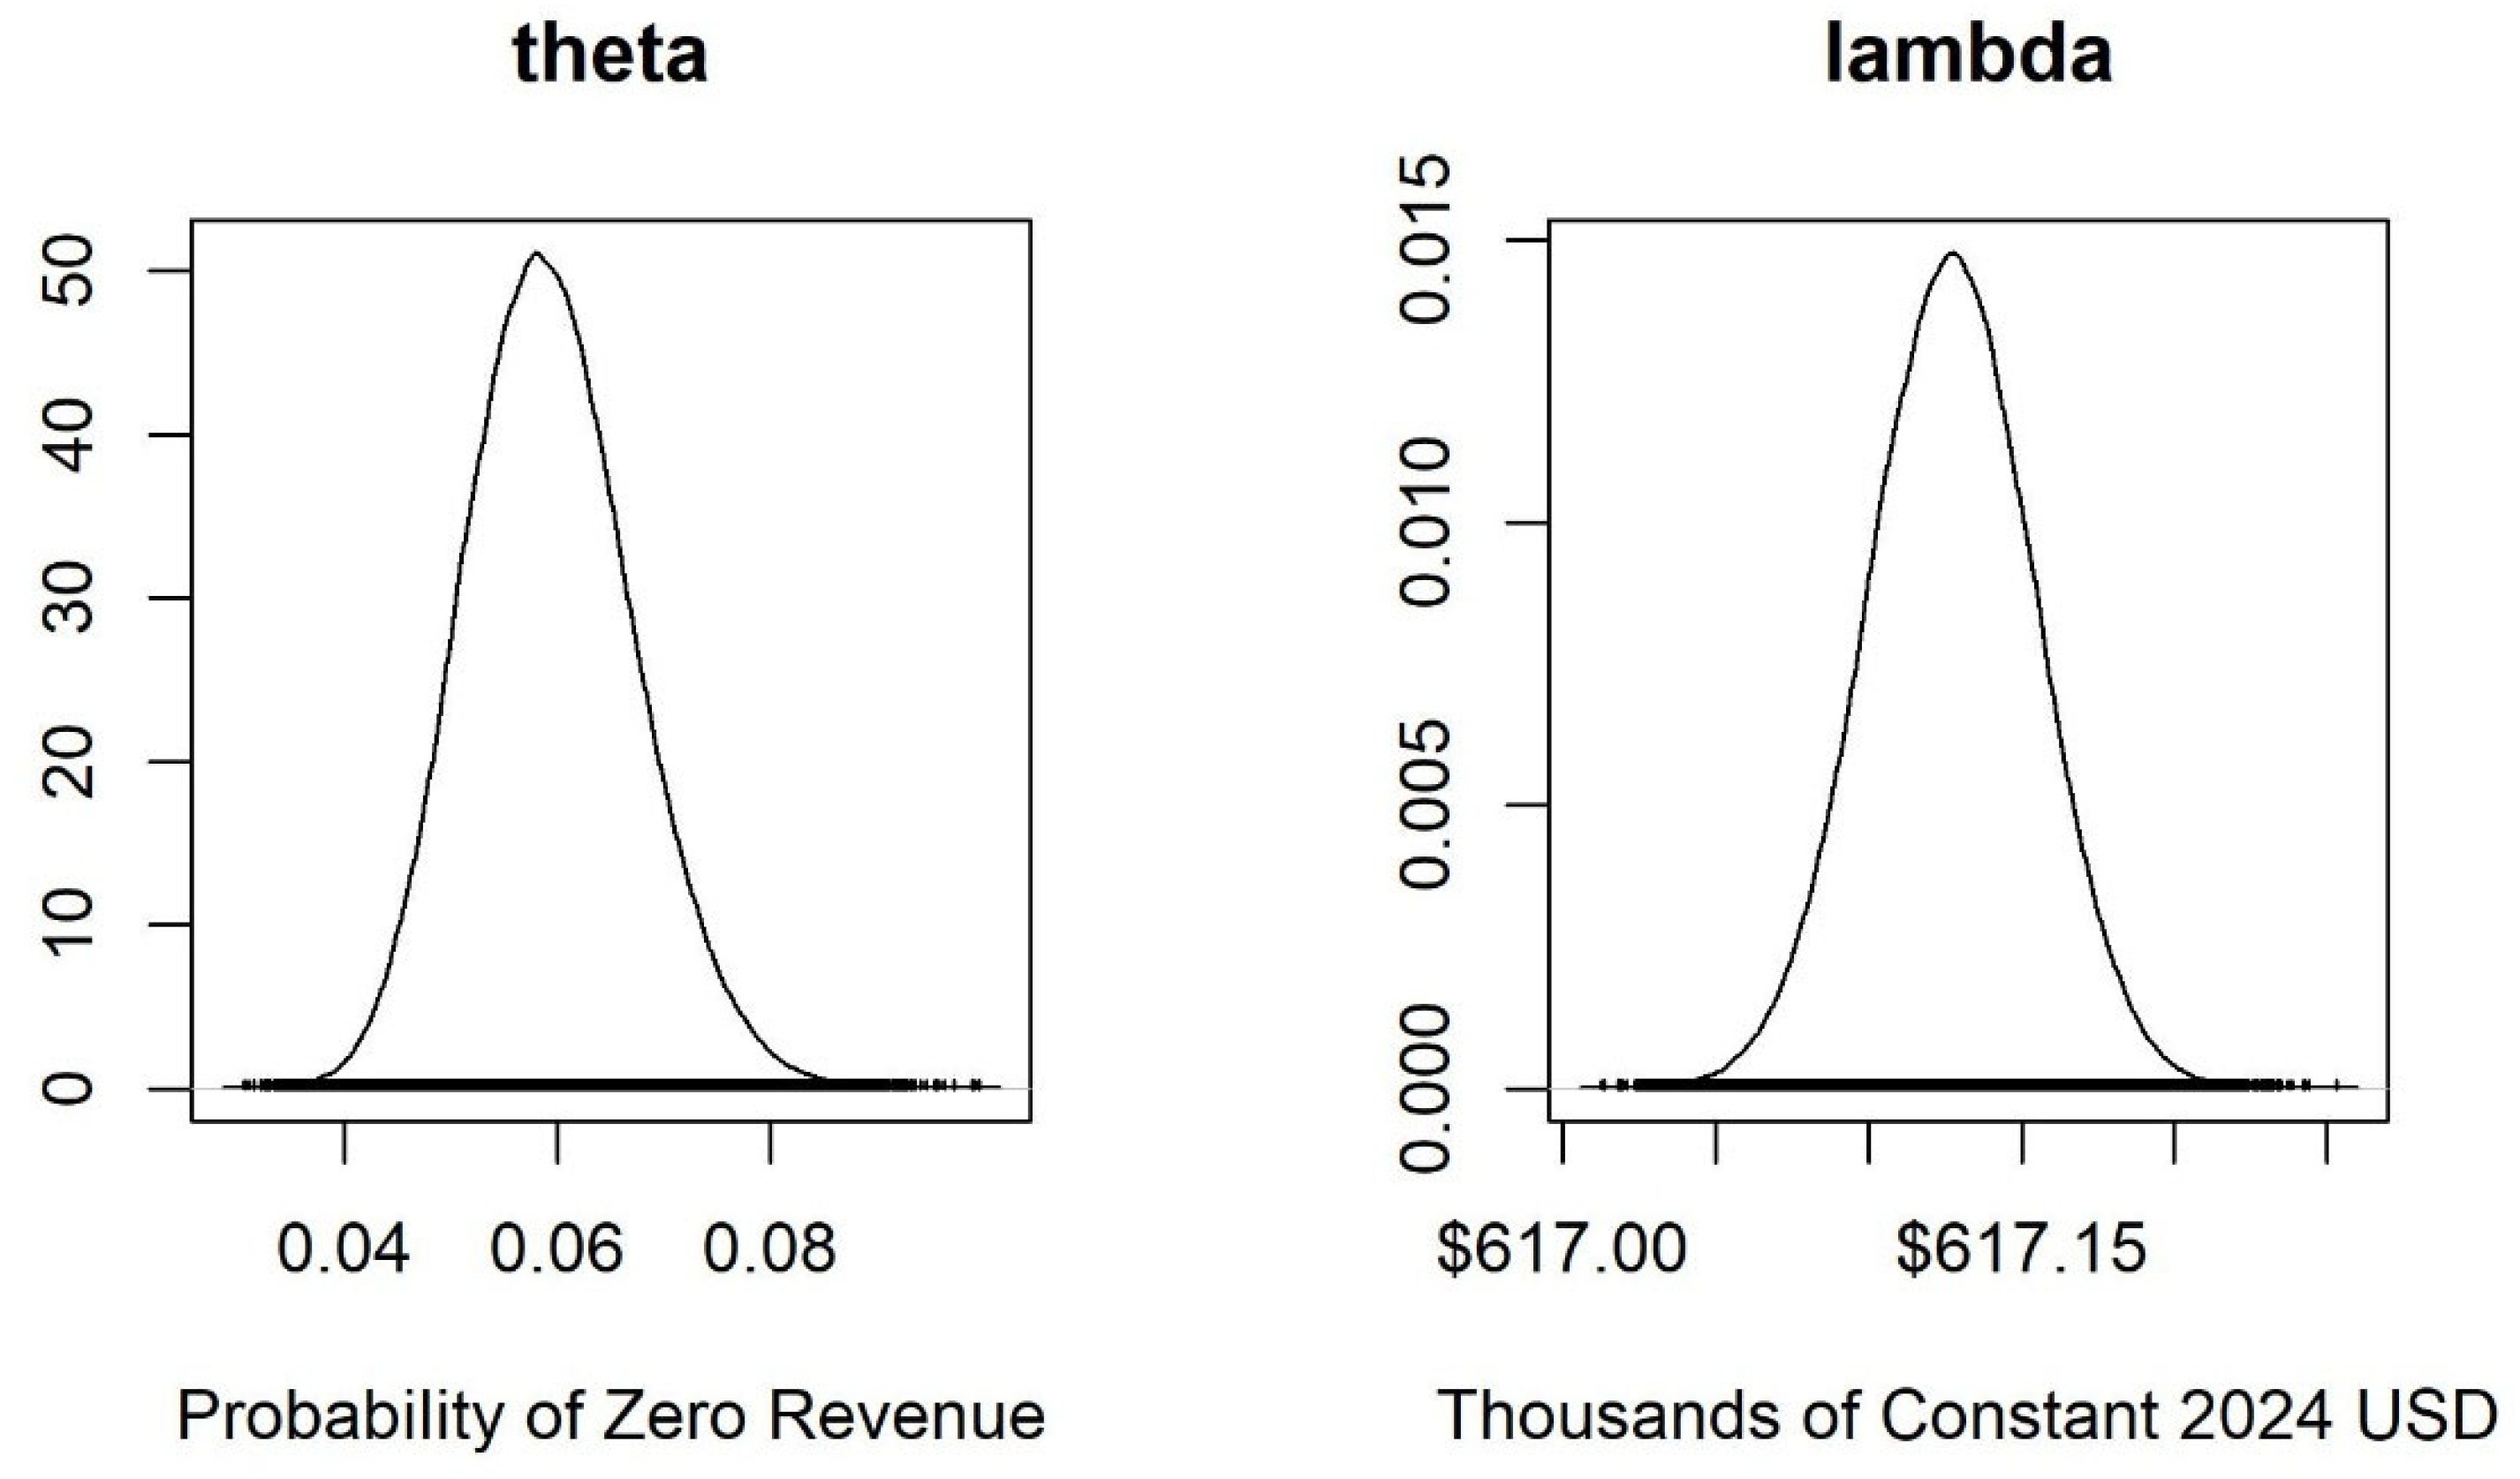
Figure 14.
Potential Increase in Licensed Technologies from Increasing Maturity Levels, FY 2015-2019. Note: Figure created by author. Data sources: AUTMN, 2024; National Institute of Standards and Technology, 2022; Schacht, 2006. Inventions licensed during the period were assumed to be inventions for which patents applications were submitted during the period. The number of estimated maturity-related opportunities is based on the expected value (i.e., mean value) of the Simulation 2 theta parameter.
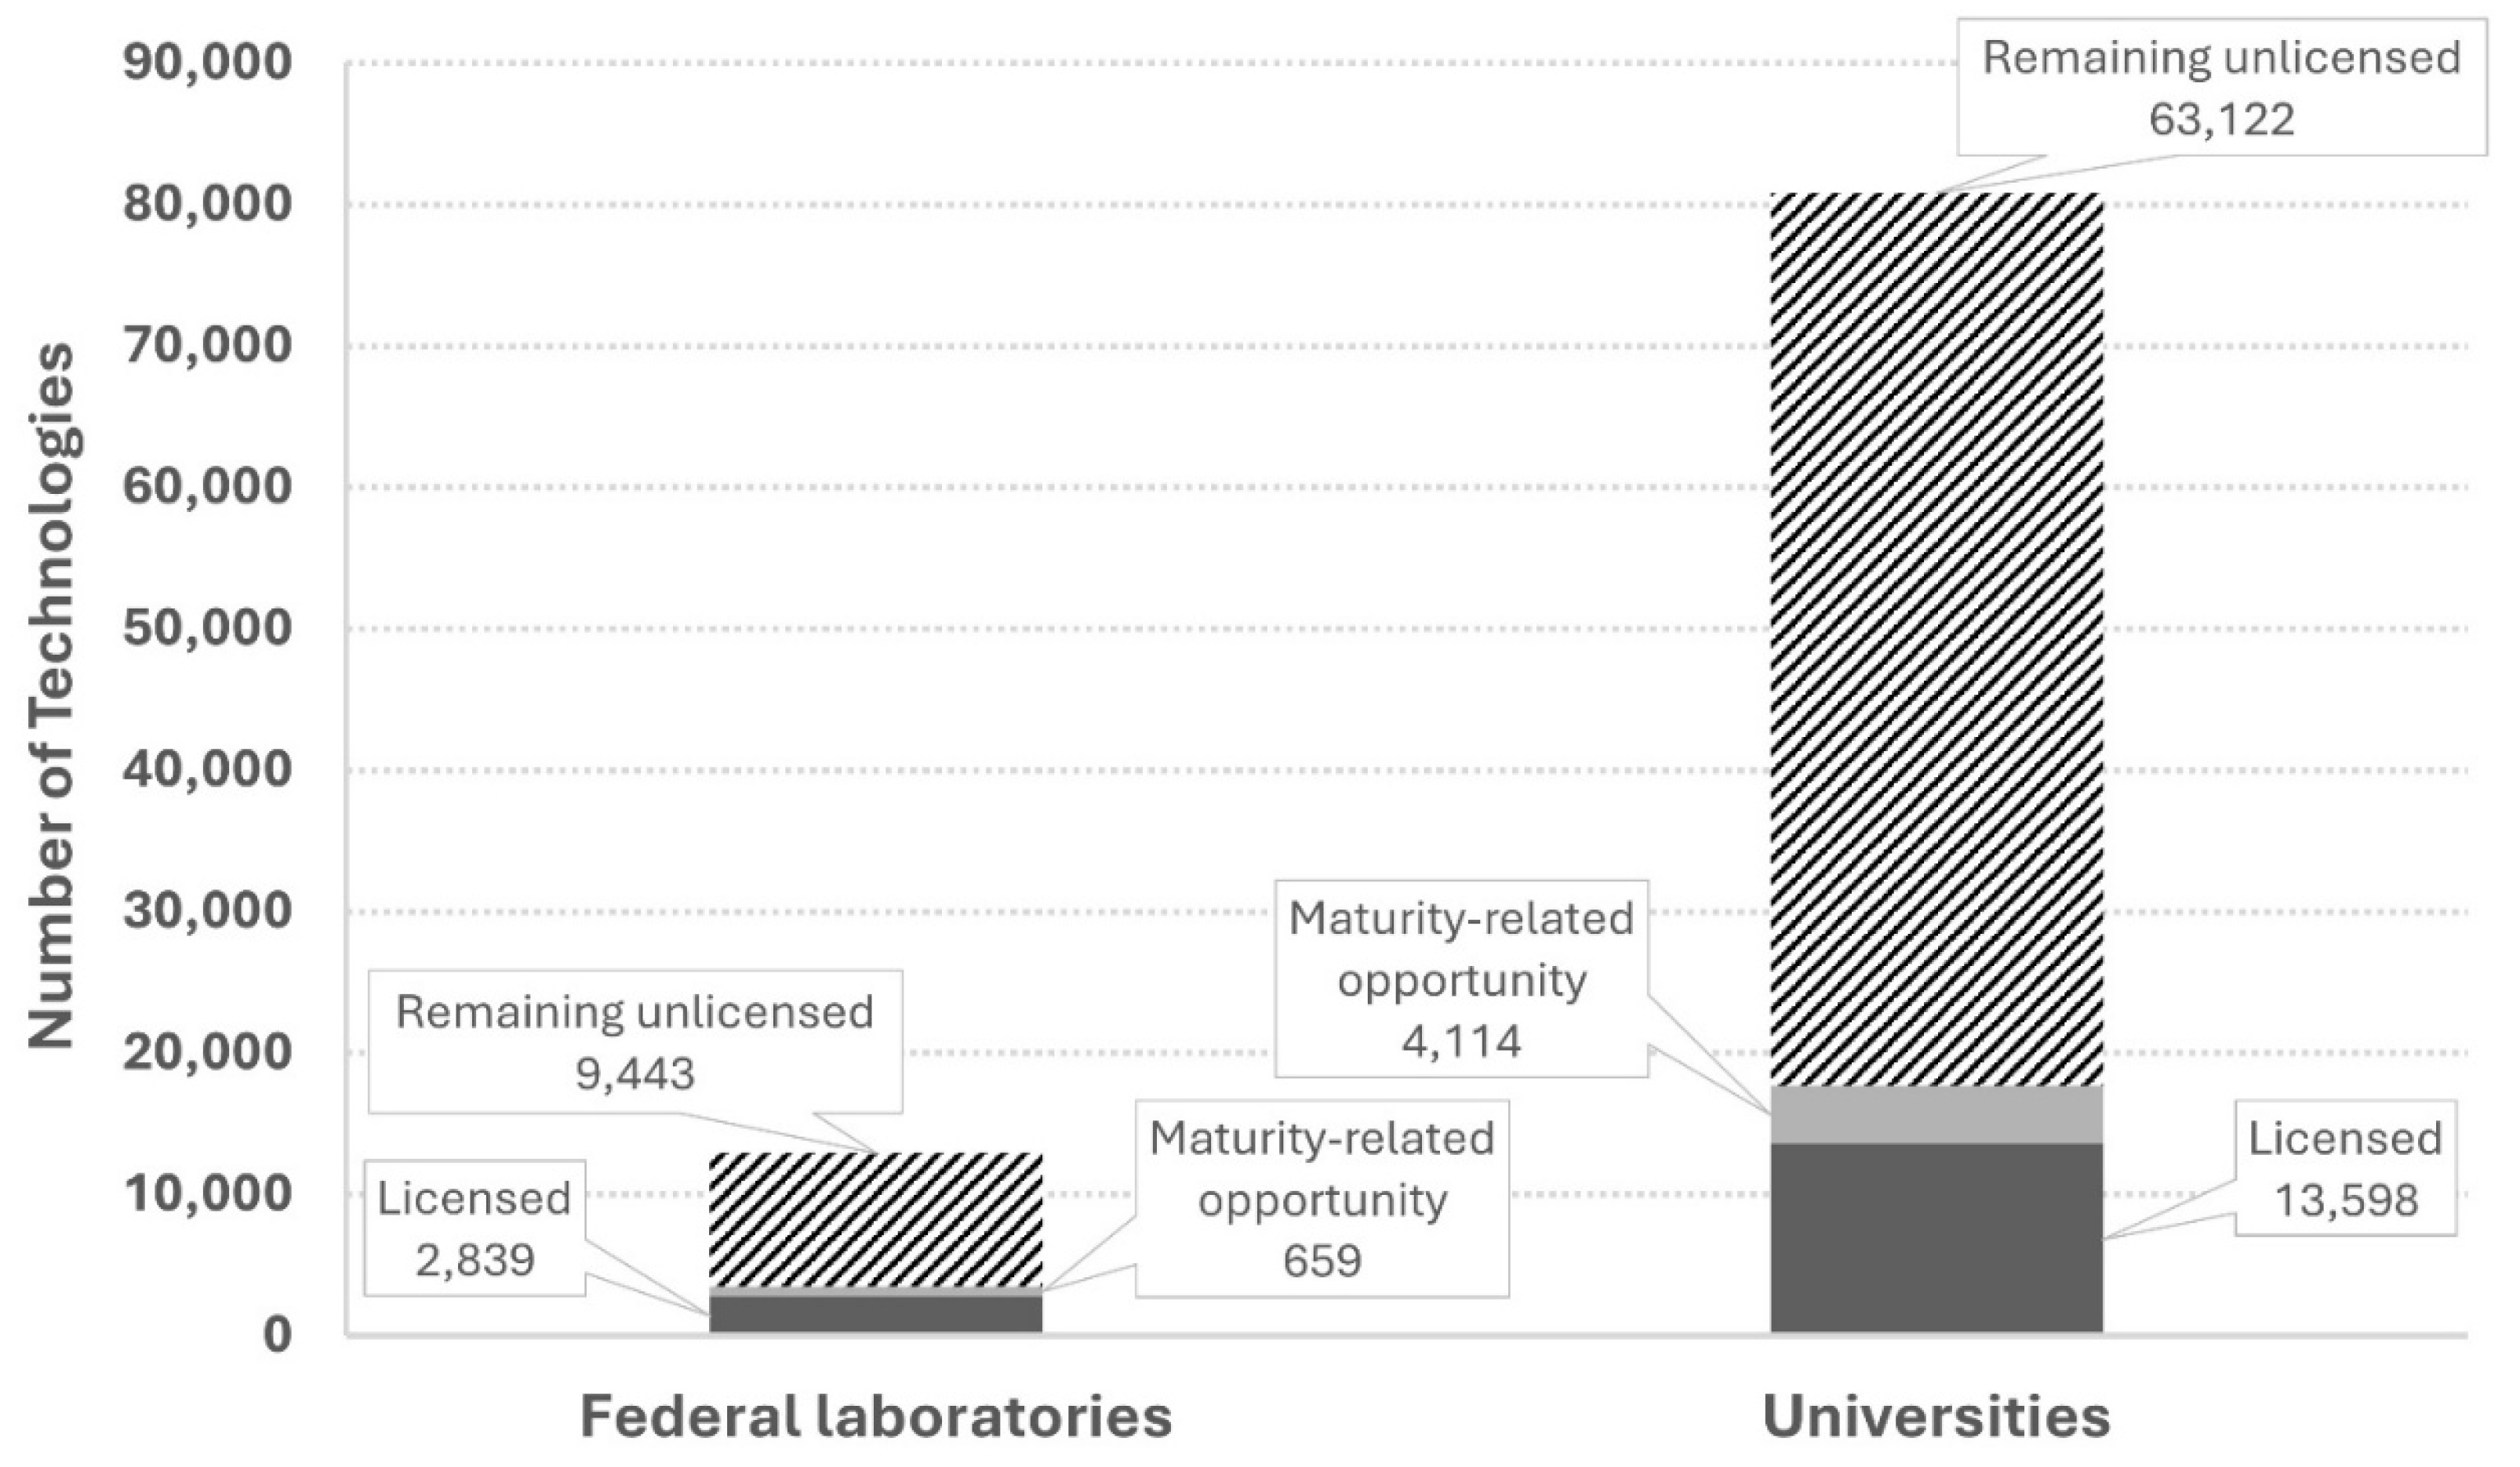

Table 1.
Estimated Percentage of Academic and Federal Technologies Licensed, 2015 to 2019.
| Federal | Academic | Total | |
| Disclosures for new inventions | 26,966 | 127,745 | 154,711 |
| U.S. patent applications | 12,941 | 80,834 | 93,775 |
| U.S. patents allowed | 11,744 | 36,313 | 48,057 |
| Unique inventions licensed | 2,839 | 13,598 | 16,437 |
| Unique inventions licensed as a percentage of invention disclosures |
10.53% | 10.64% | 10.62% |
| Unique inventions licensed as a percent of patent applications |
21.94% | 16.82% | 17.53% |
| Unique inventions licensed as a percentage of patents allowed |
24.17% | 37.45% | 34.20% |
Note. Table created by author. Data sources: Allard, G. et al., 2021; National Institute of Standards and Technology, 2022. Assumes an average of five licenses for each unique invention licensed non-exclusively.
Table 2.
Analytical Paradigms Applied to Examine University Technology Transfer.
| Framework | Primary Purpose | Core Premises | Critiques and Criticisms | Sources |
| Neo-Classical Economics | To explain and predict how scarce resources are allocated | Resources are scarce and competition is unrestricted Markets are the most efficient means of allocating scarce resources Decision makers have perfect information Individuals make rational choices to maximize utility Profit maximization is the dominant goal |
Reifies the organization construct Assumptions are highly idealized and rarely, if ever, achieved in the real world Core premises embed normative biases Presents a static view Ignores the influence of social institutions |
Holdsworth (2011); Keen (2001, 2011); Mulder and Bergh (2001); Puzon and Gisselquist (2023) |
| Transaction Cost Economics | To explain why profit-seeking organizations (i.e., firms) exist, how they are structured, and why they adopt given governance mechanisms | Profit maximization is the dominant goal of profit-seeking organizations Agents may maximize their own utility at the expense of the organization Asset specificity, uncertainty, and transaction frequency mediate a firm’s choice of governance mechanisms |
Reifies the organization construct Overemphasizes the assumptions of rationality and opportunism Presents a static view Ignores the influence of social norms and relationships Ignores motivations of organizational behavior other than profit |
Ghoshal and Moran (1996); Hardt (2011); Mahoney (2001); Marcinkowska (2015); Meier and Jäckli (2023); Miranda and Kim (2006); Valentinov and Iliopoulos (2024); Valentinov and Roth (2024); Walker and Wing (1999); Williamson (1998); Williamson (2013) |
| Resource-Based View | To explain differences in the performance of profit-seeking organizations To explain how profit-seeking organizations create and maintain a sustainable advantage |
Profit maximization is the dominant goal of profit-seeking organizations Profit-seeking organizations derive their competitive advantage from internal resources that are valuable, rare, imperfectly imitable, and non-substitutable |
Reifies the organization construct Lack of actionable insights Presents a static view Neglects important external factors Ignores institutional factors such as industry norms and cultural elements that influence how firms acquire, manage, and use resources |
Andersén et al. (2019); Barney (1991); Barney et al. (2001); Costa et al. (2012); Eðvarðsson and Óskarsson (2011); Mahoney (2001); Shafeey and Trott (2014); Wright (2001) |
| Knowledge-Based View | To explain differences in the performance of profit-seeking organizations To explain how knowledge assets influence the competitive advantage and performance of profit-seeking organizations |
Profit maximization is the dominant goal of profit-seeking organizations Knowledge (in the lay meaning of the term) is an internal resource that organizations use to create and sustain their competitive advantages |
Reifies the organization construct Presents a static view Conceptually vague Ignores other organizational and environmental factors that significantly affect competitiveness Ignores sociological factors, such as power dynamics, that significantly influence how knowledge is shared and used |
Curado and Bontis (2006); Grant (1996); McInerney (2002); Srivastava and Mir (2022) |
| Institutional Theory | To explain how rules, norms, and patterns of behaviors (i.e., institutions) influence the actions of individuals and organizations. To explain stability and change within social systems. |
External pressures influence the actions of organizations The strategies and activities of organizations are linked to cultural and social frameworks in their environment |
Definition of an institution is ambiguous Assumptions and premises are not empirically validated to a sufficient degree Emphasizes organizational stability and ignores agency and innovation Does not adequately explain why organization members modify institutions Ignores certain sociological factors like power dynamics |
Aksom and Tymchenko (2020); DiMaggio and Powell (1983); Meyer and Rowan (1977); Scott (2005) |
| Contingent Effectiveness Model | To organize technology transfer literature To understand how specific contextual conditions either facilitate or impede efficient and effective transfer of technology from one party to another |
The efficiency and effectiveness of technology transfer is dependent on organizational, social, and environmental conditions (i.e., contingencies) | Primarily conceptual Reifies organization construct Assumptions and premises are not empirically validated to a sufficient degree Application is difficult Lacks well-defined quantitative measures for effectiveness Does not sufficiently emphasize institutional factors |
Borge and Bröring (2017); Bozeman (2000); Bozeman et al. (2015); Smart and Benaroya (2016) |
| Triple Helix Model | To provide guidance for fostering collaboration between universities, industry, and government to enhance innovation outputs that drive economic development | Collaborative interactions among universities, industry, and government drive innovation The generation and cross-pollination of new knowledge drives economic growth The boundaries of the roles between universities, industry, and government evolve Institutional factors moderate the influence of innovation on generating economic development |
Primarily conceptual Reifies the organization construct Some constructs are ambiguous Difficult to measure some constructs of the model Oversimplifies the interactions in real-world innovation ecosystems Ignores certain sociological factors like power dynamics Inadequate consideration of the environment in which universities, governments, and private sector firms operate May not accurately reflect various institutional and cultural contexts such as developing countries Contextual variability limits generalization across contexts |
Cai (2015); Cai and Amaral (2021); Deakin (2022); Leydesdorff and Etzkowitz (1996, 1998) |
| Quadruple Helix Model | To provide guidance for fostering collaboration between universities, industry, government, and society to enhance innovation outputs that drive socially responsible economic development that is sustainable | Collaborative interactions among universities, industry, government, and society drive innovation The generation and cross-pollination of new knowledge drives economic growth Society plays an essential role in shaping innovation The dynamics of innovation likely vary across different contexts Innovation should align with the broader goals of society |
Primarily conceptual Reifies the organization construct Assumptions and premises are not empirically validated to a sufficient degree Additional complexity makes the model difficult to apply The role and influence of society is ambiguous Does not adequately account for certain sociological factors such as power dynamics Core premises embed normative biases |
Afonso et al. (2010); Campanella et al. (2017); Carayannis et al. (2012); Cloitre et al. (2023); König et al. (2020); Kunwar and Ulak (2024); Leydesdorff and Smith (2022); Mineiro et al. (2021); Noya et al. (2024) |
| Quintuple Helix Model | To provide guidance for fostering collaboration between universities, industry, government, society, and the natural environment to enhance innovation outputs that drive socially responsible, ecologically sound economic development that is sustainable | Collaborative interactions among universities, industry, government, society, and the natural environment drive innovation The generation and cross-pollination of new knowledge drives economic growth Society plays an essential role in shaping innovation The natural environment has an integral role in shaping innovation The dynamics of innovation likely vary across different contexts Innovation should align with the broader goals of society |
Primarily conceptual Reifies the organization construct Assumptions and premises are not empirically validated to a sufficient degree Additional complexity makes the model difficult to apply The role and influence of the natural environment is ambiguous Overgeneralizes interactions among the various actors and thus fails to account for contextual differences Core premises embed normative biases |
Carayannis et al. (2012); Carayannis and Campbell (2010); Kunwar and Ulak (2024); Leydesdorff and Smith (2022); Mineiro et al. (2021); Mutlu and Arikboga (2023) |
| Battistella-DeToni-Pillon Model of Technology and Knowledge Transfer | To identify critical factors for technology and knowledge transfer from academia to the private sector and direct future research on the relationships of the identified factors | Mutual understanding and trust between knowledge producers and acquirers are necessary conditions for successful transfer Intermediaries function as bridges between research entities and private sector organizations Contextual factors such as social, economic, and regulatory environments affect the technology transfer process Feedback mechanisms between research entities and private sector organizations support iterative improvements |
Primarily conceptual Reifies the organization construct Lacks empirical validation Difficult to operationalize Oversimplifies the technology transfer process Presents technology transfer as a linear process Does not adequately account for the influence of socio-political contexts Does not adequately account for the influence of organizational factors such as absorptive capacity May not be able to generalize to different industries and geopolitical contexts |
Battistella et al. (2016) |
| Prodan-Drnovsek-Ulijn Model of Technology Transfer |
To help researchers, policy makers, and practitioners design policy and instruments to facilitate the transfer of technology from academia to new business ventures | University technology transfer via new business ventures is primarily driven by faculty involvement Academic entrepreneurs rely on their personal networks to secure necessary resources Technology transfer via faculty involved new business ventures is affected by the nature of the academic’s personal network, the length of their academic career, the nature of the academic’s research, personality-driven motivational factors, entrepreneurial self-efficacy, previous engagement with the private sector, exposure to academic entrepreneurial role models, and institutional support |
Primarily conceptual Overly abstract Lacks empirical validation Focus is only on technology transfer via new business ventures Ignores certain sociological factors like power dynamics Ignores the influence of environmental factors Does not account for potential organizational change May not be able to generalize to different cultural contexts |
Prodan et al. (2009) |
Note. Table created by author.
Table 3.
Summary of First Data Set.
| Respondents | Count True | Count Not True | % True | % Not True | |
| Insufficient maturity is one of several reasons for not licensing | 182 | 89 | 93 | 0.49 | 0.51 |
| Insufficient maturity is the most important reason for not licensing | 175 | 40 | 135 | 0.23 | 0.77 |
Note. Table created by author.
Table 4.
Search Terms Used to Screen Cases.
| Screening Words | Screening Phrases | |
| feasibility maturity premature readiness underdeveloped undeveloped |
contact me when contact us when current state of development stage discovery project discovery stage early nature of early research stage early stage lack of later stage little early more advanced more advancement more developed once further |
once the once .* validated once .* validation pass on it .* should you pass on it .* should your pass on it .* if proof.of.concept reach out to me when reach out to us when readiness level ready within somewhat early technical challenges technology.readiness too early very early |
Note. Table created by author. .* and . are wildcards characters in the R programming language.
Table 5.
Summary of Second Data Set.
| Count | Pct of Total | |
| Total cases with notes about the reason for the solicited company’s disinterest in a technology | 1,665 | 1.0000 |
| Total cases in which insufficient maturity was the reason for the company’s disinterest | 84 | 0.0505 |
Note. Table created by author.
Table 6.
Raftery-Lewis Convergence Diagnostic for Simulation 1.
| Chain | Quantile | Accuracy | Probability | Estimated Iterations Required | Independent Samples Required |
Dependence Factor |
| 1 | 0.025 | ± 0.005 | 0.95 | 5,810 | 3,746 | 1.55 |
| 2 | 0.025 | ± 0.005 | 0.95 | 5,721 | 3,746 | 1.53 |
| 3 | 0.025 | ± 0.005 | 0.95 | 5,691 | 3,746 | 1.52 |
Note. Table created by author.
Table 7.
Probabilities for the Parameter for Simulation 1.
| 2.5% | 5.0% | 25.0% | 50.0% | 75.0% | 95% | 97.5% |
| 0.1774 | 0.1862 | 0.2146 | 0.2354 | 0.2570 | 0.2894 | 0.3004 |
Note. Table created by author.
Table 8.
Raftery-Lewis Convergence Diagnostic.
| Chain | Quantile | Accuracy | Probability | Estimated Iterations Required | Independent Samples Required |
Dependence Factor |
| 1 | 0.025 | ± 0.005 | 0.95 | 5,800 | 3,746 | 1.55 |
| 2 | 0.025 | ± 0.005 | 0.95 | 5,731 | 3,746 | 1.53 |
| 3 | 0.025 | ± 0.005 | 0.95 | 5,880 | 3,746 | 1.57 |
Note. Table created by author.
Table 9.
Probabilities for the Parameter in Simulation 2.
| 2.5% | 5.0% | 25.0% | 50.0% | 75.0% | 95% | 97.5% |
| 0.0409 | 0.0424 | 0.0472 | 0.0507 | 0.0544 | 0.0601 | 0.0620 |
Note. Table created by author.
Table 10.
Raftery-Lewis Convergence Diagnostic for Simulation 3.
| Theta Parameter | ||||||
| Chain | Quantile | Accuracy | Probability | Estimated Iterations Required | Independent Samples Required |
Dependence Factor |
| 1 | 0.025 | ± 0.005 | 0.95 | 5,581 | 3,746 | 1.49 |
| 2 | 0.025 | ± 0.005 | 0.95 | 5,571 | 3,746 | 1.49 |
| 3 | 0.025 | ± 0.005 | 0.95 | 5,440 | 3,746 | 1.45 |
| Lambda Parameter | ||||||
| Chain | Quantile | Accuracy | Probability | Estimated Iterations Required | Independent Samples Required |
Dependence Factor |
| 1 | 0.025 | ± 0.005 | 0.95 | 3,777 | 3,746 | 1.010 |
| 2 | 0.025 | ± 0.005 | 0.95 | 3,780 | 3,746 | 1.010 |
| 3 | 0.025 | ± 0.005 | 0.95 | 3,742 | 3,746 | 0.999 |
Note. Table created by author.
Table 11.
Posterior Probabilities of Mean Licensing Revenue to University.
| 2.5% | 5.0% | 25.0% | 50.0% | 75.0% | 95% | 97.5% | |
| Probability of Zero | 0.0449 | 0.0469 | 0.0538 | 0.0589 | 0.0644 | 0.0728 | 0.0757 |
| Revenue Amount | $617,074 | $617,083 | $617,109 | $617,127 | $617,145 | $617,172 | $617,180 |
Note. Table created by author.
Table 12.
Hypothetical Scenario Illustrating the Large Difference in Parameter Value Estimates.
| Reasons Technologies Declined | ||||||
| Company | Insufficient Maturity | Lack of strategic alignment | Lack of financial capacity | Total Technologies Declined | Pct of Technologies Declined for Insufficient Maturity | Survey Response Indicates Insufficient Maturity is Primary Reason |
| 1 | 8 | 6 | 7 | 21 | 38.10% | 1 |
| 2 | 9 | 8 | 8 | 25 | 36.00% | 1 |
| 3 | 6 | 76 | 68 | 150 | 4.00% | 0 |
| 4 | 5 | 75 | 57 | 137 | 3.65% | 0 |
| 5 | 3 | 83 | 60 | 146 | 2.05% | 0 |
| Totals | 31 | 248 | 200 | 479 | ||
| Overall Percentage of Technologies Declined for Insufficient Maturity | 6.47% | |||||
| Percentage of Survey Responses Indicating Insufficient Maturity is Primary Reason | 40.00% | |||||
Note. Table created by author. Last column coding: 1 indicates “Yes” and 0 indicates “No”.
Disclaimer/Publisher’s Note: The statements, opinions and data contained in all publications are solely those of the individual author(s) and contributor(s) and not of MDPI and/or the editor(s). MDPI and/or the editor(s) disclaim responsibility for any injury to people or property resulting from any ideas, methods, instructions or products referred to in the content. |
© 2025 by the authors. Licensee MDPI, Basel, Switzerland. This article is an open access article distributed under the terms and conditions of the Creative Commons Attribution (CC BY) license (http://creativecommons.org/licenses/by/4.0/).
Copyright: This open access article is published under a Creative Commons CC BY 4.0 license, which permit the free download, distribution, and reuse, provided that the author and preprint are cited in any reuse.


