
Submitted:
25 October 2024
Posted:
28 October 2024
You are already at the latest version
Abstract
The effectiveness of a comprehensive maintenance and reliability management process can be assessed through an in-depth analysis of various factors that, collectively, represent the maintenance contribution to the operational and production processes of an industrial asset. There are no simple formulas for designing an integrated maintenance and reliability model within an asset management framework (in accordance with the ISO 55001 standard), nor are there fixed or universal rules that apply equally to all production assets over time. In light of this, the primary goal of this article is to provide an overview of the implementation project of the AMORMS (Asset Management, Operational Reliability Survey), based on the Mainte-nance Management Model (MMM) developed by INGEMAN, at the SINEA PERÚ plant, a leading company in Latin America specializing in the industrial production of recycled plastic containers for commercial beverages (PET preforms - Polyethylene Terephthalate). Lastly, the article outlines the recommendations and high-impact action plans that will support SINEA PERÚ in strengthening the efficiency of its maintenance and reliability management process-es, while effectively optimizing the value of its industrial assets throughout their life cycle.
Keywords:
Asset management
; Data integration
; Criticality Analysis (CA)
; Root Cause Analysis (RCA)
; Reliability Centered Maintenance (RCM)
; Life Cycle Cost Analysis (LCCA)
; Continuous improvement
; Maintenance 4.0
1. Introduction
The main objective of this article is to present a summary of the results obtained from the application of the AMORMS diagnostic tool, which was part of the implementation project of the MMM: Maintenance Management Model [1] developed in the SINEA PERU plant, a company in Latin America in the industrial manufacture of recycled plastic containers for commercial beverages.
As defined in the European standards UNE EN 16646: 2014 and UNE EN 13306: 2002, modern maintenance management includes all those management activities that: determine the maintenance objectives or priorities (defined as the goals assigned and accepted by the management of the maintenance department), the strategies (defined as the management methods used to achieve these goals or objectives), and the management responsibilities. The above will allow then, on a day-to-day basis, to implement these strategies by planning, scheduling and controlling the execution of maintenance for its realization and improvement, always considering those economic aspects relevant to the organization [2]. It can be demonstrated [1] and [3], that for the effective and efficient management of maintenance, it is possible to achieve the above points by understanding well the following two aspects: (i) The maintenance management process, which has a course of action, i.e. a series of steps to be followed and; (ii) The general management reference model, i.e. the basic support structure consisting of a set of tools that form a basic system, which is necessary for advanced maintenance and reliability management [3].
The maintenance management process can be divided into two main parts [4]: (i) The definition of the maintenance strategy; (ii) The implementation of the maintenance strategy. The first of these parts, the process of defining the maintenance strategy, requires the definition of the maintenance objectives as an input. Obviously, maintenance objectives emanate directly from the business plan of the organization in question. Designing maintenance strategies that are aligned with the business plans is a key aspect and conditions the achievement of the maintenance objectives and ultimately those outlined in the organization’s business plan [5] and [6]. The second part of the process, the implementation of the strategy, has a different level of importance and has to do with our ability to ensure adequate levels of staff training, the preparation of the work, the selection of the right tools to perform the different tasks or, for example, the design and achievement of the timely execution of the different maintenance programs [7]. The most relevant aspects developed in the project, and which will be analyzed in this article are described below:
- Application of the AMORMS tool to identify key factors that enhance asset performance through the use of maintenance management optimization and reliability engineering techniques, integrated within an Asset Management Model.
- Evaluation of the critical processes of the proposed Maintenance Management Model (MMM), under the reference framework of an Asset Management process (related standards: UNE 16646 and ISO 55001).
- Proposal for the creation of a Reliability Engineering support group, oriented to implement the actions proposed from the application of the MMM.
- Analysis of the overall results obtained from the application of the AMORMS diagnostic tool and proposed action plans addressing various key aspects: maintenance organization, RAM indicators, maintenance software (SAP-PM), reliability and risk tools (CA, RCA, RCM, LCC), Industry 4.0, etc., in a pilot area of the SINEA PERU plant.
Finally, the recommendations and action plans with the greatest impact are described, which will help the SINEA PERU organization to consolidate the effectiveness of its maintenance and reliability management processes and to efficiently optimize the value of its industrial assets throughout their useful life cycle.
2. Materials and Methods
2.1. Maintenance strategies
The process of defining a maintenance strategy can be described using well-known standard methods of strategic planning, which typically include the following [8]:
- Obtaining, from the corporate business objectives, maintenance objectives and policies at the highest level. These objectives may include, for example, estimated and realistic values for the following variables: equipment availability, reliability, safety, risk, maintenance budget, etc.; in turn, these objectives should be communicated to all personnel involved in maintenance, including third parties.
- Determination of the current performance of production facilities.
- Determination of the Key Performance Indicators (KPIs) to be considered for the evaluation of the performance of the facilities. The improvements to be pursued will be based on this set of metrics accepted by operations and maintenance management.
- Establishment of a set of principles that will drive the implementation of the strategy, and that will condition the subsequent planning, execution, evaluation, monitoring and analysis for the continuous improvement of maintenance activities.
Maintenance management must succeed in aligning maintenance activities according to the defined strategy and this must be done at all three levels of activity in the company: strategic or managerial, tactical or process and operational. After having transformed business priorities into maintenance priorities, maintenance managers will build their short-medium term strategies to attack potential weak points in equipment maintenance, according to these objectives [9]. In this way, a generic maintenance plan is obtained in the company, which then must be developed. The development of this plan will involve, as a fundamental point, specifying a series of policies to be carried out for the assets considered critical. At this same level, another series of actions can be specified on aspects that have to do, for example, with the requirements on skills and technologies to be used to improve the effectiveness and efficiency of maintenance at a micro level, but which require considerable investment [7] and [10].
Secondly, actions at the tactical level must determine the correct allocation of maintenance resources (skills, materials, test and measurement equipment, etc.) for the delivery of the maintenance plan. As a result, a detailed program will be materialized with all the tasks to be performed, with the corresponding resources allocated for the realization of these tasks. In addition, during the detailed process of planning and scheduling maintenance needs, this level of activity in the company must develop competences that allow it to discriminate between different options of resources at its disposal (of different cost), which can be allocated to perform a certain task on a specific asset (e.g., a particular machine), the ideal place to perform the task and the time of start and execution. This will explicitly detail maintenance policies at the tactical level [11] and [12].
Actions at the operational level must ensure that maintenance tasks are properly completed by the selected technicians, within the agreed time, following the outlined procedures and using the appropriate tools. As a result of the above, the work will be performed, and the corresponding data will be collected and entered the management information system. Operational level procedures will be necessary for preventive activities, repairs and complicated fault diagnosis [11].
2.2. Management Model
The mentioned maintenance management model (MMM) is specified in a simple and practical way, always thinking of making it easier for maintenance managers to apply the aforementioned concepts. The MMM developed by [1] and [3], considers and integrates many of the models found in the literature to date, or those used in practice in companies with a long tradition and excellence in this field [11] and [13]. The proposed maintenance management model (MMM) is composed of eight blocks (Figure 1), which distinguish and characterize concrete actions to be followed in the different steps of the maintenance management process. It is a dynamic, sequential and closed-loop model that attempts to characterize precisely the course of actions to be carried out in this management process to ensure its efficiency, effectiveness and continuous improvement field [14] and [15].
As indicated in the MMM reference figure, the first three blocks condition management effectiveness, the following blocks ensure efficiency and its continuous improvement as follows: Blocks 4 and 5 include actions for maintenance planning and scheduling, including of course the capacity planning of the maintenance department. Blocks 6 and 7 are dedicated to the evaluation and control of maintenance and the cost of assets throughout their life cycle [12]. Finally, block 8 focuses on actions to ensure continuous improvement of management [16], [17] and [18].
3. Results
3.1. Case Study Scenario
The following paragraphs present the case study of the application of the MMM in the SINEA Peru plant (PET (Polyethylene Terephthalate) packaging plant). The process of implementing the MMM in the PET container plant started with the application of the diagnostic tool AMORMS: Asset Management, Operational Reliability and Maintenance Survey, which makes it possible to evaluate and define the SINEA plant's areas of opportunity with respect to the 8 phases proposed in the MMM [14] and [15]. Below are some general considerations on the process of applying the AMORMS audit at the PET container plant.
As general data of the SINEA PERU- SMI plant, it is worth mentioning that there are currently 15 compression lines installed in the SINEA Peru plant, these are dedicated to the manufacture of plastic caps through the compression process. Likewise, 100% of the machines belong to the Italian brand SACMI. They are grouped according to the number of tools they have, with 24, 32, 48 and 64 molds. As for the statistical sample of the personnel of the different areas of the plant, the following personnel were consulted: 16 people in the form of a questionnaire of 150 questions, received between January and May 2023, and 21 people in the form of personal interviews carried out in January 2023.
3.2. General AMORMS Audit Implementation Procedure
The audit called AMORMS: ASSET MANAGEMENT, OPERATIONAL RELIABILITY & MAINTENANCE SURVEY, developed by [3], is designed under the asset management approach and allows evaluating the 8 phases proposed by the Maintenance and Reliability Management (MMM) model (Figure 2). The areas to review with the AMORMS tool are:
- Asset Management, Business Objectives (KPIS) and support organization
- Risk-based Ranking Models (criticality of equipment)
- Problem analysis (fault management)
- Programming and planning processes
- Resource allocation, IT and logistical support processes
- Control processes and analysis of technical indicators RAM
- Life cycle cost analysis process
- Review and continuous improvement processes
3.3. Overall results of the AMORMS Audit at the SINEA Peru - SMI Plant
The following is a summary of the questions assessed with the results of the AMORMS audit carried out from January to May 2023 (see Table 2):
- (i)
- Sample 16 persons different areas, sample standard deviation 0.19);
- (ii)
- Average score obtained: 2.032 out of a maximum of 5 points;
- (iii)
- Category obtained: Average standard process (5 categories, category 2 - 3 was obtained).
Worst rated questions:
- -
- # Is there a process for assessing the economic impact of Reliability in the life cycle of assets? (score: 1.39)
- -
- # 6.1.2. Are improvement analyses efficiently carried out on the historical information of failures and operation of the equipment? (score: 1.47)
- -
- # 3.1.4. Is the failure analysis process carried out by interdisciplinary teams to validate the causes found with real facts? (score: 1.52)
- -
- # Is there an efficiently implemented standard indicator analysis program? (score: 1.71)
Top rated questions:
- -
- # 8.1.1. Is there an efficient quality management model within the maintenance area? (score: 2.39)
- -
- # 5.1.1. Is there an efficient IT support system for maintenance? (score: 2.37)
Results by area:
-
Asset Management, Business Objectives (KPIS) and supporting organization (score: 2.16)Worst rated questions:
- -
- # 1.5.2. Are the financial control processes implemented based on the analysis of key KPIS on an ongoing basis and not on an ad hoc basis? (score: 1.86)
- -
- # Is the process of analysis and control of the financial KPIS integrated with the analysis of the technical and economic indicators of the maintenance and reliability areas (value: 1.82)? (score: 1.82)
Best rated question:- -
- # 1.4.1. Is there a generally well-defined organizational structure? (score: 2.21)
-
Risk-based Ranking Models (criticality of equipment) (score: 2.23)Worst rated question:
- -
- # 2.2.3. Is the information used to estimate the frequency of failures taken from a reliable and accurate source? (score: 1.98)
Best rated question:- -
- # 2.3.2. Have staff been made aware of the potential consequences of events that may affect safety, health and the environment? (score: 2.25)
-
Problem analysis (fault handling) (score: 1.96)Worst rated question:
- -
- # 3.1.4. Is the failure analysis process carried out by interdisciplinary teams to validate with real facts the causes found? (score: 1.52)
Best rated question:- -
- # Is there an efficient communication process between the organization’s management and the rest of the administrative levels? (score: 2.12)
-
Programming and planning processes (score: 1.87)Worst rated question:
- -
- # Are maintenance planning and scheduling strategies analyzed and are the results of the implementation of these strategies audited? (score: 1.76)
Best rated question:- -
- # Does the organization have a support group in charge of managing and facilitating Reliability and Maintenance tools? (score: 2.16)
-
Resource allocation processes, IT and logistical support (score: 2.19)Worst rated question:
- -
- # Does the maintenance IT support system automatically generate technical and economic indicators, which are widely used by the whole organization to improve decision making? (score: 1.81)
Best rated question:- -
- # 5.1.1. Is there an efficient IT support system for maintenance? (score: 2.37)
-
Control processes and analysis of technical indicators RAM (score: 1.89)Worst rated questions:
- -
- # 6.1.2. Are improvement analyses efficiently carried out on the historical information of failures and operation of the equipment? (score: 1.47)
- -
- # Is there an efficiently implemented standard indicator analysis programmed? (score: 1.71)
Best rated question:- -
- # 6.3.2. Are operational processes related to all production activities? (score: 2.12)
-
Life cycle cost analysis process (score: 1.78)Worst rated question:
- -
- # Is there a process for assessing the economic impact of Reliability in the life cycle of assets (Woodward, Willians and Scott models, etc.)? (score: 1.39)
Best rated question:- -
- # 7.3.1. Are major shutdowns implemented in an orderly manner under a major plant shutdown management model? (score: 2,01)
-
Processes of review and continuous improvement (score: 2.18)Worst rated question:
- -
- # 8.2.4. Is the Continuous Improvement process a common practice in the areas of maintenance and reliability? (score: 1.74)
Best rated question:- -
- # 8.1.1. Is there an efficient quality management model within the maintenance area? (score: 2.39)
4. Discussion
4.1. Key issues related to the organizational structure of maintenance area
On one hand, the organization has a good level of "Know How" with respect to the PET manufacturing business. Additionally, it has selected a motivated staff, which has a very good technical knowledge (highly specialized) in the operation and maintenance processes of Plastic Container Plants. On the other hand, the organizational structure, starting from the top line (Corporate Maintenance Management) together with its support groups in the various plants, is designed to facilitate the practical application of the different optimization tools for reliability, maintenance and risk engineering (TPM, 5S, RCA, RCM, LEAN, SIX SIGMA, RAM, etc.). It is important to adjust (the number of people needed) and define more precisely the responsibilities in the current organization (associated with maintenance and reliability processes), in order to guarantee the effectiveness of the maintenance processes (to define correctly what must be done to guarantee the function of the equipment in the plant) and secondly, to guarantee efficiency (to define the human and economic resources that guarantee optimal maintenance costs). It also highlights the organization’s vision to identify, select and take advantage of the latest generation technologies, an approach that contributes to the continuous improvement of all processes related to the areas of maintenance and reliability.
Below are some recommendations that will help to consolidate the Reliability Engineering support group within the SINEA PERU- SMI Plant, so that it is able to promote and execute the main improvement activities associated with the 8 phases of the model taken as a reference for the AMORMS audit.
- Area assessed: 1. Asset Management, Objectives and Organizational Structure. Grade obtained: 2.16 = Average / Maximum level = 5
In order to reduce the gaps identified by the AMORMS technique in stage 1 and to cover the different activities to be developed within each of the 8 phases of the MMM, it is recommended to the SMI/SINEA/PERU organization to consolidate the Reliability Engineering support group within the SINEA PERU- SMI Plant, so that it is able to promote and execute the main improvement activities associated with the different stages of the model presented in Figure 1 (MMM). Among the recommended roles to be developed by this group, the same should manage the use of the computer system (SAP PM) and analyze the information generated by this system to generate action plans, based on the effective and efficient use of optimization tools for Maintenance and Reliability Engineering. For the size of the SINEA PERU Plant, it is recommended to include at least 1 to 2 full- time Reliability Engineers to support the implementation and consolidation process of the MMM. The reference standards considered for the development of recommendations to help consolidate the technical groups of Reliability Engineering are:
- -
- UNE-EN 60300-1:2015. Reliability Management. Guidelines for its management and application
- -
- EN 15628:2014. Maintenance - Qualification of Maintenance Personnel (German Version)
- -
- EN 16646:2014. Maintenance within physical asset management
- -
- EN 17007-2017-MAN.1. Maintenance process and associated indicators (establish the maintenance and reliability policy, strategy and development actions)
The Reliability Engineering technical group should be able to design and develop the following activities:
- Participate in the development of a comprehensive reliability and maintenance management policy and align it with business objectives.
- Justify and define the reliability policy within the organization and establish the requirements for that policy.
- Provide examples of how reliability aspects are integrated into a comprehensive asset management strategy.
- Formulate maintenance optimization policies aimed at improving the reliability of production assets.
- Design and establish reliability and maintenance goals, as well as technical and economic indicators.
- Guide the organization in selecting different reliability and maintenance optimization methods.
- Organize reliability activities and design the administrative structure that best suits the organization's needs (for SINEA PERÚ Plant, a centralized and horizontally integrated structure with other business areas is recommended).
- Describe and develop the skills of human resources involved in reliability optimization processes.
- Design a human resources development policy for the reliability area.
- Determine the human and material resources necessary to implement various reliability optimization techniques (e.g., support software, training, tools and materials, technical documentation).
- Integrate reliability activities with safety, hygiene, and environmental processes.
- Identify the different conditions of production equipment that may pose health, safety, and environmental risks (inside and outside the company) and describe the possibility of preventing such incidents through reliability activities, including cooperation with other company departments and external parties.
- Design and/or select methods and techniques to achieve optimized results in reliability activities, including economic, safety, and environmental aspects.
- Define the strategy for selecting and implementing different reliability and maintenance optimization methods (e.g., CA: Criticality Analysis, RCA: Root Cause Analysis, TPM: Total Productive Maintenance, RCM: Reliability Centered Maintenance, CRBA: Cost Risk Benefit Analysis, etc.).
- Develop and analyze key indicators used to control economic aspects related to the application of reliability engineering techniques.
- Develop the procedure for applying LCC (Life Cycle Costs) methods and evaluate the economic impact of reliability.
- Describe how LCC concepts can be applied in the different stages of the asset lifecycle.
- Support the optimization process for spare parts and inventory logistics (material handling and storage, methods for calculating maximum/minimum spare parts, shortage costs, storage costs, quality control, delivery systems, etc.).
- Measure and analyze the results of reliability activities, such as efficiency and cost-effectiveness, to describe different methods for evaluating the outcomes of reliability activities, their advantages and disadvantages, and how economic aspects are considered.
- Know and apply the most important standards related to reliability processes.
- Evaluate and propose different economic models related to maintenance and reliability, and understand the basic principles regarding economic outcomes for the organization.
- Participate in defining maintenance activities during the development and acquisition of new production equipment.
- Explain the importance of analyzing reliability, maintainability, and availability at every stage of the asset lifecycle: development, design, installation, commissioning, operation, and replacement.
- Evaluate the future reliability needs of a company to understand the important factors for reliability activities and how they might change in the future (e.g., new requirements related to goals, strategies, and outcomes).
4.2. Key issues related to SAP PM maintenance support software
The SAP PM software, in the SINEA PERU plant, should help to consolidate the preventive maintenance process and avoid the consequences of failures on safety, the environment and operations (costs or production losses). SAP PM currently generates activities that feed the basic processes of planning and scheduling of preventive maintenance and that in the future should be the basis for the optimization of annual maintenance budgets. In the current structure of SAP PM, preventive maintenance refers to a process related to specific maintenance activities assigned to plant equipment. To realize this, some generic maintenance plans are established. There is room for improvement in defining the task lists of the most important maintenance activities. Nevertheless, the preventive maintenance activities executed and recorded in SAP PM, generate a database of costs and elements necessary to define future maintenance activities (helps to estimate annual budgets). The tasks identified in the SAP PM can be used and analyzed beforehand with the operations area so as not to affect the performance of the production processes. Improvements to the SAP PM module will help to efficiently generate notifications that are planned and scheduled for execution in the short term. Corrective maintenance or fault repair orders can be leveraged for future failure analysis, improving the collection of key data on the unforeseen event (symptoms, failure modes and possible causes).
In summary, currently in the SINEA PERU Plant, the SAP PM system has a potential to be improved and to develop maintenance orders for different maintenance (preventive and corrective), which facilitate the allocation of resources and the proper implementation of maintenance tasks that need to be planned, scheduled and executed. The following are some general recommendations to improve the use of SAP PM software [15]
- Area assessed: 2. Ranking Models and Criticality Analysis process. Grade obtained: 2.23 = Average / Maximum level = 5
- Area assessed: 6. Process of control and analysis of technical and economic indicators. Grade obtained: 1.89 = Below Average / Maximum Level = 5
The reference standards considered in the development of recommendations to help consolidate SAP PM software are:
- -
- UNE-EN-ISO 14224:2016. Petroleum, petrochemical and natural gas industries. Collection and exchange of equipment maintenance and reliability data.
- -
- UNE-EN 60300-1:2015. Reliability Management. Guidelines for its management and application
- -
- EN 17007-2017-MAN.1. Maintenance process and associated indicators (establish the maintenance and reliability policy, strategy and development actions)
The following is a summary of the recommendations with the greatest opportunity for improvement about the use of the SAP PM IT system (phases 2, 4, 5 and 6 of the MMM):
- Improve work order data collection formats in SAP PM (problem description, symptoms, failure modes (associated with maintainable items)).
- Improve the process of data capture and analysis of the information generated by the SAP PM software, this process presents a great opportunity for improvement, additionally, the use of this management tool is very limited to only a minimum group of people in the maintenance area, it is necessary to transmit more efficiently the information of the impact of the planning and scheduling process to the operational areas, In addition, the use of SAP PM needs to be much more widely disseminated and the interpretation and decision-making process needs to be improved based on the analysis of the information (technical and economic) that can be generated within the maintenance process (the use of the installed version of SAP PM has not been consolidated).
- Develop and automatically generate within the SAP PM at the different hierarchical levels (Plant, Process, System, Equipment and reach the maintainable item, according to the ISO 14224 approach), the technical management indicators (MTTF: mean time to failure, MDT: mean down time, FF: frequency of failures and Costs due to unavailability by failures: CUF). In the medium term, the proposed indicator (CUF) can be related to other indicators such as: Back log, % maintenance activities executed vs. planned, Preventive vs. corrective.
- Promote within SAP PM, a standard model of criticality assessment of failure modes associated with the maintainable item, based on the indicator "CUF: Costs of unavailability due to failures" (frequency of failures (failures/year) x consequences ($/failures) = $/year). This model should be accepted by the whole organization and should also be the criteria for prioritizing the processes of planning, execution of maintenance activities and definition of critical spare parts (internal developments within SAP PM could help to improve this part of the maintenance management process).
- Correct the calculation of the Reliability indicator; the indicator that is currently calculated is a calculation of Availability associated with failures. The correct calculation of Reliability (Rt, probability of operation) should be carried out with statistical techniques, for example, with the Weibull Distribution.
- Promote greater interest in the use of SAP PM at the level of the different maintenance departments (greater commitment to the use of SAP PM) and make decisions based on the use of the technical and economic indicators generated from SAP PM (show the added value of the use of the SAP PM tool).
- Promote a cultural change in SAP PM users, in relation to the management process of the technical and economic data to be entered in SAP PM (guarantee a good level of quality and veracity of the data).
- Use SAP PM to promote improvements in the planning and scheduling processes of maintenance strategies, use the proposed CUF indicator, at the maintainable item level, to drive the PM preventive maintenance optimization process and improve annual maintenance budgets.
- Review and adjust detailed preventive maintenance execution procedures for critical equipment (review step-by-step maintenance and inspection plans for critical failure modes).
- Review the work order prioritization process within SAP PM (it is recommended to use the indicator CUF: Unavailability costs due to failures, to adjust the prioritization of work orders for preventive and corrective activities).
- Set the stage for work orders to be generated within SAP PM by the people who are closest to the equipment (parameterize SAP PM to make it simple and user-friendly).
- Design standard formats or improve existing formats within SAP PM), so that the following information can be recorded: failure modes (catalogue of failures associated with maintainable items, obtained from RCM applications), average operating times, average out-of-service times, economic impact (direct costs of failures plus penalty cost).
- Design a procedure within SAP PM, which allows the integration of the criteria between logistics and maintenance with the aim of being able to establish optimal maximum and minimum spare parts based on the risk factor.
- Disseminate the information generated by SAP PM; and not limit it only to maintenance personnel (take advantage and introduce operations personnel to start correcting the process of defining failure modes, especially start requiring the creation of the failure mode database).
- Develop a procedure within SAP PM to automatically prioritize equipment and preventive and corrective maintenance activities according to the potential impact of failure modes in the operational context.
- Develop a basic training program of technical indicators of Reliability and Maintenance, integrated with the training process in the use of the SAP PM tool, in which field personnel are involved, both operators and maintainers, not limiting the knowledge and use of the indicators to be generated by SAP PM, only to the group of people who make up the Maintenance area, it is necessary to involve the operations personnel.
- Promote in the medium and long term, the development within SAP PM of Root Cause Analysis (RCA) and Reliability Centered Maintenance (MCC) tools, as integrated modules within SAP PM, which directly feed the processes of planning, scheduling and the development of annual maintenance budgets.
At this stage, it is recommended that SMI develops and consolidates the CUF indicator (Costs due to unavailability by failures) at the maintainable item level (taking the ISO 14224 structure as a reference). It is recommended that the hierarchical structure of assets proposed in Table 1 be analyzed, so that it can be used as a basis for the parameterization of assets in the SAP PM software: (i) Levels 1 to 4 represent a high-level hierarchical categorization and relate to the specific industry type to be analyzed. The taxonomic information at these levels (1 to 4) must be added in the database of the Plant Maintenance system (SAP PM) for each system/equipment category (level 5) as "usage/location data". (ii) Levels 4 to 7 relate to the unit of equipment (inventory) with the subdivision into maintenance intervention levels. The ISO 14224 standard focuses on the hierarchical levels (5, 6 and 7, see Figure 2): area-sections/system-equipment/component-maintainable item), for the collection of RM data (RM: Reliability and Maintainability), with levels 5 and 6 being the most impactful for the optimization of maintenance strategies) and indirectly on the lower intervention items such as sub-units and components. The number of subdivision levels for RM data collection depends on the complexity of the equipment unit and the use of the data. For example, for a simple instrument (temperature control loop) no further subdivision is needed to define the type of maintenance, whereas, for a complex valve, several levels may be required to define the associated maintenance type down to the level of the maintainable item.
Below are the proposed calculation procedures for the basic technical indicators to be introduced into SAP PM (at the maintainable item level – ISO 14224). It is recommended that this be developed at hierarchical levels 4, 5, 6, 7 and 8 as shown in Figure 2.
-
MTTF = Mean Time to Failure (Average Operational Time Until Failure). Unit of measurement: Time (hours, days, months, etc.)MTTF = ΣTTF / nWhere:TTF = operational times until failuren = total number of failures in the evaluated periodNote: This is a technical indicator and serves as a basic measure of Reliability.
-
FF = Failure FrequencyUnit of measurement: Failures per time (failures/year, failures/month, failures/week, failures/hour)Where:FF= 1 /MTTFNote: This technical indicator measures the rate of increase or decrease in failures and is a basic measure of Reliability.
-
MDT = Mean Down Time (Average Time Out of Service)Unit of measurement: Time (hours, days, weeks, etc.)MDT = ΣDT / nWhere:DT = time out of servicen = total number of failures in the evaluated periodNote: This technical indicator represents Maintainability and measures the increase or decrease in downtime during restoration processes.
-
CUF = Cost of Unavailability Due to FailuresUnit of measurement: Money per time (dollars/year, dollars/month, etc.)CUF = FF × MDT × (CD + CP)Where:FF = failure frequency (failures/month, failures/year, etc.)MDT = average downtime (hours/failure)CD = direct cost of correction per failure hour ($/hour), including material and labor costsCP = penalty cost per hour ($/hour), including opportunity costs caused by failure events (plant shutdowns, production deferral, low quality, rework, safety, and environmental impacts)Note: This is an economic technical indicator representing the Economic Risk Value, measuring the economic impact of failures per unit of time.
-
A = AvailabilityUnit of measurement: % (ratio of operational time)A = ( (MTTF+MDT) / MTTF ) × 100%Where:MTTF = mean time to failure (average operational time until failure)MDT = mean down time (average time out of service)Note: This is a technical indicator used to measure the availability of a system, representing the percentage of time the system is operational relative to the total time (operational time + downtime).
4.3. Key aspects related to the Criticality Analysis process
The physical asset criticality analysis process to be developed by the SMI/SINEA/PERU organization should be based on a risk model based on a semi-quantitative matrix. This type of tool will allow the efficient establishment of hierarchies or priorities in the SINEA PERU plant facilities at the system, equipment and device level. The criticality model to be developed based on Risk must include key factors of the PET product manufacturing business (Safety, Environment, Production, Safety and Quality). Below are some recommendations for consolidating the prioritization process (CA: Criticality Analysis).
- Area assessed: 2. Ranking Models and Criticality Analysis process. Grade obtained: 2.23 = Average / Maximum level = 5
The reference standards considered for the development of recommendations to help consolidate the prioritization process: CA are:
- -
- ISO 31000 (Risk-Management-Principles-and-Guidelines)
- -
- NORZOK Z-008:2017 (Risk based maintenance and consequence classification)
- -
- UNE-EN-ISO 14224:2016. Petroleum, petrochemical and natural gas industries. Collection and exchange of equipment maintenance and reliability data.
The Prioritization process (CA: Criticality Analysis) is a stage that provides a baseline on which to make decisions when classifying productive assets according to the importance of their function in achieving business objectives. The proposed ranking technique (developed in the pilot applications) is based on the Risk Based Criticality Analysis and allows to identify, by their importance, the assets of a facility on which it is worth directing the greatest efforts (human, economic and technological); in other words, the criticality analysis process helps to determine the importance and consequences of the failure events of the production systems within the operational context in which they operate. To consolidate the criticality model to be developed in SINEA PERU, some recommendations are presented below to consolidate phase 2 of the MMM (risk-based criticality analysis process):
- Update and confirm the key factors that currently make up the criticality analysis process (criticality processes developed in the RCA and RCM pilot applications). It is important that the factors included in the Risk Matrix help management and technical levels to make more efficient decisions, correctly directing both economic and human resources in the processes related to the operation and maintenance of industrial assets at the SINEA PERU Plant.
- Review and adjust the Physical Assets Risk Matrix model, so that it allows for a systemic and comprehensive assessment of the following parameters: Reliability, Maintainability, Costs due to unavailability, Quality, Safety, Health, Environment, Security, Vulnerability and Reputation, aligned with the objectives of a comprehensive Asset Management process.
- Understand that the semi-quantitative method of prioritization by Risk generates a high level of uncertainty, so great care must be taken with the criteria to be evaluated and with the decisions to be taken based on the criticality results to be obtained with this methodology (it is recommended that at least once a year, the criteria included in the Risk-based criticality matrix be reviewed and updated).
- Consolidate the execution of the recommendations obtained from the criticality analysis process, promoting the real and effective implementation of the actions to be proposed from the application of the Reliability and Risk methods: RCA (Root Cause Analysis), RCM (Reliability Centered Maintenance), etc.., compare at least once a year, how the criticality levels of the equipment move within the Risk matrix, once the recommended action plans have been implemented (relate the level of importance of the systems obtained from the criticality matrix with the CUF indicator, proposed in the previous session, compare the CUF before and after the implemented recommendations).
- Ensure the veracity of the information available in the process of defining the factors of the frequencies and consequences of failures (key aspect, having people who are "experts" in the factors to be evaluated in the risk matrix), to such an extent that, if "expert" personnel are not available, high- impact risk factors may be omitted, generating erroneous or incomplete criticality results, which generate inefficient solutions with little added value.
Below is a general summary of a proposed Criticality Analysis methodology based on the estimation of the Risk factor [1], [3] and [16]. General expressions for evaluating the Criticality Model based on the Risk factor:
-
Risk = FF x CWhere:FF = Failure frequency (number of failures over a specific period)C = Consequences of failures to safety, environment, quality, production, etc.
In the risk-based criticality analysis process, factors and evaluation scales related to the consequences and frequencies of failures must be selected. Below is an example of the failure frequency and consequence factors to be evaluated. It is important to mention that the selected factors and evaluation scales must align with the business's strategic objectives.
Factors to Consider:
- Failure Frequency (FF)
1. Excellent: one occurrence after 12 weeks
2. Good: at least one occurrence between 6 and 12 weeks
3. Average: at least one occurrence between 3 and 6 weeks
4. Poor: at least one occurrence between 1 and 3 weeks
5. Very Poor: at least one occurrence per week
- Consequences of Failures (C)
Impact on Safety Hygiene and Environment (SHA)
Direct Failure Costs (CDF)
Impact on Production (IP)
- Safety, Hygiene, Environment (SHA)
5. Catastrophic event: death and/or high environmental impact
4. Event generates: disabling injury and/or significant environmental impact
3. Event generates: minor physical damage and/or controllable environmental impact
2. Event generates: potential safety alarm and/or environmental incident without legal repercussions
1. No impact on safety or the environment
- Direct Failure Costs (CDF)
5. Costs above 10,000 USD
4. Costs between 5,000 and 10,000 USD
3. Costs between 1,000 and 5,000 USD
2. Costs between 100 and 1,000 USD
1. Costs below 100 USD
- Impact on Production (IP)
5. Production loss greater than 10 hours of downtime
4. Production loss between 5 and 10 hours of downtime
3. Production loss between 3 and 5 hours of downtime
2. Production loss between 1 and 3 hours of downtime
1. Production loss < 1 hour of downtime
The evaluation results of the above factors are presented in a 5 x 5 criticality matrix (see Figure 3), where the vertical axis consists of five levels of failure frequency, while the horizontal axis consists of five levels of failure consequences.
To determine the criticality level of the equipment to be evaluated, a group of experts analyzes the failure frequency and consequence factors, assigning a score between 1 and 5 to each. In summary, the criticality definition is as follows: first, the failure frequency value (FF) is selected, determining the vertical position in the matrix for the evaluated equipment. Then, the highest value assigned to the three failure consequence factors (SH, CDF, IP) is used to determine the horizontal position in the criticality matrix. Subsequently, these values intersect in the Risk Matrix (Figure 3), which provides the criticality level of the evaluated equipment. The risk matrix is divided into four regions representing four levels of criticality:
L = Low criticality
M = Medium criticality
H = High criticality
VH = Very High criticality
Finally, the results obtained from the effective application of the Risk Based Criticality methodology (criticality matrix) will help the managers of the different areas to make more efficient decisions with a lower degree of uncertainty in the activities related to the allocation and distribution of human, technical and economic resources within the Maintenance and Operation processes, thus helping to maximize the profitability of the SINEA PERU Plant.
4.4. Key aspects related to the failure analysis process
The SMI organization must effectively consolidate the implementation of the Root Cause Analysis (RCA) technique developed in the pilot applications. Its implementation must be an intuitive and orderly process that allows the identification of the root cause of failures, considering basically two aspects: the evaluation of the real events that generate the loss of function (unavailability); and the impact that these events can cause on: the environment, human safety and operations. The RCA methodology to be implemented should help reliability engineers to orient themselves in the steps to be followed to define: the causes of failure events and the considerations to be taken to obtain effective solutions. In summary, the application of the proposed RCA Method will help the SMI organization to: (i) Easily analyze all perspectives that can cause critical failure events; (ii) Remove frustration and inefficient discussions from RCA processes; (iii) Create a common reality of the problems analyzed; (iv) Ensure buy-in from all stakeholders for proposed solutions; (v) Incorporate into day-to-day operational and maintenance processes a common, easy-to-use RCA application that allows the determination of causes, effects of failures and action plans based on real evidence. Below are some recommendations for consolidating the Root Cause Analysis (RCA) process:
- Area assessed: 3. Problem analysis and fault management. Grade obtained: 1.96 = Below Average / Highest Level = 5
The reference standards considered for the development of recommendations to help consolidate the failure analysis process (RCA) are:
- -
- UNE EN 62740:2015 (RCA: Root Cause Analysis)
- -
- ISO 31000 (Risk-Management-Principles-and-Guidelines)
The Root Cause Analysis (RCA) process constitutes phase 3 of the MMM [3]. This stage systematically identifies the primary root causes of problems and then applies corrective measures to eliminate them definitively. As part of the definition of continuous improvement strategies, it is necessary to analyze possible repetitive, chronic failure modes, whose frequency of occurrence may even be excessive. If we can find, and even eliminate, the causes of failures we can offer a high initial return on investment in our maintenance management program; therefore, the main objective of applying the RCA technique is to minimize the impact of failures and maximize the operational reliability of the assets [3]. Based on the gaps identified in the AMORMS audit, some recommendations are presented below to consolidate phase 3 of the MMM (failure analysis process) at the SINEA PERU Plant:
- Quantify in detail the improvements obtained from the implementation of the recommendations generated by the RCA process. It is proposed to calculate and analyze (before and after the implementation of RCA), technical indices such as: average operating times, average downtimes and the frequency of failures.
- Introduce the CUF indicator (Costs of Unavailability due to Failures), calculate this indicator before the implementation of the RCA and compare it with the one obtained after the implementation of the recommendations generated from the RCAs, to measure the real values of savings or losses obtained.
- Design standard RCA formats for the entire organization (ideally include this format within the SAP PM software). The formats to be developed should record the following information: failure modes and their root causes (most important), average operating times, average out-of-service times, economic impact (CUF indicator). Use as a basis for the design of the formats, the one used in the implemented RCA applications.
- Use the experiences and results obtained from the RCAs (in the pilot applications), to create a shared knowledge database (ideally this database should remain within the SAP PM, in the future all RCAs can be digitized, and Industry 4.0 tools can be integrated, e.g. application of Digital Twins in the failure analysis processes).
- Facilitate the exchange of information and the analysis of resolved RCA cases among the staff of the different maintenance and operations areas (take advantage of the analysis of previous RCAs). Generate lessons learned: "it is not necessary to make mistakes twice".
- Disseminate the information generated by the RCA results; and not limit it only to maintenance personnel (use the information collected for the creation of the failure modes database).
- Develop a basic Failure Analysis training program, involving all operations and maintenance personnel, not limiting the knowledge of the RCA technique only to the maintenance group, it is necessary to involve operations, production, projects and logistics (purchasing) personnel.
- Assign responsible parties for the implementation of the proposed recommendations (define implementation dates for each of the recommendations developed and establish a work plan to implement the recommendations in a period of less than 6 months).
At the outset, it is proposed to calculate an indicator to measure the percentage of RCAs completed at the methodological level, i.e. without implementing the recommendations generated from the RCA. For the calculation of this indicator, the last meeting is taken into account, in which the working group defines the proposed actions (recommendations) that will help to eliminate or minimize the root causes of the failure event analysis during the RCA application process (the level of success of this indicator should not be less than 75%, for example out of a total of 20 RCAs, proposed and initiated, at least 15 of the 20 RCAs should be finalized (that would be 15 RCAs finalized methodologically, i.e. without having yet implemented the proposed recommendations). Subsequently, after having finalized the RCAs, the process of implementation and execution of the recommendations generated from the RCAs should be monitored. For this purpose, it is recommended to calculate a second indicator, specifically the CUF, an indicator that will allow to evaluate the level of economic effectiveness of the executed recommendations (the level of savings to be obtained once the RCA recommendations have been implemented should not be less than 35%). In order to consolidate and massify the formation of working groups for the execution of RCA at the SINEA PERU plant, it is important to emphasize that the success of RCA implementation depends fundamentally on the human resources involved in failure analysis, which is why special attention must be paid to the formation of the working groups and above all to the participation of personnel from the maintenance, operations and production areas. Include in the process of measuring personal performance (annual objectives), indicators that make it possible to evaluate the participation of maintenance and operations personnel in RCA applications.
Here is a general summary of a proposal for the application of the RCA (Root Cause Analysis) methodology [3] at the SINEA PERU Plant.
- Formation of work teams. The first step in the methodology is to form a multidisciplinary team responsible for analyzing the problem. This team should include individuals with different perspectives and specialized knowledge about the area or process being investigated. The purpose is to ensure that all relevant aspects are covered.
- Definition and prioritization of problems. The team must identify and clearly define the problems or incidents that have been observed. It is important to have a clear and agreed-upon understanding of the problem in order to proceed effectively. Then, the problems are prioritized, focusing on those with the most significant impact or urgency.
- Definition and prioritization of failure modes. Once the problems have been identified, the next step is to identify the different failure modes that may have caused the problem. These are the various failures in components or processes that contributed to the overall problem. The failure modes are then prioritized based on their criticality and impact.
- Definition and validation of hypotheses. Based on the analysis of possible causes, the team develops hypotheses about what may be causing the problem. These hypotheses must be tested or validated using additional data or analysis to ensure that they accurately represent the root cause.
- Definition of root causes: physical, human, and latent. This is the core of Root Cause Analysis. Here, the team investigates the underlying causes of the problems. Root causes can be physical (equipment or material failures), human (operational errors, lack of training), or latent (systemic factors that are not immediately apparent, such as poor policies or lack of supervision).
- Identification and implementation of solutions. With the root cause validated, the team works on solutions to eliminate or mitigate it. These solutions may include process changes, improvements in training, technical enhancements, or adjustments in policies. It is essential that the solutions are practical and applicable.
- Evaluation of the effectiveness of the solutions. After implementing the solutions, an evaluation is conducted to measure their effectiveness. The team monitors whether the initial problems are resolved and whether the failure modes do not reoccur. This step is crucial to ensure that the solutions not only address the symptoms of the problem but eliminate the root cause.
This detailed process describes a systematic cycle that ensures problems are thoroughly analyzed and effectively solved, resulting in sustainable improvements and better prevention of future incidents. Finally, the implementation of an effective RCA process must ensure that the following 5 stages of the continuous improvement process are covered: Define, Measure, Analyze, Improve and Control. Successful implementation depends on the effort of the multidisciplinary team and as such requires some experience to overcome the paradigms traditionally found in failure analysis processes.
4.5. Key aspects related to the process of optimisation of maintenance and inspection plans (RCM)
The SMI organization should consider effectively applying the RCM method (developed in the pilot applications). This methodology serves as a guide to identify maintenance and inspection activities and their respective frequencies for the most important assets within the production process [19]. The procedures to be developed in SMI to apply the RCM tool will help to define the maintenance and inspection programs that feed the planning and programming processes of the SAP PM modules, adjusting the maintenance and inspection strategies to the real needs of the assets of the SINEA PERU Plant. For the development of the maintenance and inspection plans, the level of risk (frequency x consequences: safety/environment/operations) generated by the failure modes and deterioration processes of the SINEA PERU Plant assets is taken as a basis. Within the RCM procedure, it is proposed to calculate the REMF (Failure Mode Economic Risk) in the Failure Modes and Effects Analysis (FMECA).
In summary, the application of the RCM method, will help the SMI organization to: (i) To create a highly critical spirit in all personnel (operations-maintenance) in the face of the effects and consequences that can be generated by the various failures in the plant; (ii) To adjust maintenance and inspection tasks to the real needs of the operational context, relating failure modes and deterioration processes to their effects on safety, environment and operations; (iii) Optimize the implementation of maintenance and inspection activities taking into account the risk level of assets within the operational context, effectively feeding the maintenance planning and scheduling processes (preventive, condition and corrective); (iv) Develop an effective system for recording and managing reliability data associated with failure modes and deterioration processes (v) Increase the knowledge of both operations and maintenance personnel regarding operational processes and their effects on the integrity of the facilities. The following are some recommendations to consolidate the process of defining and optimizing maintenance and inspection (M&I) plans:
- Area assessed: 4. Process of planning, scheduling and optimization of maintenance plans. Grade obtained: 1.87 = Below Average / Highest Level = 5
- Area assessed: 5. Resource allocation and logistical support process Grade obtained: 2.19 = Average / Maximum level = 5
The reference standards considered for the development of recommendations to help consolidate the process of optimization of maintenance and inspection plans are:
- -
- SAE 1011-1012 RCM (Reliability Centered Maintenance)
- -
- UNE-EN-ISO 14224:2016. Petroleum, petrochemical and natural gas industries. Collection and exchange of equipment maintenance and reliability data.
- -
- ISO 31000 (Risk-Management-Principles-and-Guidelines)
- -
- EN 17007-2017-MAN.1. Maintenance process and associated indicators (establish the maintenance and reliability policy, strategy and development actions)
The process of defining and optimizing maintenance (RCM: Reliability Centered Maintenance) and inspection plans takes place between phases 4 and 5 of the MMM. The design of the optimal maintenance and inspection plan for a given system initially requires the identification of its functions, failure modes, deterioration processes and failure effects, as well as the establishment of a series of effective and efficient maintenance and inspection tasks, based on safety, environmental and operational considerations. The RCM methodology is responsible for optimizing operational reliability and minimizing the risk of a system operating under defined working conditions, establishing the most effective maintenance and inspection activities, based on the criticality of the assets belonging to the system, considering the possible effects that the failure modes of these assets will have on safety, the environment and operations. Based on the gaps identified with the AMORMS tool, some recommendations are presented below to consolidate phases 4 and 5 of the MMM (process of definition and optimization of maintenance and inspection plans) at the SINEA PERU Plant:
- Continue with RCM applications (based on the method used in the pilot applications) on all critical equipment in the Plant and carry out a detailed review of the current maintenance and inspection programs (use the CUF indicator to assess the economic risk factor for each failure mode and adjust the maintenance and inspection plans).
- Code failure modes and generate work orders with the failure modes obtained from RCM applications (include these failure modes as functional locations in the catalogue within the SAP PM at maintainable item level, ISO 14224).
- Develop for the failure modes and critical deterioration processes obtained from the RCM, a cost risk benefit analysis process (apply the reliability optimization techniques: Weibull and Log Normal methods integrated to the CUF optimization indicator.
- Update the effectiveness of the maintenance and inspection plans generated from the RCM; and analyze before and after, the performance of the following technical indicators (MTTF: mean time to failure and MDT: mean down time) and cost indicators (preventive, corrective, predictive maintenance and the CUF: costs due to unavailability due to failures).
- Adjust the internal review procedure of the maintenance and inspection plans defined under the RCM methodology approach to control the average operating times, repair times, failure frequencies and costs per failure unavailability (CUF), at least once every 12 to 18 months.
- Integrate RCM results within SAP PM, to have a common database of optimized maintenance and inspection plans.
Here is a general summary of a proposal for the application of the RCM (Reliability-Centered Maintenance) methodology [3] at the SINEA PERU Plant:
- INITIAL PHASE
- a. Formation of the natural work team. In this stage, a multidisciplinary team is selected and organized. This team usually consists of individuals who have direct experience with the system or asset being analyzed. The team should include operators, maintainers, engineers, supervisors, and any other relevant personnel. It is important that all team members understand the objectives of RCM and the tools that will be used throughout the process. The purpose of this phase is to ensure that the team is aligned and ready to carry out the reliability analysis efficiently and effectively.
- b. System selection and definition of the operational context. In this stage, the system or asset to be analyzed is selected. This step is crucial as it defines the boundaries of the analysis, the scope of the study, and which parts of the system will be considered.
- The operational context is also defined, which describes the conditions under which the system is expected to operate. Factors such as the environment, load capacity, operating duration, environmental conditions, safety standards, among others, are considered. This helps to understand how the system should behave under normal and extreme conditions. It is essential to have a clear understanding of the system, its limits, and its role in the overall process.
- 2.
- RCM IMPLEMENTATION PHASE
- a. Failure Modes and Effects Analysis (FMEA). FMEA is a critical step where the different modes in which a system can fail and the impact of those failures on the overall system performance are identified and analyzed. The analysis is developed through several sub-steps:
- i. Definition of functions. In this sub-phase, the primary and secondary functions of the system or asset are defined. It outlines what is expected of the system under normal conditions and any additional roles it may have. For example, the primary function of a pump in a plant might be to pump water at a certain pressure and flow rate. It may also have secondary functions, such as preventing overheating or ensuring system safety.
- ii. Detection of functional failures. In this stage, the functional failures of the system are identified, meaning those situations in which the system fails to perform its functions as expected. A functional failure can be total (the system does not function at all) or partial (the system operates inefficiently or deviates from its operational standard). Continuing with the pump example, a functional failure could be the pump not reaching the required pressure or failing to start when needed.
- iii. Identifying failure modes. Here, the different failure modes that may cause functional failures are identified. Failure modes are the specific reasons why a functional failure occurs. These modes can be caused by mechanical, electrical, human, or environmental factors. In the case of the pump, a failure mode could be a blockage in the pipes, a failure in the electric motor, or excessive wear of components.
- iv. Effects and consequences of failures. This sub-phase focuses on analyzing and documenting the effects and consequences of the identified failures. Effects describe what happens when a failure occurs (e.g., the pump does not provide enough pressure). Consequences may include damage to other equipment, production interruptions, or even safety risks. This information is crucial to prioritize failures and design mitigation strategies.
- 3.
- APPLICATION OF RCM - DECISION FLOWCHART FOR SELECTING THE OPTIMAL MAINTENANCE STRATEGY
- Once the failure modes and their consequences have been identified, RCM - Decision Flowchart is used to make decisions about the most appropriate type of maintenance to prevent or mitigate the failures. Options may include preventive, predictive, corrective maintenance, or even the decision to do nothing if the associated risk is low. In this phase, factors such as failure criticality, associated costs, and safety are evaluated to determine the optimal maintenance approach. The ultimate goal is to ensure that maintenance tasks are aligned with the critical functions of the system and that system reliability is maximized.
The RCM process is a structured methodology that helps ensure that an organization's assets are maintained efficiently, preventing major failures and maximizing uptime. Each stage is essential to ensure that the system operates as expected and that maintenance is data-driven, minimizing unnecessary costs and maximizing safety and reliability. It is important to promote the implementation of the RCM methodology within the SINEA organization as part of a comprehensive process to improve the Operational Reliability of the entire organization, rather than as an isolated initiative of the maintenance department. The scope of Reliability optimization techniques should not be limited to single tools, which are often associated with passing trends. The success of RCM implementation will depend fundamentally on the human resources involved, which is why special care must be taken in the induction process and in the training of the personnel who will participate in this process. It is important to bear in mind that the implementation of RCM in an organization will not yield immediate results; these can be reliably quantified and evaluated in the medium term (approximately one to three years). Therefore, this improvement process should be seen as a long-term project with a forward-looking vision [19].
4.6. Key issues related to the Life-Cycle Cost Analysis (LCCA) process
The SMI organization must include the analysis of the economic impact of the Reliability and Maintainability factors in the project engineering area, i.e. develop an integral process of analysis of the total life cycle costs from the initial development phase of an asset. The Life Cycle Cost Analysis process, to be implemented by SMI's project area, must be improved progressively, including the quantification process of the economic impact of reliability and maintainability, in order to reduce uncertainty in the decision-making process of vital areas such as: design, development, replacement and acquisition of assets. It is important to mention that, in this process, the SMI organization has a great opportunity for improvement, particularly in the area that corresponds to the analysis of the factors "Reliability and Maintainability"; from the design phase, since this aspect has a great influence on the total cost of the life cycle of the asset, and greatly influences the possible expectations to extend the useful life of the production systems at reasonable costs. Below are some recommendations for consolidating the Life-Cycle Cost Analysis (LCCA) process.
- Area assessed: 7. Life Cycle Cost Analysis Processes. Grade obtained: 1.78 = Below Average / Maximum Level = 5
The reference standards considered for the development of recommendations to help consolidate the Life Cycle Cost Analysis process are:
- -
- ISO 15663:2021 (Petroleum, petrochemical and natural gas industries - Life cycle costing)
- -
- ISO 31000 (Risk-Management-Principles-and-Guidelines)
The orientation of this section, towards the study and analysis of the Reliability factor and its impact on costs, is because a large part of the increase in total costs during the expected Life Cycle of a production system is mostly caused by the lack of foresight in the unexpected occurrence of failure events, a scenario basically caused by the lack of knowledge and the absence of a technical assessment in the design phase of the reliability-related aspects (phase 7 of the MMM). This situation results in an increase in total operating costs (costs that were not considered at the beginning), thus affecting the profitability of the production process (see Figure 4). In the process of Life Cycle Cost Analysis of an asset, there are many decisions and actions to be taken, being of particular interest for this work, those aspects related to the reliability improvement process (design quality, technology used, technical complexity, failure frequency, preventive/corrective maintenance costs, maintainability and accessibility levels), as these have a great impact on the total life cycle cost of the asset, and greatly influence the possible expectations to extend the useful life of the assets at reasonable costs.
In general terms, this stage of the MMM was precisely the one that presented the biggest gap in the AMORMS audit carried out at the SINEA PERU plant. Next, as a starting point, we propose the implementation of the LCCA Model developed by Woodward [12], which allows us to calculate the impact of failure costs in the life cycle of an industrial asset. General LCCA procedure (Woodward Model [12]):
- Establish the operational conditions of the system. Describe the modes of operation of the system (full load, half load, no load) and the production capacities to be satisfied.
- Establish the utilization factors. These factors should indicate the operating status within each mode of operation.
- Identify the different options to be evaluated. Select the existing alternatives that can meet the required production needs.
- Identify for each alternative all basic cost categories: initial investment, development, acquisition, planned maintenance, replacement.
- Determine for each alternative the Total Cost of Reliability (TCPF). Identify the main types of failures and the frequency of occurrence over time, which will be a constant value throughout the life cycle of the asset.
- Determine critical costs. Identify the cost categories with the highest impact and analyze the drivers of high costs (propose control strategies).
- Calculate all costs in present value (P) for each alternative. Define the discount factor and the expected lifetime and estimate the total present value costs for each alternative evaluated.
- Select the winning alternative. Compare the total costs of the evaluated alternatives and select the option that generates the lowest cost for the expected lifetime.
With reference to the previous scheme, the Woodward model proposes the following expression to calculate the different costs generated by an industrial asset throughout its life cycle:
CTCV(P) = ∑ IC + CO + CMP + CMC + CMM - VR
Where:
- (P) = Present value.
- CTCV(P) = Total life-cycle costs in present value (P), for a discount rate (i) and an expected lifetime (T).
- IC = Initial acquisition and installation cost, usually given in present value. CO = Operational costs, usually given as an Annualized value**.
- CMP = Preventive Maintenance Costs, usually given as an Annualized value**.
- CMC = Corrective Maintenance Costs (failure costs), usually given as an annualized value. In this case a constant failure rate is assumed, so the cost impact is the same in all years **.
- CMM = Major Maintenance Costs - Special, usually given as a Future value**.
- RV = Replacement Value, usually given as a Future value**.
** All cost categories shall be converted to present value (P) at an interest rate (i) and an expected useful life (T).
In relation to the quantification of reliability costs (CMC), the Woodward model proposes to evaluate the impact of the main failures on the cost structure of a production system, based on a simple process, which is summarized as follows: first, the most important types of failures are determined, then, each type of failure is assigned a constant value of frequency of occurrence per year (this value will not change over the expected lifetime), then, the cost impact per year generated by the failures on production, operations, environment and safety is estimated, and finally, the total cost impact of the failures for the years of expected lifetime is estimated in present value at a specific discount rate.
4.7. Key aspects related to the process of continuous improvement
The SMI organization has made efforts in recent years to consolidate a Quality Management process that guarantees continuous improvement, promoting a culture of excellence on a constant basis. SMI's continuous improvement process encourages the implementation of action plans that generate changes adapted to the real needs of the plant (tailor-made, rather than large-scale innovations, promoting and introducing in an orderly manner, the path towards the use of better production tools). The continuous improvement process involves all plant personnel and the company's management directly influences the implementation of the recommendations generated from the use of the different optimization methodologies applied in the areas of maintenance, reliability and risk: RCA, RCM, LEAN, SIX SIGMA RAMS, etc.). Management leads by example and sufficiently motivates all SINEA PERU Plant personnel. Some recommendations to consolidate the continuous improvement process:
- Area assessed 8: Review and continuous improvement processes. Grade obtained: 2.18 = Average / Maximum level = 5
The reference standards considered for the development of the recommendations that help to consolidate the Continuous Improvement process are:
- -
- EN 16646:2014 (Maintenance within physical asset management)
- -
- ISO 55001:2014 (Asset Management - Management Systems - Requirements)
- -
- ISO 31000 (Risk-Management-Principles-and-Guidelines)
The continuous improvement process proposed in phase 8 of the MMM will be possible by using emerging techniques and technologies in areas that are considered to have a high impact because of the studies carried out in previous phases of our management process [17] and [20]. Regarding the application of new maintenance technologies, the concepts of "maintenance 4.0", "e-maintenance", "e-manufacturing", among others, emerge as components of the "industry 4.0" concept, which promotes the benefit of new information and communication technologies to create corporate and distributed multi-user environments. "Maintenance 4.0 can be defined as a maintenance support that includes resources, services and management necessary to enable the execution of a proactive maintenance decision making process that can be consolidated by improving the use of SAP PM - integrating all maintenance management process information within SAP PM. This part will allow the future consolidation of the use of Industrial 4.0 tools applied to the maintenance area. This process will allow to include Internet technologies (i.e., ICT, Web-based, wireless, infotronic technologies) and e-maintenance activities (operations and processes) such as e-monitoring, e-diagnosis, e-prognosis, which can help to consolidate the SAP-HANA 4.0 version (version of SAP that integrates various Industry 4.0 tools).
In addition to new technologies for maintenance, the involvement of maintenance people in the improvement process will be a critical factor for success. Of course, they will require the highest levels of knowledge, experience and education (training), but at the same time, simple techniques that allow the involvement of operators in the performance of maintenance tasks will be extremely important to achieve the highest levels of maintenance quality and overall equipment efficiency. In the current scenario, the effective use and analysis of emerging technologies under the Industry 4.0 approach can exponentially improve industrial management processes. The great challenge of an integrated Maintenance model is to provide a way to optimize the use of Industry 4.0 tools (IOT, ML, NN, DT, etc.) with the objectives of: improving technical performance and helping to maximize the profitability of assets throughout their lifecycle (see Figure 5. A functional perspective of the new digital framework for Intelligent Asset Management, [20]).
It is important to promote continuous improvement by empowering all of the organization’s collaborators and providing them with simple management tools, as it is necessary to consolidate the basic operations and maintenance processes, which allow personnel at all levels of the organization to be involved in carrying out the different activities related to Asset Management. Within the continuous improvement process, the repercussions of the incorporation of the different techniques and technologies of Industry 4.0 must be analyzed: "e-maintenance"-"e-manufacturing", new information and communication technologies to create corporate and distributed multi-user environments, "internet of the things", "e-monitoring", "e-diagnosis", "e-prognosis", "Big data", "Digital twins", etc..., to strengthen the Asset Management System to be developed within the organization and thus achieve World Class standards demanded by the requirements of the ISO 55001 standard [21].
The following table, presents an estimate of the possible technical and economic improvements to be achieved in the next two years, based on the implementation of the recommendations proposed from the analysis of the AMORMS results in the SINEA organization (see Table 4). The indicators considered for evaluating the improvements of the recommended action plans are those proposed in section 4.2: Key Issues Related to SAP PM Maintenance Support Software. The projected indicator values for 2025 were calculated conservatively, taking into account prior experiences with MMM implementations in other industrial organizations [15], [17], [22], [23], [24] and [25].
5. Conclusions
Based on the gaps identified in the AMORMS audit, the following are some key recommendations to consolidate phase 8 of the CMM (continuous improvement process) at the SINEA PERU plant:
- -
- Adjust the process of measuring the execution of the recommendations obtained from the criticality analysis process, promoting the effective implementation of the proposed actions based on the application of the improvement methods: RCA (Root Cause Analysis) and RCM (Reliability Centered Maintenance). Develop within SAP PM, the indicator "CUF: Costs of unavailability due to failures" (frequency of failures (failures/year) x consequences ($/failures) = $/year), at the level of equipment and failure modes.
- -
- To consolidate the profile of the Integral Reliability Engineer, who can facilitate and develop applications of the following methodologies: CA: Criticality Analysis, RCA: Root Cause Analysis, TPM: Total Productive Maintenance, RCM: Reliability Centered Maintenance, CRBA: Cost Risk Benefit Analysis, LCC: Life Cycle Cost.
- -
- Update and review in detail the actual impact of maintenance and inspection plans for critical systems. Now, the maintenance plans are based on the manufacturer's recommendations and on the experience of the SMI/SINEA/PERU organization’s maintenance and operations personnel. It is time to update the maintenance and inspection plans (taking advantage of the use of RCA and RCM methodologies). Initially consider critical and medium criticality failure modes and apply cost risk benefit optimization techniques to adjust maintenance and inspection frequencies (the CUF indicator can help in this process).
- -
- Quantify the impact of maintenance and reliability improvement actions in terms of financial indicators. It is important to consider that the continuous improvement process encompasses action plans throughout all phases of the life cycle of physical assets (from conceptual engineering, design, selection, purchase, installation, operation, maintenance and decommissioning).
- -
- Consolidate a process in SAP PM that integrates technical indicators with cost risk benefit optimization indicators at the maintainable item level (providing the scenario to analyze the economic impact that failures could generate in the medium and long term within the operational process).
- -
- Develop a comprehensive process to evaluate systemic indicators of Reliability, Maintainability and Availability and analyze the economic impact of these indicators on the total life cycle costs of critical assets.
- -
- Promote that the Reliability Engineering Management applies in an orderly manner the Maintenance and Reliability Management Model (MMM), explained in Figure 3, orientate the roles and functions of the Reliability personnel, to cover the 8 phases of the MMM, having as final objective to help maximize the value of SMI/SINEA/PERU's assets. To cover this recommendation, "the human resources management together with the Asset Integrity Management", should evaluate the possibility of executing a pilot project to implement the MMM, covering the 8 phases of the model (estimated execution time 2- 3 years).
In summary, to guarantee the success of the improvement processes in the areas of Reliability and Maintenance, integrated to an Asset Management process, it is important that the management of the organization: SMI/SINEA/PERU, bear in mind the following considerations:
- a)
- To frame the use of the different Reliability and Maintenance optimization methodologies within an integral process of improvement of the Asset Management of the whole organization, and not as an isolated initiative of the maintenance area.
- b)
- The success of the implementation of Reliability and Maintenance optimization methodologies will depend fundamentally on the human resources involved, which is why special care must be taken in the induction process and in the training of the personnel who will participate in this process. "Assets are designed to do things, people make things happen. Technical aspects alone are not enough to reach the full potential of organizations. It is necessary to strengthen the human aspects: human reliability, motivation, training, natural work teams, communication, etc.
- c)
- The process of improving maintenance and reliability management should not be limited to mere fads, the organization should turn the process of implementing reliability and maintenance techniques into routine working practices that help to optimize decision making throughout the life cycle of industrial assets.
Finally, one of the main advantages of MMM is that it provides a structure aligned to an Asset Management process and an effective follow-up process for all the recommendations proposed from the implementation of maintenance and reliability improvement tools, involving all those involved in the design, installation, operation, maintenance and retirement of assets throughout their life cycle. MMM provides short-, medium- and long-term results, with greater safety for people, greater harmony with the environment and a better cost-benefit ratio for the asset owner.
Author Contributions
Conceptualization, C.P. and A.A.; methodology, C.M and F.P.; validation, C.P., F.P. and J.P.; formal analysis, A.A.; investigation, C.M.; resources, P.D.; data curation, J.P.; writing—original draft preparation, C.P.; writing—review and editing, V.G.P.; visualization, A.A.; supervision, V.G.P and C.P.; project administration, C.P. All authors have read and agreed to the published version of the manuscript.
Funding
This research received no external funding.
Institutional Review Board Statement
Not applicable.
Informed Consent Statement
Not applicable.
Data Availability Statement
Data is contained within the article.
Acknowledgments
Not applicable.
Conflicts of Interest
The authors declare no conflicts of interest.
References
- Crespo Márquez, A. (2007). The maintenance management framework. Models and methods for complex systems maintenance. London: Springer Verlag.
- Woodhouse, J. Standards in asset management: PAS 55 to ISO 55000. Infrastructure Asset Management 2014, 1, 1–3. [Google Scholar] [CrossRef]
- Parra, C., and Crespo, A. (2015). Ingeniería de Mantenimiento y Fiabilidad aplicada en la Gestión de Activos. Segunda edición. INGEMAN, Escuela Superior de Ingenieros Industriales, Sevilla, España. [CrossRef]
- Crespo Márquez, P. Moreu de León, J. F. Gómez Fernández, C. Parra Márquez and M. López Campos. “The maintenance management framework”. Journal of Quality in Maintenance Engineering 2009, 15, 167–178. [Google Scholar] [CrossRef]
- Campbell JD, Jardine AKS. (2001). Maintenance excellence. New York: Marcel Dekker.
- Kaplan RS, Norton DP. The Balanced Scorecard - measures that drive performance. Harv. Bus. Rev. 1992, 70, 71–9.
- Woodhouse, J. (1996). Managing Industrial Risk. Chapman Hill Inc, London.
- Prasad Mishra, R.; Anand, D.; Kodali, R. Development of a framework for world-class maintenance systems. J. Adv. Manuf. Syst. 2006, 5, 141–165. [Google Scholar] [CrossRef]
- Roda, I.; Macchi, M. A framework to embed Asset Management in production companies. Proc. Inst. Mech. Eng. Part O: J. Risk Reliab. 2018, 232, 368–378. [Google Scholar] [CrossRef]
- Reyes-Picknell, J. (2007). An introduction to PAS 55 - Optimal Management of Physical Assets. Works Management Tutorial, London.
- Pintelon, L.M.; Gelders, L.F. Maintenance management decision making. European Journal of Operational Research 1992, 58, 301–317. [Google Scholar] [CrossRef]
- Woodward, D.G. Life Cycle Costing - Theory, Information Acquisition and Application. Int. J. Proj. Manag. 1997, 15, 335–344. [Google Scholar] [CrossRef]
- Van der Duyn Schouten, F.A.; Vanneste, S.G. Maintenance optimization of a production system with buffer capacity. Eur. J. Oper. Res. 1995, 82, 323–338. [Google Scholar] [CrossRef]
- González, J. (2004). Auditoría del Mantenimiento e Indicadores de Gestión. Editorial Fundación Confemetal, Madrid, España.
- Parra-Marquez, C., Viveros-Gunckel, P., Kristjanpoller-Rodriguez, F., Crespo-Marquez, A., Gonzalez-prida-Diaz, V. “AUDIT MODELS FOR ASSET MANAGEMENT, MAINTENANCE AND RELIABILITY PROCESSES. CASE STUDY: ELECTRICITY TRANSMISSION SECTOR”. DYNA Management, 2020, 8. [14 p.]. [CrossRef]
- Crespo Márquez, A. et al. (2020). “Defining Asset Health Indicators (AHI) to Support Complex Assets Maintenance and Replacement Strategies. A Generic Procedure to Assess Assets Deterioration”. In: Crespo Márquez, A., Macchi, M., Parlikad, A. (eds) Value Based and Intelligent Asset Management. Springer, Cham. [CrossRef]
- Serra J., De la Fuente A., Crespo A., Sola A., Guillén A., Candón E., Martínez-Galán P. (2019). “A model for lifecycle cost calculation based on asset health index”. In: International Conference on Smart Infrastructure and Construction 2019 (ICSIC), pp 91–98. ISBN 978-0-7277-6466-9. https://www.icevirtuallibrary.com/. [CrossRef]
- Parra C., González-Prida V., Candón E., De la Fuente A., Martínez-Galán P., Crespo A. (2021). “Integration of Asset Management Standard ISO 55000 with a Maintenance Management Model”. In: Crespo Márquez A., Komljenovic D., Amadi-Echendu J. (eds) 14th WCEAM Proceedings. WCEAM 2019. Lecture Notes in Mechanical Engineering. Springer, Cham. [CrossRef]
- Moubray, J. (1997). Reliability-Centered Maintenance (2nd ed.). Oxford: Butterworth-Heinemann.
- Crespo Márquez, A. (2022). “Asset Health Indexing and Life Cycle Costing. In: Digital Maintenance Management”. Springer Series in Reliability Engineering. Springer, Cham. [CrossRef]
- De la Fuente A, Crespo A, Sola A, Guillén A, Gómez J, Amadi-Echendu JE. (2021). “Planning major overhaul and equipment renovation based on asset criticality and health index”. In: Crespo Márquez A, Komljenovic D, Amadi-Echendu J (eds) 14th WCEAM proceedings, WCEAM 2019. Lecture notes in mechanical engineering. Springer, Cham. [CrossRef]
- Roda, I.; Macchi, M. A framework to embed Asset Management in production companies. Proc. Inst. Mech. Eng. Part O J. Risk Reliab. 2018, 232, 368–378. [Google Scholar] [CrossRef]
- Carnero, M.C. Auditing model for the introduction of computerized maintenance management systems. Int. J. Data Sci. 2015, 1, 17–41. [Google Scholar] [CrossRef]
- Parra, C., and Crespo, A. (2015). Review of the basic processes of a Maintenance and Reliability Management Model. Project: Design and Construction of the Third Set of Locks in the ACP (AUTORIDAD DEL CANAL DE PANAMÁ). Edit IngeCon – INGEMAN - MWH GLOBAL, Panamá. [CrossRef]
- Parra, C., Pineda, G., López, F., and Crespo, A. (2013). Modelo de Gestión del Mantenimiento (MGM) alineado a un proceso de Gestión de Activos. Área de estudio: Compresión y Transporte de Gas. Editado por INGECON, Colombia. [CrossRef]
- Internet: BSI. British Standard Institution at http://www.bsigroup.com/ [accessed September 2022].
- Internet: IAM. Institute of Asset Management at http://www.theiam.org/ [accessed September 2022].
- Internet: TWPL. The Woodhouse Partnership at http://www.twpl.com/ [accessed October 2018].
- UNE EN 16646 (2014): Maintenance in Physical Asset Management.
- UNE EN 13306 (2002): Maintenance Terminology.
- PAS 55-1, 2004. Asset Management. Specification for the optimized management of physical infrastructure assets. BSI: United Kingdom.
- PAS 55-2, 2004. Asset Management. Guidelines for the application of PAS 55-1. BSI: United Kingdom.
- PAS 55-1, 2008. Asset management. Specification for the optimized management of physical assets. BSI: United Kingdom.
- PAS 55-2, 2008. Asset management. Guidelines for application of PAS 55-1. BSI: United Kingdom.
- ISO 55000: 2014, Asset management - Overview, principles and terminology.
- ISO 55001: 2014, Asset management - Management systems - Requirements.
- ISO 55002: 2014, Asset management - Management systems - Guidelines on the application of ISO 55001.
Figure 1.
Maintenance Management Model (MMM) (adapted from [18]).
Figure 1.
Maintenance Management Model (MMM) (adapted from [18]).
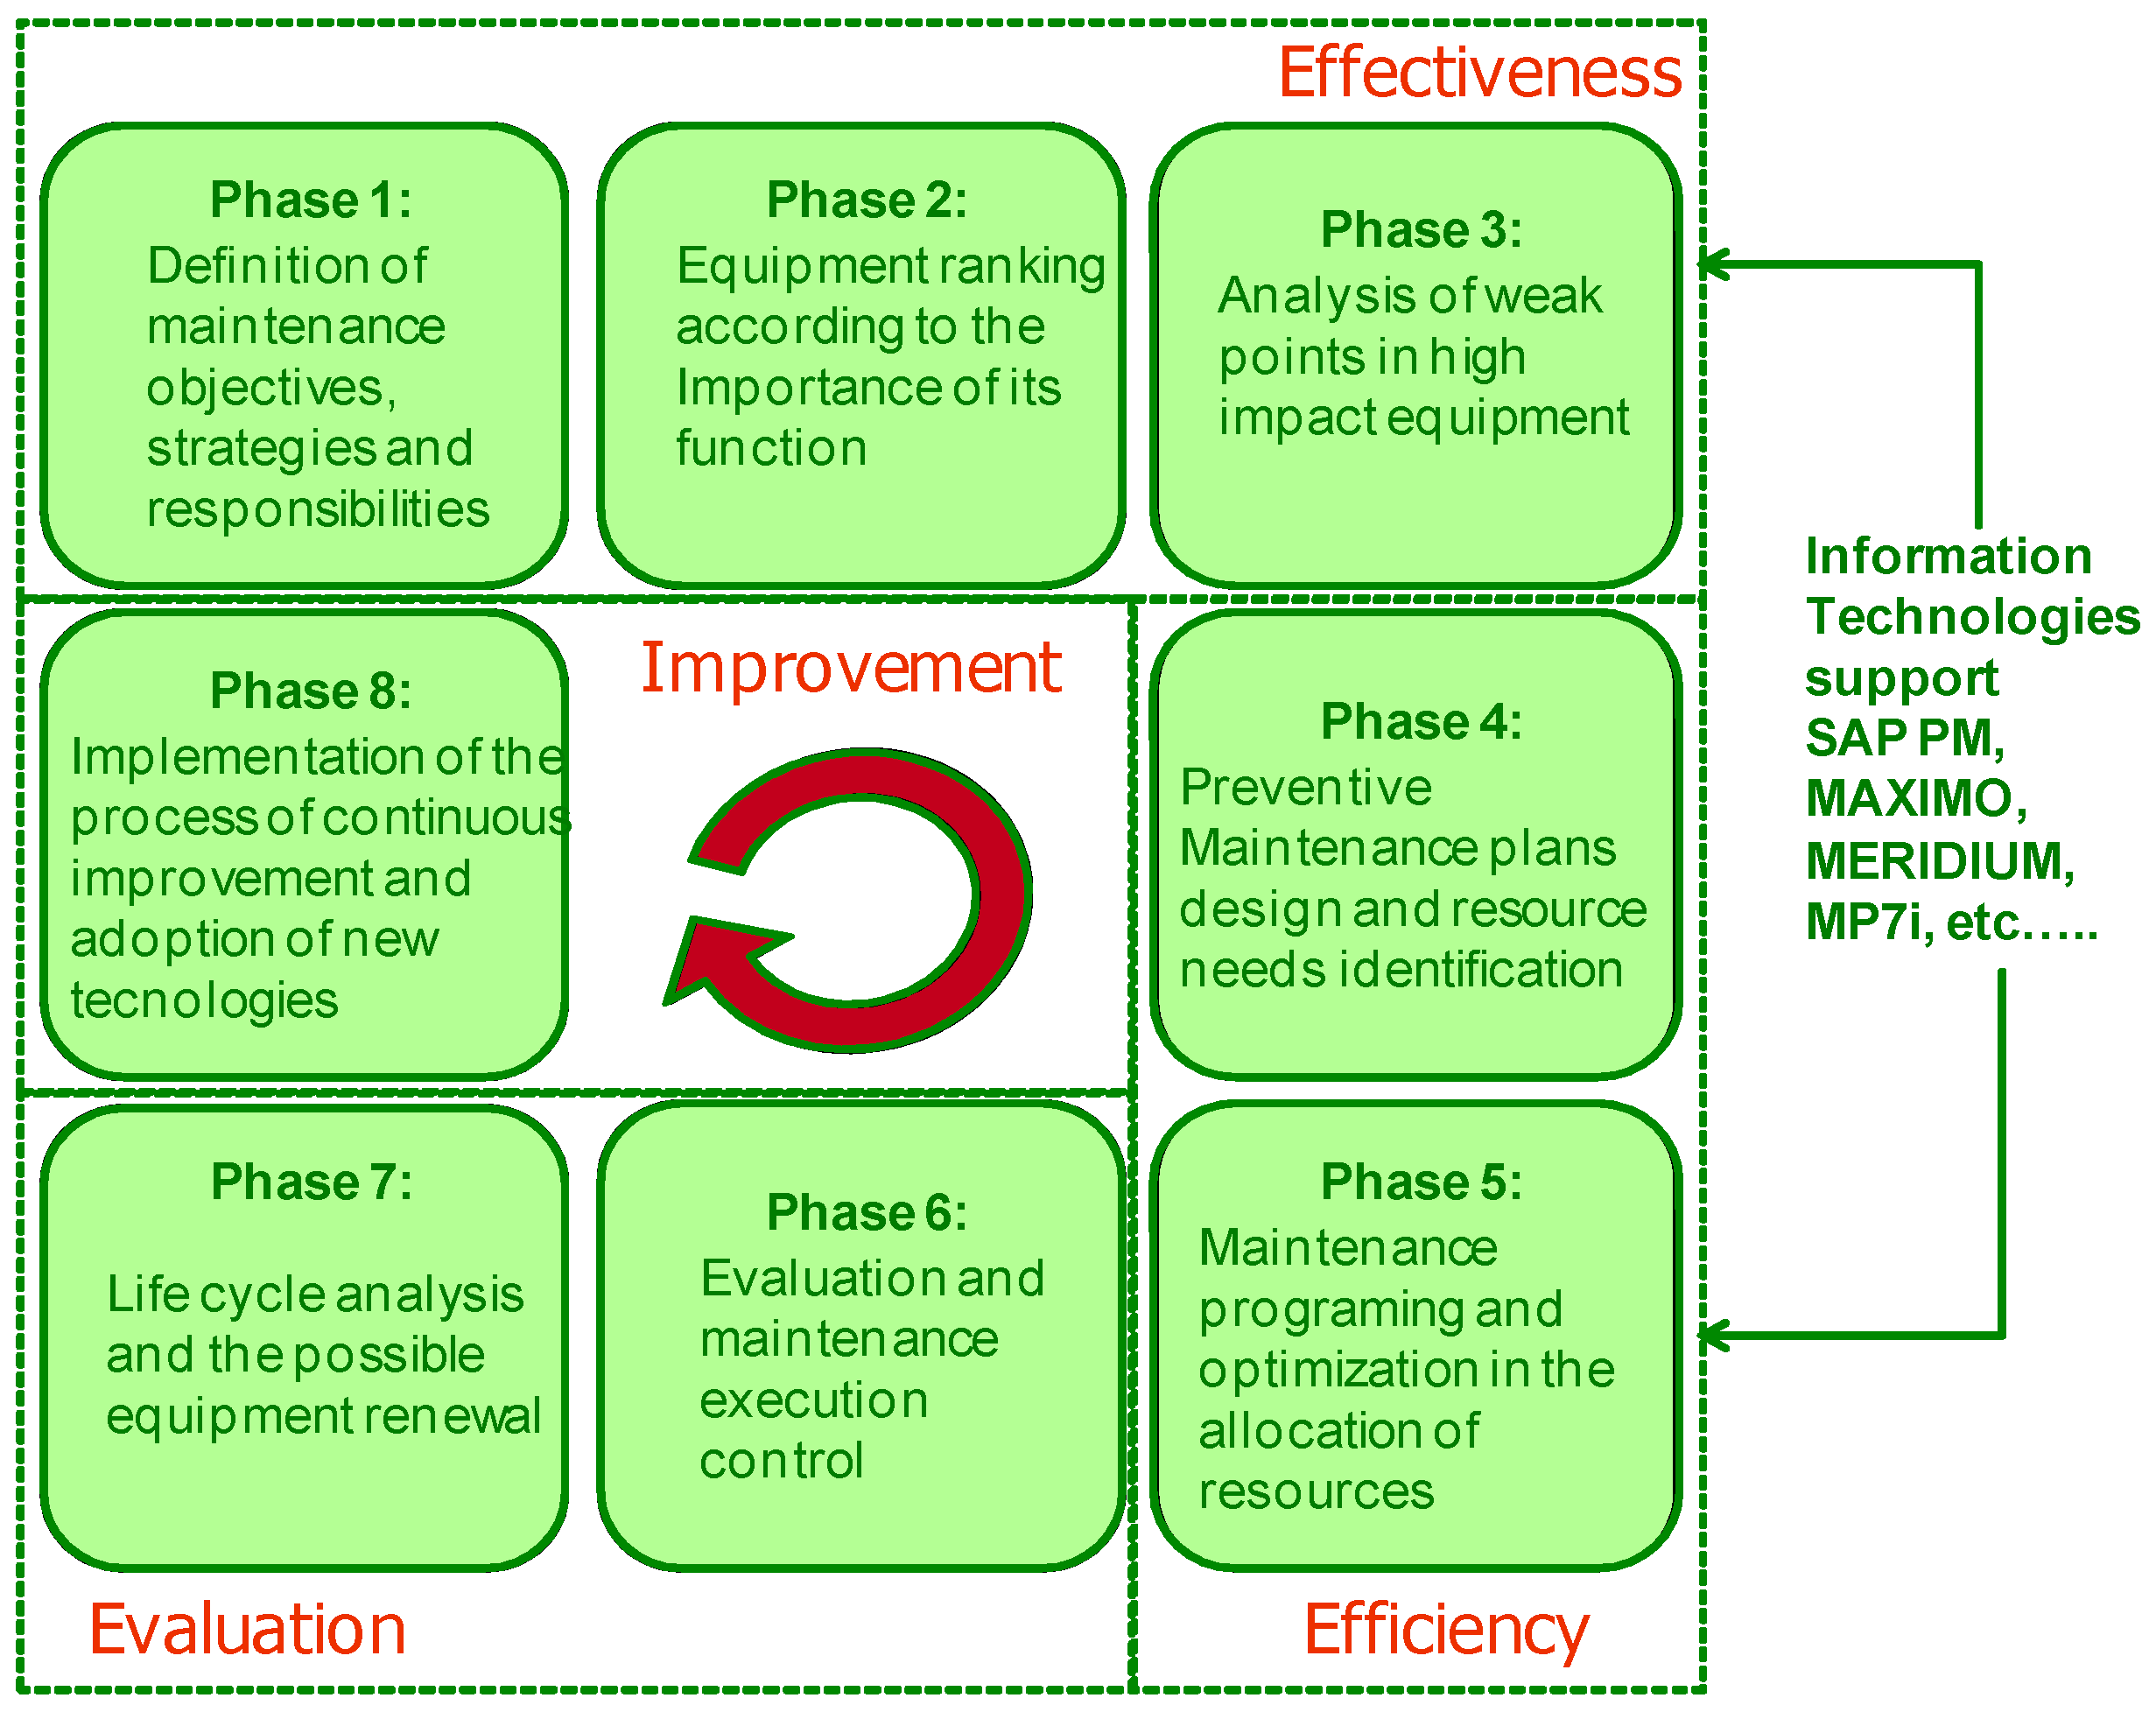
Figure 2.
Taxonomy proposal for hierarchy the different levels of physical assets based on ISO 14224 Standard.
Figure 2.
Taxonomy proposal for hierarchy the different levels of physical assets based on ISO 14224 Standard.
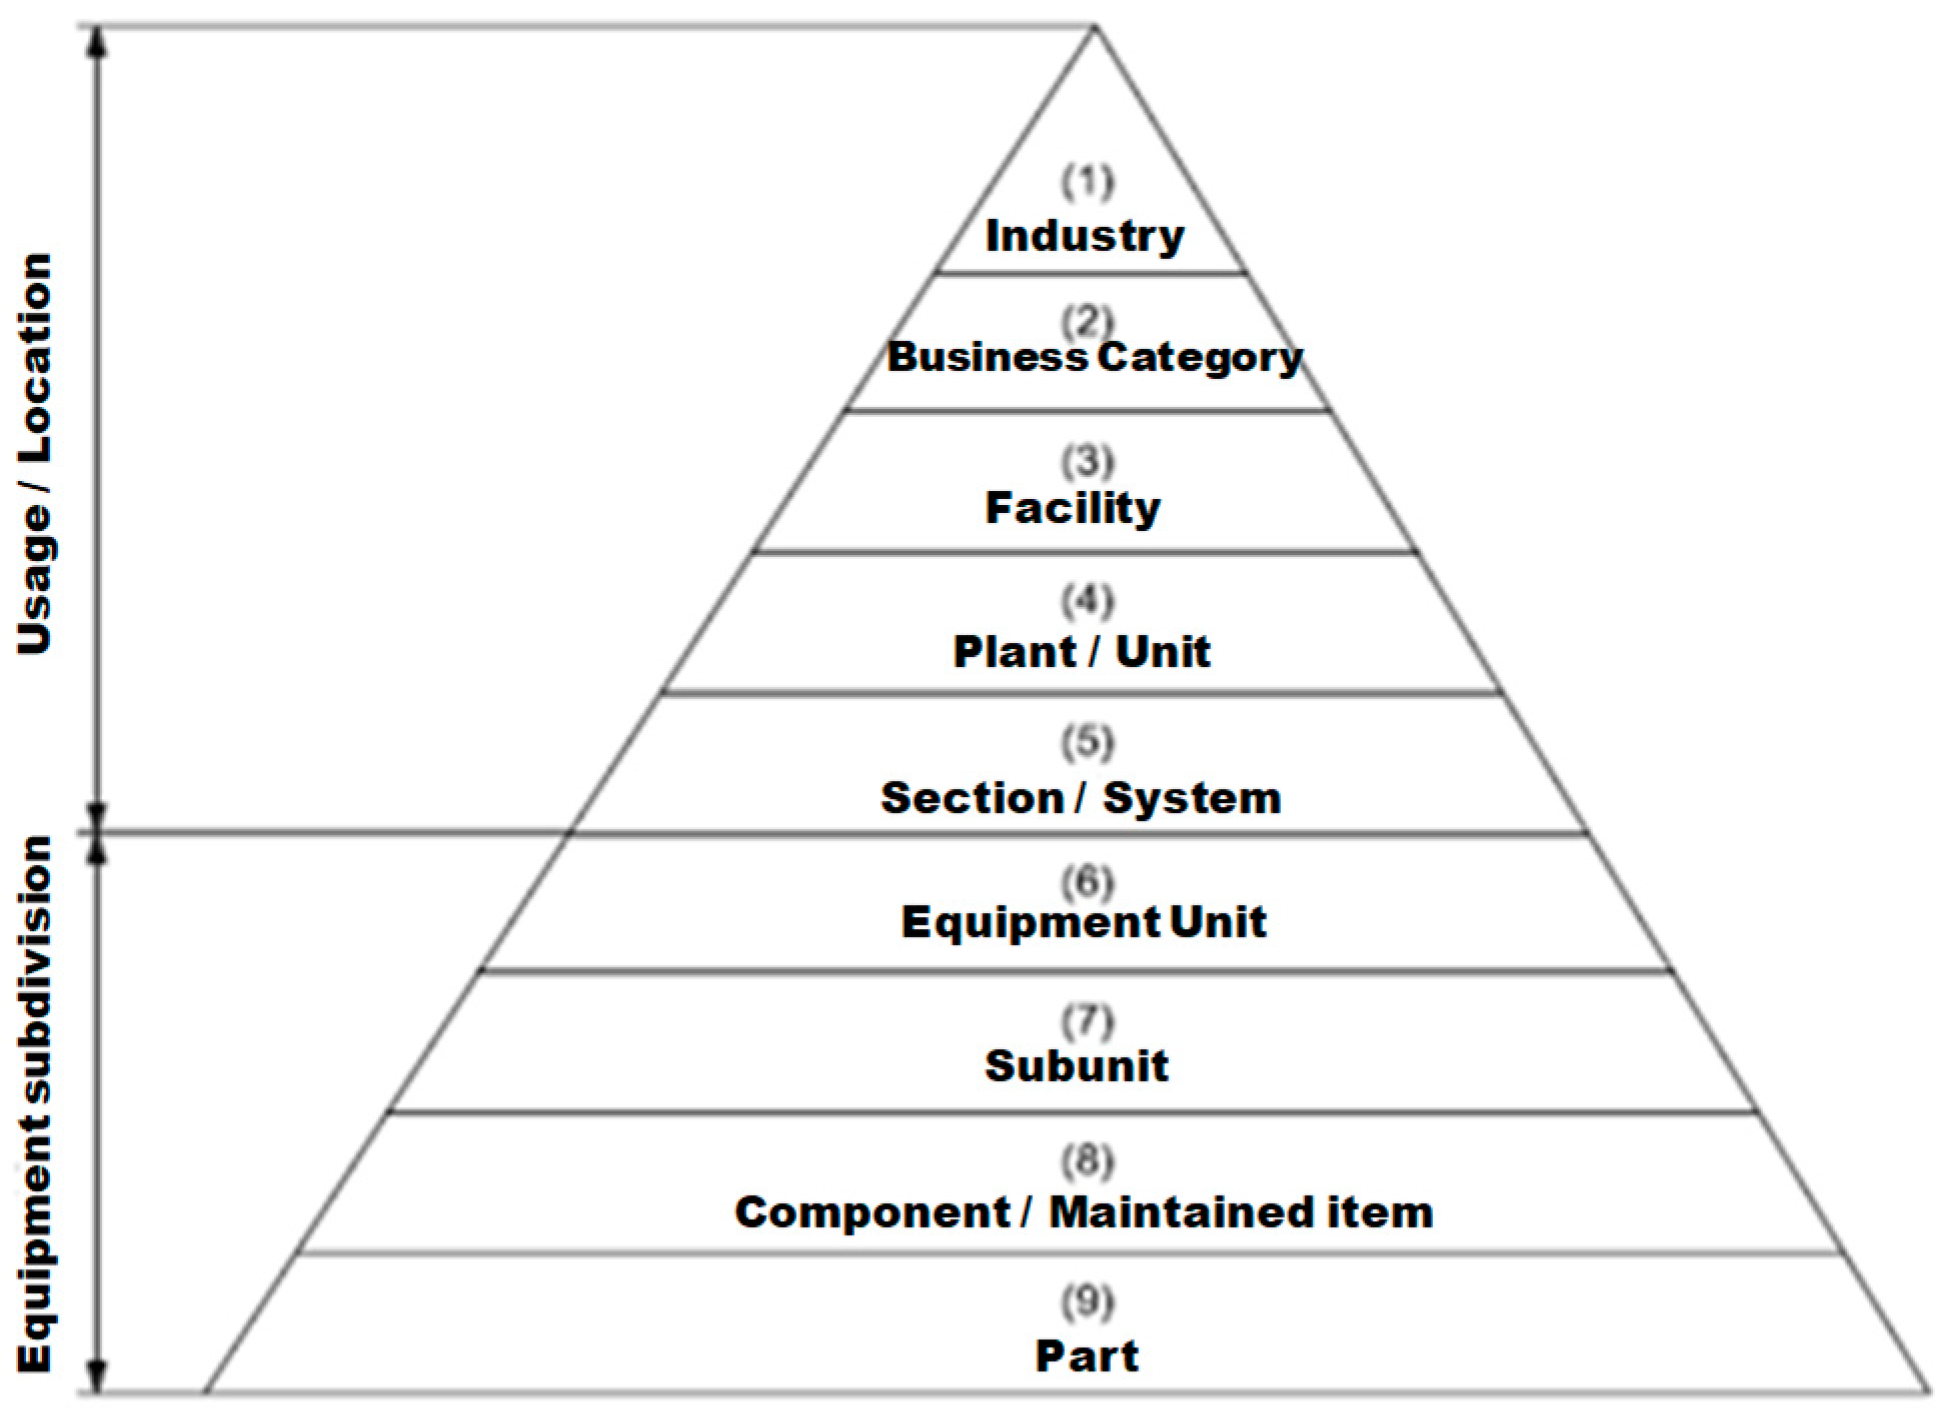
Figure 3.
Qualitative Risk Criticality Matrix (MCCR) [3].
Figure 3.
Qualitative Risk Criticality Matrix (MCCR) [3].

Figure 4.
Life Cycle Cost Variation [12].
Figure 4.
Life Cycle Cost Variation [12].
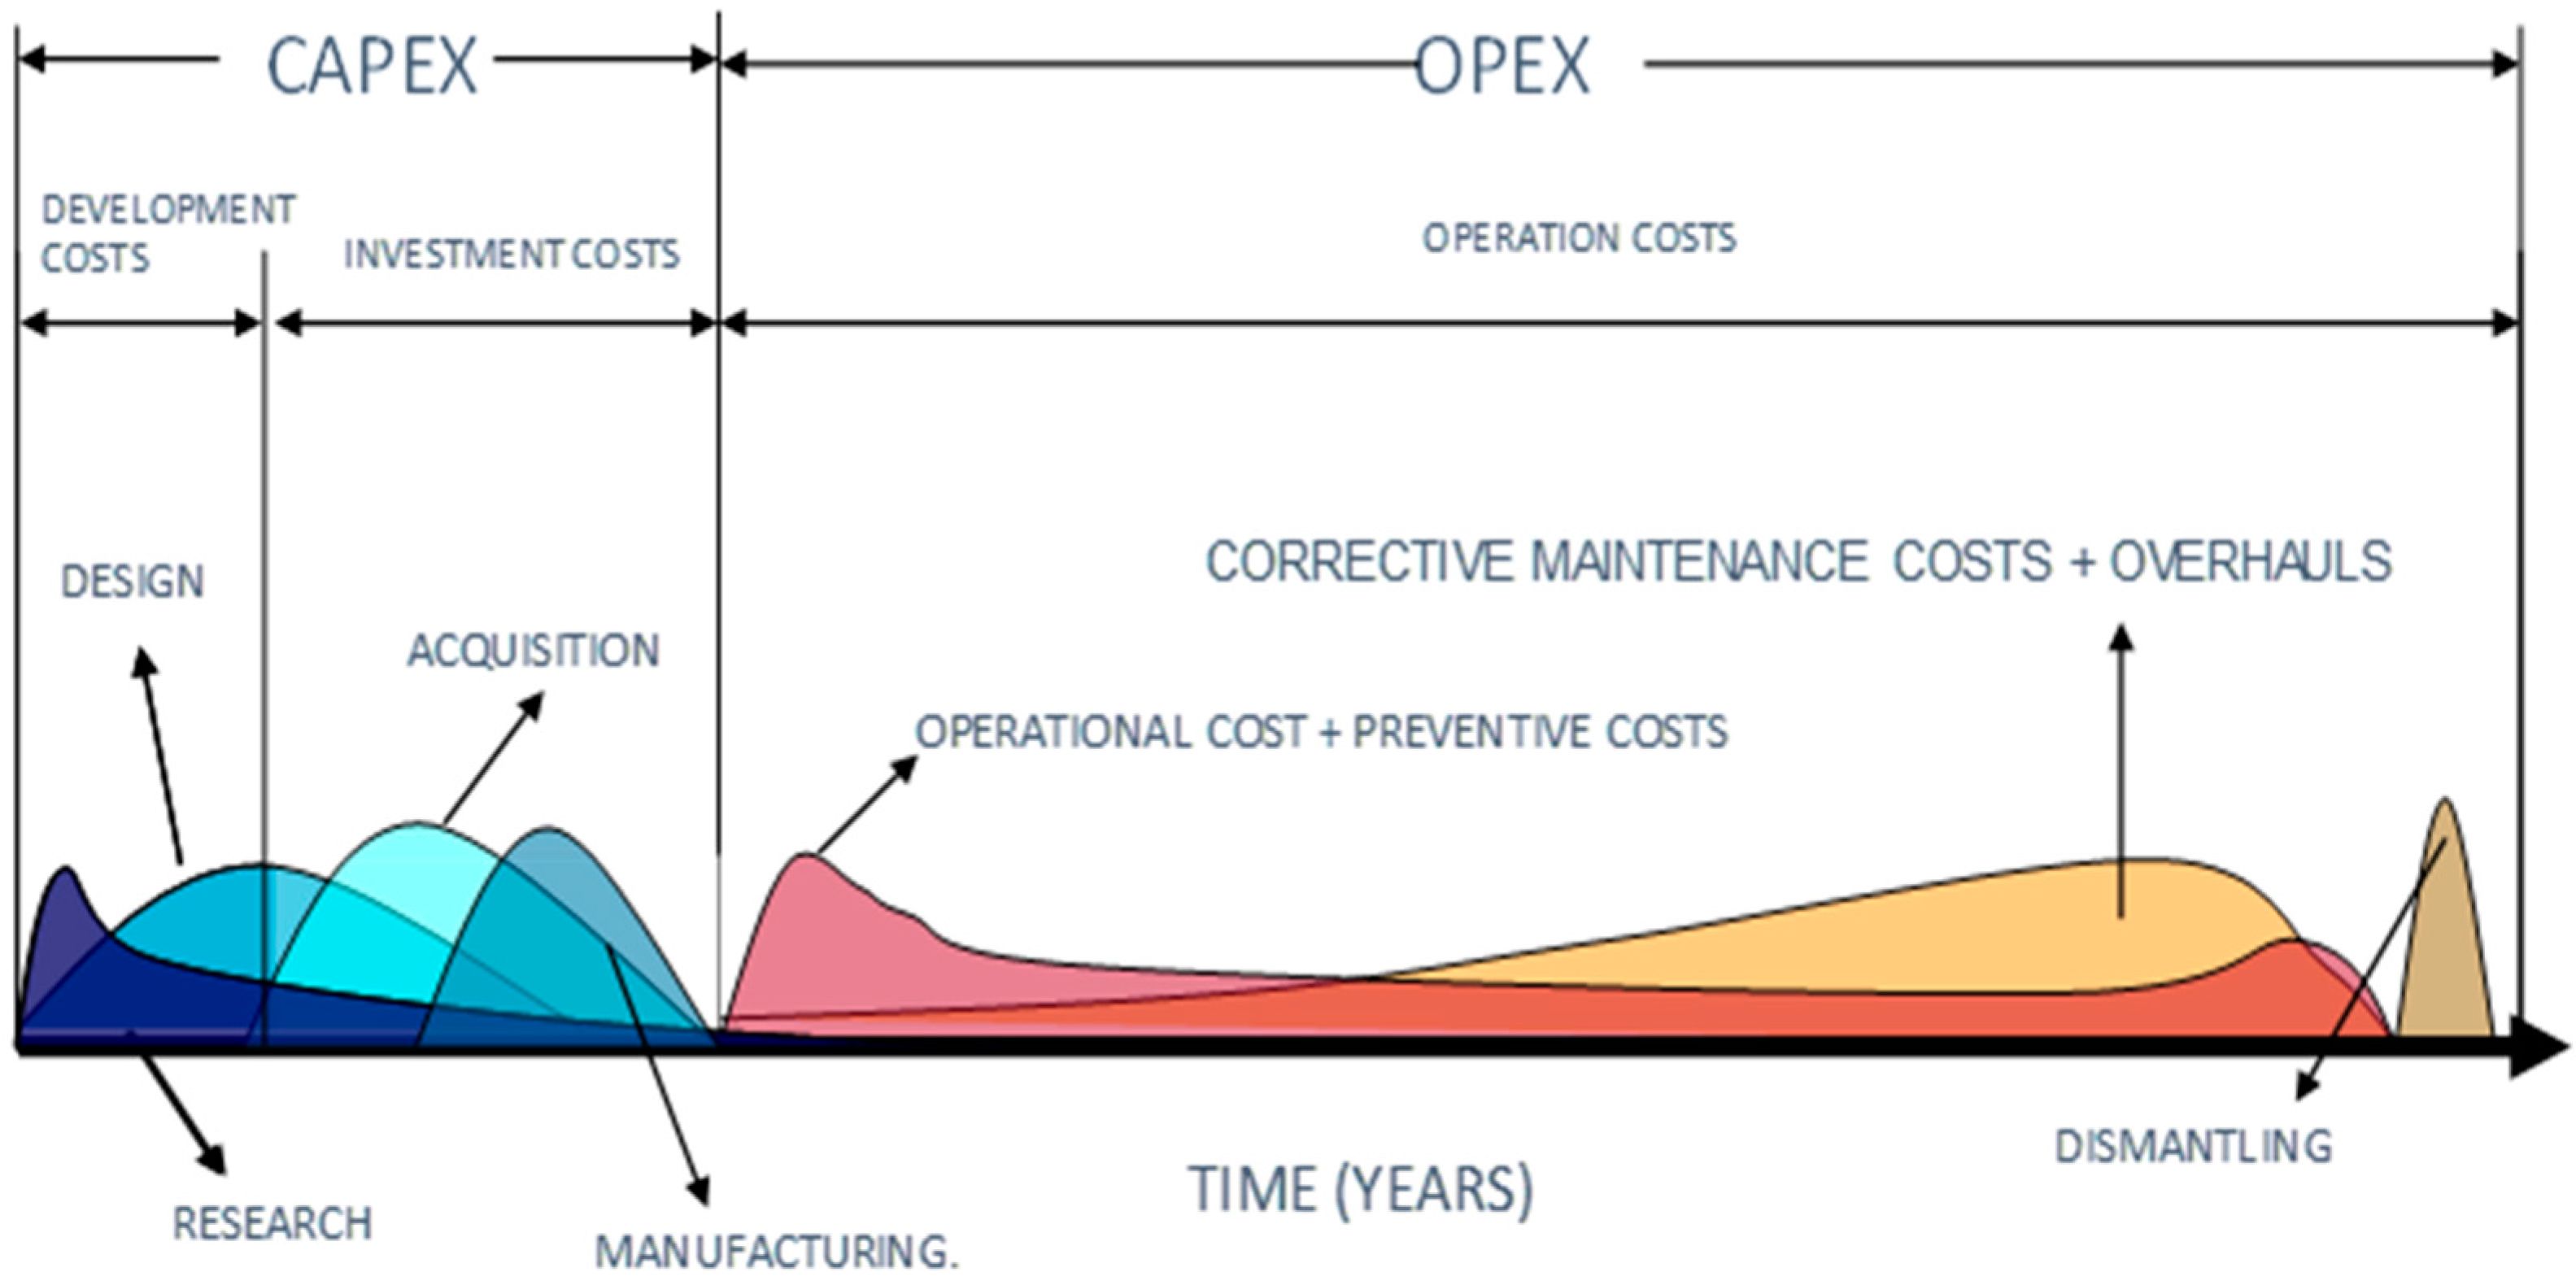
Figure 5.
A functional perspective of the new digital framework for Smart Asset Management [20].
Figure 5.
A functional perspective of the new digital framework for Smart Asset Management [20].
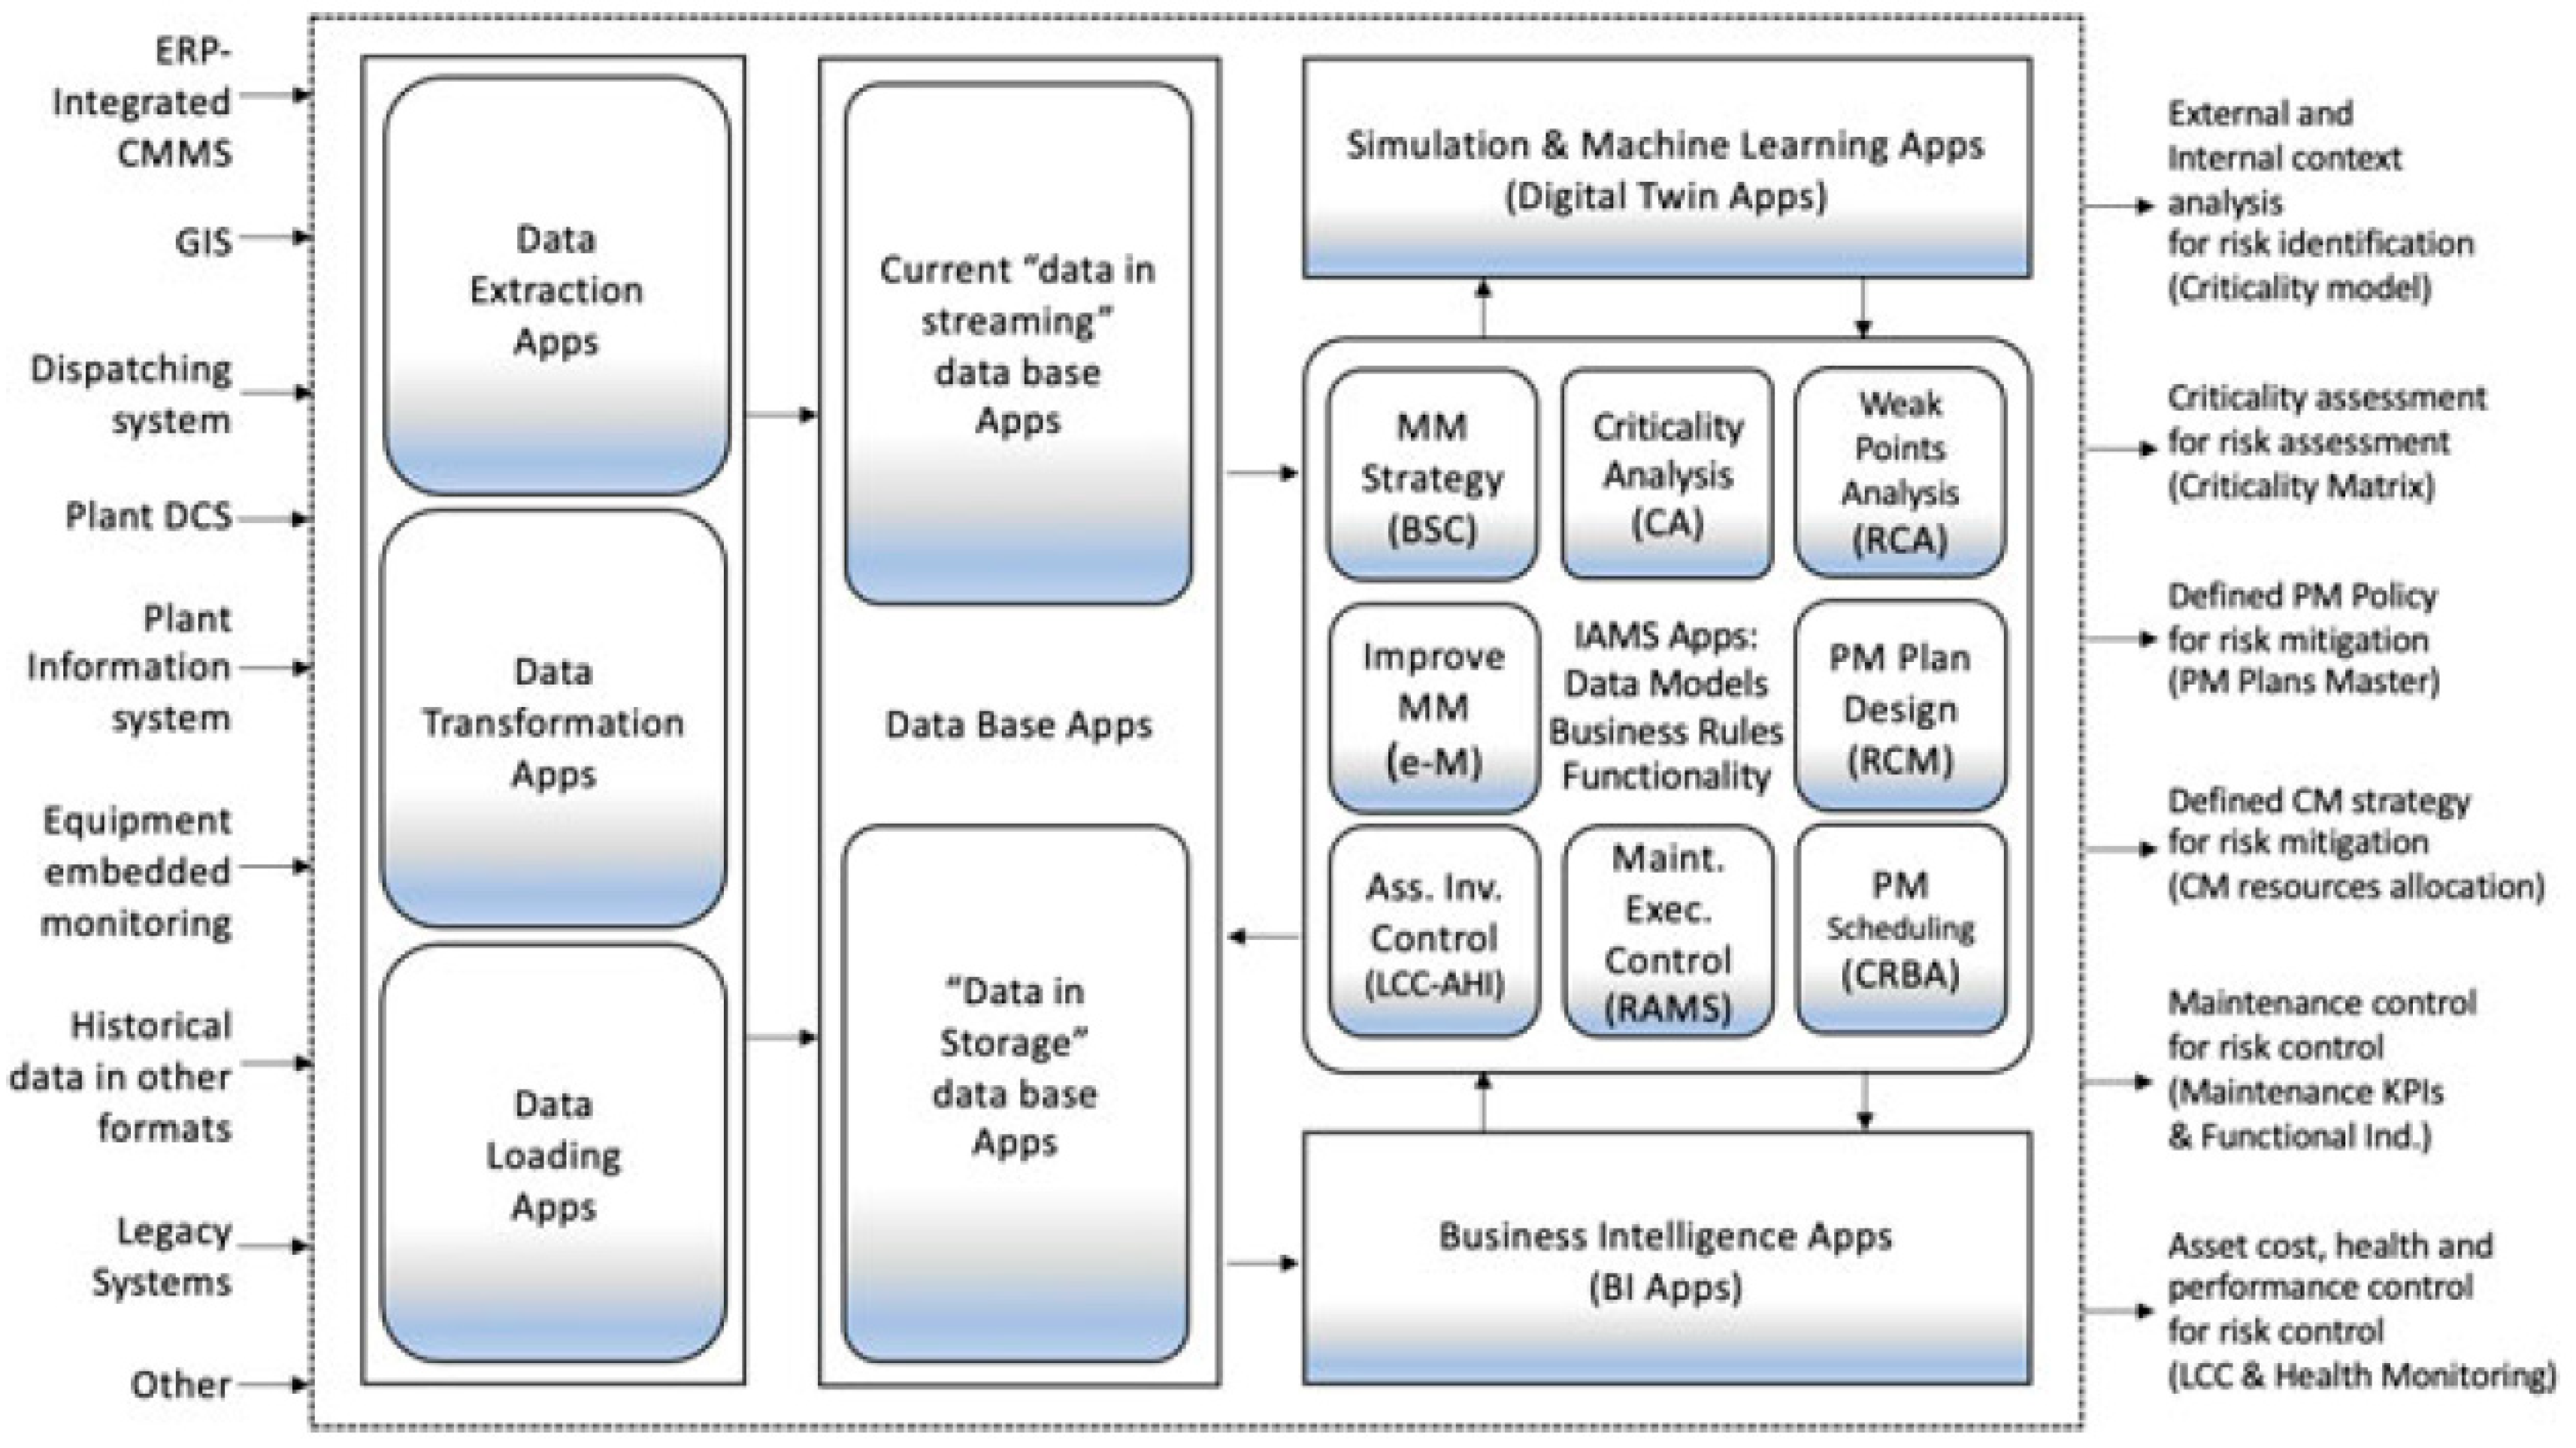

Table 1.
AMORMS Audit Assessment Scale.
| AMORMS audit rating scale | |
| 0 - 1 | Very poor process |
| 1 - 2 | Below-average process |
| 2 - 3 | Average standard process |
| 3 - 4 | Process with very good practices |
| 4 - 5 | World Class Process |
Table 2.
AMORMS Summary results.
| AMORMS Results | |
| 2.16 | Asset Management, Business Objectives (KPIS) and support organization |
| 2.23 | Risk-based Ranking Models (criticality of equipment) |
| 1.96 | Problem analysis (fault management) |
| 1.87 | Programming and planning processes |
| 2.19 | Resource allocation, IT and logistical support processes |
| 1.89 | Control processes and analysis of technical indicatorsRAM |
| 1.78 | Life cycle cost analysis process |
| 2.18 | Review and continuous improvement processes |
Table 4.
Estimated improvements from the implementation of the MMM.
| Indicators Technicals/Economics |
Before the implementation of the MMM (2023) | After the implementation of the MMM (2025) |
| MTTF: mean time to failure, hours | 210 hours | 260 hours |
| FF: failure frequency, failures/year | 44 failures/year | 33 failures/year |
| MDT: mean down time, hours/failure | 16 hours/failure | 12 hours/failure |
| A: operational availability, % | 92,9% | 95,5% |
| TDT: total down time/year, hours/year | 704 hours/year | 396 hours/year |
| CM/CP: maintenance costs/production costs, % | 27% | 21% |
| CUF: opportunity costs due to unavailability due to failures, dollars/year | 1.200 dollars/hour x 704 hours/year: 844.800 dollars/year |
1.200 dollars/hour x 396 hours/year: 369.600 dollars/year |
| Project costs/year, dollars/year | 83.000 dollars/year | |
| Savings due to decrease in CUF, dollars/year | (844.800 - 369.600 - 83.000) dollars/year = 392.200 dollars/year |
Disclaimer/Publisher’s Note: The statements, opinions and data contained in all publications are solely those of the individual author(s) and contributor(s) and not of MDPI and/or the editor(s). MDPI and/or the editor(s) disclaim responsibility for any injury to people or property resulting from any ideas, methods, instructions or products referred to in the content. |
© 2024 by the authors. Licensee MDPI, Basel, Switzerland. This article is an open access article distributed under the terms and conditions of the Creative Commons Attribution (CC BY) license (http://creativecommons.org/licenses/by/4.0/).
Copyright: This open access article is published under a Creative Commons CC BY 4.0 license, which permit the free download, distribution, and reuse, provided that the author and preprint are cited in any reuse.


