
Submitted:
27 October 2024
Posted:
28 October 2024
You are already at the latest version
Abstract
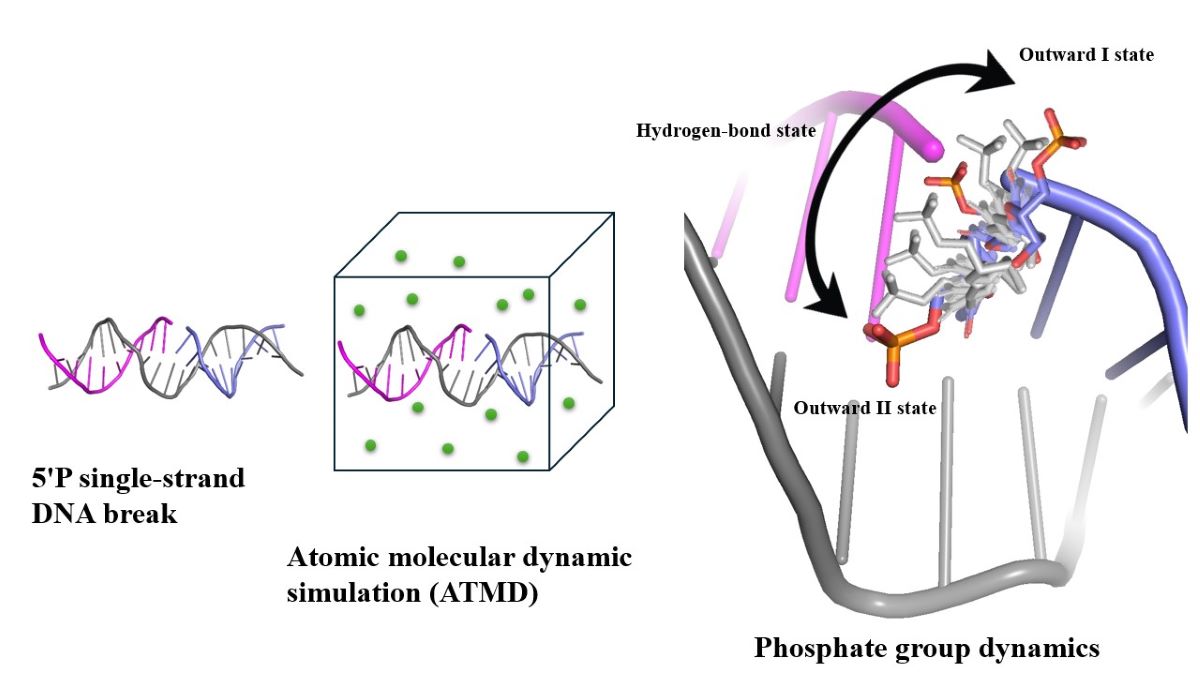
Single-stranded breaks (SSBs) are the most frequent DNA lesions threatening genomic integrity-understanding how DNA sensor proteins recognize certain SSB types is crucial for studies of the DNA repair pathways. During repair of damaged DNA the final SSB that is to be ligated contains a 5'-phosphorylated end. The present work employed molecular simulation (MD) of DNA with a phosphorylated break in solution to address multiple questions regarding the dynamics of the break site. How does the 5'-phosphate group behave before it initiates a connection with other biomolecules? What is the conformation of the SSB site when it is likely to be recognized by DNA repair factors once the DNA repair response is triggered? And how is the structure and dynamics of DNA affected by the presence of a break? For this purpose, a series of MD simulations of 20 base pair DNAs, each with either a pyrimidine-based or purine-based break, were completed at a combined length of over 20,000 ns simulation time and compared with intact DNA of the same sequence. An analysis of the DNA forms, translational and orientational helical parameters, local break site stiffness, bending angles, 5’-phosphate group orientation dynamics, and the effects of the protonation state of the break site phosphate group provides insights into the mechanism for the break site recognition.
Keywords:
DNA
; SSB
; molecular dynamics simulation
; helical parameters
; 5’ phosphate orientational dynamics
; break site recognition
Introduction
Deoxyribonucleic acid (DNA) is a macromolecular, double-stranded (ds), helical structure that serves as the primary hereditary material in all living organisms (Alberts, et al., 2003). The structure of DNA is characterized by its unique combination of four nitrogenous bases: adenine (A), thymine (T), cytosine (C), and guanine (G) (Minchin & Lodge, 2019). The phosphodiester bonds connect these bases, together with deoxyriboses, phosphate groups, and hydrogen bonds between nucleotides on different strands, to form a stable double-strand helical structure (Watson & Crick, 1953) (Bowman & Willams, 2023). The helical structure exposes the major and minor grooves that provide the locations for protein binding and interaction (Rohs, et al., 2010). Any disruption of this structure that interferes with the proper functioning of DNA may impact cellular functions and overall health of the organism (Alhmoud, et al., 2021). Every single human cell experience thousands of DNA damage every day (Milano et al., 2024), a consequence of both endogenous and exogenous influences (Carusillo & Mussolino, 2020). Endogenous stress is normally encountered during DNA replication or other specific physiological circumstances, such as DNA hydrolysis and oxidative reactions with water and reactive oxygen species (ROS). Exogenous factors, including radiation (e.g., X-rays, UV-light) and diverse chemical agents, contribute to extrinsic sources of stress on DNA (Lindahl & Nyberg, 1972) (Lindahl, 1993).Both types of stress ultimately cause damage in DNA, usually in the form of single-strand breaks (SSBs), the most common lesion, or double-strand breaks (DSBs) (Jeggo, 1998), where a bond between successive nucleotides in a strand is severed disrupting the structure of DNA. When the damage occurs, it can significantly affect the structure of chromatin (the mixture of DNA and proteins that form chromosomes in the cells of humans and other higher organisms) and can lead to chromatin remodelling, a crucial process in regulating DNA-associated processes (Wolffe, 1998) (Lans et al., 2012) (Menoni et al., 2017). Chromatin remodelling facilitates the repair enzymes’ access to damaged DNA, and the structure of chromatin often serves as a docking or signalling site for repair and signalling proteins (Lans et al., 2012) (Menoni et al., 2017) (Karakaidos et al., 2020). Improper remodelling will significantly impact several vital cellular processes such as DNA transcription and replication (Lucas et al., 2011) (Lans et al., 2012) (Nair et al., 2017). Hence, DNA breaks must be correctly and promptly repaired to maintain genetic stability (McKinnon & Caldecott, 2007) (Sirbu & Cortez, 2013). Otherwise, severe DNA damage can cause genetic mutations and cause neurodegenerative diseases and cancer (Friedberg, 2008) (Bernstein et al., 2013) (Carusillo & Mussolino, 2020).
Every single human cell experience thousands of DNA damage every day (Milano et al., 2024), a consequence of both endogenous and exogenous influences (Carusillo & Mussolino, 2020). Endogenous stress is normally encountered during DNA replication or other specific physiological circumstances, such as DNA hydrolysis and oxidative reactions with water and reactive oxygen species (ROS). Exogenous factors, including radiation (e.g., X-rays, UV-light) and diverse chemical agents, contribute to extrinsic sources of stress on DNA (Lindahl & Nyberg, Rate of depurination of native deoxyribonucleic acid, 1972) (Lindahl, 1993).Both types of stress ultimately cause damage in DNA, usually in the form of single-strand breaks (SSBs), the most common lesion, or double-strand breaks (DSBs) (Jeggo, 1998), where a bond between successive nucleotides in a strand is severed disrupting the structure of DNA. When the damage occurs, it can significantly affect the structure of chromatin (the mixture of DNA and proteins that form chromosomes in the cells of humans and other higher organisms) and can lead to chromatin remodelling, a crucial process in regulating DNA-associated processes (Wolffe, 1998) (Lans et al., 2012) (Menoni et al., 2017). Chromatin remodelling facilitates the repair enzymes’ access to damaged DNA, and the structure of chromatin often serves as a docking or signalling site for repair and signalling proteins (Lans et al., 2012) (Menoni et al., 2017) (Karakaidos et al., 2020). Improper remodelling will significantly impact several vital cellular processes such as DNA transcription and replication (Lucas et al., 2011) (Lans et al., 2012) (Nair et al., 2017). Hence, DNA breaks must be correctly and promptly repaired to maintain genetic stability (McKinnon & Caldecott, 2007) (Sirbu & Cortez, 2013). Otherwise, severe DNA damage can cause genetic mutations and cause neurodegenerative diseases and cancer (Friedberg, 2008) (Bernstein et al., 2013) (Carusillo & Mussolino, 2020).
To prevent bond-broken damaged DNA causing severe pathological outcomes, DNA breaks trigger a cascade of cellular responses that are aimed at detecting them promptly and repairing them efficiently (Caldecott, 2008, 2022, 2024). These intricate cellular responses upon DNA damage, collectively referred to as the DNA damage response (DDR) (Jackson & Bartek, 2009), represent a sophisticated network that works to identify the DNA breaks and to facilitate DNA repair (Giglia-Mari et al., 2011) (O’Connor, 2015). When the DNA break is detected by sensor proteins, alternative DDR processes are initiated depending on the type of damage (Karagiannias & El-Osta, 2004) (Dexheimer, 2013) (Brown et al., 2017) (Molinaro et al., 2021). For a thorough understanding of the DNA repair processes, as a first step, one should understand the structural and dynamical properties of damaged DNA itself, in particularly at the molecular level, and subsequently focus on how the various types of DNA breaks may affect the ability of sensor proteins to recognize DNA damage that ultimately triggers the DDR.
Phosphorylated DNA ends appear in multiple DNA-related biological processes, such as DNA replication and DNA repair pathways (Huang & Zhou, 2021) (Song et al., 2023). During DNA replication, several short pieces of DNA of the lagging strand are made by DNA polymerase called Okazaki fragments, which contain nicks between each other, and these nicks need to be ligated by DNA ligase I to properly finish the replication process (Ogawa & Okazaki, 1980) (Timson et al., 2000) (Howes & Tomkinson, 2012) (Sallmyr et al., 2020). Several previous in vitro studies have demonstrated that 5’-phosphate is required to maximize the effectiveness of DNA ligase I and III during the ligation, which indicates that 5’-phosphate is a crucial component for certain enzymes to initiate interactions with DNA (Timson et al., 2000) (Cherepanov & de Vries, 2002) (Howes & Tomkinson, 2012) (Cannan et al., 2017) (Sallmyr et al., 2020). In the DNA repair pathways, 5’-phosphorylated breaks are preferentially recognized by specific proteins that subsequently activate the DDR in the cell (Prasad et al., 1994) (Langelier et al., 2014) (Urrutia, et al., 2022). Although structures of 5’-phosphorylated DNA with proteins have been reported (Obaji et al., 2018, 2021) (Bilokapic et al., 2020), the molecular reasons as to how certain proteins are recruited to the break site have not yet been fully understood (Caldecott, 2008, 2022, 2024) (Waters & Spratt, 2024). Therefore, a comprehensive understanding of phosphorylated breaks and their influences on the local and the overall (or global) behaviour of DNA molecules at the molecular level will further enhance insights into the recognition process of DNA SSBs.
The molecular structure of different types of SSBs displays distinct features due to various forms of endogenous and exogenous influences. Typically, SSBs contain an irregular 3’ terminus, 5’ terminus, or both. These termini must be reinstated to 3’-hydroxyl and 5’-phosphate moieties to complete the repair (Caldecott, 2008, 2022, 2024). The term 5’-phosphorylated (5’P) breaks are referring to those lesions containing an unconnected phosphate group in the different protonation states as shown in Figure 1.
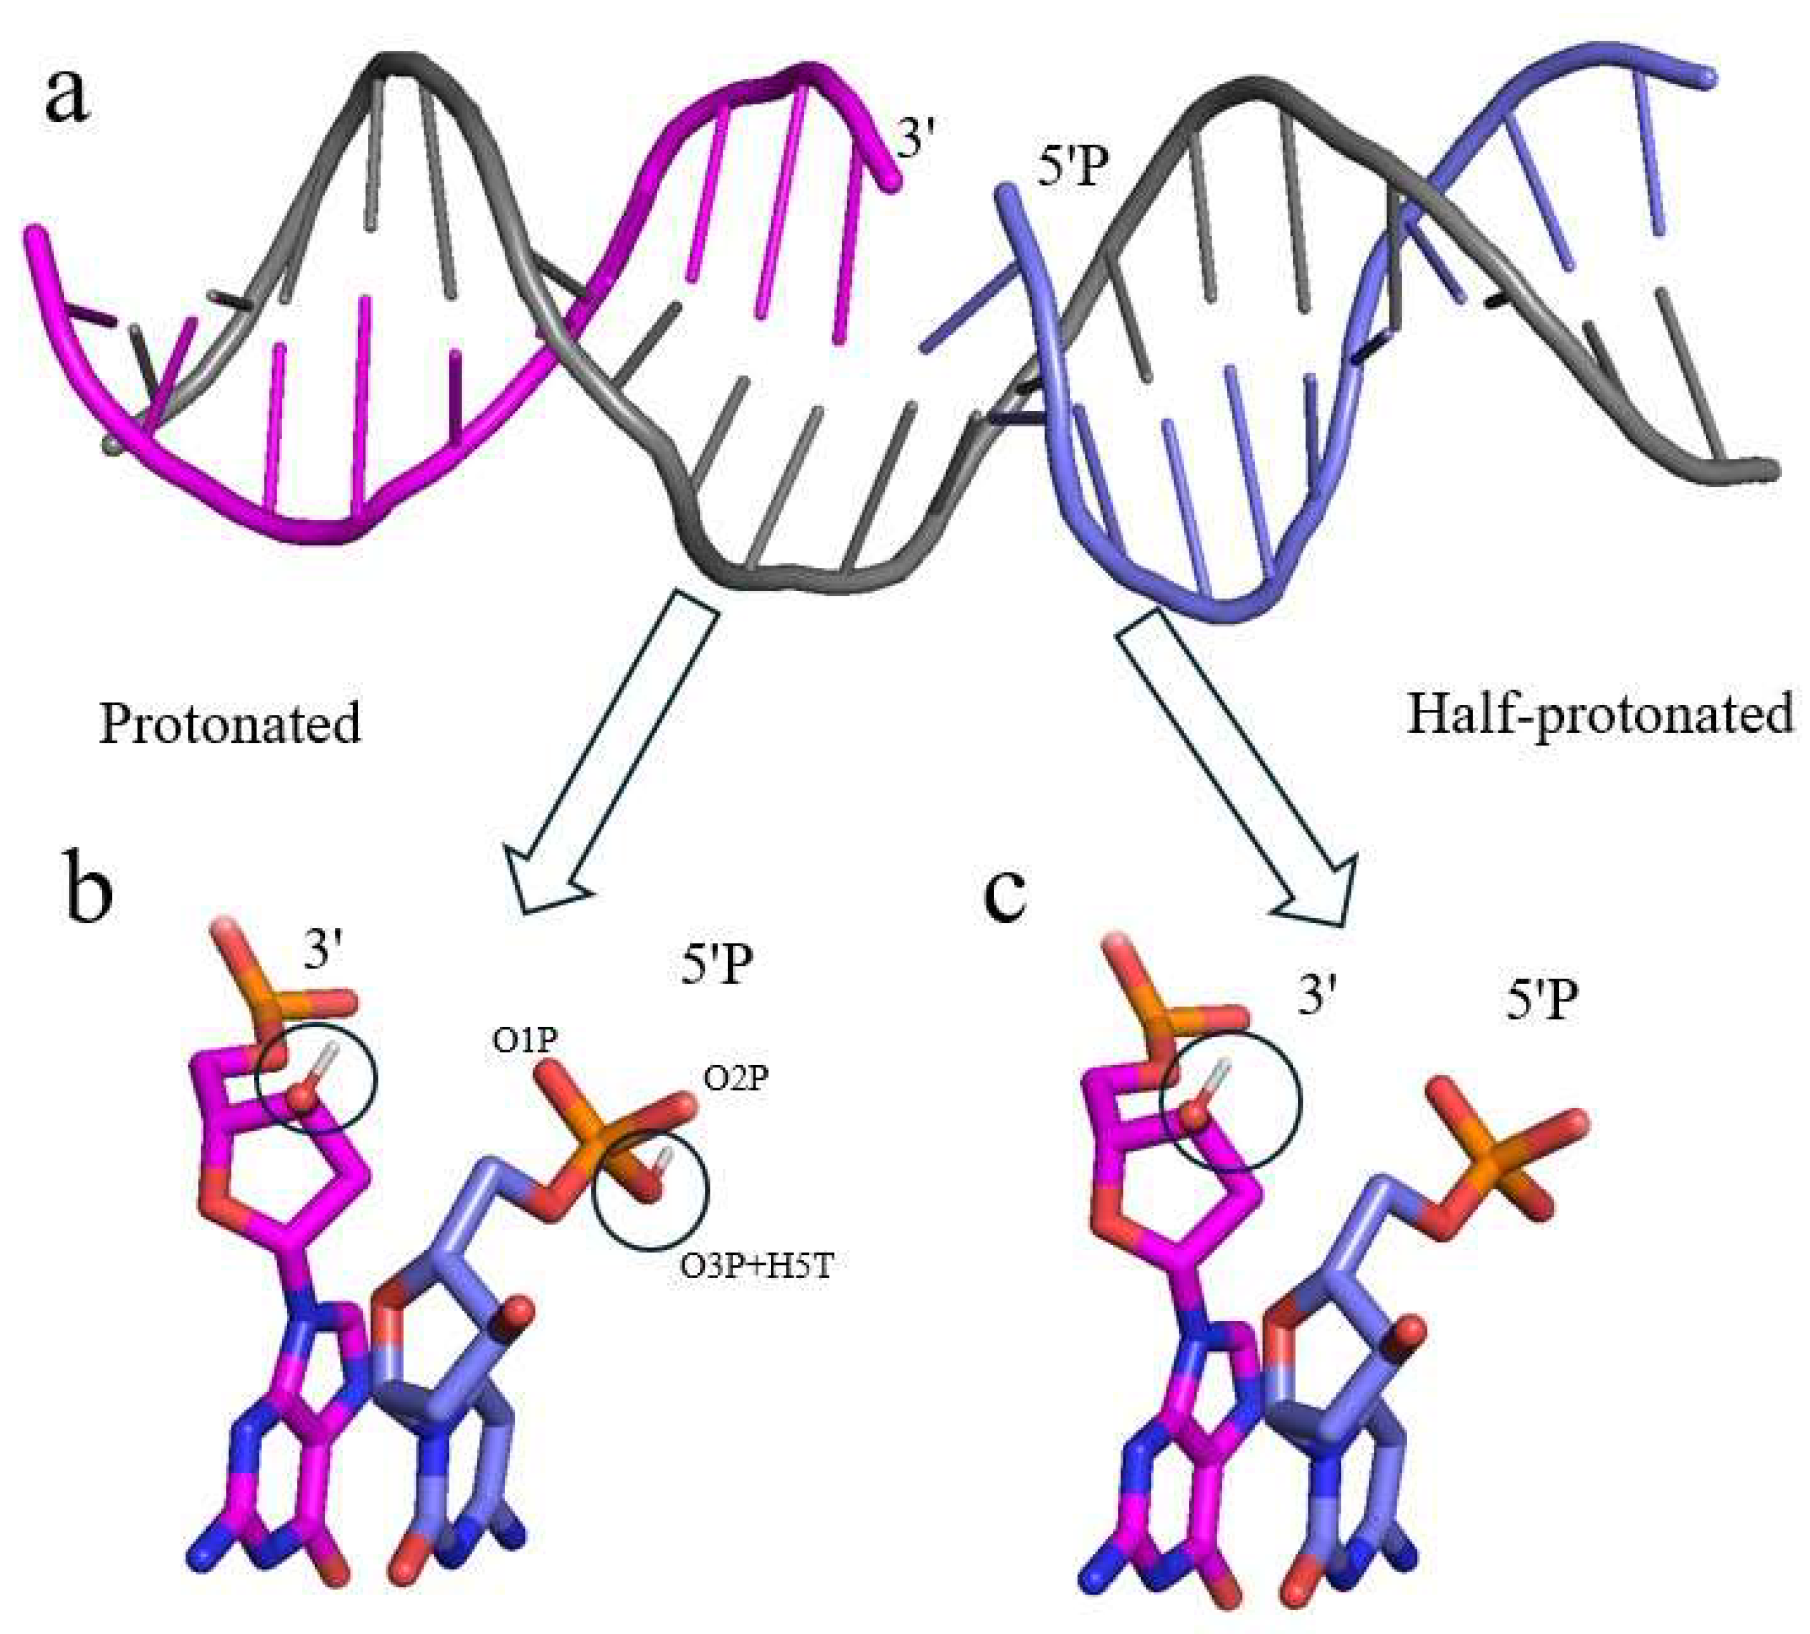
Figure 1.
The molecular structure of a 5’P DNA break: a) a 20 base pair DNA model with a break at a cytosine base based on PDB id 6X0L; b) 5’P break in the protonated state, where hydrogens (in white, in circles) are attached to both ends; c) 5’P break in the half-protonated state, where a hydrogen is attached to only the 3’ end and the 5’P is fully deprotonated.
The principal objective of the present work is to characterize the structural and dynamical properties of such phosphorylated breaks in their natural state (that is, not bound to sensor proteins) by examining a given 20 base pair (bp) DNA with a phosphorylated break on different nucleotides, where the 5’P is either protonated or fully deprotonated. Due to the current limitations of the experimental techniques and the extensive variety of DNA damage types, experimentally characterizing the structure and dynamics of intact and damaged DNA at the molecular level is still extremely challenging (Lukin & de Los Santos, 2006) (Afonin, et al., 2021)
Molecular dynamics (MD) is a proven technology that provides detailed insight into the intimate relationship between structure, dynamic, and function (Maginn & Elliott, 2010) (Salo-Ahen, et al., 2020). Therefore, to achieve the aforementioned objective, we employed atomic molecular dynamics simulations (ATMD) to study DNA breaks, where intact (undamaged) DNA with the same sequence served as a reference. Several analysis protocols are also introduced for a proper and detailed analysis of the given damaged DNA. Such computer simulations can greatly contribute to predicting and to delineating at the molecular level the intrinsic mechanical and structural preferences of a double-strand DNA containing a single break. This predictive capacity could furthermore pave the way for an extensive study of DNA malleability, encompassing both direct and indirect readout mechanisms. While there has been MD studies on DNA, DNA-DNA and Protein-DNA interactions (Yoo et al., 2020) (Esmaeeli et al., 2023), there are hardly any studies on the properties of damaged DNA as previous computational studies of free DNAs were primarily focused on intact DNA structures (Zhang & Collins, 1995) (Yamaguchi et al., 2002) (Bunta et al., 2006) (Dans et al., 2010) (Furse & Corcelli, 2010) (Laughton & Harris, 2011) (Pérez et al., 2012) (Kruba et al., 2018). The findings of this work are therefore expected to enhance the comprehension of the changes of the DNA structure when introducing a SSB in the sequence: e.g., whether the motion of the dangling phosphate group at the break site plays a specific role in the DNA repair enzymes’ recognition process or whether a particular DNA structure (or “form”) exists for the SSB that may improve the chances of being recognized by a DNA damage response protein.
Methods
Damaged DNA Templates
The DNA template containing a 5’P break which has been studied in this paper was adapted from the cryo electron microscopy structure of a 20 bp DNA containing double strand breaks (cytosine) in complex with a DNA break sensor protein (ADP-ribosyltransferase PARP2) (Bilokapic et al.,2020) (PDB id. 6X0L). To build an SSB model, one of the two breaks was manually repaired with Pymol (Schrödinger & DeLano, 2020). Atom OP3 from the phosphate group was removed, and a bond was created between the 5’ end atom P and the 3’ end atom O3’. To further investigate the effect of bp types on breaks, single strand breaks were created by replacing the break site cytosine (C) with guanine (G), adenine (A), and thymine (T) separately in the structure, and the corresponding base pair on the complementary strand was changed accordingly. In the text below, the phrase “X-break” is employed to mean that the 5’P is attached to the corresponding nucleotide, X being either ‘A’, ‘C’, ‘G’ or ‘T’. Also, the term “template” will be employed to generally refer to a 20 bp DNA with a X-break. The templates employed in this study all have the same sequence except at the break site, where a pyrimidine is replaced by another pyrimidine or a purine (Table S1 in the Supplementary Information).
Charge Distributions of the 5’ Phosphate Group
A phosphorylated SSB in DNA typically results from the hydrolysis of the glycosidic phosphate-sugar bond. Since the typical force fields to date are created for intact molecules, non-standard molecules like damaged DNA require additional parametrization of existing force fields (Mackerell Jr., 2004) (González, 2011). Previous studies have based their criteria for the parameterization of DNA breaks on normal DNA ends or have computed their own parameters for some non-standard nucleotides, such as different sugar nucleotides, 3’ phosphoramidate and manually introduced breaks (Cieplak et al., 1997) (Petrová et al., 1999) (Yamaguchi et al., 2002) (Tucker et al., 2022). In the present study, the 5’-phosphorylated break is very similar to the break that was previously studied by Bunta (Bunta et al., 2006). They have computed the break partial charges by applying a Gaussian electrostatic potential (ESP) charge fitting method and the restrained electrostatic potential (RESP) model calculation (Frisch, et al., 2004) (Barly et al., 1993). Their parameters for the phosphate group as well as the updated parameters of the bio-organic phosphate in the AMBER force field (namely, ff99sb) were both employed and served as references to define the DNA 5’P group in the present work (Steinbrecher et al., 2012). In an actual cellular environment, once the phosphodiester bond between the hydroxyl group and the adjacent phosphate group is severed, both ends will likely be hydrated such that a hydroxyl group is attached to 5’ end and a hydrogen is attached to 3’ end (Zenkova, 2004). Thus, hydrogens (with names H5T and H3T) were added to both ends for the protonated state but one was excluded on the 5’ end for the half-protonated state (Figure 1). All bonded and non-bonded parameters in the original force field remained the same, except that the angle θ and angular force constant between the atom type OH, P and OS in the phosphate group were changed from 102.6 degrees to 115.8 degrees and 376.56 kJ mol-1 rad-² to 715.46 kJ mol-1 rad-², respectively (Steinbrecher et al., 2012) (Sousa da Silva & Vranken, 2012) (Kagami et al., 2023). The charge distributions of the phosphate group in different protonation states were adapted from the standard AMBER force field and from those computed by the “acpype” server (Sousa da Silva & Vranken, 2012) (Zgarbová, et al., 2011) (Kagami et al., 2023). The original charges of the other atoms in the nucleotide remained the same and the charges were only redistributed over the phosphate and its adjacent atoms, such as C5’ and O5’, of the phosphate group. Table 1 lists the full set of various charge distributions employed in the present work

Table 1.
All phosphate group atomic partial charges (expressed in units of elementary charge, e) employed in this work. They were derived from the AMBER force field (ff99sb) for intact DNA strands (column 2), according to Bunta (Bunta et al., 2006) (columns 3 and 4), and based on the “acypye” server (Sousa da Silva & Vranken, 2012) (Kagami et al., 2023) (column 5). The remaining columns lists partial charges that were varied to describe the various protonation states of 5’P, that is, charge sets1 to 5 are for the protonated 5’P and the last column with header “half-pro” represents the half-protonated case (see Figure 1). Atoms with charge values different from the standard AMBER and/or the Bunta group force field are listed in bold face (except those from the Bunta group). Columns with red header labels are charge sets that could not pass the energy minimization (columns 3 and 4) or the simulations eventually failed (charge sets 1 and 2 in columns 6 and 7, respectively). The charges values listed as “-” in columns 3 and 4 were not provided by Bunta et al. (2006), so the standard values were assumed from column 2. These values however resulted in non-integral value for the total charge (bottom row). The difference in the charge distribution between charge sets1 to 5 is the charge values assigned to atoms P, O3P, H5T, and O5’. For the half-protonated charge state, the H5T is removed and the charge value of the OPs of 5’P were adjusted such that a total of +1e is removed so that the total charge changes to –3e.
| Atom name | Standard AMBER | Bunta group | Acpype | Charge set1 | Charge set2 | Charge set3 | Charge set4 | Charge set5 | Half-pro | |
| Gaussian ESP | RESP | |||||||||
| O3’ | -0.5232 | -0.7894 | -0.5991 | -0.5232 | -0.5232 | -0.5232 | -0.5232 | -0.5232 | -0.5232 | -0.5232 |
| H3T | 0.4396 | -0.4529 | 0.3541 | 0.4396 | 0.4396 | 0.4396 | 0.4396 | 0.4396 | 0.4396 | 0.4396 |
| P | 1.1659 | 1.3139 | 1.1436 | 1.4248 | 1.1559 | 1.1659 | 1.1659 | 1.1659 | 1.1659 | 1.1659 |
| O3P | - | -0.6602 | -0.5907 | -0.7784 | -0.5054 | -0.4954 | -0.4954 | -0.4954 | -0.4954 | -0.6226 |
| O2P | -0.7761 | - | - | -0.8395 | -0.7761 | -0.7761 | -0.7761 | -0.7761 | -0.7761 | -0.6226 |
| O1P | -0.7761 | - | - | -0.8395 | -0.7761 | -0.7761 | -0.7761 | -0.7761 | -0.7761 | -0.6226 |
| H5T | 0.4422 | 0.4563 | 0.4334 | 0.4280 | 0.2097 | 0.1897 | 0.1797 | 0.1697 | 0.1597 | - |
| O5’ | -0.6318 | - | - | -0.5902 | -0.5043 | -0.4943 | -0.4843 | -0.4743 | -0.4643 | -0.4943 |
| C5’ | -0.0069 | - | - | 0.1594 | 0.2064 | 0.2064 | 0.2064 | 0.2064 | 0.2064 | 0.2064 |
| H5’1 | 0.0754 | - | - | 0.0757 | 0.0021 | 0.0021 | 0.0021 | 0.0021 | 0.0021 | 0.0021 |
| H5’2 | 0.0754 | - | - | 0.0757 | 0.0021 | 0.0021 | 0.0021 | 0.0021 | 0.0021 | 0.0021 |
| Total | -1 | -2.9121 | -2.0378 | -2 | -2 | -2 | -2 | -2 | -2 | -3 |
Molecular Dynamics Protocol
Molecular dynamics simulation for each intact DNA molecule was carried out with GROMACS (version 2022) with AMBER ff99sb force field, all the damaged DNA was performed with the same force field with modified parameters (Bekker, et al., 1993) (Zgarbová, et al., 2011) and the various charge sets listed in Table 1. The AMBER ff99sb force field has been reported to produce the most optimized result for intact DNA simulations among other versions of amber force fields (Misra & Yadav, 2022). Every initial structure of the DNA was solvated with SPC/E water molecules in a cubic box and the minimum distance to the box edge was set to 1.0 nm (Toukan & Rahman, 1985) (Berendsen et al., 1987) (Mark & Nilsson, 2011) (Campo, 2010). The box volumes for all the simulations were always around 700 nm3. The system was neutralized by adding the counterions (Na+ and Cl-) up to a concentration of 0.15 M, which were randomly placed in the box. The system was optimized (energy minimized) during a steepest descent energy minimization of 100 steps, followed by two phases of 100 ps equilibration simulations carried out first in the canonical and subsequently in the grand canonical ensemble to stabilize the temperature (300 K) and the pressure (1 bar) of the system, where each simulation was carried out with a time step of 2 fs. The Berendsen thermostat and Parrinello-Rahman barostat were used to maintain the system at a fixed and desired temperature (300K) and pressure (1 bar), respectively (Bussi et al., 2007) (Parrinello & Aneesur, 1981) (Nosé & Klein, 1983). In the production simulation, a cutoff distance of 1.0 nm was applied for short range Coulomb and van der Waals interactions, and the long-range electrostatic interactions were calculated by the particle mesh Ewald algorithm (Darden et al., 1993). Covalent bonds involving hydrogen atoms were constrained by the LINCS algorithm (Hess et al., 1997). A snapshot of the coordinates of the system and the energy file were saved every 10 ps for subsequent analysis. For each DNA molecule, a 1000 ns ATMD simulation was completed. The starting conformation for each simulation of the DNAs is always the canonical B-form. The time step for the production simulation was also 2 fs.
Conformational and Structural Analysis
The overall average DNA conformation, and double-strand helical properties of each DNA template during the simulations were analysed by Bioexcel Building Blocks and MDanalysis python program (Andrio, et al., 2019) (Michaud-Agrawal et al., 2011), which included the DNA geometry properties, rotational and translational variations between intra-base pair (shear, stretch, stagger, buckle, propeller, opening), inter-base pair steps (shift, slide, rise, tilt, roll, twist), DNA backbone torsion angles (α, β, γ, δ, ε, ζ and χ) (illustrated in Figure S1 of the Supplementary Information). DNA structures, conformational states, or more commonly referred to as “forms” (B-form and its substates BI/BII) are defined by sugar puckering conformations and the values of backbone dihedral ε-ζ (Ohyama et al., 2005) (Teletchéa et al., 2004). The total bending angles for each DNA template were computed by Canal from Curves+, which compute the bending angle of each base pair along the helical axis, accounting for the contributions of each nucleotide to ensure the accuracy of the overall curvature of the DNA structure (Lavery et al., 2009). The stiffness at the base pair step level were obtained through the inverse-covariance matrix method, which generates the stiffness matrices, and the results presented below in Figure 5 and Figure 6 are the average value of translational and rotational properties over the simulation time series (Landau et al., 1981). Note that all the analysis results presented here related to the conformational and structural properties always ignored the terminal base pairs of the DNA since these often suffer from local deformations and consequently may affect the accuracy of the overall analysis (Samanta et al., 2009).
5’-Phosphate Group Dynamics
As will be clear from the results, the phosphate group in 5’-phosphorylated DNA break was observed shifting throughout a given simulation of damaged DNA. Given the possible relevance of the 5’P for the repair of SSBs, a protocol is developed here to better analyse its motion. The phosphate group’s position is classified based on its relative orientation into conformational states labelled as outward, hydrogen-bonded, and other (Figure 2). The outward state is further divided into two substates, outward I and outward II. A conformational state that is labelled as outward indicates that the phosphate group is pointing off or away from the backbone. Relative to the chain direction (5’ to 3’), for outward substate I the phosphate group is pointing to the right, whereas for outward substate II it is pointing to the left. The two outward substates were defined by a specific distance dOO between atom O4’ to O2 (for a pyrimidine), O4’ to N3 (for a purine), and a torsion angle χ (pyrimidine: O4’-C1’-N1-C2; purine: O4’-C1’-N9-C4) (Figure 3). The parameter values applied here were derived from a distribution for both χ and dOO (Figures S2-5). By analysing the coordinates and prominence of the peaks in Figures S2-5, the criteria for sorting the outward states of the phosphate group were established. The major peak, or outward I, corresponds to a dominant configuration characterized by larger angles and distances, whereas the minor peak, or outward II, denotes a less frequent and possibly transient state. The distance dOO is for the outward I smaller than 3.5 Å but larger than 3.5 Å for outward II. The range of torsion angle χ is 0° to 100° for substate I and 100° to 180° for substate II. These ranges also correspond to the standard nucleotide nomenclature of the N-glycosidic bond in the syn and anti-configuration, respectively (Saenger, 2013). The hydrogen-bonded state was defined by the distance between 3’ end oxygen O3’ and any of the 5’ phosphate group’s oxygens, which must be smaller than 3.5 Å, and the standard hydrogen bonding angle, which must fall in the range from 150° to 180° (Brown, 1976) (Taylor et al., 1984). The distance distribution between the OP atoms and 3’ end O3’ is shown in Figure S6. Any conformational state that cannot be sorted into any of these three states, is labelled as other. These distinctions facilitate a more precise categorization of the phosphate group’s conformational dynamics, contributing to a deeper understanding of its structural and functional behaviour.
Figure 2.
Representative structures illustrating the various conformational states employed for the analysis of the phosphate group dynamics. Each conformational state is depicted in stick representation, with elements color-coded as follows: P (phosphorus) in orange, O (oxygen) in red, and N (nitrogen) in blue. All hydrogen atoms have been omitted to enhance the visibility of the structural features. a) Structure of the damaged DNA (C-break) from 6X0L with one of the strands repaired where the arrow indicates the direction of chain of the 5’P strand, the two outward substates were identified based on this direction b) Outward substate I: the phosphate is positioned relatively far away from both the 3’ end and the complementary strand, pointing to the right; c) Outward substate II: the phosphate points to the opposite direction (to the left) compared to the outward state I, resulting in a relatively short distance between the phosphate and the other strand; d) Hydrogen-bonded: one of the phosphate group oxygens is close enough to the 3’ end hydrogen to form a transient hydrogen bond identified by the dotted line; e) Other: the phosphate group orientation cannot be assigned to any of the outward substates or the hydrogen-bonded state.
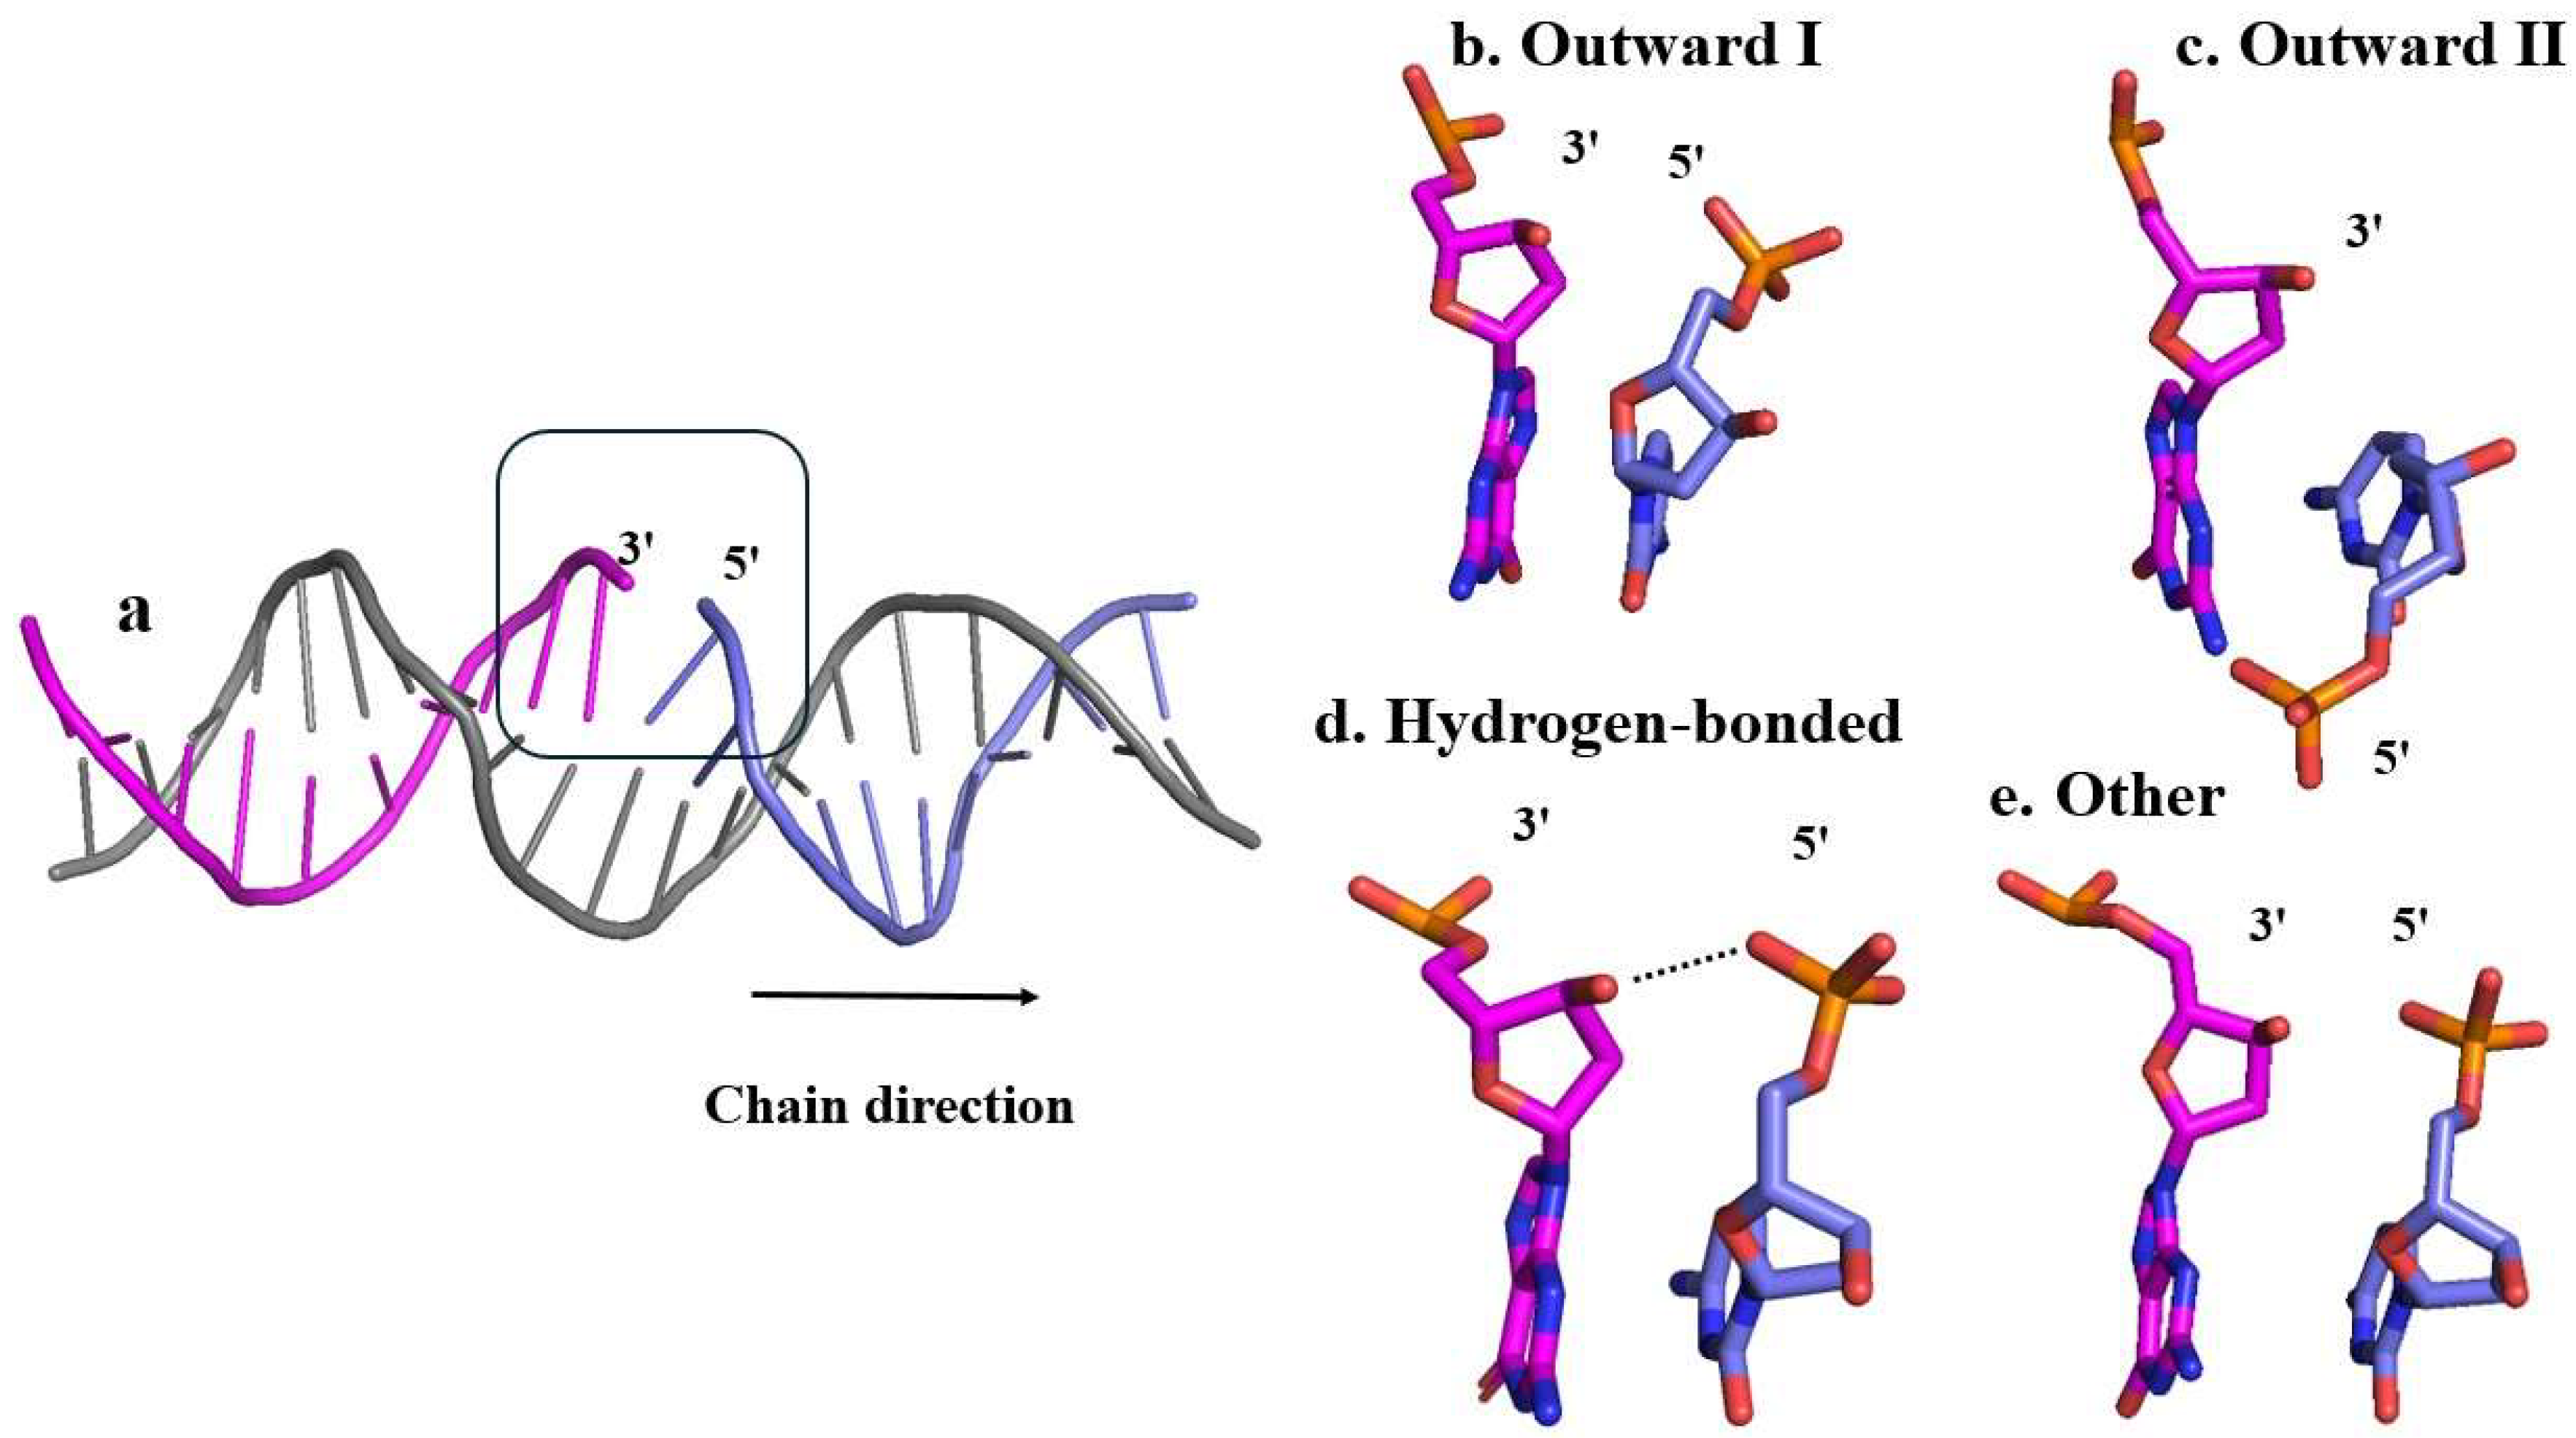
Figure 3.
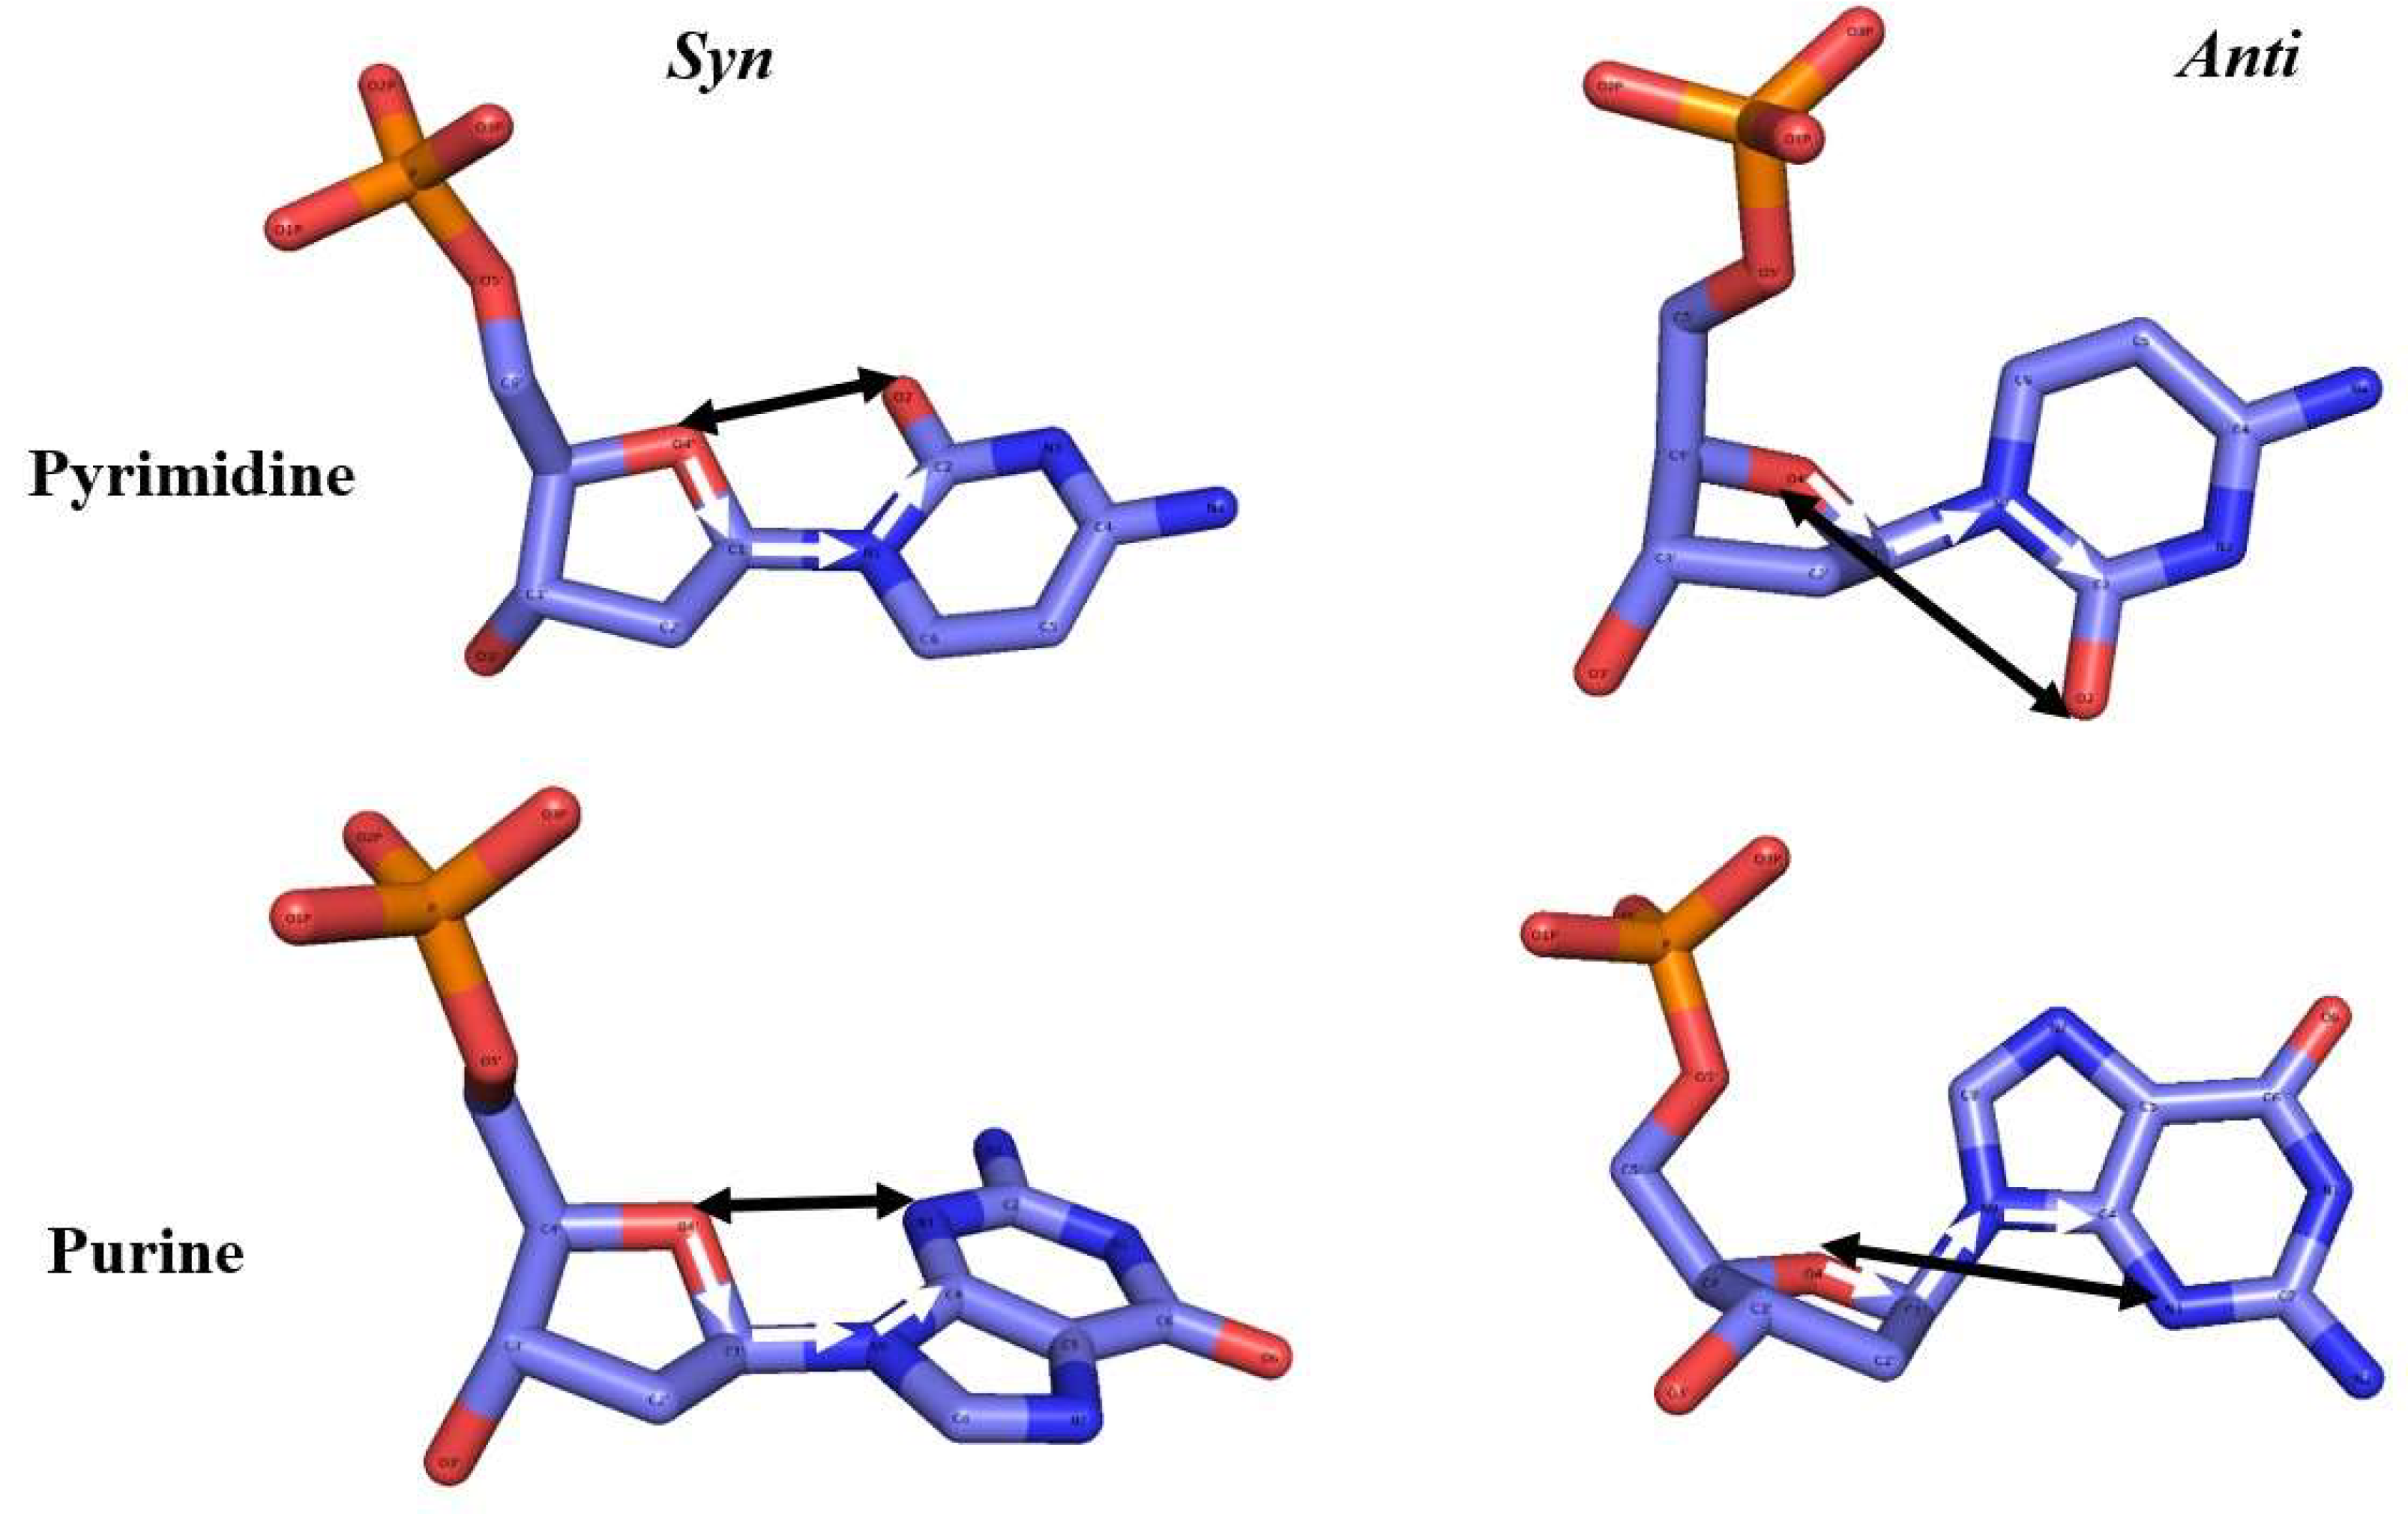
The syn- and anti-conformation in pyrimidines and purines. The torsion angle χ (pyrimidine: O4’-C1’-N1-C2; purine: O4’-C1’-N9-C4) is indicated by the white arrows; the distance dOO (O4’ to O2 for pyrimidine, O4’ to N3 for purine) measured alongside with the torsion angle to distinguish the two outward substates I and II is shown as a black arrow.
Figure 3.
The syn- and anti-conformation in pyrimidines and purines. The torsion angle χ (pyrimidine: O4’-C1’-N1-C2; purine: O4’-C1’-N9-C4) is indicated by the white arrows; the distance dOO (O4’ to O2 for pyrimidine, O4’ to N3 for purine) measured alongside with the torsion angle to distinguish the two outward substates I and II is shown as a black arrow.
Results
Charge Sets
Since the force field for damaged DNA with phosphorylated breaks is non-standard, an evaluation is required whether changes in the charge distribution assigned to the phosphate group in damaged DNA affects the outcome of the simulations. In Table 1, the two atom charge sets listed with red column headers in columns 3 and 4, from the Bunta group (Bunta et al. 2006) with a higher hydrogen atom (H5T) charge value of around 0.44 in comparison to the other charge sets but comparable to the standard AMBER force field, always caused failures during the energy minimization steps with warnings from GROMACS indicating that the H5T kept on clashing with oxygens in the phosphate group. This eventually led to fatal errors during the energy minimization. Many attempts were carried out (such as shortening the energy minimization steps, applying additional energy minimization rounds, and so forth), but GROMACS was never able to find a set of coordinates representing a minimum energy conformation of the given DNA. Likely, AMBER’s force field’s updated DNA parameters are not compatible with the old force field employed by Bunta et al. (2006) or there were some other modifications in the force field not listed in the original paper (Bunta et al., 2006) (Case, et al., 2006) (Salomon-Ferrer et, al., 2013;). Also, the overall charge of the damaged DNA was in fact not an integer (Table 1, bottom row). These failed attempts do indicate that the charge value of H5T may impact non-bonded interactions within the break site phosphate group, especially between H5T and the two oxygens O1P and O2P (Figure 1).
For all other charge sets1 to 5, the total charge of damaged DNA was always an integral value, and, using the same simulation protocol, they worked smoothly without any error warnings across all the energy minimizations and subsequent MD simulations, except for the charge sets1 and 2 (columns 6 and 7 labelled also with red column headers in Table 1, respectively) that eventually failed during the MD simulations apparently due to too many unresolvable constraint warnings again related to the atoms O3P and H5T. Two non-integral total charge value sets from the Bunta group (in columns 3 and 4) were also further tested by changing the partial charges of other atoms not in the phosphate group such that an integral value for the total charge of the whole system was obtained. However, the energy minimization attempts still failed. In the remainder of this work, no further data is reported related to these charge sets (the two Bunta group charge sets, and charge sets 1 and 2, in columns 3, 4, 6, and 7 of Table 1, respectively).
Several properties, both global (for the full DNA molecule) and local (base pairs, and around the break site), were calculated to judge whether there would be significant changes between the charge sets.
DNA Form Analysis
Comparing intact DNA with damaged DNA, the DNA form population analysis revealed minor changes for all X-breaks (referring to the different nucleotide to which the break site’s 5’P phosphate group is attached, X is either ‘C’, ‘G’, ‘A’, ‘T’) when employing charge sets 3 to 5 for the protonated 5’P, and the charge distribution for the deprotonated 5’P (“half-protonated”, abbreviated as “half-pro”) (Table 1). Also, the case of a completely removed 5’P from the break site (referred to as a dephosphorylated break) was considered. The torsion angle pair ζ-ε value was applied to compute the population of BI/BII substates for each simulated DNA molecule. Between the two B-substates, the dominance of the BI form in DNA is hardly affected by the presence of a break in the structure. The BI/BII population results (Table 2, Figure S7) show that in solution all the DNA templates mostly adopt the BI conformation (just over 80%), and BII appears in a clearly lower proportion in all simulations (about 15%). These observations are consistent with experimental data stating that the co-exist ratio of BI/BII is close to 8:2 (Djuranovic & Hartmann, 2004) (Heddi, et al., 2010).
Table 2.
The DNA B form analysis for intact DNA, and charge sets 3 to 5, half-protonated, and dephosphorylated (“Non_P”) break for all X-breaks. Shown is the overall percentage of occurrence (in %) for BI and BII, respectively, including a measure for the standard deviation. A graphical representation is provided in Figure S7.
| % | Intact | Set3 | Set4 | |||
| BI | BII | BI | BII | BI | BII | |
| C-break | 83.03 ± 0.50 | 16.97 ± 0.66 | 84.02 ± 0.50 | 15.98 ± 0.51 | 85.94 ± 0.51 | 14.06 ± 0.85 |
| T-break | 84.45 ± 0.51 | 15.55 ± 0.78 | 84.73 ± 0.50 | 15.27 ± 0.70 | 84.47 ± 0.51 | 15.53 ± 0.73 |
| G-break | 81.16 ± 0.50 | 18.84 ± 0.75 | 84.71 ± 0.50 | 15.29 ± 0.63 | 85.52 ± 0.49 | 14.48 ± 0.91 |
| A-break | 81.79 ± 0.53 | 18.21 ± 0.71 | 81.94 ± 0.51 | 18.06 ± 0.82 | 86.11 ± 0.48 | 13.89 ± 0.77 |
| % | Set5 | Half-pro | Non-P | |||
| BI | BII | BI | BII | BI | BII | |
| C-break | 86.06 ± 0.51 | 13.94 ± 0.83 | 85.52 ± 0.49 | 14.48 ± 0.80 | 84.81 ± 0.50 | 15.19 ± 0.68 |
| T-break | 85.59 ± 0.49 | 14.41 ±0.74 | 84.61 ± 0.49 | 15.39 ± 0.77 | 85.53 ± 0.49 | 14.47 ± 0.68 |
| G-break | 82.71 ± 0.48 | 17.29 ± 0.68 | 85.48 ± 0.48 | 14.52 ± 0.85 | 86.25 ± 0.46 | 13.75 ± 0.72 |
| A-break | 83.94 ± 0.48 | 16.06 ± 0.66 | 81.99 ± 0.50 | 18.01 ± 0.67 | 84.92 ± 0.50 | 15.08 ± 0.74 |
Helical Parameters
Whereas global properties such as the BI/II ratio are not very much affected by the presence of a break site, local properties perhaps are. While comparing pyrimidines- (C- and T-breaks) and purines-based breaks (G- and A-breaks) with intact DNA, it is important to note that the B-form double-stranded DNAs typically contain Watson–Crick base pairs due to the specific hydrogen bond pattern, meaning a guanine (G) pairs with a cytosine (C) and an adenine (A) pairs with a thymine (T) (Spenser, 1959). In this study, all the initial structures were in the B-form, and they do contain appropriate Watson–Crick base pairs. To investigate possible local effects, the intra-base pair parameters (shear, stretch, stagger, buckle, propeller, opening) (Figures S8-11) and the inter-base pair steps parameters (shift, slide, rise, tilt, roll, twist) (Figures S12-15) were computed for each X-break (see also Figure S1 for a visual description of these parameters). They were calculated in a comparable way for both the pyrimidines (C and T) and the purines (G and A). For their calculation, charge sets3 to 5 and the charge set for half-protonated 5’P were employed.
Intra-Base Pair
The translational parameters shear, stretch, stagger and rotational parameters buckle, propeller, opening were considered to characterize the relative spatial displacement and rotation within any base pair in the DNA (Saenger, 2013). Changes in the probability density (or distribution) and parameter ranges of the intra-base pair parameters may reveal the impact of a break on the overall conformation and the stability of damaged DNA relative to intact DNA (Bishop, 2008) (Bhattacharyya & Bansal, 1990).
Figure 5.
The propeller property (an intra-base pair parameter) calculated for the given X-break compared to intact DNA. Top row: C-break (left), T-break (right) (pyrimidines); bottom row: G-break (left), A-break (right) (purines). Shown are the propeller X-break’s probability density functions. Intact DNA: solid cerulean blue line; damaged DNA with charge set3: dashed pumkin orange; charge set4: dashdot dark gray; charge set5: dotted mortar grey; half-protonated: densely dashdotted picton blue; non-phosphorylated: dashdotted tenne orange.
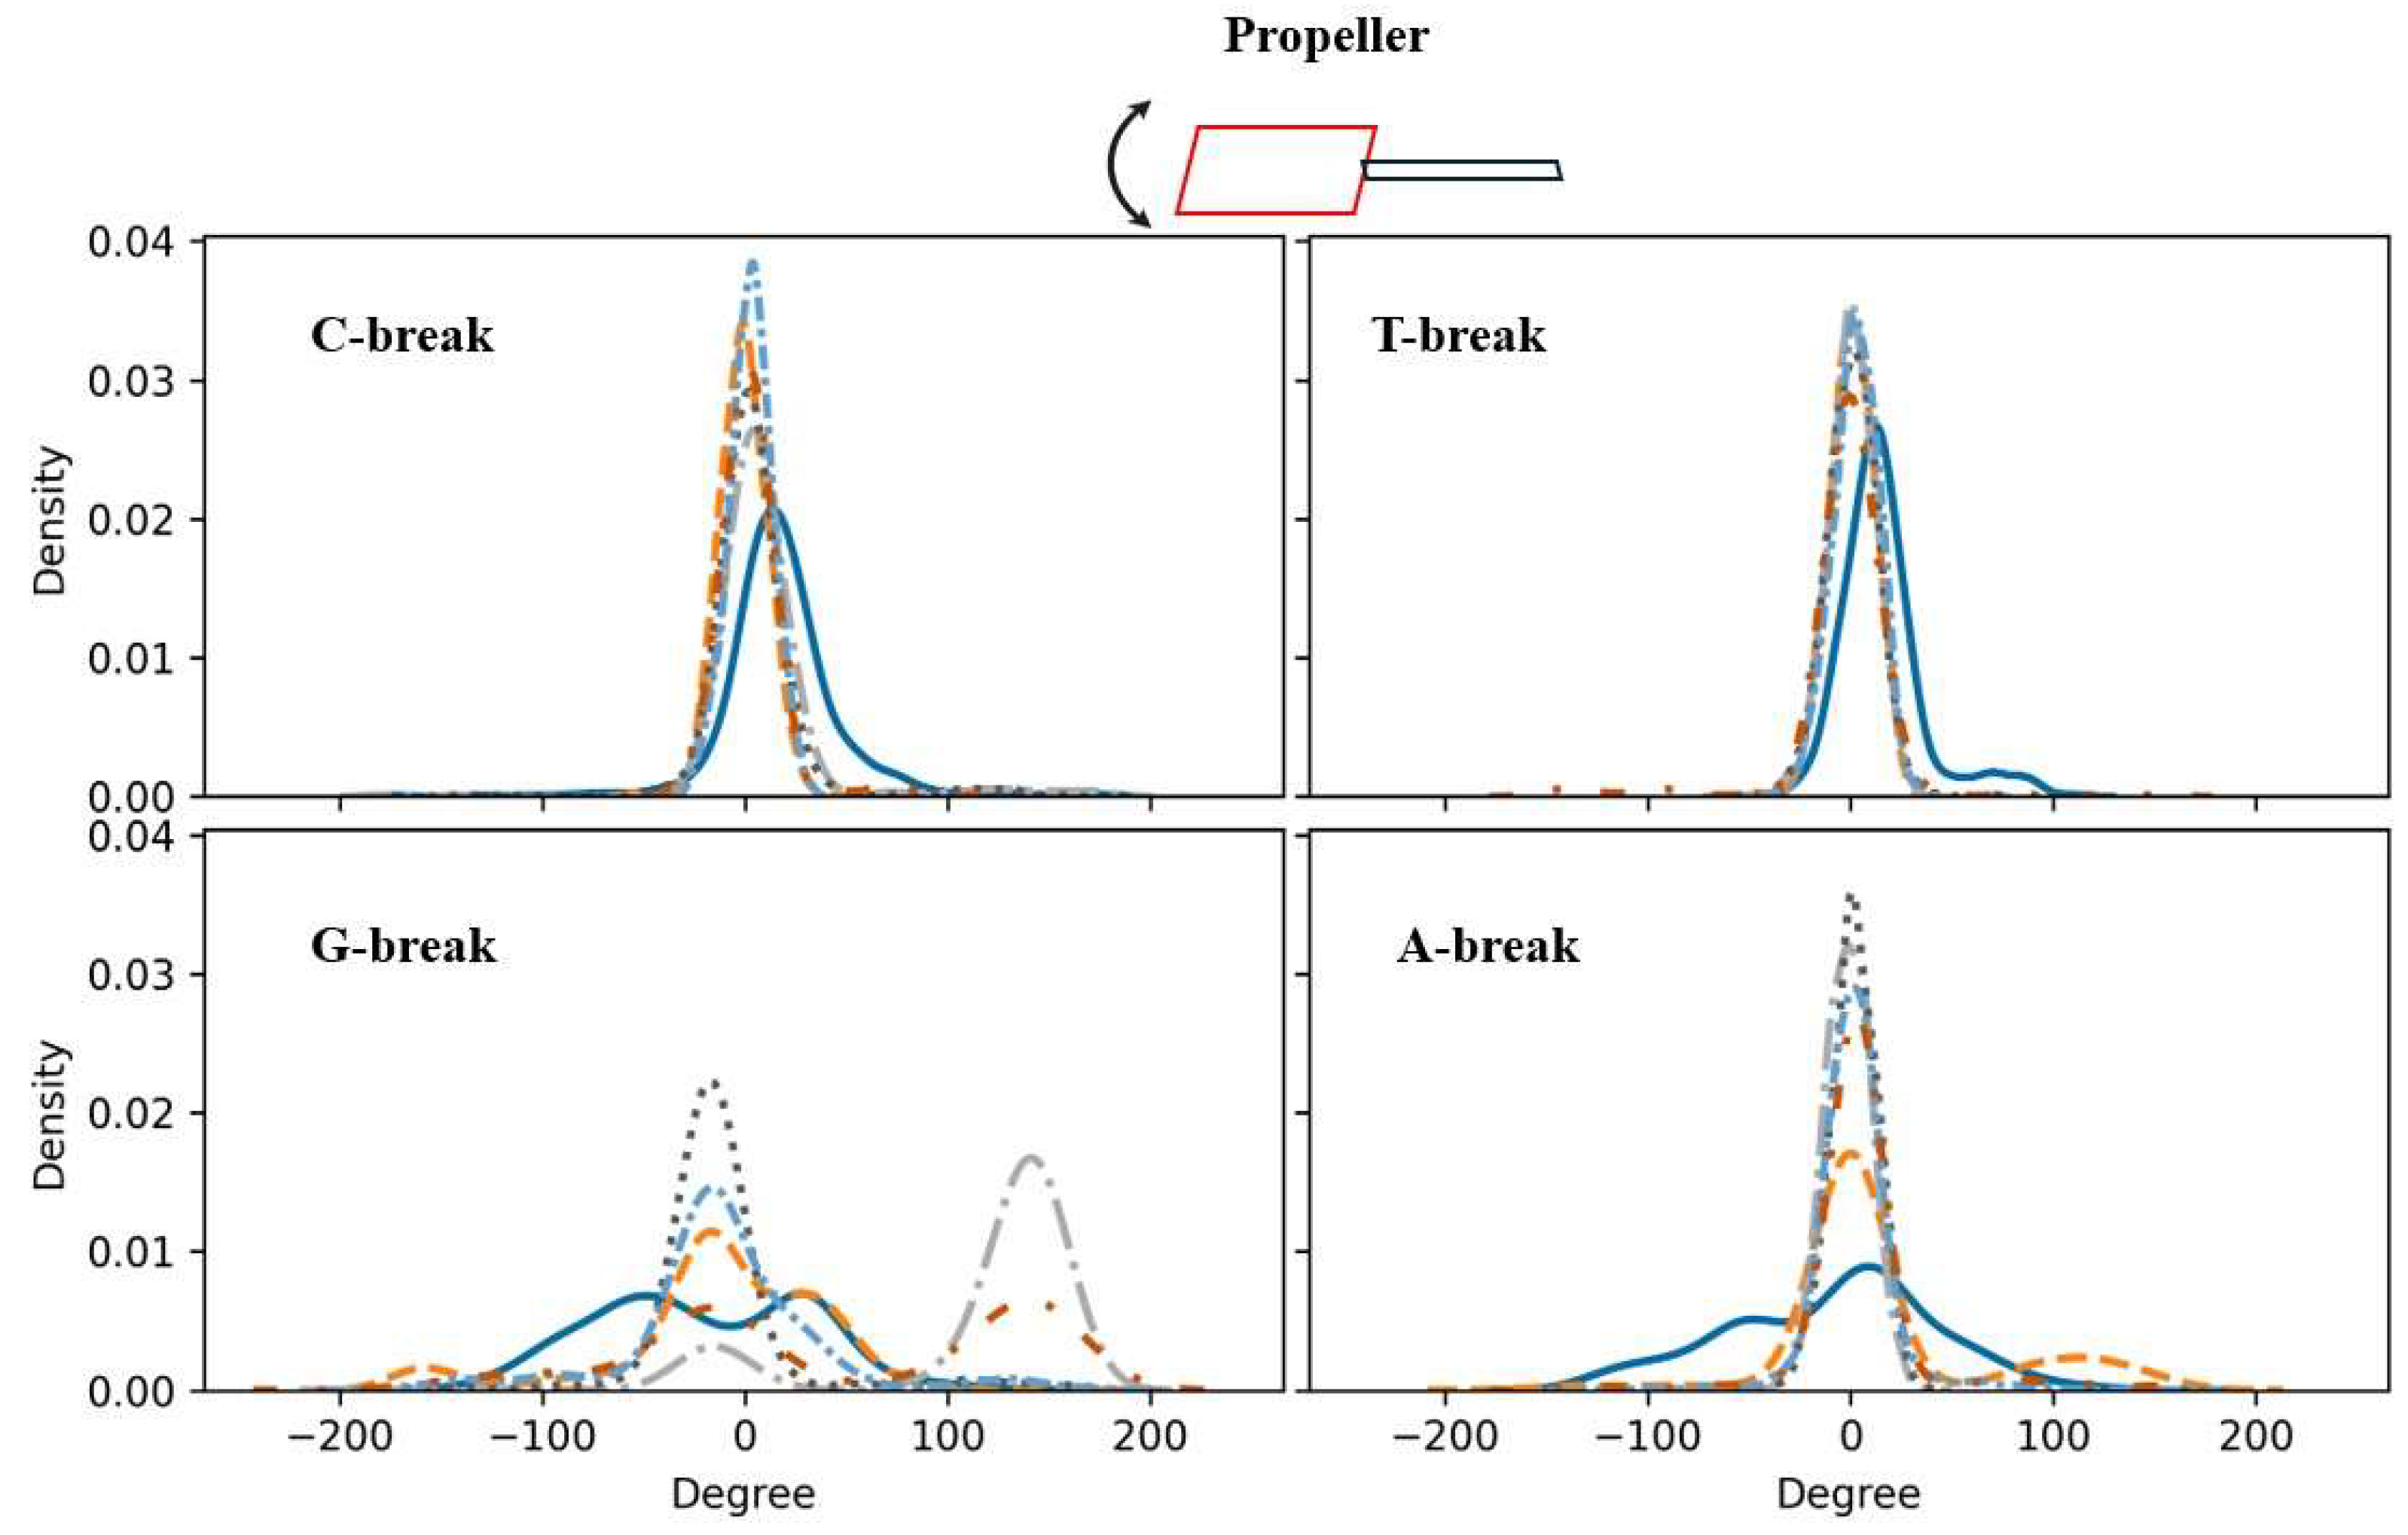
As an example, the results for propeller are discussed here in some detail. Changes in propeller affect the stacking interactions between adjacent bases, contributing for instance to DNA supercoiling. As shown in Figure 5, relative to intact DNA, the pyrimidine-based breaks generally display a narrower distribution, indicating a stronger and more stable base stacking. For the purine-based breaks, a different behaviour is observed for charge sets3 and 4 as well as for the dephosphorylated break in the case of the G-break and for charge set3 for the A-break. A narrower distribution around one or two peaks suggests a more constrained (more rigid) overall structure in the sense that the given DNA is predominantly in particular conformational states associated with certain rotation angles as identified by the peaks. A flatter or wider distribution, like the ones for intact DNA in the case of the purines, signifies the DNA’s ability to be in various conformational states associated with a wider range of rotational angles, that is, it is less constrained or more flexible. The G-break displays two peaks in the graph: charge set 3 has a major peak in the range (-50, 0), indicating a larger propeller rotation angle, and a shoulder peak in (0, 100) indicating a smaller rotation angle. For charge set4, a bimodal-like distribution is seen. Similarly, the two peaks in dephosphorylated G-break point to bimodal mode, suggesting that the given template has two preferred propeller angles. That is, relative to intact DNA, this template preferable adopts two different conformations. In conclusion then, these results indicate a degree of rigidification of a template due to the presence of a break.
Noticeable changes were also observed for shear and stagger, which primarily highlight a local distortion of DNA along the helical axis. Changes in shear can lead to a lateral misalignment of the bases, potentially disrupting hydrogen bonding and base stacking interactions. Stagger variations shift the bases along the helical axis, influencing the groove widths of the DNA, potentially affecting the recognition of DNA by the other molecules, such as proteins.
For both the pyrimidines-based damaged DNA templates (Figure S8-9), shear exhibits a higher peak, and a more confined area compared to intact DNA, suggesting that damaged DNA is overall more rigid, in the sense explained above. In the purines-based damaged DNA templates (Figures S10-11), intact DNA displays a flat-like distribution, while the damaged DNA templates exhibit a more Gaussian-like distribution, but with some distinct features observed for each charge set employed for the given break. Notably, the damaged A-breaks exhibit a significantly higher peak in shear compared to the G-breaks, possibly indicating that damaged DNA with a A-break is more rigid (constrained) than one with a G-break (Figure S10-11).
Generally, stagger typically displays two peaks for intact DNA, while for damaged DNA a single peak remains except for charge set3 in the case of the G-break and for charge set4 in the case of the C-break, both retaining the two peaks. There are distinct differences between pyrimidines- and purines-based breaks in how the remaining peak shifts after introducing a break. For the pyrimidines, the single remaining peak shifts to the left relative to intact DNA, whereas in purines, it shifts in the opposite direction—to the right. Nevertheless, both shifts and the ultimate form of the distributions suggest at a more rigid structure.
Stretch variations directly impact the hydrogen bonding between base pairs. A larger movement in stretch, that is bases are further away from each other, may weaken hydrogen bonds possibly leading to a more flexible and less stable DNA structures (here, instability refers to a partial unwinding of the double helix structure). Conversely, a small change in stretch can strengthen hydrogen bonding, resulting in a more rigid and stable structure. Stretch exhibits a similar behaviour for all X-breaks, except for the G-break. While all others display a higher and narrower peak, that is the given DNA is overall more rigid, for the G-break smaller changes compared to intact DNA are observed. Thus, the G-break DNA is still more rigid relative to intact DNA but to a lesser degree.
Among the rotational parameters, buckle describes the tilt of the base pair relative to the helical axis. Any changes to buckle can cause kinks or bends in the DNA helix. In pyrimidines (Figures S7-8), only a slight leftward shift in the probability density was observed, whereas in purines (Figures S9-10), there was a significant leftward shift compared to the intact DNA, that is, damaged DNA with G- or an A-break is overall straighter than pyrimidines.
Opening is used as a criterion to reflect the separation angle between a base pair. Fluctuations in opening describe how much the bases are exposed to solvent and other molecules. A larger opening, reflected in the density as being flatter, can lead to transient states where the DNA becomes more accessible to binding proteins and other molecules. All X-breaks display a narrower distribution for opening compared to the intact structure, but for G-break to a lesser degree (Figure S10). Additionally, within purines (Figures S10-11), the opening in both G- and A- break has two peaks in the intact structure, while only one peak is left for damaged DNA which also shifted to the right. These observations indicate that the rotational flexibility around base pairs decreased again suggesting a more rigid structure.
Inter-Base Pair Step
Like the intra-base parameters, the translational parameters and rotational parameters of an inter-base step were employed to characterize the relative spatial displacement and rotation within any base pair step in the DNA (Saenger, 2013).
Figure 6.
As Figure 5, but now for twist property (an inter-base pairs parameter). Color code for each line: Intact DNA: solid cerulean blue line; damaged DNA with charge set3: dashed pumkin orange; charge set4: dashdot dark gray; charge set5: dotted mortar grey; half-protonated: densely dashdotted picton blue; non-phosphorylated: dashdotted tenne orange.
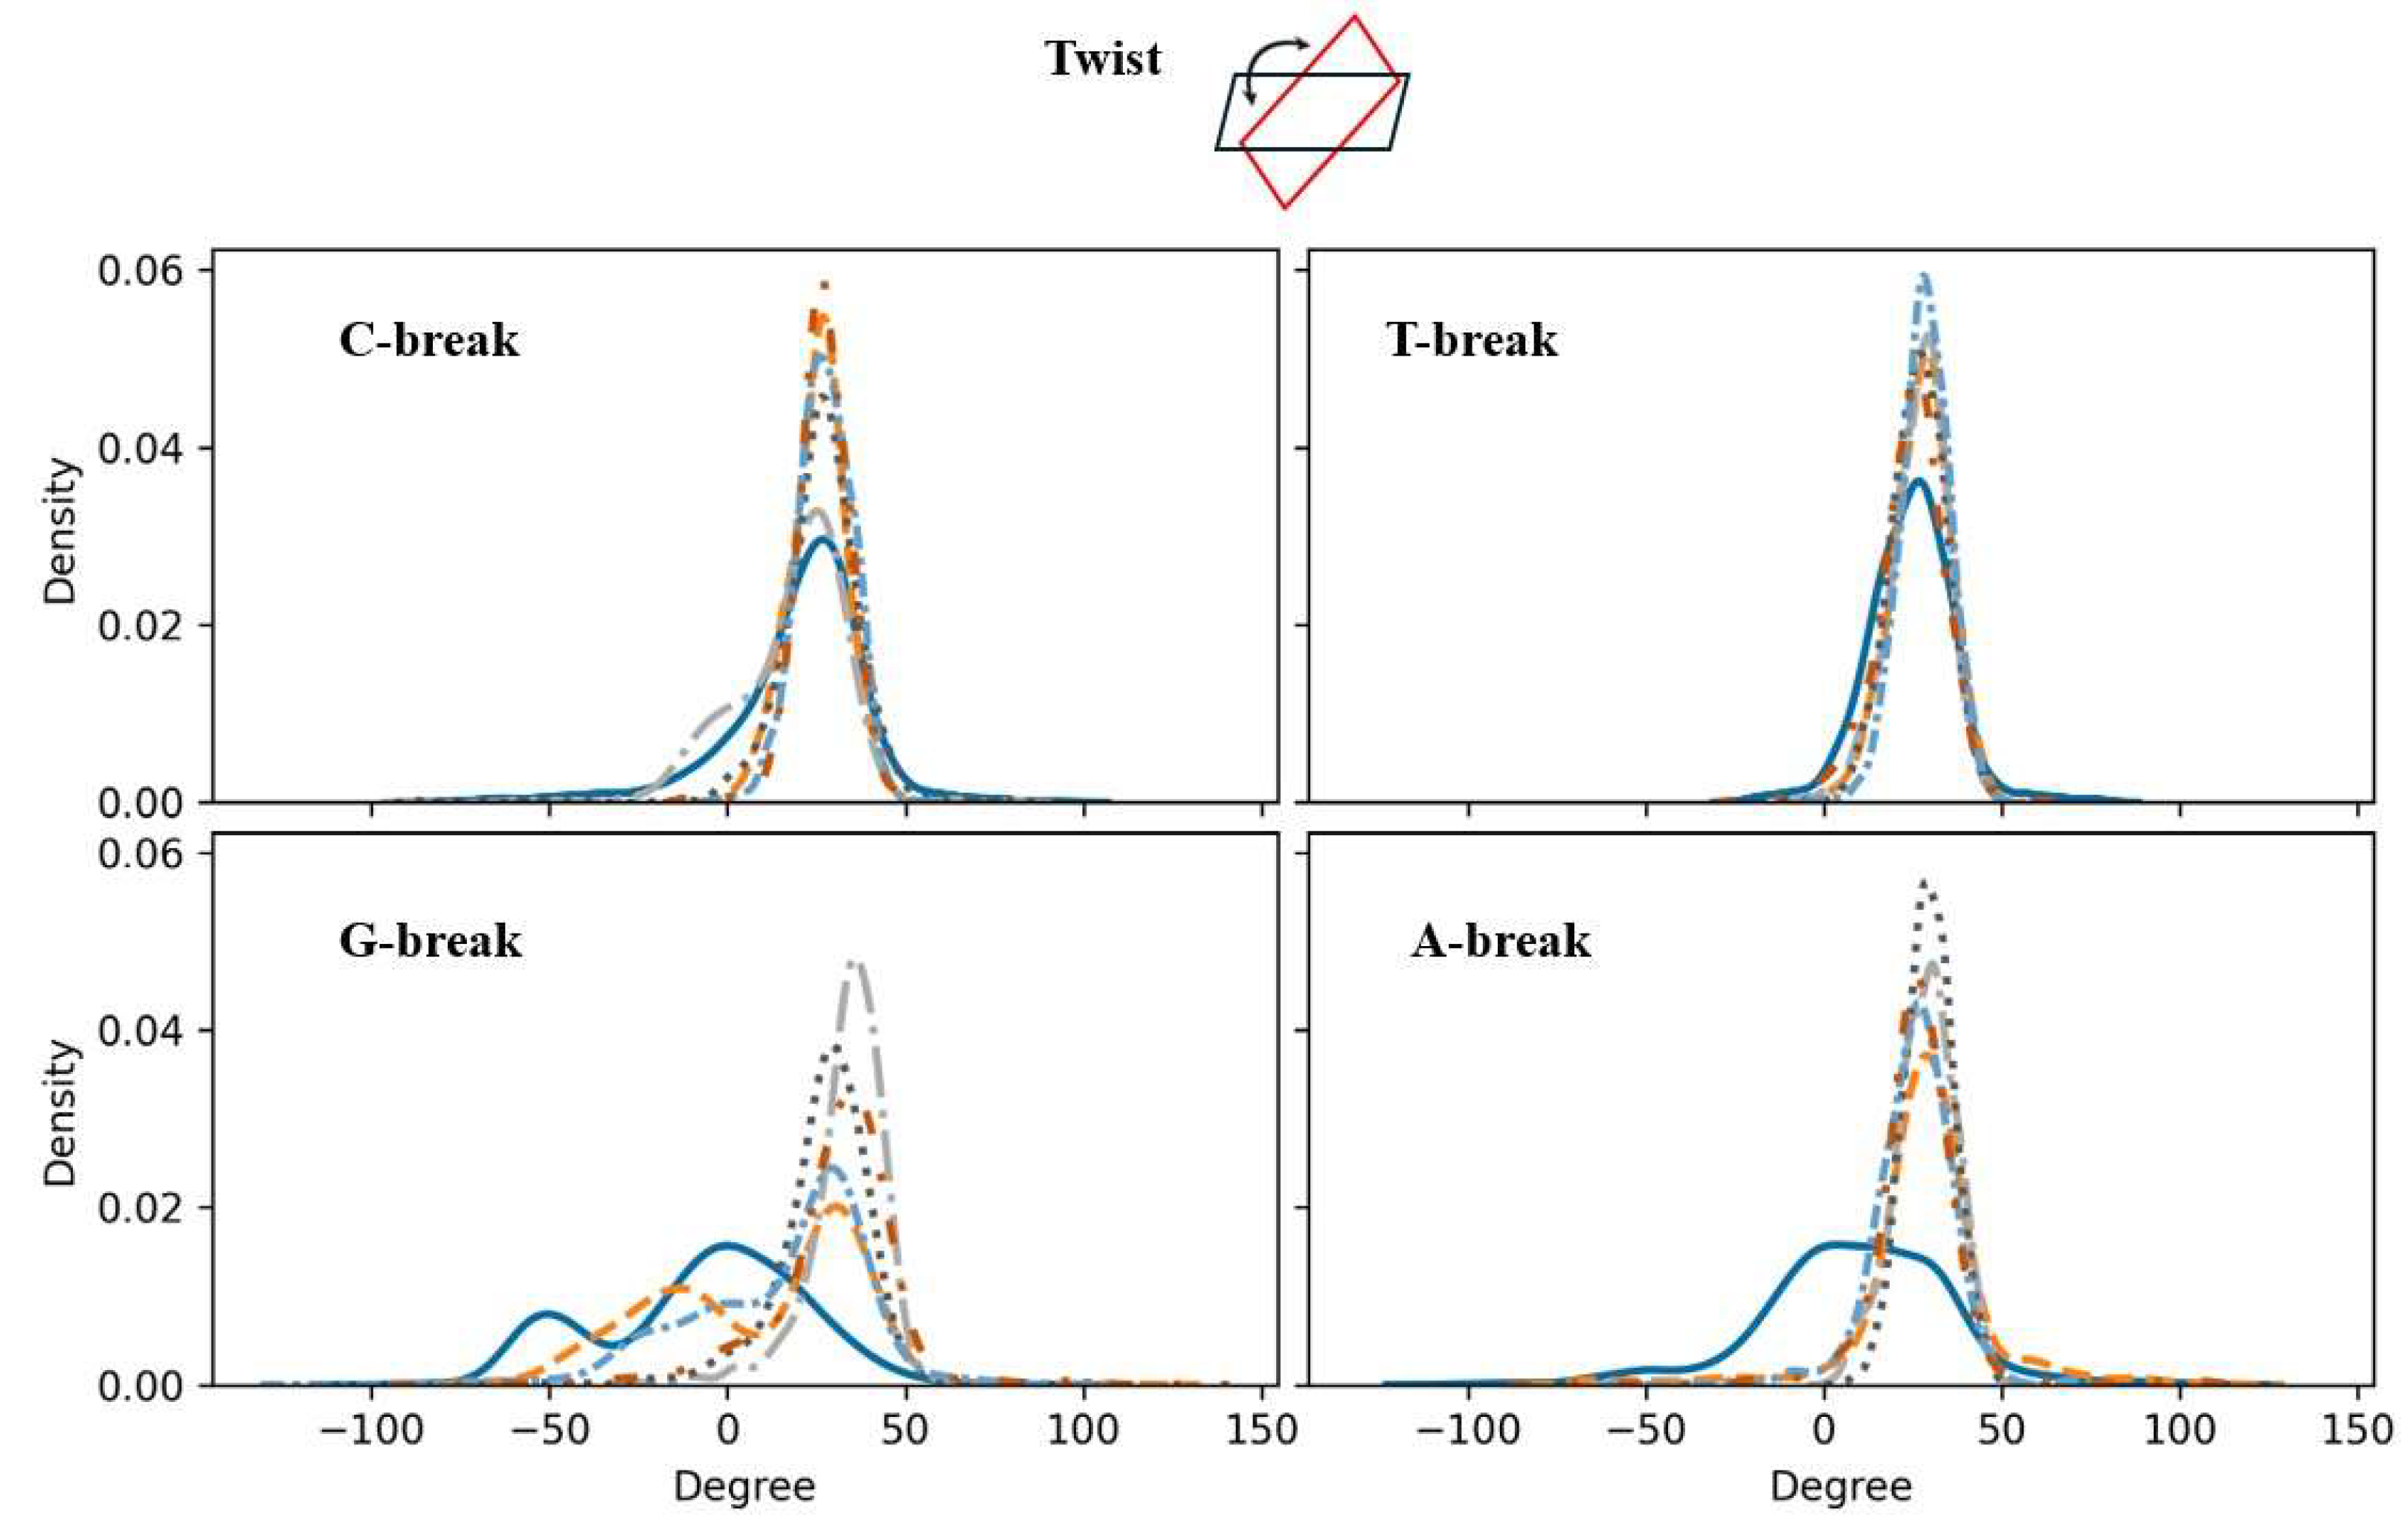
As an example, the results associated with twist are discussed here in some detail. Twist refers to the helical winding of the DNA strands around each other. Changes in twist can significantly impact the overall topology of the DNA molecule. In general, a degree of narrowing of the density relative to intact DNA is observed in Figure 6, where the effects due to the presence of a purine-based break (bottom row of the figure) appear to be more significant than for the pyrimidine-based breaks. The results point to a degree of rigidification in the sense as discussed in context of Figure 5. The G-break displays a bimodal-like distribution with a general right shift of the peaks relative to intact DNA, where the peak on the right around 30 degrees is the highest. In the case of charge sets 4 and 5, just one peak around 30 degrees remains suggesting that for these charge sets the rigidification is the strongest. For the A-break, a relatively wide distribution for intact DNA in the range of (-50, 75) becomes a narrower distribution in the interval (0, 50) in the presence of the break. The shape of the distributions is not very much depending on the charge set employed.
A larger shift may lead to a localized structural distortion, making the DNA more prone to bending and kinking. Conversely, a smaller shift could result in a more rigid and less flexible DNA segment, potentially hindering the necessary conformational changes during replication and transcription. For the X-breaks, as shown in Figure S12-15, shift exhibits an opposite behaviour for purine- and pyrimidine-based breaks. A larger shift in pyrimidines and a smaller shift in purines is observed indicating an asymmetrical variation in the C-G/A-T base pairs. Notably, for the G-break, charge set4 and dephosphorylated case have two peaks in shift, indicating two preferred conformations, the major peak in both cases is indicative of a distorted conformation, while the minor peak represents a relatively rigid molecule.
A narrowing of the slide density was found in both purines and pyrimidines, suggests a compression of the DNA ladder, potentially causing a reduction of the accessibility of the DNA to various enzymes and proteins, which may impair essential processes such as replication and repair. The rise is the distance between consecutive base pairs. A narrowing of the rise property seen in all damaged templates toward smaller values indicates that the base pairs are closer together than in intact DNA. This compaction could lead to a tighter DNA helix, which may affect the DNA’s ability to interact with proteins and other molecules.
Changes in tilt, a rotational property, can affect DNA’s ability to form stable helical structures and may influence the binding affinity of DNA-binding proteins. For pyrimidines, the slightly smaller change in tilt relative to the intact DNA might result in minor disruptions in the structure. The tilt for purines displays a significant change compared to intact DNA, which has two peaks and only one peak left in the damaged DNAs. The remaining peak in the damaged DNAs corresponds to the minor one seen for intact DNA, suggesting that the damaged DNA molecule prefers a more rigid conformation. A larger roll may lead to significant distortions, which in turn may affect the helical twist and the overall integrity of the DNA molecule. Such distortions could hinder the function of essential enzymes that interact with the DNA. Except for the charge set4 and dephosphorylated break in G-break, a tighter density of roll was also observed in all damaged DNAs possibly indicating a more constrained DNA structure. This may negatively impact the DNA’s ability to accommodate conformational changes required during interactions with regulatory proteins.
Local Bending Angles
The helical parameters within intra-/inter base pairs thus revealed a sometimes rather clear influence of the breaks on the DNA structure, especially in rotational parameters affecting DNA bending, and generally point to a degree of rigidification of damaged DNA relative to intact DNA, most clearly seen for purines-based breaks. Upon an examination of the local bending angles of all templates, some moderate changes were observed for different breaks relative to intact DNA, while some effects are also seen when changing the charge set (Table 3, Figure S16). The local bending angle was calculated by establishing vectors from the damaged site (central site in intact DNA) at both the 3’ and 5’ ends to the adjacent base pairs, respectively. A larger bending angle is indicative of a flatter DNA structure. The C-break generally sees an increase in the local bending angle for charge sets3 to 5 but is always smaller than the bending angle of intact DNA. The T-break also sees an increase but become larger than the bending angle of intact DNA for charge set4. The bending angle for the G-break is not greatly affected. For the A-break, also a general but small decrease is seen. Both results are in line with the observed variations of the rotational helical parameters of the purines, that pointed out that a phosphorylated G-/A-break is a stiffer structure compared to its intact DNA. The bending angles of the half-protonated cases are generally relatively close to those of the intact DNA, the largest deviation from intact DNA is seen for the C-break. For all X-breaks, the local bending angle of a dephosphorylated break (“non-P”) is always greater in comparison to the others. The local bending angle of phosphorylated X-breaks (charge set 3 to half-protonated) are all between 100° to 120°, except for the T-break. An increasing trend in the bending angle may be associated with specific sequence-dependent structural dynamics or localized environmental factors possibly affecting the phosphate group’s dynamical behaviour (see below).
Table 3.
The local bending angle and its standard derivation for intact DNA and damaged DNA using charge sets3 to 5, half-protonated, and dephosphorylated (“non-P”). The associated distribution plots are shown in Figure S16.
Table 3.
The local bending angle and its standard derivation for intact DNA and damaged DNA using charge sets3 to 5, half-protonated, and dephosphorylated (“non-P”). The associated distribution plots are shown in Figure S16.
| Intact | Set3 | Set4 | Set5 | Half-pro | Non-P | |
| C-break | 118.25 ± 11.32 | 107.69 ± 11.82 | 110.38 ± 12.12 | 110.64 ±15.25 | 106.79 ± 14.95 | 132.87 ± 18.98 |
| T-break | 121.66 ± 11.62 | 118.97 ± 17.80 | 125.48 ± 17.38 | 135.01 ± 15.75 | 119.98 ± 12.97 | 138.89 ± 18.81 |
| G-break | 113.61 ± 9.62 | 115. 48 ± 14.64 | 112.60 ± 11.68 | 113.62 ± 12.11 | 116.40 ± 12.92 | 125.66 ± 13.78 |
| A-break | 115.19 ± 11.42 | 107.77 ± 11.04 | 107.54 ± 10.37 | 112.71 ± 11.17 | 112.61 ± 11.09 | 122.95 ± 12.75 |
Given the large standard deviations, it is somewhat questionable whether the trends are significant. The angel distribution plots in Figure S16 show mostly overlapping curves. The density for the C-break does seem to indicate a general left-shift of the angle towards smaller values, except for the non-phosphorylated case displaying a wider distribution. The differences between the densities for the other three breaks are less clear. The somewhat higher standard deviation seen for dephosphorylated breaks may indicate that the given template is bending over a larger range, as seen for the C-break. In that sense, the template is somewhat less constrained.
Local Stiffness
To further detail the impact of a break on the DNA structure, the local stiffness along the sequence was examined as well, as estimated from each of the local inter-base helical parameters computed along the sequence. This investigation aimed to assess the effects of a break on the flexibility of DNA around the break site itself. In Figure 7 and Figures S17-20, the upward peaks correspond to increased stiffness, indicating a relatively rigid base pair step. Conversely, the downward peaks signify decreased stiffness, reflecting a more flexible base pair step. For the translational local stiffness (shift, slide, rise), comparable observations can be made for pyrimidines- and purines-based breaks. That is, damaged DNA generally displays a somewhat increased flexibility at the break site relative to the intact DNA, except for the T-break exhibiting shift stiffness comparable to intact DNA (Figure S18).
Figure 7.
The local stiffness (kcal mol-1 degree2) calculated for twist of each base pair step for intact DNA and damaged DNA of X-break. Top row: C-break (left), T-break (right) (pyrimidines); bottom row: G-break (left), A-break (right) (purines). The X-break in each DNA template is highlighted in red. Intact DNA: solid cerulean blue line; damaged DNA with charge set3: dashed pumkin orange; charge set4: dashdot dark gray; charge set5: dotted mortar grey; half-protonated: densely dashdotted picton blue; non-phosphorylated: dashdotted tenne orange.
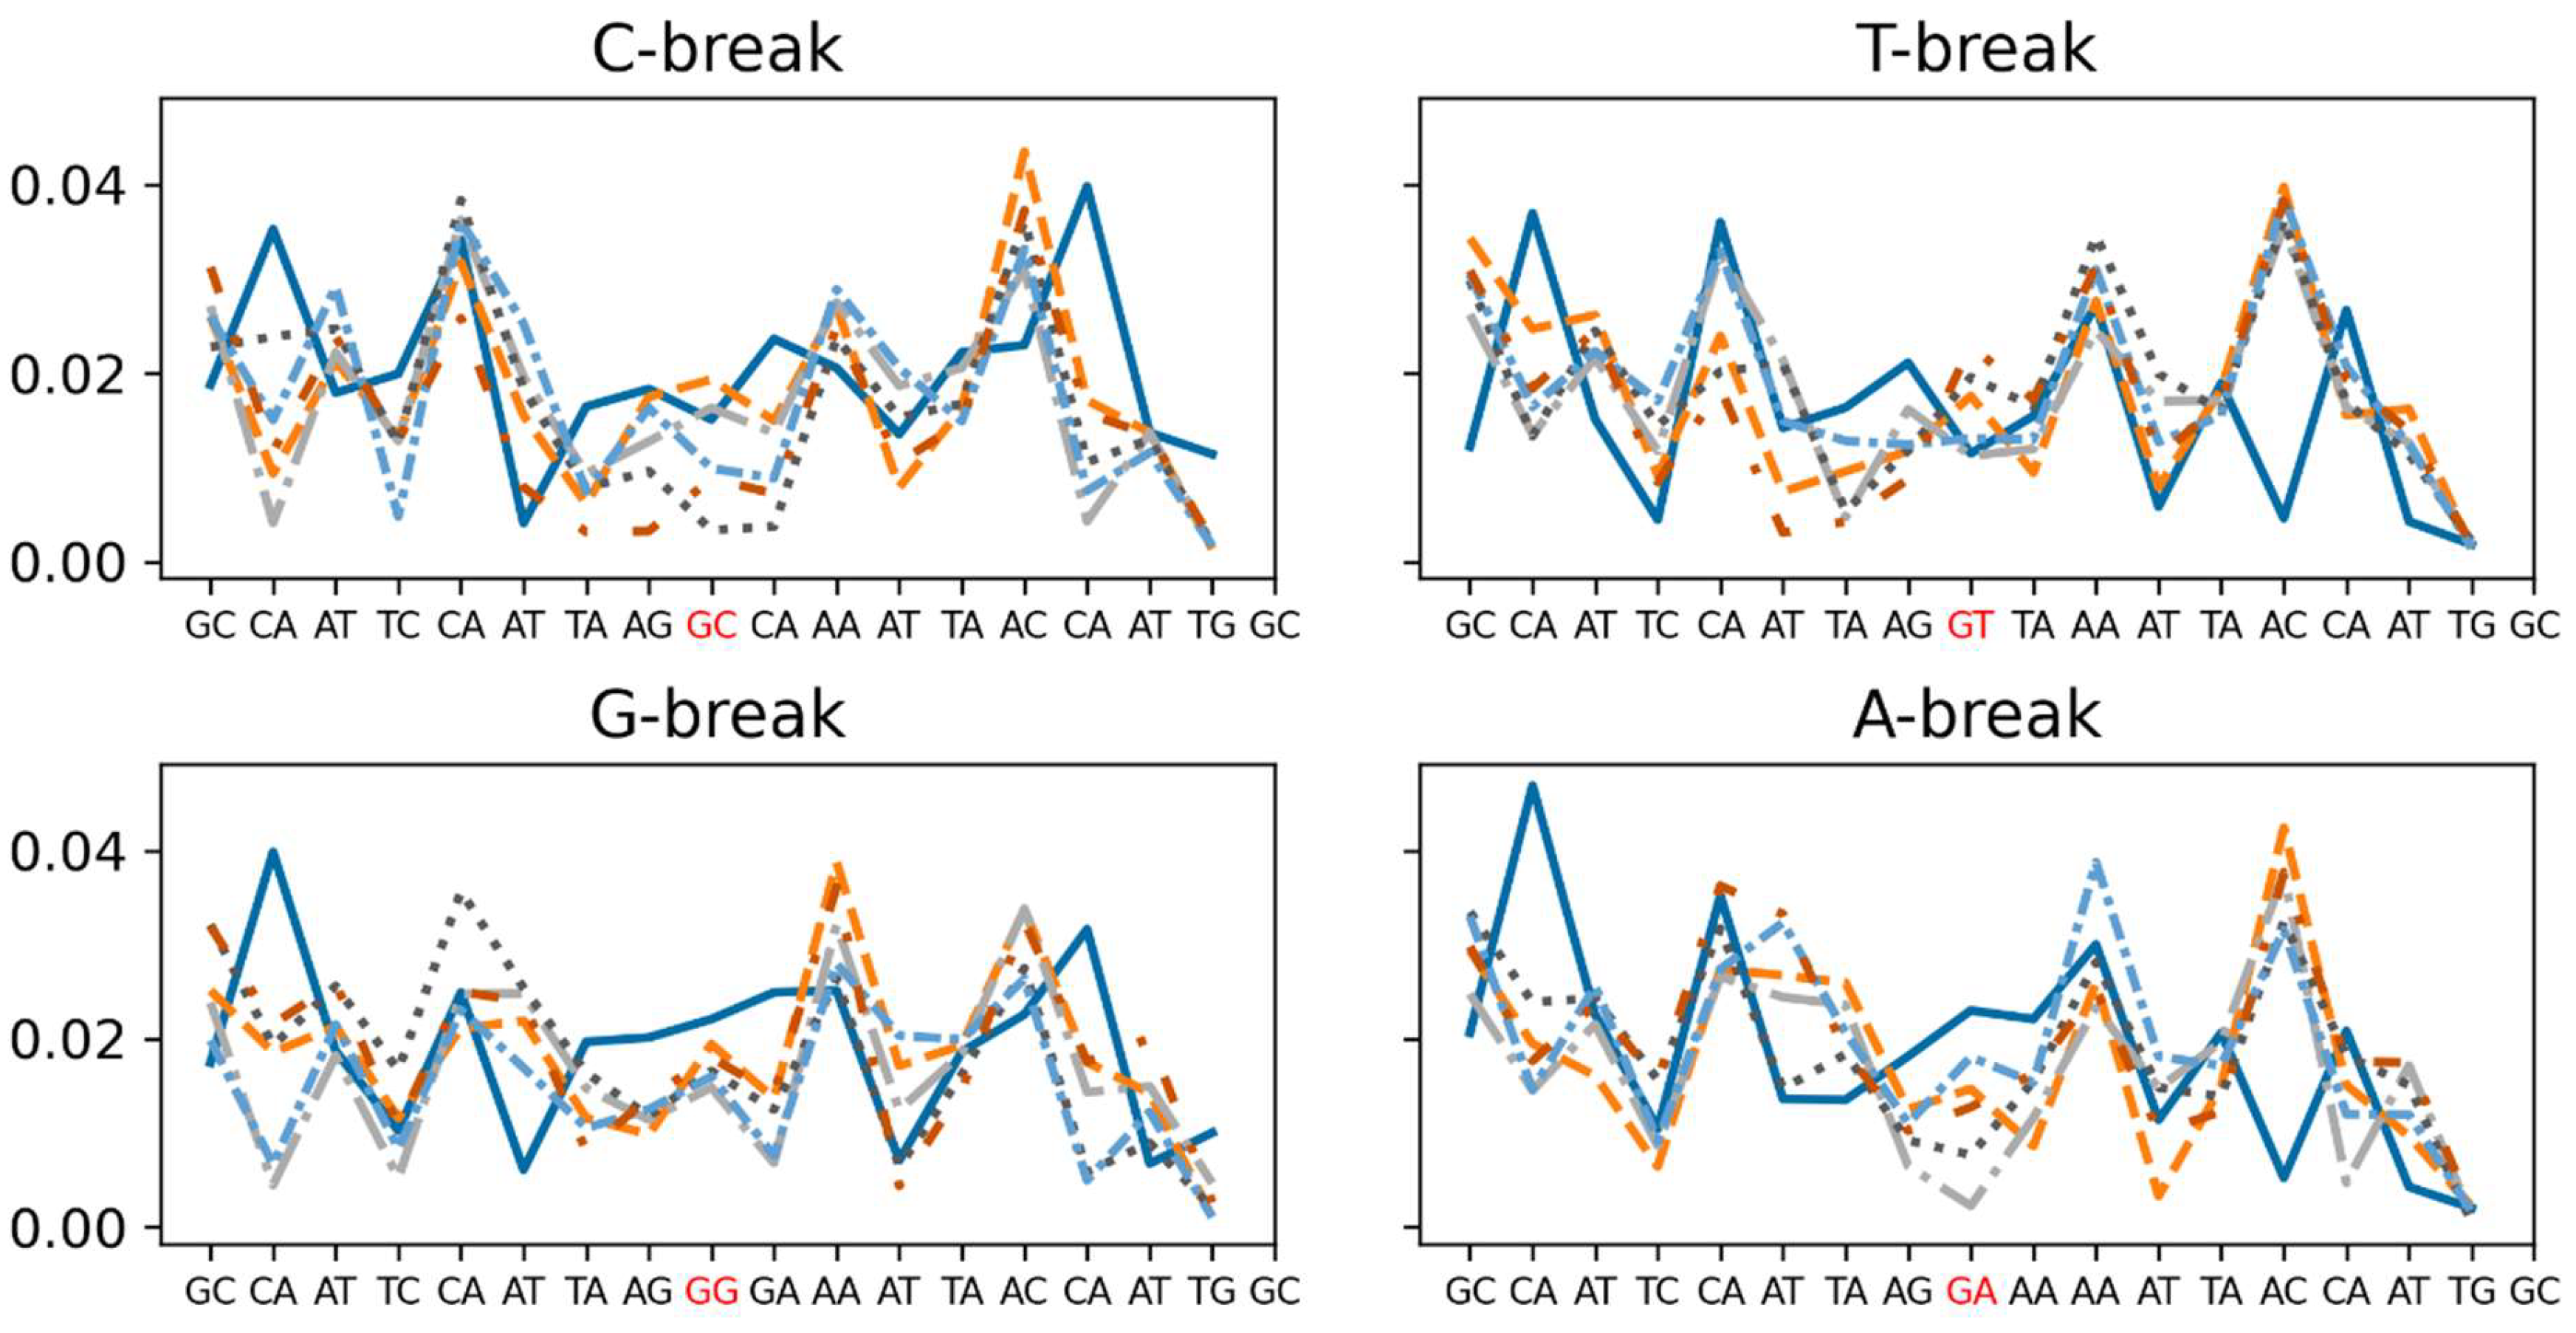
For rotational stiffness of X-breaks, relative to intact DNA, the tilt and roll are less rigid at the base step following the break whereas at the break site itself increased stiffness is observed. However, for twist, both purine-based breaks exhibit decreased stiffness around the break site of damaged DNA relative to intact DNA (Figure 7). That is, DNA is locally around the break site more flexible with weakened local stacking contact. The twist stiffness at the C-break is lower than that of intact DNA for all damaged structures except charge sets 3 and 5. In the case of the T-break, intact DNA appears to be more flexible than the damaged DNA at the break site, which may explain why there is only minimal difference in the local bending angle among the different charge sets; some even display less bending than the intact T-structure. This may be a consequence of a higher stiffness at the break site, while the base pairs immediately before and after the break exhibit increased flexibility.
5’. Phosphate Group Dynamics
Located at the break site is a dangling 5’P group. Its dynamics regarding orientation preferences were examined in terms of the hydrogen-bonded, outward I, outward II, and the other states (Figure 2). In Table 4 and Figure S21, the probability of occurrence of the four orientational states for all break types are reported, also including an estimate of the error in the analysis.
Table 4.
The probability of occurrence of 5’P orientational states for X-breaks calculated for charge sets3 to 5 and half-protonated 5’P: A) C-break, B) T-break, C) G-break, and D) A-break. A measure of the error is included. A visual representation of the probabilities is provided in Figure S21.
Table 4.
The probability of occurrence of 5’P orientational states for X-breaks calculated for charge sets3 to 5 and half-protonated 5’P: A) C-break, B) T-break, C) G-break, and D) A-break. A measure of the error is included. A visual representation of the probabilities is provided in Figure S21.
| A | ||||||
|---|---|---|---|---|---|---|
| C-break | Set3 | Set4 | Set5 | Half-pro | ||
| H-bond | 0.50 ± 0.02 | 0.57 ± 0.02 | 0.50 ± 0.02 | 0.47± 0.02 | ||
| Outward I | 0.18 ± 0.01 | 0.28 ± 0.01 | 0.31 ± 0.01 | 0.35 ± 0.02 | ||
| Outward II | 0.20 ± 0.01 | 0.01 ± 0.00 | 0.02 ± 0.00 | 0.01 ± 0.00 | ||
| Other | 0.11 ± 0.01 | 0.14 ± 0.01 | 0.17 ± 0.01 | 0.17 ± 0.01 | ||
| B | ||||||
| T-break | Set3 | Set4 | Set5 | Half-pro | ||
| H-bond | 0.46 ± 0.02 | 0.50 ± 0.02 | 0.43 ± 0.02 | 0.31± 0.01 | ||
| Outward I | 0.30 ± 0.01 | 0.31 ± 0.01 | 0.38 ± 0.02 | 0.40 ± 0.02 | ||
| Outward II | 0.01 ± 0.00 | 0.03 ± 0.01 | 0.01 ± 0.00 | 0.07 ± 0.01 | ||
| Other | 0.23 ± 0.01 | 0.16 ± 0.01 | 0.19 ± 0.01 | 0.22 ± 0.01 | ||
| C | ||||||
| G-break | Set3 | Set4 | Set5 | Half-pro | ||
| H-bond | 0.39 ± 0.02 | 0.38 ± 0.02 | 0.38 ± 0.02 | 0.25 ± 0.01 | ||
| Outward I | 0.37 ± 0.02 | 0.45 ± 0.02 | 0.48 ± 0.01 | 0.62 ± 0.02 | ||
| Outward II | 0.21 ± 0.01 | 0.12 ± 0.01 | 0.12 ± 0.01 | 0.10 ± 0.01 | ||
| Other | 0.03 ± 0.01 | 0.05 ± 0.01 | 0.02 ± 0.00 | 0.03 ± 0.01 | ||
| D | ||||||
| A-break | Set3 | Set4 | Set5 | Half-pro | ||
| H-bond | 0.50 ± 0.02 | 0.57 ± 0.02 | 0.37 ± 0.02 | 0.30 ± 0.01 | ||
| Outward I | 0.41 ± 0.02 | 0.35 ± 0.02 | 0.36 ± 0.02 | 0.42 ± 0.02 | ||
| Outward II | 0.06 ± 0.01 | 0.03 ± 0.01 | 0.19 ± 0.01 | 0.23 ± 0.01 | ||
| Other | 0.03 ± 0.01 | 0.04 ± 0.01 | 0.08 ± 0.01 | 0.05 ± 0.01 | ||
For a C-break (Table 4A), the hydrogen-bonded state generally displays the highest probability of occurence for charge sets3 to 5 considered, followed by outward I, while outward II and other have a rather low or even zero probability of occurrence in comparison. While the actual percentages are different among the charge sets employed, the observed order of preference for individual states generally remains the same. In going from set3 to 4, outward II loses probability that is mostly shifted to outward I. For charge sets4 and 5, almost all outward states are in fact outward I. The probability is increasing for outward I with the charge set employed and reaches its maximum of 0.35 or 35% for the half-protonated state, where the probability ratio is about 47/35% for hydrogen-bonded and outward I.
As another pyrimidine, the results of the T-break (Table 4B) were expected to be similar to that of the C-break. The upward trend of the outward I probability follows that of the C-break, but with the observation that the probability for set3 (0.30) is about twice as high in comparison to same probability of the C-break (0.18). The hydrogen-bond probability displays a similar pattern as seen for the C-break. Outward II and other display lower probabilities. As seen for the C-break, the numbers change but the order of preference for individual orientational states remain similar. Outward I for the half-protonated T-break displays the highest probability (0.40 versus 0.31, 0.07, and 0.22 for hydrogen-bonded, outward II, and other, respectively).
For the G-break (Table 4C), a similar increasing trend is observed for outward I as already seen for the pyrimidines, from 0.37 to 0.48 for charge sets 3 to 5, while hydrogen-bonding remains constant at 0.38. The probability for outward II is somewhat higher for these charge sets when compared to the C- and T-break probabilities. Also here, the actual numbers change when using a different charge set, but trends remain the same. For the half-protonated G-break, outward I display the highest probability (0.62), while at the same time hydrogen-bonded is significantly lower (0.25) with even lower probabilities for outward II (0.10) and other (0.03), respectively.
Finally, Table 4D displays the results for the A-break. The hydrogen-bonded is becoming less preferred for charge sets3 to 5, outward II and other always display a lower probability, and outward I’s probability displays a downward trend from 0.41 to 0.36. An identical observation is made for the half-protonated state as before, where again it is seen that outward I displays the highest probability (0.42) relative to the other orientation states, that is 0.30, 0.23, and 0.05 for hydrogen-bonded, outward II, and other, respectively.
The residence time of each orientation state of the X-breaks was also examined, and it was observed that the residence times are always under 15 ps.
Radial Distribution Function
The results presented above indicated that the presence of phosphate groups impacts DNA at various levels. To closely examine the dangling phosphate group at the break site, the radial distribution function (RDF) between the phosphorus (P) of the 5’ phosphate group and the oxygen (O) of water was investigated (Figure S22). The RDF for the X-breaks are rather similar and are independent of the charge set employed, implying a similar water solvation structure around the 5’P in all cases, including the half-protonated X-breaks.
Discussion
The principal objective of this study is to characterize damaged DNA with emphasis on 5’ end phosphorylated breaks employing atomic molecular dynamics simulation (ATMD) techniques. The templates employed in this study all have the same sequence except at the break site, where a pyrimidine was replaced by another pyrimidine or a purine (Table S1). All break types and protonation states of the 5’P at the break site were considered, along with the effects of different base pairs connected to the 5’P on the local and global structural and dynamic properties of the DNA template. A comparison was made between the damaged and intact DNA of the same sequence.
One complication in achieving the goal was the lack of a properly parametrized force field for damaged DNA, related to the break site where the 5’P is either single protonated or fully deprotonated (the latter case is referred to as “half-protonated” as the opposing 3’O still carries a proton). Consequently, while almost all of the force field parameters for intact DNA were also employed for damaged DNA, efforts were spent on validating several charge distributions for protonated 5’P (see Table 1). Unfortunately, since no experimental data is available specifically related to damaged DNA, a complete validation is not possible. Thus, the aim was to employ several charge distributions for the 5’P, both with a single proton attached and without any protons bound, and to test whether the outcome of simulations would be strongly affected by different charge sets. A series ATMD simulations of a 20 bp DNA template, each covering a time scale of 1000 ns, with a break representing a single stranded break (SSB) DNA were completed. No large effects on various properties were detected when choosing another charge set in the sense that the observed trends remained similar. While one cannot select the “best” charge set for lack of experimental data, the results do demonstrate that the outcomes of the simulations are not too sensitive to the exact choice of the charge set such that one may assume that the observed differences in behaviour between the templates are not caused by severe errors in the force field but represent indeed real changes caused by different break types, protonation states, and so forth. Given that charge set3 for the single protonated 5’P represents a force field for damaged DNA that is the closest to the original force field for intact DNA, it may be selected for future work.
A series of investigations were conducted for the analysis of a variety of helical parameters, both translation and rotational properties, focusing both on global aspects related to the full DNA structure and local effects around the break site in damaged DNA. Certain changes in the distribution of these helical parameters relative to intact DNA emerge if a break is present. The intra-base pair/inter-base pair steps helical parameters analysis also revealed distinct behaviours between pyrimidine- (cytosine and thymine) and purine-based breaks (adenine and guanine) under the same simulation conditions. Specifically, pyrimidines mostly behaved uniformly, maintaining consistent structural features in the presence of different type of break. This uniformity suggests that the single-ring structure of pyrimidines causes an increased rigidity that maintains the stability of the structure. Purines exhibited more changes in these helical parameters in the damaged DNAs relative to intact DNA. The larger, double-ring structure of purines introduces additional complexity to their interactions within the DNA helix. These interactions are more sensitive to the perturbations, such as introducing a break in the structure, leading to larger changes in helical parameters. For damaged DNA, these parameters are seen to be constrained to certain values, pointing also to a degree of rigidification of the structure relative to intact DNA. That is, for the latter, the same distribution is flatter, indicating a less constrained structure. These changes in helical parameters can affect the local flexibility and conformational dynamics of the DNA, potentially influencing how the molecule responds to damage and how the repair mechanism is initiated. Taken together, from the simulations one observes that DNA molecules do not respond in the same way to the presence of a break, with subtle differences between purines- and pyrimidines-based break sites.
As noted, a degree of global rigidification of the templates is seen in the presence of a break. At the same time, however, according to the local stiffness analysis, the region around the break site is found to be more flexible in comparison to intact DNA. This may be due to the missing bond in damaged DNA between the 5’P and subsequent base of the strand. While it stands to reason that these observations may imply that different sensor proteins therefore recognize different break types, one cannot be certain of this at this point.
Earlier MD simulations of intact DNA have shown that the pyrimidine-purine steps are flexible, purine-purine steps are intermediate flexible and the purine-pyrimidine steps are relatively stiff in all helical parameters but in shift and slide (Lankas et al., 2003). The breaks simulated in this study are two purine-pyrimidine steps (C- and T-breaks) and two purine-purine (G- and A-breaks) steps. For the intact DNA in case of C- and T-break models, the steps before and after the break are a purine-purine (AG) and a pyrimidine-purine (CA or TA) step, respectively. The net result is that overall, this region in intact DNA is supposed to be more rigid area since AG are relatively stiff, while CA and TA steps are flexible. The steps at the break site itself is a GC and GT base pair (both purine-pyrimidine base pairs) and these are stiff. Conversely, purine-purine steps (G- and A-breaks) supposed to be relatively flexible, as in the given sequence the neighbouring steps are all purine-purine steps (AG and GA, and AG and AA), so that this region would be flexible. However, the observed flexibility around the break site in the intact DNA structures was not entirely according to the results from these previous studies. Nevertheless, these studies also noted that the stiffness of the same base pair step has different value in different sequences, indicating that the degree of flexibility of DNA is sensitive to the actual DNA sequence.
The analysis shows that the presence of a break markedly reduces the local stiffness in most of the simulated templates, regardless the combination of the base pair steps. The presence of the break is making the break region more flexible and less resistant to deformation. The reduction in local stiffness may be a critical aspect of the DNA’s response to damage, as it would contribute to the variations of the local conformation that eventually may influence for instance the width and depth of the both the major and minor grooves, the common binding locations for the DNA binding proteins. A more flexible local structure around the break site could also facilitate the recognition of breaks by DNA repair enzymes, allowing them to efficiently recognize and bind to damaged DNA for repair. The difference in stiffness between intact and damaged DNA also highlights the potential for sequence-specific effects. While the global structure becomes more rigid, the increased local flexibility at the break site suggests that the sequence context around the break can modulate the extent of this rigidification. Purine-rich regions might exhibit different mechanical properties compared to pyrimidine-rich regions, affecting how the DNA bends and twists near the break, such that different types of breaks possibly may be processed by different sets of repair proteins, tailored to the specific mechanical and structural properties of the damaged site.
The local bending angle analysis demonstrated that the presence of phosphate groups influences the flexibility and bending properties of the X-breaks (referring to the different nucleotide to which the break site’s 5’P phosphate group is attached, X is either ‘C’, ‘G’, ‘A’, or ‘T’). Specifically, the dephosphorylated breaks (“non-p”) exhibit for all X-breaks higher local bending angles, suggesting that the removal of phosphate groups makes damaged DNA on average flatter. On the other hand, the phosphorylated X-breaks (charge set 3 to half-protonated) demonstrate a more consistent bending angle range between 100° to 120°, indicating that the presence of phosphate groups may help to maintain a certain degree of flexibility and structural integrity around the break site. The consistency in the bending angles across these charge sets suggests that the different partial charge distributions of the phosphate group did not affect the local structural flexibility.
The motion of the 5’P dangling at the centre of the break site was also analysed. The present study considered both pyrimidines- and purines-based break sites, where the 5’P is either single protonated or deprotonated. Only two other studies of damaged DNA with a A-break have been carried out by Yamaguchi et al., (2002) and Bunta et al. (2006). The first study found that the effects due to the presence of a break on the overall conformation of the damaged DNA was relatively small in comparison with intact DNA, while the latter study demonstrated that an oxygen of the 5’P will form a hydrogen bond with the 3’end hydrogen after about 2 ns of the simulation (this would be referred to as a hydrogen-bonded orientational state in the terminology of this work, Figure 2) and it remained in that state during the remainder of the simulation. Bunta et al. (2006) stated that the orientation of the DNA break phosphate group probably plays a role in the DNA break recognizing process during the early stages of the DNA repair process, but it may be difficult for sensor proteins to detect such breaks if the hydrogen bond formed between the 5’-phosphate and 3’-end remains stable. The analysis conducted here found that a variety of orientational states for 5’P may be identified during any given simulation of a template. To classify these the present work defined four orientational states for the 5’P group (Figure 2).
The hydrogen-bonded and outward I was frequently preferred over the other states (outward II and other). This finding is only partially in agreement with the findings of Bunta et al. (2006), who reported that the hydrogen-bonded was preferred once a hydrogen bond is formed between atom O2P and H3T. For all X-breaks and the 5’P protonated state, at least 30% of the simulation time the 5’P is in the hydrogen-bonded state irrespective of the charge set employed. There are several reasons as to why the hydrogen-bonded state is among the preferred states for X-breaks. Firstly, hydrogen bonds can stabilize the structure. DNA is a highly dynamic molecule, and the entire system is always in a dynamic equilibrium. The more stable or energetically more favourable states tend to be occupied more frequently. For a phosphorylated X-breaks, also referred to as a nick break, the distance between 3’ and 5’ end in the same strand is small such that the 3’ and 5’ ends can favourably form a hydrogen bond. Additionally, forming a hydrogen bond can be thermodynamically favourable because it lowers the system’s overall free energy. Moreover, the phosphate groups in DNA create a highly negative electrostatic environment, which can influence the formation of hydrogen bonds. When the 5’ end is phosphorylated, the negative charges can help attract the positively charged hydrogen atoms of adjacent nucleotide bases, promoting the formation of (transient) hydrogen bonds. Secondly, during any given simulation, the three oxygens of the phosphate group were constantly rotating. To achieve an accurate measurement of the prevalence of hydrogen-bonded, all three oxygens were selected to detect whether a hydrogen bond was formed between these oxygens and H3T. In contrast, Bunta et al. (2006) apparently only observed that the hydrogen bond is formed, specifically between the O2P and H3T. Figure S6 demonstrated that any of three oxygens can form a hydrogen bond with H3T. An analysis of the residence time of orientational states revealed that despite the high probability of occurrence of the hydrogen-bonded and outward I orientation states (Figure S21), the frequency of the transitions into and out of these states and the other orientation states leads to short residence times up to about 15 ps, a number that is compatible with the characteristic times of chemical groups. This observation contrasts the much longer hydrogen-bonded residence time of 8 ns seen by Bunta et al. (2006). Given the short simulation of just 10 ns, their observations may not be entirely indicative.
Between two substates of outward, outward I is predominant for all breaks, particularly for the half-protonated case. The latter may be explained in terms of favourable solvation of the phosphate group by the highly polar solvent (an electrolyte, the simulations were conducted at 0.15 M). However, the radial distributions functions (Figure S22) did not identify clear differences in the solvation structure around 5’P. For the half-protonated break, the 5’P carries an extra negative charge, possibly resulting in a greater repulsive force from local base pairs compared to the protonated charge sets, leading to a higher probability of adopting the outward I state. By examining the nucleotide’s geometry of outward I and outward II, both the anti and syn conformations are seen to be adopted, while the sugar puckering mode in these two states was also different. Outward I adopts a C2’-endo conformation, whereas outward II contains a C3’-endo five-membered furanose ring. The C2’-endo conformation is commonly preferred in B-form DNAs (Hartmann & Lavery, 1996), which allows more conformational freedom, making the prevalence of outward I over outward II more likely (Figure S2-S5).
This work also demonstrated an effect on the 5’P dynamics due to the protonation state of the 5’P. If a phosphate group free in solution is remotely representative for the 5’P in damaged DNA, then, chemically, it is rather unlikely that both the 5’P and 3’O are fully deprotonated as their pKa (acid dissociation constants) values would suggest that 5’P would carry at least one proton, while also the 3’O would always be protonated. For the phosphoric acid free in solution, the pKa values for the three oxygens are reported to be 2.2, 7.2, and 12.4 (Clayden, et al., 2012). The DNA backbone phosphate has a very low pKa of around 1, but the terminal phosphate can potentially be in a dianionic state with a higher pKa close to 7 (Thaplyal & Bevilacqua, 2014). Placing two negatively charged groups at proximity is unlikely due to highly unfavourable electrostatic interactions between them. Nevertheless, it is still possible that the 5’P is transiently in the fully deprotonated state, while the 3’end is still protonated (this case is referred to as the “half-protonated” state in this work). Thus, to test this alternative situation, a series of simulations were conducted for all half-protonated X-breaks. In all these simulations, a notable change in the probability of the 5’P was observed in that the outward I state is now always preferred over all other states (except for the C-break). Apparently, the presence of a fully negatively charged phosphate group at the break site pushes the 5’P to the outward position likely due to repulsive electrostatic interactions between 5’P and the negatively charged DNA backbone. The structural analysis results of half-protonated and single protonated 5’P using different charge sets showed that the half-protonated 5’P exhibited a similar behaviour as charge set3. Given the differing behaviour of the 5’P dynamics for the two protonation states, along with the suggestion by Bunta et al. (2006) that a hydrogen-bonded state may not be so effective for initiating the DNA repair process, a fully deprotonated 5’P would be more useful as it points outward more frequently.
On a final note, it is worthwhile to briefly discuss whether any of the results presented here are in fact transferable to the actual cell environment. The 5’P dynamics measurements in the present work were defined based on the geometry of pyrimidine and purine, respectively. Therefore, they are not based on DNA sequences and should therefore be transferable to all nucleotides in any given DNA sequence. An interesting question is: what would be the most efficient length of a portion of DNA with a break site that should be exposed such that sensor proteins can effectively bind to the break site? Increased accessibility could potentially promote better recognition by DNA repair enzymes. While no information to date exists on this matter, the current study may be extended to longer and different sequence DNA to examine the length and sequence effects on the 5’P dynamics more carefully using the tools developed in this work. As Bunta et al. (2006) already pointed out, the outward I conformational state for 5’P may facilitate recognition and binding to sensor proteins. In this context, it is noteworthy that the outward I orientational state as defined in this work is fully compatible with the observed orientations of the 5’P in reported DNA-protein complexes (PDB codes: 6X0L and 7AEO) with breaks (Bilokapic et al.,2020) (Obaji et al., 2021). An extended study could provide a comprehensive view of the correlations between 5’P dynamics and the appropriate length of DNA, which may contribute towards an understanding of chromatin accessibility after DNA damage.
Conclusions
The primary objective of this work was to characterize at the molecular level the effects of breaks in DNA. It has shed light on complicated structural changes in DNA SSBs, particularly those of phosphorylated DNA breaks. Several helical parameters related to base pair step, base pairs, backbone torsions, bending, chain stiffness and the dynamics of the break site 5’P phosphate group, among other, were investigated employing molecular simulation techniques for a DNA template of 20 bp as a function of break type and the 5’P protonation state. For this, several methodologies were developed for a proper evaluation of such structural and dynamical effects in SSBs. The analysis has resulted in intriguing observations that are summarized below.
To a certain degree, the presence of a break results in a degree of rigidification of the given DNA structure globally, but around the break site an increase of flexibility is seen. The latter is likely the result of the bond broken between the 5’P and the subsequent base. Several authors have suggested that the 5’P group plays an important role in the recognition process of the break site by signal proteins in the early stages of the DNA repair process, the exact details of which are however unknown. It is possible that because of the increased local flexibility around breaks there is a higher chance for the 5’P to be in an outward position that may facilitate recognition of the break site by specific sensor proteins. If so, given that for the half-protonated state, where the 5’P is void of any protons, the phosphate group displays an even higher probability of pointing outward, the fully deprotonated 5’P would be more effective for initializing the DNA repair process. While the effects on DNA structure in the presence of a break are overall similar, there are also some noticeable differences in responses between pyrimidines- and purines-based breaks at the molecular level, but at this point one cannot immediately state whether these differences are relevant for the DNA repair process. Finally, the employed charge sets appear to incite similar responses in DNA due to the presence of a break in the given DNA. While one cannot strictly choose the “best” charge set, as no experimental evidence is in fact available for validation, set3 is close to the force field of intact DNA and is perhaps the safest choice for subsequent work.
Supplementary Materials
The following supporting information can be downloaded at the website of this paper posted on Preprints.org.
Acknowledgements
We greatly thank CSC (Center of Scientific Computing, www.csc.fi) for providing computing power. The research was supported by the Research Council of Finland (Grant No. 347026), by the Biocenter Oulu spearhead project funding for L.L., and the Biocenter Oulu Biocomputing Research Infrastructure (O.L. and A.H.J.). The research was also supported by Biocenter Finland.
References
- Abbotts, R., & DM, W. (2017). Coordination of DNA single strand break repair. Free Radical Biology and Medicine, 228-244. doi:https://doi.org/10.1016/j.freeradbiomed.2016.11.039.
- Afonin, K., Kasprzak, W., Bindewald, E., Puppala, P., Diehl, A., Hall, K., . . . Shapiro, B. (2021). Computational and experimental characterization of RNA cubic nanoscaffolds. In Therapeutic RNA Nanotechnology (pp. 121-149). New York: Jenny Standford Puhlishing. doi:https://doi.org/10.1201/9781003122005.
- Alberts, B., Johnson, A., Lewis, J., Raff, M., Roberts, K., & Walter, P. (2003). The Structure and Function of DNA. In Molecular Biology of the Cell. New York: Garland Science. doi:https://doi.org/10.1093/aob/mcg023.
- Alhmoud, J., Woolley, J., Moustafa, A.-E., & Mallei, M. (2021). DNA damage/repair management in cancers. In Advances in Medical Biochemistry, Genomics, Physiology, and Pathology (pp. 309-339). New York: Jenny Standford Publishing. doi:https://doi.org/10.1201/9781003180449.
- Andrio, P., Hospital, A., Conejero, J., Jordá, L., Del Pino, M., Codo, L., & Soiland-Reyes, S. (2019). BioExcel Building Blocks, a software library for interoperable biomolecular simulation workflows. Nature scientific data. doi:https://doi.org/10.1038/s41597-019-0177-4.
- Bayly, C., Cieplak, P., Cornell, W., & Kollman, P. (1993). A well-behaved electrostatic potential based method using charge restraints for deriving atomic charges: the RESP model. The Journal of Physical Chemistry, 10269-10280. doi:https://doi.org/10.1021/j100142a004.
- Bekker, H., Berendsen, H., Dijkstra, E., Achterop, S., Vondrumen, R., Vanderspoel, D., . . . Renardus, M. (1993). Gromacs-a parallel computer for molecular-dynamics simulations. 4th international conference on computational physics (pp. 252-256). World Scientific Publishing. https://doi.org/10.1074/jbc.m116.736728.
- Berendsen, H., Grigera, J.-R., & Straatsma, T. (1987). The missing term in effective pair potentials. Journal of Physical Chemistry, 6269-6271.https://doi.org/10.1021/ja963909j.
- Bernstein, C., Prasad, A., Nfonsam, V., & Bernstein, H. (2013). DNA damage, DNA repair and cancer. InTech Rijeka, Croatia. https://doi.org/10.1093/nar/gkad013.
- Bhattacharyya, D., & Bansal, M. (1990). Local variability and base sequence effects in DNA crystal structures. Journal of Biomolecular Structure and Dynamics. doi:https://doi.org/10.1080/07391102.1990.10507828.
- Bilokapic, S., Suskiewicz, M., Ahel, I., & Halic, M. (2020). Bridging of DNA breaks activates PARP2–HPF1 to modify chromatin. Nature, 609-613. doi:https://doi.org/10.1038/s41586-020-2725-7.
- Bishop, T. (2008). Geometry of the nucleosomal DNA superhelix. Biophysical journal. doi:https://doi.org/10.1529/biophysj.107.122853.
- Bowman, J., & Willams, L. D. (2023). Nucleic acids. In Encyclopedia of astrobiology (pp. 2096-2103). Berlin: Springer Berlin Heidelberg. doi:https://doi.org/10.1007/978-3-662-65093-6_1079.
- Brown, I. (1976). On the geometry of O–H⋯ O hydrogen bond. s Acta Crystallographica Section A: Crystal Physics, Diffraction, Theoretical and General Crystallography. doi:https://doi.org/10.1107/S0567739476000041.
- Brown, J., O’Carrigan, B., Jackson, S., & Yap, T. (2017). Targeting DNA repair in cancer: beyond PARP inhibitors. Cancer discovery, 20-37. doi:https://doi.org/10.1158/2159-8290.CD-16-0860.
- Bunta, J., Laaksonen, A., Pinak, M., & Nemoto, T. (2006). DNA strand break: Structural and electrostatic properties studied by molecular dynamics simulation. Computational Biology and Chemistry, 112-119. doi:https://doi.org/10.1016/j.compbiolchem.2005.12.001.
- Bussi, G., Donadio, D., & Parrinello, M. (2007). Canonical sampling through velocity rescaling . The Journal of chemical physics . doi:https://doi.org/10.1063/1.2408420.
- Caldecott, K. (2008). Single-strand break repair and genetic disease. Nature Reviews Genetics, 619-631. doi:https://doi.org/10.1038/nrg2380.
- Caldecott, K. (2022). DNA single-strand break repair and human genetic disease. Trends in cell biology, 733-745. doi:https://doi.org/10.1016/j.tcb.2022.04.010.
- Caldecott, K. (2024). Causes and consequences of DNA single-strand breaks. Trends in Biochemical Sciences. doi:https://doi.org/10.1016/j.tibs.2023.11.001.
- Campo, M. (2010). Structural and dynamic properties of SPC/E water. Papers in physics.
- Cannan, W., Rashid, I., Tomkinson, A., Wallace, S., & Pederson, D. (2017). The human ligase IIIα-XRCC1 protein complex performs DNA nick repair after transient unwrapping of nucleosomal DNA. Journal of Biological Chemistry, 5227-5238. doi:https://doi.org/10.1074/jbc.M116.736728.
- Carusillo, A., & Mussolino, C. (2020). DNA Damage: From Threat to Treatment. Cells, 1665. doi:https://doi.org/10.3390/cells9071665.
- Case, D., Darden, T., Cheatham III, T., Simmerling, C., Wang, J., Duke, R., . . . Kollman, P. (2006). AMBER 9. San Francisco.
- Cherepanov, A., & de Vries, S. (2002). Dynamic mechanism of nick recognition by DNA ligase. European Journal of Biochemistry, 5993-5999. doi:https://doi.org/10.1046/j.1432-1033.2002.03309.x.
- Cieplak, P., Cheatham, T., & Kollman, P. (1997). Cieplak, P., Cheatham, T. E., & Kollman, P. A. (1997). Molecular Dynamics Simulations Find That 3 ‘Phosphoramidate Modified DNA Duplexes Undergo a B to A Transition and Normal DNA Duplexes an A to B Transition. Journal of the American Chemical Society, 6722-6730. doi:https://doi.org/10.1021/ja963909j.
- Clayden, J., Greeves, N., & Warren, S. (2012). Organic chemistry. Oxford University Press.
- Dans, P., Zeida, A., Machado, M., & Pantano, S. (2010). A coarse grained model for atomic-detailed DNA simulations with explicit electrostatics. Journal of chemical theory and computation, 1711-1725. doi:https://doi.org/10.1021/ct900653p.
- Darden, T., York, D., & Pedersen, L. (1993). Particle mesh Ewald: An N⋅ log (N) method for Ewald sums in large systems. The Journal of chemical physics, 10089-10092.
- Dexheimer, T. (2013). DNA repair pathways and mechanisms. DNA repair of cancer stem cells, 19-32. doi:https://doi.org/10.1007/978-94-007-4590-2_2.
- Djuranovic, D., & Hartmann, B. (2004). DNA fine structure and dynamics in crystals and in solution: the impact of BI/BII backbone conformations. Biopolymers: Original Research on Biomolecules. doi: https://doi.org/10.1002/bip.10528.
- Esmaeeli, R., Bauzá, A., & Perez, A. (2023). Structural predictions of protein–DNA binding: MELD-DNA. Nucleic Acids Research, 1625-1636. doi:https://doi.org/10.1093/nar/gkad013.
- Friedberg, E. (2008). A brief history of the DNA repair field. Cell research, 3-7.
- Frisch, M., Trucks, G., Schlegal, H., Scuseria, G., Robb, M., Cheeseman, J., . . . Pople, J. (2004). Gaussian 03, Revision C.02. Gaussian, Inc., Wallingford CT.
- Furse, K., & Corcelli, S. (2010). Molecular dynamics simulations of DNA solvation dynamics. The Journal of Physical Chemistry Letters, 1813-1820. doi:https://doi.org/10.1021/jz100485e.
- Giglia-Mari, G., Zotter, A., & Vermeulen, W. (2011). DNA damage response. Cold Spring Harbor perspectives in biology, a000745. doi:DOI: 10.1101/cshperspect.a000745.
- González, M. (2011). Force fields and molecular dynamics simulations. École thématique de la Société Française de la Neutronique, 169-200. doi:https://doi.org/10.1051/sfn/201112009.
- Heddi, B., Oguey, C., Lavelle, C., Foloppe, N., & Hartmann, B. (2010). Intrinsic flexibility of B-DNA: the experimental TRX scale. Nucleic acids research. doi:https://doi.org/10.1093/nar/gkp962.
- Hess, B., Bekker, H., Berendsen, H., & Fraaije, J. (1997). LINCS: a linear constraint solver for molecular simulations. Journal of computational chemistry 18, 1463-1472. doi:https://doi.org/10.1002/(SICI)1096-987X(199709)18:12<1463::AID-JCC4>3.0.CO;2-H.
- Howes, T., & Tomkinson, A. (2012). DNA Ligase I, the Replicative DNA Ligase. The eukaryotic replisome: A guide to protein structure and function, 327-341. doi:https://doi.org/10.1007/978-94-007-4572-8_17.
- Huang, R., & Zhou, P.-K. (2021). DNA damage repair: historical perspectives, mechanistic pathways and clinical translation for targeted cancer therapy. Nature, 254. doi:https://doi.org/10.1038/s41392-021-00648-7.
- Jackson, S., & Bartek, J. (2009). The DNA-damage response in human biology and disease. Nature 461, 1071-1078. doi:https://doi.org/10.1038/nature08467.
- Jeggo, P. (1998). DNA Breakage and Repair. In Advances in Genetics 38 (pp. 185-218). Academic Press. doi:https://doi.org/10.1016/S0065-2660(08)60144-3.
- Kagami, L., Wilter, A., Diaz, A., & Vranken, W. (2023). The ACPYPE web server for small-molecule MD topology generation. Bioinformatics. doi:https://doi.org/10.1093/bioinformatics/btad350.
- Karagiannias, T., & El-Osta, A. (2004). DNA damage repair and transcription: Double-strand breaks: signaling pathways and repair mechanisms. Cellular and Molecular Life Sciences CMLS, 2137-2147. doi:https://doi.org/10.1007/s00018-004-4174-0.
- Karakaidos, P., Karagiannis, D., & Rampias, T. (2020). Resolving DNA damage: epigenetic regulation of DNA repair. Molecules 25(11), 2496. doi:https://doi.org/10.3390/molecules25112496.
- Krupa, P., Wales, D., & Sieradzan, A. (2018). Computational Studies of the Mechanical Stability for Single-Strand Break DNA. The Journal of Physical Chemistry B, 8166-8173. doi:https://doi.org/10.1021/acs.jpcb.8b05417.
- Landau, L., Lifshitz, E., & Reichl, L. (1981). Statistical Physics, Part 1 (Third Edition). Physics today. doi:https://doi.org/10.1063/1.2889978.
- Langelier, M.-F., Riccio, A., & Pascal, J. (2014). PARP-2 and PARP-3 are selectively activated by 5′ phosphorylated DNA breaks through an allosteric regulatory mechanism shared with PARP-1. Nucleic acids research, 7762-7775. doi:https://doi.org/10.1093/nar/gku474.
- Lankas, F., Langowski, J., Šponer, J., & Cheatham, T. (2003). DNA basepair step deformability inferred from molecular dynamics simulations. Biophysical journal. doi:https://doi.org/10.1016/S0006-3495(03)74710-9.
- Lans, H., Marteijn, J., & Vermeulen, W. (2012). ATP-dependent chromatin remodeling in the DNA-damage response. Epigenetics & Chromatin 5, 4. doi: https://doi.org/10.1186/1756-8935-5-4.
- Laughton, C., & Harris, S. (2011). The atomistic simulation of DNA. Wiley Interdisciplinary Reviews: Computational Molecular Science, 590-600. doi:https://doi.org/10.1002/wcms.46.
- Lavery, R., Moakher, M., Maddocks, J., Petkeviciute, D., & Zakrzewska, K. (2009). Conformational analysis of nucleic acids revisited: Curves+. Nucleic acids research. doi:https://doi.org/10.1093/nar/gkp608.
- Lindahl, T. (1993). Instability and decay of the primary structure of DNA. Nature 362, 709-715. doi:https://doi.org/10.1038/362709a0.
- Lindahl, T., & Nyberg, B. (1972). Rate of depurination of native deoxyribonucleic acid. In Biochemistry (pp. 3610-3618).
- Lukas, J., Lukas, C., & Bartek, J. (2011). More than just a focus: The chromatin response to DNA damage and its role in genome integrity maintenance. Nature cell biology, 1161-1169. doi:https://doi.org/10.1038/ncb2344.
- Lukin, M., & de Los Santos, C. (2006). NMR Structures of Damaged DNA. Chemical Reviews, 607-686. doi:https://doi.org/10.1021/cr0404646.
- Mackerell Jr., A. (2004). Empirical force fields for biological macromolecules: overview and issues. Journal of computational chemistry, 1584-1604. doi:https://doi.org/10.1002/jcc.20082.
- Maginn, E., & Elliott, J. (2010). Historical perspective and current outlook for molecular dynamics as a chemical engineering tool. Industrial & engineering chemistry research, 3059-3078. doi:https://doi.org/10.1021/ie901898k.
- Mark, P., & Nilsson, L. (2011). Structure and Dynamics of the TIP3P, SPC, and SPC/E Water Models at 298 K. The Journal of Physical Chemistry A, 9954-9960. doi:https://doi.org/10.1021/jp003020w.
- McKinnon, P., & Caldecott, K. (2007). DNA Strand Break Repair and Human Genetic Disease. Annu. Rev. Genomics Hum. Genet. 8, no. 1 , 37-55. doi:https://doi.org/10.1146/annurev.genom.7.080505.115648.
- Menoni, H., Mascio, P., Cadet, J., Dimitrov, S., & Angelov, D. (2017). Chromatin associated mechanisms in base excision repair - nucleosome remodeling and DNA transcription, two key players. Free Radical Biology and Medicine 107, 159-169. doi:https://doi.org/10.1016/j.freeradbiomed.2016.12.026.
- Michaud-Agrawal, N., Denning, E., Woolf, T., & Beckstein, O. (2011). MDAnalysis: a toolkit for the analysis of molecular dynamics simulations. Journal of computational chemistry. doi: https://doi.org/10.1002/jcc.21787.
- Milano, L., Gautam, A., & Caldecott, K. (2024). DNA damage and transcription stress. Molecular Cell, 70-79. doi:https://doi.org/10.1016/j.molcel.2023.11.014.
- Minchin, S., & Lodge, J. (2019). Understanding biochemistry: structure and function of nucleic acids. Essays in biochemistry 63(4), 433-456. doi:https://doi.org/10.1042/EBC20180038.
- Misra, M., & Yadav, A. (2022). Assessment of Available AMBER Force Fields to Model DNA-Ligand Interactions. Biointerface Res. Appl. Chem. 13, 156. doi:https://doi.org/10.33263/BRIAC132.156.
- Molinaro, C., Martoriati, A., & Cailliau, K. (2021). Proteins from the DNA damage response: Regulation, dysfunction, and anticancer strategies. Cancers, 3819. doi:https://doi.org/10.3390/cancers13153819.
- Nair, N., Shoaib, M., & Sørensen, C. (2017). Chromatin Dynamics in Genome Stability: Roles in Suppressing Endogenous DNA Damage and Facilitating DNA Repair. International Journal of Molecular Sciences, 1486. doi:https://doi.org/10.3390/ijms18071486.
- Nosé, S., & Klein, M. (1983). Constant pressure molecular dynamics for molecular systems. Molecular Physics, 1055-1076. doi:https://doi.org/10.1080/00268978300102851.
- O’Connor, M. (2015). Targeting the DNA damage response in cancer. Molecular cell, 547-560. doi:https://doi.org/10.1016/j.molcel.2015.10.040.
- Obaji, E., Haikarainen, T., & Lehtiö, L. (2018). Structural basis for DNA break recognition by ARTD2/PARP2. Nucleic acids research, 12154-12165. doi:https://doi.org/10.1093/nar/gky927.
- Obaji, E., Maksimainen, M., Galera-Prat, A., & Lehtiö, L. (2021). Activation of PARP2/ARTD2 by DNA damage induces conformational changes relieving enzyme autoinhibition. Nature communications, 3479. doi:https://doi.org/10.1038/s41467-021-23800-x.
- Ogawa, T., & Okazaki, T. (1980). Discontinuous DNA replication. Annual review of biochemistry, 421-457. doi:https://doi.org/10.1146/annurev.bi.49.070180.002225.
- Ohyama, T., Vladimir N., P., & Sinden, R. (2005). DNA: alternative conformations and biology. DNA conformation and transcription, 3-17.
- Parrinello, M., & Aneesur, R. (1981, 7182-7190). Polymorphic transitions in single crystals: A new molecular dynamics method. Journal of Applied physics 52. doi:https://doi.org/10.1063/1.328693.
- Pérez, A., Luque, F., & Orozco, M. (2012). Frontiers in molecular dynamics simulations of DNA. Accounts of chemical research, 196-205. doi:https://doi.org/10.1021/ar2001217.
- Petrová, P., Koča, J., & Imberty, A. (1999). Potential Energy Hypersurfaces of Nucleotide Sugars: Ab Initio Calculations, Force-Field Parametrization, and Exploration of the Flexibility. Journal of the American Chemical Society, 5535-5547. doi:https://doi.org/10.1021/ja983854g.
- Prasad, R., Beard, W., & Wilson, S. (1994). Studies of gapped DNA substrate binding by mammalian DNA polymerase beta. Dependence on 5’-phosphate group. Journal of Biological Chemistry, 18096-18101. doi:https://doi.org/10.1016/S0021-9258(17)32422-5.
- Rohs, R., Jin, X., West, S., Joshi, R., Honig, B., & Mann, R. (2010). Origins of specificity in protein-DNA recognition. Annual review of biochemistry 79, 233-269. doi:https://doi.org/10.1146/annurev-biochem-060408-091030.
- Saenger, W. (2013). Principles of nucleic acid strucure. Springer Science & Business Media.
- Sallmyr, A., Rashid, I., Bhandari, S., Naila, T., & Tomkinson, A. (2020). Human DNA ligases in replication and repair. DNA repair, 102908. doi:https://doi.org/10.1016/j.dnarep.2020.102908.
- Salo-Ahen, O., Alanko, I., Bhadane, R., Bonvin, A., Honorato, R., Hossain, S., . . . Larsen, A. (2020). Molecular dynamics simulations in drug discovery and pharmaceutical development. Processes, 71. doi:https://doi.org/10.3390/pr9010071.
- Salomon-Ferrer, R., Case, D., & Walker, R. (2013). An overview of the Amber biomolecular simulation package. Computational Molecular Science. doi: https://doi.org/10.1002/wcms.1121.
- Samanta, S., Mukherjee, S., Chakrabarti, J., & Bhattacharyya, D. (2009). Structural properties of polymeric DNA from molecular dynamics simulations. The Journal of chemical physics. doi:https://doi.org/10.1063/1.3078797.
- Schrödinger, L., & DeLano, W. (2020). The PyMOL Molecular Graphics System.
- Sirbu, B., & Cortez, D. (2013). DNA Damage Response: Three Levels of DNA Repair Regulation. Cold Spring Harbor perspectives in biology, 5(8), a012724.
- Song, H.-Y., Shen, R., Mahasin, H., Guo, Y.-N., & Wang, D.-G. (2023). DNA replication: Mechanisms and therapeutic interventions for diseases. MedComm, e210. doi: https://doi.org/10.1002/mco2.210.
- Sousa da Silva, A., & Vranken, W. (2012). ACPYPE - AnteChamber PYthon Parser interfacE. BMC research notes, 1-8. doi:https://doi.org/10.1186/1756-0500-5-367.
- Spenser, M. (1959). The stereochemistry of deoxyribonucleic acid. II. Hydrogen-bonded pairs of bases. Acta Crystallographica. doi:https://doi.org/10.1107/S0365110X59000160.
- Steinbrecher, T., Latzer, J., & Case, D. (2012). Revised AMBER Parameters for Bioorganic Phosphates. Journal of Chemical Theory and Computation, 4405-4412. doi:https://doi.org/10.1021/ct300613v.
- Taylor, R., Kennard, O., & Versichel, W. (1980). The geometry of the N–H⋯ O= C hydrogen bond. 3. Hydrogen-bond distances and angles. Acta Crystallographica Section B: Structural Science 40. doi:https://doi.org/10.1107/S010876818400210X.
- Teletchéa, S., Hartmann, B., & Kozelka, J. (2004). Discrimination between BI and BII conformational substates of B-DNA based on sugar-base interproton distances. Journal of Biomolecular Structure and Dynamics. doi:https://doi.org/10.1080/07391102.2004.10506942.
- Thaplyal, P., & Bevilacqua, P. (2014). Experimental approaches for measuring pKa’s in RNA and DNA. Methods in enzymology, 189-219. doi:https://doi.org/10.1016/B978-0-12-801122-5.00009-X.
- Timson, D., Singleton, M., & Wigley, D. (2000). DNA ligases in the repair and replication of DNA. Mutation Research/DNA Repair, 301-318. doi:https://doi.org/10.1016/S0921-8777(00)00033-1.
- Toukan, K., & Rahman, A. (1985). Molecular-dynamics study of atomic motions in water. Physical Review B, 2643-2648. doi:https://org/doi/10.1103/PhysRevB.31.2643.
- Tucker, M., Piana, S., Tan, D., LeVine, M., & Shaw, D. (2022). Development of Force Field Parameters for the Simulation of Single- and Double-Stranded DNA Molecules and DNA–Protein Complexes. The Journal of Physical Chemistry B, 4442-4457. doi:https://doi.org/10.1021/acs.jpcb.1c10971.
- Urrutia, K., Xu, W., & Zhao, L. (2022). The 5′-phosphate enhances the DNA-binding and exonuclease activities of human mitochondrial genome maintenance exonuclease 1 (MGME1). Journal of Biological Chemistry. doi:https://doi.org/10.1016/j.jbc.2022.102306.
- Waters, K., & Spratt, D. (2024). New Discoveries on Protein Recruitment and Regulation during the Early Stages of the DNA Damage Response Pathways. International Journal of Molecular Sciences, 1676. doi:https://doi.org/10.3390/ijms25031676.
- Watson, J., & Crick, F. (1953). Molecular structure of nucleic acids: a structure for deoxyribose nucleic acid. Nature 171(4356), 737/738. doi:https://doi.org/10.1038/171737a0.
- Wolffe, A. (1998). Chromatin: structure and function. Academic Press.
- Yamaguchi, H., Siebers, J.-G., Furukawa, A., Otagiri, N., & Osman, R. (2002). Molecular dynamics simulation of a DNA containing a single strand break. Radiation protection dosimetry, 103-108. doi:https://doi.org/10.1093/oxfordjournals.rpd.a006737.
- Yoo, J., Winogradoff, D., & Aksimentiev, A. (2020). Molecular dynamics simulations of DNA–DNA and DNA–protein interactions. Current Opinion in Structural Biology, 88-96. doi:https://doi.org/10.1016/j.sbi.2020.06.007.
- Zenkova, M. (2004). Artificial nucleases (Vol. 13). Springer Science & Business Media.
- Zgarbová, M., Otyepka, M., Šponer, J., Mládek, A., Banáš, P., Cheatham, T., & Jurečka, P. (2011). Refinement of the Cornell et al. Nucleic Acids Force Field Based on Reference Quantum Chemical Calculations of Glycosidic Torsion Profiles. (2902, Ed.) Journal of Chemical Theory and Computation, 2886. doi:https://doi.org/10.1021/ct200162x.
- Zhang, F., & Collins, M. (1995). Model simulations of DNA dynamics. Physical Review E, 4217. doi:https://doi.org/10.1103/PhysRevE.52.4217.
Disclaimer/Publisher’s Note: The statements, opinions and data contained in all publications are solely those of the individual author(s) and contributor(s) and not of MDPI and/or the editor(s). MDPI and/or the editor(s) disclaim responsibility for any injury to people or property resulting from any ideas, methods, instructions or products referred to in the content. |
© 2024 by the authors. Licensee MDPI, Basel, Switzerland. This article is an open access article distributed under the terms and conditions of the Creative Commons Attribution (CC BY) license (http://creativecommons.org/licenses/by/4.0/).
Copyright: This open access article is published under a Creative Commons CC BY 4.0 license, which permit the free download, distribution, and reuse, provided that the author and preprint are cited in any reuse.


