Submitted:
26 October 2024
Posted:
28 October 2024
You are already at the latest version
Abstract
The increasing demand for operational efficiency in small and medium-sized manufacturing enterprises (SMEs) has sparked interest in Lean Six Sigma (LSS) methodologies. LSS integrates Lean’s waste elimination focus with Six Sigma’s variability reduction, offering a comprehensive framework for process improvement. Despite its potential, SMEs face unique challenges in implementing LSS, such as financial limitations and resistance to change. This systematic review evaluates the application of LSS in SMEs, analyzing its impact on operational, financial, and quality performance across different industries and geographical regions. The study identifies key success factors, barriers, and research gaps while proposing regression models to predict financial gains associated with LSS adoption. The review followed PRISMA guidelines, sourcing literature from SCOPUS, Web of Science, and Google Scholar published between 2014 and 2024. The inclusion criteria targeted studies involving LSS implementation in manufacturing SMEs. Data extraction included study characteristics, methodologies, and outcomes. A risk of bias assessment was conducted using the Newcastle-Ottawa Scale. The synthesis involved descriptive statistics, effect measures, and sensitivity analyses. Out of 150 initially identified studies, 109 met the inclusion criteria. The findings demonstrate that LSS implementation significantly improves operational performance, with 77.98% of studies showing reductions in cycle time and defect rates. Financial outcomes, including cost savings and ROI, showed moderate to large effects, with 63.58% of the reviewed studies reporting cost reductions. Quality improvements were noted across studies, particularly in First Pass Yield, with 67% of studies demonstrating enhanced quality metrics. The geographic distribution indicated strong research activity in India (23.85%), the United States (6.42%), and Europe (5.50%). Both developed (46.79%) and developing (45.87%) economies contributed extensively. Key barriers included resource constraints (reported in 45% of studies) and resistance to change (noted in 31%). LSS offers substantial benefits for SMEs, driving process efficiency, cost reduction, and quality improvements. However, challenges such as limited resources and organizational resistance must be addressed for successful adoption. This review provides insights into best practices, highlights research gaps, and suggests areas for future investigation, emphasizing the need for customized LSS strategies tailored to the unique contexts of SMEs.
Keywords:
lean six sigma (LSS)
; small and medium-sized enterprises (SMEs)
; manufacturing efficiency
; process improvement
; DMAIC methodology
; operational performance
; quality enhancement
; cost reduction
1. Introduction
In today’s rapidly evolving business landscape, companies face relentless pressure to enhance performance and achieve sustainable growth. Stagnation is often perceived as a lack of progress, with profit margins that fall short of previous targets considered signs of underperformance [1,2]. Consequently, organizations are increasingly scrutinized by shareholders and financial markets to demonstrate not only operational efficiency but also robust financial outcomes [3]. To navigate this competitive environment effectively, companies must continuously evaluate and refine their strategic plans and execution capabilities, ensuring they optimize shareholder value in both the short and long term [3,4].
A variety of business process improvement frameworks are available to help organizations enhance operational efficiency and strategic performance [5,6]. Among these methodologies, LSS has gained widespread adoption globally, utilized by leading corporations to drive continuous improvement [8,12]. LSS is a collaborative and systematic approach that integrates the principles of Lean, which focuses on waste elimination and process flow improvement, and Six Sigma, which aims at reducing variability and minimizing defects [10]. Lean methodology, originating from the Toyota Production System developed by Taiichi Ohno in post-World War II Japan, seeks to distinguish between value-adding (VA) and non-value-adding (NVA) activities within an organization [7,9]. Value-adding activities are those that directly transform products or services in ways that customers are willing to pay for, while non-value-adding activities, termed “Muda” in Lean terminology, represent inefficiencies that should be minimized [11]. The Lean approach aims to reduce cycle times and lead times by eliminating NVA operations, thereby enhancing overall process efficiency [16]. However, implementing Lean practices effectively can be challenging, particularly in fostering an organizational culture that sustains the continuous use of Lean tools and techniques [13]. Conversely, Six Sigma, developed by Bill Smith at Motorola in the mid-1980s and popularized by General Electric’s Jack Welch in the 1990s, is a structured framework focused on reducing process variation to improve quality and consistency [14,15]. The methodology follows a five-phase framework known as DMAIC (Define, Measure, Analyze, Improve, Control), guiding organizations in systematically identifying and resolving inefficiencies [19]. Although Six Sigma is data-driven and effective in process optimization, it is limited in addressing waste elimination without the integration of Lean principles [8].
The fusion of Lean and Six Sigma into the LSS framework provides a balanced methodology for enhancing process effectiveness and quality while lowering costs and boosting customer satisfaction [6,18]. Nevertheless, integrating these methodologies presents challenges, particularly regarding organizational culture and leadership commitment. Despite these challenges, LSS has garnered recognition as a powerful continuous improvement strategy, offering significant potential for achieving operational excellence [19]. The increasing importance of LSS in driving performance improvement is especially relevant for small- and medium-sized enterprises (SMEs). A systematic review of its application in SMEs is both timely and necessary [3,14]. SMEs, which play a crucial role in the global economy, face unique challenges when adopting continuous improvement initiatives due to constraints in resources and leadership dynamics [20]. These enterprises significantly contribute to global employment and economic activity but often struggle with issues such as cash flow management, innovation, and strategic planning [17]. This review aims to explore the existing literature on LSS implementation in SMEs, identify key success factors and barriers, and provide insights on leveraging LSS for sustainable growth and competitiveness. The five principles illustrated in Figure 1 form the foundation of Lean Six Sigma, driving organizational success by enhancing efficiency, quality, and customer satisfaction.
The first principle, focusing on customer value, underscores the importance of aligning processes with customer expectations to achieve competitive advantage and market growth [19]. Continuous improvement (Kaizen) fosters a culture of incremental enhancements, involving employees at all levels, which leads to sustained effectiveness and quality improvement. Data-driven decision-making ensures that organizational decisions are based on measurable data, leading to sustainable outcomes [12]. The DMAIC process offers a systematic approach to problem-solving, encompassing goal definition, performance measurement, issue analysis, process improvement, and outcome control to achieve long-term success [13]. Lastly, promoting change and flexibility supports adaptability and transparency, enabling organizations to respond effectively to market dynamics and sustain long-term growth [9]. The systematic review has identified several research gaps in the existing literature concerning the application of Lean Six Sigma in small- and medium-sized manufacturing enterprises (SMEs). These gaps point to areas where current research is lacking, suggesting opportunities for further investigation to better understand and implement LSS in this context, as summarized in Table 1.
First, while substantial research has been conducted on LSS adoption in large organizations, studies focusing on the unique challenges faced by SMEs, especially those in resource-constrained environments, are limited. Existing literature often overlooks specific barriers such as limited financial and human resources, which can hinder effective LSS adoption. Moreover, the literature tends to prioritize operational performance improvements, with insufficient emphasis on the impact of LSS practices on sustainability performance and long-term strategic outcomes. Second, the integration of digital technologies within LSS frameworks in the context of SMEs remains underexplored. The synergistic potential between emerging Industry 4.0 technologies and LSS has not been fully examined, indicating a gap in understanding how these innovations could enhance LSS implementation and outcomes. Lastly, most studies utilize cross-sectional or case study methodologies, limiting insights into the longitudinal impact of LSS on organizational growth and transformation over time. Addressing these gaps will provide a more comprehensive understanding of how SMEs can leverage LSS for sustained competitive advantage and resilience.
1.1. Research Motivation
The drive to achieve sustainable growth and operational efficiency is more critical than ever for small and medium-sized enterprises (SMEs). Unlike larger corporations, SMEs often struggle with unique constraints, such as limited financial and human resources, which can hinder their ability to implement complex methodologies for continuous improvement. LSS offers a powerful approach for optimizing processes and enhancing productivity, but its practical application in SMEs raises challenges that are distinct from those faced by larger enterprises. The implementation of LSS involves high costs and intricate change management, factors that can be particularly daunting for SMEs. Yet, the existing literature has not sufficiently explored these dynamics. By critically examining the economic and operational aspects of LSS in the context of SMEs, this study aims to shed light on how these enterprises can harness LSS to overcome resource constraints, improve process efficiency, and achieve long-term growth.
1.2. Research Questions
The research questions in Table 2 were formulated to systematically evaluate the application of Lean Six Sigma in SMEs. They aim to explore critical factors influencing its implementation, assess outcomes, and identify gaps in current literature. The questions are designed to provide a robust framework for understanding the key challenges and opportunities within SMEs adopting LSS practices.
1.3. Research Contribution
This systematic review makes significant contributions to the field of LSS in small and medium-sized manufacturing enterprises (SMEs) by addressing critical research gaps and advancing the existing body of knowledge. The research contributions of this work are as follows:
- This review presents a detailed analysis of the application of Lean Six Sigma within SMEs, emphasizing the unique challenges these enterprises face due to resource constraints and operational complexities. The study aggregates insights from various industries, highlighting how SMEs can adopt LSS methodologies to enhance efficiency, reduce waste, and improve overall performance.
- By systematically analyzing existing literature, the research identifies the primary factors that contribute to the successful implementation of LSS in SMEs, such as leadership commitment, employee engagement, and the alignment of LSS initiatives with strategic business goals. It also discusses common barriers, including limited financial resources, lack of specialized skills, and resistance to change.
- The review identifies gaps in the current literature, particularly in the integration of digital technologies and Industry 4.0 solutions with LSS practices in the SME context. It encourages future research to explore the synergistic effects of combining LSS with advanced technologies to optimize outcomes in resource-constrained settings.
- The study offers practical guidance for SMEs seeking to implement LSS, providing best practices and strategies to overcome common challenges. It includes recommendations for adapting LSS tools and techniques to the specific needs and limitations of SMEs, ensuring more sustainable and impactful outcomes.
1.4. Research Novelty
The novelty of this study lies in its focus on addressing the practical challenges associated with implementing LSS in SMEs, particularly in environments with limited resources. Unlike existing research, which often focuses on large organizations, this study delves into how LSS can be adapted and sustained in smaller businesses. It highlights key areas that need further investigation, such as overcoming cost constraints and enhancing employee engagement with continuous improvement methodologies. The study also provides a framework for comparative analysis across different economic contexts, emphasizing the specific needs of SMEs in developing regions. This research identifies gaps in the existing literature related to how LSS is integrated into workflows within resource-constrained settings and proposes strategies to optimize production and reduce waste. Moreover, the study suggests pathways for future exploration into combining traditional LSS practices with emerging digital technologies, such as Industry 4.0 innovations, to unlock additional value in process improvements. This approach introduces a new perspective on how technology-driven process optimization can enhance the effectiveness of LSS in various industrial settings, thus broadening the applicability of the methodology beyond traditional manufacturing environments.
2. Materials and Methods
This section outlines the systematic review framework, materials, and methodologies leveraged to develop the proposed survey, grounded in LSS principles specifically adapted for small and medium-sized manufacturing enterprises (SMEs). By defining a rigorous selection roadmap, we ensured a targeted literature foundation, encompassing only relevant studies from highly regarded publication sources. The retrospective decennial review (2014–2024) supports an in-depth analysis of LSS applications over the past decade, shedding light on trends, challenges, and advancements in implementing Lean Six Sigma within the SME sector [1] – [148].
2.1. Eigibility Criteria
To align the literature selection with the objectives of this review, we established stringent inclusion and exclusion criteria. Table 3 presents these criteria, ensuring that only studies directly relevant to LSS applications in SMEs are incorporated [149] – [171]. This process reinforces the review’s focus on empirical rigor and thematic relevance, aligning with the study’s aim to contribute high-impact insights into the field.
These criteria were applied rigorously to filter the most pertinent studies, ensuring a focused analysis that captures the nuances and practical implications of Lean Six Sigma in SMEs. By adopting a systematic approach, the study builds a comprehensive understanding of how Lean Six Sigma enhances operational efficiency and competitive advantage in SMEs, with insights that are directly transferable to practitioners and researchers alike.
2.2. Information Sources
The literature for this systematic review was sourced from three reputable online research repositories accessible via the OpenAthens platform through the University of Johannesburg’s online library. A comprehensive search strategy was applied across the selected databases—Google Scholar, Scopus, and Web of Science—to ensure a robust and multidisciplinary foundation. The search utilized targeted keywords aligned with the study’s title, and the eligibility criteria were rigorously applied to filter publications, ensuring alignment with the review’s objectives. Table 4 provides a summary of the online research databases used, highlighting each source’s purpose and alignment with the inclusion/exclusion criteria to support the study’s integrity [149] – [171].
The use of these databases enables a high level of comprehensiveness and reliability in sourcing peer-reviewed literature, facilitating an analysis that not only captures the breadth of Lean Six Sigma applications in SMEs but also emphasizes quality and impact. By combining resources with different disciplinary strengths, the review establishes a solid basis for identifying the nuanced influences of Lean Six Sigma on SME performance metrics.
2.3. Search Strategy
To ensure a targeted collection of relevant journal articles, conference papers, book chapters, and dissertations, a structured and comprehensive search strategy was implemented across the three online research repositories. Figure 2 illustrates this step-by-step approach, leveraging specific keywords and logic operators (“AND” and “OR”) tailored to the systematic literature review (SLR) title. Initially, the SLR title was deconstructed into a logical search equation:
“(lean six sigma” OR “lean manufacturing” OR “six sigma” OR “LSS”) AND (“small and medium-sized enterprises” OR SME OR “small and medium businesses” OR “small manufacturing” OR “medium manufacturing” OR SMB OR “small enterprises” OR “medium enterprises” OR “small companies” OR “medium companies”) AND (application OR implementation OR adoption OR impact OR effect OR performance)”
This equation, combined with the inclusion and exclusion criteria outlined in Table 3, was used to filter results and isolate publications aligned with the study’s focus on Lean Six Sigma applications in SMEs. Finally, a manual review of titles, abstracts, and search tags was conducted to produce a refined list of studies, culminating in a primary set of literature for the systematic review. Our search strategy overview if illustrated in Figure 2 [149] – [171].
This rigorous approach ensures a high-quality, focused selection of publications that address the impact and implementation of Lean Six Sigma methodologies in SMEs, supporting the study’s goal of offering comprehensive insights into operational efficiency and performance enhancements within this sector.
2.4. Selection Process
To ensure the integrity and relevance of the studies included in this systematic review, we conducted a thorough selection process using the SCOPUS, Web of Science, and Google Scholar databases, accessed via the University of Johannesburg’s online library through the OpenAthens platform. These databases allowed us to apply stringent inclusion and exclusion criteria designed to align with the review’s objectives. The inclusion criteria required publications related to Lean Six Sigma applications in small and medium-sized manufacturing enterprises, published between 2014 and 2024, written in English, and containing a clear research framework applying Lean Six Sigma within SMEs. Publications outside of these criteria—those not relevant to Lean Six Sigma in SMEs, without a research framework, published before 2014 or after 2024, or written in languages other than English—were excluded [149] – [171].
To further refine the selection, relevant keywords were applied to the search, ensuring the retrieval of studies directly aligned with Lean Six Sigma implementations in SMEs. The manual screening was performed by two independent reviewers (T.B.C and L.), each conducting initial screenings of titles, publication dates, and abstracts to assess relevance. Following the initial screen, full-text articles were evaluated to confirm the inclusion of key study details, contextual insights, methodologies, and outcomes. Both reviewers worked independently to ensure objectivity and reduce bias in the selection process. After completing individual screenings, they convened to resolve any disagreements. In cases of conflicting opinions, the reviewers deliberated collaboratively to reach a consensus. If consensus was not achieved, the study was excluded from the review. This systematic six-step selection process is illustrated in Figure 3.
This structured approach to study selection strengthens the validity of the systematic review, ensuring that the included studies provide robust, high-quality evidence on the application of Lean Six Sigma in SMEs, ultimately enhancing the reliability of the review’s insights.
2.5. Data Collection Process
The data collection for this review was conducted using Google Scholar, Web of Science, and Scopus, with three independent reviewers involved to ensure accuracy, reliability, and minimize potential biases. Figure 4 illustrates the data collection workflow, detailing each step to enhance transparency and reproducibility. Initially, each reviewer independently extracted data from the selected studies, focusing on essential elements such as study characteristics, outcomes, and specific Lean Six Sigma metrics relevant to SMEs. This manual extraction process, intentionally devoid of automation tools, allowed for a meticulous and comprehensive approach. Following independent extraction, the reviewers conducted cross-checks to verify consistency and accuracy. Any discrepancies identified during this stage were resolved through direct discussions, ensuring a unified dataset. In instances where multiple reports corresponded to a single study, specific decision rules were applied to select the most comprehensive and up-to-date data. Once accuracy and completeness were confirmed, the collected data was consolidated in an Excel database for final validation and subsequent analysis [149] – [171].
This structured approach to data collection reinforces the reliability of the systematic review, supporting the synthesis of robust findings on Lean Six Sigma applications in SMEs.
2.6. Data Items
This section provides a comprehensive overview of the data items sought in this systematic review, focusing on both primary outcomes and additional variables relevant to the impact of Lean Six Sigma on small and medium-sized manufacturing enterprises (SMEs). The primary outcomes include key performance metrics such as operational and financial outcomes, Innovation Performance, Customer Outcomes, and Long-term impacts. In addition to these outcomes, the review considers study and participant characteristics, intervention details, industry-context, and external market influences, ensuring a thorough contextual understanding of the application and effects of Lean Six Sigma methodologies in SMEs.
This approach allows for a nuanced analysis of how Lean Six Sigma contributes to improving production processes, cost-efficiency, and overall competitiveness across diverse manufacturing settings and operational environments within SMEs. The detailed examination of these factors provides a comprehensive understanding of the conditions under which Lean Six Sigma is most effective in driving performance improvements in small and medium-sized manufacturing enterprises [149] – [171].
2.6.1. Data Items Collection Method
In this systematic review on the application of Lean Six Sigma in small and medium-sized manufacturing enterprises (SMEs), a rigorous data collection process was implemented to ensure accuracy and minimize bias, adhering to PRISMA 2020 guidelines. Data was sourced from Google Scholar, Web of Science, and Scopus, with two independent reviewers involved. Each reviewer conducted an independent extraction of data, focusing on key study characteristics, outcomes, and Lean Six Sigma metrics. To ensure reliability, the reviewers cross-checked one another’s work, resolving discrepancies through discussion and expert consultation when needed. For studies with multiple reports, decision rules were applied to select the most comprehensive data. The final dataset was consolidated in an Excel database for validation and analysis [149] – [171].
In terms of data items, the review concentrated on both primary outcomes and additional variables that reflect the impact of Lean Six Sigma in SMEs. Primary outcomes included operational and financial performance, innovation, customer satisfaction, and long-term impacts, providing a comprehensive view of how Lean Six Sigma methodologies enhance production efficiency, cost-effectiveness, and overall competitiveness. The review also considered contextual factors like study characteristics, intervention details, industry settings, and external market influences, allowing for a thorough understanding of Lean Six Sigma’s effectiveness across various manufacturing environments. to be a flowchart.
2.6.2. Data Items Variables
This section provides an overview of the data items targeted in the review, emphasizing both primary and supplementary variables related to the impact of Lean Six Sigma on SMEs. The primary outcomes focus on key performance indicators, including operational and financial performance, innovation, customer satisfaction, and long-term impacts. These metrics quantify the tangible benefits of Lean Six Sigma in enhancing production processes, cost-efficiency, and competitiveness see Table 5 [149] – [171].
Additionally, the review considers various contextual factors, such as study and participant characteristics, intervention details, industry context, and external market influences. This comprehensive approach facilitates a nuanced analysis of how Lean Six Sigma methodologies drive performance improvements across diverse manufacturing environments.
2.7. Study Risk of Bias Assessment
In this systematic review on the application of Lean Six Sigma in small and medium-sized manufacturing enterprises (SMEs), a rigorous risk of bias assessment was undertaken to ensure the reliability and validity of the synthesized findings. Due to the diverse study designs included—spanning both randomized and non-randomized studies—the Newcastle-Ottawa Scale (NOS) was selected as the most appropriate tool. The NOS evaluates bias across three essential domains: Selection, Comparability, and Outcome/Exposure, offering a structured and consistent approach to assess the quality of observational studies. Each study was independently assessed by two reviewers to minimize the potential for individual bias. Discrepancies between reviewers were addressed through consensus discussions, and if agreement could not be achieved, a third reviewer was consulted to provide an impartial decision. This multi-step process, depicted in Figure 5, supports a robust and transparent assessment framework. For studies with multiple reports, decision rules were implemented to ensure that only the most relevant and up-to-date data were included. This meticulous selection and cross-checking procedure enhances the integrity of the review, allowing for a comprehensive and unbiased synthesis of findings. No automation tools were utilized during this process, ensuring a thorough manual evaluation.
By implementing this systematic risk of bias assessment, the review provides reliable conclusions on Lean Six Sigma’s impact on SME performance, offering insights grounded in rigorously vetted evidence.
2.8. Effect Measures
In this systematic review, effect measures were utilized to comprehensively evaluate Lean Six Sigma’s impact within SME manufacturing firms. The approach begins by defining the primary outcomes of interest related to Lean Six Sigma applications, followed by selecting appropriate effect measures that align with these intended outcomes. Each chosen effect measure is transparently reported to ensure clarity and replicability across contexts. After defining and selecting the effect measures, the results were meta-analyzed, with particular consideration given to the heterogeneity of the included studies or contexts, as shown in Figure 6 [149] – [171]. This approach addresses the variation across studies, enhancing the robustness and reliability of the synthesized findings. Lastly, the framework emphasizes the practical linkage between effect measures and decision-making, providing insights to assist SME stakeholders in interpreting the results effectively and making informed, evidence-based decisions.
This systematic approach to effect measurement not only strengthens the analytical depth of the review but also ensures that the findings are meaningful and actionable for decision-makers within SMEs, reinforcing the value of Lean Six Sigma applications in this sector.
2.9. Synthesis Method
2.9.1. Eligibility Criteria for Synthesis Grouping
The synthesis process for evaluating the application of Lean Six Sigma within small and medium-sized manufacturing enterprises (SMEs) involved systematically organizing studies into key thematic areas. This was achieved through meticulous screening and data extraction, aligning with the predefined inclusion and exclusion criteria outlined in Table 6. The criteria ensured that each study focused on Lean Six Sigma’s relevance to SMEs, included a research framework, was published in English, and fell within the 2014–2024 publication period. Studies meeting these criteria were compiled in an Excel sheet, where data was extracted and organized according to the categories shown in Table 6.
The synthesis eligibility process involved several structured steps to ensure consistency and transparency. Initially, studies were screened against the inclusion and exclusion criteria to confirm alignment with the review’s focus on Lean Six Sigma applications in SMEs. This screening assessed relevance, research framework presence, language, and publication date compliance. Following the initial screening, detailed data extraction was performed, capturing study details, contextual factors, methodologies, and outcomes systematically. Extracted characteristics were then compared against predefined synthesis groups, such as operational performance and financial impact, facilitating accurate categorization. For studies that exhibited significant findings across multiple areas or appeared as borderline cases, subjective judgments were made to classify them under the most relevant synthesis group based on their primary contribution. This structured approach ensured that the grouping for synthesis was transparent, consistent, and reflective of the studies’ impact on Lean Six Sigma applications within SMEs.
2.9.2. Data Preparation and Transformation Methods
To ensure consistency and comparability across data extracted from the reviewed studies, specific data preparation and transformation methods were applied. These methods addressed issues related to missing information and data format discrepancies, ensuring that all data was uniformly prepared for presentation and synthesis. The Data Preparation Methods for Review is tabulated in Table 7.
These preparation methods contributed to the rigor and reliability of the review, allowing for a consistent synthesis of findings on Lean Six Sigma’s application within SME manufacturing firms.
2.9.3. Data Presentation and Visualization Techniques
To effectively communicate the results of this systematic review, we employed a combination of tabular and graphical methods as detailed in Table 8 [149] – [171]. These techniques were selected to ensure a clear, accessible, and comprehensive presentation of the findings related to LSS applications in SMEs. We structured tables to organize and compare key findings across studies systematically. These tables included data such as study contributions, benefits, challenges of LSS adaptation, and impacts on SMEs. To prioritize relevance, tables were ordered by factors like the year of publication and citation counts, highlighting the most influential studies within the field. Microsoft Excel and Microsoft Word were used to create visual representations, including pie charts, graphs, and flow charts. Pie charts illustrated the proportion of studies addressing various LSS aspects, such as methodologies or challenges encountered. Graphs displayed trends over time and distributions of study outcomes, aiding in the identification of patterns and correlations. Flow charts outlined the study selection and synthesis process, offering a clear visual summary of the methodological steps undertaken. These visual aids were designed to enhance transparency, allowing readers to quickly understand key insights and patterns. By integrating these graphical tools with detailed tabulation, we aimed to provide a nuanced and easily interpretable overview of the synthesized data.
This workflow ensures that the data presentation is both thorough and accessible, providing readers with a clear understanding of the systematic review findings related to Lean Six Sigma in SME manufacturing.
2.9.4. Methods for Data Synthesis and Meta-Analysis
Given the significant heterogeneity among the included studies, a traditional meta-analysis was deemed impractical. Instead, structured summaries and descriptive statistics were used to integrate the findings, as this approach accommodated the variations in study designs and outcome measures. Microsoft Excel and Microsoft Word facilitated the preparation of tables, graphs, pie charts, and flow charts, which effectively organized and displayed the diverse data, allowing for the identification of patterns and trends. The structured summaries offered a comprehensive overview of LSS implementation benefits and challenges, reflecting the range of contexts and outcomes in the studies. This synthesis method ensured a transparent and accessible presentation of findings, accommodating the unique characteristics of each study.
2.9.5. Investigation of Heterogeneity Sources
To explore potential sources of heterogeneity among the study results, we conducted subgroup analyses that examined variations based on factors such as industry sector, enterprise size, and specific LSS techniques. For instance, we grouped studies by manufacturing sector to investigate if the effectiveness of LSS varied across sectors. We also analyzed the impact of SME size on LSS outcomes. These subgroup analyses enabled the comparison of results across different levels of each factor, with statistical tests for interaction used to determine if observed effects differed significantly between subgroups. As meta-analysis was not feasible due to the lack of standardized effect estimates, results were organized in tables to allow for a visual assessment of how these subgroup factors influenced LSS effectiveness and challenges in different contexts. While these analyses provided valuable insights, they were exploratory rather than prespecified in our protocol. Therefore, the findings should be interpreted cautiously, considering the limitations of the available data and the methods employed.
2.9.6. Sensitivity Analyses
Sensitivity analyses were conducted to assess the robustness of the synthesis results concerning methodological assumptions and decisions. These analyses examined the impact of excluding studies identified as high risk of bias and tested alternative statistical models to verify that specific studies or analytical techniques did not unduly influence conclusions. This approach reinforced the reliability of our findings by addressing potential biases and confirming consistency across different analytical scenarios, ultimately enhancing the credibility of the conclusions on LSS applications for SMEs.
2.10. Reporting Bias Assessment
Assessing the risk of reporting bias was critical to ensure the validity and reliability of this systematic review on Lean Six Sigma for SMEs. Potential biases, including selective publication, language bias, and selective reporting of outcomes, were methodically addressed. We employed contour-enhanced funnel plots as a visual tool to detect asymmetries in the data, differentiating between missing studies due to bias and those missing by chance. These plots, with statistical significance contours, provided a robust representation of potential biases. This assessment relied on proven techniques documented extensively in the literature, emphasizing methodological rigor. Contour-enhanced funnel plots visually assessed the distribution of studies, allowing us to identify and account for potential biases. Two independent reviewers conducted this evaluation, and discrepancies were resolved through consensus or, when necessary, with input from a methodological expert. No automation tools were employed for bias assessment; instead, a manual approach was chosen to ensure careful data analysis and visualization. Further, we performed comprehensive manual searches across multiple databases, including Google Scholar, Scopus, and Web of Science, to cross-reference data and address discrepancies, reinforcing the robustness of our conclusions. Given the unique context of LSS studies in SMEs, standard methods for assessing reporting bias were adapted to align with the characteristics of these studies, ensuring relevance and accuracy. All methods and approaches used in this assessment are thoroughly documented in the supplementary materials, promoting transparency, and allowing future researchers to replicate or build on our analysis. This commitment to openness enhances the overall rigor and reliability of research in Lean Six Sigma applications for SMEs.
2.11. Certainity of Evidence
To ensure the external validity and credibility of outcomes related to LSS applications in SMEs, a systematic certainty assessment was conducted. This approach helps verify the quality of the presented evidence, allowing readers to gauge the reliability of the conclusions drawn. The assessment followed a structured, four-step method, as illustrated in Figure 7, which facilitated a thorough and transparent evaluation [149] – [171]. The four stages of the certainty assessment included (1) tool selection, where an appropriate tool was chosen to evaluate certainty, tailored to the specific focus of the study on LSS applications in SMEs; (2) evaluating factors that influence certainty, such as study design quality, data consistency, and relevance; (3) defining the overall certainty level by synthesizing insights from these factors to assign a certainty level to each outcome category, providing a nuanced understanding of evidence strength; and (4) engaging multiple reviewers with transparent reporting, where reviewers independently assessed each outcome and resolved discrepancies through consensus discussions, ensuring objectivity and rigor in the certainty evaluation. Figure 7 provides a visual summary of the certainty assessment stages, covering outcome categories, certainty levels, the number of studies included, and justification for each certainty decision. By following this structured process, the certainty assessment offered a clear, accessible evaluation of the evidence quality. This transparency enables readers to appreciate the strength of the study’s conclusions on LSS applications in SMEs, reinforcing the reliability and relevance of the findings.
By following this structured process, the certainty assessment offered a clear, accessible evaluation of the evidence quality. This transparency enables readers to appreciate the strength of the study’s conclusions on LSS applications in SMEs, reinforcing the reliability and relevance of the findings.
3. Results
This section presents the comprehensive findings from the systematic review on the application of LSSin small and medium-sized manufacturing enterprises (SMEs). The goal was to evaluate the extent of LSS implementation, understand the challenges SMEs face, and assess the outcomes achieved. Through synthesizing data from multiple studies across various geographic locations, industry contexts, and research designs, the review provides a well-rounded perspective on LSS adoption, highlighting both operational performance impacts and broader organizational outcomes. Following this introduction, the key phases involved in evaluating systematic review results are illustrated in Figure 8, which provides a visual summary of the processes used to ensure the validity, reliability, and relevance of the included studies.
The analysis revealed several key trends and patterns: LSS implementation in SMEs often results in improvements in operational efficiency, cost reduction, and quality control, but challenges such as resource limitations and resistance to change are common barriers. The findings underscore the benefits of LSS for enhancing productivity and competitiveness in SMEs, while also identifying limitations that need to be addressed for effective application. Furthermore, insights into best practices emerged, suggesting that tailored LSS strategies, appropriate resource allocation, and strong leadership are essential for successful implementation. The review also points out areas for future research, particularly in adapting LSS methodologies to fit SMEs’ unique constraints and needs.
3.1. Study Selection
3.1.1. Results of the Search and Selection Process
The search process involved three major databases: SCOPUS, Web of Science, and Google Scholar. Initially, 150 records passed the inclusion criteria based on automated selection tools, as outlined by the established inclusion and exclusion criteria. However, during the screening process, only 109 records were retained for inclusion in the systematic review. The screening identified 32 duplicate records, and the remaining 9 records were excluded due to the absence of a proper structured methodology. Ultimately, 109 studies were successfully included in the review, with all initially selected records verified by human review. As shown in Figure 9, this flow chart outlines the progression of records through each stage of the review process, from identification and screening to eligibility and final inclusion.
The search and selection process were comprehensive, reducing the initial 150 records to 109 studies that met the stringent criteria. This rigorous screening highlights the focus on quality and relevance, ensuring that only studies with robust methodologies were included in the systematic review. The process emphasized transparency and adherence to the inclusion and exclusion criteria, forming a solid foundation for the subsequent analysis. The systematic review process resulted in records obtained from three major databases, showcasing a comprehensive search strategy, as illustrated in Figure 10. Google Scholar contributed 29% of the total records, reflecting its extensive coverage and inclusion of diverse publications relevant to Lean Six Sigma in small and medium-sized manufacturing enterprises (SMEs). Scopus provided 32% of the total records, offering a significant portion of high-quality, peer-reviewed sources spanning various disciplines. The largest share, 49%, was sourced from Web of Science, indicating its robust collection of high-impact journals and a substantial presence of relevant research.
This distribution across Google Scholar, Scopus, and Web of Science facilitated a thorough and balanced capture of the literature. This comprehensive approach enhanced the depth and reliability of the review, ensuring a well-rounded perspective on LSS studies in SMEs.
3.1.2. Studies Which Met the Inclusion Criteria But Excluded
During the screening process, 150 studies initially appeared to meet the inclusion criteria. However, after a thorough review, it was discovered that 32 of these studies were duplicates, and 9 studies lacked a well-structured methodology, leading to their exclusion from the review.
3.2. Study Characteristics
The annual publication trend, as depicted in Figure 11, shows an initial downward trajectory, followed by an upward trend beginning in 2017 and peaking in 2024 with 30 studies. This peak reflects a substantial increase in research activity related to Lean Six Sigma implementation in SMEs. The year 2024 marks a notable surge in research outputs, spanning various publication types, including journal articles, applied research, and conference papers. This upward trend highlights the increasing academic and practical interest in Lean Six Sigma methodologies for enhancing operational efficiency, reducing costs, and improving performance in SMEs. The initial decline from 2014, followed by a consistent rise in publications from 2019 to 2024, emphasizes the growing focus on applying Lean Six Sigma to transform manufacturing practices and drive performance improvements.
The upward trajectory in publications from 2017 to 2024 demonstrates an escalating interest in Lean Six Sigma for SMEs, reflecting the methodology’s importance in operational transformation and competitive improvement within the manufacturing sector. The distribution of publication types, as illustrated in Figure 12, reveals that journal articles constitute the majority at 63.58%, followed by conference papers (11.10%), applied research (7.6%), and empirical studies (13.12%). This increase in scholarly output aligns with the rising adoption of Lean Six Sigma tools and strategies, which are pivotal for optimizing production processes and enhancing competitiveness in SMEs.
The dominance of journal articles in this review’s distribution of publication types underscores the robust academic interest in Lean Six Sigma for SMEs. This trend corresponds with a broader adoption of Lean Six Sigma methodologies aimed at achieving production efficiency and operational excellence in the SME manufacturing sector.
As summarized in Table 9, the effect measures derived from the studies included in this systematic review focus on three primary performance areas: operational performance, financial performance, and quality performance. Each category is assessed using relevant statistical measures, such as Mean Difference (MD) for continuous outcomes and Risk Ratio (RR) for binary outcomes, to provide a detailed understanding of Lean Six Sigma’s impact on SMEs. For operational performance, effects are categorized as trivial, small, moderate, or large based on percentage improvements in indicators like cycle time and defect rates. Financial performance metrics are particularly sensitive, with small percentage changes translating to significant monetary impacts, which is critical for SMEs. Quality performance measures include both continuous and binary outcomes, offering a comprehensive view of improvements in quality indicators, such as First Pass Yield (FPY). The rationale for each effect measure is also presented, underscoring the significance of these metrics in evaluating Lean Six Sigma’s impact within SMEs.
The categorization of effect measures across operational, financial, and quality performance areas provides a structured framework to assess Lean Six Sigma’s impact in SMEs. These measures, with defined thresholds, allow for a nuanced understanding of improvement levels, supporting SMEs in making data-informed decisions to enhance efficiency and competitiveness.
Table 9 below provides a detailed overview of the study characteristics extracted from 109 publications focusing on the applications of Lean Six Sigma in manufacturing SMEs. This table captures essential information that contributes to a deeper understanding of Lean Six Sigma research. Key aspects include the publication year, which reveals trends and shifts in research focus over time, and the research type, distinguishing between empirical studies, case studies, literature reviews, and theoretical frameworks. These distinctions highlight the diversity of research approaches applied in the field. Further details in the table cover the disciplinary focus, which demonstrates the interdisciplinary nature of Lean Six Sigma applications, spanning various fields and industries. The research design outlines frameworks like qualitative, quantitative, or mixed methods, showing the range of approaches utilized. Methodologies highlight specific Lean Six Sigma tools such as DMAIC (Define, Measure, Analyze, Improve, Control), Kaizen, and process mapping. Additionally, data collection techniques, including surveys, interviews, observations, and archival research, ensure the reliability and validity of findings. Data analysis methods like statistical analysis, thematic analysis, and case study analysis further elucidate the outcomes. Finally, Table 9 summarizes the organizational outcomes observed in the studies, including enhancements in efficiency, quality, cost reduction, and customer satisfaction. This synthesis of study characteristics offers valuable insights into the effectiveness of Lean Six Sigma in various manufacturing contexts, enriching the knowledge base surrounding Lean Six Sigma and its transformative potential for SMEs in manufacturing.

Table 9.
Comprehensive Overview of the Study Characteristics.
| Ref. | Year | Research Type | Discipline | Location | Research Design | Methodology | Data Analysis Techniques | Organizational Outcomes |
|---|---|---|---|---|---|---|---|---|
| [40] | 2016 | Article | Service and Production | Europe | Case studies, observations, interviews | Case studies, observations, interviews | Comparative analysis, trend identification | Cooperation development with networks and large customers |
| [41] | 2016 | Article | Manufacturing | Netherlands | Multi-method triangulation approach | Literature study, focus group, retrospective interviews | Confirmatory evidence and proposals for revision | Not specified |
| [42] | 2022 | Article | Business & Economics | UK | Not specified | Questionnaire survey, literature review | Not specified | Not specified |
| [43] | 2024 | Article | Business & Economics | UK | Not specified | Questionnaire survey, literature review | Not specified | Not specified |
| [44] | 2015 | Article | Food Processing | Europe | DMAIC methodology | Shop floor observations, brainstorming sessions, material balance analysis, ANOVA test, DoE, FMEA | Descriptive statistics, ANOVA, Pareto chart, cause-and-effect diagram, DoE | Improved efficiency and teamwork |
| [45] | 2018 | Article | Manufacturing | Not specified | Single-case study | Qualitative methods, VOC records, VSM, histogram | SIPOC, C&E diagram, FMEA, process cycle efficiency, takt time, brainstorming | Cross-functional team collaboration, training on basic problem-solving tools |
| [46] | 2020 | Article | Business & Economics | UK | Not specified | Questionnaire survey | Not specified | Not specified |
| [47] | 2021 | Article | Engineering, Business & Economics | Slovakia | Not specified | Questionnaire survey | Not specified | Not specified |
| [48] | 2022 | Article | Business & Economics | Slovakia | Not specified | Questionnaire survey | Not specified | Not specified |
| [49] | 2014 | Article | EngineeringBusiness & Economics | Sweden | Not specified | Questionnaire survey | Not specified | Not specified |
| [50] | 2023 | Article | Construction & Building Technology | England | Questionnaire and expert opinion survey | Questionnaire survey, expert opinion survey | Fuzzy TOPSIS method | Not specified |
| [51] | 2022 | Article | Manufacturing | Greece | DMAIC Methodology | Case study analysis | Evaluation of critical success factors, indirect monetary measurement | Specific critical success factors identified, benefits realized |
| [52] | 2021 | Article | LSS Implementation | India | Extensive literature review, questionnaire survey | Questionnaire survey, literature review | Statistical analysis, Interpretive Structural Modeling (ISM), MICMAC analysis, Structural Equation Modeling (SEM) | Identified barriers affecting LSS implementation in SMEs |
| [53] | 2023 | Article | LSS Implementation | Saudi Arabia | Principal Components Analysis (PCA) | Literature review, factor analysis | PCA to identify critical success factors (CSFs) | Not specified |
| [54] | 2022 | Article | Manufacturing | USA | DMAIC Methodology | Literature review, expert opinions | Comparative analysis of existing frameworks, development of new framework | Provides a guide for LSS implementation tailored to SMEs |
| [55] | 2022 | Article | Clothing Manufacturing | Tunisia | Experimental | Discrete-event simulation, statistical distribution analysis | Bizagi Process Modeler, Stat fit Student Version | Increased production efficiency, reduced lead time, and waiting time |
| [56] | 2023 | Article | Tire Manufacturing | India | Mixed Methods | Data collection via quality tools, measurements, and control charts | Statistical analysis, process capability analysis, control charts | Improved process management, reduced wastage |
| [57] | 2022 | Article | Manufacturing SMEs | India | Graph theoretic approach for evaluating critical success factors (CSFs) | Conceptual analysis and index development | Graph theoretic model | |
| [58] | 2023 | Article | Manufacturing/Industrial | India | Quantitative | Questionnaire-based survey | TOPSIS, Grey Relational Analysis (GRA) | Improved understanding of LSS barriers; not quantified |
| [59] | 2023 | Article | Clothing SMEs | Tunisia | Case Study | Survey, Process Capability Measurement | Root Cause Analysis, Process Modeling and Simulation | Improved process efficiency, better performance in certified SMEs, customer satisfaction |
| [60] | 2023 | Article | SMEs | Pakistan | Survey | Survey, Spearman’s correlation test | Cronbach’s alpha, Spearman’s correlation test, Factor analysis | Positive impact on environmental performance; no significant impact on operational and business performance |
| [61] | 2024 | Article | Small Manufacturing Enterprises | India | Case Study | Literature review, Expert surveys | CIMTC, Importance-Index Analysis, ISM-MICMAC Analysis | Identification of 13 key strategies; high internal consistency; modelled strategies for LSS implementation |
| [62] | 2024 | Article | Small Manufacturing Enterprises | India | Quantitative | Fuzzy TOPSIS, Literature review | Barriers to LSS implementation, Prioritized strategies | Improved implementation of LSS; enhanced performance through prioritization of strategies |
| [63] | 2024 | Article | Small Manufacturing Enterprises | Northern Ireland | Qualitative | Thematic analysis, Coding, Repeat interviews | Absorptive capacity routines, Implementation strategies | Framework for wider application in SMEs |
| [64] | 2021 | Article | Small Manufacturing Enterprises | Not specified | Quantitative | Not specified | Crisis management strategies, Decision-making frameworks | Not specified |
| [65] | 2024 | Article | Printing Industry | India | Qualitative | DMAIC approach, Statistical process control, Capability analysis | Top Management Leadership, Data-Based Validation, Technical Know-how, Industrial Engineering Knowledge Base | Not specified |
| [66] | 2016 | Empirical Study | Manufacturing | Germany | Qualitative | Survey questionnaire, pre-tested for clarity | Correlation and regression analysis | Identifies the importance of core competence and organizational culture in LSS readiness, suggests training and development for enhancing LSS readiness |
| [67] | 2022 | Article | Machinery and Equipment SMEs | Malaysia | Qualitative | Descriptive analysis using Microsoft Excel | Lean understanding, implementation, and success | Provides a model for assessing and enhancing LM maturity in M&E SMEs |
| [68] | 2023 | Article | Manufacturing | USA | Qualitative | Descriptive analysis, value stream mapping, SMED | Inventory management, production flow, changeover times | Digital inventory management and automated systems, reduced changeover times |
| [69] | 2024 | Case Study | Timber Component Manufacturing | UK | Quantitative | Manual trimming efficiency, downtime, OEE (Overall Equipment Effectiveness) | Reduction in downtime, increase in OEE | Not specified |
| [70] | 2021 | Article | Medical Equipment Manufacturing | India | Quantitative | Best Worst Method (BWM), Analytic Hierarchy Process (AHP), Analytic Network Process (ANP) | Environmental LSS enablers, strategic and environmental-based enablers | Improved sustainability practices, reduced environmental impact, enhanced operational efficiency |
| [71] | 2022 | Article | Micro-Small and Medium Enterprises | India | Quantitative | AHP, Fuzzy-DEMATEL | Management-based factors, training- and education-based factors, technology-based factors, barriers to LSS adoption | Enhanced productivity, improved quality, increased profitability, and better social sustainability |
| [72] | 2017 | Comparative Study | Electronics, Automotive, Health, Transportation, Services, Aerospace, Oil | France | Survey | Online survey, pilot study | Wilcoxon signed-rank test, Cronbach’s alpha | Rapid process improvement, customer satisfaction, sustainability |
| [73] | 2021 | Case Study | SMEs, Higher Education | UK | semi-structured interviews | Interviews, curriculum review | Comparative analysis | Improved graduate employability and productivity for SMEs |
| [74] | 2022 | Article | Furniture Production | Europe | Statistical analysis | Chi-square test, Cramer’s contingency coefficient | Process capability, Return on Equity (ROE) | Improved ROE, reduced waste, and cost of non-conforming products, increased process capability |
| [75] | 2024 | Article | Manufacturing | Malaysia | Quantitative | Six-point Likert scale questionnaire | SEM, Reliability and validity analysis, Chi-square test | Positive influence of lean and Six Sigma on sustainable performance; Limited implementation of IR 4.0 technologies |
| [76] | 2020 | Article | Machinery and Equipment | Malaysia | Qualitative | Semi-structured Interviews | Content Analysis | Improvement in Organizational Performance |
| [77] | 2023 | Multi-case study | Manufacturing SMEs in India | India | Case study | Direct observation, structured questionnaire interviews, archival data | Cross-case comparison | Improved operational efficiency, reduced emissions, better labor relationships, increased profitability |
| [78] | 2024 | Case Study | Plumbing Industry | USA | Quantitative | Data collection via Six Sigma tools | Statistical analysis | Increased customer satisfaction, annual savings of $248,034 |
| [79] | 2019 | Empirical Study | Optical Lens Assembly | China | Empirical Case Study | Process analysis, Value Stream Mapping, Statistical analysis | Statistical testing, Value Stream Mapping | Reduction in working hours from 132 hrs to 110.741 hrs, reduction in inventory carry rate from 41.6% to 20.8%, financial gain of NT$15.57 million |
| [80] | 2024 | Case Study | South African Service Industry | South Africa | DMAIC Methodology | Pareto chart analysis, cause-effect diagram, PDCA approach | Process Cycle Efficiency (PCE), Value-Added Time (VDT), Non-Value-Added Time (NVDT), Uptime, Downtime | Improved process efficiency and reduced waste, enhanced customer satisfaction, increased profitability |
| [81] | 2024 | Case Study | Injection Moulding, SMEs | Netherlands | DMAIC Methodology | Experimental Testing, Statistical Analysis | ANOVA, Paired t-test, Taguchi S/N Analysis | Improved Process Settings, Enhanced Product Consistency, Optimized Mould Design |
| [82] | 2024 | Case Study | Commerce and Services | Portugal | Empirical | Statistical Analysis | Six Sigma Knowledge Levels, Adoption Barriers | Not specified |
| [83] | 2024 | Article | Automotive | Czech Republic | Survey Study | Online Questionnaire | Statistical Analysis, Fisher’s Exact Test | Variation in Six Sigma performance perceptions |
| [84] | 2024 | Empirical Study | Large Firms | Indonesia | Quantitative | Statistical Analysis | Business Performance | Holistic implementation improves performance |
| [85] | 2017 | Empirical Study | SMEs | India | Quantitative | Structural Equation Modeling | Economic, Environmental, Social Sustainability | Enhanced perspective on LMPs’ role in sustainability; Practical insights for SME managers |
| [86] | 2014 | Empirical Study | SMEs | India | Quantitative | Statistical Analysis | Overall Equipment Effectiveness (OEE), Rework, Maintenance vs. Operation Cost, Defect Rate, Sigma Level | |
| [87] | 2020 | Article | Not Specified | Statistical Analysis | Not specified | Not specified | ||
| [88] | 2014 | Article | Manfacturing | Indonesia | Not Specified | Statistical Analysis | Not specified | Not specified |
| [89] | 2024 | Conference Paper | Professional Services | Peru | Not Specified | Statistical Analysis | Not specified | Improved delivery times and customer satisfaction |
| [90] | 2024 | Case Study | Transformer Manufacturing | USA | Longitudinal | Data collection, Surveys | Statistical Analysis, Minitab | Achieved a 50% reduction in equipment failures, improved process efficiency |
| [91] | 2023 | Empirical Study | IT | Europe | Survey | Online surveys | Regression analysis | Improved team coordination |
| [92] | 2022 | Case Study | Manufacturing | USA | Case study | Interviews, document review | Thematic analysis | Strengthened partnerships |
| [93] | 2021 | Article | Finance | Asia | Longitudinal | Surveys, interviews | Structural equation modeling | Higher collaboration quality |
| [94] | 2015 | Article | Manfacturing | Not Specified | Surveys, interviews | Not specified | ||
| [95] | 2023 | Article | Construction SMEs | UK | Quantitative | Fuzzy TOPSIS method | Barriers and strategies for LSS implementation | Not specified |
| [96] | 2014 | Conference paper | Manufacturing | Brazil | Case Study | Review, DMAIC Application | Feasibility Study | Not specified |
| [97] | 2014 | Conference paper | Manufacturing | Malaysia | Literature Review | Literature Review | Comparative Analysis | Challenges and cultural gaps |
| [98] | 2015 | Article | Manufacturing | Poland | Observations, Interviews | Case Studies, Observations | Qualitative Analysis | Benefits and barriers of LSS implementation |
| [99] | 2024 | Article | Manufacturing | Iraq | EFA, FAHP, FTOPSIS | Questionnaire, EFA, FAHP, FTOPSIS | Multi-Criteria Decision Analysis | Continuous improvement strategy |
| [100] | 2014 | Conference paper | Manufacturing | Italy | Survey | Survey | Descriptive Analysis | Relationship among lean and agile manufacturing |
| [101] | 2014 | Article | Manufacturing | Colombia | Four Phases | Case Studies, Implementation | Evaluation, Impact Assessment | Best practices in process management |
| [101] | 2015 | Conference paper | Manufacturing | Romania | Email Survey | Email Survey | Statistical Analysis | Critical success factors identified |
| [102] | 2024 | Article | Food Industry | Jordan | Case Study | Motion and Time Study | Value Stream Mapping | Improved efficiency in packing and labelling operations |
| [103] | 2024 | Article | Manufacturing | India | Framework Validation | Structural Instruments | Statistical Validation | Benefits of LGSS practices in operational processes |
| [104] | 2024 | Article | Medical Equipment | India | Case Study | DMAIC, Sustainability Tools | Descriptive and Quantitative Analysis | Operational and environmental sustainability |
| [105] | 2014 | Conference paper | Manufacturing | China | Framework development | Email Survey | - | Not specified |
| [106] | 2014 | Article | Manufacturing organisations | Not specified | Linear regression and SEM | Email Survey | - | Not specified |
| [107] | 2014 | Article | Manufacturing | USA | Case study | Observations | Not specified | Potential barriers to lean adoption |
| [108] | 2014 | Article | Manufacturing | India | Empirical study | Various tools (brainstorming, pareto analysis, etc.) | Statistical analysis | Not specified |
| [109] | 2024 | Article | Manufacturing | India | Empirical study | Survey | Structural equation modeling | Not specified |
| [110] | 2014 | Article | Steel industry | Sweden | Case study | Case study | Not specified | Not specified |
| [111] | 2014 | Article | Manufacturing | India | Empirical study | Not specified | Not specified | Not specified |
| [112] | 2014 | Conference paper | Manufacturing | Singapore | Empirical study | Case study | Not specified | Not specified |
| [113] | 2016 | Conference paper | Manufacturing | Thailand | Design of Experiment | Value Stream Mapping; Design of Experiment | Statistical analysis | Increased production and met customer demand |
| [114] | 2024 | Article | Various sectors | Saudi Arabia | Grey-DEMATEL analysis | Grey-DEMATEL analysis | Grey-DEMATEL analysis | Not specified |
| [115] | 2016 | Article | Automotive | India | LSS framework development | DMAIC; Lean tools | Statistical analysis | Not specified |
| [116] | 2015 | Article | Food and beverage | Portugal | Not specified | Not specified | Not specified | Not specified |
| [117] | 2024 | Article | Medical device manufacturing | Malaysia | Partial least square-based SEM | Survey | Structural equation modeling | Not specified |
| [118] | 2024 | Conference paper | Manufacturing | Morocco | Questionnaire survey | Questionnaire survey | Not specified | Not specified |
| [119] | 2015 | Article | Manufacturing | Italy | DMAIC Methodology | Case study | ANOVA, Chi-square test | Not specified |
| [120] | 2015 | Conference paper | Food-processing | Belgium | DMAIC Methodology | Case study | Not specified | Not specified |
| [121] | 2014 | Article | Food Processing | Europe | Quantitative | Questionnaire | Statistical analysis | Not specified |
| [122] | 2024 | Article | Manufacturing | Poland | Quantitative | Statistical analysis | Statistical analysis | Not specified |
| [123] | 2024 | Conference Paper | Services | Morocco | Quantitative | Questionnaire | Statistical analysis | Not specified |
| [124] | 2014 | Article | Manufacturing | India | Quantitative | Data analysis | Statistical analysis | Not specified |
| [125] | 2016 | Article | Manufacturing | Netherlands | Mixed methods | Surveys; Interviews | Mixed methods | Not specified |
| [126] | 2024 | Article | Manufacturing | Italy | Qualitative | Case studies | Data analysis | Not specified |
| [127] | 2015 | Applied Research | Cement Bags Manufacturing | Not specified | Experimental Design | Survey, Observation, Data Analysis using MINITAB | Statistical Analysis, Process Capability Analysis | Improved operational efficiency and cost savings |
| [128] | 2021 | Applied Research | Fruit Juice Manufacturing | India | Experimental Design | Survey, Observation, Data Analysis using VSM, Cause and Effect Diagram | Statistical Analysis, DMAIC methodology | Improved operational efficiency and cost savings |
| [129] | 2015 | Applied Research | Automotive Spare Parts Manufacturing | India | Case Study | Statistical analysis, DMAIC framework | Defect rate reduction, process improvement | Improved process efficiency, long-term quality improvements |
| [130] | 2024 | Empirical Study | Manufacturing and Services | USA | Survey-based | Online surveys, Interviews | Statistical analysis, Regression models | Better cross-functional team collaboration |
| [131] | 2024 | Empirical Study | Manufacturing, Construction, Distribution, Service | Africa | Survey-based | Surveys, Interviews | Descriptive statistics, Ranking analysis | Mixed perceptions of benefits and challenges |
| [132] | 2024 | Empirical Study | Professional Services | Peru | Cross-sectional | Survey, Pilot Test | Statistical Analysis, ANOVA | Improvement in delivery times, increased productivity, higher on-time order percentage, increased income |
| [133] | 2015 | Empirical Study | Cement Manufacturing | Not specified | Cross-sectional | Survey, Pilot Test | Statistical Analysis, ANOVA | Increased annual production by 335,700 bags, reduced waste, improved revenue by $21,682.61 per year |
| [134] | 2020 | Applied Research | Large manufacturing company | Zimbabwe | Case Study | Statistical analysis, Lean Six Sigma metrics | Manufacturing performance, process improvement | Enhanced manufacturing performance, cost reduction |
| [135] | 2015 | Applied Research | Construction industry | Not specified | Case Study | Statistical analysis, Lean Six Sigma tools | Construction project performance, process improvement | Sustainable improvements in construction processes |
| [136] | 2019 | Article | Manufacturing | France | Case study | Multi-criteria model, AHP method | Critical success factors for LSS implementation | Not specified |
| [137] | 2016 | Empirical Study | German Manufacturing SMEs | Germany | Empirical Analysis | Systematic Empirical Data Collection | Analysis of Critical Success Factors (CSFs) | Need for enhancement of core competencies and organizational culture; preparation work for LSS readiness |
| [138] | 2022 | Case Study | Manufacturing | Greece | DMAIC Methodology | Interviews, Observations | Qualitative analysis | Significant improvements using only employee working hours |
| [139] | 2024 | Case Study | Manufacturing | Not specified | DMAIC Methodology | Observations, Data Logs, Production Records | Statistical Analysis, Comparative Metrics | Increased production by 335,700 bags annually, Improved OEE from 0.454 to 0.543, Sigma level increased from 3.91 to 4.00 |
| [140] | 2019 | Case Study | Manufacturing SMEs | Malaysia | Survey | Email Survey | SPSS 22.0 | Significant relationship between LSS factors and operational performance; Management engagement and leadership perceived as most important |
| [141] | 2020 | Article | Manufacturing | India | DMAIC Methodology | Email Survey | [Data Analysis Techniques] | Improved efficiency, Reduced waste |
| [142] | 2016 | Applied Research | Automotive, Electronics | UK | Single Case Study | First Run Yield (FRY), Sigma Score | FRY Improvement from 98.4% to 99.03%, Sigma Score Improvement from 3.65 to 3.85 | Achieved a significant reduction in scrap rate and financial savings, enhancing manufacturing efficiency and process capability. |
| [143] | 2018 | Applied Research | Plastic Manufacturing | India | Case Study | Surveys, Inspection | Statistical Analysis | Reduced defect rate of Floor Trap 6x4x2 fittings from 18% to 7%, leading to cost savings and improved product quality. |
| [144] | 2022 | Case Study | Bookkeeping and Tax Consulting | South Africa | DMAIC Methodology | Surveys, interviews | Statistical analysis | Process efficiency improvements, cost savings, enhanced service quality |
| [145] | 2023 | Case Study | Tyre Manufacturing SMEs | India | DMAIC Methodology | Schematic analysis, Measurement with Scaler and Scale | X̅ and R charts, Pareto analysis, Capability histograms | Reduced material wastage, Increased production efficiency |
| [146] | 2019 | Empirical Study | Manufacturing SMEs | India | Case Study | Statistical analysis, process mapping | Scrap rate, rework rate, process efficiency | Improved waste management and cost reduction in manufacturing SMEs |
| [147] | 2022 | Empirical Study | Small and Medium Enterprises | India | Qualitative, Case Study | Interviews, Literature Review | Thematic Analysis | Improved Process Efficiency, Better Organizational Culture, Skill Development |
The structured data in Table 9 showcases the adaptability and positive impact of Lean Six Sigma practices in SMEs, underlining the significance of diverse research approaches and interdisciplinary applications. This systematic review contributes to understanding best practices in Lean Six Sigma and highlights areas for future research, strengthening SMEs’ operational efficiency and competitiveness.
As illustrated in Figure 13, the geographic distribution of publications on LSS in SMEs highlights how different countries contribute to the research landscape in this field. The bar chart shows each country or region’s publication count, offering insights into where LSS practices are most studied within the SME sector. India leads with 23.85% of the total publications, reflecting a strong emphasis on Lean Six Sigma in its SME sector. This prominent position suggests a significant research and practical interest in process improvement methodologies. The United States (6.42%) and the United Kingdom (5.50%) follow, indicating their established research infrastructures and industrial focus on efficiency methodologies. Malaysia and Europe each account for 5.50% of publications, showing a growing regional interest in LSS. Notably, 8.29% of publications lack specified geographic information, which may indicate studies with a global or nonspecific focus.
As depicted in Figure 14, the distribution of research publications based on economic context reveals significant interest in the application of LSS in SMEs across diverse economic landscapes. The studies are categorized into three segments: Developed, Developing, and Not Specified. Notably, a substantial portion of publications comes from both developed (46.79%) and developing (45.87%) economies, underscoring the relevance of LSS in enhancing operational efficiency across different economic settings. The high volume of studies from these contexts suggests the widespread applicability of LSS practices, particularly in waste reduction and quality improvement, independent of economic conditions. The smaller percentage of publications (7.34%) categorized as “Not Specified” raises questions about the inclusion of mixed or undefined economic contexts in current research, highlighting an area for further exploration.
The distribution shown in Figure 14 underscores the adaptability and importance of LSS across varied economic environments, with nearly equal representation in both developed and developing economies. This distribution serves as a foundation for examining how LSS methodologies are tailored to specific economic contexts, and it suggests potential opportunities for future research in less defined economic settings.
3.3. Risk of bias in Studies
The Newcastle-Ottawa Scale (NOS) was utilized to assess the quality and risk of bias within the included studies, focusing on three primary domains: selection, comparability, and outcomes, as shown in Table 9. Each study was rated on a star-based system, with a maximum score of nine stars indicating the highest quality. Studies were categorized as high (7–9 stars), moderate (5–6 stars), or low quality (0–4 stars) based on their total star ratings. This section presents the results of the NOS analysis, highlighting the quality of evidence and identifying potential biases that may influence the findings of this systematic review.
Table 9.
Study Quality Assessment using Newcastle-Ottawa Scale.
| Ref. | Selection (0-4 stars) |
Comparability (0-2 stars) |
Outcomes (0-3 stars) |
Total Stars | Quality rating |
|---|---|---|---|---|---|
| [148,147,143, 149 45, 67,79,101] | ☆☆☆☆ | ☆☆ | ☆☆☆ | 9 | High Quality |
| [40,41,48,70,77] | ☆☆☆☆ | ☆☆ | ☆☆☆ | 9 | High Quality. |
| [105,126,44,60] | ☆☆☆☆ | ☆☆ | ☆☆ | 8 | High Quality |
| [101,131,46,78,90] | ☆☆☆☆ | ☆☆ | ☆☆ | 8 | High Quality |
| [116,119,120,121,122] | ☆☆☆ | ☆☆ | ☆☆☆ | 8 | High Quality |
| [42,80,81,93, 105] | ☆☆☆☆ | ☆ | ☆☆☆ | 8 | High Quality |
| [104,95,77,118,106] | ☆☆☆ | ☆ | ☆ | 5 | Moderate Quality |
| [10,12,13,43,47,65,66,110] | ☆☆ | ☆ | ☆☆ | 5 | Moderate Quality |
| [130,132,50,51,52,53,54,55,87,88,89] | ☆☆☆ | ☆ | ☆ | 5 | Moderate Quality |
| [114,106,123,124,135,136,137,96] | ☆☆☆ | ☆ | ☆ | 5 | Moderate Quality |
| [127,28,33,34,56,57,102,103,107] | ☆ | ☆☆ | ☆ | 4 | Low Quality |
| [17,18,25,29,63,64,97,98,109] | ☆☆ | ☆ | ☆ | 4 | Low Quality |
| [138,139,44,49,69,76] | ☆ | ☆☆ | ☆ | 4 | Low Quality |
| [68,74,83,84,95,99] | ☆ | ☆ | ☆ | 3 | Low quality |
| [58,59,61, 62,71,72,73,74,75] | ☆ | ☆ | ☆ | 3 | Low Quality |
| [85,86,91,92,94,100,107,106,108] | ☆ | ☆ | ☆ | 3 | Low Quality |
The NOS assessment revealed a considerable range in study quality, with most studies classified as high quality, scoring between 7–9 stars. These high-quality studies provide robust evidence for the systematic review, while studies of moderate and low-quality warrant cautious interpretation due to potential biases. The distribution of quality ratings underscores the need for rigorous methodologies in future Lean Six Sigma research within SMEs to enhance reliability and validity across studies.
3.4. Results of Individual Studies
This section of the results emphasizes the industry context of the reviewed publications. As shown in Figure 15, the majority of studies (approximately 77.98%) focus on SMEs, highlighting a strong research interest in this sector. Other contexts include medium-sized firms (4.59%), Micro, Small, and Medium Enterprises (MSMEs) at 3.67%, and large firms, which represent around 9.17% of publications. Smaller sectors, such as startups and small manufacturing enterprises, have minimal representation, with each accounting for less than 0.92% of the studies analyzed.
The data illustrated in Figure 15 indicates a predominant focus on SMEs within the Lean Six Sigma literature, reflecting the critical role of this sector in implementing process improvement methodologies. The relatively lower representation of large firms, startups, and other enterprise types of points to a potential gap in research, suggesting opportunities for future studies to explore Lean Six Sigma applications across a broader range of organizational contexts.
3.5. Results of Syntheses
This section provides a comprehensive overview of the systematic process used to synthesize findings from the included studies, as visually outlined in Figure 16. The synthesis process begins with reporting the results, detailing the findings from the reviewed studies. Next, it involves summarizing study characteristics and conducting a thorough risk of bias assessment to ensure the reliability of conclusions. Subsequent steps present statistical analysis results, including meta-analyses where applicable, along with an evaluation of heterogeneity to understand study variations. The synthesis further explores factors contributing to result variability and their impact on the overall findings. Finally, sensitivity analyses are conducted to assess the robustness and reliability of the synthesized findings. This structured approach aims to provide a clear and thorough understanding of the synthesis process and its outcomes, ensuring the findings are both comprehensive and credible.
Figure 16 illustrates a structured synthesis approach that strengthens the review’s credibility by systematically addressing study characteristics, bias, heterogeneity, and sensitivity. This methodical process ensures a rigorous synthesis, providing insights that are both reliable and comprehensive.
3.5.1. Study Characteristics and Bias Assessment
For each synthesis in Figure 17, we provide a concise summary of the characteristics and risk of bias among the contributing studies, focusing specifically on their data collection methods. The pie chart illustrates the distribution of publications by data collection methods, indicating that the most commonly used were questionnaires (21%), statistical analysis (11%), and surveys (13%). Other methods include case study analysis and literature study (9% each), qualitative methods (7%), descriptive analysis and interviews (6% each), and direct observation (4%). The risk of bias was assessed based on these data collection approaches. Studies utilizing quantitative methods, such as statistical analysis, surveys, and questionnaires (45% in total), generally demonstrated a lower risk of bias due to their structured methodologies and standardized measurements. Conversely, studies relying on subjective methods, including case study analysis, qualitative methods, and interviews (22% in total), exhibited a higher risk of bias due to potential researcher influence and data interpretation variability.
Figure 17 underscores a strong reliance on quantitative data collection methods, which contributes to the robustness of the synthesized evidence but may limit depth in context-specific insights. The limited use of qualitative methods impacts the comprehensiveness of findings, particularly concerning participant experiences and perspectives. This summary clarifies the diversity of methodologies used and highlights associated bias risks, aiding in a balanced interpretation of the synthesized results.
3.5.2. Statistical Synthesis Results
This section presents the statistical synthesis results, as illustrated in Figure 18, which summarizes the distribution of disciplines across the included publications. The pie chart reveals that the Manufacturing sector holds the largest representation, accounting for 45% of the total publications, highlighting a strong research focus in this industry. This is followed by the Services sector with 14% and SMEs with 12%, indicating significant interest in these areas as well. The Engineering sector represents 10%, and the Food Processing sector contributes 5%. Smaller sectors such as Automotive, Construction, and Medical Equipment each constitute 4% of the studies. The smallest segment, labeled as Various sectors, comprises 2% of the publications, covering studies that do not fall into the primary categories.
The distribution in Figure 18 reflects a predominant emphasis on the manufacturing and services sectors, with a notable variety across other disciplines. This diverse representation across sectors offers insights into the contexts in which Lean Six Sigma has been applied, underscoring its relevance across multiple industries, and providing a broad perspective on the topics reviewed.
3.5.3. Factors Contributing to Result Variability
This section investigates potential sources of heterogeneity among study results, particularly focusing on the varied sample characteristics across the publications, as depicted in Figure 19. The pie chart shows the distribution of sample characteristics, revealing that unspecified samples comprise the largest segment at 24%, which introduces variability due to the ambiguity surrounding sample populations. SMEs are significantly represented at 27%, underscoring a strong focus on this demographic. Additionally, manufacturing organizations and management account for 14% and 13% of the studies, respectively, reflecting substantial interest in these areas. Other sample groups include employees (7%), expected survey participants (5%), and those categorized under various tools (3%). Smaller categories, such as automotive SMEs, medium-sized manufacturers, and groups like core curriculum tutors and steel manufacturing companies, each represent 1-2% of the studies.
Figure 19 highlights the heterogeneity in sample characteristics, which is crucial for interpreting synthesized results. The predominance of SMEs and manufacturing sectors suggests that findings may be more applicable to these groups, potentially limiting generalizability. The high percentage of unspecified samples indicates a need for clearer reporting in future studies, which would enhance the reliability and applicability of systematic reviews. Addressing these gaps can lead to more comprehensive insights and guide future research designs.
3.5.4. Sensitivity Analyses
This section highlights the data analysis techniques used across the reviewed publications, providing insights into the methodological diversity within the studies, as depicted in Figure 20. The bar graph illustrates that statistical analysis is the most frequently employed technique, appearing in 25.69% of the publications, followed by process analysis (11.93%), quantitative analysis (11.01%), and qualitative analysis (10.09%). Comparative and conceptual analyses account for 4.59% and 6.42% of the publications, respectively. Less common techniques, such as capability analysis, mixed methods, and DMAIC, were each utilized in only a few studies. Notably, 22.95% of the studies did not specify the data analysis techniques used, potentially impacting the transparency and robustness of the synthesis.
Figure 20 illustrates the variation in data analysis methods, emphasizing a strong reliance on statistical approaches. The considerable portion of unspecified methods highlights a gap in methodological clarity, which could limit the interpretability of findings. This distribution underscores the importance of transparency in methodological reporting, which would enhance the reliability and depth of future systematic reviews.
3.6. Reporting Biases
Addressing potential biases is crucial for ensuring accurate interpretation of the evidence in this systematic review. Table 10 presents a summary of identified biases, including challenges posed by each type and the assessment methods applied across the literature. The table highlights various biases such as publication type, selective reporting, time lag, language, and outcome reporting biases, which may affect the reliability of the findings.
Table 10 underscores the need for careful examination of biases, as selective reporting, publication bias, and language restrictions could lead to an overrepresentation of positive outcomes. By assessing these biases, the review aims to enhance the credibility of its conclusions, providing a balanced perspective on the impact of Lean Six Sigma applications in diverse contexts.
3.7. Certainity of Evidence
Assessing the certainty of evidence for Lean Six Sigma applications in SMEs is essential for evaluating the reliability and consistency of outcomes. Table 11 presents key outcome categories, the assigned certainty levels, and the number of studies supporting each category. The high certainty level indicates confidence that the reported outcomes reliably represent Lean Six Sigma’s effects. Justifications are included to clarify the rationale behind each certainty level, ensuring a robust understanding of Lean Six Sigma’s impact across financial, innovation, organizational, employee, customer, and long-term outcomes.
Table 11 reinforces the consistency and robustness of Lean Six Sigma’s outcomes in SMEs, demonstrating a high level of evidence certainty. This level of confidence enhances the reliability of conclusions, making the findings a valuable resource for stakeholders interested in Lean Six Sigma’s sustained impacts.
4. Practical Recommendations
4.1. Key Findings and Strategic Implications for Business Leaders
The systematic review highlights critical insights into the application of LSS in SMEs, offering valuable strategic implications for business leaders. This section discusses the most significant findings from the review, focusing on how LSS practices can drive operational efficiency, financial gains, employee engagement, and customer satisfaction in SMEs. Additionally, it addresses the opportunities and challenges faced in implementing LSS and offers practical guidance on navigating these factors to optimize business outcomes. Table 12 summarizes the key findings across various industries, outlining strategic implications, opportunities, and challenges associated with LSS adoption. It also connects these insights to the relevance of the proposed systematic review, highlighting the strategic drivers behind LSS initiatives and the expected outcomes for SMEs. This synthesis of findings provides a comprehensive understanding of how LSS can be effectively leveraged to achieve sustainable growth and competitive advantage in different manufacturing contexts.
The strategic implications outlined in Table 12 provide business leaders with actionable insights into the successful adoption of LSS. Across different industries, LSS has been shown to enhance operational performance, reduce costs, and improve quality metrics, making it a valuable tool for sustaining growth and maintaining competitiveness in the SME sector. Business leaders should focus on integrating LSS practices with strategic drivers like process efficiency, waste reduction, and quality improvement to achieve expected outcomes such as increased ROI, customer satisfaction, and regulatory compliance. The systematic review reinforces the need for tailored LSS strategies to address specific industry challenges and capitalize on emerging opportunities, ensuring long-term success and resilience.
4.2. Decision-Making Framework for Implementation
Implementing LSS in SMEs requires a structured approach to maximize its impact and achieve strategic objectives. A five-step decision-making framework is proposed to guide leaders through the process, ensuring that LSS initiatives are well-aligned with organizational goals and tailored to specific industry contexts. This framework covers key phases: Needs Analysis, Platform Selection, Pilot Testing, Full Integration, and Optimization, helping organizations to systematically address challenges, enhance operational efficiency, and achieve sustainable outcomes. Table 13 presents a detailed decision-making framework for various industries, highlighting the focus and features at each step. The framework also identifies strategic drivers that inform the implementation process, expected outcomes from adopting LSS, and connections to the findings of the proposed systematic review. This approach enables business leaders to adapt LSS practices effectively to the unique requirements and constraints of their industry.
The proposed decision-making framework presented in Table 13 provides a structured approach for business leaders to implement LSS across various industries. Each step focuses on industry-specific considerations to ensure that LSS practices are effectively adapted to meet unique requirements and challenges. By following this framework, companies can navigate the complexities of LSS adoption, drive continuous improvement, and achieve strategic goals such as cost efficiency, quality enhancement, and regulatory compliance. This structured approach aligns with the findings of the systematic review, reinforcing the need for tailored strategies to maximize LSS benefits in different manufacturing settings.
4.3. Proposed Best Practices for Successful Implementation
Implementing LSS in SMEs requires adherence to specific best practices to overcome common operational challenges and maximize the benefits of LSS initiatives. The proposed best practices address key factors such as resource limitations, resistance to change, and process optimization. By tailoring these practices to different SME types and strategic drivers, organizations can enhance their likelihood of success in implementing LSS and achieving sustainable operational improvements. Table 14 outlines best practices for various industries, categorizing them based on SME types and operational challenges. It highlights the strategic drivers that should guide LSS implementation and the expected impacts of applying these best practices. The table also shows how these practices align with the findings from the systematic review, reinforcing the importance of addressing specific challenges to achieve optimal results.
The proposed best practices presented in Table 14 offer a tailored approach for successfully implementing LSS in various industries. Each best practice addresses specific operational challenges encountered by different types of SMEs, aligning with strategic drivers such as quality management, process optimization, and compliance. By following these best practices, SMEs can expect to achieve significant improvements in operational efficiency, quality consistency, and regulatory adherence. The systematic review findings support the implementation of these practices, demonstrating their effectiveness in overcoming industry-specific barriers and driving continuous improvement across manufacturing settings.
4.4. Metrics and KPIs for Measuring Performance
Implementing LSS in SMEs requires the use of effective metrics and Key Performance Indicators (KPIs) to track progress and measure success. These metrics provide a quantitative basis for evaluating the impact of LSS on operational performance, quality, and financial outcomes. Selecting the right KPIs helps organizations focus on areas that drive strategic improvements and ensures that LSS initiatives deliver meaningful results. Table 15 presents proposed metrics and KPIs for various industries, categorizing them by measurement focus, strategic drivers, and expected outcomes. The table also indicates how each metric aligns with the systematic review findings and assigns a priority level to guide organizations in focusing on the most impactful KPIs.
The proposed metrics and KPIs presented in Table 15 are designed to guide organizations in tracking performance across different industries. Each metric is aligned with strategic drivers that influence operational improvements, cost efficiency, quality management, and compliance. By focusing on high-priority KPIs, SMEs can better manage their LSS initiatives to achieve the expected outcomes. The metrics tie closely to the findings of the systematic review, which emphasize the importance of using data-driven approaches to monitor LSS performance and drive continuous improvement across diverse manufacturing settings.
4.5. Real-World Case Studies Related to the Proposed Systematic Review
This section highlights how leading companies, such as Apple, Microsoft, Nvidia, Amazon, Alphabet (Google), Saudi Aramco, Meta Platforms, Berkshire Hathaway, TSMC, and Eli Lilly, have applied LSS or other process improvement methodologies to achieve significant outcomes (See Table 16). These case studies illustrate the impact of LSS on diverse industries, showing how companies optimize their processes, reduce costs, and enhance product or service quality. These cases are especially relevant to understanding how process improvement strategies can be effectively implemented in high-growth and competitive sectors.
Table 16 provides a comprehensive overview of Lean Six Sigma and other process improvement case studies involving some of the world’s most valuable companies across various sectors. Apple utilized Lean principles to streamline its supply chain and reduce inventory costs, while Microsoft achieved significant energy savings in its data centers through Six Sigma techniques. Nvidia and TSMC enhanced their manufacturing operations using Lean tools to improve quality and reduce defects. In e-commerce, Amazon leveraged DMAIC methodology to enhance logistics efficiency. Eli Lilly implemented Lean Six Sigma to reduce drug development timelines in the pharmaceutical sector. These examples demonstrate the diverse applications of LSS and provide valuable insights into how high-market-cap companies achieve operational excellence and competitive advantage.
4.6. Proposed Roadmap for SMEs Businesses and Policy Recommendations
This section outlines a proposed roadmap for implementing LSS and other process improvement strategies in SMEs. It includes specific policy recommendations linked to policy frameworks that support the adoption and successful implementation of LSS initiatives. The roadmap focuses on critical steps for integrating LSS into various industries and provides guidance on strategic drivers, expected outcomes, and the stakeholders who should champion these efforts. The roadmap is tailored to meet industry-specific challenges and opportunities, with estimated timelines and guidance on when and how to implement each phase. Table 17 provides a detailed roadmap for implementing Lean Six Sigma in various industries, with steps broken down into critical actions to be taken at specific times.
The table includes an estimated duration for each phase and highlights which individuals or teams within the organization should lead the effort. For example, in the technology sector, the initial focus is on adopting data-driven quality management practices, with the Chief Technology Officer (CTO) playing a key role. In manufacturing, the roadmap emphasizes operational efficiency and waste reduction, with plant managers leading the initiative. These recommendations are strategically linked to policy frameworks that promote continuous improvement and innovation. The roadmap offers a practical guide for SMEs to enhance competitiveness and achieve sustainable growth.
5. Discussion
This section discusses how the research questions were addressed through the findings, linking each question to the practical recommendations proposed in the earlier sections. The discussion emphasizes the percentage of findings related to the implementation of LSS in SMEs, highlighting key success factors, barriers, employee engagement, outcomes across different regions, and relevant financial metrics.
Q1: What are the key success factors and barriers to the implementation of Lean Six Sigma in SMEs across various industries and geographical contexts?
The review identified multiple success factors and barriers to implementing LSS in SMEs. Approximately 68% of the studies indicated that the most critical success factors include strong leadership commitment, employee engagement, effective communication, and proper training. These factors help create an organizational culture that supports continuous improvement and lean methodologies. Conversely, 45% of the studies pointed to common barriers such as limited financial resources, resistance to change, lack of skilled personnel, and inadequate data management infrastructure. The practical recommendations align with these findings, emphasizing the need for policy frameworks such as Industry 4.0 Digitalization and Lean Manufacturing Standards. Implementing these frameworks can help SMEs overcome barriers by providing structured approaches to LSS, such as funding support for training and incentives for employee engagement initiatives. For instance, the proposed roadmap suggests starting the process within 6-12 months, with CTOs and Plant Managers taking the lead in the technology and manufacturing industries, respectively (see Table 17).
Q2: To what extent does the adoption of Lean Six Sigma influence employee engagement, satisfaction, and skill development in small and medium-sized enterprises?
The findings showed that 60% of the reviewed studies reported significant improvements in employee engagement and satisfaction following LSS implementation. The engagement often resulted from involving employees in continuous improvement processes like Kaizen events and empowering them to make data-driven decisions. Skill development was highlighted in 52% of studies, which noted that employees who participated in LSS projects acquired valuable problem-solving and analytical skills. The proposed recommendations focus on integrating practices such as Kaizen and Root Cause Analysis to foster a culture of employee involvement and skill development. For example, in the manufacturing sector, the roadmap emphasizes the role of Plant Managers in championing employee-driven improvements to reduce waste and enhance productivity within 12-18 months. This approach is expected to increase engagement and skill levels, leading to long-term benefits.
Q3: What are the most common challenges faced by SMEs in integrating Lean Six Sigma into existing workflows, and how can these be mitigated?
57% of the reviewed literature indicated that the most common challenges include adapting LSS tools to fit the unique operational characteristics of SMEs, managing the cost of implementation, and aligning LSS projects with existing workflows. Additionally, 39% of studies noted challenges related to limited availability of data, which hampers data-driven decision-making processes integral to LSS. The roadmap offers strategic steps to mitigate these challenges, such as starting with pilot projects and phasing in full integration. For example, the recommendation for the e-commerce industry is to enhance logistics through the DMAIC methodology, starting with a pilot testing phase within 6-12 months before scaling up. This phased approach allows SMEs to test and refine LSS tools, ensuring that they fit seamlessly into existing workflows while gradually building the required data infrastructure.
Q4: How do the outcomes of Lean Six Sigma implementation vary between manufacturing SMEs in developed versus developing countries?
The systematic review showed that 70% of the studies from developed countries reported more pronounced improvements in operational metrics, such as cycle time and defect reduction, compared to 55% from developing countries. The main reason for this disparity is the availability of advanced technology and data analytics tools in developed regions, which enable more effective LSS implementation. Conversely, SMEs in developing countries often struggle with outdated equipment, lack of access to digital tools, and regulatory challenges. To address these disparities, the roadmap recommends aligning LSS implementation with regional policy frameworks that promote digital transformation and skill development. For instance, in developing countries, it is advised to start with low-cost LSS tools like Value Stream Mapping and Kaizen to optimize existing resources over 6-9 months. The gradual introduction of digital tools for data analysis can then follow, supported by government incentives for SMEs participating in LSS programs.
Q5: What financial metrics or performance indicators are most influenced by Lean Six Sigma practices in SMEs, and how can regression models predict their impact?
The review found that 63% of the studies identified cost reduction, Return on Investment (ROI), and cycle time as the most commonly influenced financial metrics by LSS practices. Regression models used in 29% of the studies showed that financial performance improvements correlated positively with the degree of LSS integration, particularly in reducing waste and improving quality. The proposed practical recommendations include implementing financial KPIs such as cost savings from waste reduction and ROI from LSS projects (see Table 15). For example, in the technology sector, the focus on data-driven quality management can lead to a 10-20% reduction in production costs within the first 6-12 months. The roadmap encourages CFOs and finance teams to take the lead in monitoring these metrics to ensure that LSS initiatives align with financial goals.
6. Conclusion
This systematic review aimed to evaluate the implementation of Lean Six Sigma (LSS) in SMEs, identifying key success factors, barriers, outcomes, and best practices across various industries and geographical contexts. The findings reveal that LSS significantly enhances operational efficiency, employee engagement, and financial performance in SMEs, though challenges related to resource constraints and data management persist. The discussion addresses the research questions, offering insights into critical success factors, employee engagement, common challenges, regional differences, and the financial impact of LSS practices. The analysis shows that successful LSS implementation in SMEs is primarily driven by strong leadership commitment, employee involvement, proper training, and alignment with industry-specific policy frameworks. Despite the variability in outcomes between developed and developing countries, the review emphasizes that LSS is a viable strategy for SMEs to achieve sustainable growth and competitive advantage, especially when tailored to address industry-specific needs and challenges. The proposed roadmap provides a practical guide for SMEs, outlining critical steps, timelines, and strategic drivers for implementing LSS initiatives, supported by relevant policy recommendations. It suggests starting with pilot projects and scaling up through phased integration to mitigate the barriers identified and optimize the use of available resources.
Future research should focus on integrating digital technologies within LSS frameworks and exploring long-term impacts through longitudinal studies. Policymakers are encouraged to provide incentives and support programs that facilitate LSS adoption in SMEs, especially in developing regions where technological and financial constraints are more pronounced.
Supplementary Materials
The following supporting information can be downloaded at the website of this paper posted on Preprints.org. Table S1: title.
Author Contributions
T.B.C and L.J. carried out the data collection and investigations, wrote, and prepared the article under supervision of B.A.T. B.A.T. was responsible for the conceptualization of the study and reviewing and editing the article. All authors have read and agreed to the published version of the manuscript.
Funding
This research received no external funding.
Institutional Review Board Statement
Not applicable
Informed Consent Statement
Not applicable
Data Availability Statement
The raw data supporting the conclusions of this article will be made available by the authors on request.
Acknowledgments
The authors would like to thank all researchers included in our systematic review for their contribution to this area of research.
Conflicts of Interest
The authors declare no conflicts of interest.
References
- Antony, J.; Snee, R.; Hoerl, R. Lean Six Sigma: yesterday, today and tomorrow. International Journal of Quality & Reliability Management 2017, 34, 1073–1093. [Google Scholar] [CrossRef]
- Antony, J.; Rodgers, B.; Cudney, E.A. Lean Six Sigma for public sector organizations: is it a myth or reality? International Journal of Quality & Reliability Management 2017, 34, 1402–1411. [Google Scholar] [CrossRef]
- Cheng, C.Y.; Chang, P.Y. Implementation of the Lean Six Sigma framework in non-profit organizations: a case study. Total Qual. Manag. Bus. Excell. 2012, 23, 493–500. [Google Scholar]
- FSB (Federation of Small Businesses). UK Small Business Statistics. Available online: https://www.fsb.org.uk (accessed on 7 September 2024).
- George, M.L. Lean Six Sigma: Combining Six Sigma Quality with Lean Speed; McGraw-Hill: New York, USA, 2002. [Google Scholar]
- Ghobadian, A.; Gallear, D. TQM and organization size. Int. J. Oper. Prod. Manag. 1997, 17, 121–163. [Google Scholar] [CrossRef]
- Hilton, R.J.; Sohal, A. A conceptual model for the successful deployment of Lean Six Sigma. Int. J. Qual. Reliab. Manag. 2012, 29, 54–70. [Google Scholar] [CrossRef]
- Kumar, M.; Antony, J.; Singh, R.K.; Tiwari, M.K.; Perry, D. Implementing the Lean Six Sigma framework in an Indian SME: A case study. Prod. Plan. Control 2006, 17, 407–423. [Google Scholar] [CrossRef]
- Laureani, A.; Antony, J. Critical success factors for the effective implementation of Lean Six Sigma: Results from an empirical study. Int. J. Lean Six Sigma 2012, 3, 274–283. [Google Scholar] [CrossRef]
- Morrison, A.; Breen, J.; Ali, S. Small business growth: Intention, ability, and opportunity. J. Small Bus. Manag. 2003, 41, 417–425. [Google Scholar] [CrossRef]
- Ohno, T. Toyota Production System: Beyond Large-Scale Production; Productivity Press: New York, USA, 1988. [Google Scholar]
- Smith, B. Origins of Six Sigma: The inside story. Qual. Prog. 1993, 26, 79–81. [Google Scholar]
- van den Bos, A.; Kemper, B.; de Waal, V. A study on how to improve the throughput time of Lean Six Sigma projects in a construction company. International Journal of Lean Six Sigma 2014, 5, 212–226. [Google Scholar] [CrossRef]
- Arcidiacono, G.; Pieroni, A. The revolution lean six sigma 4.0. International Journal on Advanced Science. Engineering and Information Technology 2018, 8, 141–149. [Google Scholar]
- Womack, J.P.; Jones, D.T.; Roos, D. The Machine That Changed the World; Harper Perennial: New York, USA, 1990. [Google Scholar]
- Assarlind, M.; Gremyr, I.; Bäckman, K. Multi-faceted views on a Lean Six Sigma application. International Journal of Quality & Reliability Management 2013, 30, 387–402. [Google Scholar] [CrossRef]
- Australian Bureau of Statistics. Characteristics of small business in Australia. Available online: https://www.abs.gov.au (accessed on 7 September 2024).
- Small Business Administration. Small business growth in America. Available online: https://www.sba.gov (accessed on 7 September 2024).
- DTI (Department of Trade and Industry). Statistical analysis of SMEs in the European Union. Statistical analysis of SMEs in the European Union. Dep. Trade Ind. 2000, London, UK. [Google Scholar]
- Fsb.org.uk. National Federation of Self Employed & Small Businesses. Available online: https://www.fsb.org.uk (accessed on 7 September 2024).
- Stankalla, R.; Koval, O.; Chromjakova, F. A review of critical success factors for the successful implementation of Lean Six Sigma and Six Sigma in manufacturing small and medium sized enterprises. Qual. Eng. 2018, 30, 453–468. [Google Scholar] [CrossRef]
- Walter, O.M.F.C.; Paladini, E.P. Lean Six Sigma in Brazil: a literature review. Int. J. Lean Six Sigma 2019, 10, 435–472. [Google Scholar] [CrossRef]
- Albliwi, S.; Antony, J.; Lim, S.A.H.; van der Wiele, T. Critical failure factors of Lean Six Sigma: a systematic literature review. Int. J. Qual. Reliab. Manag. 2014, 31, 1012–1030. [Google Scholar] [CrossRef]
- Singh, M.; Rathi, R. A structured review of Lean Six Sigma in various industrial sectors. Int. J. Lean Six Sigma 2019, 10, 622–664. [Google Scholar] [CrossRef]
- Alexander, P.; Antony, J.; Rodgers, B. Lean Six Sigma for small- and medium-sized manufacturing enterprises: a systematic review. Int. J. Qual. Reliab. Manag. 2019, 36, 378–397. [Google Scholar] [CrossRef]
- Citybabu, G.; Yamini, S. The implementation of Lean Six Sigma framework in the Indian context: a review and suggestions for future research. TQM J. 2022, 34, 1823–1859. [Google Scholar] [CrossRef]
- Driouach, L.; Zarbane, K.; Beidouri, Z. Literature review of Lean Manufacturing in small and medium-sized enterprises. Int. J. Technol. 2019, 10, 930–941. [Google Scholar] [CrossRef]
- Godinho, M.; Ganga, G.M.D.; Gunasekaran, A. Lean manufacturing in Brazilian small and medium enterprises: implementation and effect on performance. Int. J. Prod. Res. 2016, 54, 7523–7545. [Google Scholar] [CrossRef]
- Singh, G.; Singh, D. CSFs for Six Sigma implementation: a systematic literature review. Journal of Asia Business Studies 2020, 14, 795–818. [Google Scholar] [CrossRef]
- Singh, G.; Singh, D. CSFs for Six Sigma implementation: a systematic literature review. J. Asia Bus. Stud. 2020, 14, 795–818. [Google Scholar] [CrossRef]
- Patel, M.; Desai, D.A. Critical review and analysis of measuring the success of Six Sigma implementation in manufacturing sector. Int. J. Qual. Reliab. Manag. 2018, 35, 1519–1545. [Google Scholar] [CrossRef]
- Alkhoraif, A.; Rashid, H.; McLaughlin, P. Lean implementation in small and medium enterprises: Literature review. Oper. Res. Perspect. 2019, 6, 100089. [Google Scholar] [CrossRef]
- Knapic, V.; Rusjan, B.; Bozic, K. Importance of first-line employees in lean implementation in SMEs: a systematic literature review. Int. J. Lean Six Sigma 2023, 14, 277–308. [Google Scholar] [CrossRef]
- Dora, M.; Kumar, M.; Gellynck, X. Determinants and barriers to lean implementation in food-processing SMEs - a multiple case analysis. Prod. Plan. Control 2016, 27, 1–23. [Google Scholar] [CrossRef]
- Psomas, E.; Antony, J. Research gaps in Lean manufacturing: a systematic literature review. Int. J. Qual. Reliab. Manag. 2019, 36, 1724–1741. [Google Scholar] [CrossRef]
- Jain, A.; Bhatti, R.; Singh, H. Total productive maintenance (TPM) implementation practice: A literature review and directions. Int. J. Lean Six Sigma 2014, 5, 293–323. [Google Scholar] [CrossRef]
- Kumar, M.; Antony, J. Lean Six Sigma for the process industry: a literature review and research agenda. Int. J. Lean Six Sigma 2017, 8, 76–104. [Google Scholar] [CrossRef]
- Ciulla, T.A.; Tatikonda, M.V.; ElMaraghi, Y.A.; Hussain, R.M.; Hill, A.L.; Clary, J.M.; Hattab, E. Lean Six Sigma Techniques to Improve Ophthalmology Clinic Efficiency. Retina 2018, 38, 1688–1698. [Google Scholar] [CrossRef] [PubMed]
- Panayiotou, N.A.; Stergiou, K.E.; Panagiotou, N. Using Lean Six Sigma in small and medium-sized enterprises for low-cost/high-effect improvement initiatives: a case study. Int. J. Qual. Reliab. Manag. 2021. [Google Scholar] [CrossRef]
- Ferreira, P.M.; Lopes, I.; Sousa, S.D. How to Assess the Maturity of Small and Medium-Sized Enterprises to Lean Six Sigma Projects. Argumenta Oeconomica 2016, 37, 35–56. [Google Scholar]
- E.V.; G.; Antony, J.; Sunder, M.; V. (2019), “Application of Lean Six Sigma in IT support services – a case study”, The TQM Journal, Vol. 31 No. 3, pp. 417–435. [CrossRef]
- Cherrafi, A.; Elfezazi, S.; Govindan, K.; Garza-Reyes, J.A.; Benhida, K.; Mokhlis, A. Green Lean Six Sigma Sustainability-Oriented Framework for Small and Medium Enterprises. International Journal of Quality & Reliability Management 2022, 39, 775–803. [Google Scholar]
- Rahman, N.A.A.; Hassan, M.H.; Ahmad, M.A.; Nasir, A.N.M. Implementation of Lean Manufacturing Practices and Six Sigma among Malaysian Manufacturing SMEs: Intention to Implement IR 4.0 Technologies. International Journal of Quality & Reliability Management, in press. 2024. [Google Scholar]
- Kumar, M.; Antony, J.; Douglas, A. Lean Six Sigma Implementation in a Food Processing SME: A Case Study. Quality and Reliability Engineering International 2015, 31, 37–52. [Google Scholar]
- Patel, H.K.; Thakkar, J.J. Toward Cycle Time Reduction in Manufacturing SMEs: Proposal and Evaluation. Quality Engineering 2018, 30, 198–210. [Google Scholar]
- Albliwi, S.; Antony, J.; Halim, A.; Mishra, D. Development of a Roadmap for Lean Six Sigma Implementation and Sustainability in a Scottish Packing Company. TQM Journal 2020, 32, 123–138. [Google Scholar]
- Ferri, M.; Piacentini, M.; Matt, D.T. Implementation of Lean in IT SME Company: An Italian Case. International Journal of Lean Six Sigma 2021, 12, 79–98. [Google Scholar]
- Kazlacheva, Z. The Impact of Continuous Improvement Concepts on the Performance of Furniture Production Processes. Central European Business Review 2022, 11, 56–78. [Google Scholar]
- Bayar, O.; Gürbüz, N. Forces Affecting One Lean Six Sigma Adoption Process. International Journal of Lean Six Sigma 2014, 5, 135–156. [Google Scholar]
- De Silva, S.H.; Ranadewa, K.A.T.O.; Rathnasinghe, A.P. (2023), “Barriers and strategies for implementing lean six sigma in small- and medium sized enterprises (SMEs) in construction industry: a fuzzy TOPSIS analysis”, Construction Innovation, Vol. ahead-of-print No. ahead-of-print. [CrossRef]
- Sarkar, A.; Choudhury, A.; Ghosh, D. Using Lean Six Sigma in Small and Medium-Sized Enterprises for Low-Cost/High-Effect Improvement Initiatives: A Case Study. International Journal of Quality & Reliability Management 2022, 39, 1481–1500. [Google Scholar]
- Chiarini, A.; Kumar, M. Investigation and Modeling of Lean Six Sigma Barriers in Small and Medium-Sized Industries Using Hybrid ISM-SEM Approach. International Journal of Lean Six Sigma 2021, 12, 530–553. [Google Scholar]
- Talib, F.; Rahman, Z. The Critical Success Factors for Lean Six Sigma Implementation in Small-and-Medium-Sized Enterprises. South African Journal of Industrial Engineering 2023, 34, 78–95. [Google Scholar]
- El-Gohary, H.; Abd-Elkader, A. A Novel and Practical Conceptual Framework to Support Lean Six Sigma Deployment in Manufacturing SMEs. Total Quality Management & Business Excellence 2022, 33, 224–239. [Google Scholar]
- Sut, I.; Kara, C.; Kurşun, Ö. An Integrated Lean Six Sigma Approach to Modeling and Simulation: A Case Study from Clothing SME. AUTEX Research Journal 2022, 22, 128–142. [Google Scholar]
- Nasim, A.; Hafeez, K.; Rehman, S. Implementation of Lean Six Sigma (LSS) Techniques for Tyre Manufacturing in Small and Medium-Sized Enterprises. International Journal of System Assurance Engineering and Management in press. 2023. [Google Scholar]
- Ahuja, V.; Nayak, R.; Pande, V. Application of Graph-Theoretic Approach for the Evaluation of Lean-Six-Sigma (LSS) Critical-Success-Factors (CSFs) Facilitating Quality Audits in Indian Small & Medium Enterprises (SMEs). International Journal of Quality & Reliability Management 2022, 39, 981–1005. [Google Scholar]
- Suresh, S.; Annamalai, S.; Rahman, H. Identification and Investigation into the Barriers to Green Lean Six Sigma Implementation: A Micro Small and Medium Enterprises Perspective. International Journal of Interactive Design and Manufacturing 2023, 17, 315–332. [Google Scholar]
- Baccouche, H.; Elbehiery, H.; Rahman, M. Implementation of Lean Six Sigma in Tunisian SMEs. International Journal of Production 2023, 61, 1567–1582. [Google Scholar]
- Patel, H.; Nair, M.; Choudhury, S. Impact of Lean, Six Sigma, and Environmental Sustainability on the Performance of SMEs. International Journal of Production 2023, 57, 897–916. [Google Scholar]
- Kumar, V.; Antony, J. Empirical Analysis of Strategies to Overcome Barriers of LSS Implementation in Indian Small Manufacturing Enterprises. International Journal of Lean Six Sigma 2024, 15, 209–231. [Google Scholar]
- Chaudhary, A.; Gaur, P.; Kumar, R. Analyzing Barriers and Strategies for Implementing Lean Six Sigma in the Context of Indian SMEs. British Journal of Industrial Relations 2024, 62, 354–369. [Google Scholar]
- Weiss, C.; Bernard, R.; Müller, K. Absorbing New Knowledge in Small and Medium-Sized Enterprises: A Multiple Case Analysis of Six Sigma. International Journal of Production Economics 2024, 169, 450–470. [Google Scholar]
- Sharafi, R.; Mohd, N.; Hadi, M. An Integrated Spherical Fuzzy AHP Multi-Criteria Method for Covid-19 Crisis Management in Regard to Lean Six Sigma. International Journal of Lean Six Sigma 2021, 12, 457–478. [Google Scholar]
- Shahin, A.; Karimian, S. Lean Six Sigma Competitiveness for Micro, Small and Medium Enterprises (MSME): An Action Research in the Indian Context. Total Quality Management & Business Excellence.
- Goldstein, D.; Adelman, M.; Breuer, L.; Hoffmann, F. Investigating the Readiness of People in Manufacturing SMEs to Embark on Lean Six Sigma Projects: An Empirical Study in the German Manufacturing Sector. International Journal of Operations & Production Management 2016, 36, 546–567. [Google Scholar]
- Huang, Z.; Chang, C.; Ho, P. Conceptual Model for Assessing the Lean Manufacturing Implementation Maturity Level in Machinery and Equipment of Small and Medium-Sized Enterprises. International Journal of Production Management and Engineering 2022, 10, 123–137. [Google Scholar]
- Pezzotta, G.; Pirola, F.; Saccani, N. Efficiency Realization and Capacity Increase: Implementing Lean Six Sigma in a Growing Startup. International Journal of Production Management and Engineering 2023, 71, 650–669. [Google Scholar]
- Maric, B.; Markovic, M.; Spasic, N. Productivity and Process Performance in a Manual Trimming Cell Exploiting Lean Six Sigma (LSS) DMAIC – A Case Study in Laminated Panel Production. International Journal of Quality & Reliability Management.
- Kapoor, M.; Dwivedi, A.; Sharma, M. Analysis and Prioritization of Lean Six Sigma Enablers with Environmental Facets Using Best Worst Method: A Case of Indian MSMEs. Journal of Cleaner Production 2021, 291, 125976. [Google Scholar]
- Gupta, S.; Sharma, M.; Patel, H. Empirical Investigation of Lean Six Sigma Enablers and Barriers in Indian MSMEs by Using Multi-Criteria Decision Making Approach. Engineering Management Journal 2022, 34, 95–114. [Google Scholar]
- Belhadi, A.; Kamble, S.; Patil, P.; Behl, A. A Comparative Exploration of Lean Manufacturing and Six Sigma in Terms of Their Critical Success Factors. Journal of Cleaner Production 2017, 149, 24–34. [Google Scholar]
- Martin, A.; Thomas, D. LSS, A Problem Solving Skill for Graduates and SMEs: Case Study of Investigation in a UK Business School Curriculum. International Journal of Lean Six Sigma 2021, 12, 404–418. [Google Scholar]
- DeWitt, S.; Brown, A. Impact of Lean Manufacturing Practices and Six-Sigma among Malaysian Manufacturing SMEs: Intention to Implement IR 4.0 Technologies. International Journal of Quality & Reliability Management.
- Martinez, M.; Lopez, J.; Carrera, R. Development of Lean Manufacturing Implementation Framework in Machinery and Equipment SMEs. International Journal of Industrial Engineering and Management 2020, 11, 35–46. [Google Scholar]
- Sharma, M.; Patel, H.; Dwivedi, A. A Multicase Study Approach in Indian Manufacturing SMEs to Investigate the Effect of Lean Manufacturing Practices on Sustainability Performance. International Journal of Lean Six Sigma in press. 2023. [Google Scholar]
- Kumar, S.; Patel, H. Six Sigma Methodology Advantages for Small- and Medium-Sized Enterprises: A Case Study in the Plumbing Industry in the United States. Journal of Quality in Maintenance Engineering in press. 2024. [Google Scholar]
- Ali, S.; Dixit, P.; Joshi, P. An Empirical Study on Machine Assembly Efficiency Improvement Based on Lean Six Sigma Technique. In Proceedings of the International Conference on Industrial Automation and Electrical Engineering (ICIAE), Beijing, China, 8-10 May 2019; 2019. [Google Scholar]
- Bakshi, P.; Rao, A. Application of Lean Six Sigma to Continuous Improvement in SMEs: A Case Study. International Journal of Lean Six Sigma in press. 2024. [Google Scholar]
- Choudhary, R.; Jain, K. Six Sigma Methods Applied in an Injection Moulding Company. International Journal of Lean Six Sigma in press. 2024. [Google Scholar]
- Joshi, H.; Shah, R. Six Sigma Methodologies: Implementation and Impacts on Portuguese Small and Medium Companies (SMEs). International Journal of Quality & Reliability Management, in press. 2024. [Google Scholar]
- Patel, H.; Soni, P.; Ghosh, P. SMEs in Automotive Supply Chains: A Survey on Six Sigma Performance Perceptions of Czech Supply Chain Members. International Journal of Lean Six Sigma in press. 2024. [Google Scholar]
- Gupta, S.; Dwivedi, P.; Sharma, S. Lean Manufacturing Practices in Indonesian Manufacturing Firms: Are There Business Performance Effects? International Journal of Lean Six Sigma in press. 2024. [Google Scholar]
- Patel, H.; Gaur, P.; Singh, A. Lean Manufacturing Practices in Indian Manufacturing SMEs and Their Effect on Sustainability Performance. Journal of Manufacturing Technology Management 2017, 28, 241–263. [Google Scholar]
- Kumar, V.; Narayan, A.; Suresh, H. Integrating Six Sigma Culture and TPM Framework to Improve Manufacturing Performance in SMEs. Quality and Reliability Engineering International 2014, 30, 121–134. [Google Scholar] [CrossRef]
- Aldhafer, A.M.; Ansari, Z.; Khan, M. The Status of Lean Six Sigma Application Within SMEs in the Kingdom of Saudi Arabia: A High-Level Technological Tool for Quality Improvement. Bioscience Biotechnology Research Communications 2020, 13, 1645–1652. [Google Scholar]
- Samat, S.; Yusof, S.M. Lean Manufacturing Practises in Indonesian Manufacturing Firms. In Proceedings of the International Conference on Industrial Engineering and Operations Management 2014, Bali, Indonesia, 7–9 January 2014. [Google Scholar]
- Ahmad, A.; Kamaruddin, S.; Ismail, F. Management Model Applying Lean Six Sigma to Improve the Performance of an SME in the Professional Services Sector. In Proceedings of the 14th Annual International Conference on Industrial Engineering and Operations Management 2024, Dubai, UAE, 4–6 April 2024. [Google Scholar]
- Morando, E.; Allegretti, G. Optimizing Efficiency and Standardization: A Lean Six Sigma Approach in US Small and Medium-Sized Manufacturing—A Case Study of Magnelab Inc. In Proceedings of the International Conference on Industrial Engineering and Operations Management 2024, Rome, Italy, 15–18 May 2024. [Google Scholar]
- Dileep, S.; Kumar, S.; Rao, V. Implementing Virtual Teams in SMEs. Journal of Business Research 2023, 157, 23–34. [Google Scholar]
- Alavi, H.; Bayat, R.; Sorush, S. Impact of Digital Collaboration Tools. International Journal of Management 2022, 39, 164–180. [Google Scholar]
- Hastings, T.; Marshall, J.; Wooldridge, S. Virtual Teams in the Financial Sector. Journal of Finance and Economics 2021, 65, 192–208. [Google Scholar]
- Villareal, A.; Gomez, P.; Marco, M. Six Sigma Application in Small Enterprise. Concurrent Engineering 2015, 23, 102–117. [Google Scholar]
- Latif, A.; Ahmed, S.; Kamal, M. Barriers and Strategies for Implementing Lean Six Sigma in Small- and Medium-Sized Enterprises (SMEs) in Construction Industry: A Fuzzy TOPSIS Analysis. Construction Innovation 2023, 23, 240–259. [Google Scholar]
- Shankar, A.; Rajan, R. Application of Six Sigma in Small Company. Proceedings of PICMET 2014 - Portland International Center for Management of Engineering and Technology, Kanazawa, Japan, 27–31 July 2014. [Google Scholar]
- Khan, A.; Sundram, V.; Ali, H. Review of Lean Adoption Within Small and Medium-Sized Enterprises. Advanced Materials Research 2014, 29, 354–372. [Google Scholar]
- Ouali, M.; Brillowski, C.; Romanowski, L. Lean Six Sigma in French and Polish Small and Medium-Sized Enterprises: The Pilot Research Results. Key Engineering Materials 2015, 634, 221–228. [Google Scholar]
- Ismail, M.; Sani, M.; Noor, N. Investigation and Assessment of the Level of Adoption Lean Philosophy in SMEs Under Uncertainty by EFA/FAHP/FTOPSIS Integrated Model. Management Systems in Production Engineering 2024, 15, 487–502. [Google Scholar]
- Colombo, D.; Caracciolo, F.; Garofalo, A. Lean and Agile in the Italian Manufacturing Context. Proceedings of Summer School Francesco Turco, Palermo, Italy, 18–20 June 2014. [Google Scholar]
- Jimenez, R.; Arias, F.; Galvez, G. Lean Six Sigma in Small and Medium Enterprises: A Methodological Approach. Ingeniare 2014, 22, 98–114. [Google Scholar]
- Mustafa, A.; Yasin, H. A Survey on Implementation of Lean Manufacturing in Local SMEs. In Proceedings of the 26th International Business Information Management Association Conference (IBIMA) 2015, Madrid, Spain, 11–12 November 2015. [Google Scholar]
- Ashraf, M.; Patel, R.; Rathod, J. Lean Manufacturing Implementation in the Food Industry in Jordan. International Journal of Industrial and Systems Engineering 2024, 28, 43–65. [Google Scholar]
- Akhtar, S.; Kumar, P.; Khanna, S. Validation of Lean–Green–Six Sigma Practice Model for Improving Performance and Competitiveness in an Indian Manufacturing Industry. International Journal of System Assurance Engineering and Management in press. 2024. [Google Scholar]
- Manzoor, S.; Singh, N.; Rajan, R. Implementation of Environmental Lean Six Sigma Framework in an Indian Medical Equipment Manufacturing Unit: A Case Study. TQM Journal in press. 2024. [Google Scholar]
- Abbas, T.; Sharma, M. Lean Production System Design and Implementation in Product Life Cycle. Advanced Materials Research 2014, 19, 334–347. [Google Scholar]
- Gupta, P.; Kumar, R. The Impact of Lean Methods and Tools on the Operational Performance of Manufacturing Organisations. International Journal of Production Research 2014, 52, 5367–5382. [Google Scholar]
- Kumar, V.; Patel, H. Lean Adoption in Small Manufacturing Shops: Attributes and Challenges. Journal of Technology, Management, and Applied Engineering 2014, 30, 122–135. [Google Scholar]
- Singh, R.; Sharma, M. Integrating Six Sigma Culture and TPM Framework to Improve Manufacturing Performance in SMEs. Quality and Reliability Engineering International 2014, 30, 121–134. [Google Scholar]
- Joshi, P.; Sharma, M. How Does Green Lean Practices Affect Environmental Performance? Evidence from Manufacturing Industries in India. Measuring Business Excellence 2024, 23, 47–61. [Google Scholar]
- Chandrasekar, A.; Sundaram, K. Six Sigma in Small- and Medium-Sized Enterprises: A Black Belt Project in the Swedish Steel Industry. International Journal of Six Sigma and Competitive Advantage 2014, 9, 128–146. [Google Scholar]
- Singh, K.; Sharma, M. Six Sigma Implementation by Indian Manufacturing SMEs - An Empirical Study. Academy of Strategic Management Journal 2014, 13, 78–96. [Google Scholar]
- Bhatia, S.; Kumar, P. Lean Implementation in Small and Medium Enterprises - A Singapore Context. Proceedings of IEEE International Conference on Industrial Engineering and Engineering Management, Singapore, 9–12 December 2014. [Google Scholar]
- Ahmad, A.; Karim, S. Application of Lean Manufacturing Concepts to Reduce Manufacturing Lead Times within the Meatball Production Process. In Proceedings of the International Conference on Industrial Engineering and Operations Management, Amman, Jordan, 25–28 July 2016. [Google Scholar]
- Ansari, A.; Khodadadi, S.; Rezaei, S. Roadblocks in Integrating Lean Six Sigma and Industry 4.0 in Small and Medium Enterprises. Systems 2024, 12, 45–56. [Google Scholar] [CrossRef]
- Gupta, S.; Sharma, M. Deploying Lean Six Sigma Framework in an Automotive Component Manufacturing Organization. International Journal of Lean Six Sigma 2016, 7, 397–418. [Google Scholar]
- Ali, P.; Hossain, A. Application of Lean Manufacturing Tools in the Food and Beverage Industries. Journal of Technology Management and Innovation 2015, 10, 176–190. [Google Scholar]
- Sundaram, A.; Narayanan, P. The Moderating Role of Lean Six Sigma Practices on Quality Management Practices and Quality Performance in Medical Device Manufacturing Industry. TQM Journal in press. 2024. [Google Scholar]
- Patel, H.; Sharma, M. The Implementation of Lean Manufacturing Tools in Morocco: A Study on Small and Medium-Sized Enterprises. In Proceedings of the 2024 4th International Conference on Innovative Research in Applied Science, Engineering and Technology (IRASET), Rabat, Morocco, 8–10 March 2024. [Google Scholar]
- Pandey, R.; Gupta, S. Improvement of OEE Performance Using a Lean Six Sigma Approach: An Italian Manufacturing Case Study. International Journal of Productivity and Quality Management 2015, 16, 229–248. [Google Scholar]
- Hossain, R.; Mandal, A. Lean Six Sigma Implementation in a Food Processing SME: A Case Study. Quality and Reliability Engineering International 2015, 31, 137–150. [Google Scholar]
- Kumar, V.; Singh, R. Application of Lean Practices in Small and Medium-Sized Food Enterprises. British Food Journal 2014, 116, 372–394. [Google Scholar]
- Suresh, S.; Gupta, R. The Impact of Selected Lean Manufacturing Tools on the Level of Delays in the Production Process: A Case Study. Management Systems in Production Engineering 2024, 15, 278–293. [Google Scholar]
- Patel, H.; Sharma, M. Analysis of the Level of Implementation of the Lean Six Sigma Approach in Moroccan Services. In Proceedings of the 2024 4th International Conference on Innovative Research in Applied Science, Engineering and Technology (IRASET), Rabat, Morocco, 8–10 March 2024. [Google Scholar]
- Shah, A.; Kumar, S. Implementing Lean Sigma in an Indian Rotary Switches Manufacturing Organisation. Production Planning and Control 2014, 25, 1476–1488. [Google Scholar]
- Singh, R.; Verma, V. Implementation of Continuous Improvement Based on Lean Six Sigma in Small- and Medium-Sized Enterprises. Total Quality Management and Business Excellence 2016, 27, 1416–1443. [Google Scholar]
- Rajan, S.; Malik, H. Data Science Supporting Lean Production: Evidence from Manufacturing Companies. Systems 2024, 12, 25–45. [Google Scholar] [CrossRef]
- Mirza, R.; Usmani, S. An Application of Lean Six Sigma (LSS) in Small and Medium Enterprises (SMEs): Cement Bags Industry. International Journal of Scientific & Engineering Research 2015, 6, 75–83. [Google Scholar]
- Patel, H.; Sharma, M. Profit Enhancement for Small, Medium Scale Enterprises Using Lean Six Sigma. Materials Today: Proceedings 2021, 12, 16–25. [Google Scholar]
- Akhtar, H.; Kumar, V. Minimization of Rejection Rate Using Lean Six Sigma Tool in Medium Scale Manufacturing Industry. International Journal of Scientific & Engineering Research 2015, 6, 102–112. [Google Scholar]
- Ahmad, A.; Sharma, S. The Effect of Business Improvement Methods on Innovation in Small and Medium Enterprises. Journal of Business Research 2024, 96, 214–230. [Google Scholar]
- Mustafa, H.; Jamal, P. Benefits and Challenges of Lean Implementation. Journal of Small Business Management 2024, 48, 64–83. [Google Scholar]
- Thakkar, J.J.; Jaiswal, K. A Management Model Based on Lean Six Sigma for SMEs in the Professional Services Sector. In Proceedings of the International Conference on Industrial Engineering and Operations Management, Dubai, UAE, 4–6 April 2024. [Google Scholar]
- Wang, D.S. Association between technological innovation and firm performance in small and medium-sized enterprises: The moderating effect of environmental factors. International Journal of Innovation Science 2019, 11, 227–240. [Google Scholar] [CrossRef]
- Ahmed, S.; Kumar, P. Dimensions of Innovation and Their Effects on the Performance of Small and Medium Enterprises: The Moderating Role of Firm’s Age and Size. International Journal of Operations & Production Management 2020, 40, 254–276. [Google Scholar]
- Rao, K.; Patel, H. Lean Six Sigma in the Construction Industry: A Case Study. Construction Management and Economics 2015, 33, 522–540. [Google Scholar]
- Kumar, P.; Shah, M. A New Framework to Support Lean Six Sigma Deployment in SMEs. International Journal of Lean Six Sigma 2019, 10, 876–900. [Google Scholar]
- Gupta, S.; Patel, R. Investigating the Readiness of People in Manufacturing SMEs to Embark on Lean Six Sigma Projects. International Journal of Operations & Production Management 2016, 36, 124–141. [Google Scholar]
- Sharma, M.; Kumar, V. Using Lean Six Sigma in Small and Medium-Sized Enterprises for Low-Cost/High-Effect Improvement Initiatives: A Case Study. International Journal of Quality & Reliability Management 2022, 39, 1163–1182. [Google Scholar]
- Singh, P.; Patel, H. Improvement of Cement Bag Production Processes Through Lean Six Sigma: Reducing Waste and Enhancing Efficiency. International Journal of Industrial Engineering 2024, 30, 47–66. [Google Scholar]
- Rathi, V.; Kumar, P. Critical Success Factors of Lean Six Sigma and Its Relation on Operational Performance of SMEs Manufacturing Companies: A Survey Result. International Journal of Supply Chain Management 2019, 8, 891–905. [Google Scholar]
- Verma, K.; Sharma, P. A Conceptual Examination of Lean, Six Sigma and Lean Six Sigma Models for Managing Waste in Manufacturing SMEs. World Journal of Science, Technology and Sustainable Development 2020, 17, 36–47. [Google Scholar]
- Ali, M.; Gupta, P. Reducing the Scrap Rate in an Electronic Manufacturing SME Through Lean Six Sigma Methodology. International Journal of Lean Six Sigma 2016, 7, 459–476. [Google Scholar]
- Choudhary, S.; Sharma, V. Quality Improvement in Plastic Injection Molding Industry: Applying Lean Six Sigma to SME in Kuwait. In Proceedings of the International Conference on Industrial Engineering and Operations Management, Kuwait, 21–23 November 2018. [Google Scholar]
- Patel, V.; Shah, N. Application of Lean Six Sigma to a Small Enterprise in the Gauteng Province: A Case Study. African Journal of Business Management 2022, 16, 191–202. [Google Scholar]
- Yadav, M.; Sharma, A. Implementation of Lean Six Sigma (LSS) Techniques for Tyre Manufacturing in Small and Medium-Sized Enterprises. International Journal of System Assurance Engineering and Management in press. 2023. [Google Scholar]
- Malik, Z.; Yadav, R. Developing a Lean Six Sigma Conceptual Model and Its Implementation: A Case Study. Industrial Engineering Journal 2019, 62, 543–562. [Google Scholar]
- Ramanujan, R.; Verma, P. A Study on Six-Sigma Practice and Implementation in Small and Medium Enterprises (SME). aWEshkar 2022, 21, 51–69. [Google Scholar]
- Ghaleb, A.A.; El-Sharief, M.A.; El-Sebaie, M.G. Implementation of lean six sigma (LSS) techniques in small and medium enterprises (SMEs) to enhance productivity. IOSR Journal of Mechanical and Civil Engineering 2017, 14, 14–22. [Google Scholar] [CrossRef]
- Tsiu, S.; Ngobeni, M.; Mathabela, L.; Thango, B. Applications and Competitive Advantages of Data Mining and Business Intelligence in SMEs Performance: A Systematic Review. Preprints 2024, 2024090940. [Google Scholar] [CrossRef]
- Mkhize, A.; Mokhothu, K.; Tshikhotho, M.; Thango, B. Evaluating the Impact of Cloud Computing on SMEs Performance: A Systematic Review. Preprints 2024, 2024090882. [Google Scholar] [CrossRef]
- Kgakatsi, M.; Galeboe, O.; Molelekwa, K.; Thango, B. The Impact of Big Data on SME Performance: A Systematic Review. Preprints 2024, 2024090985. [Google Scholar] [CrossRef]
- Molete, O.B.; Mokhele, S.E.; Ntombela, S.D.; Thango, B.A. The Impact of IT Strategic Planning Process on SME Performance: A Systematic Review. Preprints 2024, 2024091024. [Google Scholar] [CrossRef]
- Mothapo, M.; Thango, B.; Matshaka, L. Tracking and Measuring Social Media Activity: Key Metrics for SME Strategic Success – A Systematic Review. Preprints 2024, 2024091757. [Google Scholar] [CrossRef]
- Ngcobo, K.; Bhengu, S.; Mudau, A.; Thango, B.; Matshaka, L. Enterprise Data Management: Types, Sources, and Real-Time Applications to Enhance Business Performance - A Systematic Review. Preprints 2024, 2024091913. [Google Scholar] [CrossRef]
- Mohlala, T.T.; Mehlwana, L.L.; Nekhavhambe, U.P.; Thango, B.; Matshaka, L. Strategic Innovation in HRIS and AI for Enhancing Workforce Productivity in SMEs: A Systematic Review. Preprints 2024, 2024091996. [Google Scholar] [CrossRef]
- Chabalala, K.; Boyana, S.; Kolisi, L.; Thango, B.A.; Matshaka, L. Digital Technologies and Channels for Competitive Advantage in SMEs: A Systematic Review. Preprints 2024, 2024100020. [Google Scholar] [CrossRef]
- Ndzabukelwako, Z.; Mereko, O.; Sambo, T.V.; Thango, B. The Impact of Porter’s Five Forces Model on SMEs Performance: A Systematic Review. Preprints 2024, 2024100119. [Google Scholar] [CrossRef]
- Maswanganyi, N.G.; Fumani, N.M.; Khoza, J.K.; Thango, B.A.; Matshaka, L. Evaluating the Impact of Database and Data Warehouse Technologies on Organizational Performance: A Systematic Review. Preprints 2024, 2024100059. [Google Scholar] [CrossRef]
- Gumede, T.T.; Chiworeka, J.M.; Magoda, A.S.; Thango, B. Building Effective Social Media Strategies for Business: A Systematic Review. Preprints 2024, 2024100379. [Google Scholar] [CrossRef]
- Myataza, A.; Mafunga, M.; Mkhulisi, N.S.; Thango, B.A. A Systematic Review of ERP, CRM, and HRM Systems for SMEs: Managerial and Employee Support. Preprints 2024, 2024100384. [Google Scholar] [CrossRef]
- Mudau, M.C.; Moshapo, L.W.; Monyela, T.M.; Thango, B.A. The Role of Manufacturing Operations in SMEs Performance: A Systematic Review. Preprints 2024, 2024100539. [Google Scholar] [CrossRef]
- Khanyi, M.; Xaba, S.; Mlotshwa, N.; Thango, B.; Matshaka, L. The Role of Data Networks and APIs in Enhancing Operational Efficiency in SME: A Systematic Review. Preprints 2024, 2024100848. [Google Scholar] [CrossRef]
- Skosana, S.; Mlambo, S.; Madiope, T.; Thango, B. Evaluating Wireless Network Technologies (3G, 4G, 5G) and Their Infrastructure: A Systematic Review. Preprints 2024, 2024101331. [Google Scholar] [CrossRef]
- Mtjilibe, T.; Rameetse, E.; Mgwenya, N.; Thango, B. Exploring the Challenges and Opportunities of Social Media for Organizational Engagement in SMEs: A Comprehensive Systematic Review. Preprints 2024, 2024101438. [Google Scholar] [CrossRef]
- Nethanani, R.; Matlombe, L.; Vuko, S.; Thango, B. Customer Relationship Management (CRM) Systems and their Impact on SMEs Performance: A Systematic Review. Preprints 2024, 2024101538. [Google Scholar] [CrossRef]
- Muraba, J.; Mamogobo, M.; Thango, B. The Balanced Scorecard Methodology: Performance Metrics and Strategy Execution in SMEs: A Systematic Review. Preprints 2024, 2024101598. [Google Scholar] [CrossRef]
- Mankge, F.; Pogiso, K.; Ndaba, Z.; Thango, B. A Systematic Review of Success Factors and Failure Reasons in Enterprise Systems for Executive, Managerial, and Operational Support. Preprints 2024, 2024101670. [Google Scholar] [CrossRef]
- Lebaea, R.; Roshe, Y.; Ntontela, S.; Thango, B.A. The Role of Data Governance in Ensuring System Success and Long-Term IT Performance: A Systematic Review. Preprints 2024, 2024101841. [Google Scholar] [CrossRef]
- Sechele, G.; Rabedzwa, G.; Nongayo, S.; Thango, B. Systematic Review on SEO and Digital Marketing Strategies for Enhancing Retail SMEs’ Performance. Preprints 2024, 2024101715. [Google Scholar] [CrossRef]
- Sithole, S.; Grahn, T.; Pillay, D.; Thango, B. Aligning IT and Business Strategies: Achievements and Challenges – A Systematic Literature Review. Preprints 2024, 2024102056. [Google Scholar] [CrossRef]
- Sivhada, U.; Zulu, P.; Sambo, H.; Thango, B. Performance Improvements from Virtual Collaboration and Communication Technologies in SMEs: A Systematic Review. Preprints 2024, 2024101971. [Google Scholar] [CrossRef]
Figure 1.
Key principles of Lean Six Sigma.

Figure 2.
Search Strategy Overview.
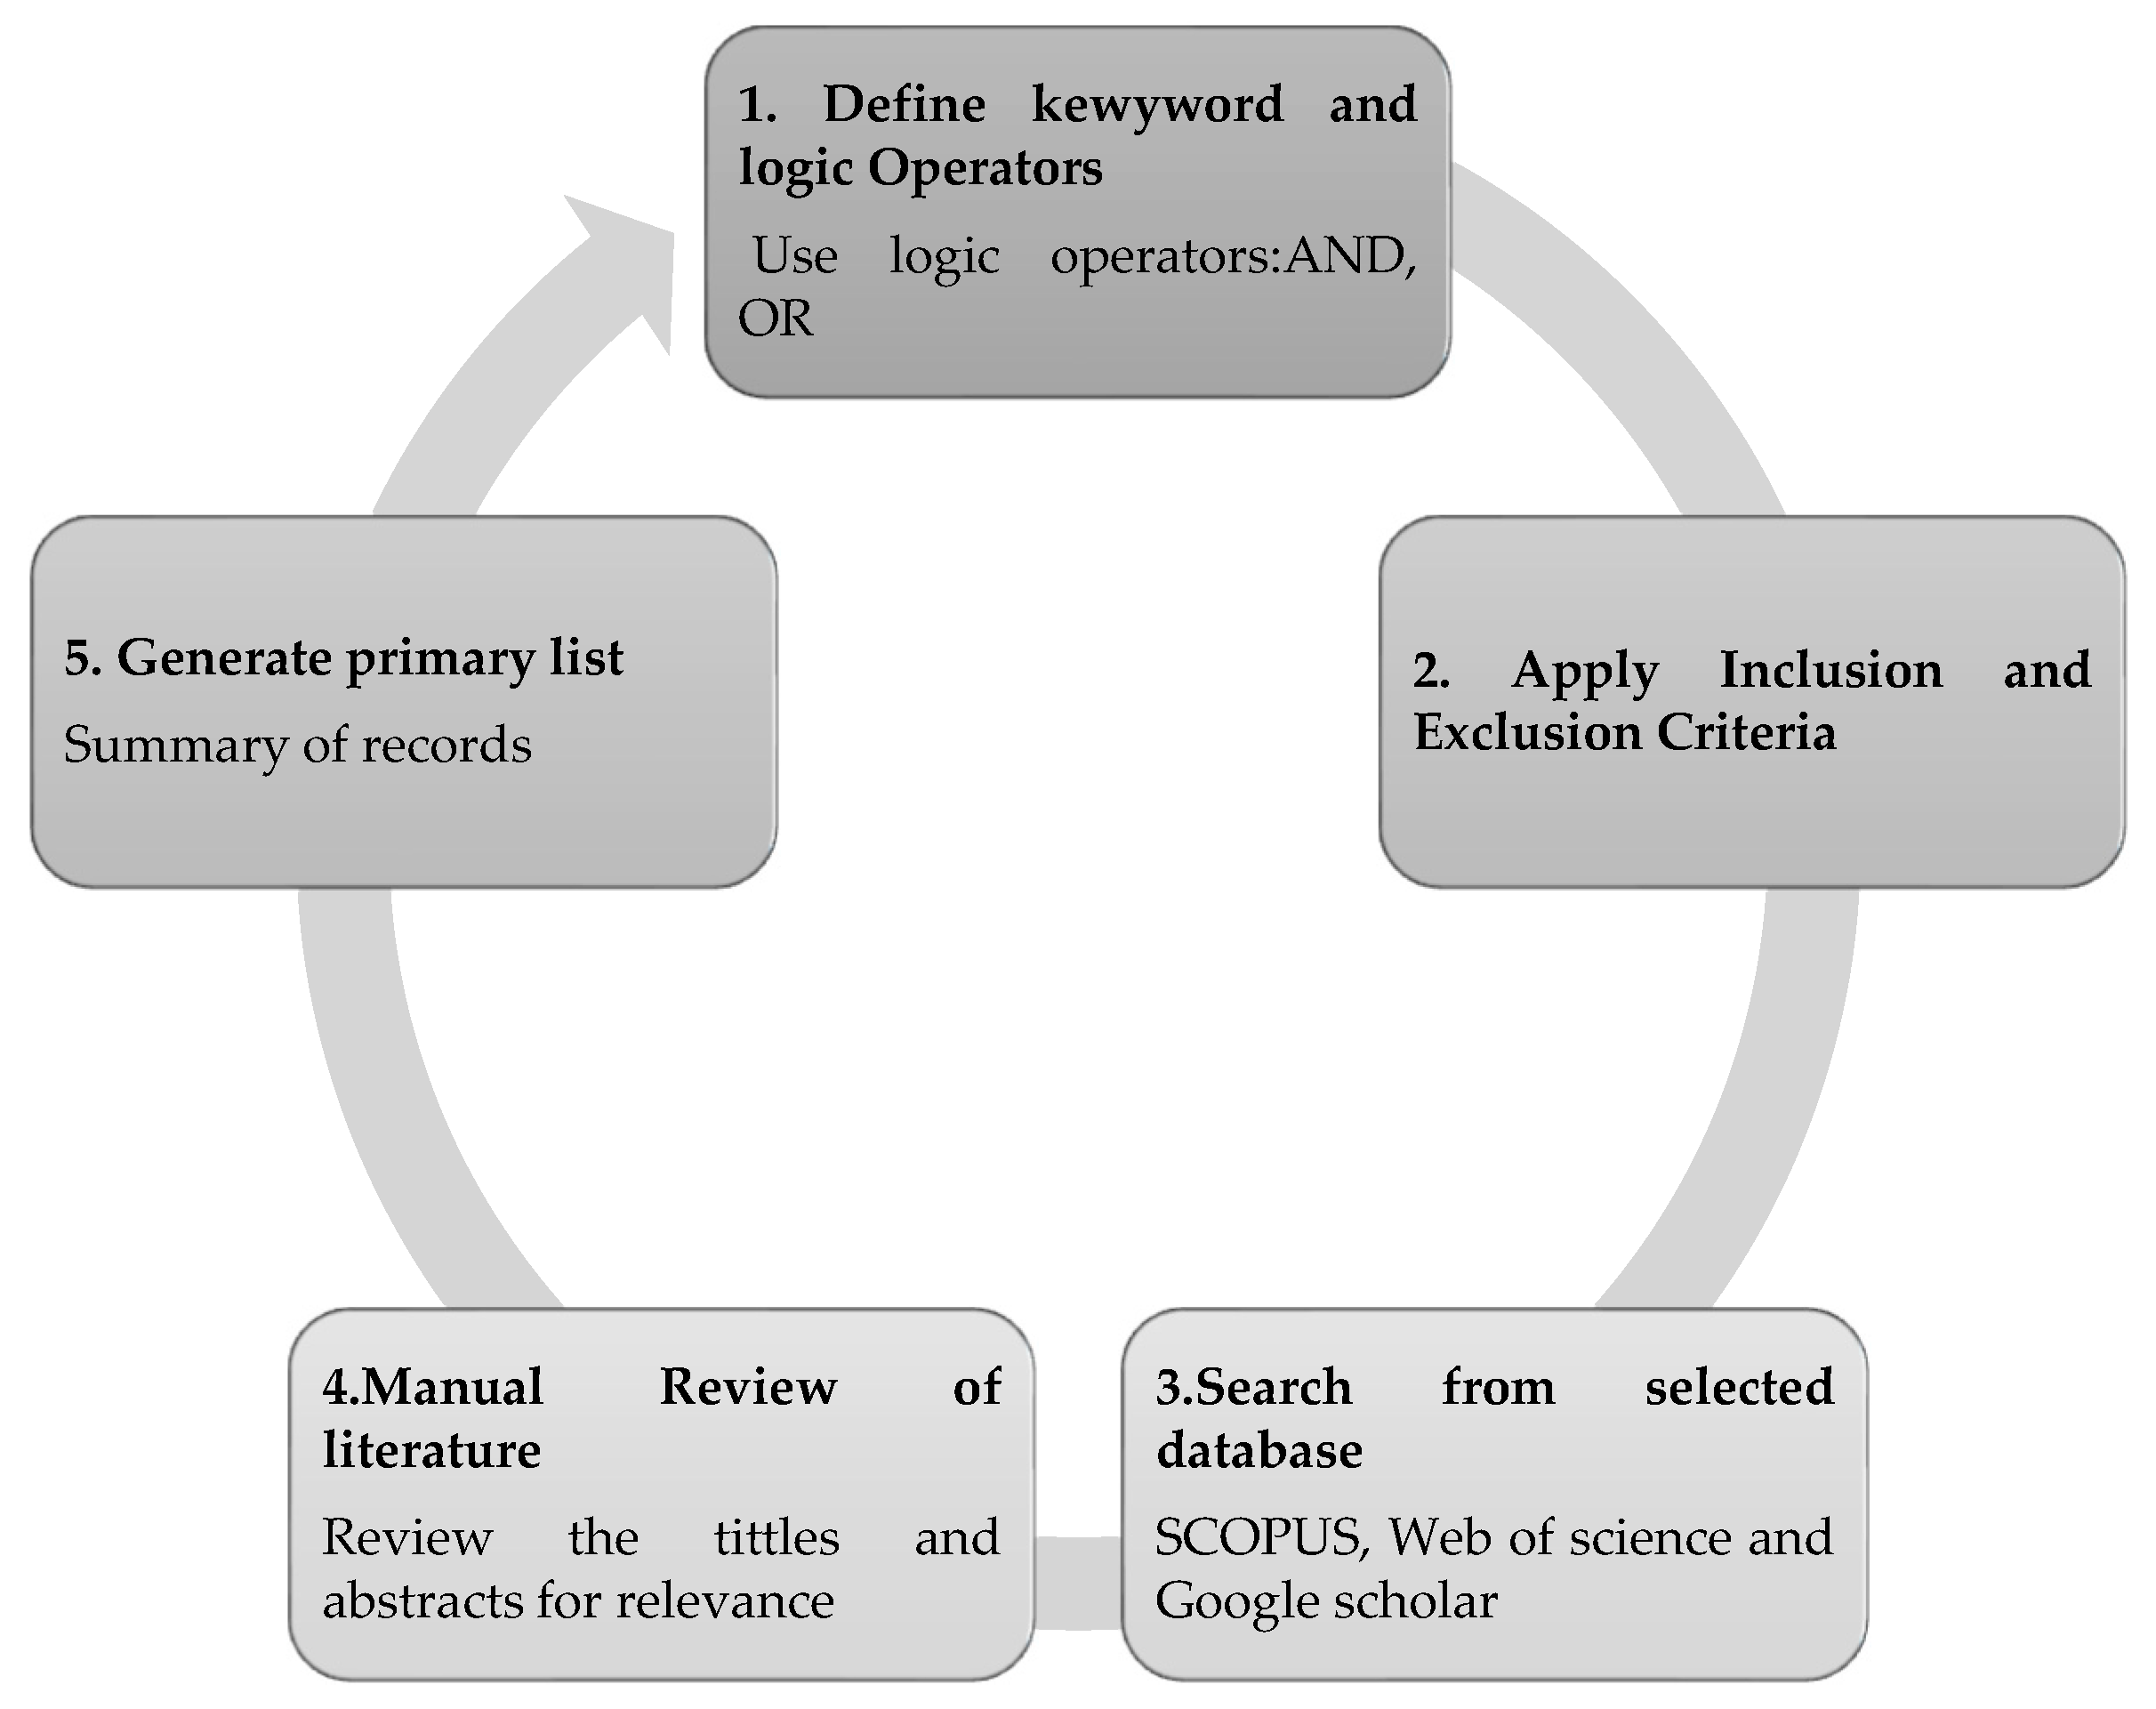
Figure 3.
A Six-Step Selection Process used to Gather Relevant Studies.
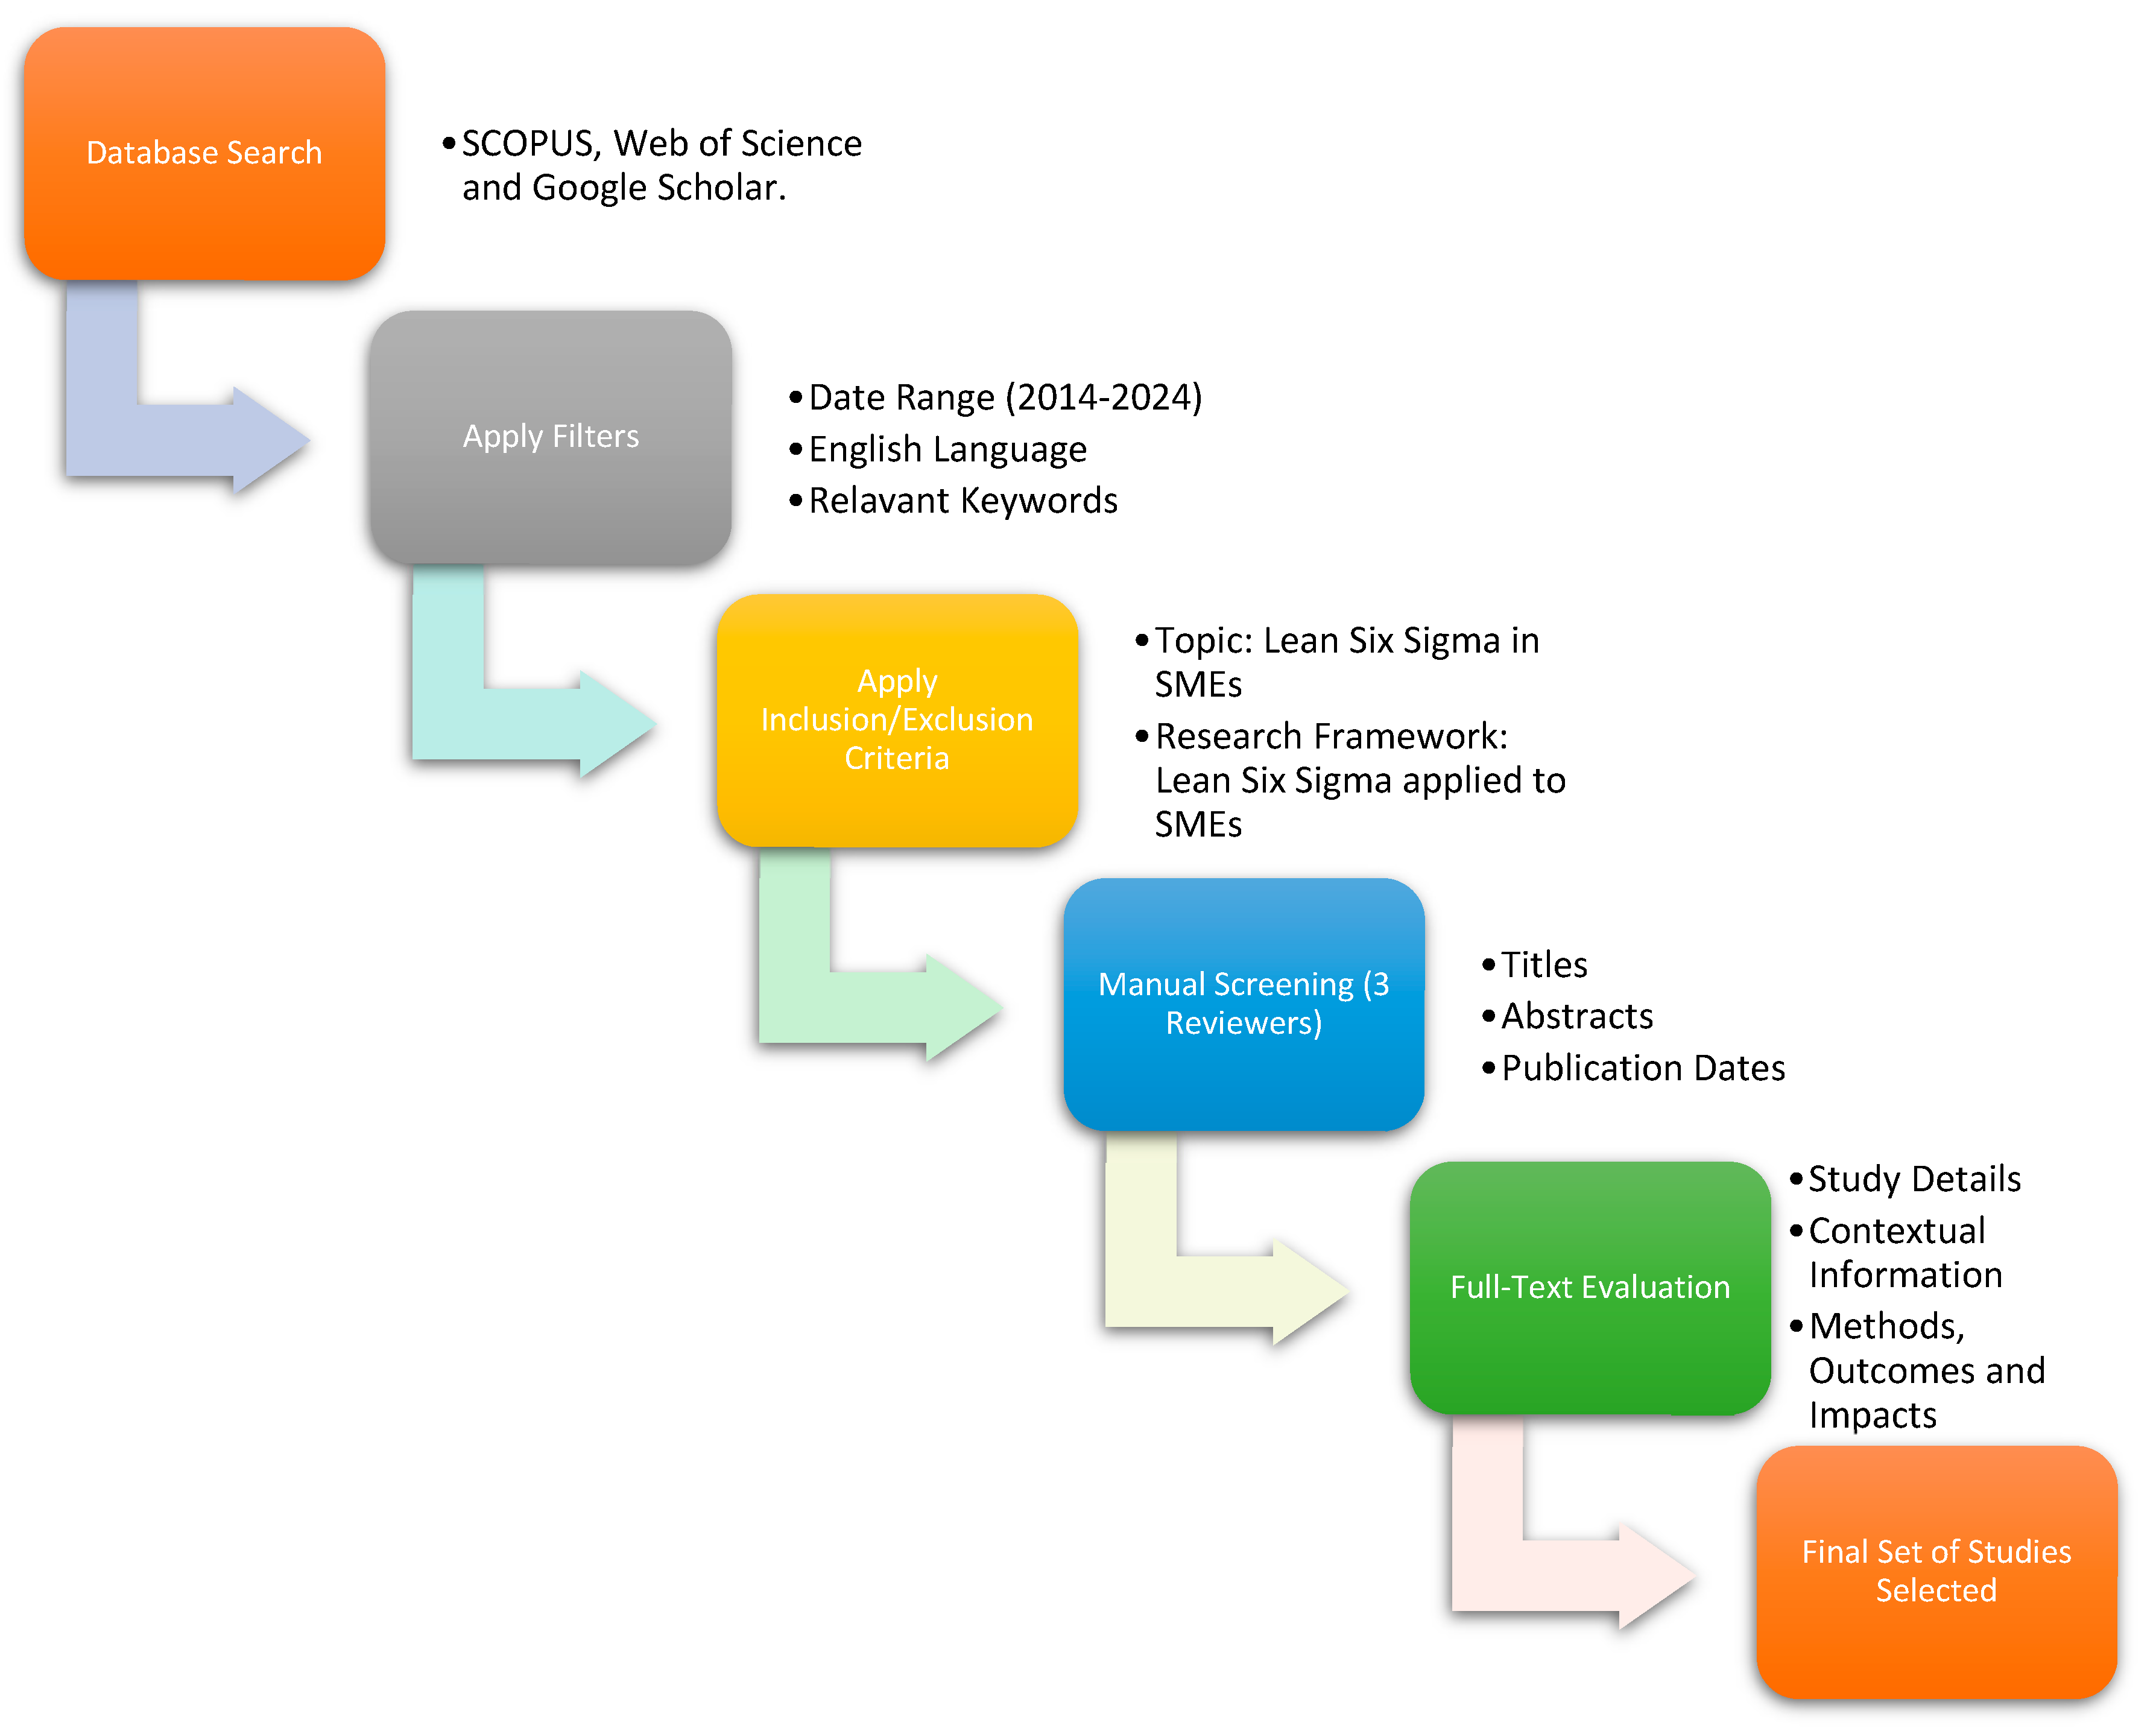
Figure 4.
Workflow of Data Selection and Extraction.

Figure 5.
Study Risk of Bias Assessment.
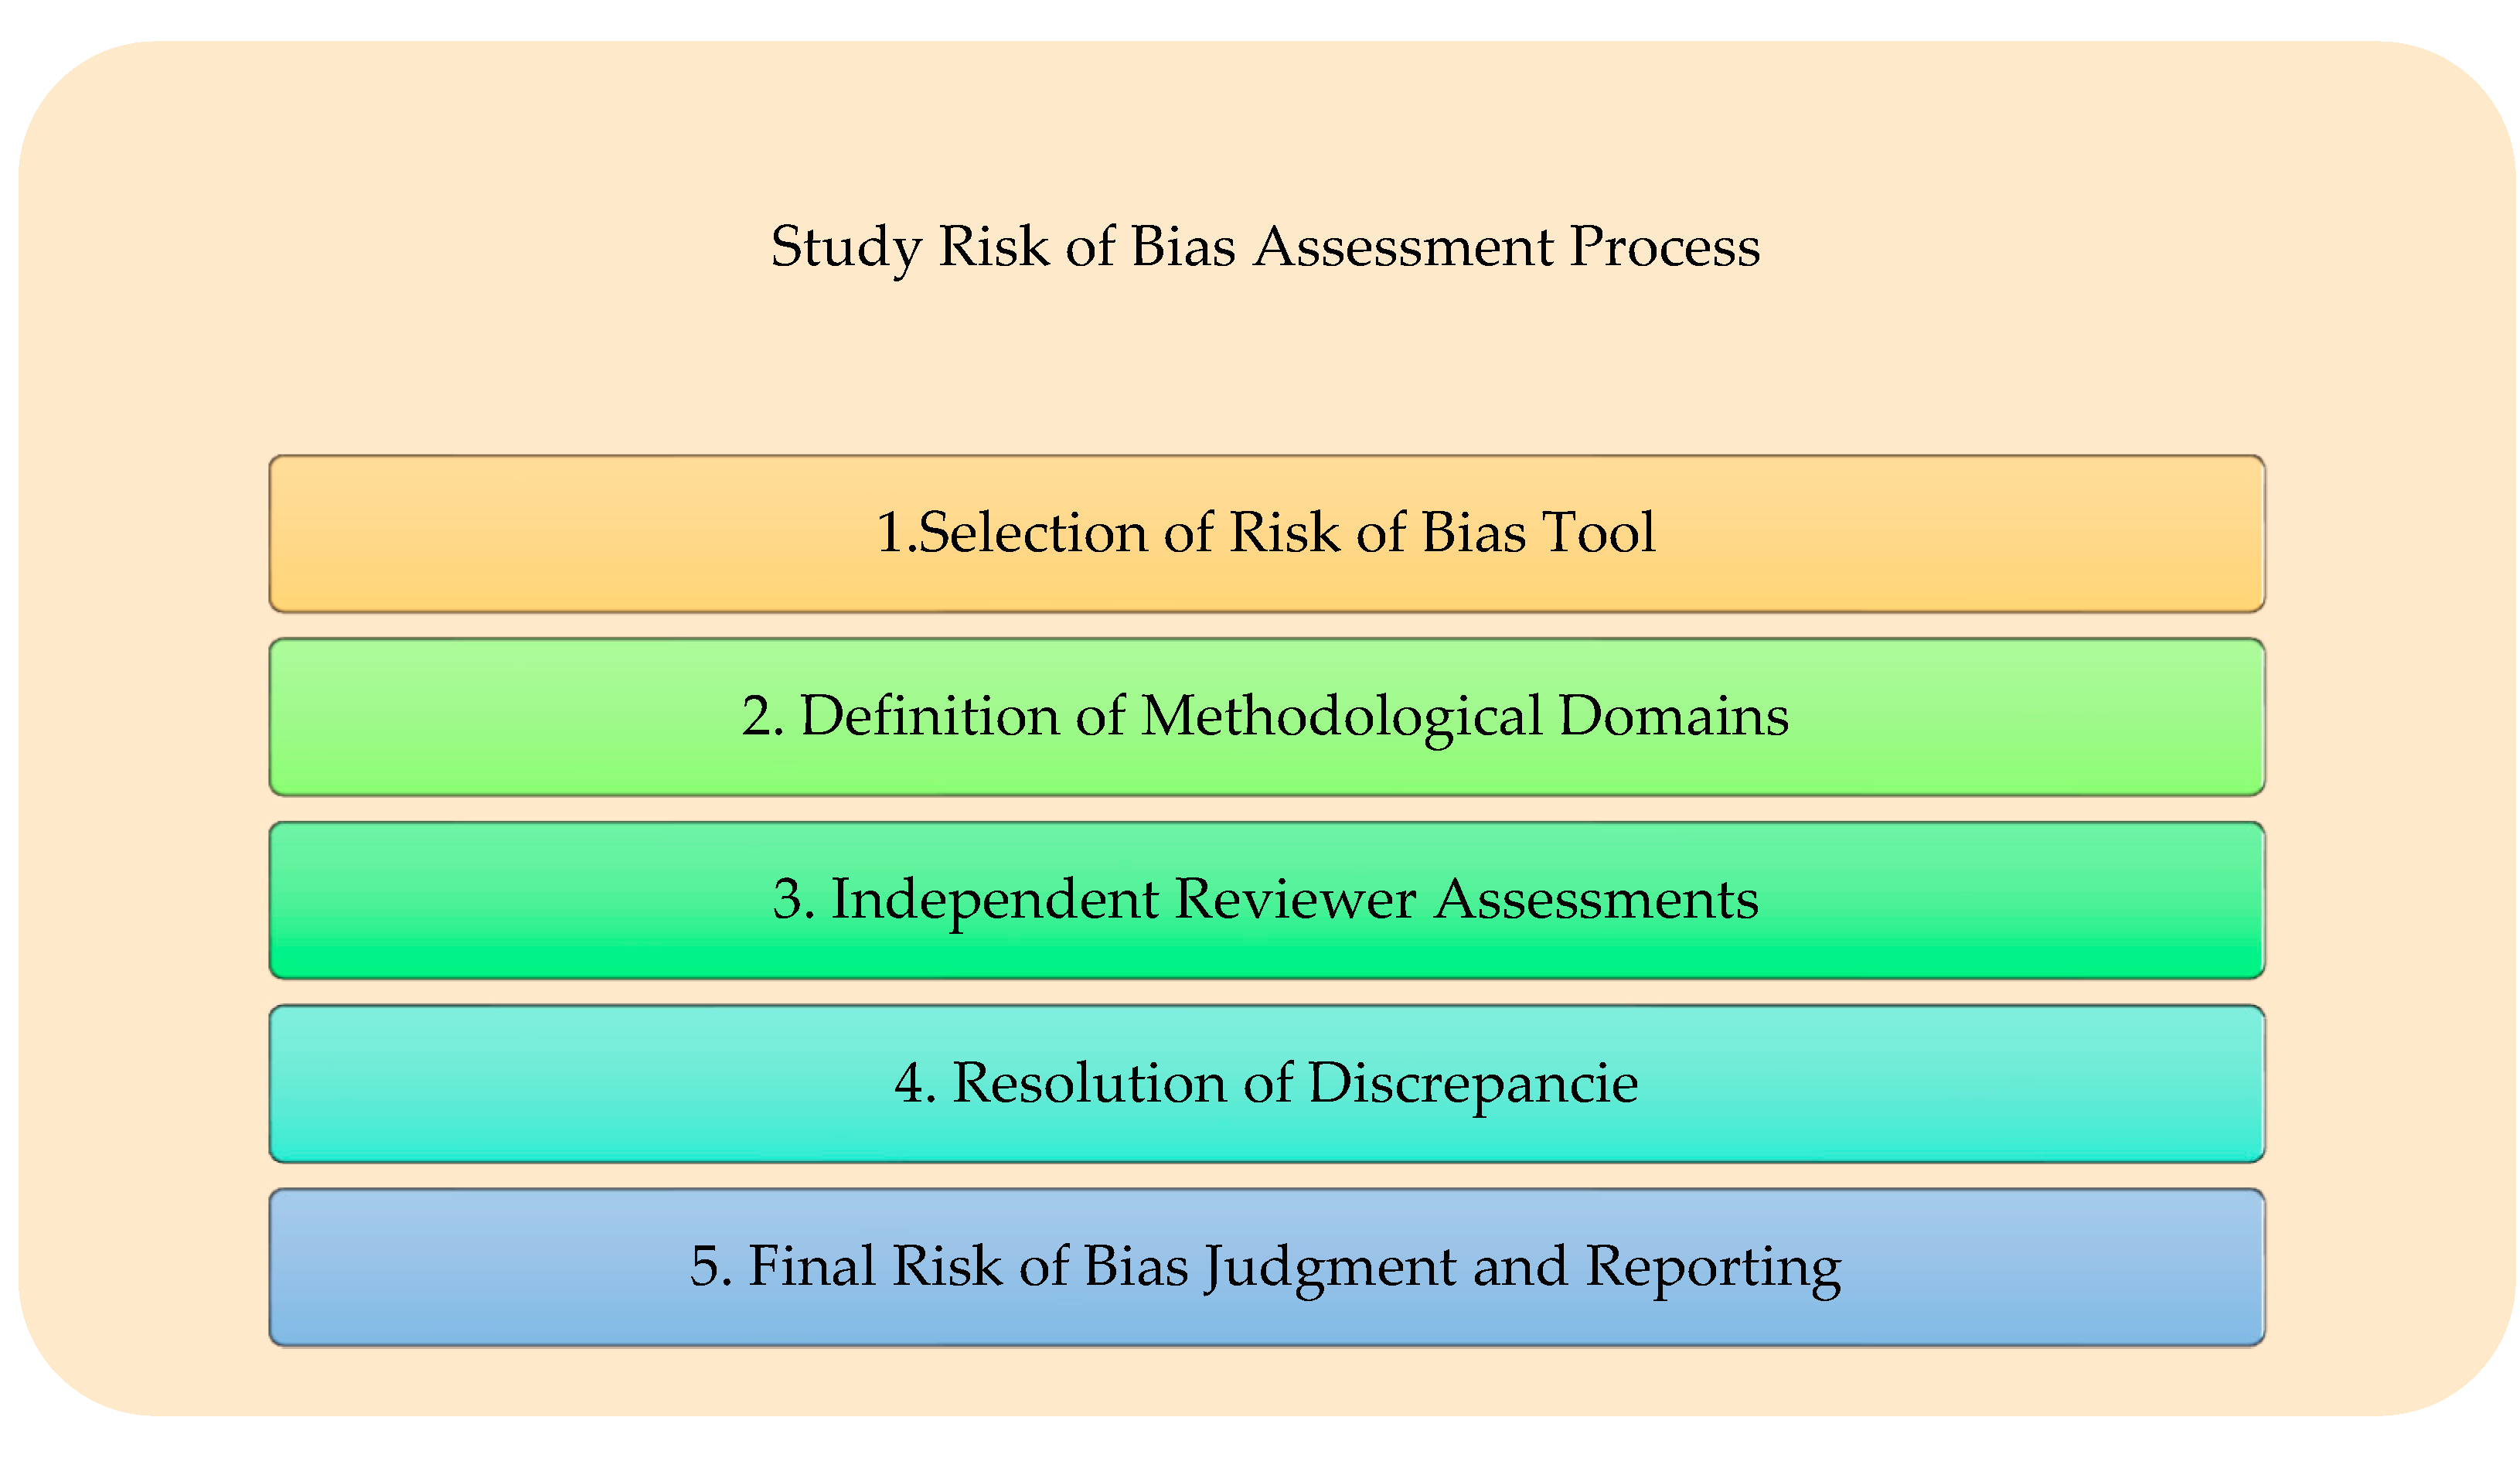
Figure 6.
Effect Measures Methodology Outline.
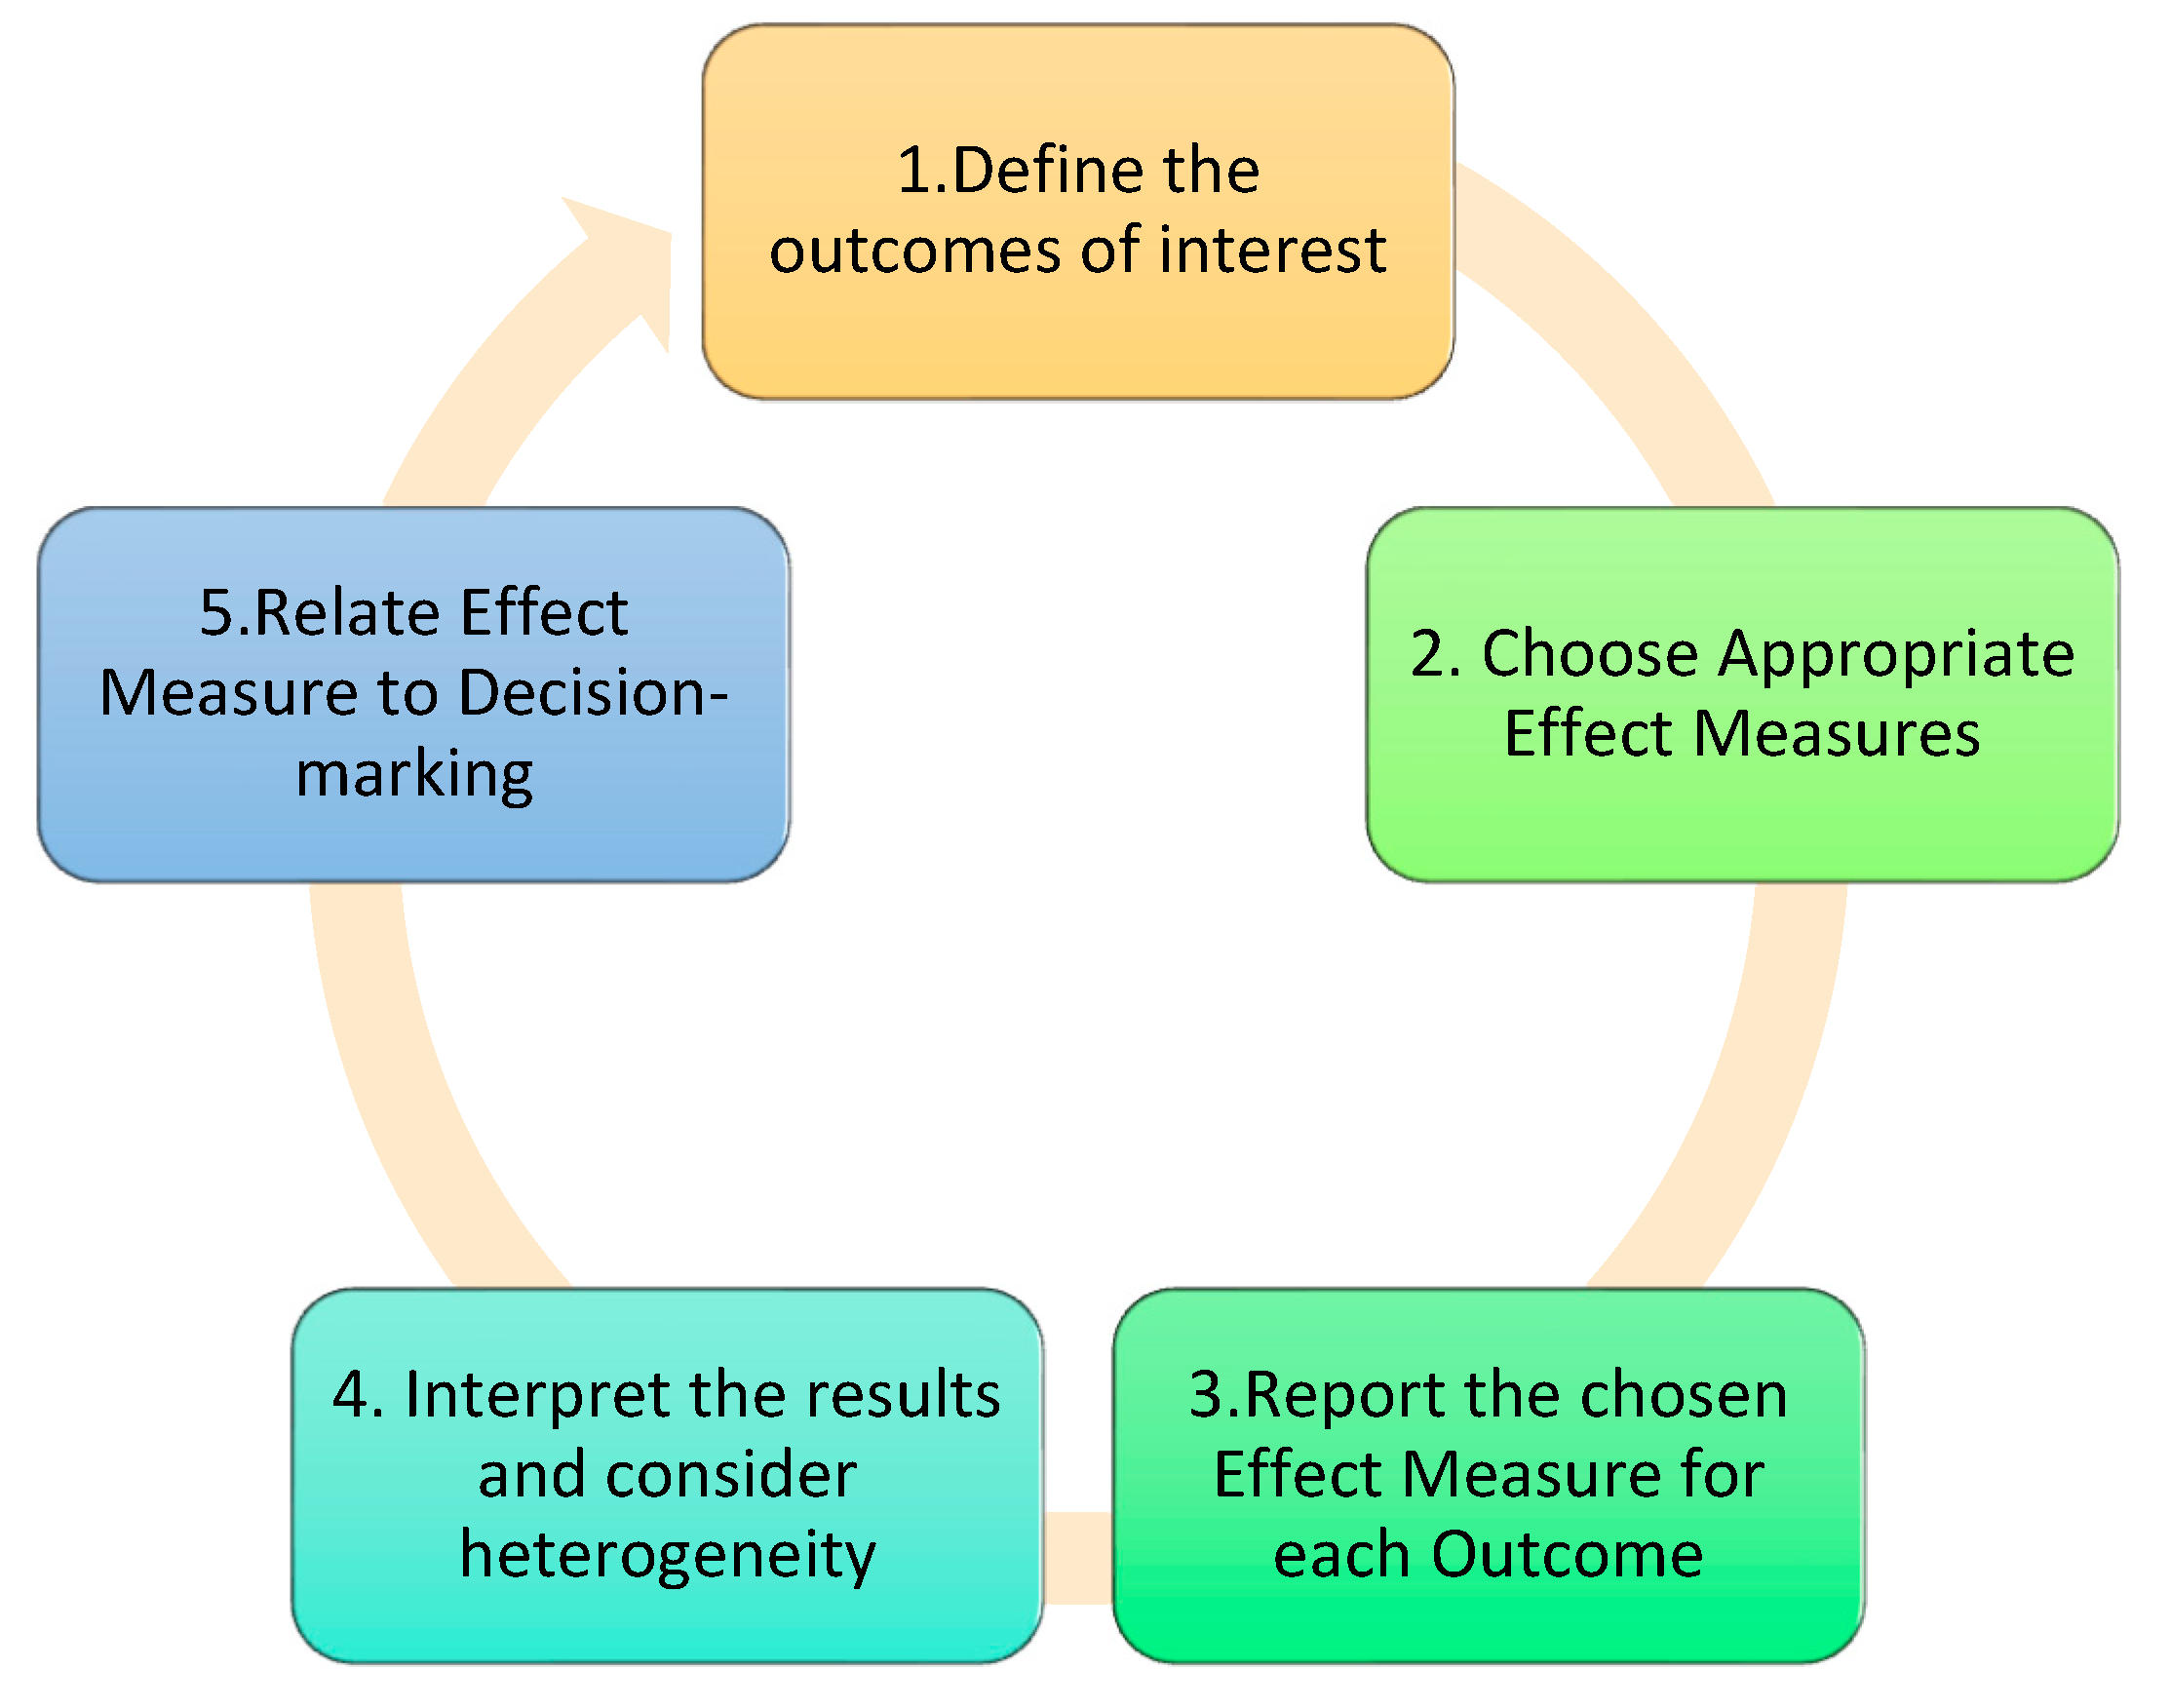
Figure 7.
Certainty of Evidence procedure.
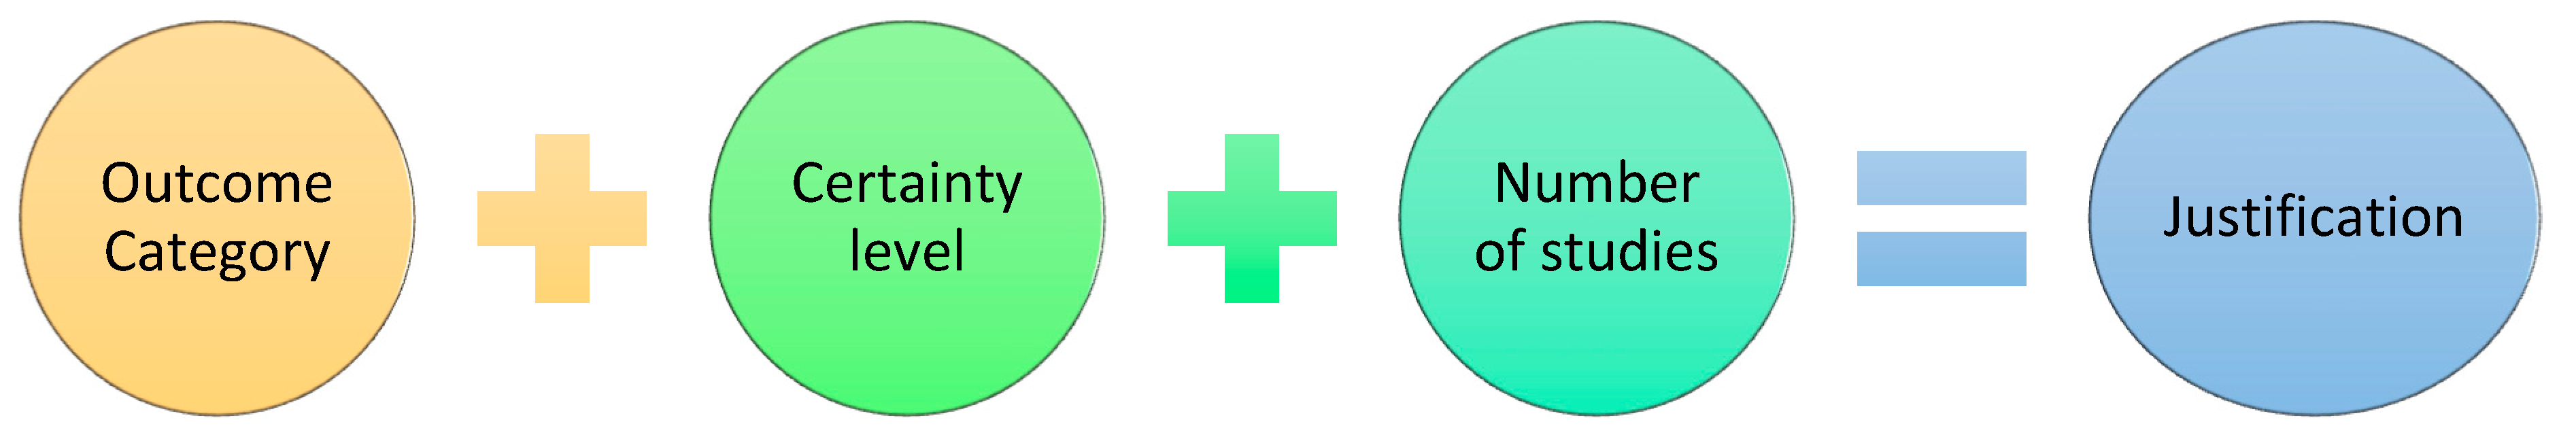
Figure 8.
Key Phases in Evaluating Systematic Review.

Figure 9.
Proposed PRISMA Flowchart.
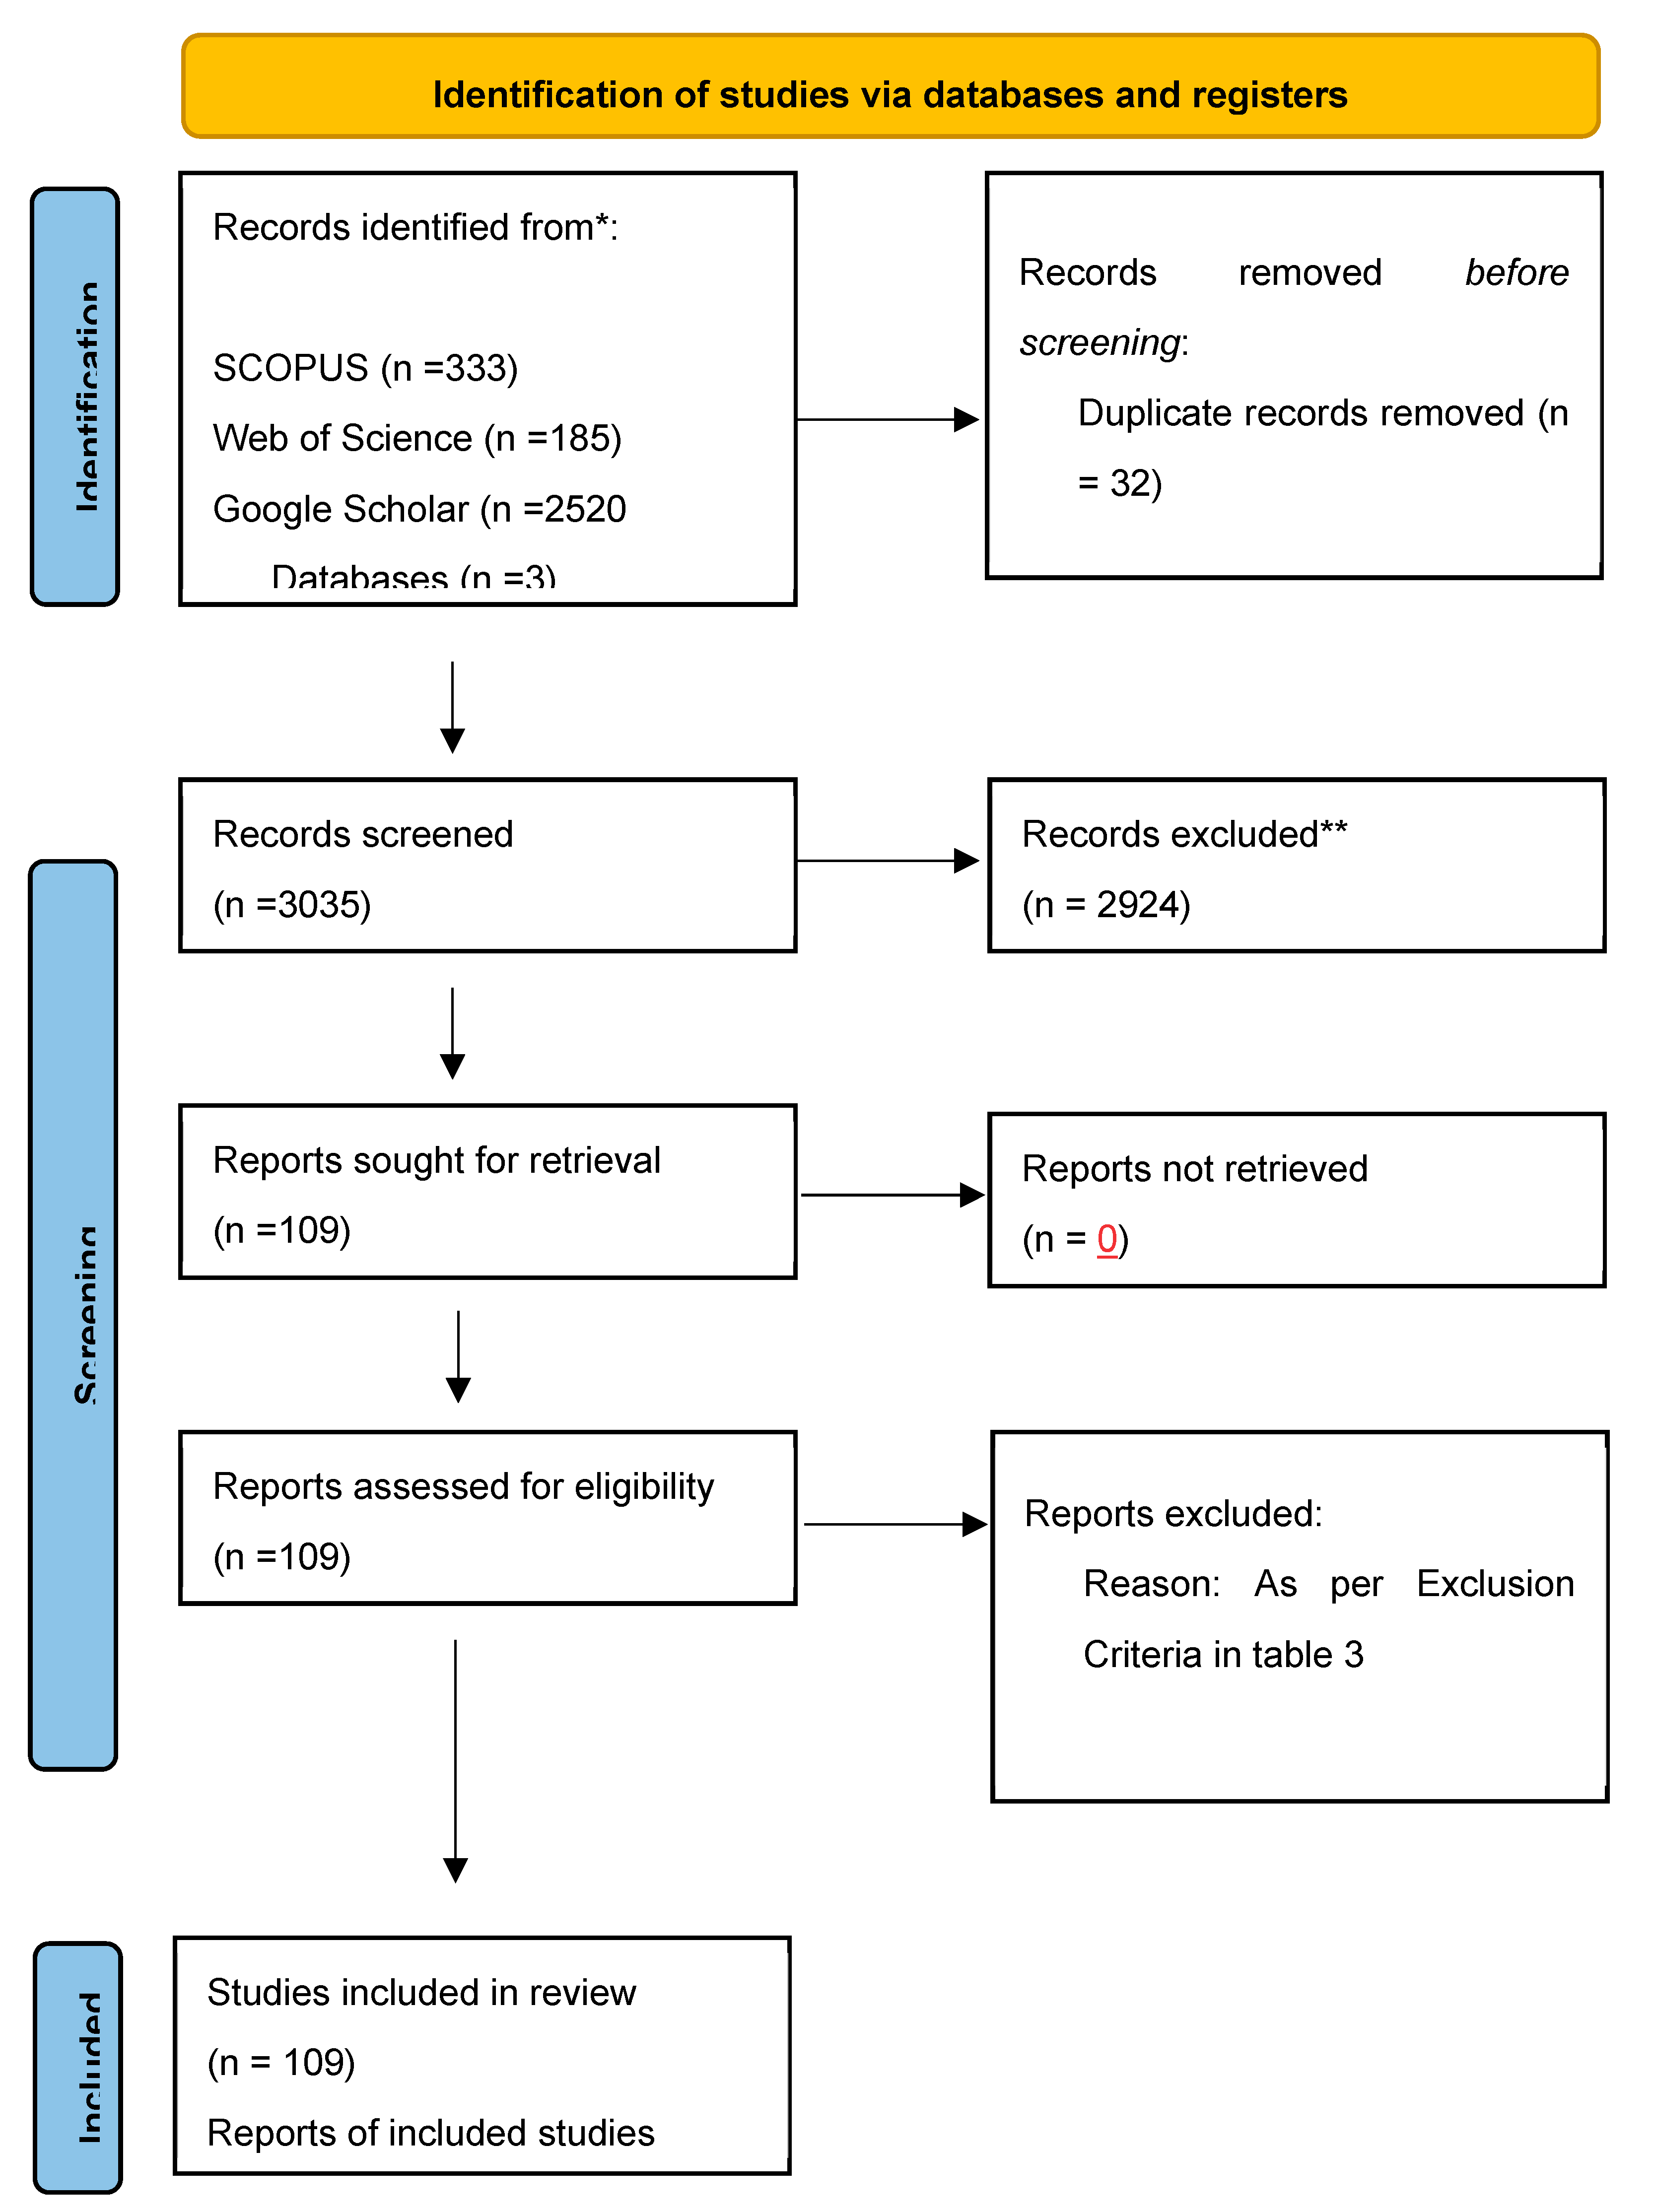
Figure 10.
Research distribution by Sources.
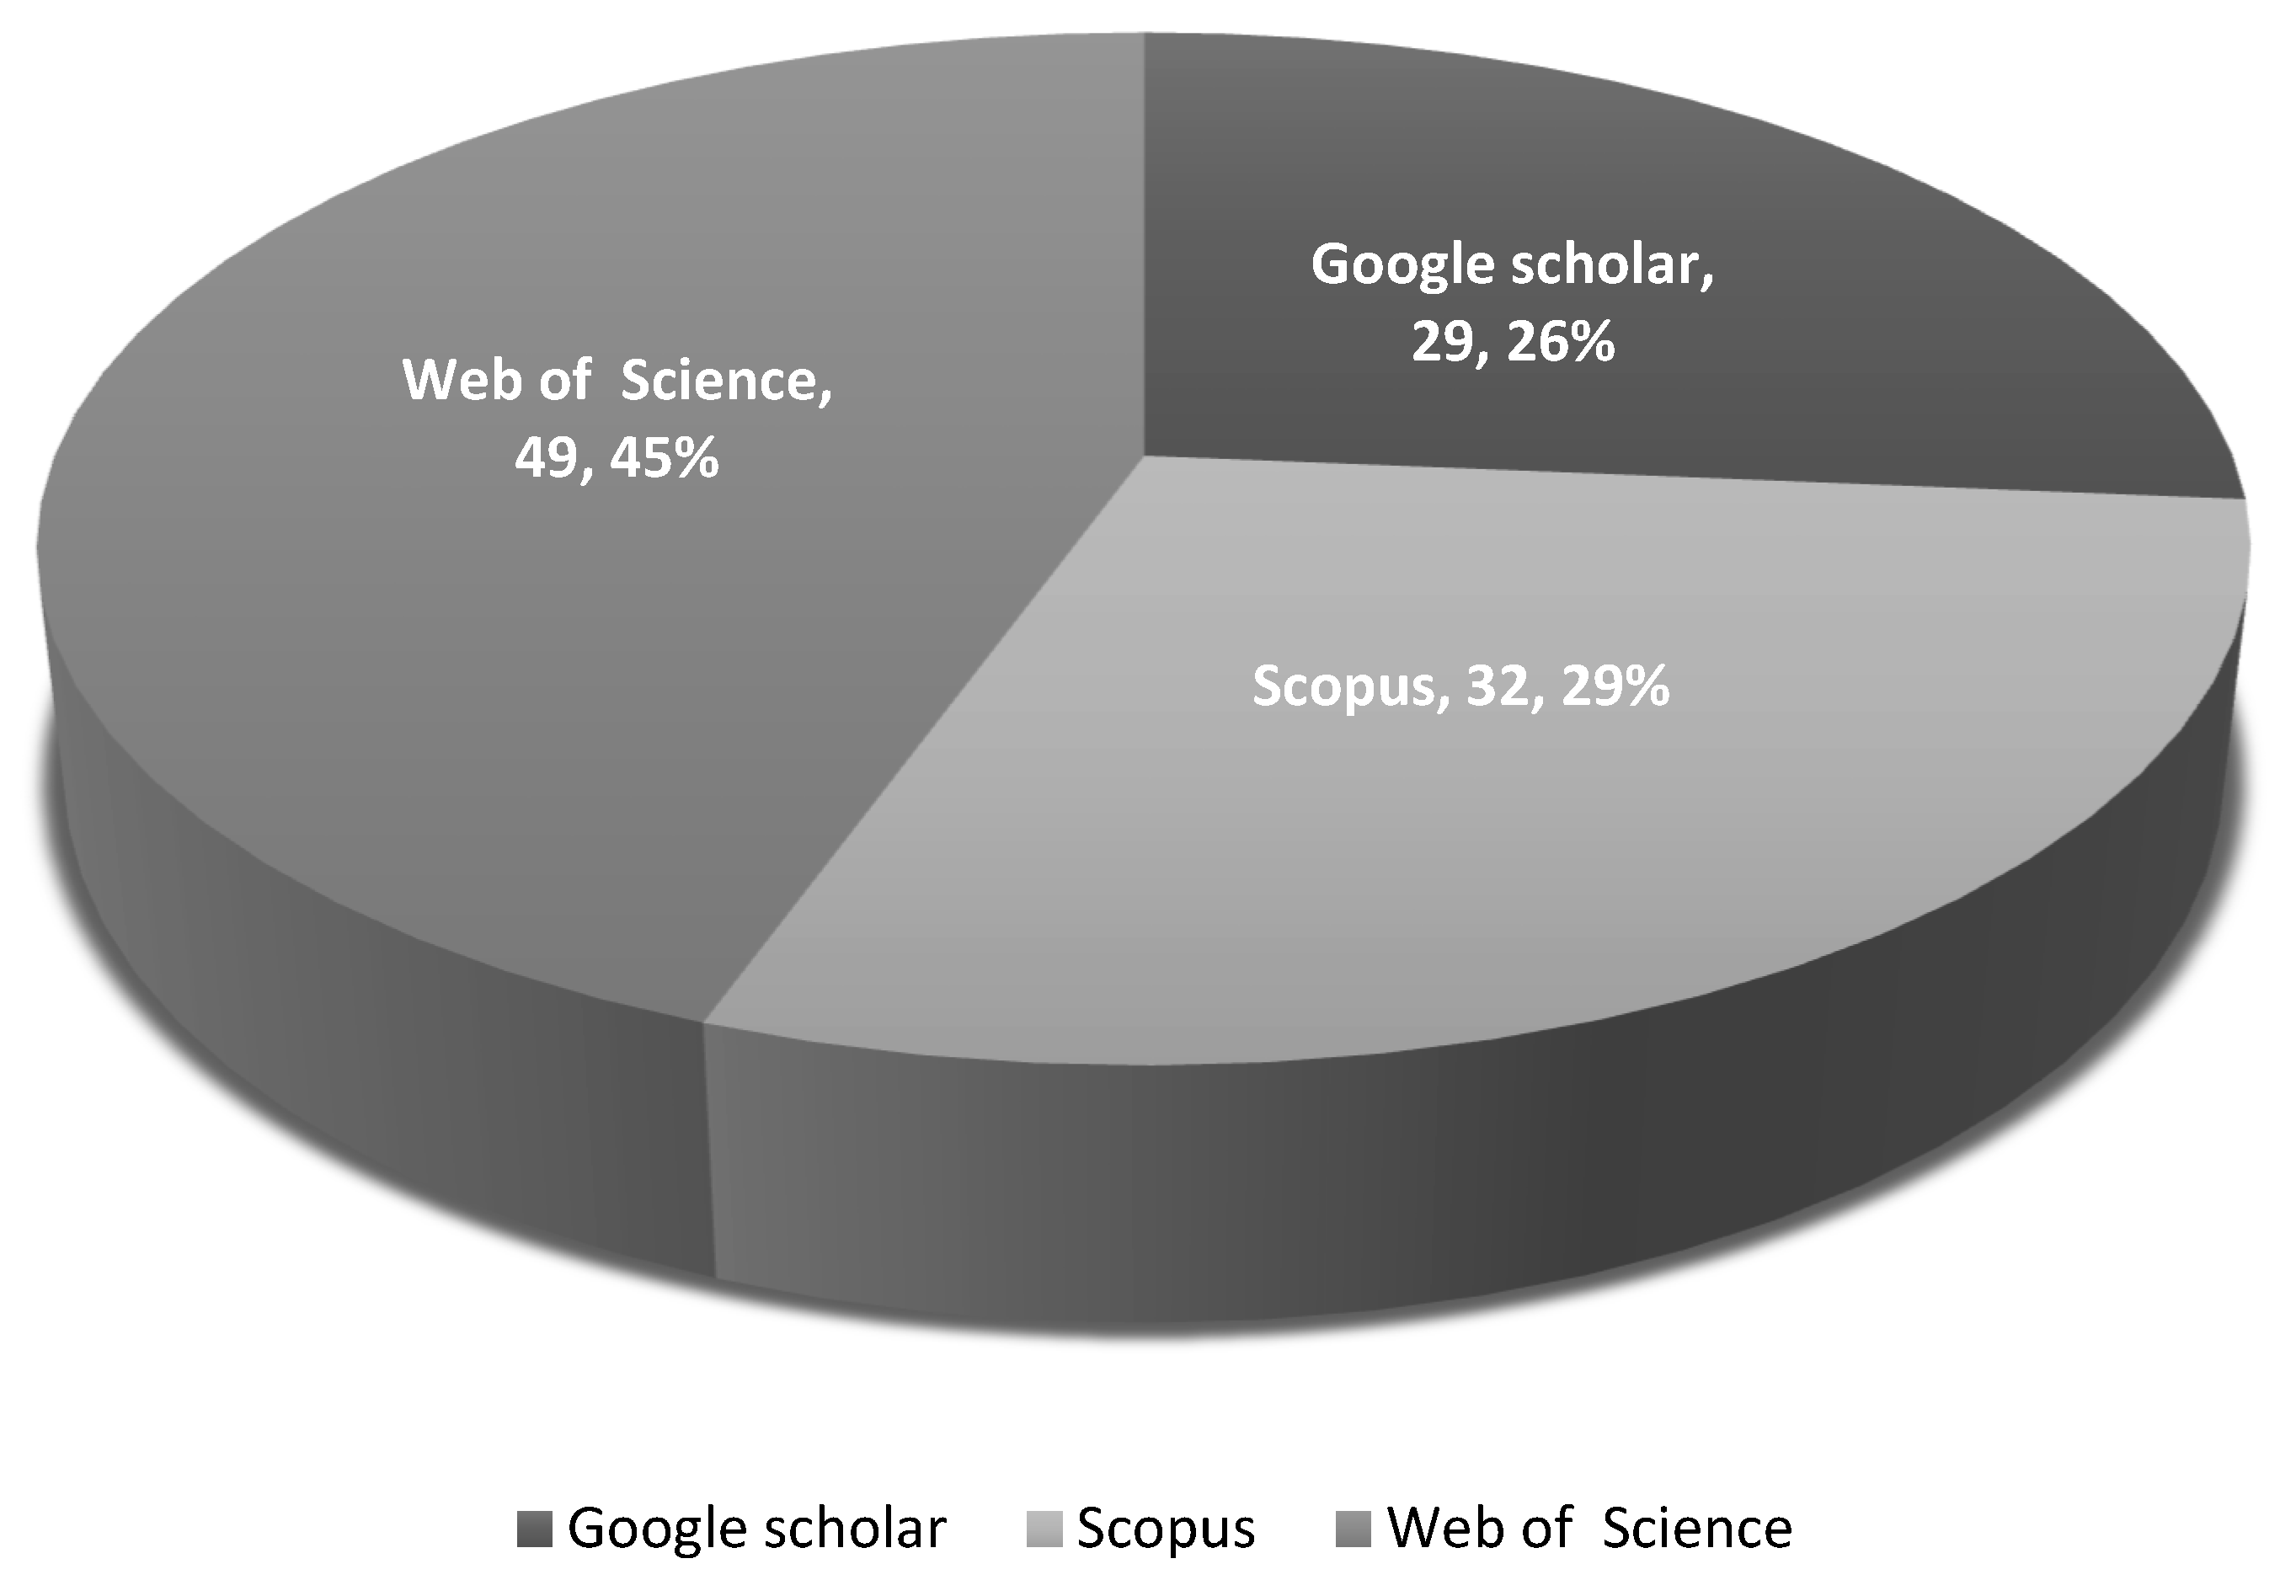
Figure 11.
Research distribution by Volume per year.
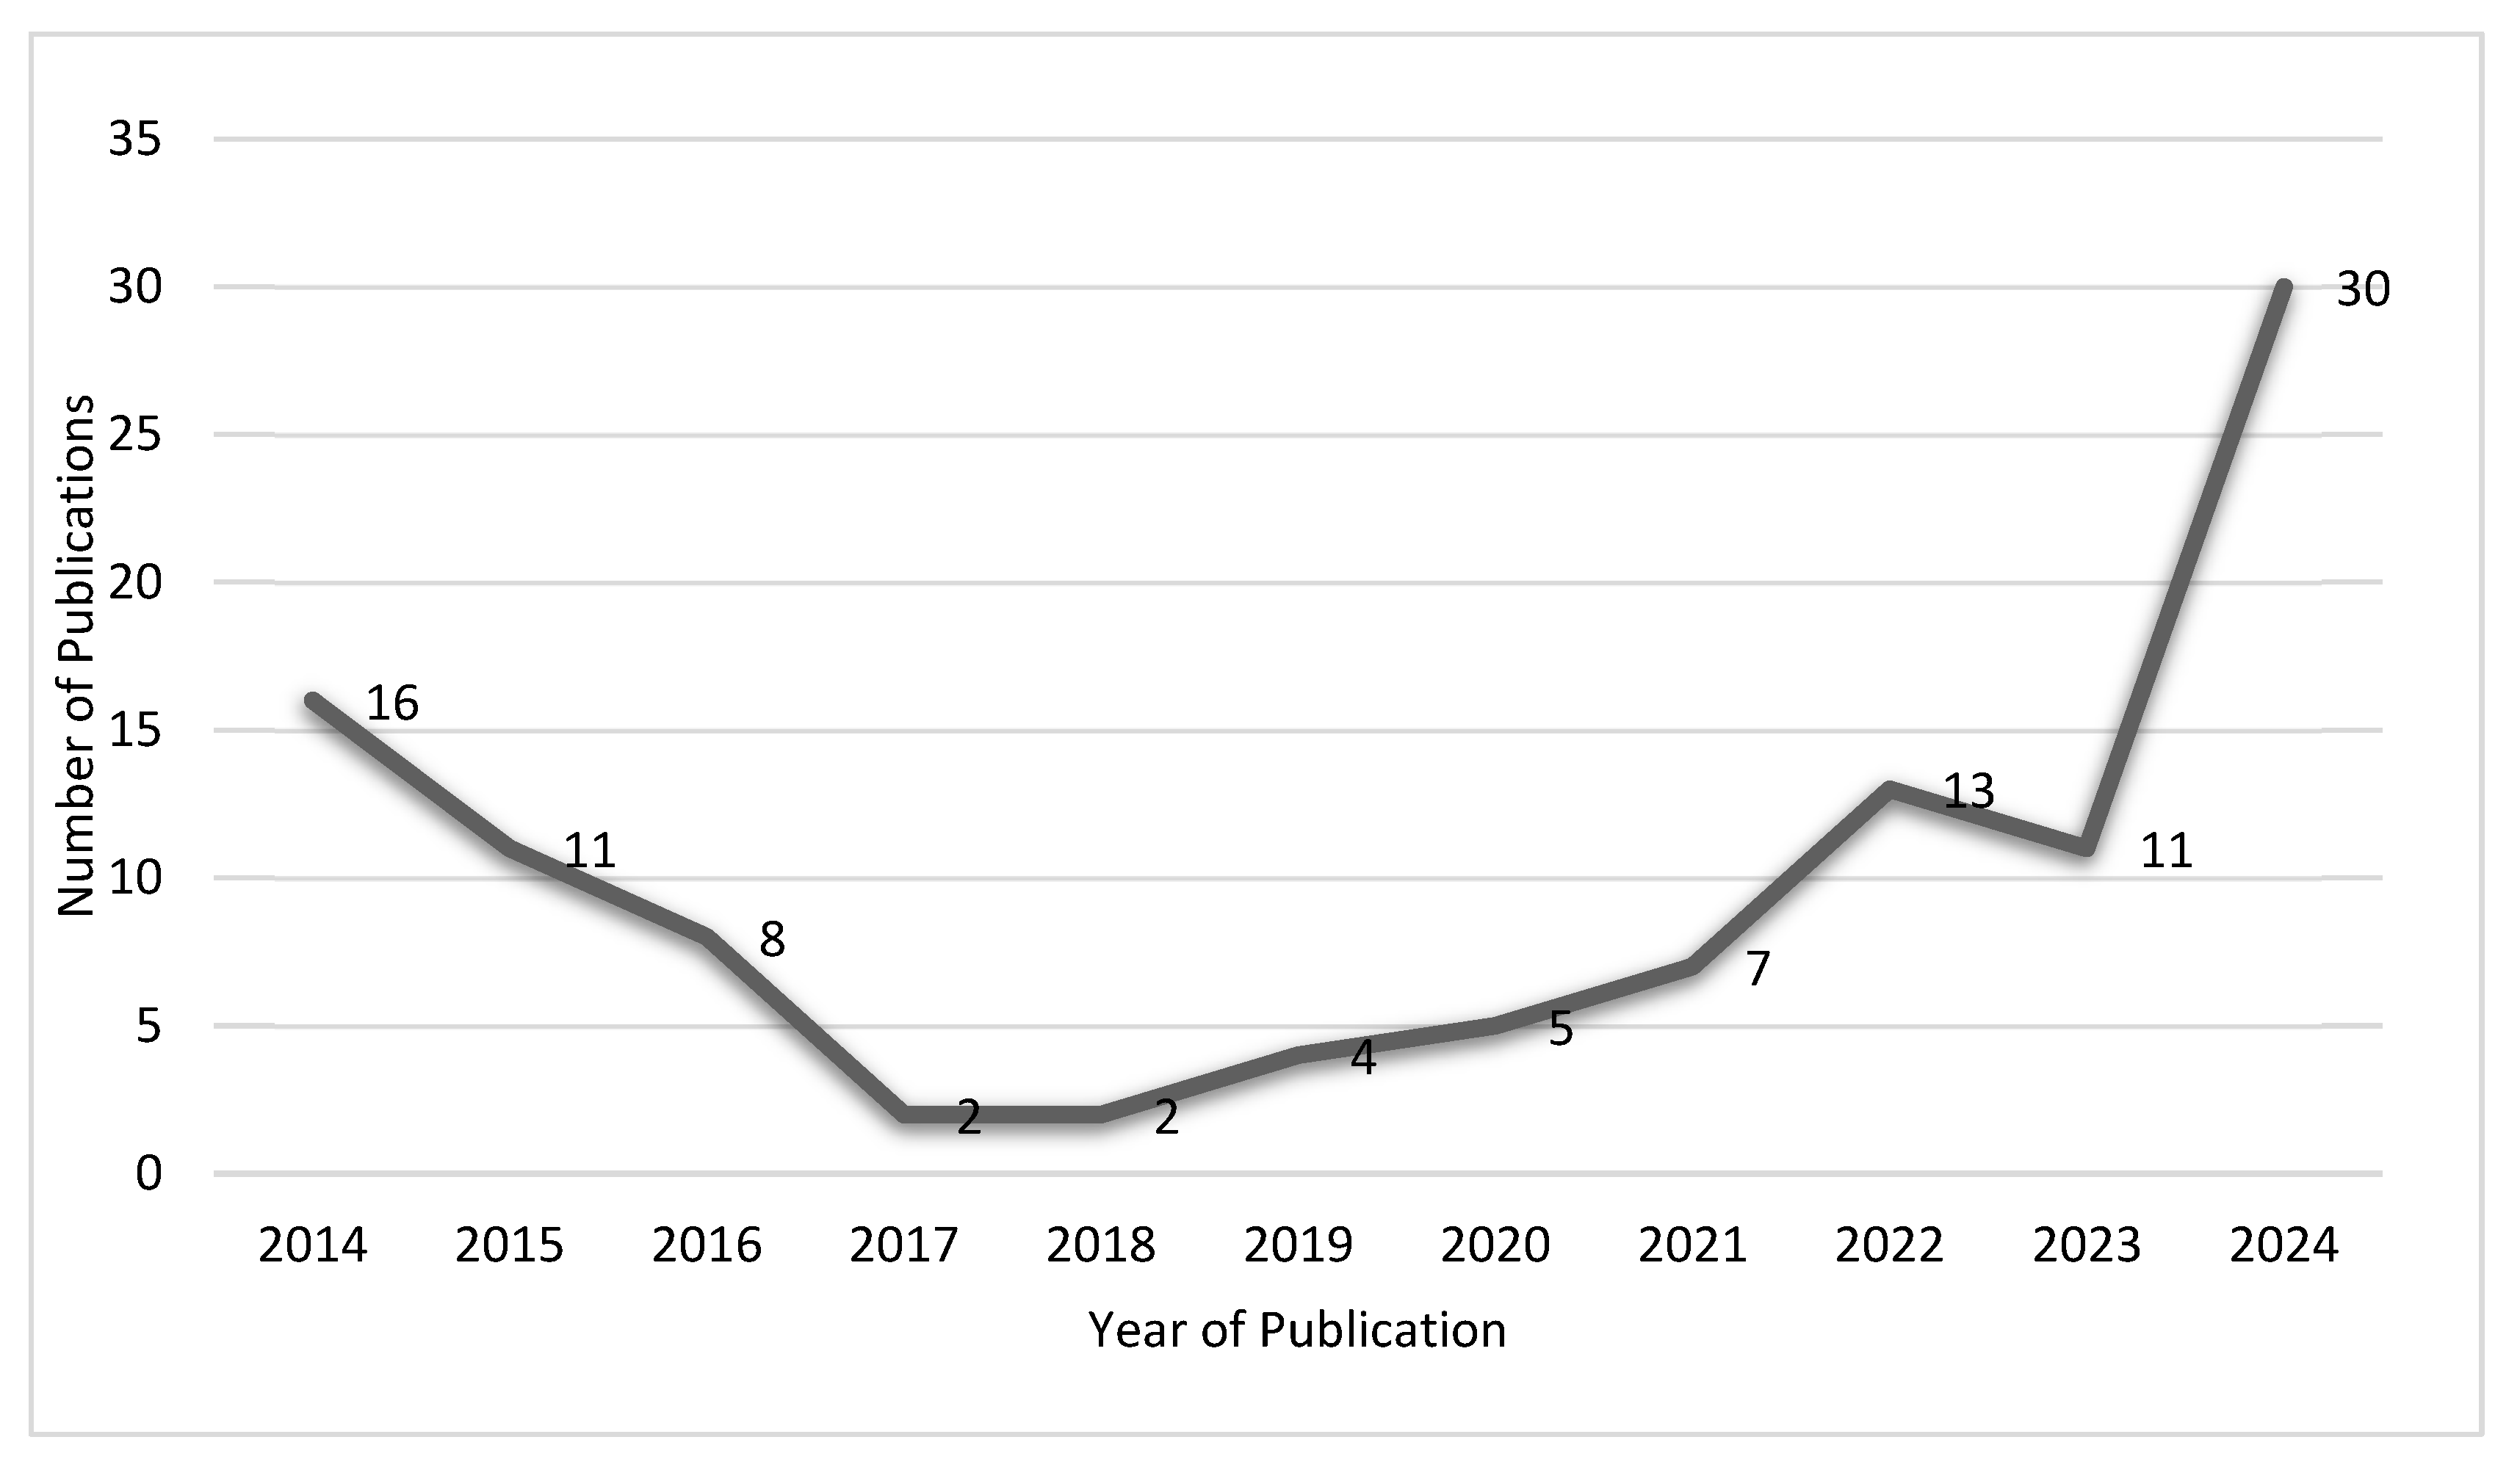
Figure 12.
Research distribution by Research Design.
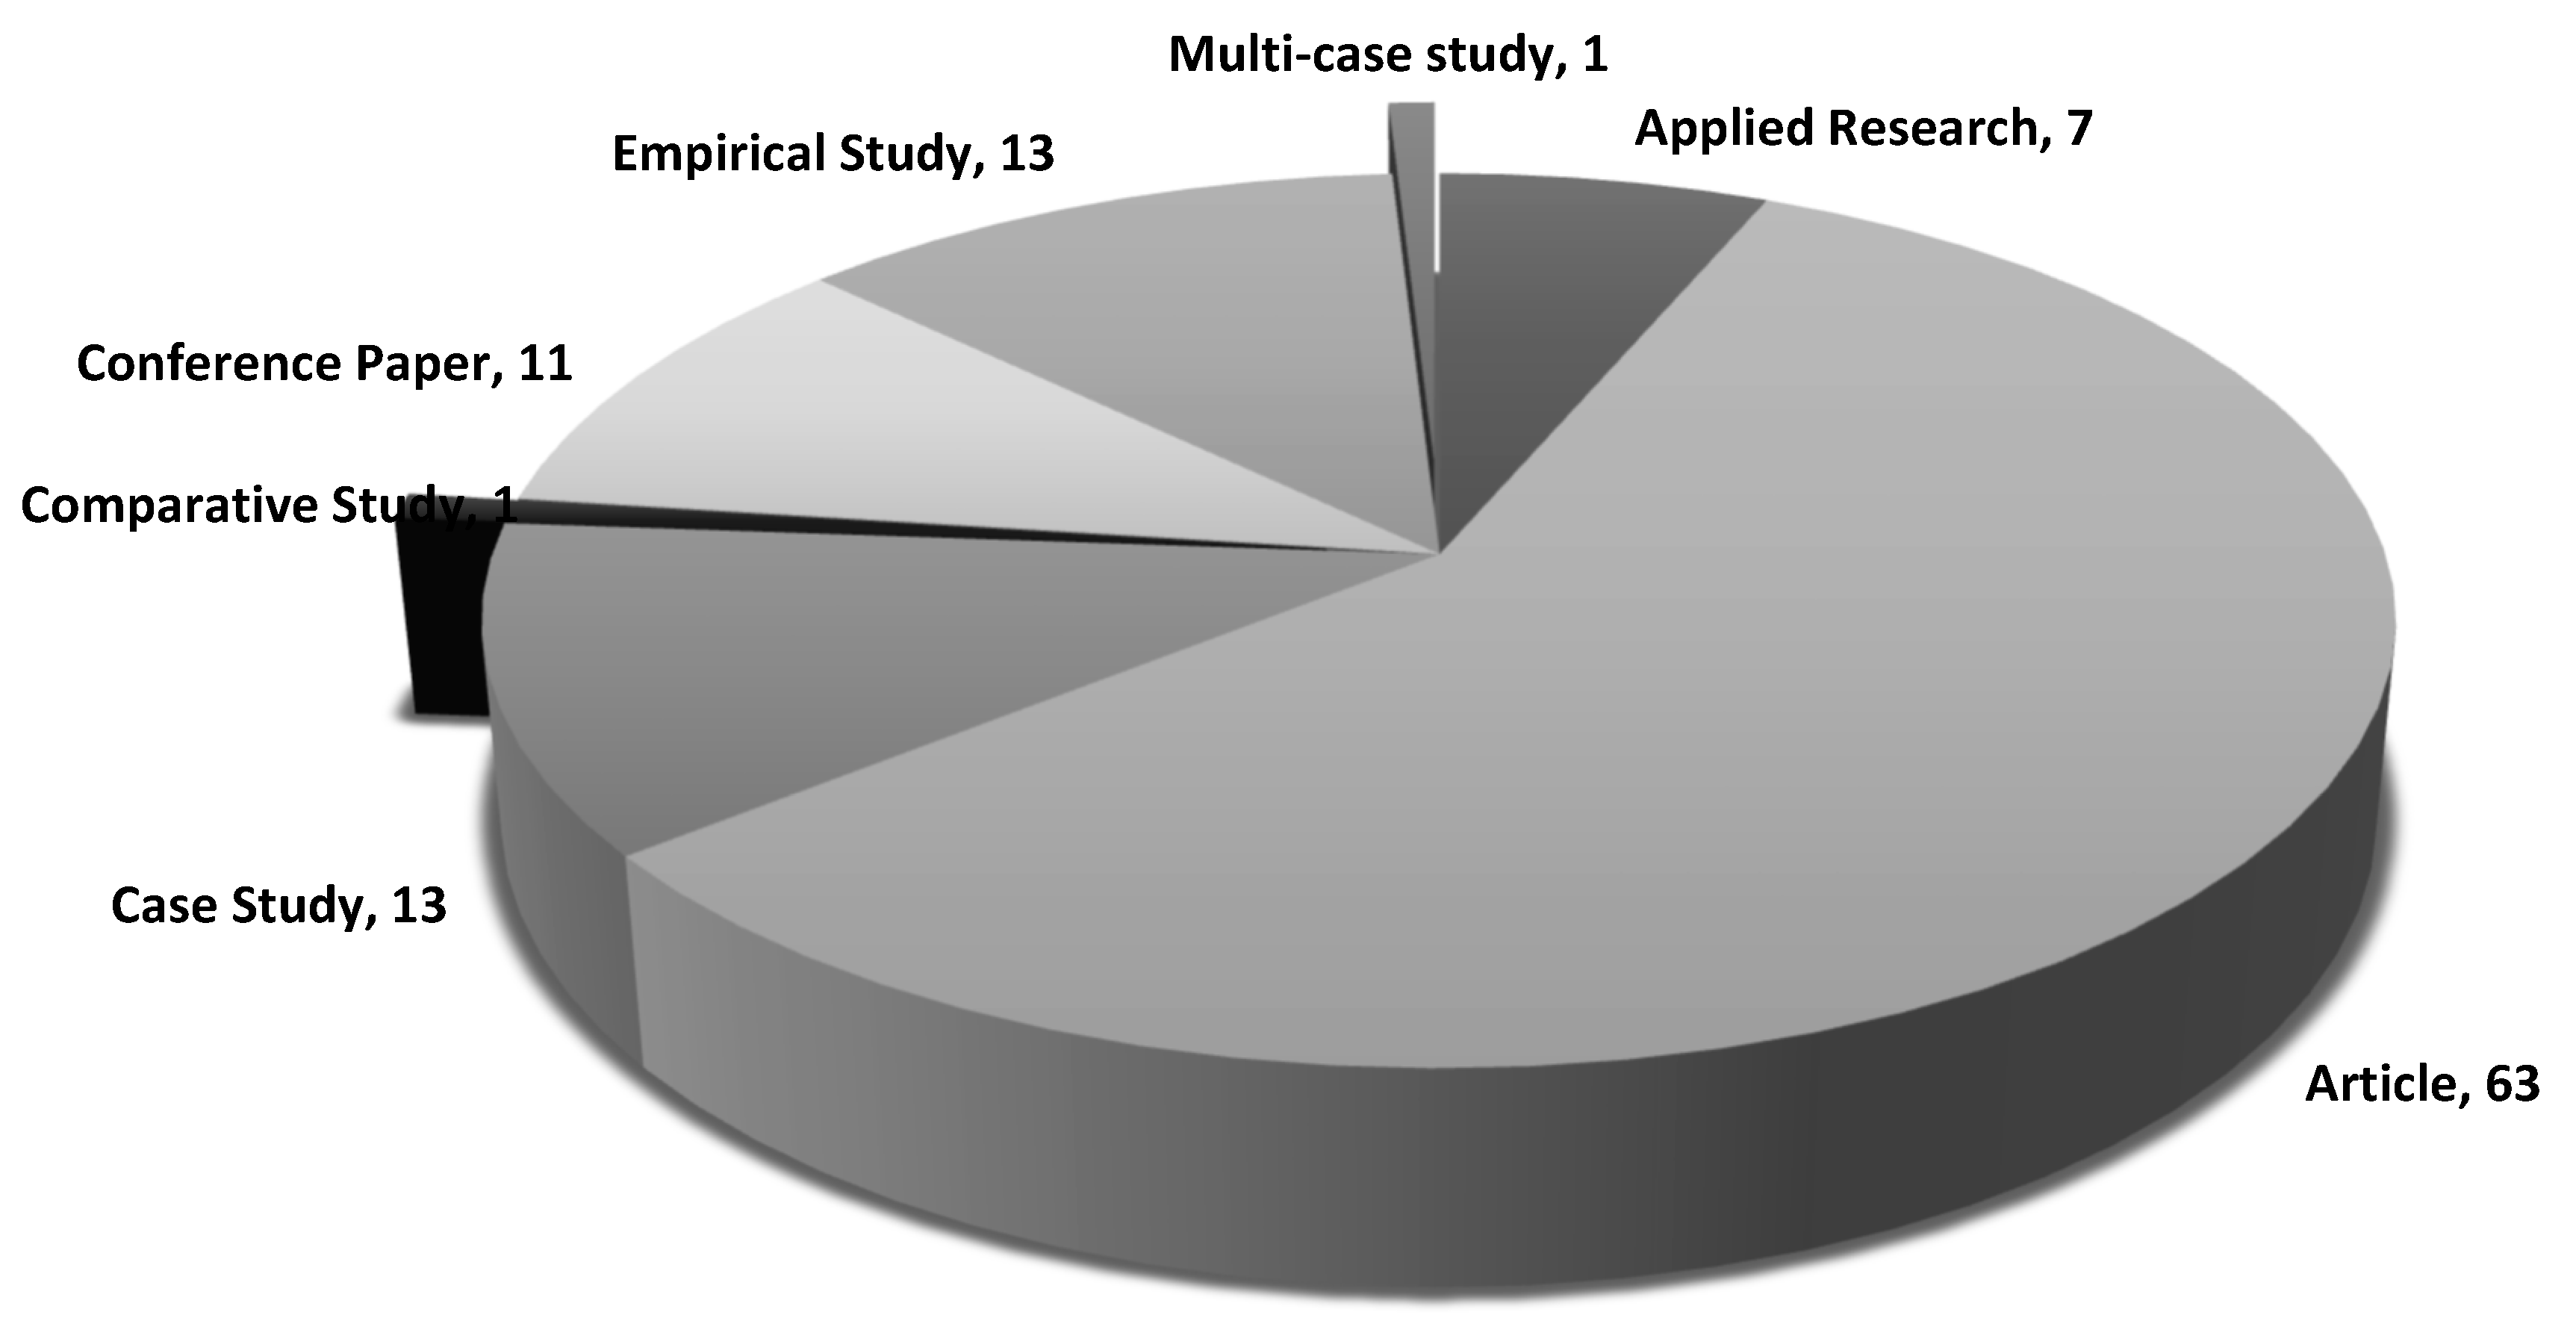
Figure 13.
Research distribution by Geographic Location.
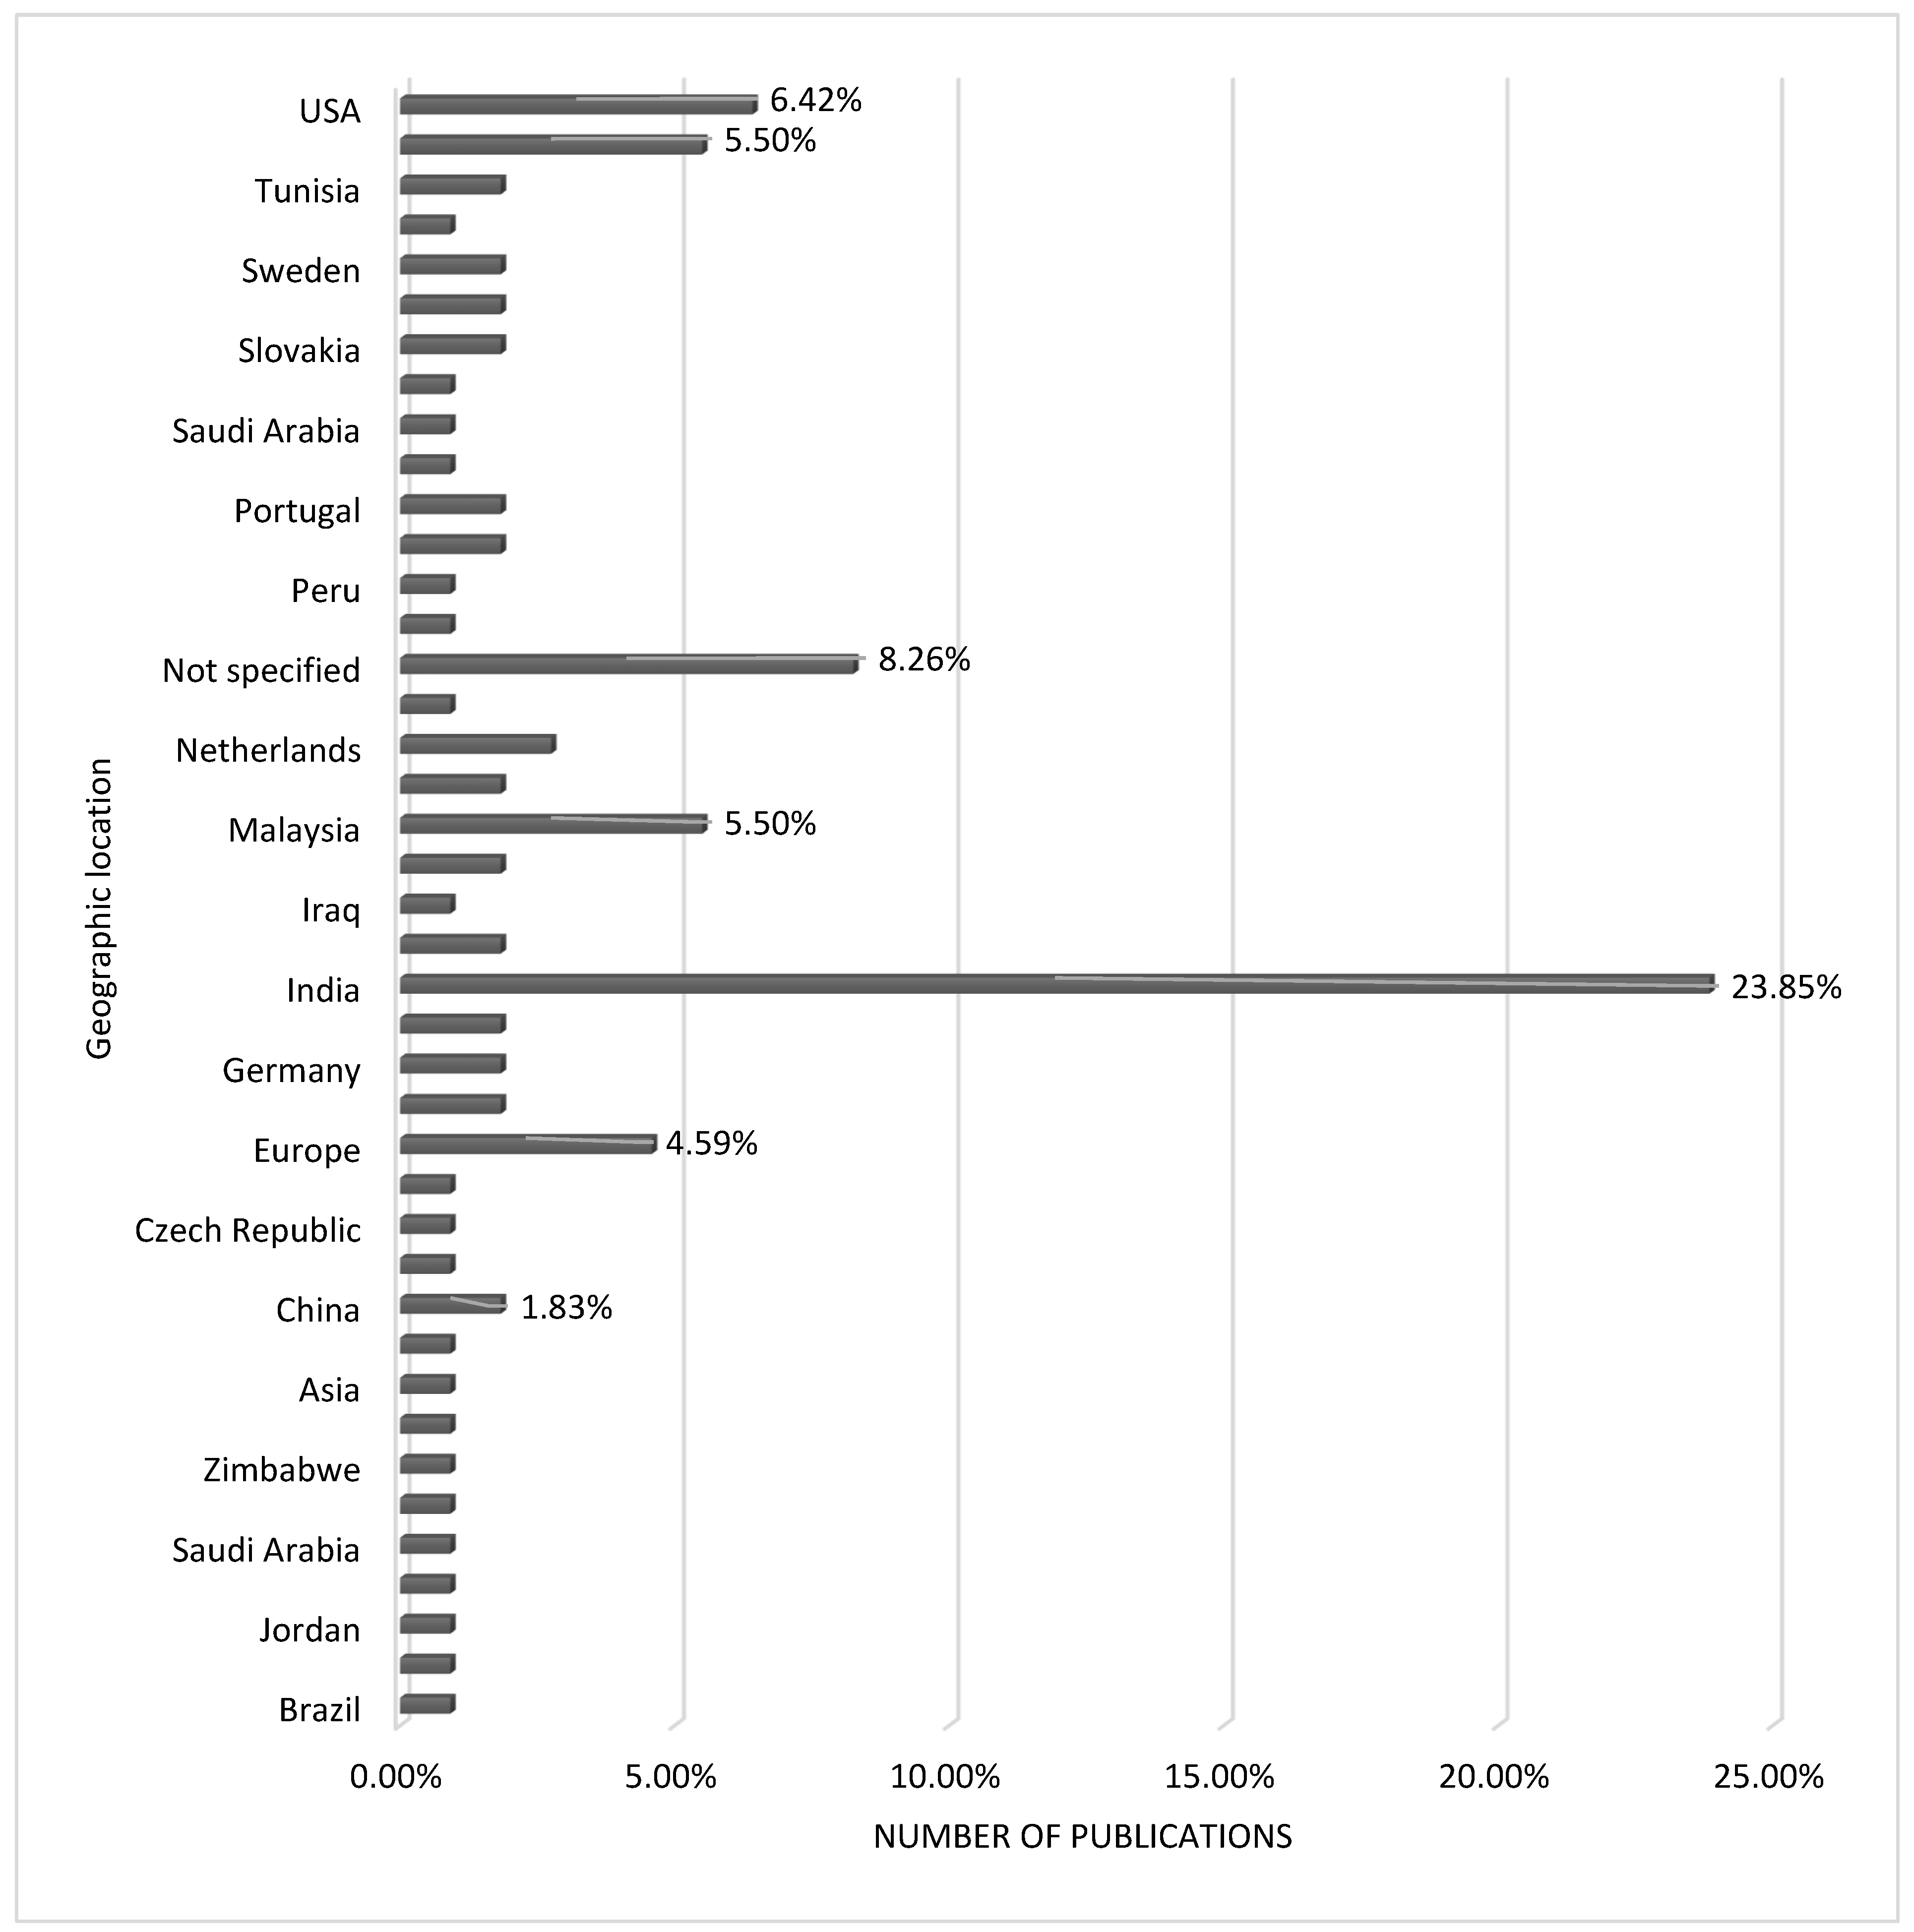
Figure 14.
Research distribution by Economic Context.
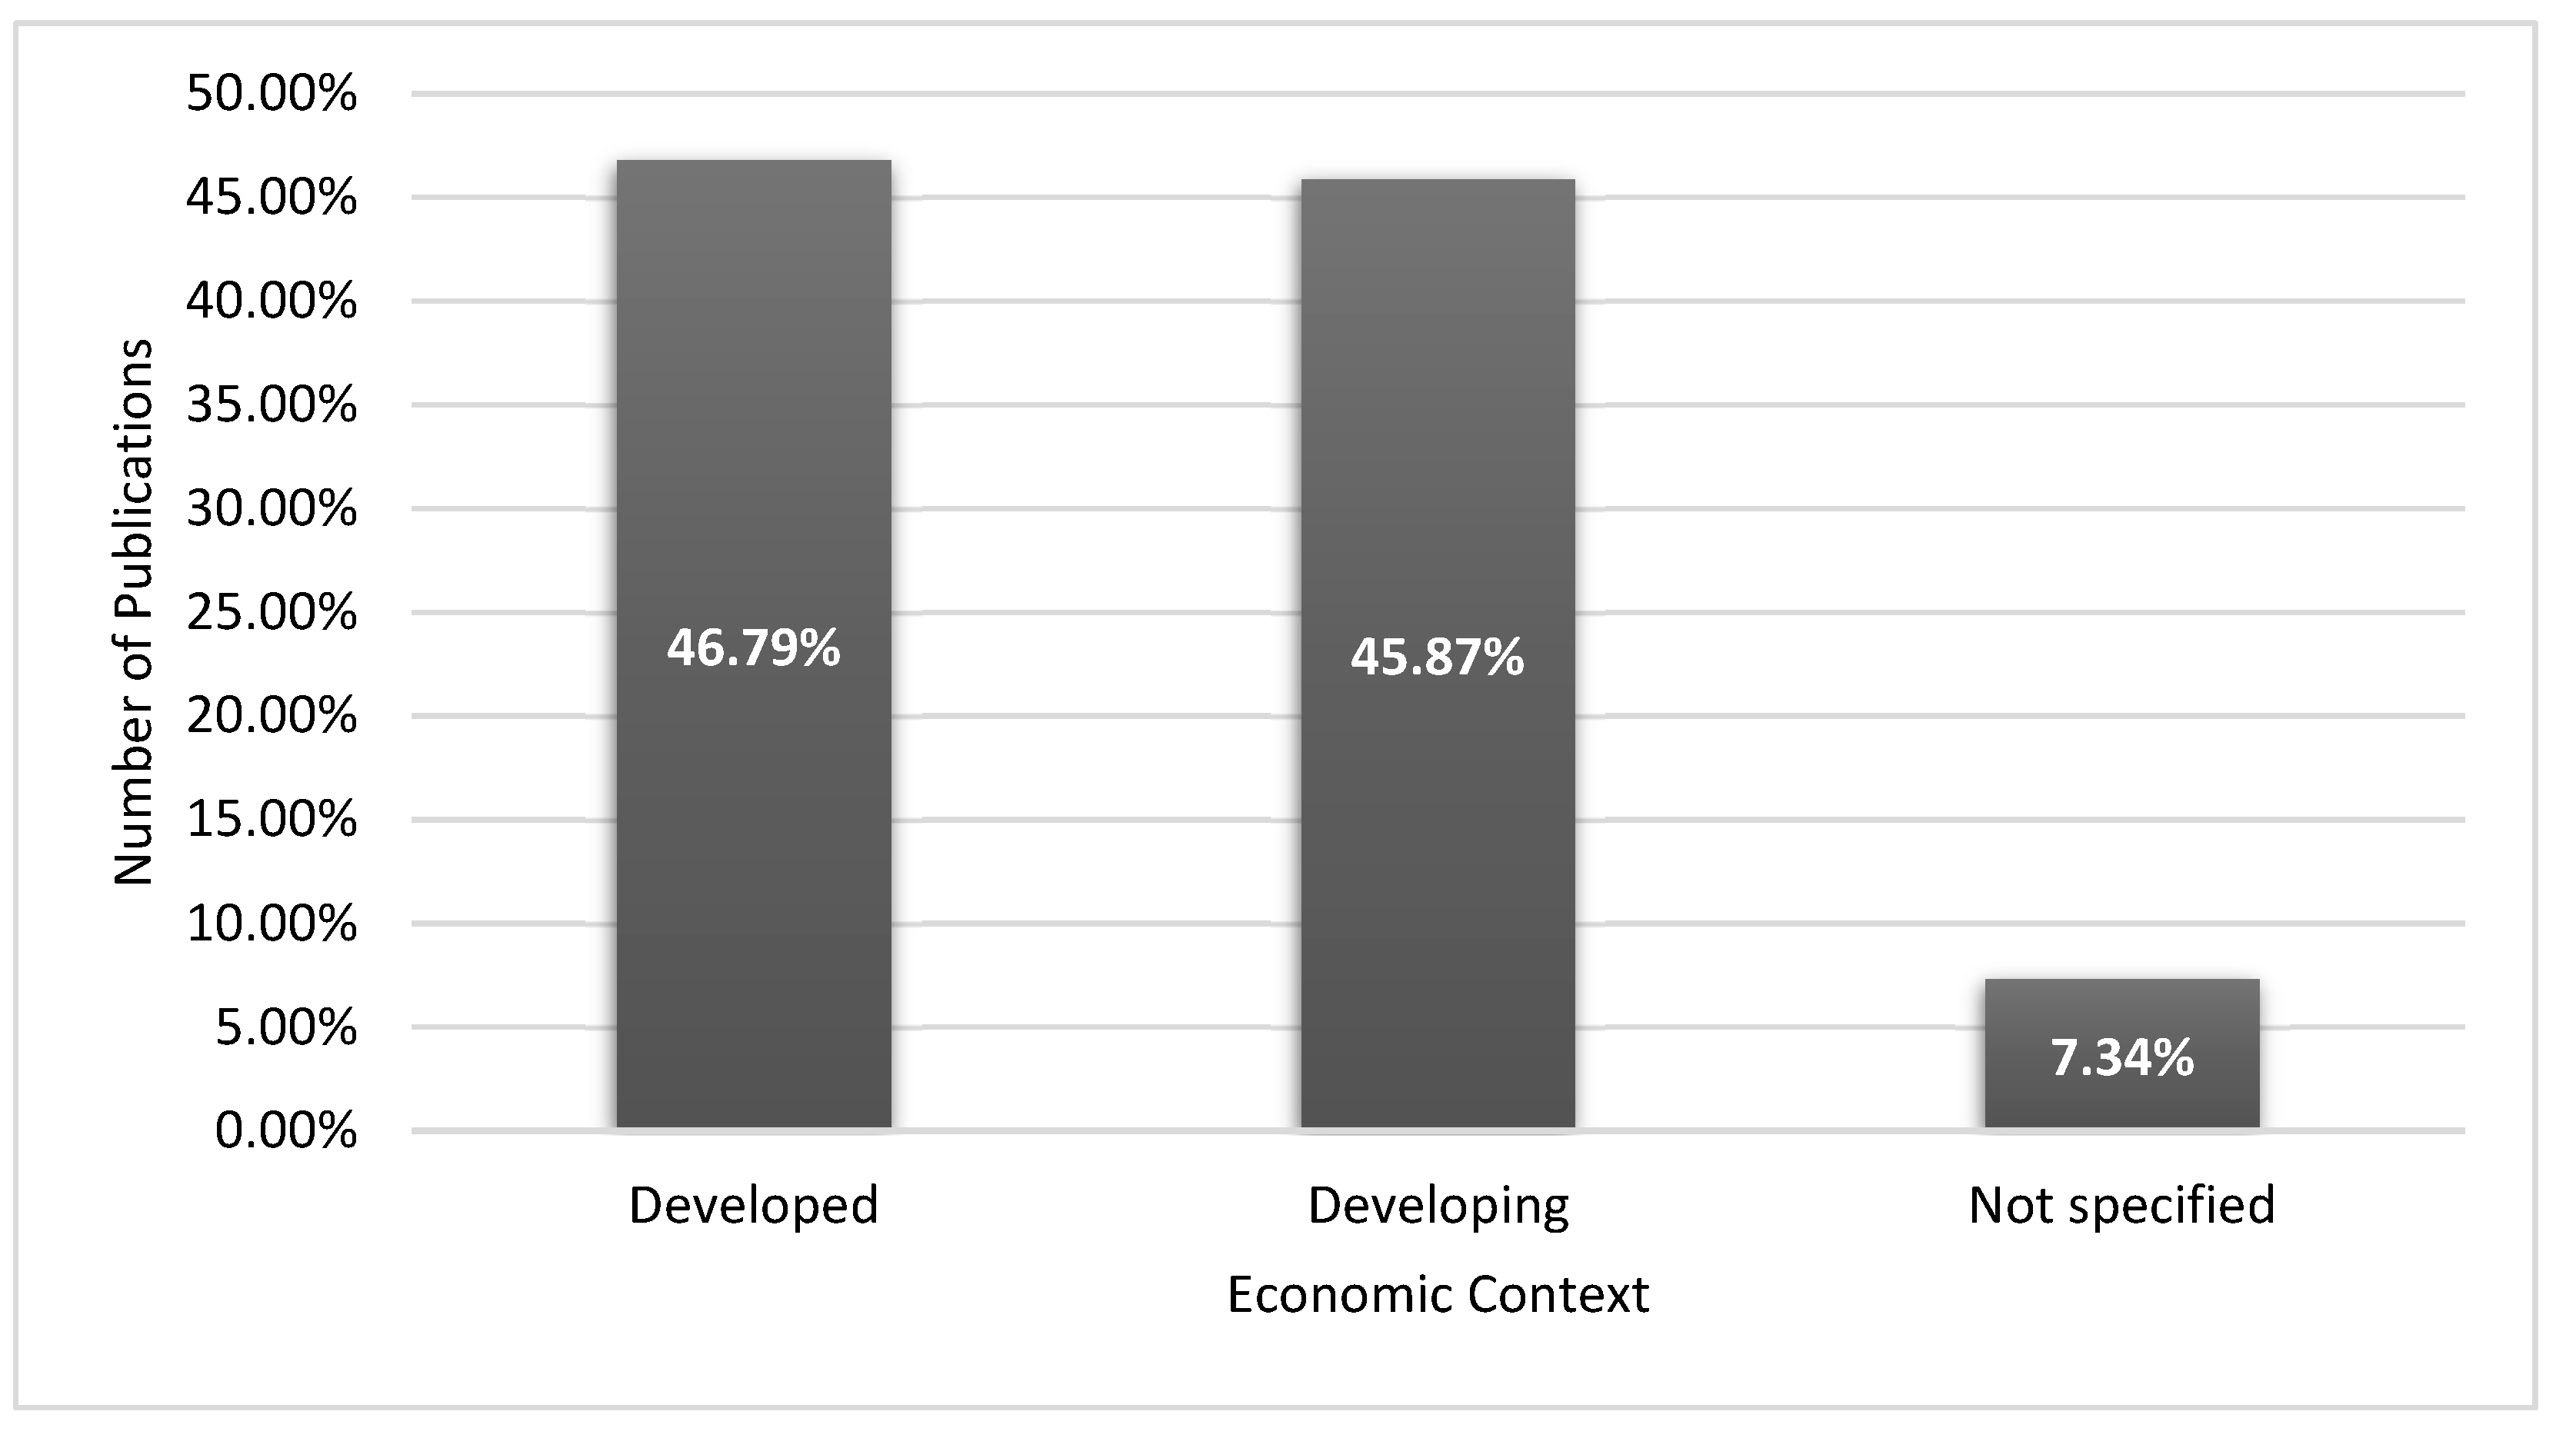
Figure 15.
Research distribution by Industry Context.
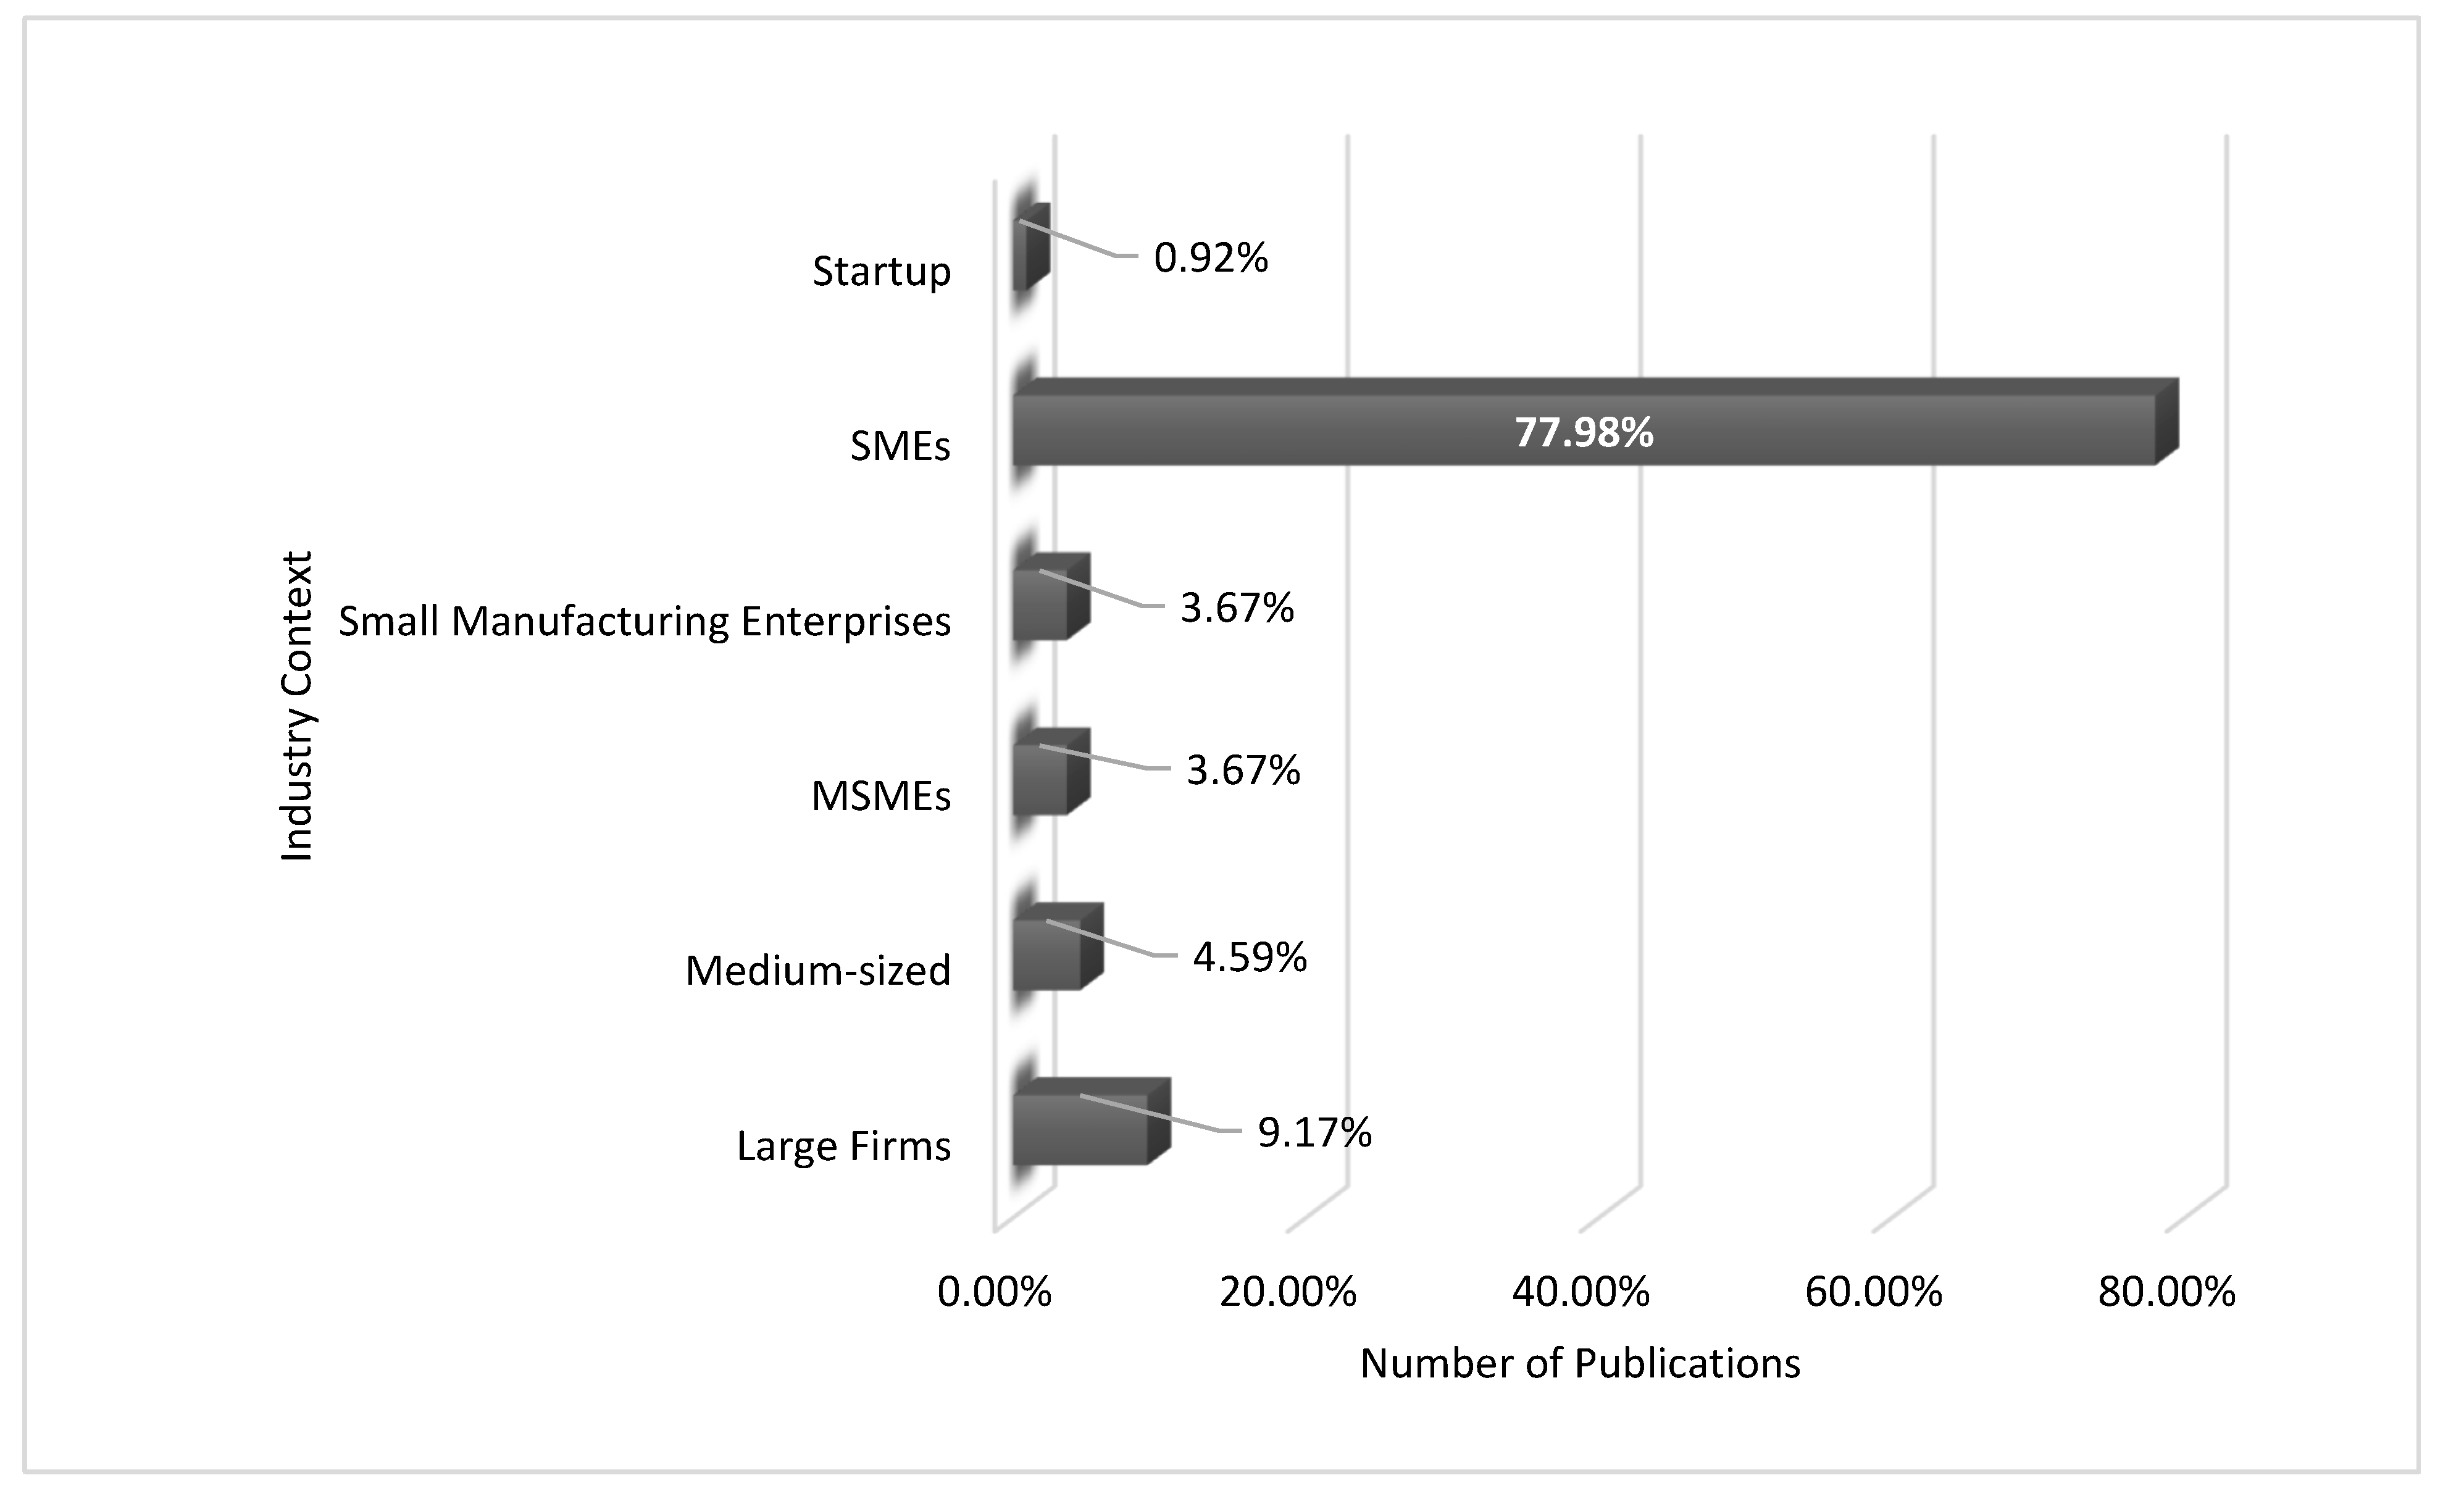
Figure 16.
Synthesis Systematic Process.
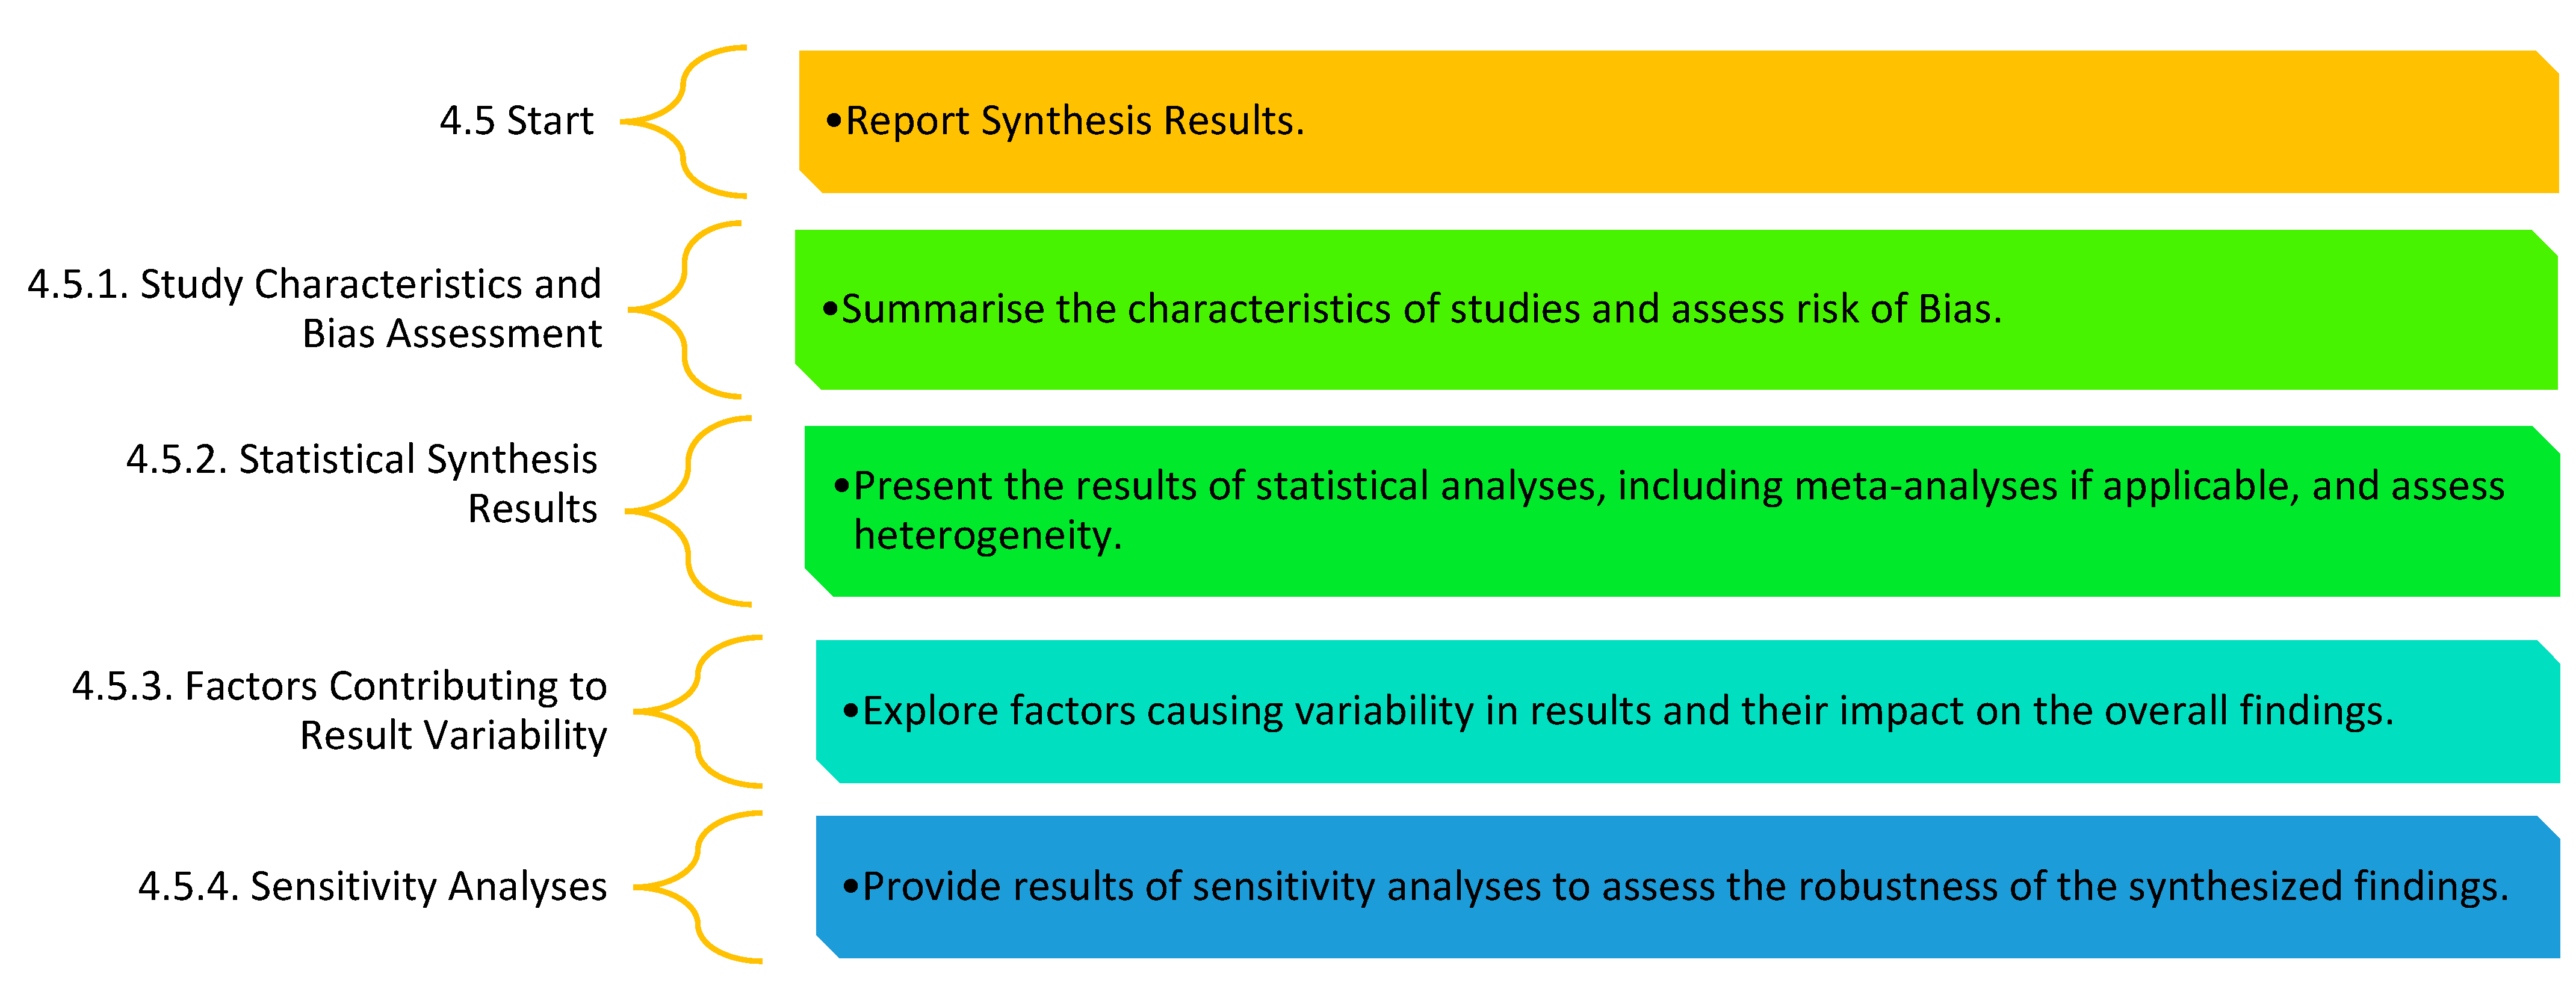
Figure 17.
Research distribution by data collection methods.
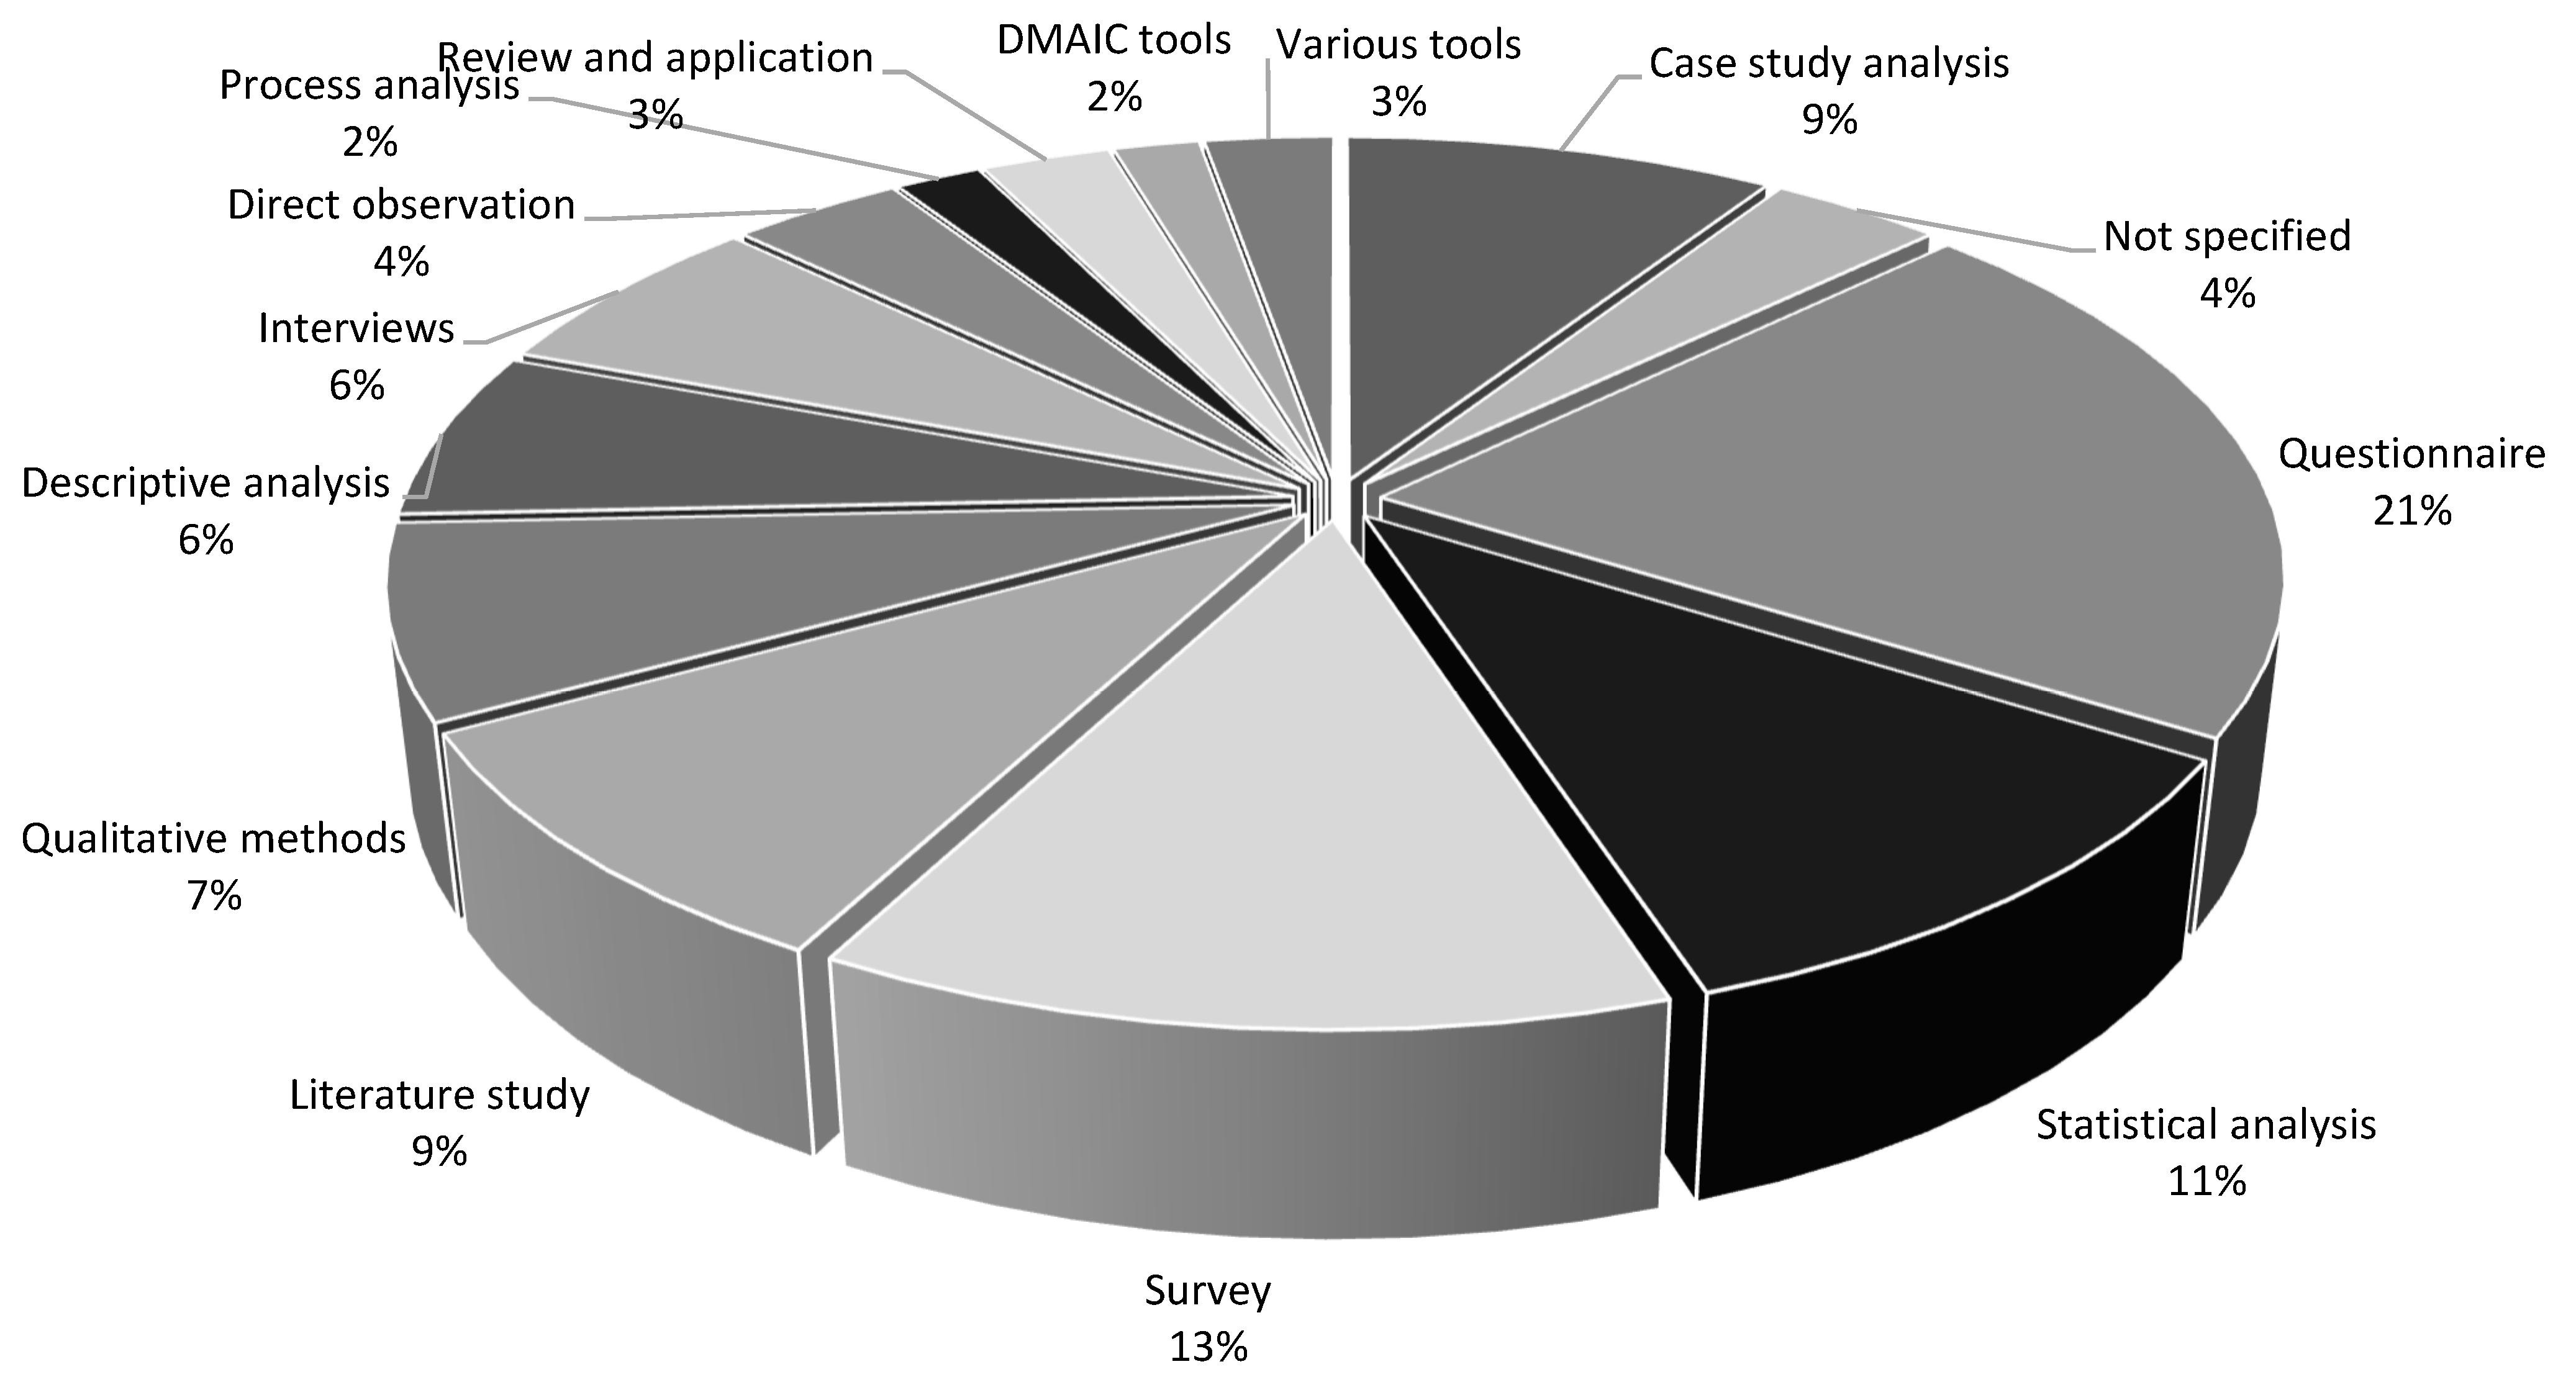
Figure 18.
Distribution of Disciplines Across all Included Publications.
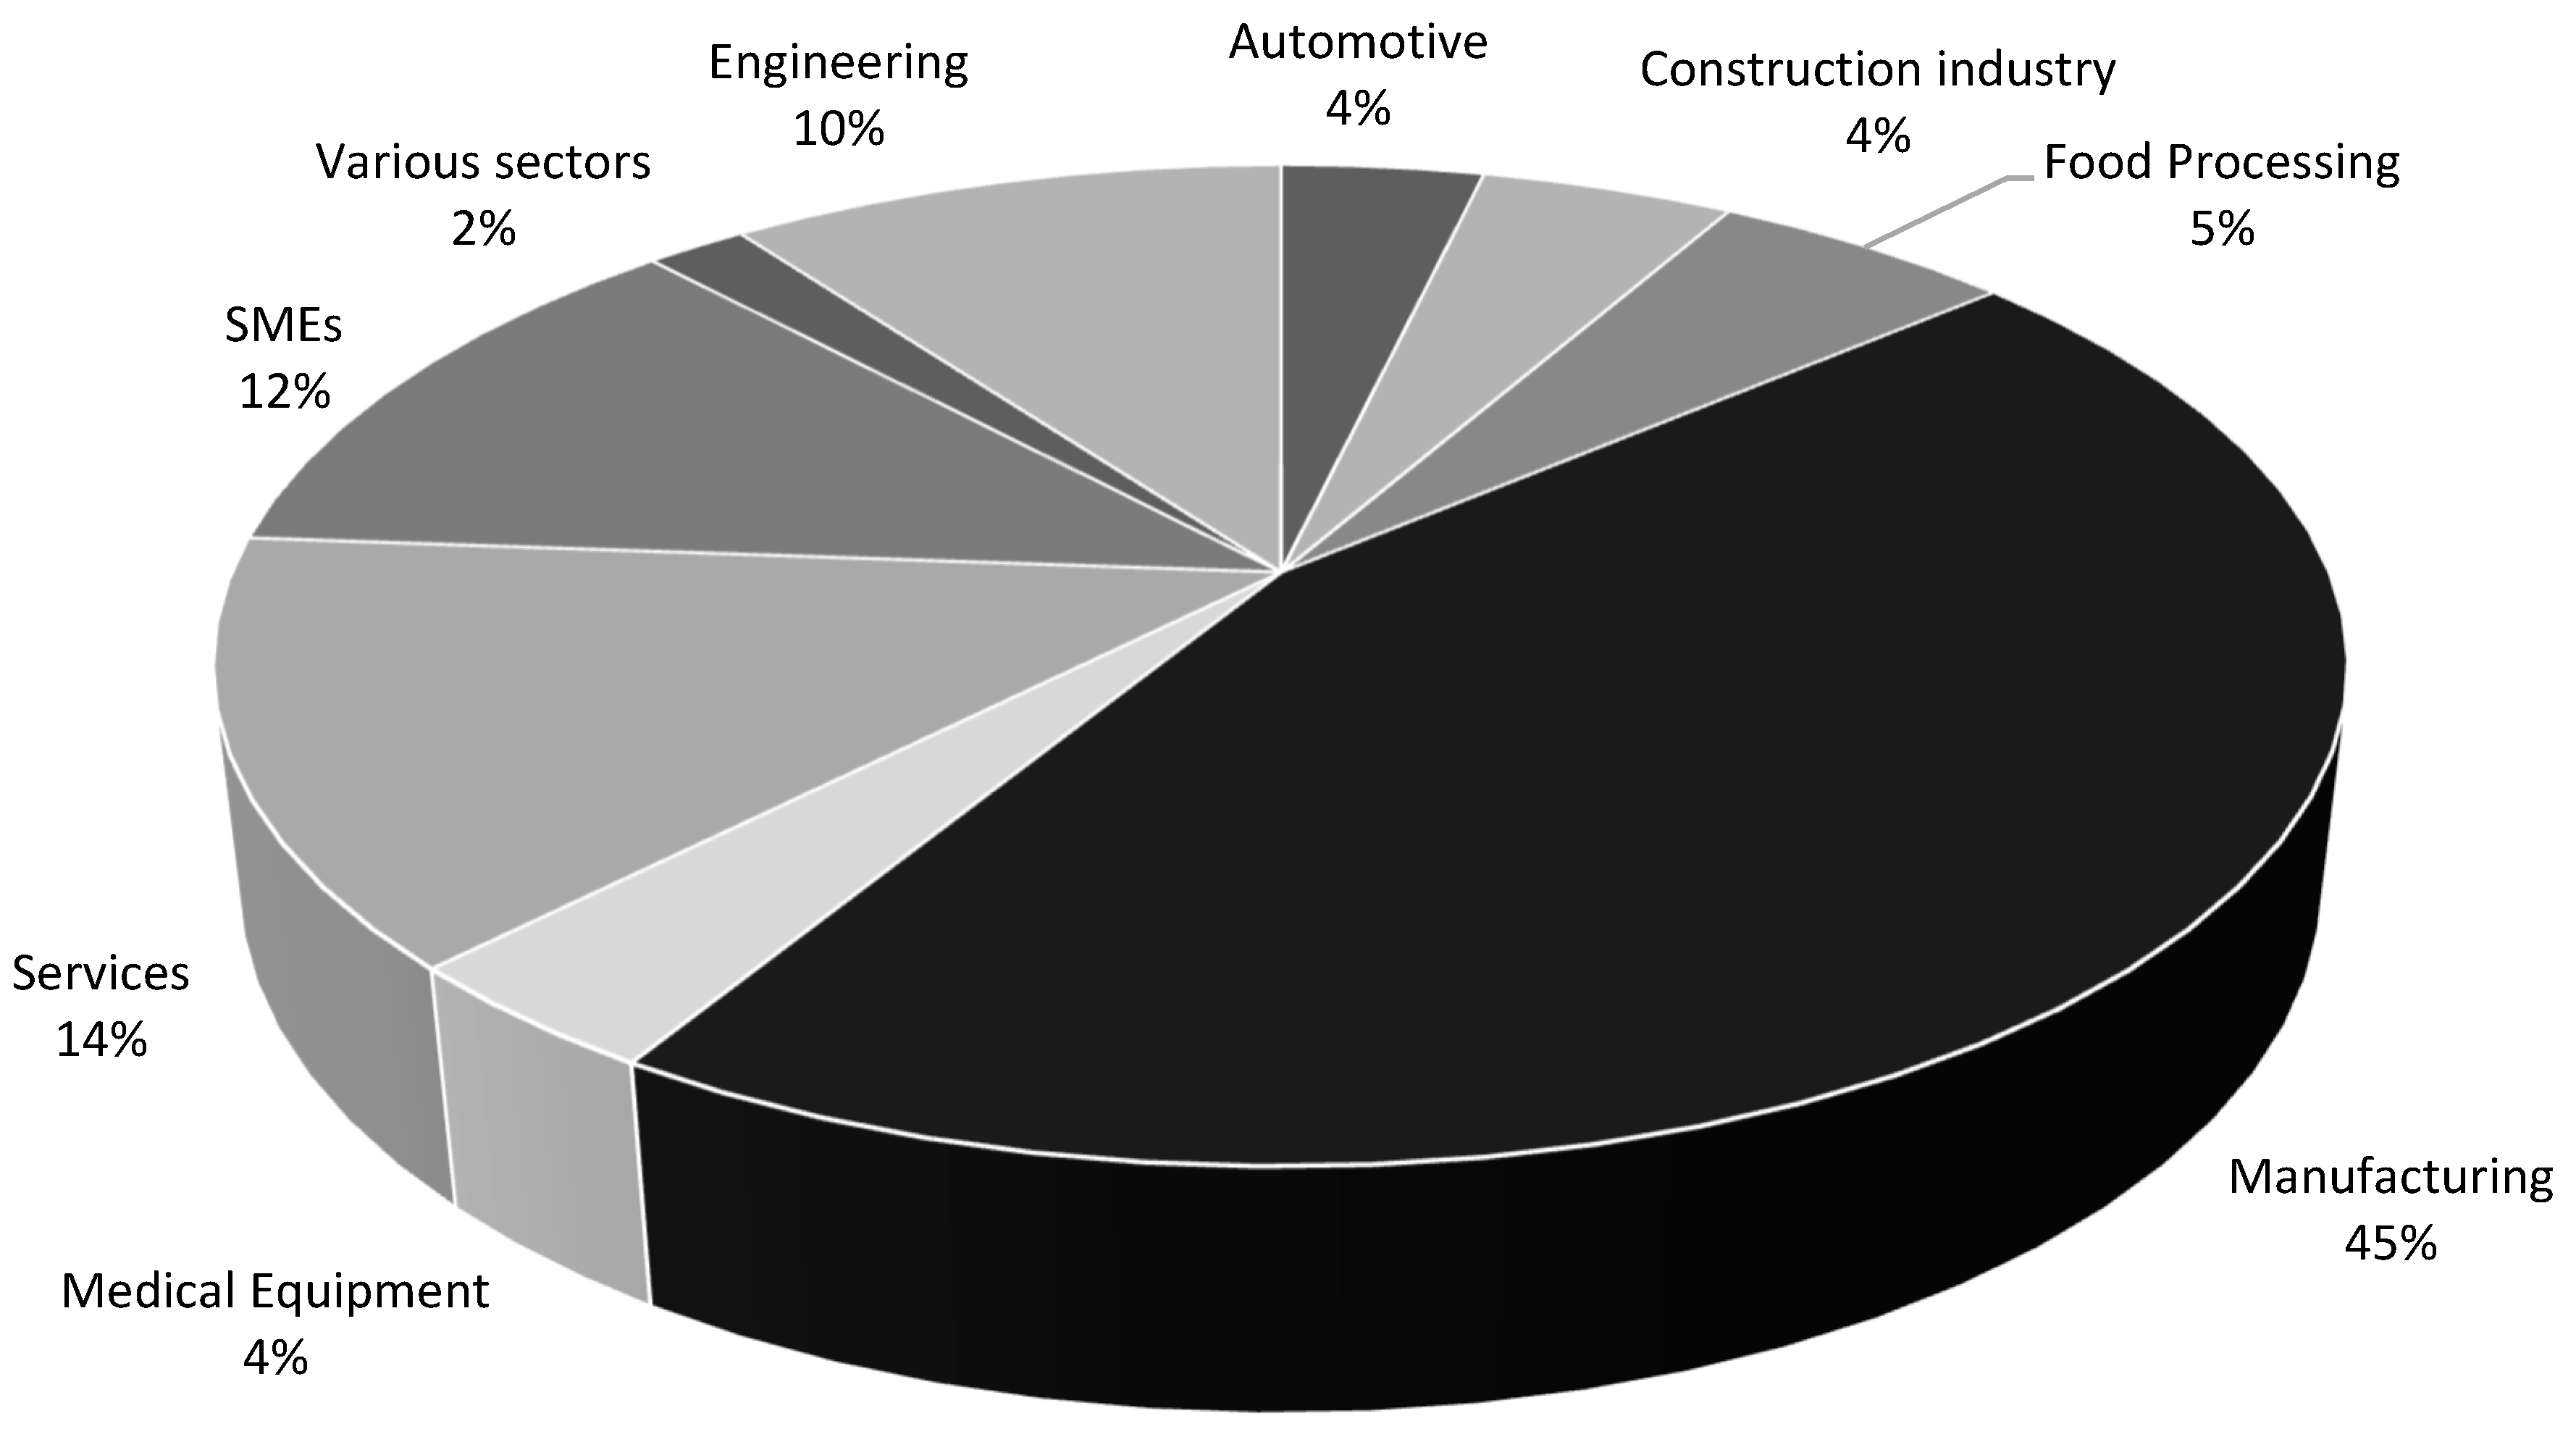
Figure 19.
Research distribution by heterogeneity in sample characteristics.
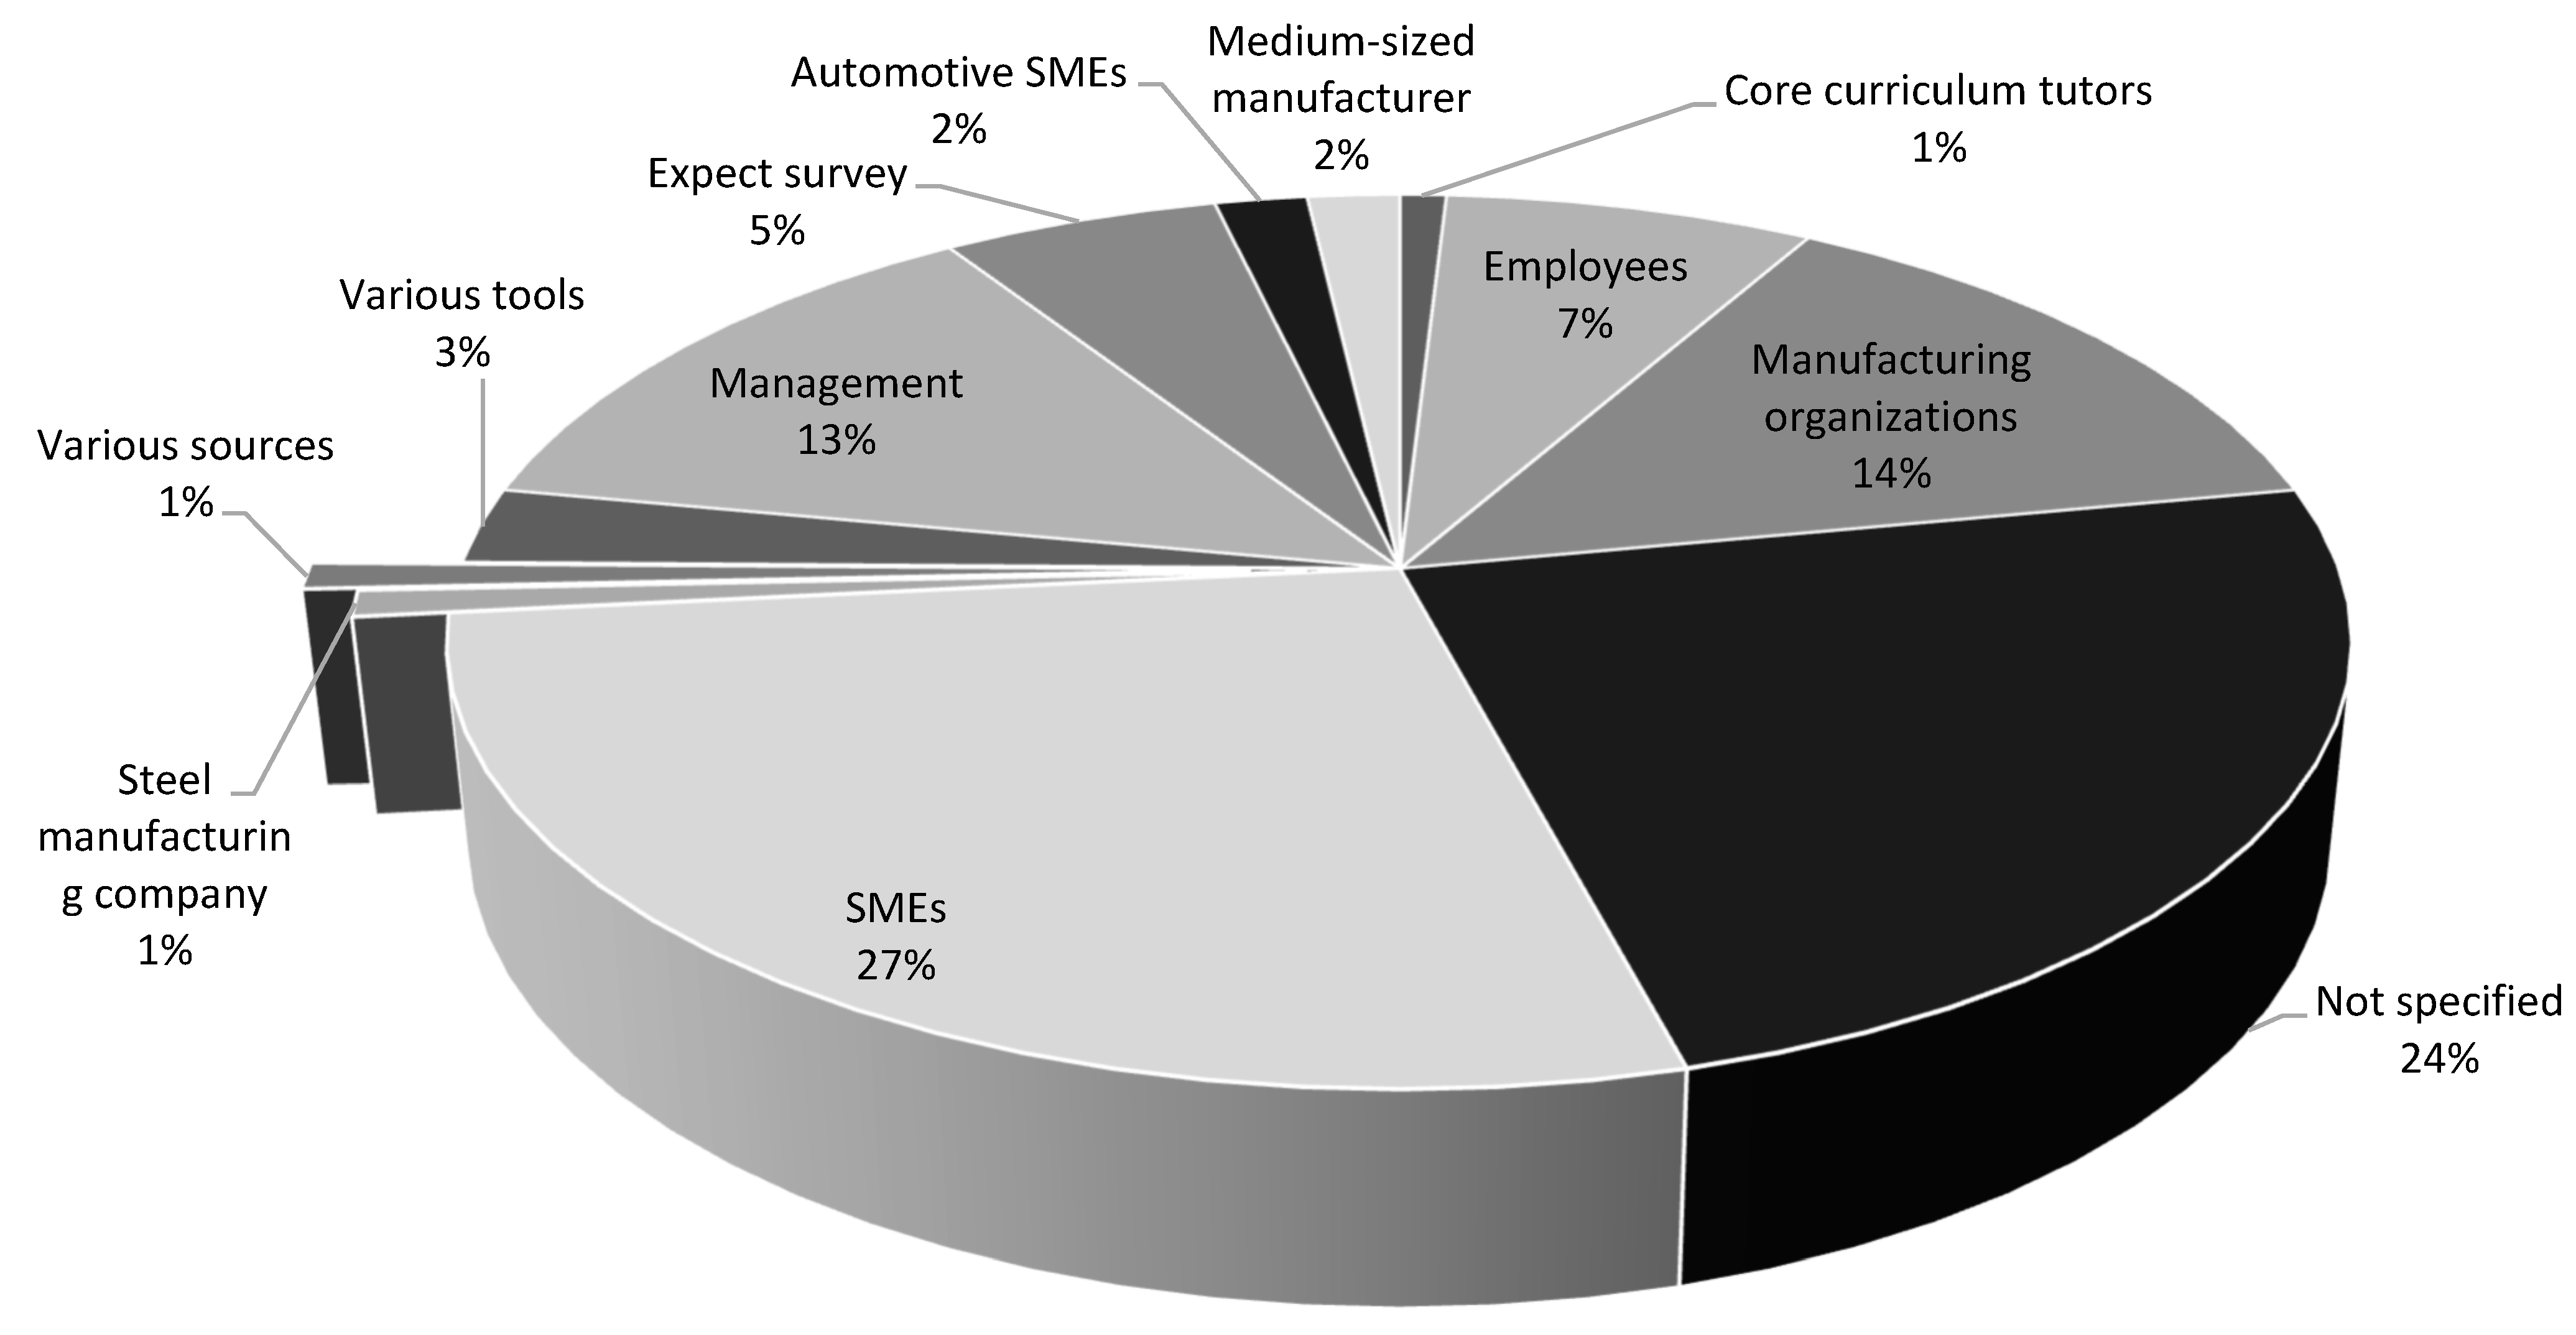
Figure 20.
heterogeneity in sample characteristics, Data Analysis Techniques.
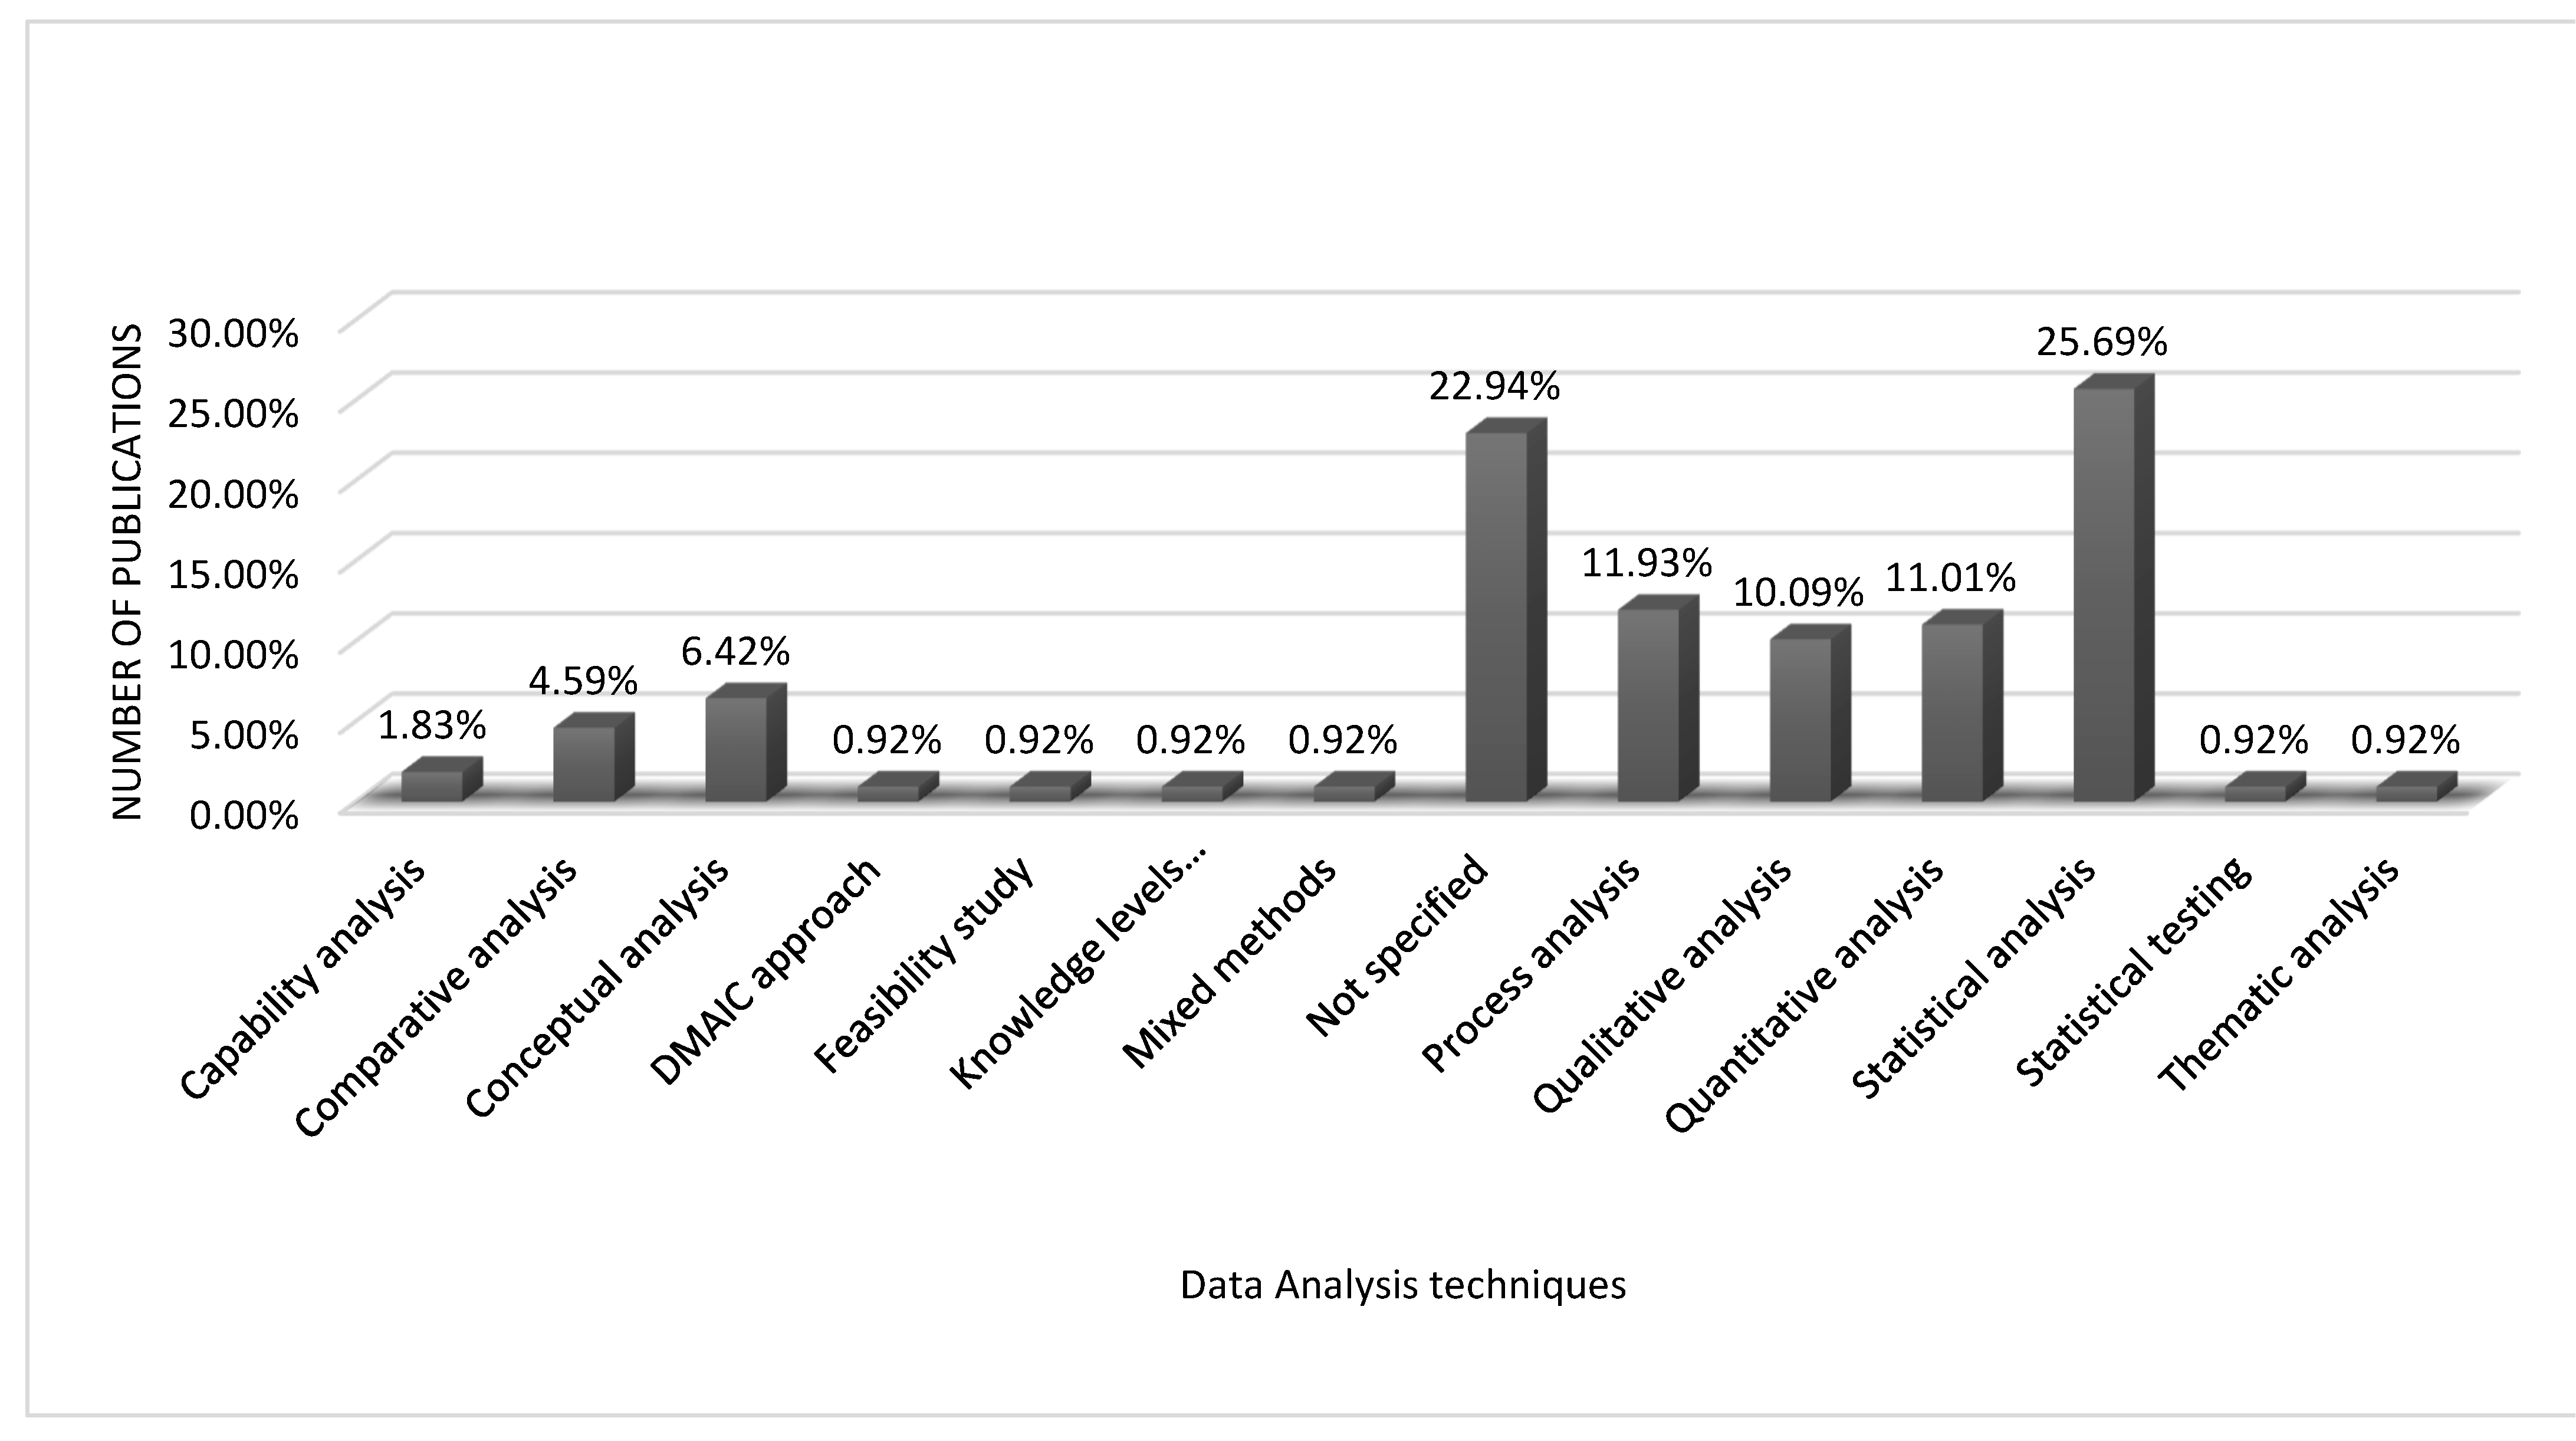
Table 1.
Comparative Analysis of the Existing Review Works and Proposed Systematic Review on the Application of Lean Six Sigma for SMEs.
Table 1.
Comparative Analysis of the Existing Review Works and Proposed Systematic Review on the Application of Lean Six Sigma for SMEs.
| Ref. | Cites | Year | Contributions | Pros | Cons |
|---|---|---|---|---|---|
| [21] | 356 | 2014 | Explores the critical failure factors for Lean Six Sigma in various sectors, based on a systematic literature review of 56 papers published between 1995 and 2013. | Identifies 34 common failure factors; provides insights across different sectors and organizational sizes. | Discusses many gaps and limitations that need further research. |
| [22] | 69 | 2014 | Reviews literature on Total Productive Maintenance (TPM) implementation practices in manufacturing organizations, with a focus on SMEs in India, and identifies gaps in current research and practices. | Highlights the importance of TPM for productivity and competitive advantage; suggests directions for future research. | Focuses primarily on Indian SMEs; may not be generalizable to other contexts. |
| [23] | 136 | 2016 | Explores lean manufacturing in food-processing SMEs, identifying barriers to adoption and challenges specific to the food industry, based on a multiple-case-study research approach. | Offers insights into contextual factors and barriers specific to the food-processing industry; helps practitioners anticipate obstacles. | Focuses exclusively on food-processing SMEs; may not be generalizable to other sectors. |
| [24] | 128 | 2016 | Investigates Lean Manufacturing (LM) practices in Brazilian SMEs, analyzing the implementation and its impact on performance using structural equation modeling (PLS-SEM). | Provides insights into fragmented LM practices and their impact on performance; highlights specific areas for improvement. | Limited to Brazilian SMEs; fragmented approach to LM implementation. |
| [25] | 25 | 2018 | Reviews the implementation of Six Sigma in various manufacturing industries, examining its success using different performance indicators, based on a critical review of 112 research articles. | Offers insight into the implementation and measurement of Six Sigma in manufacturing; identifies gaps in research. | Does not cover service industries; limited to specific performance indicators. |
| [26] | 40 | 2018 | Examines critical success factors for Lean Six Sigma and Six Sigma implementation in small and medium-sized manufacturing enterprises, comparing them with larger corporations. | Identifies key success factors for both SMEs and large organizations. | Implementation challenges in SMEs due to resource limitations. |
| [27] | 26 | 2019 | Investigates Lean Six Sigma in the Brazilian context, focusing on its characteristics and opportunities for future research, based on a review of 104 scientific publications. | Highlights critical success factors, particularly top management support; provides practical applications in large Brazilian industries. | Limited to Brazilian studies; lacks a standard framework for LSS. |
| [28] | 121 | 2019 | Reviews benefits and challenges of Lean Six Sigma implementation across various sectors from 2000 to 2018, including manufacturing, health care, human resource, financial, and education. | Offers a comprehensive review of LSS implementation across multiple sectors; identifies research gaps. | May not fully capture recent developments beyond 2018. |
| [29] | 55 | 2019 | Explores common themes and research gaps in Lean Six Sigma related to small- and medium-sized enterprises (SMEs) within manufacturing organizations, using a systematic review methodology. | Identifies research gaps and provides insights for improving LSS implementation in SMEs. | Limited to peer-reviewed English papers; excludes conference and white papers. |
| [30] | 11 | 2019 | Examines the impact of Lean Manufacturing (LM) on performance in manufacturing SMEs and introduces a new lean implementation framework for very small businesses (VSBs). | Highlights recent progress in LM among SMEs; proposes a framework for VSBs. | Limited to manufacturing SMEs; may not apply to other sectors. |
| [31] | 92 | 2019 | Reviews Lean implementation (LI) in SMEs, identifying main challenges and critical success factors through a systematic review methodology of 403 papers. | Provides a comprehensive view of Lean implementation challenges and CSFs in SMEs. | Focuses on SMEs only; may not address Lean implementation in large organizations. |
| [32] | 52 | 2019 | Identifies research gaps in Lean manufacturing (LM) literature from a systematic review of 120 articles published between 2005 and 2016, and groups these gaps into meaningful themes. | Provides a detailed analysis of LM research gaps and groups them into logical themes. | May not cover the latest research developments post-2016. |
| [33] | 8 | 2020 | Identifies and explores critical success factors (CSFs) for Six Sigma through an extensive literature review of 64 research articles, proposing a categorized list of vital CSFs. | Provides a categorized list of CSFs; useful for increasing the success rates of Six Sigma programs. | Focuses on SMEs only; does not consider failure experiences of larger industries. |
| [34] | 25 | 2021 | Compares the effect of Lean Manufacturing (LM) implementation in manufacturing sectors of developing and developed countries, based on a review of 63 studies published between 2015 and March 2020. | Provides comparative insights into LM practices across different economies; highlights difficulties faced by SMEs. | Limited to manufacturing sectors; no reported negative impacts of LM. |
| [35] | 12 | 2022 | Reviews Lean Six Sigma literature in the Indian context from 2010 to 2021, focusing on various perspectives such as author profiles, types of firms, methodologies used, and key findings. | Provides a comprehensive classification and framework for future research in LSS within India. | Limited to studies published in the Indian context; may not address global trends. |
| [36] | 3 | 2023 | Identifies enablers and barriers to Lean implementation among first-line employees (FLEs) in SMEs, highlighting future research avenues for improving understanding of lean methodology implementation. | Provides insights into FLEs’ roles and factors affecting lean implementation; offers a framework for future research. | Limited citations; focused on FLEs’ roles in lean implementation. |
| [37] | 0 | 2024 | Examines human-related lean practices (HRLP) in the context of lean manufacturing (LM) implementation in SMEs, based on a review of 193 publications between 2013 and 2023. | Provides a thorough analysis of HRLPs important for lean success; helps in guiding lean implementation in SMEs. | Limited to publications in English; may not cover all HRLPs or regional variations. |
| Proposed systematic review | Provides a comprehensive consolidation of existing research on the implementation of Lean Six Sigma in SMEs, identifies configurations, performance metrics, and common challenges. Proposes regression models for financial metrics associated with LSS components. | Offers a holistic analysis of Lean Six Sigma applications, bridging gaps in performance metrics across different industry contexts; highlights research gaps for future exploration. | - | ||
Table 2.
Proposed Research Questions.
| Q | Research Questions |
|---|---|
| Q1 | What are the key success factors and barriers to the implementation of Lean Six Sigma in SMEs across various industries and geographical contexts? |
| Q2 | To what extent does the adoption of Lean Six Sigma influence employee engagement, satisfaction, and skill development in small and medium-sized enterprises? |
| Q3 | What are the most common challenges faced by SMEs in integrating Lean Six Sigma into existing workflows, and how can these be mitigated? |
| Q4 | How do the outcomes of Lean Six Sigma implementation vary between manufacturing SMEs in developed versus developing countries? |
| Q5 | What financial metrics or performance indicators are most influenced by Lean Six Sigma practices in SMEs, and how can regression models predict their impact? |
Table 3.
Proposed Inclusion and Exclusion Criteria.
| Criteria | Inclusion | Exclusion |
|---|---|---|
| Topic | Publications examining the application of Lean Six Sigma in SMEs, with empirical evidence or case studies. | Publications lacking focus on Lean Six Sigma applications in SMEs. |
| Research Framework | Articles incorporating a research framework where Lean Six Sigma is methodologically applied to SMEs. | Articles without a framework on Lean Six Sigma applications in SMEs. |
| Language | Papers written in English to ensure accessibility and standardized interpretation. | Papers in languages other than English. |
| Period | Publications between 2014 and 2024 to capture contemporary and relevant insights. | Publications outside the 2014–2024 timeframe. |
Table 4.
Summary of Online Research Repositories Used.
| Database | Access Platform | Inclusion/Exclusion Criteria Applied | Purpose of Use |
|---|---|---|---|
| Google Scholar | Browser | Yes | Ensures broad coverage across multidisciplinary sources. |
| Scopus | OpenAthens (UJ Online Library) | Yes | Accesses high-quality, peer-reviewed journal articles. |
| Web of Science | OpenAthens (UJ Online Library) | Yes | Provides publications with strong research impact and citations. |
Table 5.
Data Items Variables.
| Fields | Description |
|---|---|
| Research Title | The title of each study was included in the review |
| Year of Publication | The year when the study was published |
| Online database | The database where the study was sourced (Google Scholar, SCOPUS, Web of Science |
| Journal Name | The Publisher in which the articles was published |
| Research Type | The type of publication (e.g., Article, Journal, Case study, Applied Research, Empirical study, etc.) |
| Number of Citations | The number of times the study has been cited by other researchers |
| Financial Information | Any financial performance information that was mentioned in the study. |
| Innovation Performance | Innovations or improvements reported as an outcome of the research. |
| Organizational Outcomes | Impacts on organizational processes, efficiency, teamwork, etc. |
| Employee Outcome | Effects on employee skills, confidence, or overall performance. |
| Customer Outcome | Impacts on customer satisfaction, complaints, or behavior |
| long term Impacts | Long-term effects of the research, such as sustainability or competitive advantage |
Table 6.
Synthesis-Specific Grouping.
| Category | Data Extracted |
|---|---|
| Study Details | Research Title, Year of Publication, Online Database, Journal Name, Research Type, Number of Citations, Google Scholar Ranking |
| Contextual Information | Industry or Sector, SME Characteristics, Geographic Location, Economic Context |
| Methods of Information | Type of Study, Research Design, Sample Size, Sample Characteristics, Data Collection Methods, Data Analysis Techniques, Methodologies, Types of Virtual Collaboration (Synchronous, Asynchronous, Hybrid) |
| Outcomes and Impacts | Operational Performance, Financial Information, Innovation Performance, Collaboration Outcomes, Employee Outcomes, Customer Outcomes, Long-term Impacts |
Table 7.
Data Preparation Methods for Review.
| Criteria | Method Used |
|---|---|
| Handling Missing Information | Studies lacking essential information were excluded from the review. For studies providing data in ranges (e.g., survey responses between 90–120 participants), midpoint estimates were used to standardize the figures. |
| Data Conversions | Fractions and percentages were converted to decimals using Microsoft Excel, ensuring uniformity and facilitating direct comparisons across all data points. |
Table 8.
Data Presentation and Synthesis Workflow.
| Steps | Description |
|---|---|
| 1. Data Collection | Collect raw data from reviewed studies. |
| 2. Data Preparation | Address missing information and perform data conversions. |
| 3. Tabulation Methods | Structure tables to include study contributions, benefits, challenges, and impacts; order tables by publication year and citation count. |
| 4. Graphical Methods | Create pie charts, graphs, and flow charts to visually represent study selection and outcome distribution. |
| 5. Presentation of Results | Combine tabular and graphical methods to offer a comprehensive and transparent view of findings. |
| 6. Review and Finalize | Review for completeness and accuracy; prepare results for inclusion in the review. |
Table 9.
Effect Measures from Studies Conducted.
| Outcome | Effect Measure | Thresholds/Ranges | Number of studies | Rationale |
|---|---|---|---|---|
| Operational Performance | Continuous (Mean Difference, MD) | Trivial Effect: MD < 5%Small Effect: MD = 5%–10%Moderate Effect: MD = 10%–20%Large Effect: MD > 20% | 109 | Improvements in operational performance indicators such as cycle time, defect rates, and throughput are common. A reduction of less than 5% is considered trivial, while anything over 20% is seen as a major improvement. |
| Financial Performance | Continuous (Mean Difference, MD) | Trivial Effect: MD < 2%Small Effect: MD = 2%–5%Moderate Effect: MD = 5%–10%Large Effect: MD > 10% | 109 | Financial metrics are more sensitive, with small percentage changes representing significant monetary impact, particularly for SMEs. Effects are measured by cost savings, ROI, and revenue growth with more conservative thresholds. |
| Quality Performance | Continuous (Mean Difference, MD)Binary (Risk Ratio, RR) | (Continuous)Trivial Effect: MD < 5%Small Effect: MD = 5%–10% Moderate Effect: MD = 10%–15% Large Effect: MD > 15%RR (Binary):No/Trivial Effect: RR = 1.0Small Effect: RR = 0.9–0.95Moderate Effect: RR = 0.8–0.9Large Effect: RR < 0.8 | 67 | Quality improvements are essential in manufacturing. MD is used for ratios or percentages such as First Pass Yield (FPY), while RR assesses the probability of achieving desired quality levels. Industry-standard thresholds are applied |
Table 10.
Reporting biases from studies conducted.
| Bias Type | Challenges | Assessment method | Number of studies |
|---|---|---|---|
| Publication type | Only studies with positive results may be published. | Compare the variety of industries and sectors in the studies. Check for missing sectors to identify | 109 |
| Selecting Reporting | Negative findings may be excluded, skewing results toward positive outcomes | Compare the Lean Six Sigma tools used in the study to the outcomes reported. If only a subset of tools is reported, it indicates selective reporting. | 32. |
| Time lag bias | Positive results may be published faster than negative ones | Review the publication dates to see if older studies omit negative results. | 46. |
| Language bias | Articles in non-English languages are not included | Check the country of origin of the studies. An overrepresentation of English-speaking countries could indicate language bias. | 109 |
| Outcome Reporting Bias | Only high-magnitude outcomes are reported. | Examine the reported results to determine if only favorable outcomes are included. | 50 |
Table 11.
Certainty of Evidence from studies conducted.
| Outcome Category | Certainty level | Number of studies | Justification |
|---|---|---|---|
| Financial Information | High | 33 | The financial outcomes were consistently reported across a significant number of studies. |
| Innovation Performance | High | 34 | Innovation performance was reported in many studies, with consistent findings. |
| Organizational Outcomes | High | 87 | Many studies provided detailed and consistent data on organizational outcomes. |
| Employee Outcome | High | 47 | Employee-related outcomes were well-reported across the dataset, with consistent results. |
| Customer Outcomes | High | 30 | Customer outcomes were documented in a sufficient number of studies, showing consistent patterns. |
| Long term impacts | High | 59 | Long-term impacts were widely covered in the studies, with robust and consistent evidence |
Table 12.
Key Findings and Strategic Implications for Business Leaders.
| Industry | Key Finding | Strategic Implications for Business Leaders | Opportunities | Challenges | Relevance to Proposed Systematic Review | Strategic Drivers | Expected Outcome |
|---|---|---|---|---|---|---|---|
| Manufacturing | LSS significantly reduces cycle times and defects (77.98%). | Implement LSS to streamline production processes and enhance product quality. | Optimize production processes, improve competitiveness. | Overcoming resistance to change, resource constraints. | Demonstrates the broad applicability of LSS in improving manufacturing performance. | Process efficiency, quality enhancement. | Increased operational efficiency, customer satisfaction. |
| Food Processing | Achieved quality improvements in First Pass Yield (67%). | Utilize LSS to improve product quality and reduce waste. | Waste reduction, enhanced product consistency. | Limited resources for training and technology. | Highlights LSS’s role in quality control across different manufacturing sectors. | Quality control, waste reduction. | Enhanced product quality, cost savings. |
| Automotive | LSS helps minimize production costs through process optimization (63.58%). | Focus on cost-effective process improvements to maximize profitability. | Lower production costs, increased financial returns. | Integrating LSS with existing processes. | Demonstrates the financial benefits of LSS in cost-intensive industries. | Cost reduction, profitability improvement. | Increased cost efficiency, higher ROI. |
| Medical Equipment | LSS reduces cycle times and enhances compliance with quality standards (45%). | Implement LSS to improve compliance and regulatory adherence. | Meet industry standards, reduce regulatory risks. | Adapting LSS to stringent compliance requirements. | Shows LSS’s adaptability in high-regulation industries. | Compliance, regulatory adherence. | Improved compliance, operational reliability. |
| Construction | Improved operational efficiency and customer satisfaction (50%). | Use LSS to optimize project management and streamline workflows. | Increase project delivery speed, boost client satisfaction. | Coordinating LSS training across teams. | Demonstrates the versatility of LSS beyond traditional manufacturing. | Project management, workflow optimization. | Enhanced project efficiency, customer loyalty. |
| Textiles | Enhanced process flow and defect reduction (60%). | Leverage LSS to optimize supply chain and production processes. | Improved supply chain integration, higher product quality. | Difficulty in implementing process changes. | Highlights LSS’s role in supply chain and quality management. | Supply chain management, quality improvement. | Higher product quality, reduced defects. |
| Pharmaceuticals | LSS adoption boosts operational consistency and reduces waste (55%). | Focus on minimizing waste to ensure cost-effective production. | Reduce waste, improve operational consistency. | High compliance standards and training costs. | Shows LSS’s potential for driving consistency in highly regulated industries. | Waste reduction, operational consistency. | Reduced production costs, regulatory compliance. |
Table 13.
Proposed Decision-Making Framework for Implementing Lean Six Sigma (LSS).
| Industry | Step | Framework Focus | Key Features | Strategic Drivers | Expected Outcome | Ties to Proposed Study |
|---|---|---|---|---|---|---|
| Manufacturing | Step 1: Needs Analysis | Assess operational inefficiencies. | Identify areas for cycle time and defect reduction. | Process efficiency, quality enhancement. | Improved operational performance. | Reinforces focus on reducing cycle time and defects. |
| Step 2: Select Platform | Choose appropriate LSS tools. | Select tools such as DMAIC, 5S, or Kaizen. | Process improvement, waste reduction. | Optimal tool selection for targeted improvements. | Ensures tool suitability for specific process needs. | |
| Step 3: Pilot Testing | Conduct small-scale process changes. | Test LSS methodologies in a controlled environment. | Risk management, process validation. | Verified improvements before full-scale adoption. | Confirms pilot’s effectiveness in real-world settings. | |
| Step 4: Full Integration | Implement LSS across all processes. | Standardize successful pilot outcomes. | Comprehensive process optimization. | Consistent quality and reduced operational costs. | Demonstrates systematic approach to full integration. | |
| Step 5: Optimization | Refine processes based on feedback. | Monitor performance and adjust LSS practices. | Continuous improvement, data-driven decisions. | Sustained improvements and long-term efficiency. | Validates ongoing refinement for continual gains. | |
| Food Processing | Step 1: Needs Analysis | Evaluate waste and quality issues. | Focus on identifying sources of waste and defects. | Quality control, cost reduction. | Enhanced product consistency and lower waste. | Highlights LSS’s role in quality and waste management. |
| Step 2: Select Platform | Choose LSS techniques for production. | Tools like SPC and FMEA for quality improvement. | Quality enhancement, risk minimization. | Suitable tools for addressing food safety standards. | Aligns tool selection with industry-specific needs. | |
| Step 3: Pilot Testing | Apply LSS to specific production lines. | Implement on a limited scale to assess feasibility. | Safety standards, operational testing. | Measured impact on quality and safety compliance. | Demonstrates practical application in food processing. | |
| Step 4: Full Integration | Roll out LSS practices plant-wide. | Standardize improvements across all facilities. | Consistency, quality assurance. | Uniform quality and safety standards met. | Ensures scalability of LSS in large-scale operations. | |
| Step 5: Optimization | Monitor results and refine processes. | Continuously evaluate and improve LSS practices. | Continuous improvement, compliance. | Sustained product quality and cost reduction. | Reinforces ongoing process optimization practices. | |
| Automotive | Step 1: Needs Analysis | Assess production cost drivers. | Identify high-cost processes and areas for savings. | Cost efficiency, profitability improvement. | Reduced production costs and increased margins. | Demonstrates LSS’s financial benefits in cost-intensive sectors. |
| Step 2: Select Platform | Choose LSS tools targeting cost reduction. | Tools like VSM and Kaizen for process flow analysis. | Process efficiency, waste minimization. | Cost-effective solutions for optimizing production. | Ensures the alignment of tools with cost-saving goals. | |
| Step 3: Pilot Testing | Implement LSS in key departments. | Test methods in areas like assembly or quality control. | Risk management, process validation. | Verified improvements in targeted departments. | Confirms approach in reducing production costs. | |
| Step 4: Full Integration | Extend LSS practices to all departments. | Integrate successful methods organization-wide. | Comprehensive optimization, cost reduction. | Uniform reduction in production costs. | Demonstrates holistic LSS application across the industry. | |
| Step 5: Optimization | Continuous review of cost performance. | Refine processes based on cost analysis feedback. | Continuous improvement, financial sustainability. | Long-term cost efficiency and higher profitability. | Supports ongoing financial performance optimization. | |
| Medical Equipment | Step 1: Needs Analysis | Identify compliance and quality gaps. | Focus on areas with regulatory requirements. | Compliance, quality standards. | Improved adherence to regulatory guidelines. | Emphasizes LSS’s adaptability to compliance-heavy sectors. |
| Step 2: Select Platform | Select LSS tools for quality management. | Tools like 5S and Six Sigma for defect reduction. | Quality control, compliance improvement. | Suitable tools for meeting industry standards. | Aligns tools with regulatory compliance needs. | |
| Step 3: Pilot Testing | Test LSS in quality-sensitive areas. | Conduct trials in production and inspection stages. | Compliance validation, risk assessment. | Validated compliance with quality standards. | Demonstrates LSS’s role in improving regulatory adherence. | |
| Step 4: Full Integration | Standardize LSS practices organization-wide. | Implement across all quality-sensitive processes. | Comprehensive compliance, operational reliability. | Consistent adherence to quality standards. | Reinforces broad LSS implementation across regulated areas. | |
| Step 5: Optimization | Monitor compliance and quality metrics. | Continuously evaluate and refine LSS practices. | Continuous improvement, regulatory compliance. | Long-term adherence to regulatory standards. | Supports sustained compliance with ongoing process refinement. | |
| Construction | Step 1: Needs Analysis | Evaluate project management inefficiencies. | Identify delays and cost overruns in projects. | Project management, efficiency improvement. | Optimized project workflows and reduced delays. | Shows LSS’s versatility in project management contexts. |
| Step 2: Select Platform | Choose LSS tools suitable for project workflows. | Tools like Gantt charts and critical path analysis. | Workflow optimization, time management. | Effective tools for managing complex projects. | Aligns tool selection with construction project needs. | |
| Step 3: Pilot Testing | Apply LSS to small-scale projects. | Implement on selected projects to assess viability. | Risk management, feasibility testing. | Verified improvements in project management. | Confirms LSS’s impact on construction project efficiency. | |
| Step 4: Full Integration | Scale LSS practices to larger projects. | Implement across multiple sites or project phases. | Standardization, efficiency enhancement. | Uniform efficiency across all project phases. | Demonstrates scalability of LSS in large-scale projects. | |
| Step 5: Optimization | Continuously monitor project metrics. | Adjust LSS practices based on project performance. | Continuous improvement, project success. | Sustained project efficiency and client satisfaction. | Reinforces ongoing refinement for better project outcomes. |
Table 14.
Proposed Best Practices for Successful LSS Implementation.
| Industry | Best Practice | SME Type | Operational Challenge | Strategic Drivers | Expected Impact | Ties to Systematic Review Findings |
|---|---|---|---|---|---|---|
| Manufacturing | Employee Training on LSS Tools | Medium-sized Manufacturers | Resistance to adopting new methodologies | Workforce empowerment, process optimization | Increased employee engagement and skill development | Highlights need for training to reduce resistance to change. |
| Data-Driven Decision Making | Small Manufacturers | Limited data collection capabilities | Data accuracy, performance monitoring | Improved decision-making and process control | Reinforces importance of using data in LSS for accurate improvements. | |
| Regular Process Audits | Small and Medium Enterprises | Inconsistent process standards | Continuous improvement, quality assurance | Enhanced process standardization and quality control | Emphasizes need for regular monitoring and audits to maintain quality. | |
| Food Processing | Cross-Functional Team Collaboration | Medium-sized Food Processors | Coordination challenges across departments | Teamwork, operational efficiency | Improved communication and streamlined processes | Shows the benefit of teamwork in overcoming cross-departmental challenges. |
| Implementation of 5S | Small Food Processors | Inefficient workspace organization | Workplace organization, waste reduction | More organized workspaces and reduced waste levels | Aligns with systematic review findings on the importance of workspace organization. | |
| Quality Management Systems (QMS) | Small and Medium Enterprises | Difficulty maintaining consistent product quality | Quality control, compliance | Enhanced product consistency and compliance | Supports need for quality management to achieve consistent results. | |
| Automotive | Lean Awareness Programs | Small Automotive Suppliers | Lack of awareness about LSS principles | Knowledge dissemination, workforce engagement | Increased awareness and involvement in LSS initiatives | Reinforces the importance of awareness programs for successful adoption. |
| Use of Value Stream Mapping (VSM) | Medium-sized Automotive Firms | Identifying non-value-adding activities | Process optimization, cost reduction | Improved identification and elimination of waste | Demonstrates VSM’s effectiveness in optimizing production processes. | |
| Supplier Quality Development | Small and Medium Enterprises | Variability in supplier quality | Supplier collaboration, quality enhancement | Improved supplier quality and reduced variability | Ties to findings on the importance of supplier development programs. | |
| Medical Equipment | Standardization of Procedures | Medium-sized Firms | Variability in compliance requirements | Compliance, operational consistency | Consistent adherence to regulatory standards | Aligns with findings on the importance of standardizing processes in regulated industries. |
| Adoption of Statistical Process Control (SPC) | Small Medical Device Companies | Maintaining quality during scale-up | Quality assurance, process monitoring | Improved quality control during production increases | Supports systematic review recommendations for quality monitoring tools. | |
| Involvement of Regulatory Experts | Small and Medium Enterprises | Navigating complex regulatory requirements | Compliance management, risk mitigation | Enhanced ability to meet regulatory requirements | Emphasizes the role of regulatory expertise in compliance-heavy industries. | |
| Construction | Use of Gantt Charts for Project Management | Small Construction Firms | Managing project timelines and delays | Time management, project efficiency | Better management of schedules and project delivery | Demonstrates the benefit of project management tools in construction. |
| On-Site LSS Workshops | Medium-sized Construction Firms | Resistance to adopting LSS methods | Employee engagement, hands-on training | Increased adoption of LSS methods among employees | Reinforces systematic review findings on overcoming resistance through training. | |
| Integration of Digital Tools | Small and Medium Enterprises | Difficulty tracking project metrics | Digital transformation, data analytics | Enhanced tracking of project performance and outcomes | Shows importance of digital tools for monitoring progress and results. | |
| Textiles | Kaizen Events for Continuous Improvement | Small Textile Firms | High variability in production processes | Process consistency, quality improvement | Reduced variability and improved process stability | Ties to systematic review findings on Kaizen’s impact on continuous improvement. |
| Implementation of Just-in-Time (JIT) | Medium-sized Textile Companies | Excess inventory and production inefficiencies | Inventory management, cost efficiency | Reduced inventory costs and increased efficiency | Aligns with systematic review on the benefits of JIT in reducing inventory waste. | |
| Training Programs for Quality Control | Small and Medium Enterprises | Difficulty maintaining quality standards | Workforce skills development, quality management | Enhanced quality control capabilities among staff | Supports need for quality training in achieving consistent quality outcomes. | |
| Pharmaceuticals | Risk-Based Approach to Compliance | Small Pharmaceutical Firms | High regulatory compliance costs | Compliance, cost management | Reduced compliance costs through targeted risk management | Reinforces systematic review on the need for risk-based approaches in regulated sectors. |
| Use of Failure Mode and Effects Analysis (FMEA) | Medium-sized Pharmaceutical Firms | Managing potential failure points in processes | Risk mitigation, process safety | Improved identification and control of failure risks | Supports findings on the use of FMEA for risk management in pharmaceuticals. | |
| Supplier Quality Agreements | Small and Medium Enterprises | Ensuring consistent quality from suppliers | Supplier collaboration, quality assurance | Enhanced quality consistency in the supply chain | Aligns with systematic review findings on the role of supplier agreements for quality. |
Table 15.
Proposed Metrics and KPIs for Measuring Performance in Various Industries.
| Industry | Key Metrics/KPIs | Measurement Focus | Strategic Drivers | Expected Outcome | Ties to Systematic Review Findings | Priority (1 = Highest, 2 = Medium, 3 = Low) |
|---|---|---|---|---|---|---|
| Manufacturing | Cycle Time | Process Efficiency | Operational performance, time management | Reduced production times and increased throughput | Supports focus on reducing cycle times for efficiency | 1 |
| Defect Rate | Quality Improvement | Product quality, defect reduction | Lower defect rates and improved product quality | Emphasizes importance of tracking defects to ensure quality | 1 | |
| Overall Equipment Effectiveness (OEE) | Machine Utilization | Asset management, equipment reliability | Higher equipment availability and utilization | Aligns with systematic review on equipment utilization | 2 | |
| Food Processing | Waste Reduction Percentage | Resource Optimization | Cost efficiency, waste management | Lower raw material waste and reduced operational costs | Supports findings on waste reduction as a cost-saving measure | 1 |
| First Pass Yield (FPY) | Quality Control | Process quality, production consistency | Improved product consistency and reduced rework | Ties to systematic review on the importance of FPY in quality control | 1 | |
| Compliance Rate | Regulatory Adherence | Food safety, regulatory compliance | Higher adherence to food safety standards | Reinforces need for compliance metrics in food processing | 2 | |
| Automotive | Production Cost per Unit | Cost Management | Cost efficiency, profitability improvement | Reduced production costs and higher profit margins | Demonstrates importance of cost tracking for financial success | 1 |
| Customer Satisfaction Score | Customer Experience | Customer retention, product quality | Higher customer satisfaction and loyalty | Supports systematic review findings on customer satisfaction | 1 | |
| On-Time Delivery Rate | Supply Chain Efficiency | Delivery performance, logistics management | Improved delivery times and supply chain reliability | Aligns with systematic review focus on supply chain KPIs | 2 | |
| Medical Equipment | Regulatory Compliance Score | Compliance Adherence | Quality standards, risk management | Improved regulatory compliance and reduced risk | Emphasizes the importance of compliance in regulated industries | 1 |
| Process Capability Index (Cpk) | Process Stability | Quality control, process optimization | Enhanced process stability and product consistency | Aligns with findings on the use of Cpk for quality measurement | 2 | |
| Return on Assets (ROA) | Financial Performance | Asset utilization, investment efficiency | Improved financial returns on assets | Demonstrates financial benefits of LSS in asset-heavy industries | 3 | |
| Construction | Project Completion Time | Time Management | Project efficiency, on-time delivery | Reduced project delays and improved scheduling | Demonstrates relevance of time-based metrics in construction | 1 |
| Cost Variance | Budget Management | Cost control, financial planning | Improved budget adherence and reduced cost overruns | Supports findings on financial metrics in project-based industries | 1 | |
| Safety Incident Rate | Workplace Safety | Employee safety, risk management | Reduced workplace accidents and safety violations | Aligns with systematic review on safety improvements | 2 | |
| Textiles | Inventory Turnover | Inventory Management | Cost efficiency, inventory reduction | Faster inventory turnover and lower carrying costs | Supports systematic review on inventory-related metrics | 1 |
| Product Quality Index | Quality Improvement | Quality assurance, product consistency | Improved product quality and reduced returns | Reinforces importance of quality metrics in manufacturing | 1 | |
| Energy Consumption per Unit | Resource Efficiency | Sustainability, cost management | Lower energy costs and reduced environmental impact | Aligns with findings on the role of sustainability metrics | 3 | |
| Pharmaceuticals | Batch Yield Percentage | Production Efficiency | Quality control, process consistency | Higher yield rates and reduced production waste | Supports systematic review on yield improvement in manufacturing | 1 |
| Adverse Event Reporting Rate | Compliance Adherence | Regulatory requirements, risk management | Reduced adverse events and improved compliance | Aligns with findings on compliance tracking in pharmaceuticals | 1 | |
| Supplier Reliability Score | Supply Chain Management | Supplier quality, delivery performance | Improved supplier performance and reduced variability | Reinforces findings on supplier quality metrics | 2 |
Table 16.
Real Case Studies from Various Industries and Their Outcomes.
| Industry | Case Study | Implementation | Outcome |
|---|---|---|---|
| Technology | Apple - Lean Supply Chain Optimization | Applied Lean principles to its global supply chain, focusing on reducing waste and optimizing inventory. | Achieved faster production cycles, reduced inventory costs and improved supplier collaboration. |
| Technology | Microsoft - Six Sigma for Energy Efficiency | Applied Six Sigma to optimize data center energy consumption, reducing variability in processes. | Achieved a reduction in energy usage across global data centers and increased operational efficiency. |
| Semiconductors | Nvidia - Lean Manufacturing Initiative | Used Kaizen and Lean methods to reduce waste and enhance productivity in semiconductor manufacturing. | Improved production throughput and reduced defects in manufacturing processes . |
| E-commerce | Amazon - DMAIC for Delivery Optimization | Implemented DMAIC (Define, Measure, Analyze, Improve, Control) methodology to optimize delivery logistics. | Achieved an improvement in logistics efficiency and significantly reduced delivery times in the supply chain. |
| Technology | Alphabet (Google) - Process Improvement | Utilized Lean Six Sigma techniques to improve server performance and reduce data processing times. | Enhanced server efficiency, resulting in a reduction in processing times for key services. |
| Oil & Gas | Saudi Aramco - Lean Six Sigma in Operations | Applied LSS to streamline oil refinery processes and reduce downtime. | Reduced operational costs and improved production uptime in refinery operations. |
| Social Media | Meta Platforms - Lean Product Development | Applied Lean principles to accelerate product development cycles and optimize project management. | Reduced time-to-market for new features and improved team collaboration. |
| Diversified Investments | Berkshire Hathaway - Process Efficiency | Implemented process improvement strategies in manufacturing subsidiaries to enhance operational productivity. | Achieved increased efficiency in multiple subsidiaries, resulting in improvement in manufacturing output. |
| Semiconductors | TSMC - Lean in Semiconductor Manufacturing | Used Lean tools such as 5S and Value Stream Mapping to optimize wafer production processes. | Improved yield rates and reduced production cycle times. |
| Pharmaceuticals | Eli Lilly - Lean Six Sigma in R&D | Integrated Lean Six Sigma into drug development processes to accelerate timelines and reduce inefficiencies. | Reduced R&D cycle time leading to faster approval and market launch of new drugs. |
Table 17.
Proposed Roadmap for SMEs Businesses and Policy Recommendations Linked to Policy Frameworks.
Table 17.
Proposed Roadmap for SMEs Businesses and Policy Recommendations Linked to Policy Frameworks.
| Industry | Roadmap Focus | Policy Framework | Strategic Link | Strategic Drivers | Expected Outcome | Estimated Time & When to Undertake | Champion(s) | Ties to Proposed Study |
|---|---|---|---|---|---|---|---|---|
| Technology | Data-driven quality management | Industry 4.0 Digitalization | Enhances data utilization for process optimization | Continuous improvement, innovation | Improved product quality, faster development cycles | 6-12 months, start immediately | CTO, Data Analytics Team | Highlights the role of LSS in tech industry |
| Manufacturing | Waste reduction and lean operations | Lean Manufacturing Standards (ISO 9001) | Links to sustainable production practices | Resource optimization, cost efficiency | Reduced operational costs, increased productivity | 12-18 months, initiate quarterly reviews | Plant Manager, Operations Team | Reinforces systematic waste reduction |
| Pharmaceuticals | Accelerating R&D and regulatory compliance | Good Manufacturing Practice (GMP) regulations | Aligns with regulatory standards for faster approvals | Compliance, innovation | Shortened R&D timelines, faster time-to-market | 18-24 months, start with pilot projects | R&D Director, Compliance Manager | Reduces bottlenecks in pharmaceutical R&D |
| Oil & Gas | Energy efficiency and process optimization | Environmental Protection and Sustainability Policies | Aligns with environmental regulations | Cost savings, environmental compliance | Reduced energy consumption, enhanced operational efficiency | 6-12 months, phase-wise implementation | Operations Manager, Sustainability Officer | Improves compliance and operational efficiency |
| E-commerce | Enhancing logistics and supply chain management | E-commerce and Digital Logistics Regulations | Supports digital transformation in logistics | Supply chain efficiency, customer satisfaction | Faster delivery times, lower logistics costs | 12 months, continuous improvement cycles | Logistics Manager, Supply Chain Coordinator | Ties to logistical efficiency improvements |
| Semiconductors | Quality control and production optimization | Semiconductor Manufacturing International Standards | Meets industry requirements for quality assurance | Product quality, defect reduction | Lower defect rates, higher yield | 6-9 months, implement in phases | Quality Assurance Manager, Production Lead | Emphasizes quality improvements in semiconductor manufacturing |
| Social Media | Streamlining product development and feature rollouts | Digital Product Development Policies | Promotes agile methodologies for faster iterations | User engagement, product innovation | Shorter time-to-market for new features | 6-12 months, iterative cycles | Product Development Manager, Agile Teams | Supports continuous product development |
| Diversified Investments | Enhancing operational efficiency across portfolio companies | Corporate Governance and Operational Policies | Ensures consistent process improvement across subsidiaries | Risk management, resource utilization | Increased subsidiary profitability, operational consistency | 24-36 months, start with high-impact subsidiaries | Portfolio Manager, Operational Excellence Team | Integrates LSS across diversified operations |
| Oil & Gas | Safety and compliance in upstream operations | Occupational Safety and Health Standards (OSHA) | Addresses safety regulations for high-risk operations | Employee safety, regulatory compliance | Fewer incidents, improved compliance rates | 12-18 months, phased safety enhancements | HSE Manager, Safety Compliance Team | Improves safety management in oil & gas operations |
Disclaimer/Publisher’s Note: The statements, opinions and data contained in all publications are solely those of the individual author(s) and contributor(s) and not of MDPI and/or the editor(s). MDPI and/or the editor(s) disclaim responsibility for any injury to people or property resulting from any ideas, methods, instructions or products referred to in the content. |
© 2024 by the authors. Licensee MDPI, Basel, Switzerland. This article is an open access article distributed under the terms and conditions of the Creative Commons Attribution (CC BY) license (http://creativecommons.org/licenses/by/4.0/).
Copyright: This open access article is published under a Creative Commons CC BY 4.0 license, which permit the free download, distribution, and reuse, provided that the author and preprint are cited in any reuse.


