
Submitted:
25 October 2024
Posted:
25 October 2024
You are already at the latest version
Abstract
An earthquake with magnitude of Mw = 6.5–6.6 occurred on April 3, 2023 near the eastern coast of Kamchatka Peninsula (northwest of Pacific seismic belt) at a depth of H = 95 km, causing shaking with intensity of 6 points on the 12-point MSK-64 scale in the Petropavlovsk-Kamchatsky geodynamic test site, where long-term observations of groundwater pressure in wells are carried out. In wells YuZ-5, E-1, 1303, M-1, located at epicentral distances de = 67–77 km (hypocentral distances dh = 116–122 km), various changes in groundwater pressure/level were recorded: (i) oscillations due to passage of seismic waves, (ii) coseismic jumps of water pressure caused by a change in the static stress state of water-bearing rocks during the formation of rupture in the earthquake source (coseismic effects); (iii) post-seismic effects. In the well E-1, within 93 days before earthquake, a hydrogeodynamic precursor was recording as a lowering in water level/pressure at increased rate. Using this precursor, identified in real time, a forecast conclusion on the strong earthquake possibility was submitted in advance to the Kamchatka branch of the Russian Expert Council for Earthquake Forecasting. The earthquake that occurred was consistent with the forecast in magnitude, time, and location. Seismo-hydrogeodynamic effects in water pressure/level changes recorded in wells YuZ-5 and E-1 corresponded to the previously created typifications of such phenomena for these wells. The issues of creation and verification of seismo-hydrogeodynamic effect typifications for individual observation wells for predicting strong earthquakes and studying the influence of seismicity on groundwater are discussing.
Keywords:
well
; groundwater pressure
; earthquake
; seismo-hydrogeodynamic effects typification
; earthquake forecast
; Kamchatka Peninsula
1. Introduction
For decades, the geosciences have been interested in studying the impact of earthquakes on the natural environment, including groundwater. Variety of phenomena observed in pressure, level, discharge, temperature and hydrogeochemistry changes of underground water during strong earthquakes does not yet have an exhaustive explanation. Of particular interest is the experimental study the influence of strong earthquake preparations on groundwater based on data from long-term precision observations in wells [1,2].
When a strong earthquake occurs near the area of precision observations of groundwater parameters in wells, a unique opportunity arises for a detailed study of the seismicity impact on groundwater. To study such phenomena, it is preferable to use observations in deep wells, the regime of which is formed in absence of technogenic influence [3]. If this condition is met, each strong earthquake, together with reliably diagnosed changes in groundwater parameters, both preceding the earthquake and associated with its implementation, represent valuable scientific facts that form the basis for studying the influence of seismicity on underground aquifers and the possibility of using hydrogeological precursors for forecasting strong earthquakes. However, the combination of near disposition of the strong earthquake source to observation wells at distances comparable to the size of earthquake source is very rare. When such situations arise, the obtained data from recording groundwater parameters and identified seismo-hydrogeological effects over a wide range of periods are of scientific and practical interest.
The paper examines changes in groundwater pressure in observation wells located in the east of Kamchatka Peninsula (Figure 1) during the earthquake with magnitude Mw = 6.6 that occurred on April 3, 2023 (hereinafter EQ), at the epicentral distances de = 67–77 km (hypocentral distances dh = 116–122 km). During this earthquake, digital equipment was used at the wells for precision recording of water pressure/level [7,8], which allows diagnosing seismo-hydrogeodynamic effects (SHGE) in the frequency range from 1 Hz to hours, days and tens of days.
The work provides a description of the recorded effects in water pressure/level changes in observation wells due to EQ and compares the identified SHGE in wells E-1 and YuZ-5 with previously created typifications of such effects in these wells based on observation data for more than twenty-five years.

| Wells |
Barometric Efficiency, Eb, | Tidal Sensitivity, AV*, hPa/10−9 |
Skempton’s Coefficient, B |
Specific Elastic Capacity, SS, m−1×10⁻⁷ |
Porosity, φ |
Transmi-ssivity, Т, m2/day |
Hydraulic Conductivity, m/с |
|---|---|---|---|---|---|---|---|
| YuZ-5 | 0.40 | 0.161 | 0.67 | 16.9 | 0.11 | 7.8 | 9⋅10−7 |
| E-1 | 0.1 | 0.015 | 0.09 | 2.9 | 0.05 | 0.005 | 3.2⋅10−9 |
| 1303 | 0.43 | 0.215 | 0.64 | 10.3 | 0.07 | 0.32 | 3.7⋅10−8 |
Notes: * AV is tidal sensitivity of water pressure with respect to the theoretical volumetric strain.
Wells and Observations
Kamchatka Peninsula is located in the northwestern part of Pacific seismic belt at the Pacific oceanic plate with the continental Eurasian and North American plates junction. Here, seismic activity reaches the maximum level on Earth and strong earthquakes with magnitudes up to 8–9 occur with recurrence rate of the first hundreds of years [10,11]. Here, on the Petropavlovsk-Kamchatsky geodynamic test site (Figure 1a), precision observations of groundwater pressure are carried out in four deep wells in order to study seismo-hydrogeodynamic phenomena [12]. Observations carried out by the Kamchatka branch of the Geophysical Survey of the Russian Academy of Sciences (KB GS RAS). Geological and hydrogeological environment of the wells location area (Figure 1b) is given in [8].
Table 3.
Earthquake data (https://www.globalcmt.org; https://earthquake.usgs.gov; https://glob.emsd.ru (accessed on 20 January 2024)).
Table 3.
Earthquake data (https://www.globalcmt.org; https://earthquake.usgs.gov; https://glob.emsd.ru (accessed on 20 January 2024)).
| EQ Date |
EQ Time |
EQ Hypocenter Coordinates |
Mw | Earthquake Source Mechanism According to CMT https://www.globalcmt.org (accessed on 20 January 2024) |
Earthquake Source Dimensions**** |
Movement Along the Rupture***** U, m |
||||||
|---|---|---|---|---|---|---|---|---|---|---|---|---|
| N, (°) |
E, (°) |
H, km |
Scalar Seismic Moment M0, N×m×1020 |
Strike, (°) |
Dip, (°) |
Rake, (°) |
W, m |
L, m |
||||
| 03.04.2023 | 03:06:59 | 52.58 | 158.76 | 95 | 6.6* 6.5** 6.6*** |
0.1 | 215(104) | 86(10) | 80(159) | 15798 | 41210 | 0.46 |
Notes: * Magnitude of the earthquake according to the catalog https://www.globalcmt.org (accessed on 20 January 2024). ** Magnitude of the earthquake according to the catalog https://earthquake.usgs.gov (accessed on 20 January 2024). *** Magnitude of the earthquake according to the catalog https://glob.emsd.ru (accessed on 20 January 2024). **** L, length along the strike, and W, width along the dip, were estimated from magnitude Mw = 6.6 according to the following formulas: lgL = 0.440Mw–1.289 and lgW = 0.401Mw–1.448 [13]. ***** The amount of movement along the rupture U was found from scalar seismic moment M0, in U = M0/S × μ, where S = L × W is the rupture area, and μ = 30 × 109 N/m2 is the shear modulus of elastic medium.
Wells data are presented in Table 1 and Table 2 and Figure 2. The YuZ-5, E-1 and 1303 wells are piezometric with the water level at depths of 1.5–27 m below the earth’s surface. The M-1 well is self-flowing with a water flow rate of 1.5 L/s.
Equipment used to record water pressure in wells is presented in the work [7]. All wells are equipped with precision sensors for groundwater pressure/level and atmospheric pressure, providing an accuracy of ±0.1 hPa. Registration of water pressure in well YuZ-5 is carried out with frequency of 20 Hz and 1 Hz, in wells 1303 and M-1 – with frequency of 1 Hz. Atmospheric pressure is measured at frequency of 1 Hz.
The wells open up pressure aquifers in the areas of casing perforation at depths of 310-1100 m. The exposed water-bearing rocks are presented by tuffaceous-sedimentary rocks of Neogene age and terrigenous metamorphosed deposits of Late Cretaceous age with predominantly fracture permeability. These aquifers are characterized by static confined conditions [9,14,15]. For such conditions, there is a direct connection between changes in water pressure and deformation of water-bearing rocks in a range of periods from minutes to hours–days, which is controlled by the elastic parameters of aquifer. The presence of static confined conditions in the “well–water-bearing rock” system is evidenced by the results of barometric and tidal analysis of the water level variations in piezometric wells (Table 2).
Analysis of the relationship between the water pressure with atmospheric pressure and theoretical earth tide variations showed a weak barometric response and no tidal response of groundwater pressure in self-flowing well M-1. We believe that this is caused by the dissipation of barometric and tidal signals in water pressure changes at the wellbore perforation depths by the free flow of water from the well. At the same time, the depth opening of water-bearing rocks of 310−556 m, the constancy of underground water pressure and discharge, as well as the stability in chemical composition of underground water throughout the year, allow us to accept static confined conditions for the well M-1.
The duration of continuous observations of water level/pressure variations using digital equipment in individual wells varies from 28 to approximately 3 years (Table 1). Previously, in the 80−90s of the 20th century, mechanical float recorders and digital equipment with a measurement frequency of 5−10 minutes were used to record changes in the water level in piezometric wells.
Well E-1. In this well the total duration of water level/pressure observations is more than 37 years. In 1987−1995, observations were made using mechanical water level recorders. Digital measurements have been carried out since 1996 to the present day [7,16,17].
During the earthquake on April 3, a set of equipment was operating at the E-1 well to measure the water level and atmospheric pressure with frequency of 5 minutes [17], as well as a set of equipment to measure the pressure, temperature and electrical conductivity of water at depth of 6 m below the water level with frequency of once every 2 minutes (0.008 Hz) [7]. Examples of the SHGE recording in this well, including hydrogeodynamic precursors in form of a decrease in water level at increased rate before local earthquakes with M = 5.0−7.8 and postseismic water increases after earthquakes with M = 5.6−7.8 are presented in the above publications, as well as in the works [18,19].
Well YuZ-5. In the well YuZ-5, water level/pressure observations have been carried out since September 1997 (27 years). The results of observations, including a description of various types of seismo-hydrogeodynamic effects, are presented in [8].
In this well, three main types of SHGE were identified: (i) supposed hydrogeodynamic precursors before two strongest earthquakes, manifested in a violation of the seasonal change in hydrostatic head during the first tens of days; (ii) coseismic jumps in water pressure due to changes in the static stress state of water-bearing rocks during the rupturing in the sources of local earthquakes; (iii) vibration effects of seismic waves in water pressure changes lasting from minutes to tens of days, the morphological features of which are determined by the amplitude-frequency composition of seismic waves from earthquakes recorded at the nearest PET seismic station [18].
Wells 1303 and M-1. The precision observations of pressure variations in these wells are relatively short and amounts to 3.6 and 2.8 years. Previously, here observations were carried out using simplified methods.
Since 1984, the KB GS RAS has been conducting observations on the discharge rate, temperature and chemical composition of water at the self-flowing well M-1 with a frequency of 3−6 days [3,20]. In this well, abnormal changes in the chemical composition of water were recorded, including hydrogeochemical precursors to strong earthquakes with Mw = 6.5–7.5, which occurred at epicentral distances of 100−230 km., [3,21,22].
In the well M-1, according to precision observation with a frequency of 1 Hz from 2020−2024, water pressure fluctuations with amplitudes of 0.1−0.2 hPa for 10−20 minutes during the passage of surface seismic waves from five strong distant earthquakes (Mw = 7.4−8.2, de = 2600−9800 km) occurred in Alaska, Turkey, Japan and Taiwan were recorded.
At the well 1303, since the beginning of the 21st century, observations carried out on changes in the water level using mechanical float recorders and digital equipment by organizations of the Ministry of Natural Resources of the Russian Federation. The frequency of water level and atmospheric pressure measurements was 1 hour. The results of processing individual fragments of such observations are presented in the paper [23]. According to 10−minute measurements, a postseismic rise in the water level was recorded after the Olyutor earthquake of 20.04.2006, Mw = 7.6 in the north of Kamchatka, which occurred at a distance of 1040 km from the well. The amplitude of water level rise was 0.35 cm within 30 minutes [24].
After installing precision equipment for recording water pressure with a frequency of 1 Hz, pressure fluctuations with maximum amplitudes of 0.1−0.3 hPa were recorded in well 1303 during the passage of surface seismic waves from six strong (Mw = 7.4−8.2) distant (de = 4500−9800 km) earthquakes in Alaska, Japan, Turkey, the New Hebrides Islands and Taiwan. The duration of such pressure fluctuations was 10−40 minutes.
The differences in duration and detail of water level/pressure observations determine the knowledge about the seismo-hydrogeodynamic effect manifestations in individual wells. Time series of precision observations lasting several decades were obtained for wells E-1 and YuZ-5 (Table 1). During such long time intervals, numerous earthquakes occurred in a wide range of magnitudes at different epicentral distances to the wells. These earthquakes were accompanied by seismo-hydrogeodynamic effects that differed in morphology and duration, as well as in time relative to the moments of earthquakes. The presence of multiple earthquakes and corresponding seismo-hydrogeodynamic effect manifestations makes it possible to generalize such data for individual wells in the diagrams showing the dependence of the seismo-hydrogeodynamic effect manifestations of various morphologies and durations on the earthquake parameters − the ratio of their magnitudes and epicentral distances, density of seismic energy in wave in area of the well [25] and the ratio between the epicentral distances of the well and linear size of the sources [19].
The paper considers seismo-hydrogeodynamic effects in water pressure changes in wells E-1 and YuZ-5 during the earthquake of April 3, 2023 (Figure 1a, Table 2) in comparison with previously created typifications of SHGE for these wells. The main goal of the work is to verify previously created typifications of seismo-hydrogeodynamic effects using data on the earthquake of April 3, 2023.
3 April 2023 Earthquake, Mw=6.6
The earthquake of April 3, 2023 (hereinafter EQ) (Figure 1a, Table 3) was one of the strongest seismic events in the Petropavlovsk-Kamchatsky test site area during the period of precision observations in wells. The wells are located at epicentral distance de = 67–77 km (hypocentral distance dh = 116–122 km). In the wells’ area macroseismic intensity of shaking was 6 points on the 12-point MSK-64 scale [26].
At the PET seismic station, located at a distance of 23-30 km from the wells (Figure 1), the arrival of body P-waves was recorded at 03:07:12, S-waves − at 03:07:24 (Figure 3). Surface waves were not detected in the seismic record of the EQ.
Figure 4 shows the distribution of coseismic volumetric strain during EQ at depth of 500 m, corresponding to the average depth of open part of the wellbores of wells YuZ-5 and 1303. The calculations used a model of dislocation source of displacement in homogeneous elastic half-space [27] with the parameters of the EQ mechanism (Table 3). In the area of wells, the expansion calculated value of water-bearing rocks was 2.3 × 10⁻⁸.
2. Seismo-Hydrogeodynamic Effects
The study of seismo-hydrogeodynamic effects in groundwater pressure changes in Kamchatka wells has shown that they can manifest themselves in a wide range of periods – from seconds to hours and days−tens of days. Such different SHGE manifestations over time correspond to observations at wells in other regions during strong earthquakes [1,2,28,29,30,31,32,33,34]. It should be noted also the detail of the SHGE study, especially high-frequency variations in water pressure due to passage of seismic waves, is determined by the frequency of pressure measurements in the observation well.
Typically, the frequency of groundwater level/pressure recording is 1 hour or 1 minute. With hourly measurements, it is not possible to study high-frequency variations in groundwater pressure. With minute’s measurements can only state the fact of high-frequency pressure variations during the passage of seismic waves, but it is impossible to consider them in detail with accurate estimates of amplitudes and frequency content [18,35].
Much less frequently, the periodicity of recording the water level/pressure in wells is 1 s (frequency 1 Hz), and only in rare examples did the recording frequency amount to the first tens of Hz [33]. In such cases, the records of water pressure oscillations and subsequent postseismic changes can be obtained, the features of which are explained by the generation of a complex of hydrogeodynamic processes in the well-aquifer system determined by the local natural conditions, as well as differences in structure of wells [36]. This is consistent with the authors opinion that each observation well is a unique object for recording and subsequent study of seismo-hydrogeodynamic effects of earthquakes in groundwater pressure variations both in the high-frequency domain with periods of seconds-minutes and in the relatively low-frequency hourly-daily range [18].
Using equipment installed in observation wells in Kamchatka, water pressure records were obtained with frequency of 20 Hz and 1 Hz in well YuZ-5 and with frequency of 1 Hz in wells 1303 and M-1. Below, pressure records with a frequency of 1 Hz will be considered for all three of these wells.
In the well E-1, the water level/pressure measurement frequency was 2 minutes or 0.008 Hz. This well is characterized by sensitivity to the preparation of strong local earthquakes and is used mainly to identify hydrogeodynamic precursors in groundwater pressure changes in the daily range of periods.
For the convenience of describing individual types of SHGE during EQ, their entire set was divided into:
(i) “high-frequency effects” caused by the dynamic impact of seismic waves and change in the static stress state of water-bearing rocks, including short-term disruption of quasi-stationary filtration of underground water near the wellbore lasting from minutes to hours;
(ii) “low-frequency effects” during the preparation of EQ and relaxation of the disturbed state of the well-aquifer system at the post-seismic stage lasting for a day or tens of days.
The identification of “high-frequency effects” was carried out using fragments of the initial pressure records in wells YuZ-5, 1303 and M-1 with a frequency of 1 Hz, including the arrival time of seismic waves at the PET seismic station (Figure 1 and Figure 3).
The identification of “low-frequency effects” in water pressure changes in wells YuZ-5 and E-1 was carried out using time series of hourly average data obtained by averaging the initial pressure records with a frequency of 1 Hz and 0.008 Hz in a time window of 1 hour. In the obtained hourly average data series of water level/pressure recording, compensation for barometric and tidal variations was carried out in accordance with the algorithm described in [8,37].
2.1. High-Frequency Records of Underground Water Pressure Variations
Figure 5a shows the records of water pressure with a frequency of 1 Hz in wells YuZ-5, 1303 and M-1 for five hours, including the moment of the EQ. Figure 5b shows the pressure variations in more detail over two minutes in comparison with the seismic record on the vertical channel of the PET seismic station.
High-frequency pressure variations were recorded in all of these wells, which occurred during the arrival of body P and S waves. The maximum amplitudes of such variations were 3–4 hPa in the piezometric wells YuZ-5 and 1303. In the flowing well M-1, the amplitude of pressure variations was 6 hPa. Such high-frequency pressure records were caused predominantly by vertical displacements of the wellbores during the passage of seismic body waves [38].
In the pressure records in wells YuZ-5 and 1303, coseismic effects (cse) in form of pressure drops with amplitudes Δhcse = −1.6 hPa and Δhcse = −1.5 hPa (Figure 5b)) were identified, which estimated as the difference between average pressure values during P and S-waves passages [8].
In the pressure records in well M-1 (Figure 5b, lower panel), the coseismic effect was not evident, apparently due to dissipation of the coseismic response of groundwater pressure in the aquifer by free flow of water in wellbore.
In well YuZ-5, the increase in water pressure with amplitude of Δh = 0.35 hPa was recorded for 50 minutes after the end of pressure fluctuations under the influence of seismic waves (Figure 5a, upper panel). The most likely cause of this effect is the influx of water into the wellbore during short-term nonlinear filtration of underground water near the wellbore during the passage of seismic waves. Previously, a similar short-term increasing water pressure in this well was observed during some strong earthquakes [8,39].
In well 1303, after the end of high-frequency pressure oscillations, a decrease in water pressure with amplitude of Δh = 4 hPa for forty minutes was observed (Figure 5a, middle panel). Such a relatively short-term postseismic effect, as well as a coseismic pressure jump, were recorded in this well for the first time.
In 2-minute records of pressure, temperature and electrical conductivity of water in well E-1, a decrease in pressure with amplitude of 12 hPa and an increase in electrical conductivity of water with amplitude of 9 μS/cm were detected during the time from 3 h 6 min to 3 h 10 min. An increase in water temperature of 0.01° C over 3 hours was also recorded. Such short-term effects in changes in groundwater parameters could have been caused by movements of the wellbore and the water column in it during seismic shaking, which were apparently accompanied by a decrease in the height of the water column above the sensor and mixing of water in the wellbore due to a slight upward displacement of the warmer and mineralized layer of water.
2.1.1. Coseismic Effects in Water Pressure Changes
Previously, in the works of authors [8,35], it was convincingly shown that the amplitudes and direction of coseismic changes in water pressure in the well YuZ-5 are in agreement with theoretical estimates of coseismic deformation in the well area (D2) in accordance with the dislocation model [27] with the parameters of earthquake focal mechanisms.
The values of the coseismic deformation in the well area (D1) were estimated based on the amplitudes of water level/pressure changes Δhcse (Figure 5b), with use of the value tidal sensitivity Av (Table 2) as a coefficient normalizing the amplitudes of pressure jumps. The sign of deformation was assessed by the directions of the water level/pressure change: volumetric compression of water-bearing rocks with an increase and volumetric expansion with a decrease of water level/pressure. In see Table 3, Figure 10, 11 in [8], D1 values, calculated for 14 earthquakes, are compared with the theoretical estimates of coseismic strain D2 according to the dislocation model [27] with parameters of earthquake sources for the observation period from 1997 to 2020.
The amplitudes of water pressure decrease during EQ correspond to the volumetric coseismic expansion in the well area D1(YuZ-5) = −Δhcse(YuZ-5)/Av(YuZ-5) = 1 × 10⁻⁸ и D1(1303) = −Δhcse(1303)/Av(1303) = 0.7 × 10⁻⁸ , where Av is the tidal sensitivity 0.161 hPa/10−9 volumetric deformation in well YuZ-5 and 0.215 hPa/10−9 in well 1303 (Table 2).
The values D1(1303) = 0.7 × 10⁻⁸ and D1(YuZ-5) = 1 × 10⁻⁸ agree with each other and with the theoretical estimate of coseismic volumetric deformation in the wells area D2 = 2.3 × 10⁻⁸ (Figure 4) in sign (expansion) and in amplitudes within the same order of magnitudes.
Figure 6a,b show the distribution of 14 earthquakes (see Table 3 in [8]), which were accompanied by coseismic jumps in water level/pressure changes with amplitudes Δhcse ≥ 0.2 cm (hPa), depending on magnitudes and distances of the earthquakes from the YuZ-5 well. Here the red star shows the EQ data.
Despite the fact that EQ occurred at the minimum epicentral distance from the well YuZ-5 (Figure 6a), its manifestation corresponds to the general pattern of the coseismic jumps manifestations in this well depending on the earthquake parameters: Mw ≥ 0.004de + 5.0 and Mw ≥ 0.004dh + 5.0 (here de is the epicentral distance; dh is the hypocentral distance in km).
The coseismic effect during EQ approximately correspond to the parameters of the coseismic effects during the earthquakes of 01.06.1998, Mw = 6.4 (Δhcse = −1.0 см, D1 = 0.6 × 10⁻⁸, D2 = 0.6 × 10⁻⁸) and 08.03.1999, Mw = 6.9 (Δhcse = −1.7 см, D1 = 1.1 × 10⁻⁸, D2 = 3.1 × 10⁻⁸) (see Table 3 in [8]). These two earthquakes occurred relatively close to the EQ focal region and had similar magnitudes and focal mechanism parameters.
Figure 6c shows the D1 and D2 values relationship for all 15 earthquakes accompanied by coseismic jumps with amplitudes of ≥0.2 cm (hPa). The values of coseismic deformation D1 and D2 obtained by two methods are uniformly distributed with respect to the direct connection line. Such distribution of the deformation values indicates the absence of systematic errors in their determination using each of the methods. A consideration of possible errors in the estimates of coseismic deformation D2 on the model of dislocation source and D1 on the data of water level observations is given in [35].
2.2. Average Hourly Variations of Water Pressure in Well YuZ-5
Average hourly data from water level/pressure recording in wells are used to study tidal and barometric responses of groundwater, as well as changes in the permeability of water-bearing rocks during the preparation and implementation stages of earthquakes [40]. Such hourly average data with compensated tidal and barometric variations are also used to diagnose hydrogeodynamic precursors and postseismic effects in the behavior of water level/pressure trends [8,9,16,18,35,37,39,41].
Figure 7 shows the water pressure changes in the well YuZ-5 with compensated barometric and tidal variations in comparison with the behavior of the annual seasonal function in hydrostatic head changes in the well area. The description of the seasonal function construction is given in the work [8].
After the end of short-term co- and postseismic variations in water pressure (see Section 2.1, Figure 5), a pressure decrease with amplitude of about 30 hPa was observed for two months (Figure 7b, upper panel). Taking into account the seasonal trend, the amplitude of the postseismic pressure lowering was 24 hPa (Figure 7b, lower panel).
Previously, long-term postseismic decreases in water pressure were observed after three of the strongest seismic events: 05.12.1997, Mw = 7.8, de = 200 km; 28.02.2013, Mw = 6.9, de = 280 km and 30.01.2016, Mw = 7.2, de = 80 km. Such decreases in water level/pressure after earthquakes accompanied by tremor with an intensity of 4−6 points on the MSK-64 scale were identified as type IV vibration effects of seismic waves [8,18].
The most probable mechanism for the postseismic water level lowering in well YuZ-5 is a drop in head pressure in the aquifer due to local increase in the water-bearing rock permeability as a result of intense seismic shaking [18,39,41].
The decrease in water level in a well can be described by a mathematical model of a remote head pressure drop source [42]:
where x is the water level in the well, x0 is the initial water level in the well, Δh = Δp/ρg is the change in pressure head in the well when changing water pressure in the aquifer Δp, ρ is the density of water, g is the acceleration of gravity, R is the distance from the source of the pressure head drop to the well, a is the hydraulic diffusivity, t is the time.
x = x0 − Δh × erfc(R/√(4 × a × t)),
The calculation according to (1) shows satisfactory agreement between the calculated function of water pressure decrease in the well (red line in Figure 7b, bottom panel) and the development of postseismic pressure decrease after EQ at values of the amplitude of water pressure decrease Δh = 0.24 m, hydraulic diffusivity coefficient a = 0.25 m2/s and distance to the source of head pressure drop in the aquifer R = 450 m.
The results of calculations of the water level drop according to (1) after all four strong earthquakes, including EQ, agree in determining the distance to the source of the hydrostatic head pressure drop. In all four cases, these values were the same R = 450 m. This allows us to assume that at a distance of 450 m from the well YuZ-5 there is an object whose permeability can increase sharply during seismic tremors with an intensity of ≥4–5 points on the MSK-64 scale. We believe that such an object is a zone of concentrated tectonic fracturing in the Late Cretaceous metamorphosed volcanogenic-sedimentary rocks, which controls the structure of the Avacha river valley and is covered by modern sedimentary deposits (Figure 1b). An increase in the permeability of such a zone during seismic shocks may be accompanied by a short-term decrease in groundwater pressure in the Late Cretaceous rocks in the well area.
During the 2.5 months before the EQ, increased values of water pressure were recorded in the well YuZ-5, exceeding the seasonal pressure by ≈10 hPa (Figure 7b, upper panel). The most noticeable increase in water pressure occurred from mid-January to mid-February 2023 (Figure 7b, bottom panel). We assume that such excessive increase in groundwater pressure in relation to the average seasonal head pressure could be a manifestation of the EQ hydrogeodynamic precursor. Previously, the supposed hydrogeodynamic precursors were identified by a significant deviation of the water pressure values from the average long-term head pressure function in the well YuZ-5 before the Kronotsky (KE) earthquake on December 5, 1997, Mw = 7.8 [43] and before the Zhupanovsky earthquake (ZhE) on January 30, 2016, Mw = 7.2 [39].
KE and ZhE earthquakes were the strongest seismic events for the entire observation period at well YuZ-5. These earthquakes were also preceded by various precursors in the form of foreshocks, movements of GPS stations, changes in the chemical composition of groundwater, etc.
In the case of KE, the preceded decreasing in water pressure was Δh = 11 cm of water column for ≈20 days. Before the ZhE, the excess of water pressure relative to its seasonal position was approximately Δh = 30 cm over 90 days.
Based on the assumption the leading mechanism of water pressure change is due to quasi-elastic deformation of water-bearing rocks near the wellbore, the amplitudes of volumetric deformation before KE were estimated: D(KE) = Δh/Av = 11 cm/0.161 cm/10−9 = 68 × 10−9 ≈ 0.7 × 10⁻⁷ (expansion) and before ZhE D(ZhE) = −30 cm/0.161 cm/10−9 = −186.3 × 10⁻⁹ ≈ −1.9 × 10⁻⁷ (compression). Before EQ, the value of volumetric deformation could amount to D(EQ) = −10.2 cm/0.161 cm/10−9 = −63.4 × 10⁻⁹ ≈ −0.6 × 10⁻⁷ (compression).
The given values of volumetric deformations of water-bearing rocks in the area of well YuZ-5 during the preparation of three strong earthquakes are hypothetical and approximate due to the evaluative nature of the quasi-elastic response of water pressure in the well.
2.3. Average Daily Variations in Water Pressure in Well E-1
The well E-1 opens up brackish groundwater in Neogene tuffs in the depth range of 625−648 m (Figure 1 and Figure 2, Table 1) in a hydrodynamic zone of weak water exchange. Such conditions are indicated of the absence of annual seasonality in water level changes, as well as increased mineralization of underground water and the methane-nitrogen composition of the dissolved gas. A characteristic feature of the water level changes are the increases and decreases lasting 3−6 years with amplitudes from the first tens of cm to 1.5 m with an average rate of ≤0.1 cm/day. Against the backdrop of such trends, weak barometric variations in water levels and changes associated with strong earthquakes appear [9,16].
During the EQ, two sets of equipment were operating at well E-1, measuring the water level every 5 minutes and the water pressure at a depth of 6 m below the water level every 2 minutes [7].
The works [3,9,19,44] describe a hydrogeodynamic precursor (HGP), which manifests itself in decreases in water level/pressure at an increased rate during the days to weeks before earthquakes with Mw ≥ 5.0 at epicentral distances of up to 350 km. HGP appeared before earthquakes with M = 5.0−6.3 in 50% of cases, and in 100% of cases it appeared before earthquakes with M = 6.4–7.8 [3]. Figure 8 shows a diagram of the diurnal rate of water level variations during the HGP.
The regular recurrence of HGP before earthquakes with Mw ≥ 5.0 at epicentral distances de ≤ 350 km (more than 70% of such earthquake cases), as well as the improvement of the statistical relationship of the HGP manifestations with subsequent earthquakes with an increase in their magnitude, made it possible to use HGP for medium-term (days−weeks) assessment of the time of local strong earthquake occurrences [3,9,16,19].
Since 2002, an experiment has been conducted on the use of the HGP to predict earthquakes in real time by submitting forecasts to the Kamchatka branch of the Russian Expert Council for Earthquake Forecasting and Seismic Hazard and Risk Assessment (KB REC). According to the KB REC conclusions, successful predictions of the location, time and magnitude were made according to observations in well E-1 for nine earthquakes with Mw = 5.6–7.2, as well as for the earthquake on April 3, 2023.
Figure 9 shows the synchronous changes in water level and pressure recorded by two sets of equipment during the EQ period, including the HGP occurrence and postseismic level/pressure rise within two months after the EQ. The hydrogeodynamic precursor manifested itself for 92 days before the EQ, starting from January 1, 2024 (Figure 9aB,aD,bB,bD).
The amplitude of the water level decrease was − 4.2 cm with an average daily rate of −0.00 to −0.30 cm/day, the amplitude of the water pressure decrease at a depth of 6 m below water level was − 3.5 hPa with an average daily rate of −0.00 to −0.23 hPa/day.
Previously, HGP in water level/pressure changes in the E-1 well was recorded in real time before the earthquakes of 28.02.2013, Mw = 6.9, de = 280 km; 30.01.2016, Mw = 7.2, de = 80 km; 16.03.2021, Mw = 6.6, de = 350 km and before some other seismic events [3,7,8,19,39].
The postseismic increase in water level and water pressure with amplitudes of 7.9 cm and 9.5 hPa and their subsequent stabilization continued for 1.5−2 months (Figure 9aA,aC,bA,bC).
The most probable mechanism for the occurrence of HGP during the preparation of local strong earthquakes, including EQ, is the increase in the fracture-pore capacity of water-bearing rocks in the area of the well filter and the outflow of water from the wellbore into the rocks around the wellbore. Such process is possible during the development of fracture dilatancy in low-porosity water-bearing rocks (Table 2) over time interval of a day to tens of days before earthquakes. Previously, the determining role of fracture dilatancy in the formation of hydrogeochemical precursors in the composition of thermo-mineral waters from self-flowing wells on the territory of Petropavlovsk-Kamchatsky geodynamic test site was indicated in works [22,45].
The post-seismic increase in water level after strong earthquakes, including the EQ, could have been caused by the influx of water into the wellbore from water-bearing rocks, as well as due to a decrease in the density of water in the wellbore with increase in the proportion of free methane-nitrogen gas in water in wellbore, caused by intense seismic shaking.
Water pressure changes in well E-1 in the case of EQ corresponded to the such groundwater pressure changes during local strong (Mw ≥ 6.6) earthquakes at epicentral distances up to 300 km.
3. Discussion
3.1. Typification of Seismo-Hydrogeodynamic Effects in Wells YuZ-5 and E-1
The diversity of seismo-hydrogeodynamic effect manifestations in individual wells during strong earthquakes is determined by the differences in the technical structure of wells as well as natural conditions for the groundwater formation together with the individual responses of groundwater pressure changes to the influence of meteorological and man-made factors. With such basic prerequisites for conducting well observations, a promising direction for solving the problem of the diversity of seismo-hydrogeodynamic effects is the empirical method of their typifications for individual wells.
The main genetic types of SHGEs are (i) hydrogeodynamic precursors that appear at the stage of earthquake preparation (HGP); (ii) coseismic pressure jumps with changes in the static stress state of water-bearing rocks during the formation of ruptures in earthquake source (coseismic effects CSE_1) and under the influence of seismic waves (coseismic effects CSE_2); (iii) post-seismic effects (PSE) during changes and subsequent restoration of the state of the “well – aquifer” system after seismic impact. The sequence of the SHGE genetic types manifestation in groundwater pressure changes HGP → CSE → PSE reflects the staging of seismic influence on the state of “well – aquifer” system during strong earthquakes and is manifested in the wells of Kamchatka most clearly during strong (Mw ≥ 6.6) local earthquakes, accompanied by tremors with an intensity of at least 4–6 points on the MSK-64 scale [8].
The seismo-hydrogeodynamic effects of the April 3, 2023 earthquake, recorded in the two most studied wells in Kamchatka, can be used to verify the previously proposed SHGE typifications for these wells [3,8,19].
Figure 10 shows the diagrams of different types of SHGE distribution diagnosed over the entire observation period in well YuZ-5 (Figure 10a) and well E-1 (Figure 10b), in comparison with the SHGEs caused by the EQ presented above in Section 2.
Figure 10.
Distribution of various types of seismo-hydrogeodynamic effects in water level/pressure changes as functions of magnitude Mw, epicentral distance of earthquakes de and seismic energy density e. One, five and ten maximum linear sizes of earthquake sources as a function of magnitude Mw are shown as 1L, 5L and 10L. (a) In the YuZ-5 well, according to data from 1997–2023: 1—supposed hydrogeodynamic precursor (EQ highlighted with a red thick contour line), 2—coseismic jumps, 3–6—vibration effects of seismic waves according to data from 2003–2023: 3—type I vibration impact of seismic waves in water level/pressure, 4—type II, 5—type III, 6—type IV [8,18]. (b) In the E-1 well according to data from 1987–2023: 1—precursor revealed in real time, with a conclusion on a potential earthquake for KB REC, 2013–2023 (EQ highlighted with a red thick contour line); 2—precursors before M ≥ 5, de ≤ 350 km earthquakes revealed retrospectively, 1987–2023; 3—no precursors manifested before M ≥ 5, de ≤ 350 km earthquakes, 1996–2023; 4—post-seismic rise in water level.
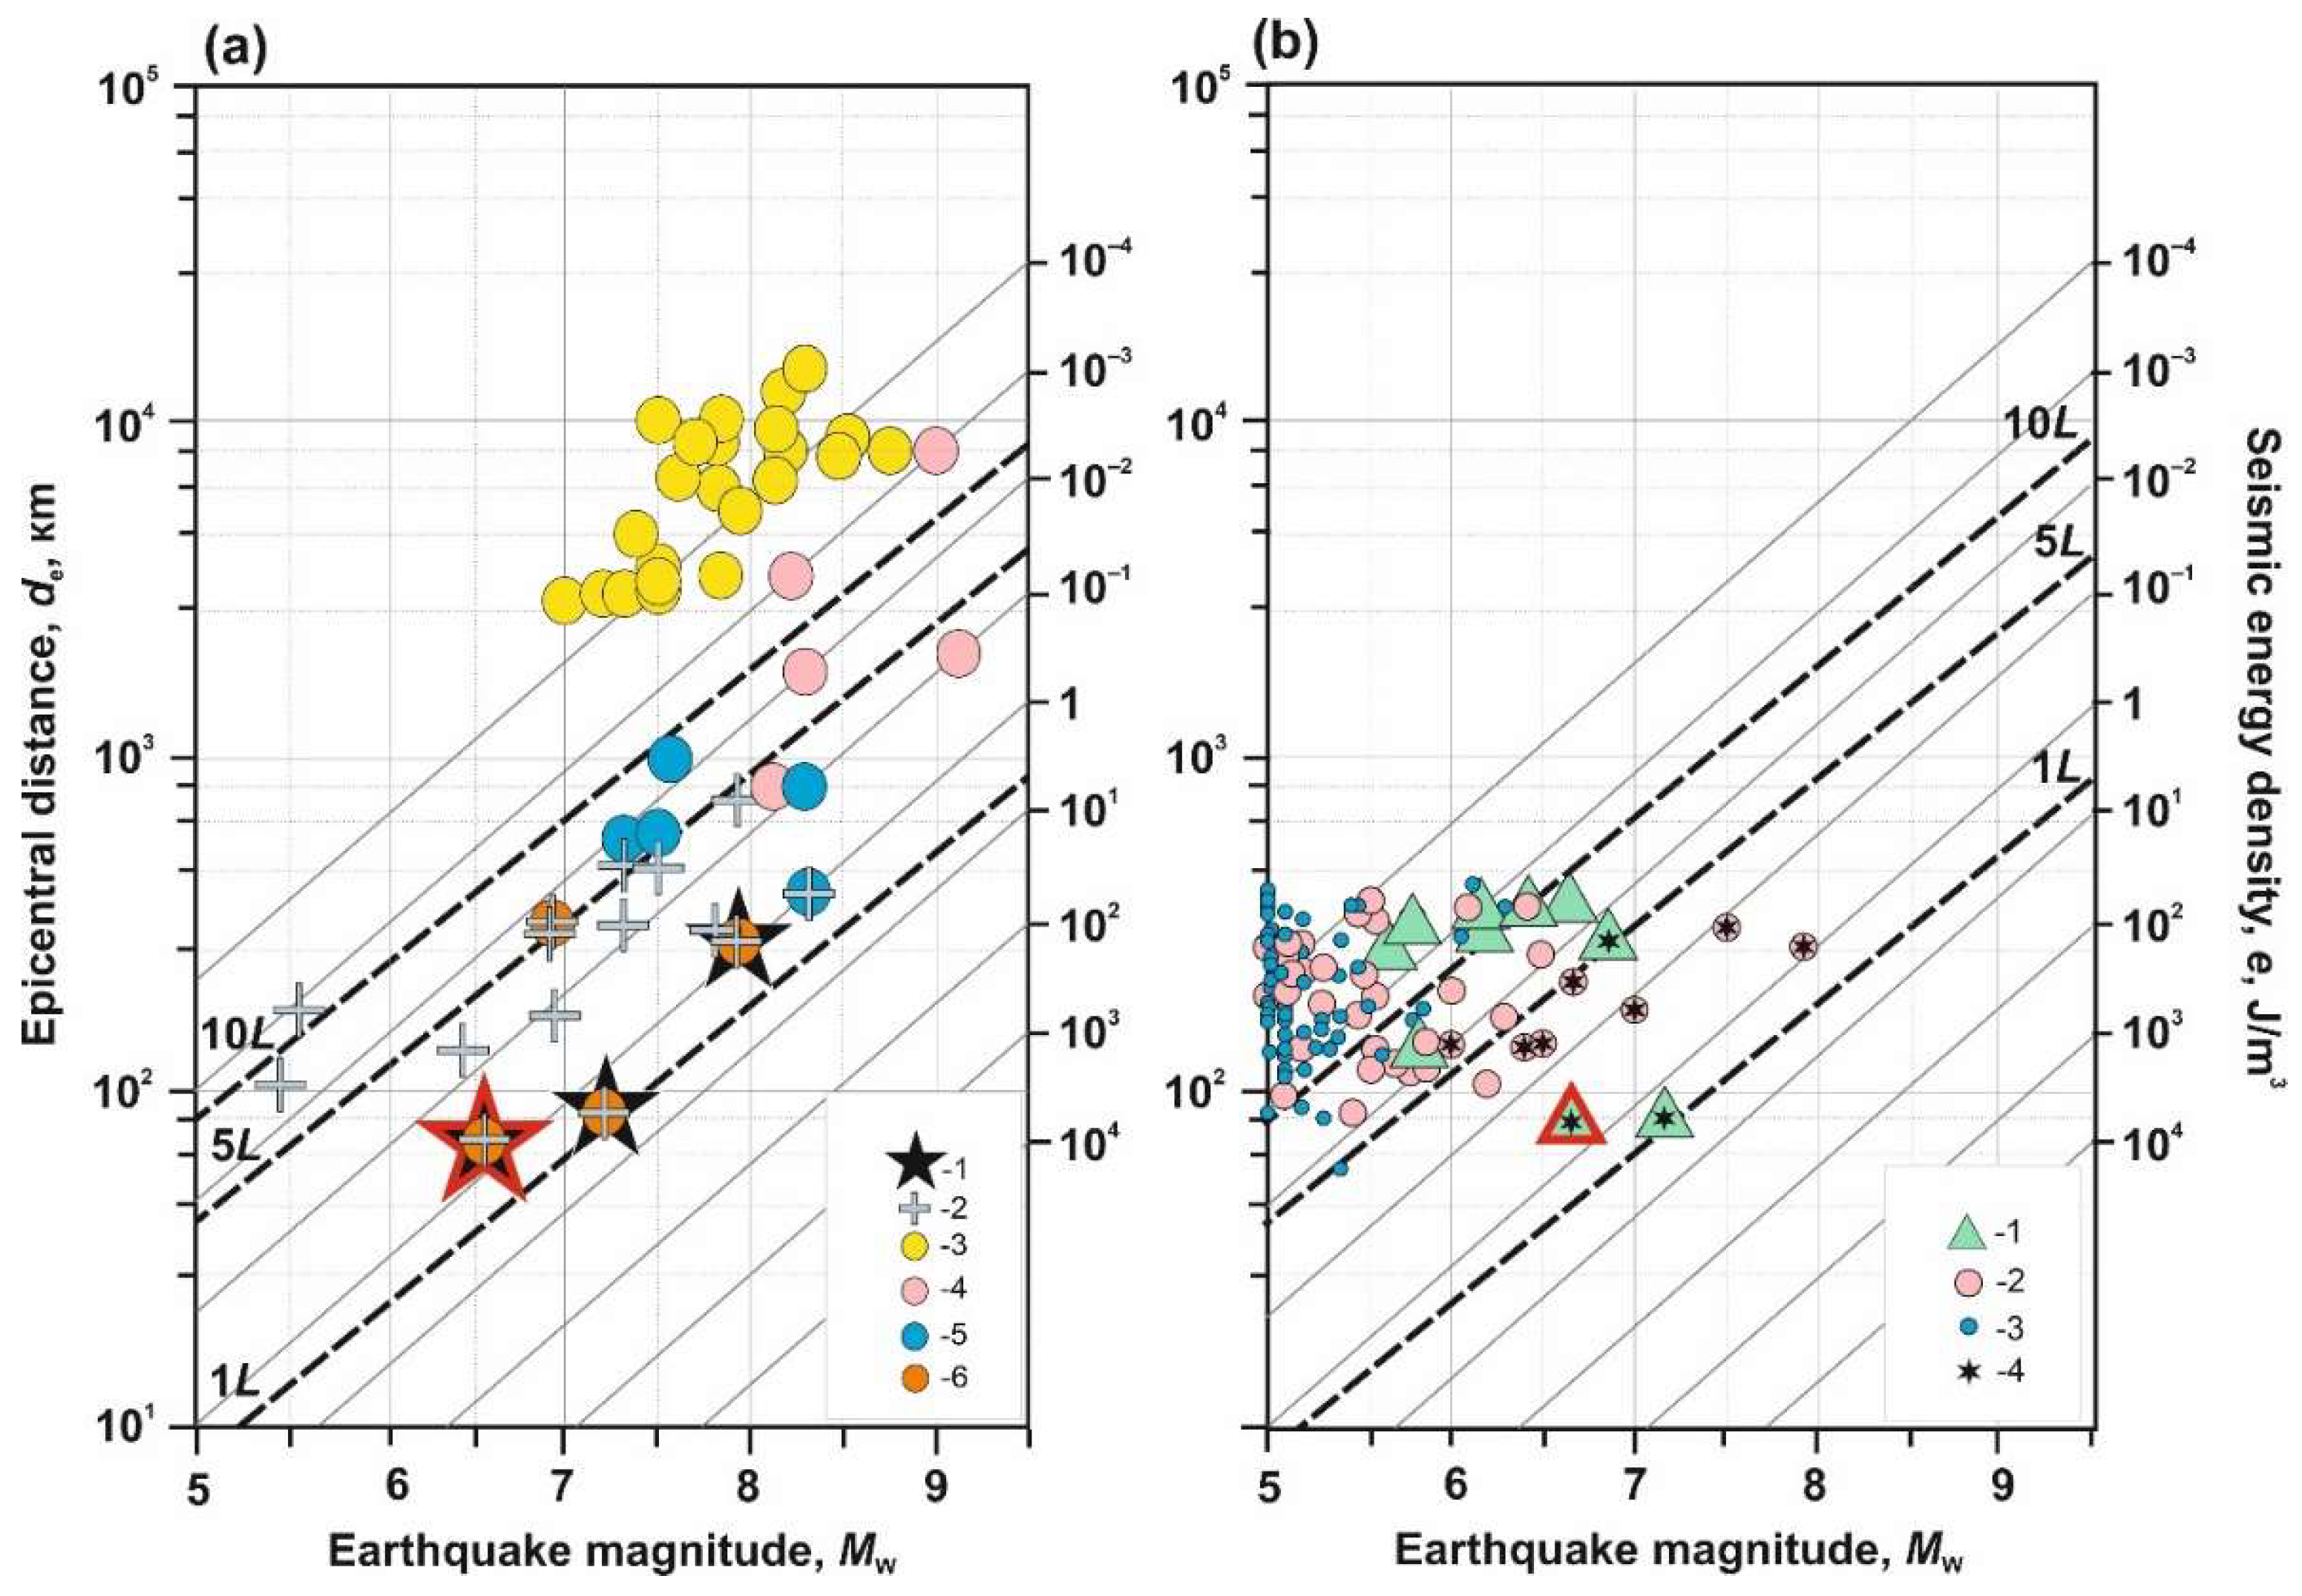
On the diagrams, constructed in the coordinates of magnitude Mw – epicentral distance of earthquakes to well de, the calculated values of seismic energy density in the observation area e (in J/m3 according to [25]) and the maximum linear size of earthquake source L (in km, according to [46]) are shown with inclined lines depending on the values of Mw and de. Symbols in the diagram field show the types of SHGE diagnosed in the water pressure changes in observation well during the earthquakes that occurred.
This representation of the SHGE allows to display in a compact form the relationship between registered effects in water pressure changes in individual well with energy and spatial characteristics of seismic events causing such effects, and also to estimate the distances of the well from earthquake sources on the ratio between epicentral distances and linear size of the earthquake sources de/L.
Using the data in Figure 10, it is possible to give a meaningful description of the characteristic types of SHGE that manifest themselves in the YuZ-5 well (Figure 10a) and in the E-1 well (Figure 10b) depending on the energy and spatial parameters of earthquakes accompanied by manifestations of certain types of SHGE.
A diagram of the seismo-hydrogeodynamic effects typification detected in water pressure changes in the well YuZ-5 on data 1997–2022 observations was presented in the works [8], see Figure 14 in [18]. In Figure 10, this diagram is reproduced with the addition of seismo-hydrogeodynamic effects caused by EQ.
According to observation data from 1997–2022, the supposed hydrogeodynamic precursors appeared in the well YuZ-5 twice before earthquakes with Mw = 7.2 and 7.8 (L = 76 and L = 139 km) at epicentral distances de = 86 and de = 200 km (de/L = 1.1–1.4). The intensity of seismic impact in the well area during these earthquakes was IMSK-64 = 5–6 points with values of e = 0.4 and 4 J/m3. These two earthquakes were accompanied, in addition to the HGP, by the manifestation of coseismic jumps in water pressure changes (CSE_1) and long-term postseismic decreases in water pressure, corresponding to type IV vibration impact of seismic waves [8,18].
The earthquake of April 3, 2023 had comparable values of parameters Mw = 6.6, de = 67 km, as well as the values of the intensity of seismic impact in the well area e = 0.6 J/m3, IMSK-64 = 5–6 points and was accompanied by a similar set of seismo-hydrogeodynamic effects (Figure 5,7). EQ is characterized by the ratio of epicentral distance to the well to the size of earthquake source de/L=67 km/37 km = 1.8, which shows the location of well YuZ-5 in the near-intermediate zone of earthquake source. Similar characteristics of earthquakes that exhibit coseismic pressure jumps (CSE_1) and four types of vibration effects of seismic waves in water level/pressure changes (CSE_2) can also be obtained from the diagram in Figure 10a.
A description of seismo-hydrogeodynamic effects recorded in well E-1 is given in the works [3,16,19]. In this well the main types of SHGE are the hydrogeodynamic precursor before earthquakes (Figure 8,9a) and postseismic increase in water level/pressure followed by stabilization (Figure 9b).
Typification of the refined data on SHGE for well E-1 for the observation period 1987–2023, including the SHGEs recorded during the EQ (see section 2.3), presented for the first time in Figure 10b. From this diagram it follows that the hydrogeodynamic precursor appears before earthquakes with magnitudes М ≥ 5.0 at epicentral distances de = 70–350 km. Before earthquakes with magnitudes M = 5.0–6.4, HGP was observed in approximately 50% of cases. Before earthquakes with magnitudes M = 6.5–7.8, HGP was observed in 100% of cases. The presented estimates of the relationship between the HGP and subsequent earthquakes, depending on their parameters, correspond to the results of previous studies [3,19].
A smooth water pressure increase with amplitude of ≈8 cm for two months after the EQ (Figure 9) is a typical postseismic effect in this well, which is observed in connection with local strong earthquakes, most of which had Mw ≥ 6.5 and occurred at distances of no more than 200 km from the well.
Presentation of the SHGE data in form of diagrams (Figure 10) allows the use of such diagrams in tasks of using well observations for geophysical monitoring and earthquake prediction, and can also be useful in the general assessment of seismicity impact on the hydrogeodynamic regime of wells.
The diagrams for two Kamchatka wells, presented in Figure 10, are important evidence of the significant differences between individual observation wells in terms of sensitivity to the individual, mainly strong, earthquakes. As can be seen from the comparison of the SHGE typification diagrams for wells YuZ-5 and E-1, the well YuZ-5 is more “sensitive” to remote earthquakes. This well recorded the vibration effects of seismic waves from strong earthquakes at distances of up to 14 thousand km. While the “sensitivity” of the E-1 well is limited to distances of about 200 km in relation to the impact of seismic waves from the strong earthquakes. For this well, according to the manifestation of HGP, the sensitivity zone to the preparation processes of local earthquakes with M ≥ 5.0 is limited to epicentral distances of no more than 350 km.
3.2. About the Forecast of 3 April 2023 Earthquake
Since 2002, based on current observations at wells E-1 and YuZ-5, conclusions have been drawn up weekly on the presence/absence of hydrogeodynamic precursors. Such conclusions are transferred to the Kamchatka branch of the Russian Expert Council for Earthquake Prediction (KB REC). When HGP is detected in water level/pressure changes in well E-1, the conclusion provides estimates of the time, location and magnitude of the expected earthquake based on the retrospective analysis of the relationship between HGP and earthquakes [3]. According to the KB REC conclusions, for the period from 2002 to 2022, based on the hydrogeodynamic precursors HGP identified in real time in the water level changes in the well E-1, forecasts of nine earthquakes with Mw = 5.6–7.2 were made, including four forecasts of the earthquakes with magnitudes Mw = 6.4–7.2 occurred at epicentral distances of 80–350 km [47,48,49].
Using the HGP identified in real time (Figure 9), on January 19, 2023, a forecast conclusion was prepared on increased probability of strong earthquake, which was transmitted to the KB REC. The conclusion of January 19, 2023 stated: “Over the course of 14 days, an alarming sign of HGP has been manifested in the water pressure changes in well E-1. This indicates that within 1-2 months an earthquake with Mw ≥ 5.0 is possible at a distance of up to a few hundred kilometers from the well.”. During the period from the third decade of January to March, this forecast was confirmed by the authors on a weekly basis.
The EQ of April 3, 2023 with Mw = 6.6 corresponded to the forecast conclusion in terms of magnitude (Mw ≥ 5), time (waiting time from January 19 to April 3 is 75 days or 2.5 months ≈ 2 months) and location (epicentral distance to well E-1 de = 77 km). Therefore, this forecast is successful according to the author’s estimates, as well as according to the conclusion of the KB REC.
3. Conclusion
The paper demonstrates that one of the tasks of well observations of groundwater pressure variations, carried out for seismic forecasting, is to verify the relationships between the various types of seismo-hydrogeodynamic effect manifestations in observation well with earthquake parameters. Such verification of knowledge about the SHGE manifestations in individual wells can be carried out when strong local earthquakes occur and the recorded effects in water pressure changes are compared with the existing SHGE typifications depending on the parameters of earthquakes and their impact in the observation area. Such verification of data on hydrogeodynamic precursors in water pressure changes, which can be used to predict strong local earthquakes, is especially necessary [3,8,18,19].
Using the example of the earthquake of 03.04.2023, Mw = 6.6, which occurred at the epicentral distance of about 70 km from the observation wells, it is shown that the observation system in the East of Kamchatka Peninsula makes it possible to diagnose in near real time various types of seismo-hydrogeodynamic effects manifested in groundwater pressure changes in the range of periods from seconds to tens of days, including hydrogeodynamic precursors of strong local earthquakes.
Water pressure changes in well E-1 during the EQ showed two types of seismo-hydrogeodynamic effects, including a hydrogeodynamic precursor in form of water pressure lowering with increased rate and a postseismic increase with subsequent stabilization. This sequence of SHGE is consistent with water pressure changes in well E-1 during other previously occurring earthquakes with parameters Mw = 6.0–7.8, de = 70–200 km. The impact of such earthquakes in the well area is characterized by seismic energy density e = 4.0–0.01 J/m3 and macroseismic intensity IMSK-64 ≥ 4 points.
Using a hydrogeodynamic precursor identified in real time in water level/pressure changes in well E-1, the EQ of April 3, 2023 was predicted with a lead time of 75 days. The successful prediction of the EQ using the HGP (Figure 9) was confirmed by the KB REC and is a convincing significative of the verification of previously created typification of HGSEs manifested in well E-1 during strong local earthquakes.
For the well YuZ-5, a correspondence was established in the sequence of seismo-hydrogeodynamic effects manifestations HGP→CSE→PSE during the three strongest and closest local earthquakes, including the EQ. This can also be seen as a confirmation of the correctness of the proposed SHGE typification for this well in relation to strong local seismic events, during which the main genetic types of SHGE are consistently manifested. Parameters of such earthquakes Mw = 6.6–7.8, de = 70–200 km and their impact in the well area e = 4.0–0.4 J/m3, IMSK-64 ≥ 5–6 points are estimated. For all three of these strong earthquakes, the observation well was located in the near-intermediate zone of the earthquake source (de/L = 1–3) (Figure 10a).
Thus, the presented experience of observing a set of seismo-hydrogeodynamic effects in connection with the EQ confirmed the correctness of SHGE typifications depending on the parameters of earthquakes and intensity of seismic impact for wells YuZ-5 and E-1, for which long-term series of precision data were obtained.
The method of empirical description of the diversity of SHGE presented in this paper can be implemented together with the development of models describing the behavior of observed well-aquifer systems under various mechanisms of seismic influence. At the same time, the empirical method of describing the diversity of SHGE has undoubted advantages in solving practical problems of using well observation data in predicting of strong earthquakes and assessing of their hydrogeological consequences.
The recording of coseismic pressure jumps (coseismic effect type 1—CSE_1) in wells YuZ-5 and 1303 during the EQ and the obtained estimates of the volumetric coseismic deformation of water-bearing rocks (expansion with amplitude of D1 = (0.7–1.0) × 10−8), consistent with theoretical estimates based on the dislocation model [27], demonstrate the possibility of using data from these wells to obtain quantitative estimates of the quasi-elastic deformation of water-bearing rocks in problems of geophysical monitoring of modern geodynamic processes and earthquake prediction in the Kamchatka region.
Author Contributions
Kopylova, G. and Boldina, S. have made a substantial, direct and intellectual contribution to the work. Authors have read and agreed to the published version of the manuscript.
Funding
The work was supported by Ministry of Science and Higher Education of the Russian Federation (075-00682-24). The data used in the work were obtained with large-scale research facilities “Seismic infrasound array for monitoring Arctic cryolitozone and continuous seismic monitoring of the Russian Federation, neighbouring territories and the world” (https://ckp-rf.ru/usu/507436/; http://www.gsras.ru/unu/ (accessed on 20 January 2024)).
Data Availability Statement
The original contributions presented in this study are included in the article; further inquiries can be directed to the corresponding author.
Conflicts of Interest
The authors declare that this research was conducted in the absence of any commercial or financial relationships that could be construed as a potential conflict of interest.
References
- Wang, C.-Y.; Manga, M. Earthquakes and Water. Lecture Notes in Earth Sciences; Springer: Berlin, Germany, 2010; p. 225. [CrossRef]
- Wang, C.-Y.; Manga, M. Water and Earthquakes. Lecture Notes in Earth System Sciences; Springer: Cham, Switzerland, 2021; p. 387. [CrossRef]
- Kopylova, G. N.; Boldina, S. V. Hydrogeological Earthquake Precursors: A Case Study from the Kamchatka Peninsula. Front. Earth Sci. 2020, 8, 576017. [CrossRef]
- Sheymovich, V. S. Explanation to the State Geological Map of the Russian Federation. Scale 1:200,000. Series South Kamchatka; VSEGEI: Moscow, Russia, 2000; p. 302. (In Russian).
- Kiryukhin, A.; Lavrushin, V.; Kiryukhin, P.; Voronin, P. System of Koryaksky–Avachinsky Volcanoes (Kamchatka, Russia). Geofluids 2017, 2017, 4279652. [CrossRef]
- Taran, Y.; Ryabinin, G.; Pokrovsky, B.; Malik, N.; Cienfuegos, E. Methane–rich thermal and mineral waters of the Avachinsky Depression, Kamchatka. Appl. Geochem. 2022, 145, 105414. [CrossRef]
- Boldina, S. V.; Kopylova, G. N.; Kobzev, V. A. Study of Seismic Effects on Changes in Groundwater Pressure: Equipment and Some Well Observastion Results for the Kamchatka Peninsula. Geodyn. Tectonophys. 2022, 13, 0594. (In Russian). [CrossRef]
- Kopylova, G.; Boldina, S. Seismo-Hydrogeodynamic Effects in Groundwater Pressure Changes: A Case Study of the YuZ-5 Well on the Kamchatka Peninsula. Water. 2023, 15, 2174. [CrossRef]
- Kopylova, G. N.; Boldina, S. V. On the Relationships of Water-Level Variations in the E-1 Well, Kamchatka to the 2008–2009 Resumption of Activity on Koryakskii Volcano and to Large (M ≥ 5) Earthquakes. J. Volcanol. Seismol. 2012, 6(5), 316–328. [CrossRef]
- Gordeev, E. I.; Pavlov, V. M. Subduction of the Pacific plate under Kamchatka: Seismic velocity of underthrust. Izv. Phys. Solid Earth 2009, 45(4), 326–337. [CrossRef]
- Gordeev, E. I.; Pinegina, T. K.; Lander, A. V.; Kozhurin, A. I. Beringia: Seismic Hazard and Fundamental Problems of Geotectonics. Izv. Phys. Solid Earth 2015, 51( 4), 512–521. [CrossRef]
- Kopylova, G. N.; Boldina, S. V. Hydrogeoseismological Research in Kamchatka: 1977–2017. J. Volcanol. Seismol. 2019, 13(2), 71–84. [CrossRef]
- Riznichenko, Y. V. The source dimensions of the crustal earthquakes and the seismic moment. In Issledovaniya po Fizike Zemletryasenii (Studies in Earthquake Physics); Nauka: Moscow, Russia, 1976; pp. 9–27. (In Russian).
- Rojstaczer, S. Determination of fluid flows properties from the response of water levels in wells to atmospheric loading. Water Resour. Res. 1988, 24, 1927–1938.
- Boldina, S. V.; Kopylova, G. N. Coseismic effects of the 2013 strong Kamchatka earthquakes in well YuZ-5. Bull. Kamchatka Reg. Assoc. “Educ.-Sci.” Cent. Earth Sci. 2016, 30, 66–76. (In Russian).
- Kopylova, G. N. Variations of Water Level Elizovskaya 1 Well, Kamchatka Due to Large Earthquakes: 1987–1998 Observations. J. Volcanol. Seismol. 2001, 2, 39–52. (In Russian).
- Kopylova, G. N.; Boldina, S. V.; Smirnov, A. A.; Chubarova, E. G. Experience in Registration of Variations Caused by Strong Earthquakes in the Level and Physicochemical Parameters of Ground Waters in the Piezometric Wells: The Case of Kamchatka. Seism. Instrum. 2017, 53, 286–295. [CrossRef]
- Kopylova, G. N.; Boldina, S. V. Effects of Seismic Waves in Water Level Changes in a Well: Empirical Data and Models. Izv. Phys. Solid Earth 2020, 56, 530–549. [CrossRef]
- Kopylova, G. N.; Boldina S. V. Seismohydrogeological Phenomena as an Earthquake’s Trigger Impact on Groundwater (by the Example of the Wells of the Petropavlovsk-Kamchatsky Test Site, Kamchatka Peninsula. Izv. Phys. Solid Earth 2023, 59(3), 405-420. [CrossRef]
- Kopylova, G. N.; Sugrobov, V. M.; Khatkevich, Yu. M. Variations in the regime of springs and hydrogeological boreholes in the Petropavlovsk polygon (Kamchatka) related to earthquakes. J. Volcanol. Seismol. 1994, 2, 53‒70. (in Russian).
- Kopylova, G.; Boldina, S. Anomalies in Groundwater Composition Caused by Earthquakes: Examples and Modeling Issues. E3S Web of Conferences 2019, 98, 01029. [CrossRef]
- Kopylova, G.; Boldina, S. Preseismic Groundwater Ion Content Variations: Observational Data in Flowing Wells of the Kamchatka Peninsula and Conceptual Model. Minerals 2021, 11, 731. [CrossRef]
- Kopylova, G. N.; Kulikov, G. V.; Timofeev, V. M. Otsenka sostoyaniya i perspektivy razvitiya gidrogeodeformatsionnogo monitoringa seysmoaktivnykh regionov Rossii (Assessment of the state and prospects for the development of hydrogeodeformational monitoring of seismically active regions of Russia). Razvedka i Okhrana Nedr (Exploration and Protection of Subsoil) 2007, 11, 75-83. (In Russian).
- Kopylova, G. N.; Smolina, N. N. Water-level changes in the wells of Kamchatka at the time of the Mw 7.6, April 20, 2006 Olyutorskii earthquake. J. Volcanolog. Seismol. 2010, 4, 180–192. [CrossRef]
- Wang, C.-Y. Liquefaction beyond the near field. Seismol. Res. Lett. 2007, 78, 512–517. [CrossRef]
- Medvedev, S. V.; Sponheuer, W.; Kárník, V. Seismic Intensity Scale MSK-64; Akad. Nauk SSSR, Geofiz. Kom: Moscow, Russia, 1965; p. 11. (In Russian).
- Okada, Y. Surface deformation due to shear and tensile faults in a half–space. Bull. Seismol. Soc. Am. 1985, 75, 1135–1154.
- Chia, Y.; Chiu, J.-J.; Chiang, Y.-H.; Lee, T.-P.; Wu, Y.-M.; Horng, M.-J. Implications of coseismic groundwater level changes observed at multiple-well monitoring stations. Geophys. J. Int. 2008, 172, 293–301. [CrossRef]
- Shi, Z.; Wang, G.; Liu, C. Co-seismic groundwater level changes induced by the May 12, 2008 Wenchuan earthquake in the near field. Pure Appl. Geophys. 2013, 170, 1773–1783. [CrossRef]
- Shi, Z.; Wang, G.; Manga, M.; Wang, C.-Y. Mechanism of co–seismic water level change following four great earthquakes—Insights from co-seismic responses throughout the Chinese mainland. Earth Planet. Sci. Lett. 2015, 430, 66–74. [CrossRef]
- Sun, X.; Wang, G.; Yang, X. Coseismic response of water level in Changping well, China, to the Mw 9.0 Tohoku earthquake. J. Hydrol. 2015, 531, 1028–1039. [CrossRef]
- Zhang, S.; Shi, Z.; Wang, G.; Zhang, Z. Quantitative Assessment of the Mechanisms of Earthquake–Induced Groundwater–Level Change in the MP Well, Three Gorges Area. Pure Appl. Geophys. 2018, 175, 2475–2484. [CrossRef]
- Shalev, E.; Kurzon, I.; Doan, M.-L.; Lyakhovsky, V. Sustained water-level changes caused by damage and compaction induced by teleseismic earthquakes. J. Geophys. Res. Solid Earth 2016, 121, 4943–4954. [CrossRef]
- Shalev, E.; Kurzon, I.; Doan, M.-L.; Lyakhovsky, V. Water–level oscillations caused by volumetric and deviatoric dynamic strains. Geophys. J. Int. 2016, 204, 841–851. [CrossRef]
- Kopylova, G. N.; Steblov, G. M.; Boldina, S. V.; Sdel’nikova I. A. The possibility of estimating the coseismic deformation from water level observations in wells. Izv. Phys. Solid Earth 2010, 46, 47–56. [CrossRef]
- Xiang, Y.; Sun, X.; Gao, X. Different coseismic groundwater level changes in two adjacent wells in a fault-intersected aquifer system. J. Hydrol. 2019, 578, 124123. [CrossRef]
- Kopylova, G. N.; Lyubushin, A. A.; Boldina, S. V. Statistical Analysis of Precision Water Level Data from Observations in a Seismoactive Region: Case Study of the YuZ-5 Well, Kamchatka. Seism. Instrum. 2019, 55, 507–523. [CrossRef]
- Cooper H. H.; Bredehoeft J. D.; Papadopulos I. S.; Bennet R.R. The response of well-aquifer system to seismic waves. Journal of Geophysical Research 1965, 70, 3915−3926.
- Boldina, S. V.; Kopylova, G. N. Effects of the January 30, 2016, Mw = 7.2 Zhupanovsky earthquake on the water level variations in wells YuZ-5 and E-1 in Kamchatka. Geodyn. Tectonophys. 2017, 8, 863–880. (In Russian). [CrossRef]
- Wang, C.-Y.; Manga, M. Changes in Tidal and Barometric Response of Groundwater during Earthquakes—A Review with Recommendations for Better Management of Groundwater Resources. Water 2023, 15, 1327. [CrossRef]
- Kopylova, G. N. Earthquake–induced Water Level Changes in the YuZ-5 Well Kamchatka. J. Volcanol. Seismol. 2006, 6, 52–64. (In Russian).
- Brodsky, E.E.; Roeloffs, E.; Woodcock, D.; Gall, I.; Manga, M.A. A Mechanism for sustained groundwater pressure changes induced by distant earthquakes. J. Geophys. Res. 2003, 108, 2390–2400. [CrossRef]
- Kopylova, G. N.; Boldina, S. V. The mechanism of the hydrogeodynamic precursor of the Мw = 7.8 Kronotsky earthquake of December 5, 1997. Russ. J. Pac. Geol. 2012, 5, 104–114. (In Russian).
- Kopylova, G. N. O veroyatnostnom srednesrochnom prognoze sil’nykh zemletryaseniy Kamchatki i parametrizatsii predvestnikov (On the probabilistic medium-term forecast of strong earthquakes in Kamchatka and the precursors parameterization). In Problemy kompleksnogo geofizicheskogo monitoringa Dal’nego Vostoka Rossii (Problems of complex geophysical monitoring of the Russian Far East), Chebrov, V. N., ed.; GS RAN: Obninsk, Russia, 2014; pp. 382-386. (In Russian).
- Kopylova, G. N., Boldina, S. V.; Serafimova, Yu. K. Earthquake Precursors in the Ionic and Gas Composition of Groundwater: A Review of World Data. Geochem. Int. 2022, 60, 928–946. [CrossRef]
- Zavyalov, A. D.; Zotov, O. D. A new way to determine the characteristic size of the source zone. J. Volcanol. Seismol. 2021, 15(1), 19-25. [CrossRef]
- Sil’nye Kamchatskie Zemletryaseniya 2013 Goda (Strong Earthquakes of Kamchatka in 2013), Chebrov, V. N., ed.; Novaya kniga: Petropavlovsk-Kamchatsky, Russia, 2014; p. 252. (In Russian).
- Chebrov, V. N.; Saltykov, V. A.; Serafimova, Yu. K. Identifying the Precursors of Large (M ≥ 6.0) Earthquakes in Kamchatka Based on Data from the Kamchatka Branch of the Russian Expert Council on Earthquake Prediction: 1998–2011. J. Volcanol. Seismol. 2013, 7(1), 76–85. [CrossRef]
- Chebrov, V.N.; Kugayenko, Y.A.; Abubakirov, I.R.; Droznina, S.Y.; Ivanova, Y.I.; Matveyenko, Y.A.; Mityushkina, S.V.; Ototyuk, D.A.; Pavlov, V.M.; Rayevskaya, A.A.; et al. The January 30th, 2016 earthquake with Кs = 15.7, Mw = 7.2, I = 6 in the Zhupanovsky region (Kamchatka). Bull. Kamchatka Reg. Assoc. “Educ.-Sci.” Cent. Earth Sci. 2016, 29, 5–16. (In Russian).
Figure 1.
Location observation wells (Table 1,2) on the territory of Petropavlovsk-Kamchatsky geodynamic test site (shown with a yellow dotted line in the inset), geologic setting, epicenter and focal mechanism of April 3, 2023 earthquake, Mw = 6.6 (Table 3) and the epicenters of major aftershocks (according to data of NEIS (https://earthquake.usgs.gov/earthquakes/search (accessed on 20 January 2024)), GlobalCMT (https://www.globalcmt.org (accessed on 20 January 2024)) and the Kamchatka Branch of the Geophysical Survey of the Russian Academy of Sciences (http://sdis.emsd.ru/info/earthquakes/catalogue.php (accessed on 20 January 2024)). (a) Location observation wells: 1—piezometric well, 2—flowing well, 3—Petropavlovsk (PET) seismic station, 7—Petropavlovsk-Kamchatsky geodynamic test site (inset), 8—Petropavlovsk-Kamchatsky city (inset). (b) Geological environment according to [4,5,6] with author’s additions: 4—weather station, 5—main event epicenter, 6—aftershock epicenters, 9–13—geological formations (9—Quaternary sedimentary deposits, 10—Quaternary volcanogenic deposits, 11—Quaternary lavas of modern volcanoes, 12—Neogene volcanogenic-sedimentary rocks, 13—Late Cretaceous metamorphosed volcanogenic-sedimentary rocks), 14—regional faults (1—Avachinsky, 2—Petropavlovsky), 15—faults (a—established, b—assumed), 16—depth to the metamorphosed basement in km, 17—tectonic structures (I—Avacha volcano-tectonic depression, II—Petropavlovsky horst, III—Nachikinskaya zone of fold-block dislocations), 18—direction of regional underground runoff.
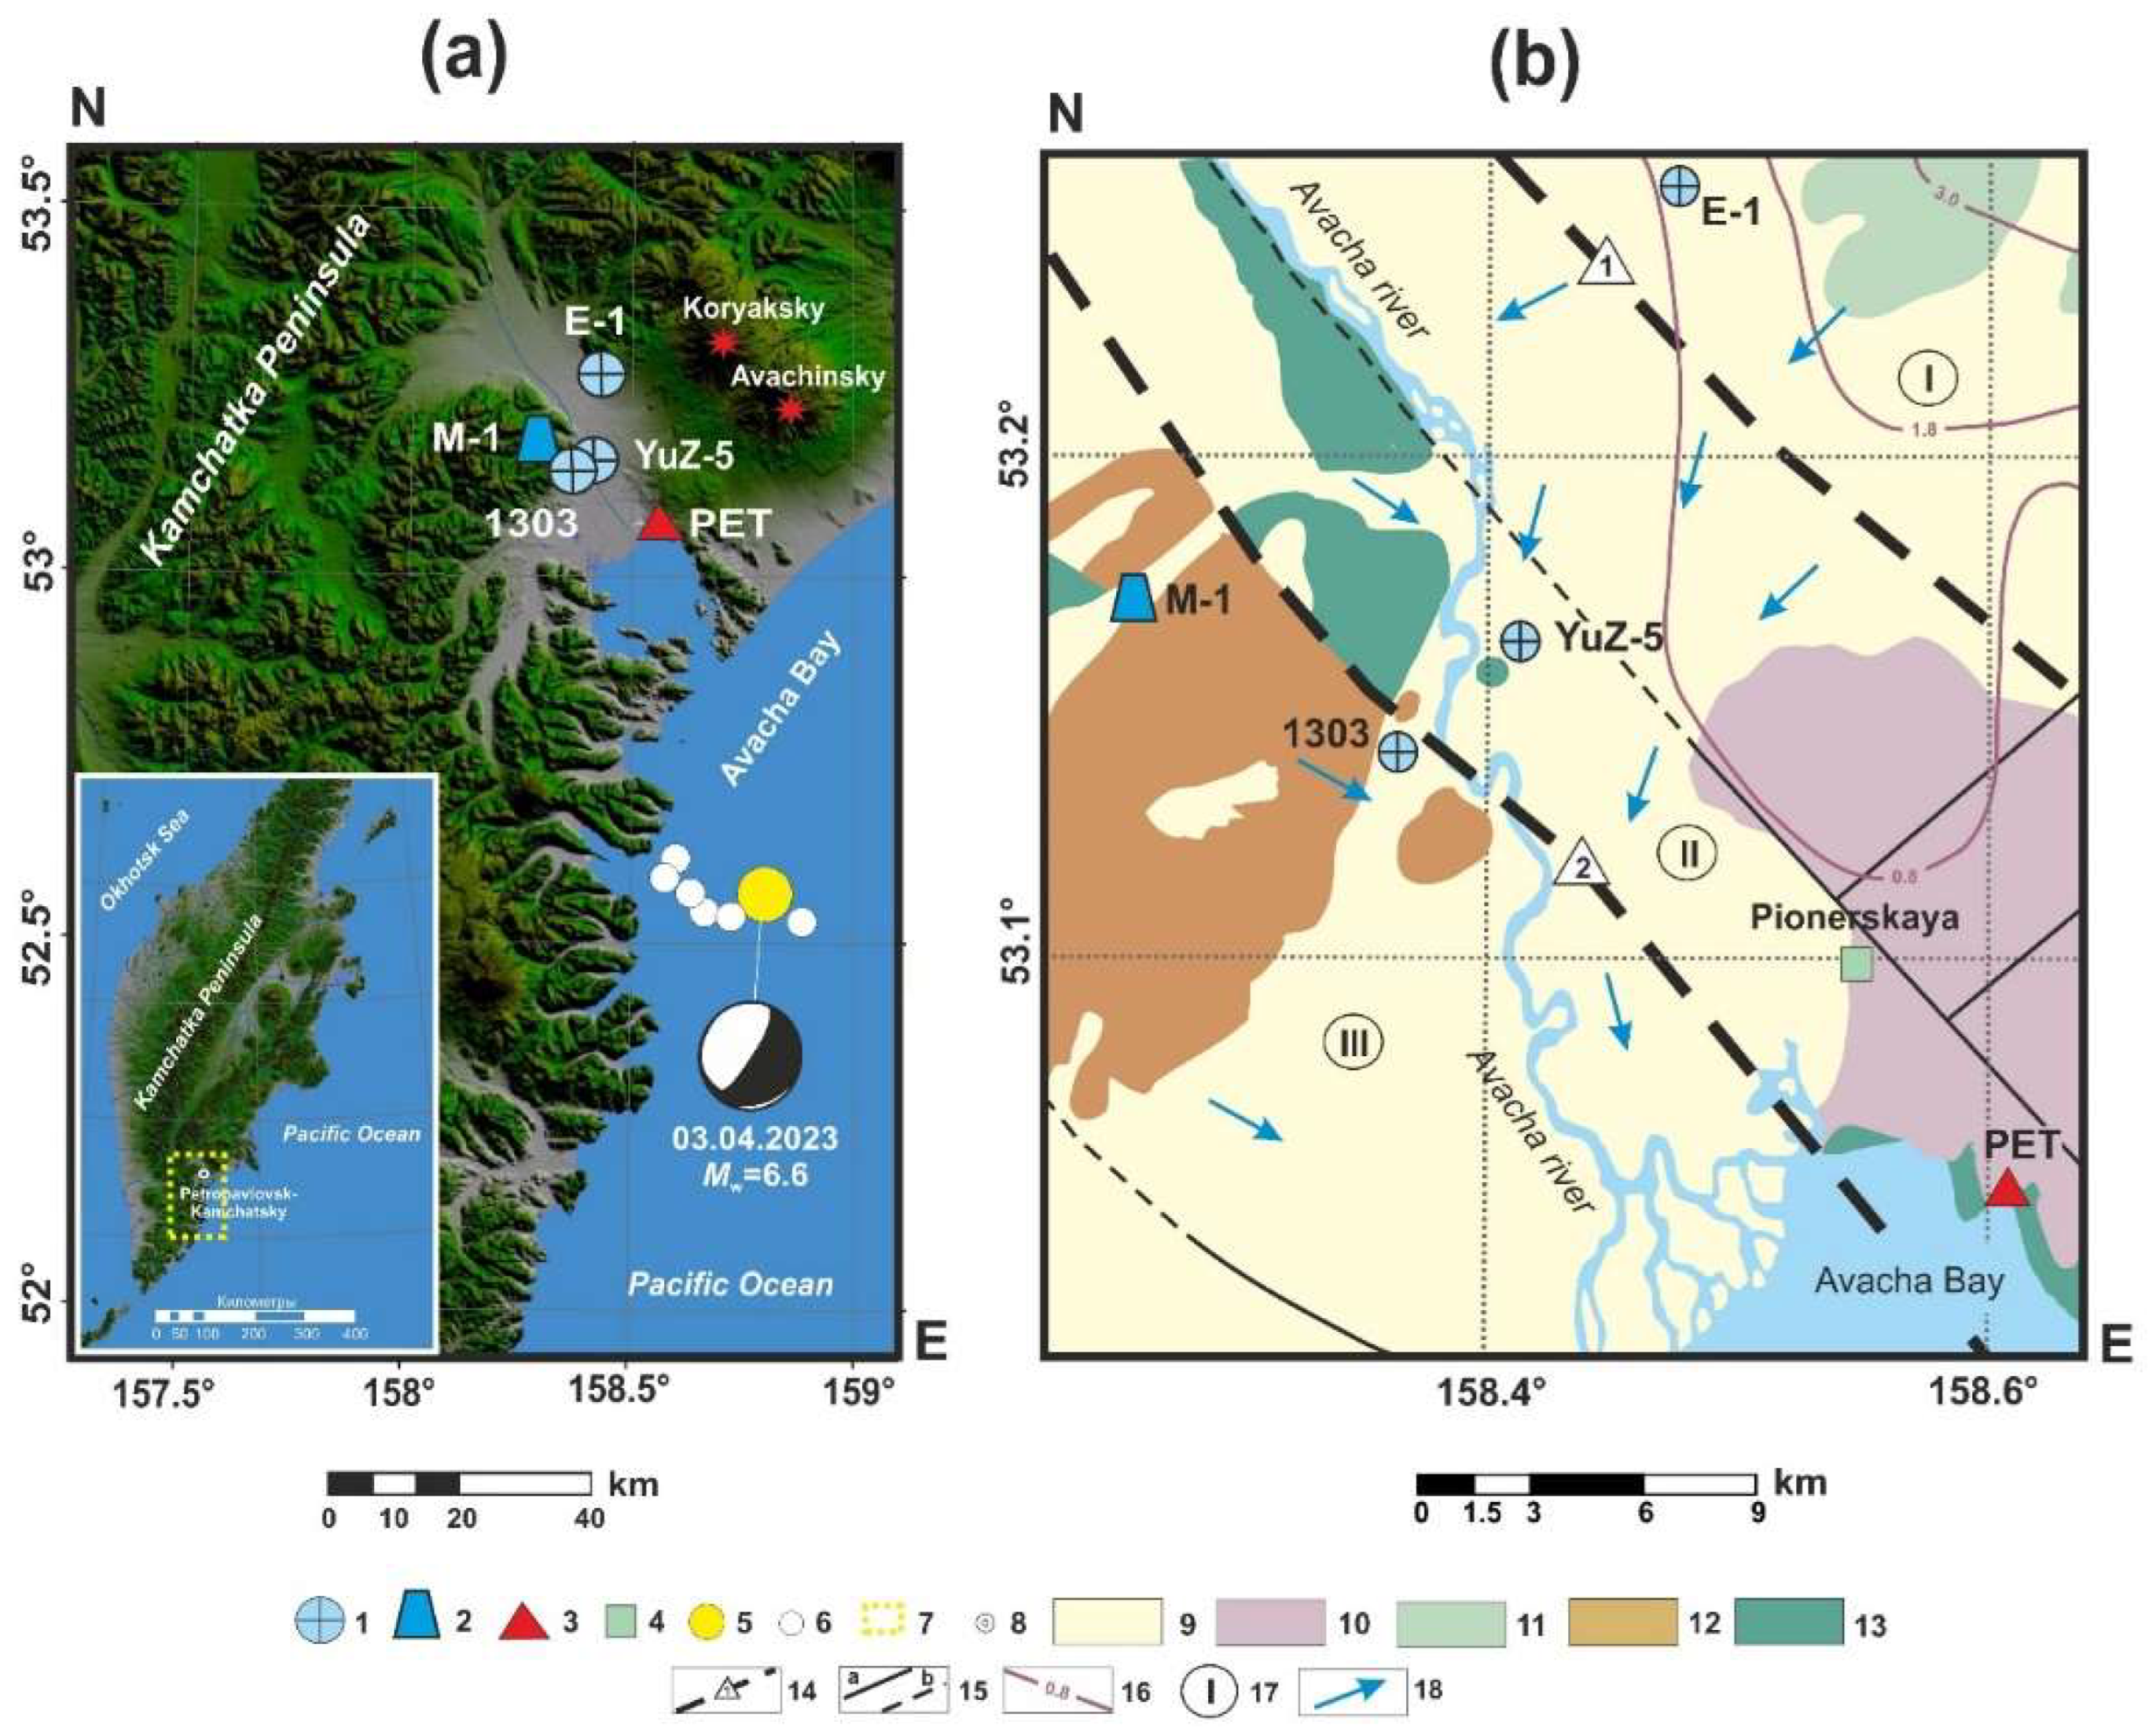
Figure 2.
Wells structure and geological section.
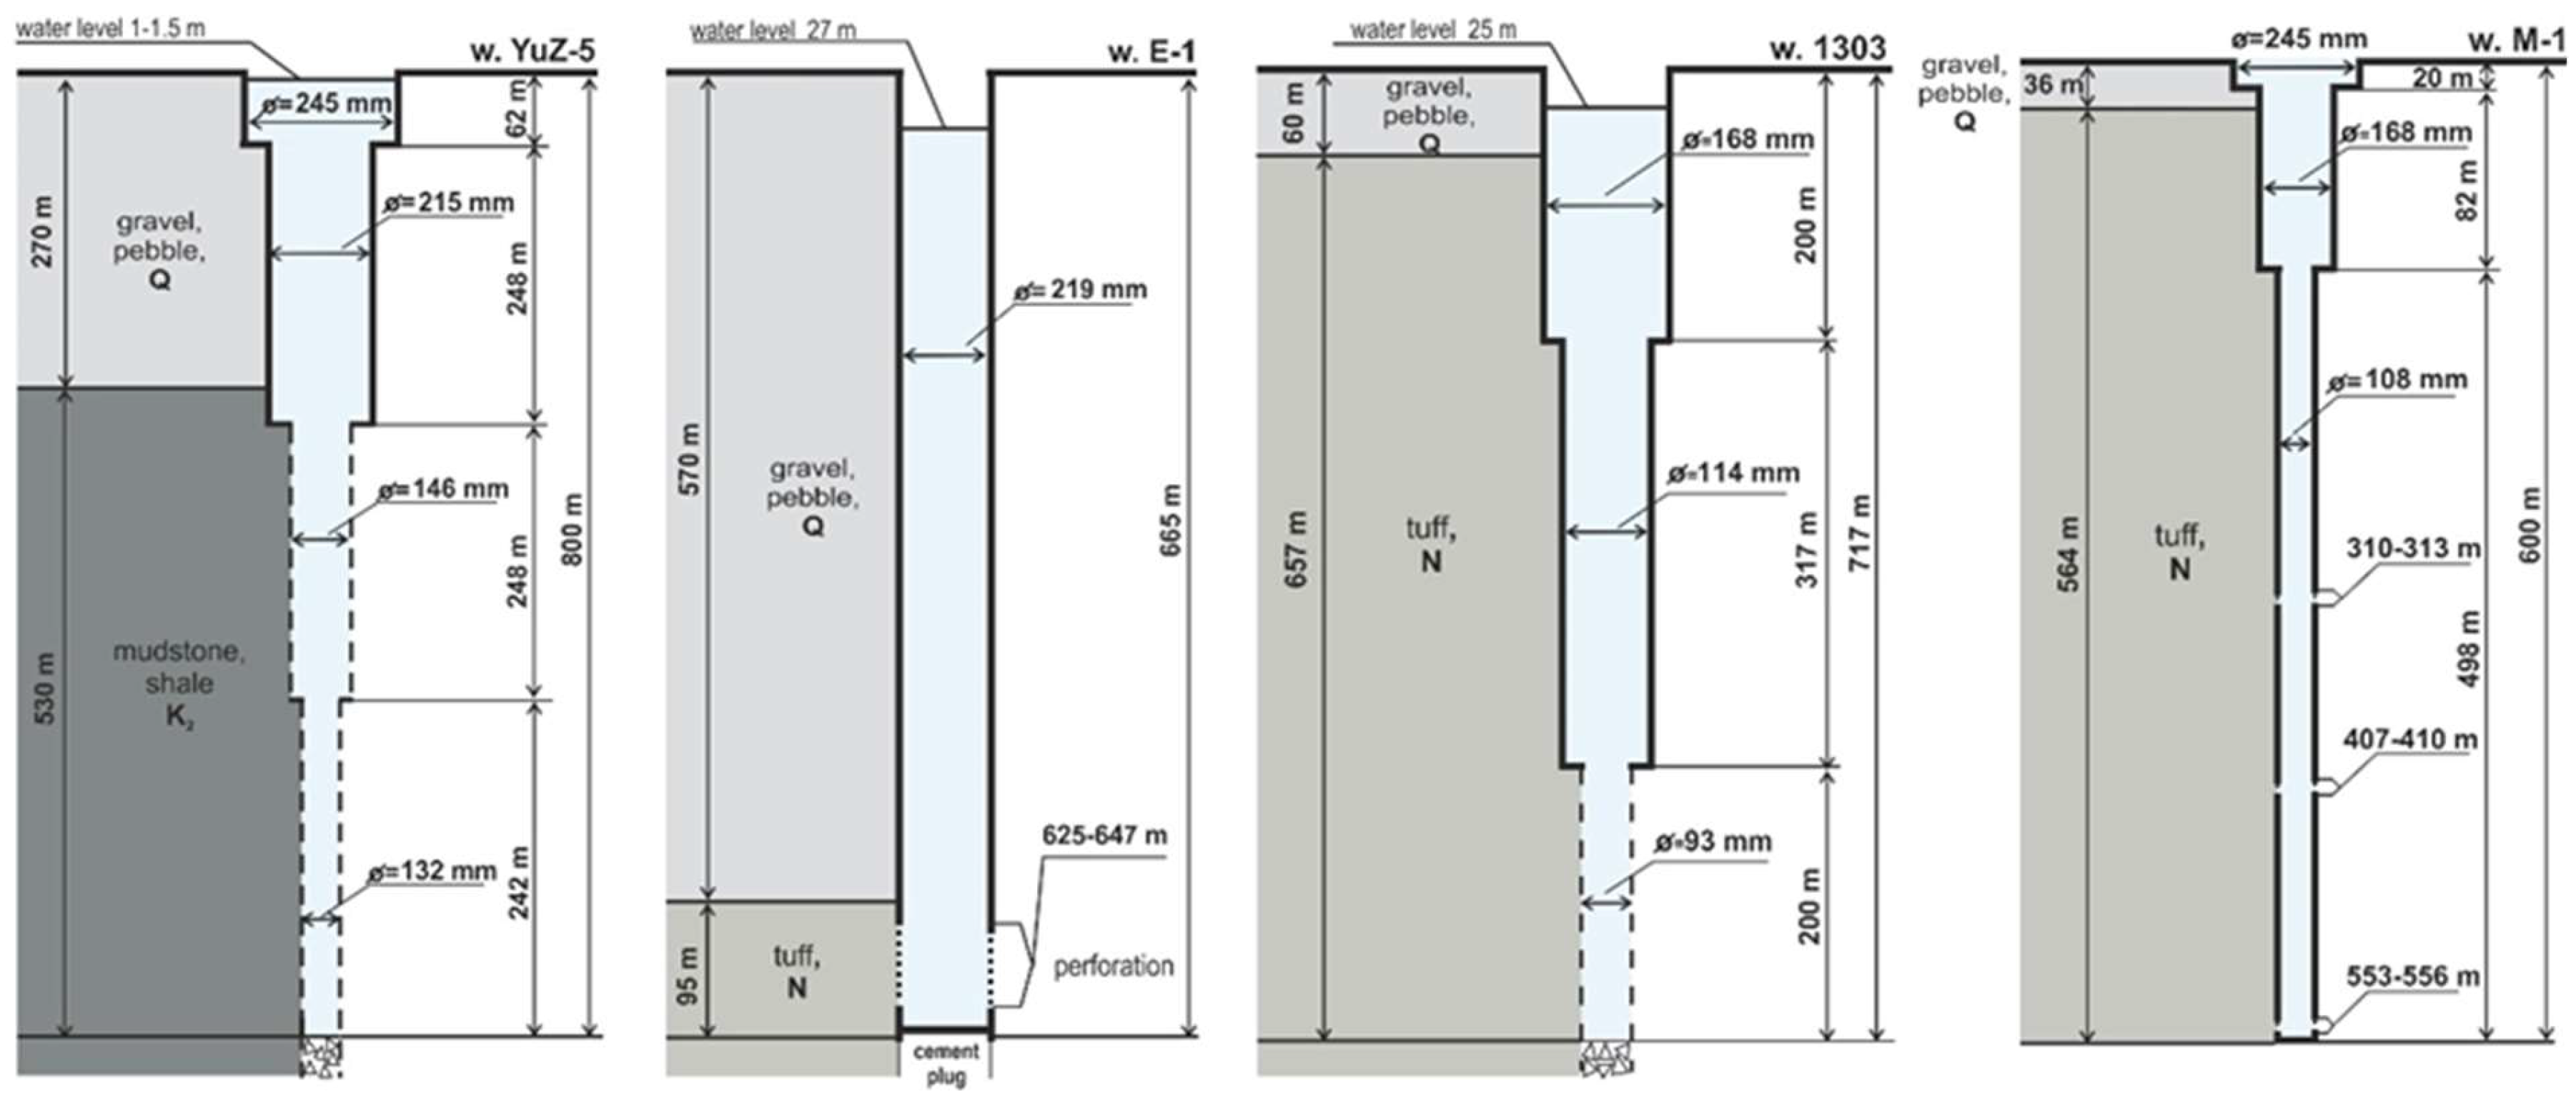
Figure 3.
Seismic recording on the HNZ channel in PET seismic station (53.023°N, 158.65°E), 100 Hz. P, S−seismic waves.
Figure 3.
Seismic recording on the HNZ channel in PET seismic station (53.023°N, 158.65°E), 100 Hz. P, S−seismic waves.
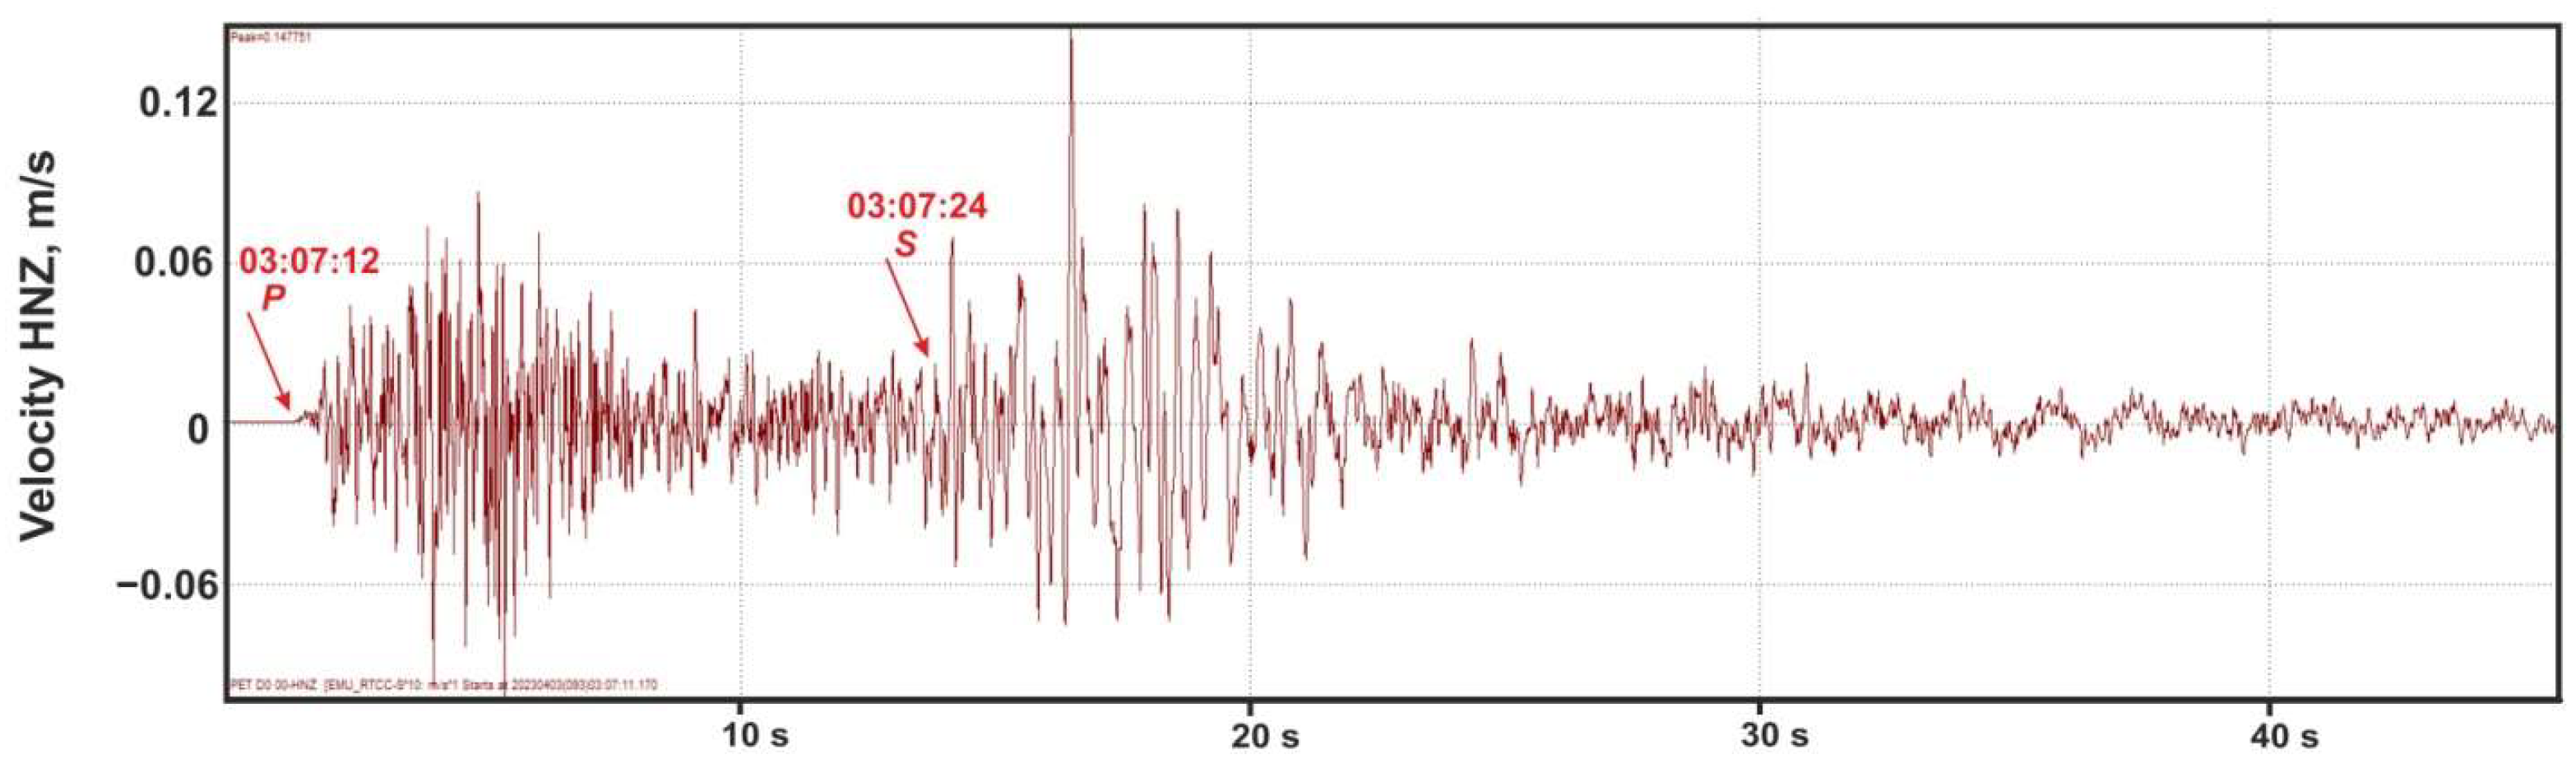
Figure 4.
Distribution of coseismic volumetric strain at depth of 500 m calculated from the dislocation model [27] and data on the earthquake source mechanism (Table 3), indicating the D2 value (volumetric expansion 2.3 × 10⁻⁸) in the area of wells YuZ-5 and 1303 (the wells are shown by the black circles). The values of compression strain correspond to the sign “−“, and expansion strain to the sign “+”.
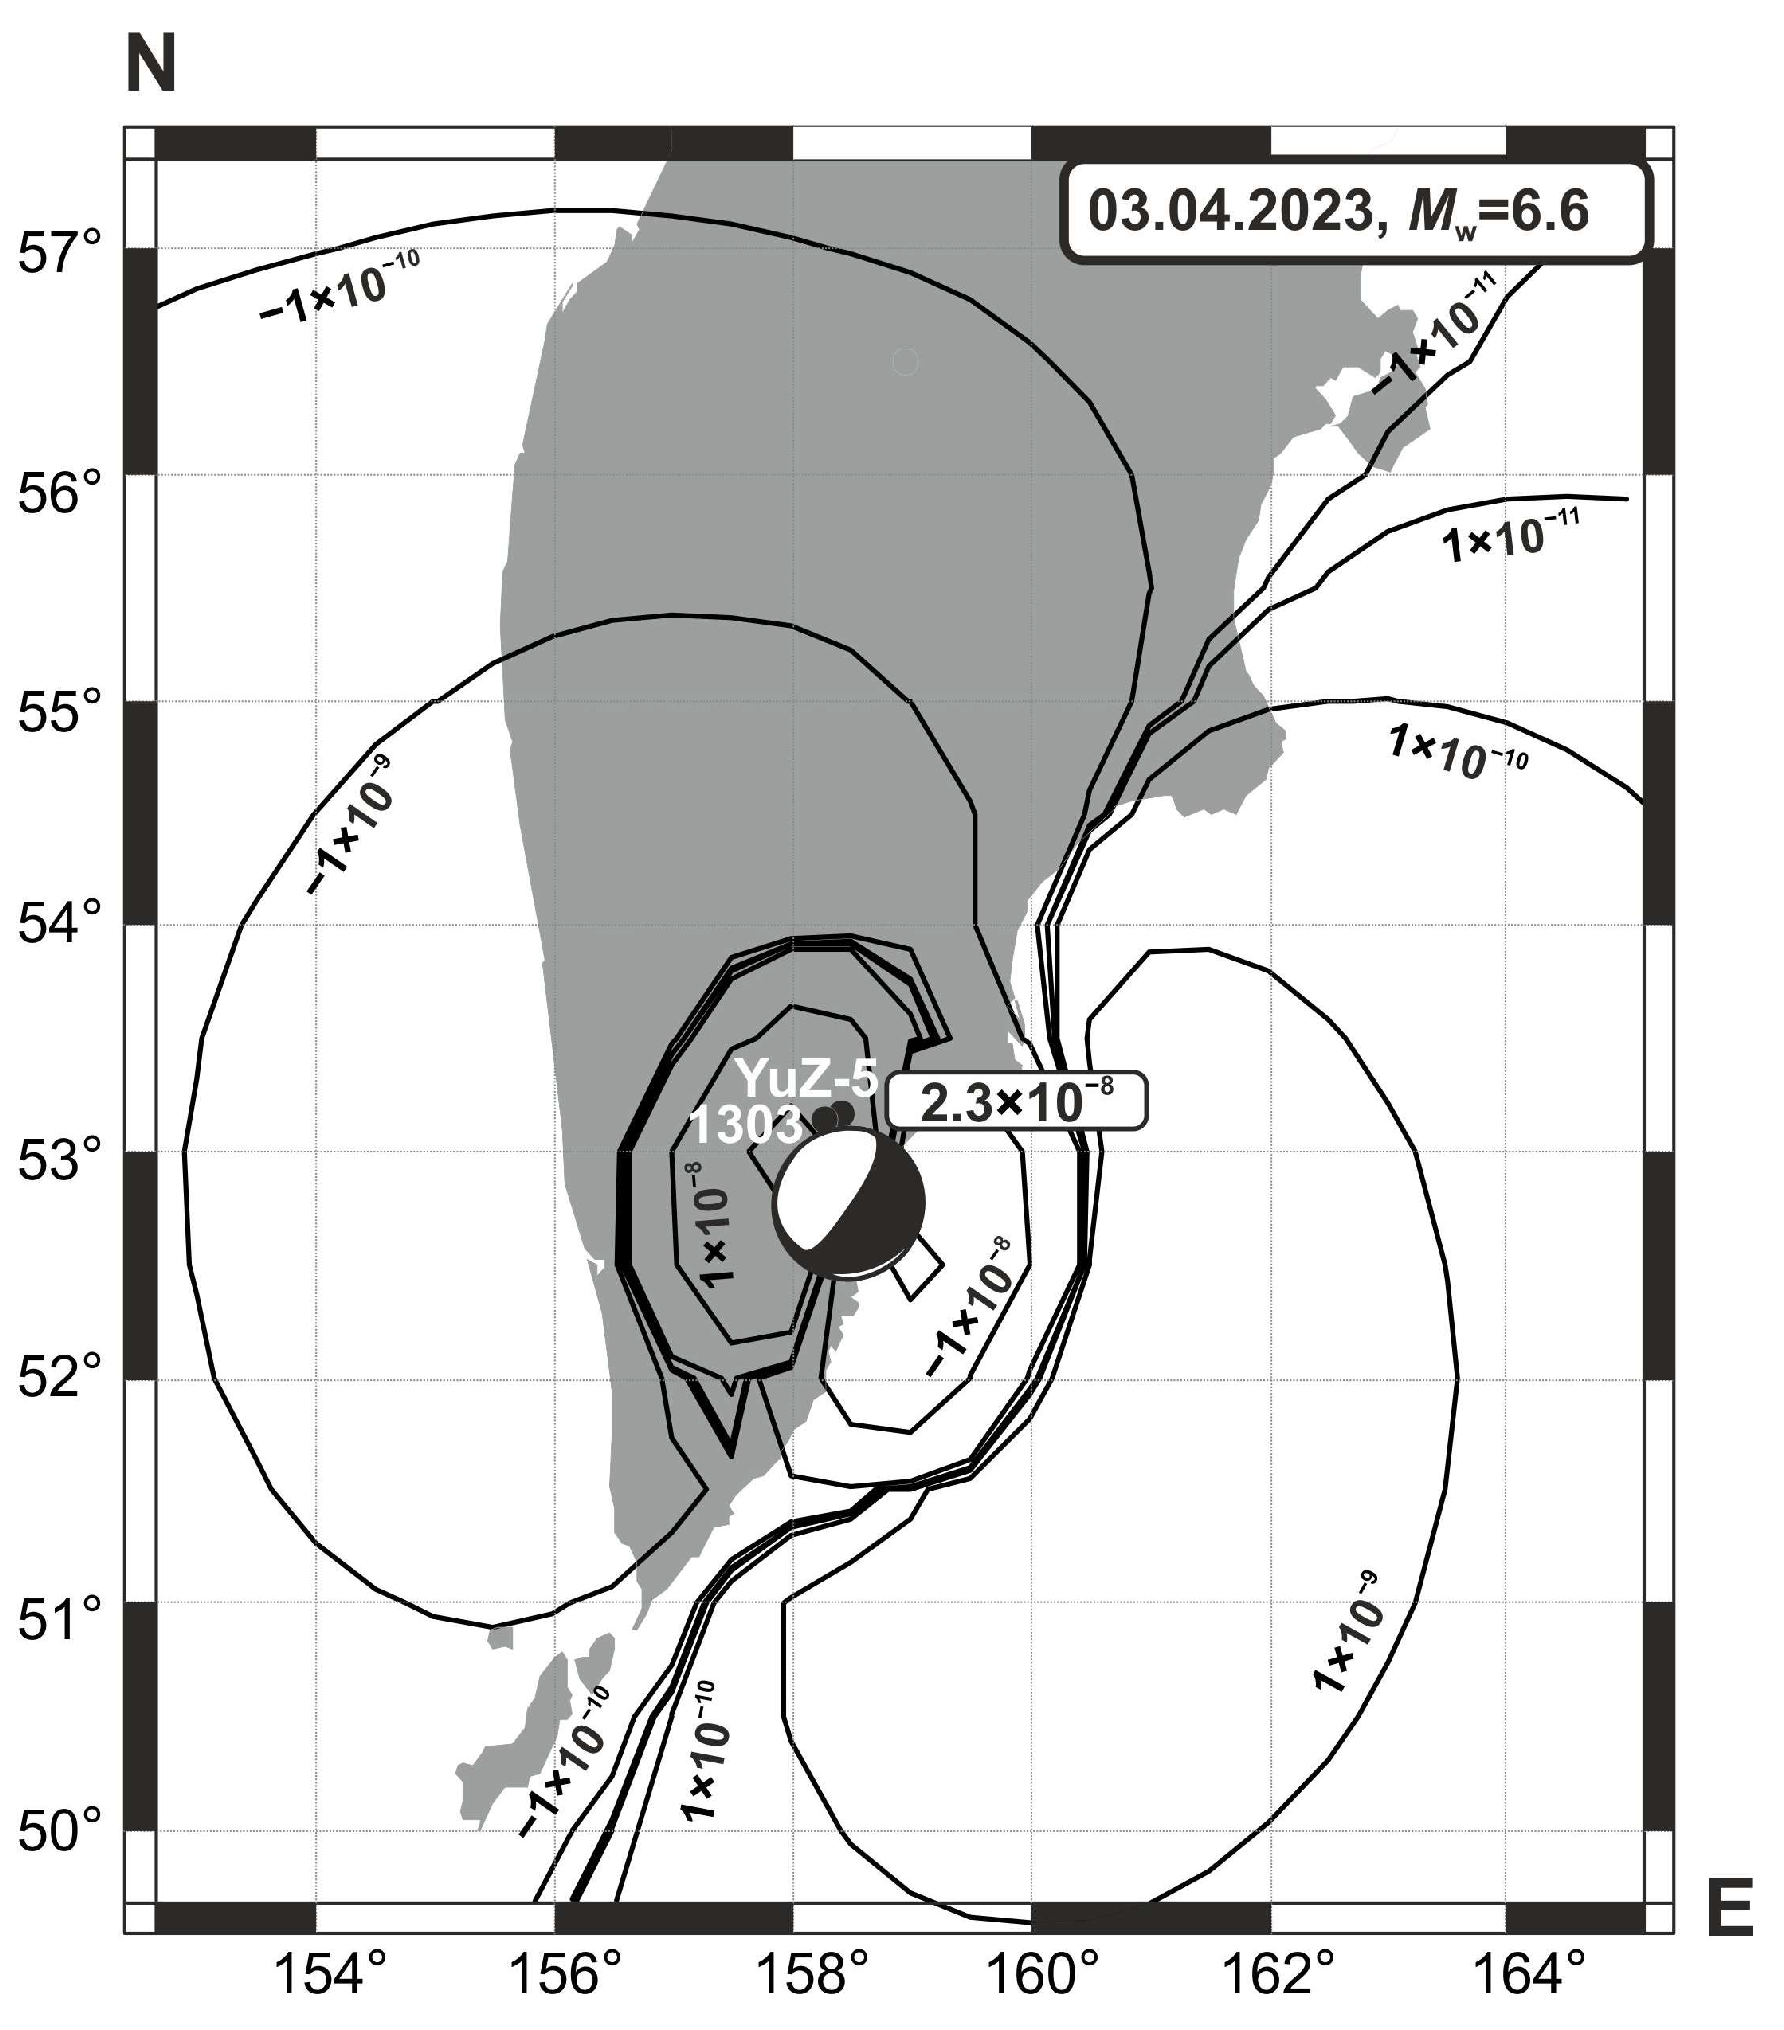
Figure 5.
Water pressure variations with a frequency of 1 Hz in wells YuZ-5, 1303 and M-1 caused by the April 3, 2024 earthquake. (a) During 5 hours, including the moment of the earthquake (shown by the red arrow). (b) Within 2 minutes after the arrival of seismic waves at the PET station in comparison with the record on the HNZ channel (upper panel): arrival of P−longitudinal waves in 03:07:12, arrival of S−transverse waves in 03:07:24.
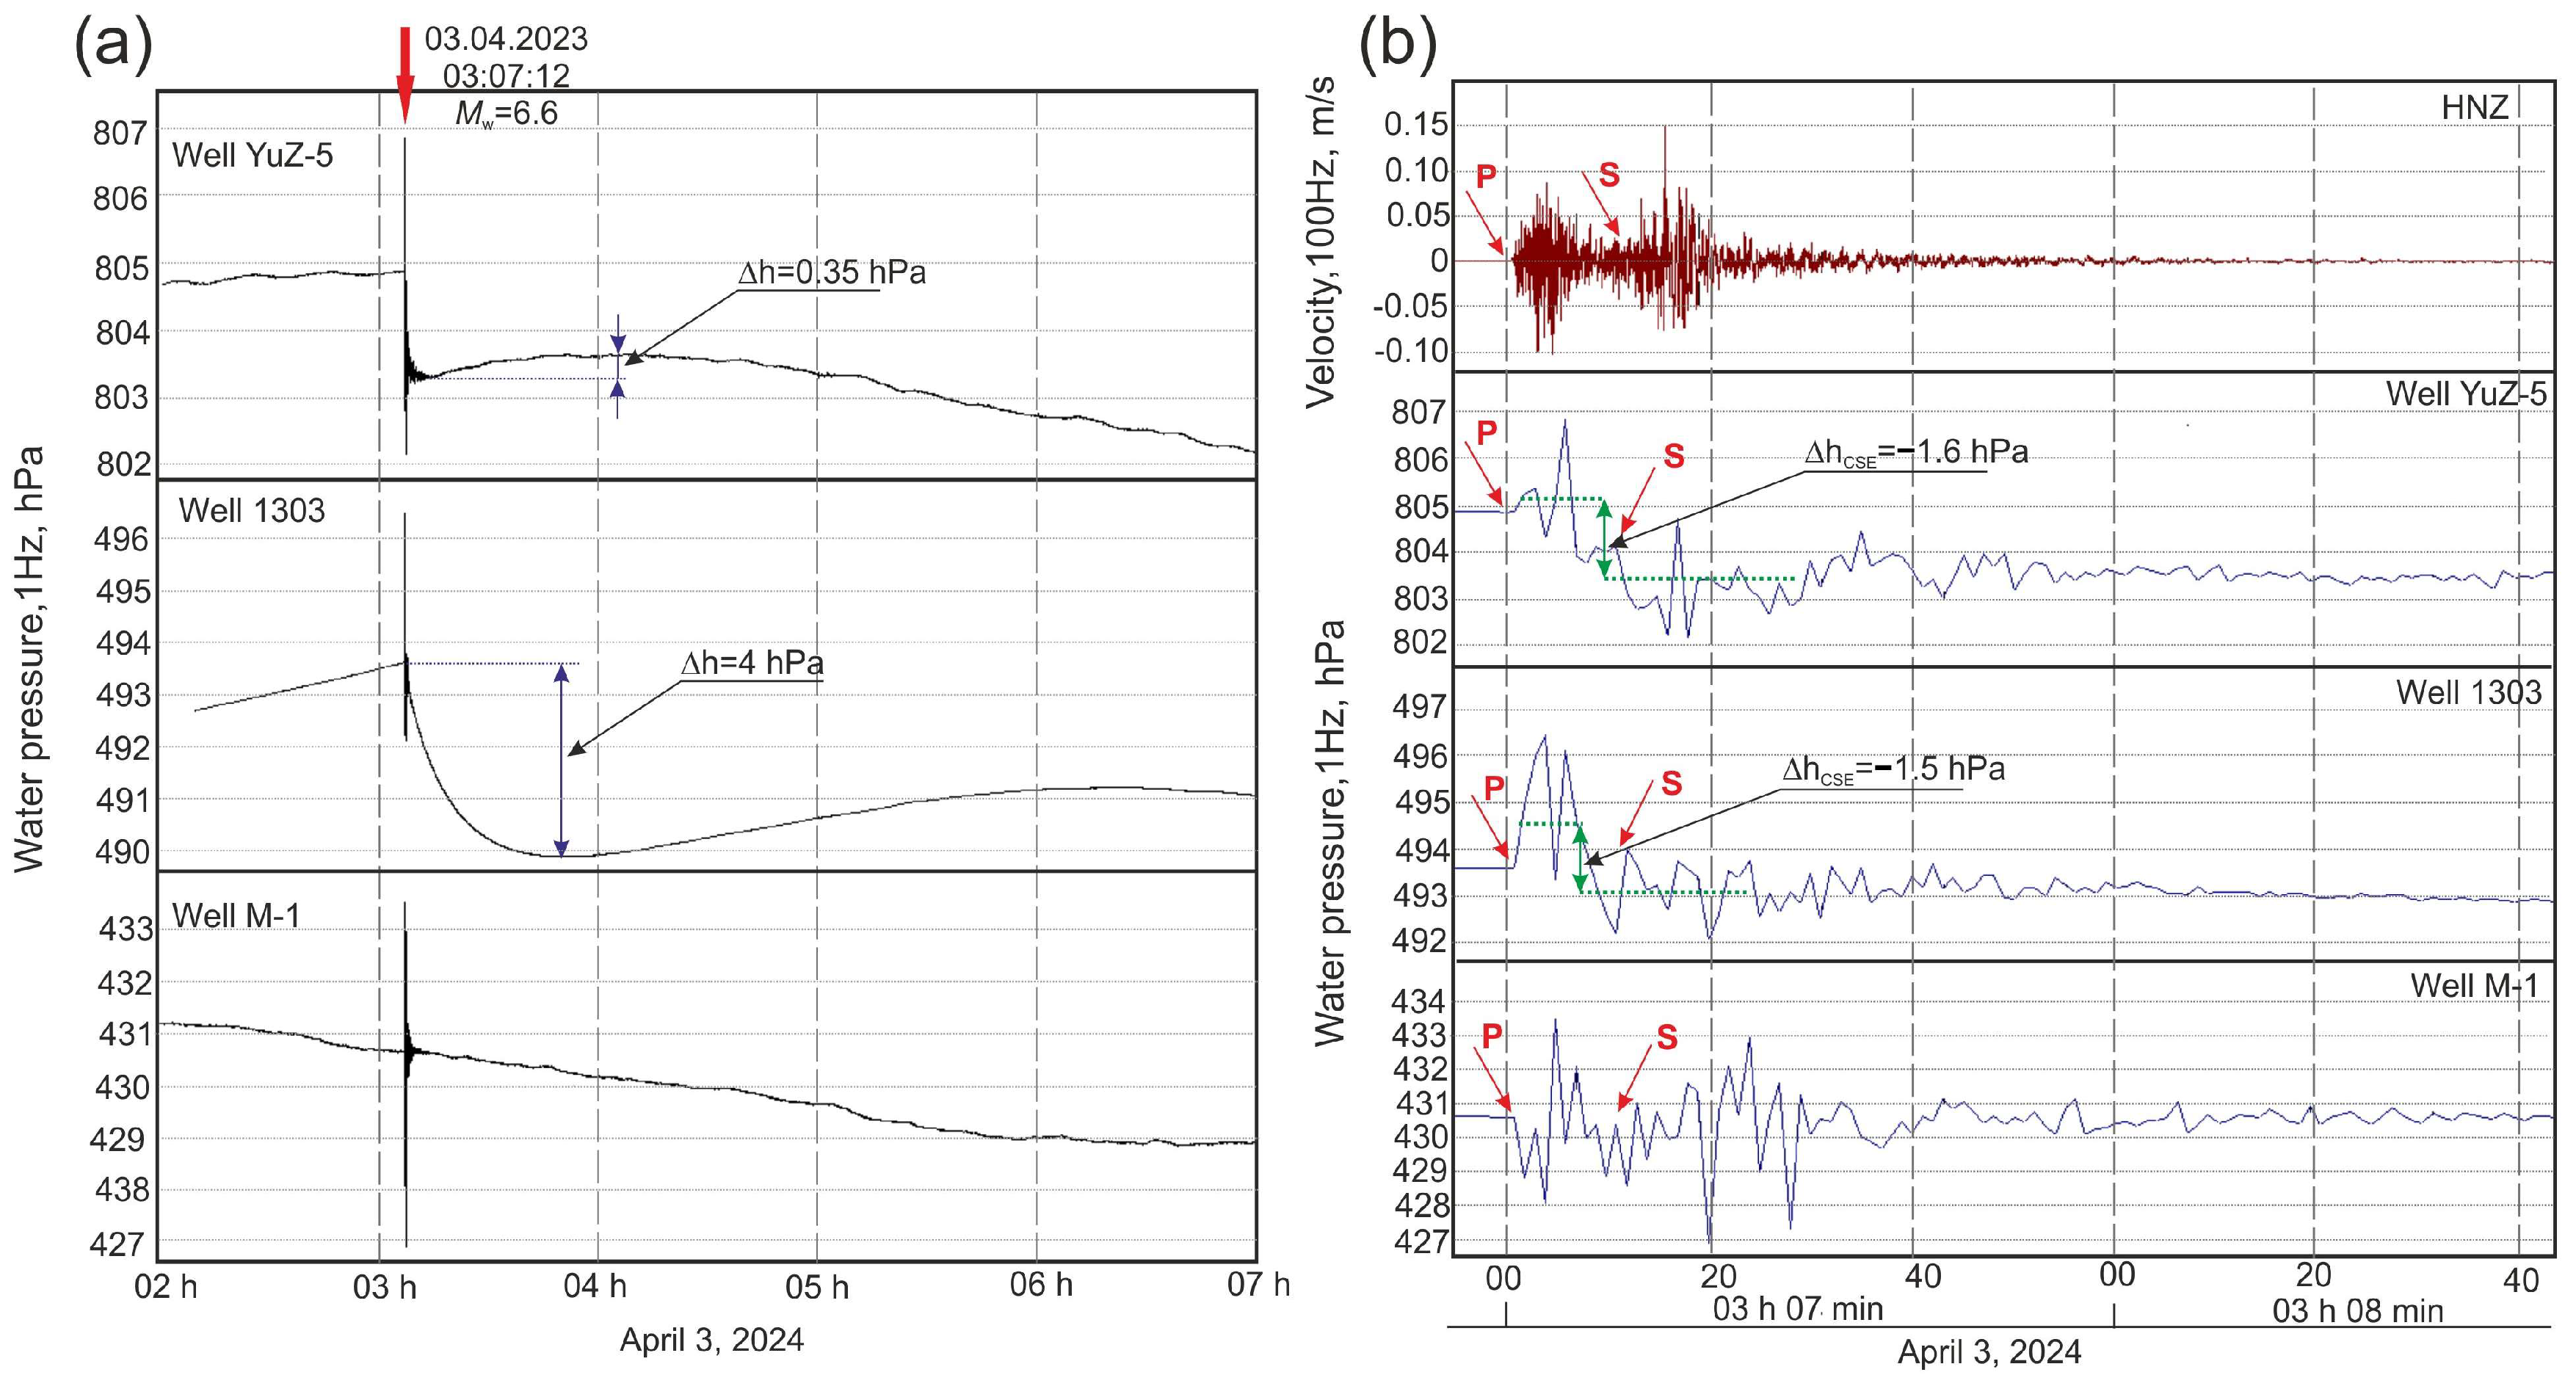
Figure 6.
Distribution of 1997–2023 earthquakes, that were accompanied coseismic jumps in water pressure in the YuZ-5 well as a function of magnitude Mw and epicentral distance de (а) and hypocentral distance dh (b). (c) Correlation between coseismic volumetric deformation in the YuZ-5 well area during local earthquakes obtained from observational data in the well (D1) and from the dislocation model (D2). 1—1997–2020 earthquakes (Table 3 in [8]), 2—April 3, 2023 earthquake.
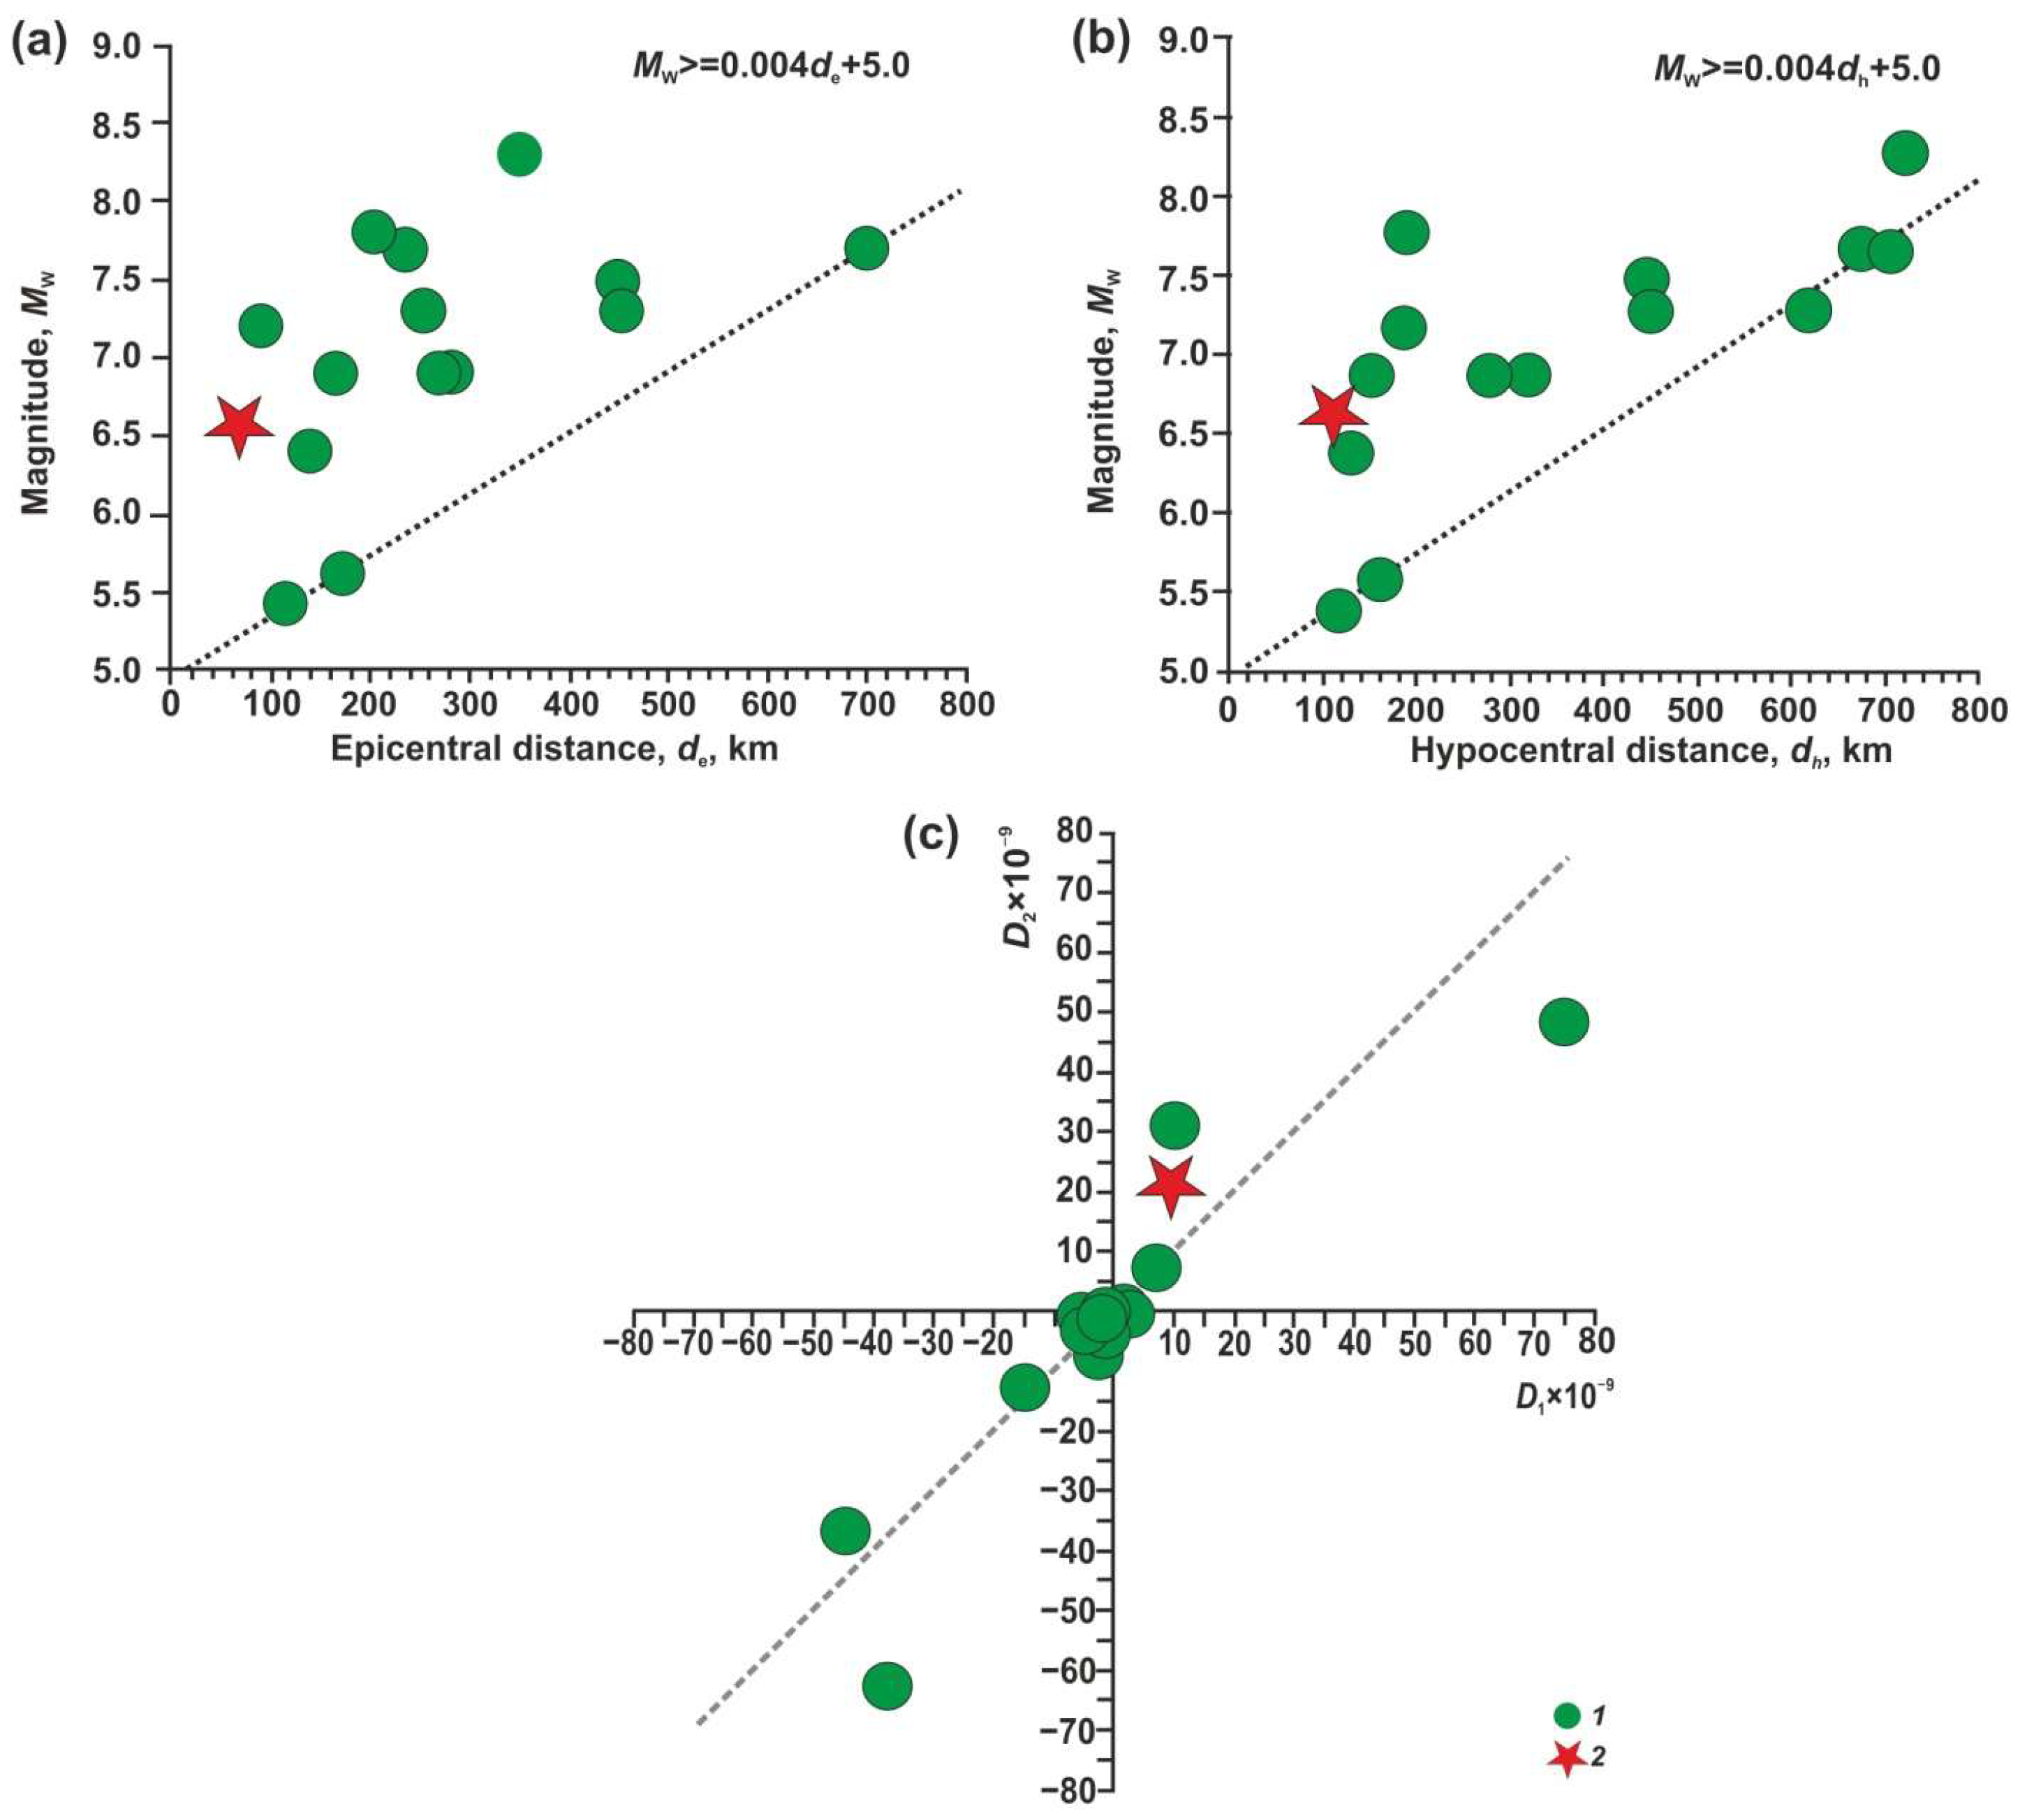
Figure 7.
Average hourly water pressure variations in well YuZ-5 and atmospheric precipitation in May 2021–June 2023 (a): 1—average hourly pressure variations with compensated barometric variations (black line); 2—seasonal pressure variations (gray line); 3—residuals in water pressure changes after removal of annual seasonality; red arrow − earthquake on 3 April 2023, Mw = 6.6 (EQ). Bold dotted line denotes a fragment of pressure variations during EQ, shown in Figure (b). (b) Manifestation of the supposed hydrogeodynamic precursor and postseismic decrease in water pressure, corresponding to type IV vibration impact of seismic waves [18]: red line shows the calculated water level decrease according to formula (1).
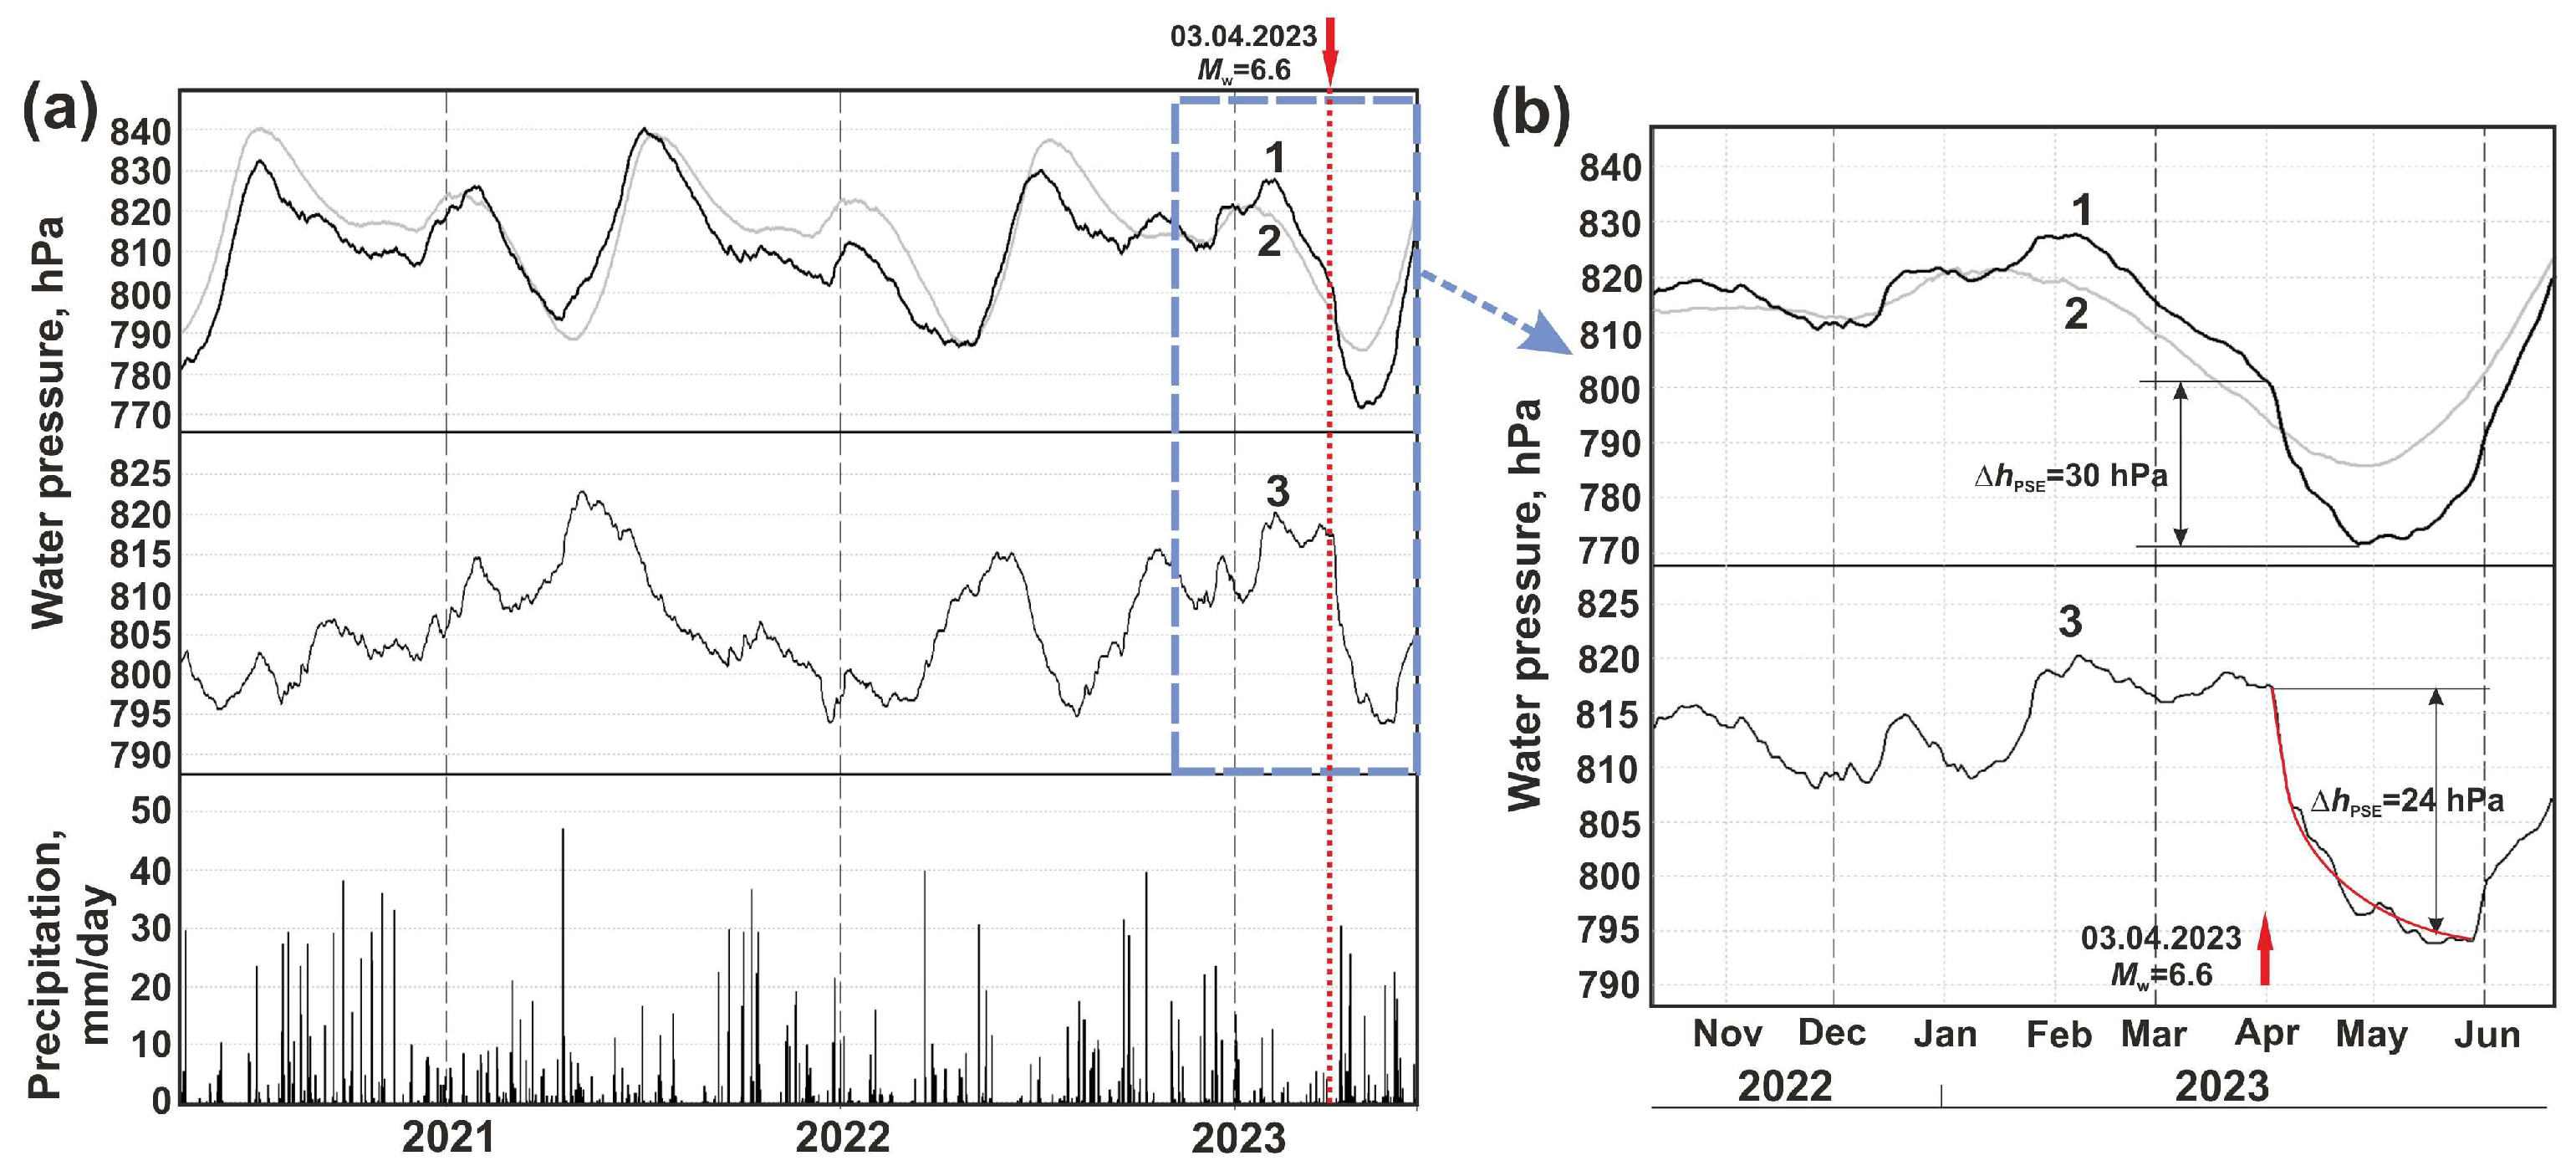
Figure 8.
Scheme of hydrogeodynamic precursor in water level changes in well E-1. The horizontal dotted line is the threshold value of the decrease rate in the water level. Tp – time of precursor manifestation. The vertical arrows show possible times of earthquake occurrence: unfilled arrow – earthquakes occur in approximately 10% of cases, filled arrow – earthquakes occur in approximately 90% of cases.
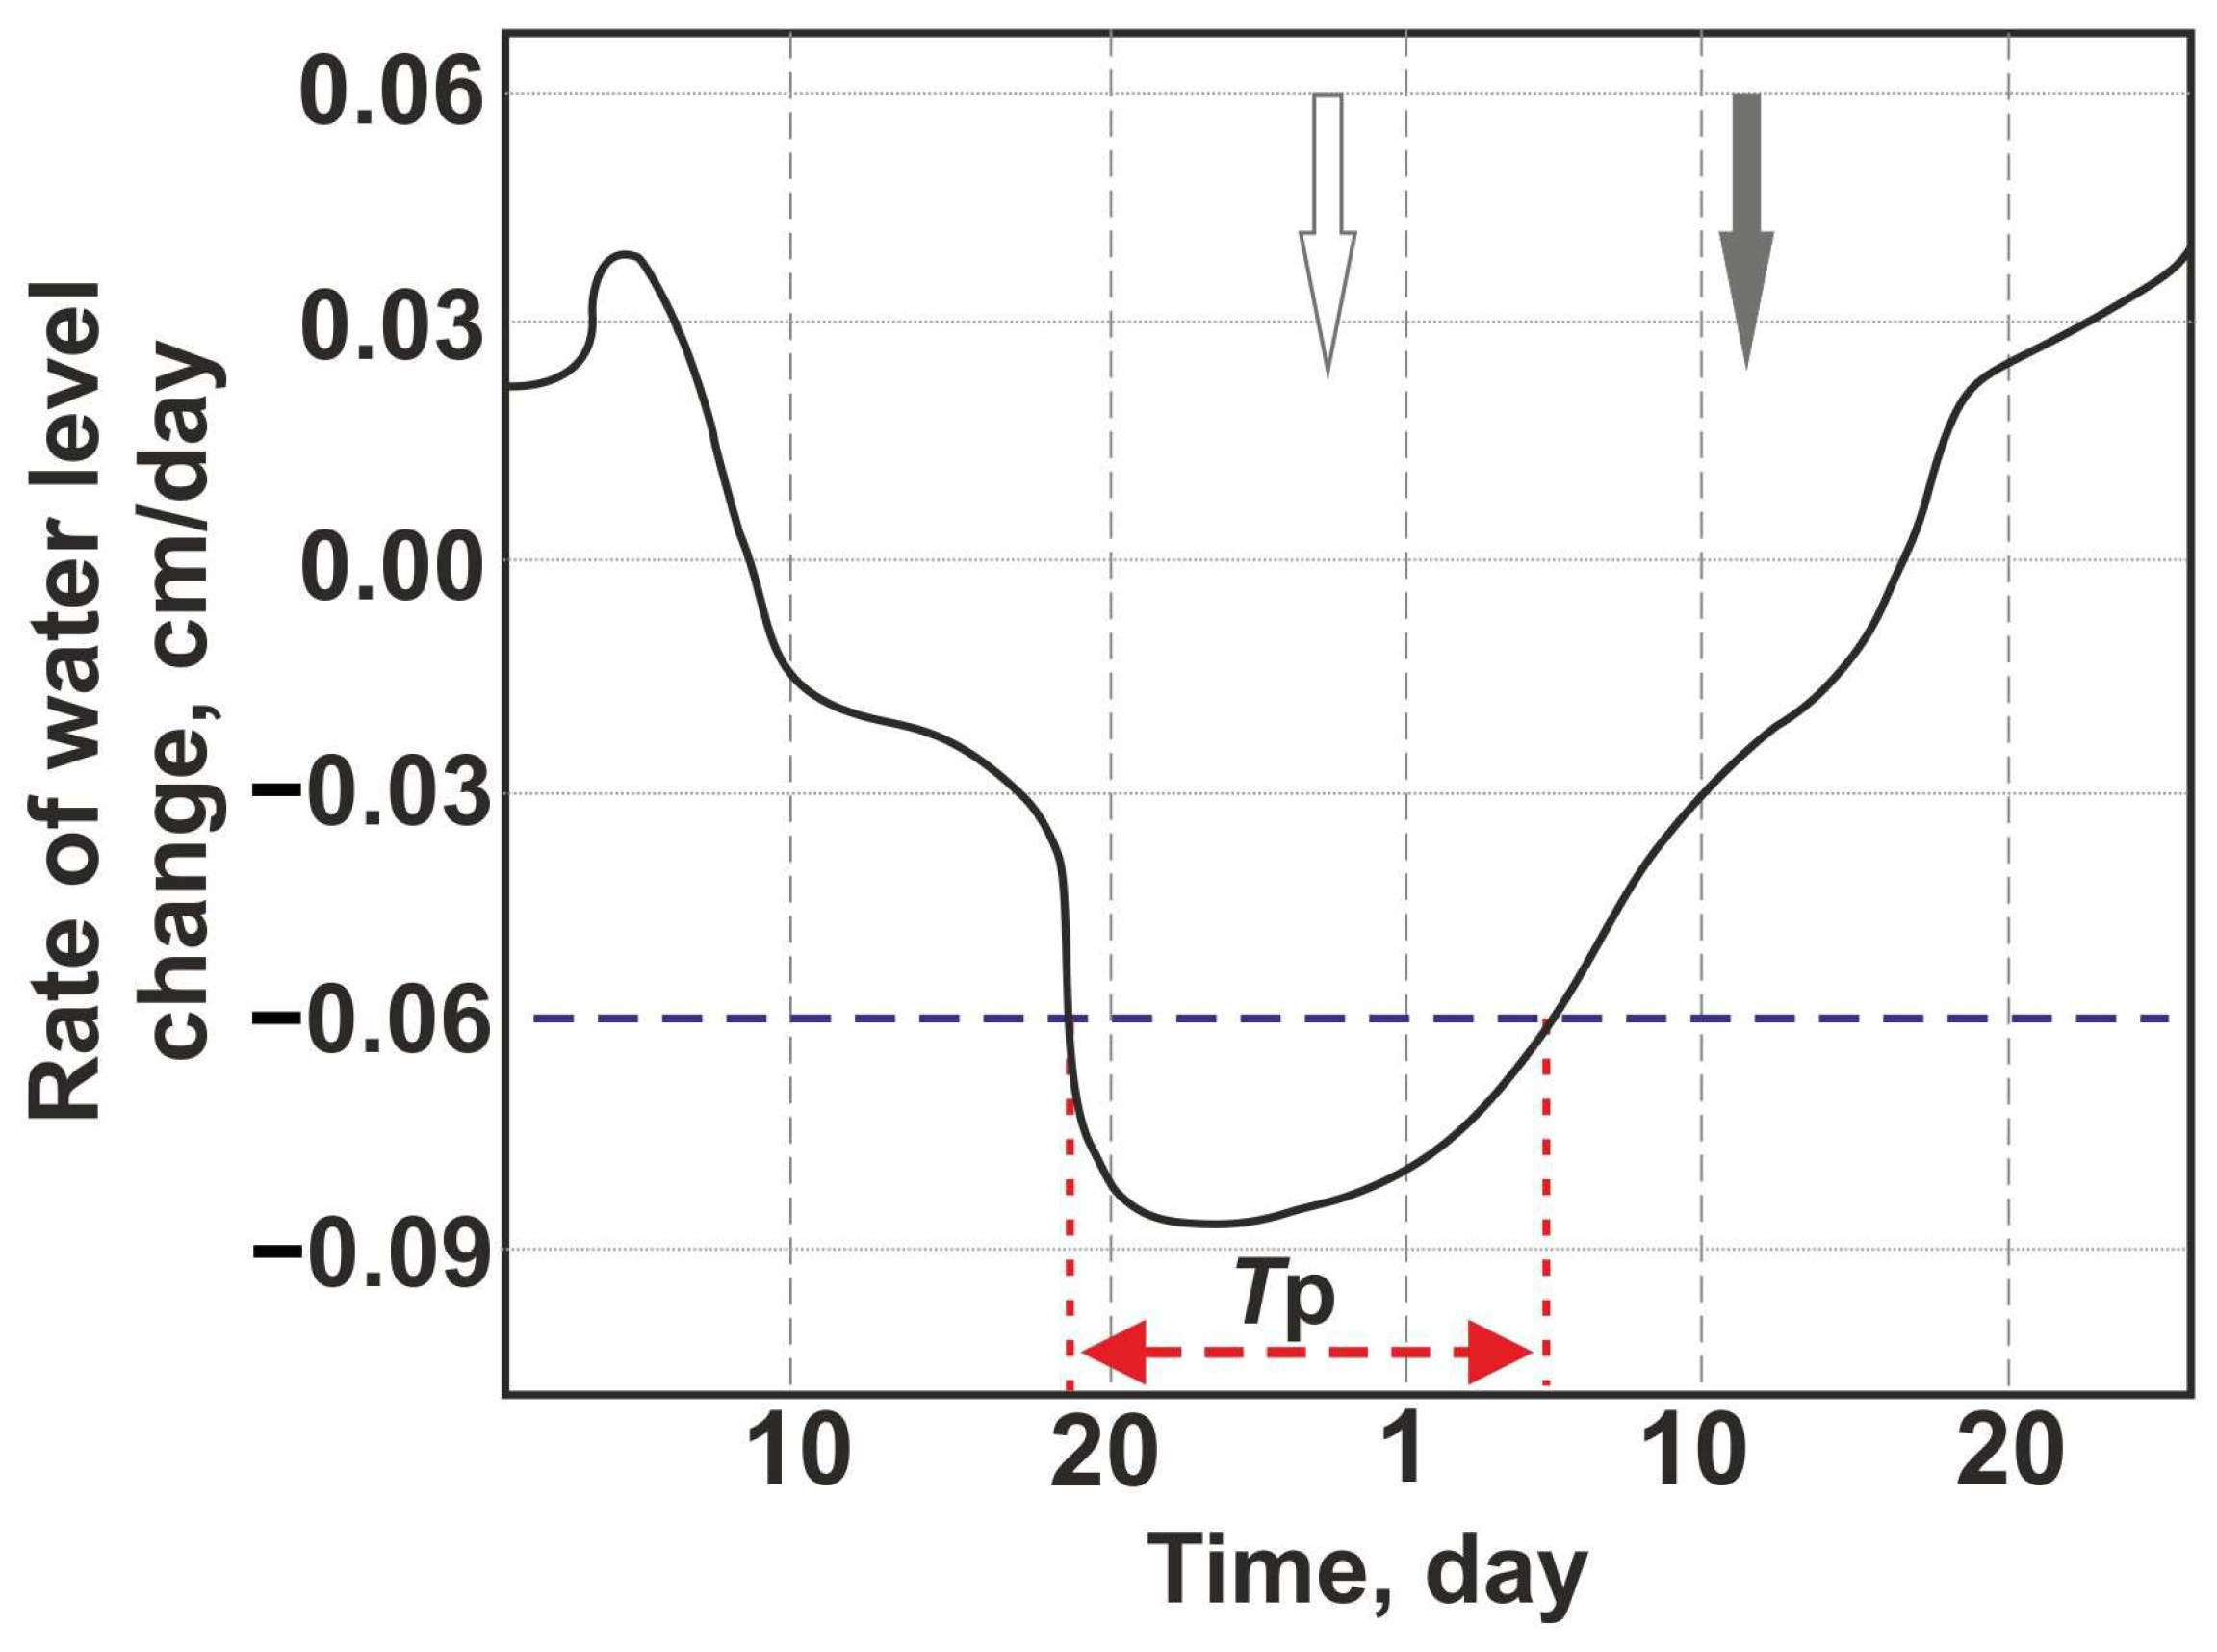
Figure 9.
The well E-1: (a) water level (A), water pressure (C) and their average daily rate changes (B, D) due to the earthquake on 3 April 2023, Mw = 6.6 (EQ), compared to precipitation, September 2022−May 2023. EQ is indicated with a red arrow. In the graphs of the daily average rate of water level and water pressure variations, arrows with numbers show: 1—1 January – the onset of the hydrogeodynamic precursor, 2—19 January – the date of submission of a forecast report on a potential strong earthquake to KB REC, 3—3 April – earthquake; the dashed line indicates the threshold of water level decrease rate. The bold dashed line outlines a fragment of observations, shown in the figure (b): A—water level and C—water pressure variations from 1 December 2022 to 30 May 2023, including hydrogeodynamic precursor and postseismic rise; B, C—average daily rate of water level and water pressure changes respectively in comparison with their threshold values.
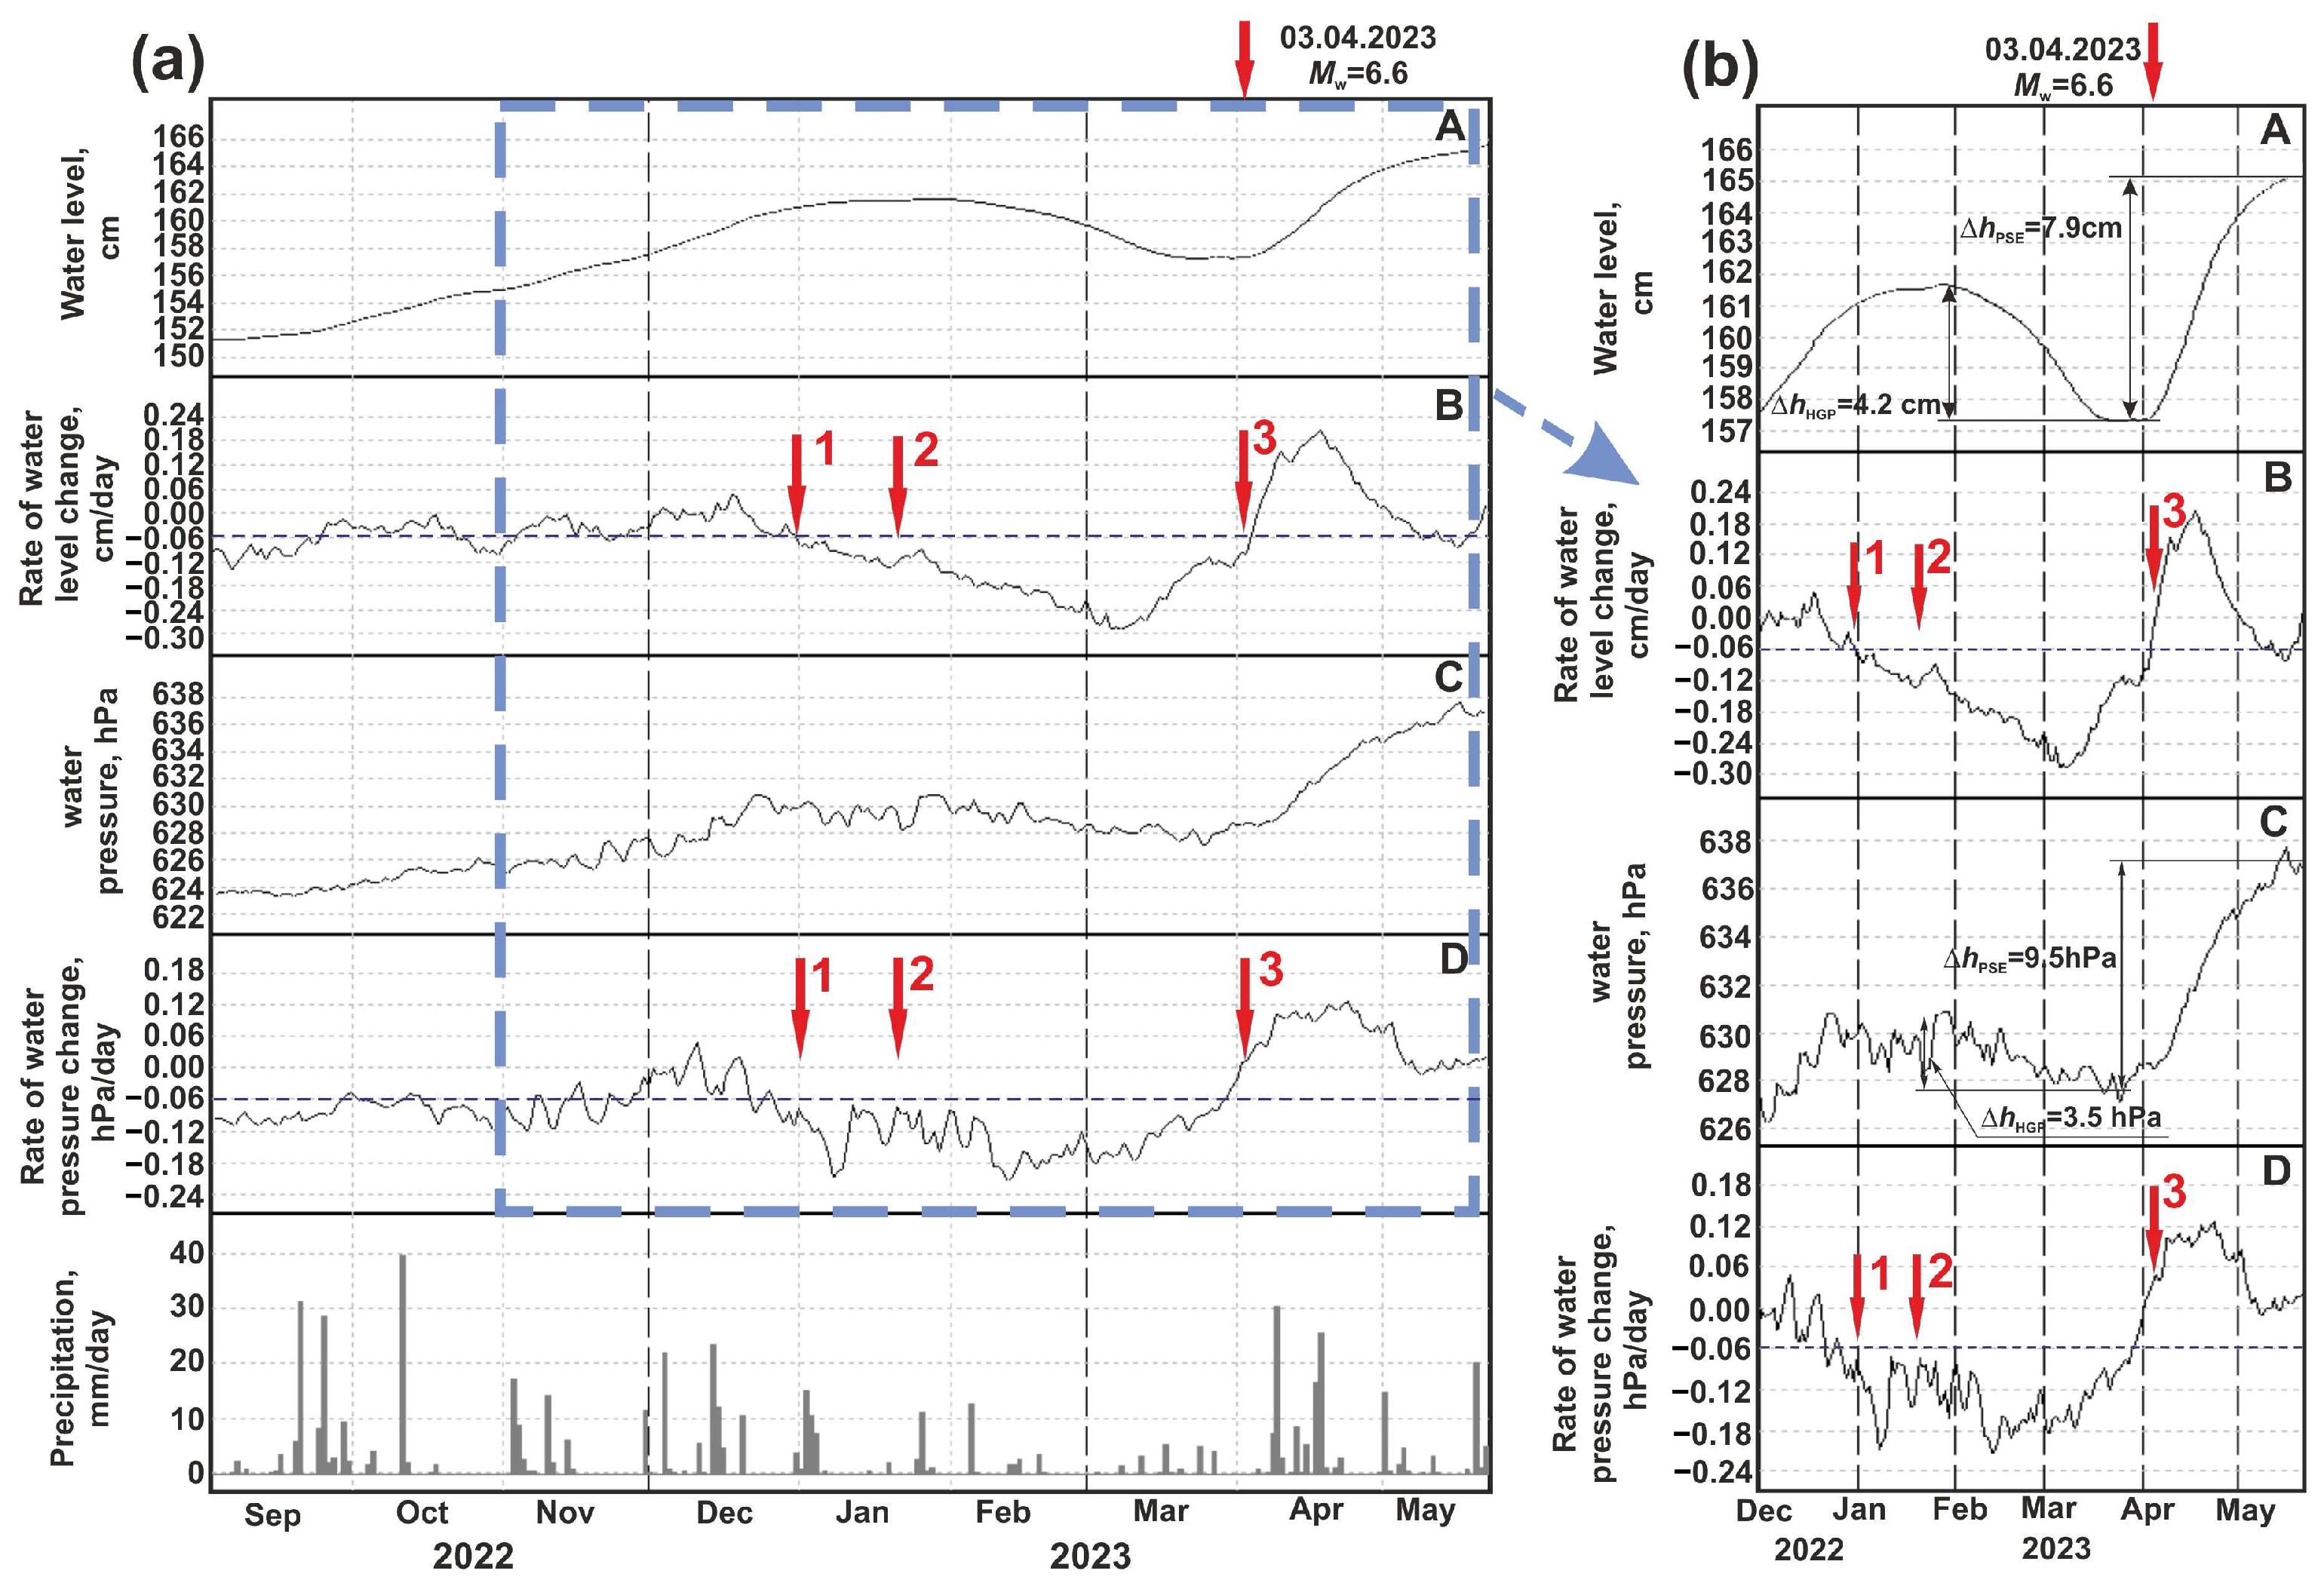
Table 1.
Observation Wells, Kamchatka Peninsula.
| Wells | Coor- dinates |
Precision observations start date (Precision observations duration*) |
Depth, m Open Interval, m |
Lithology: Age, Composition |
Water Level Depth, h, m Discharge rate, q, L/s; |
Water Temperature, °С |
Water Mineralization, g/L |
Water Type |
Gas Composition |
|---|---|---|---|---|---|---|---|---|---|
| YuZ-5 | 53.17°N 158.41°E |
Sept 1997 (26.4 years) |
800 310–800 |
К2, mudstone, shale |
piezometric h=1.5 |
14 | 0.45 | HCO3–SO4– Na–Ca |
dissolved gas, N2 |
| E-1 | 53.26°N 158.48°E |
Jan 1996 (28 years) |
665 625–645 |
N, Tuffs | piezometric h=27 |
10 | 1.5 | Cl–HCO3– Na |
free gas, N2–CH4 |
| 1303 | 53.14°N 158.36°E |
April 2021 (2.8 years) |
717 517–717 |
N, Tuffs | piezometric h=25 |
14 | 0.67 | HCO3–SO4– Na |
dissolved gas, N2 |
| M-1 | 53.18°N 158.28°E |
July 2020 (3.6 years) |
600 310–313 407–410 553–556 |
N, Tuffs | self-flowing, q=1.5 |
16 | 0.25 | SO4–Ca–Na | dissolved gas, N2 |
Notes: * Number of years as of February 01, 2024.
Disclaimer/Publisher’s Note: The statements, opinions and data contained in all publications are solely those of the individual author(s) and contributor(s) and not of MDPI and/or the editor(s). MDPI and/or the editor(s) disclaim responsibility for any injury to people or property resulting from any ideas, methods, instructions or products referred to in the content. |
© 2024 by the authors. Licensee MDPI, Basel, Switzerland. This article is an open access article distributed under the terms and conditions of the Creative Commons Attribution (CC BY) license (http://creativecommons.org/licenses/by/4.0/).
Copyright: This open access article is published under a Creative Commons CC BY 4.0 license, which permit the free download, distribution, and reuse, provided that the author and preprint are cited in any reuse.


