Submitted:
23 October 2024
Posted:
24 October 2024
You are already at the latest version
Abstract
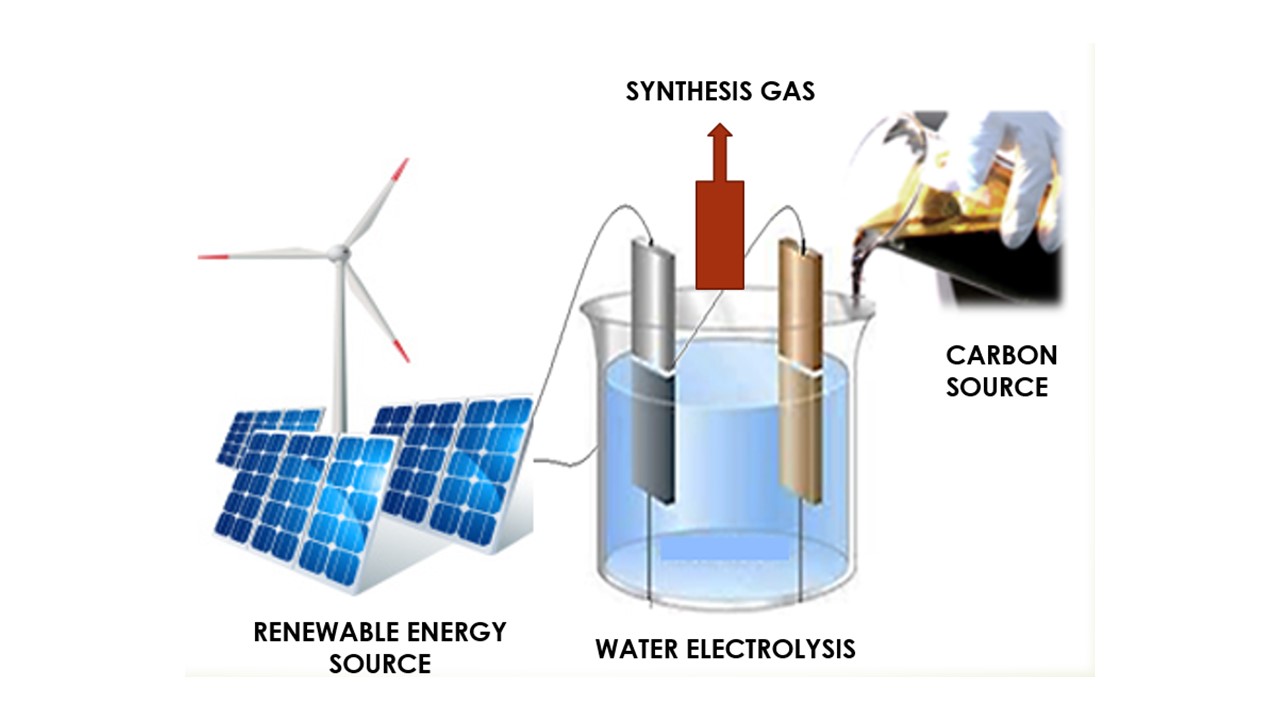
Developed within the scope of a collaborative R&DT project, a 1 kW pilot unit aimed to perform the recovery of previously liquefied biomass from lignocellulosic forest resi-dues, later used as a carbon source in a co-electrolysis process, intended for the pro-duction of synthesis gas (H2, CO, CO2), also known as syngas. The syngas will be trans-formed into other value-added products, namely synthetic biofuels such as methane, methanol or biodiesel. This paper presents the results of the research currently being carried out at ISEL with the objective of further advancing development on the pilot unit by the execution of optimization tests with and without the addition of two dif-ferent biomass types.
Keywords:
syngas
; Biomass
; Water Electrolysis
; Renewable energy
; Forest Wastes
1. Introduction
Today, an important amount of the World’s energy consumption is still based on fossil fuels, and thus, the harmful impacts of the combustion of fossil fuels are yet increasing in magnitude [1], which is devastating the environment and damaging the quality of life. Therefore, global energy transformation is taking place, which has been accelerated by the rapid development of using renewable energy [2]. To enhance this drive and to reduce atmospheric emissions, H2 has been considered a promising energy carrier, as generating electricity from H2 using a fuel cell or in combustion systems causes no local pollution as the only by-product is pure water. Hydrogen/synthesis gas can be produced locally, which also contributes to reducing countries’ dependence on external energy suppliers and can be extracted from an extensive range of substances, such as oil, gas and water. Decomposing water by electrolysis offers promising opportunities in terms of promoting synergies with renewable energies. H2 and synthesis gas can be produced and stored before its use due to the intermittent nature of renewable energy sources, so it is suitable for distributed production and centralised production connected specifically to remote renewable resources. Advances in integrating H2 and syngas in power systems have been made in recent years ranging from production and storage to re-electrification and safety matters [3]. Nevertheless, several integration issues still require adequate answers calling for applied research to solve and optimize possible solutions in order to achieve cost-effective approaches within the scope of a green fuel economy [4].
Since 2014, this research team has been investigating this particular field in cooperative research, following the design of a process capable of generating synthesis gas, composed of CO2, CO, O2 and H2, with traces of CH4, from alkaline water electrolysis using graphite electrodes [5]. During the first financed project, the laboratory proof of concept was made [6], which allowed proceeding to further developments under other funded projects, which resulted in the test and optimized operation of a 1 kW pilot rig producing synthesis gas coupled with a heterogeneous tubular reactor able to produce methane and methanol [7, 8]. More recently, another nationally funded project [9] aims to promote the development of a pilot (patented) system to produce syngas without separation of the generated gases. This novel process, intended as a positive contribution in reducing the dependence on fossil fuels, combines alkaline water electrolysis with the addition of a carbon source in the form of graphite composing the disks inside the stack and, also, added liquified biomass obtained from forest residues [9]. Syngas has several potential uses for the modern industry, as it can be converted into other synthetic fuels, both gaseous like methane or liquid such as gasoline and diesel, through processes such as the Fischer-Tropsch or the methanol-to-gasoline conversion [10]. It can also be used as a feedstock for the production of a wide range of chemicals, including methanol, ammonia, and acetic acid. In addition, syngas can be burned to generate electricity in gas turbines or internal combustion engines and substitute more expensive or scarce feedstocks in refinery processes, such as the hydrogen production taking place in petroleum refining [11].
2. Materials and Methods
As displayed schematically in Figure 1, the prototype unit consists of an electrolyte reservoir, a set of pressure and temperature sensors, a pump, a radiator with a fan (in order to control the temperature of the process), a heating resistance, a moisture adsorption column and an electrolyzer consisting of a stack of 11 spaced graphite discs. Figure 2 shows an aspect of the prototype unit.
The production of synthesis gas via electrochemical means is based on the following reactions:
i) cathode reactions:
2H2O + 2 e- → 2H2 + 2OH-Equation (1)
ii) anode reactions:
4OH- → O2 + H2O + 4e- Equation (2)
2C + O2 → 2CO Equation (3)
2CO + O2 → 2CO2 Equation (4)
iii) Global reaction:
2H2O +C + We → 2H2 + CO2 Equation (5)
Current experimental work focuses on carrying out optimization tests to determine the ideal conditions for the production of syngas to be used, in the future, as a feedstock for methane production. For this specific purpose, the syngas produced aims to have oxygen content as low as possible (to minimize the risk of catalyst deactivation during methanation) and a CO2:H2 ratio ideally close to the one associated with the conversion of CO2 into methane (1:4) [12].
Two different biomass types were tested for two different concentrations (2.5 and 5 % (w/w)) in order to allow comparisons with each other and the respective performance with and without the use of any liquified biomass. In all tests, the electrolyte used was a 1M solution of NaOH, as indicated schematically in Figure 3.
The 1 kW prototype plant has a stack with 12 cells (graphite bipolar electrodes), the distance between electrodes being 5 mm. The electrodes have a diameter of 117 mm (100 cm2 area) and 5 mm thickness with 10 mm two holes to allow for circulation. The electrolyte used is NaOH (0.4 M). The dimensions of each electrode can be found in Figure 4.
The electrolyte used is NaOH (1 M). A pump is used to circulate the electrolyte from the reservoir to the stack. The electrolyte solution together with the produced gaseous phase leaves the stack from the top and is guided through the tubes into the initial tank where the liquid phase is recirculated while the gaseous phase is separated and leaves the tank through a pressure valve. Since the produced gas phase leaving the tank still carries some steam, it needs to be passed through a cooling serpentine to condense the bulk of the water that is then collected in the following drainable reservoir. The remaining gas exists from a second hole on the top and is passed through a cylindrical tank filled with a molecular sieve (2.0-5.0 mm) to remove any remaining moisture. Following the removal of the majority his humidity, the gases enter a group of sensors to analyse and determine their pressure, temperature, remaining humidity as well as its composition. Control and adjustable operational parameters are: voltage/current, temperature and pressure, and the current of each stack is separately monitored.
To optimize syngas production and its composition, three different groups of tests were executed, one without the addition of liquified biomass, one using a liquified sample of Acacia biomass and another using a sample of non-specified composition designated as Energreen, obtained from the liquefaction of a mixture of cork, eucalyptus and pine wood [13]. Each sample was diluted in the electrolyte solution at 2.5 and 5 % (w/w) and each one was tested within an interval of pressure (4 and 5 bar gauge) and temperature (100 and 110 ºC).
Each test was executed over a period of 3 hours with temperature, pressure, flow of gas produced, and current applied among other data, being monitored every 5 minutes. To simplify the analysis and presentation the average of the 3 last measurements in a stationary state was collected and presented as the shortened results for each test. Through these methods, it was possible to evaluate how the operational conditions affect the flow rate of gas produced and its composition (which constitute the most important set of results). These tests were performed bearing in mind the intended use of the syngas produced for subsequent methane production, with the aim of:
i) having an oxygen content as low as possible, to minimize the risk of catalyst deactivation during methanation;
ii) a CO2:H2 ratio ideally close to the one associated with the conversion of CO2 into methane (1:4) via the following reaction:
CO2 + 4H2 → CH4 + H2O Equation (6);
iii) a good relation between the flow of gas produced and the energy consumed to produce it.
3. Results
As an example, of the results obtained in each test, Figure 5 and Table 1 display the variations in terms of compositions and the results collected throughout one of the tests: in this case the one at 4 bar gauge at 100 ºC with 5% Acacia.
As a way to resume the results of each individual test, Table 2 displays an average of the 3 last measurements, in a stationary state, for each key parameter as well as a final CO2:H2 ratio to allow for a better comparison.
The obtained results are shown graphycally in figures 6 and 7, as follows: a) Figure 6: performance results obtained without the use of biomass; b) Figure 7: performance results obtained with the use of biomass.
4. Discussion
By analysing the results obtained, it can be concluded that the additions of liquified biomass boosted CO2 production leading to a significant increase in its content within the gas outlet. As a consequence, it also lowered the CO2:H2 ratio. Additionally, the higher CO2 production also requires more O2 consumption, generating syngas with lower O2 concentration.
Focusing on the production of syngas specifically for future use in methanation, the addiction of biomass, specifically Acacia shows favoured results regarding the production of a syngas mixture while lowering its O2 content. On the other hand, CO2:H2 ratios are farther from the ideal value when compared to the ideal 0.25, as expected. However, this can be easily resolved either by a later addition of H2 or alternatively, by the partial removal of its CO2 (with this still being an easier approach compared to removing the O2).
Energreen, on the other hand, produced a more optimal CO2:H2 ratio (at the cost of lower O2 consumption), and most importantly, has shown the best relation between energy consumed and gas production.
Regarding process conditions, both biomasses showcased different behaviour towards pressure, temperature, and its concentration. In the case of Acacia, the preferable conditions are 4 bar gauge at 110 ºC, as these result in lower O2 and energy consumption. Between the two tested concentrations, arguably the 2.5% mixture offered the best performance by having consistently the lowest energy expenditure while producing a more optimal CO2:H2 ratio.
In what regards Energreen, on the other hand, it is not as clear which of the two concentrations offers the best performance with 2.5% producing syngas at a lower energy cost and being close to 5% in terms of O2 content but producing a less ideal CO2:H2 ratio. The same can be said for pressure and temperature. If the priority is the reduction of O2 content, the observed ideal conditions were 5 bar gauge at 110 ºC. Although reducing energetic costs is deemed more important, than the best conditions were 4 bar gauge at 110 ºC.
5. Conclusions
The additions of liquified biomass resulted in a significant increase in the CO2 content of the gas outlet, resulting in a lower CO2:H2 ratio. Additionally, higher CO2 production also requires more O2 consumption, generating syngas with less O2. Focusing on the production of syngas to be used in methanation, Acacia shows favoured results in lowering its O2 content. On the other hand, CO2:H2 ratios as expected are far from the ideal 0.25. However, this can be easily resolved either by later addition of H2 or, alternatively, by partial removal of the CO2 (with this still being an easier approach compared to removing O2).
Author Contributions
Conceptualization, J.R., J.P. and J.G.; methodology, J.P. and J.G.; investigation, D.M. and T.C.; writing—original draft preparation, D.M.; writing—review and editing, J.P. and J.G. All authors have read and agreed to the published version of the manuscript.
Funding
This research was funded by FCT – Fundação para a Ciência e Tecnologia, I.P., Portugal I&D project CLEANFOREST (PCIF/GVB/0167/2018).
Data Availability Statement
Data is contained within the article or supplementary material.
Conflicts of Interest
The authors declare no conflicts of interest.
References
- B.P. Statistical Review (2022). Statistical Review of World Energy Globally Consistent Data.
- Ma, X.; Fu, Q. The influence of financial development on energy consumption: Worldwide evidence. Int. J. Environ. Res. Public Health 2020, 17. [Google Scholar] [CrossRef] [PubMed]
- Yue, M.; Lambert, H.; Pahon, E.; Roche, R.; Jemei, S. Hydrogen energy systems: a critical review of technologies, applications, trends and challenges. Renewable and Sustainable Energy Reviews 2021, 146, 111180. [Google Scholar] [CrossRef]
- Oyeakale, J.; Petrollese, M.; Tola, V.; Cau, G. Impacts of renewable energy resources on effectiveness of grid-integrated systems: succint review of current challenges and potential solution strategies. Energies 2020, 13, 4856. [Google Scholar] [CrossRef]
- Rodrigues, J. (2013) Patente portuguesa 106779T (In Portuguese).
- Guerra, L.; Gomes, J.; Puna, J.; Rodrigues, J. Production of renewable synthetic fuels from electricity using the ELECTROFUEL® concept. Energy 2015, 89, 1050–1056. [Google Scholar] [CrossRef]
- Guerra, L.; Moura, K.; Rodrigues, J.; Gomes, J.; Puna, J.; Santos, M. Synthesis gas production from water electrolysis, using the Electrocracking concept. Journal of Environmental Chemical Engineering 2018, 6, 604–609. [Google Scholar] [CrossRef]
- Gonçalves, A.; Puna, J.; Guerra, L.; Rodrigues, J.; Gomes, J.; Santos, M.; Alves, D. Towards the Development of Syngas/Biomethane Electrolytic Production, Using Liquefied Biomass and Heterogeneous Catalyst. Energies 2019, 12, 3787. [Google Scholar] [CrossRef]
- Gomes, J.; Puna, J.; Marques, A.; Gominho, J.; Lourenço, A.; Galhano, R.; Ozkan, S. Clean Forest – Project concept and early results. Energies 2022, 15, 9294. [Google Scholar] [CrossRef]
- Chen, X.; Guan, C.; Xiao, G.; Du, X.; Wang, J. Syngas production by high temperature steam/CO2 co-electrolysis using solid oxide electrolysis cells. Faraday Discussions 2015, 182, 341–351. [Google Scholar] [CrossRef] [PubMed]
- Kumar, S.; Lim, H. An overview of water electrolysis technologies for green hydrogen production. Energy Reports 2022, 8, 13793–13813. [Google Scholar] [CrossRef]
- Guerra, L.; Rossi, S.; Rodrigues, J.; Gomes, J.; Puna, J.; Santos, M. Methane production by a combined Sabatier reaction/water electrolysis process. Journal of Environmental Chemical Engineering 2018, 6, 671–676. [Google Scholar] [CrossRef]
- Mateus, M.; Acero, N.; Bordado, J.; Santos, R. Sonication as a foremost tool to improve cork liquefaction, Industrial Crops and Products 2015, 74, 9–13. 74.
Figure 1.
Simplified flowsheet of the process.
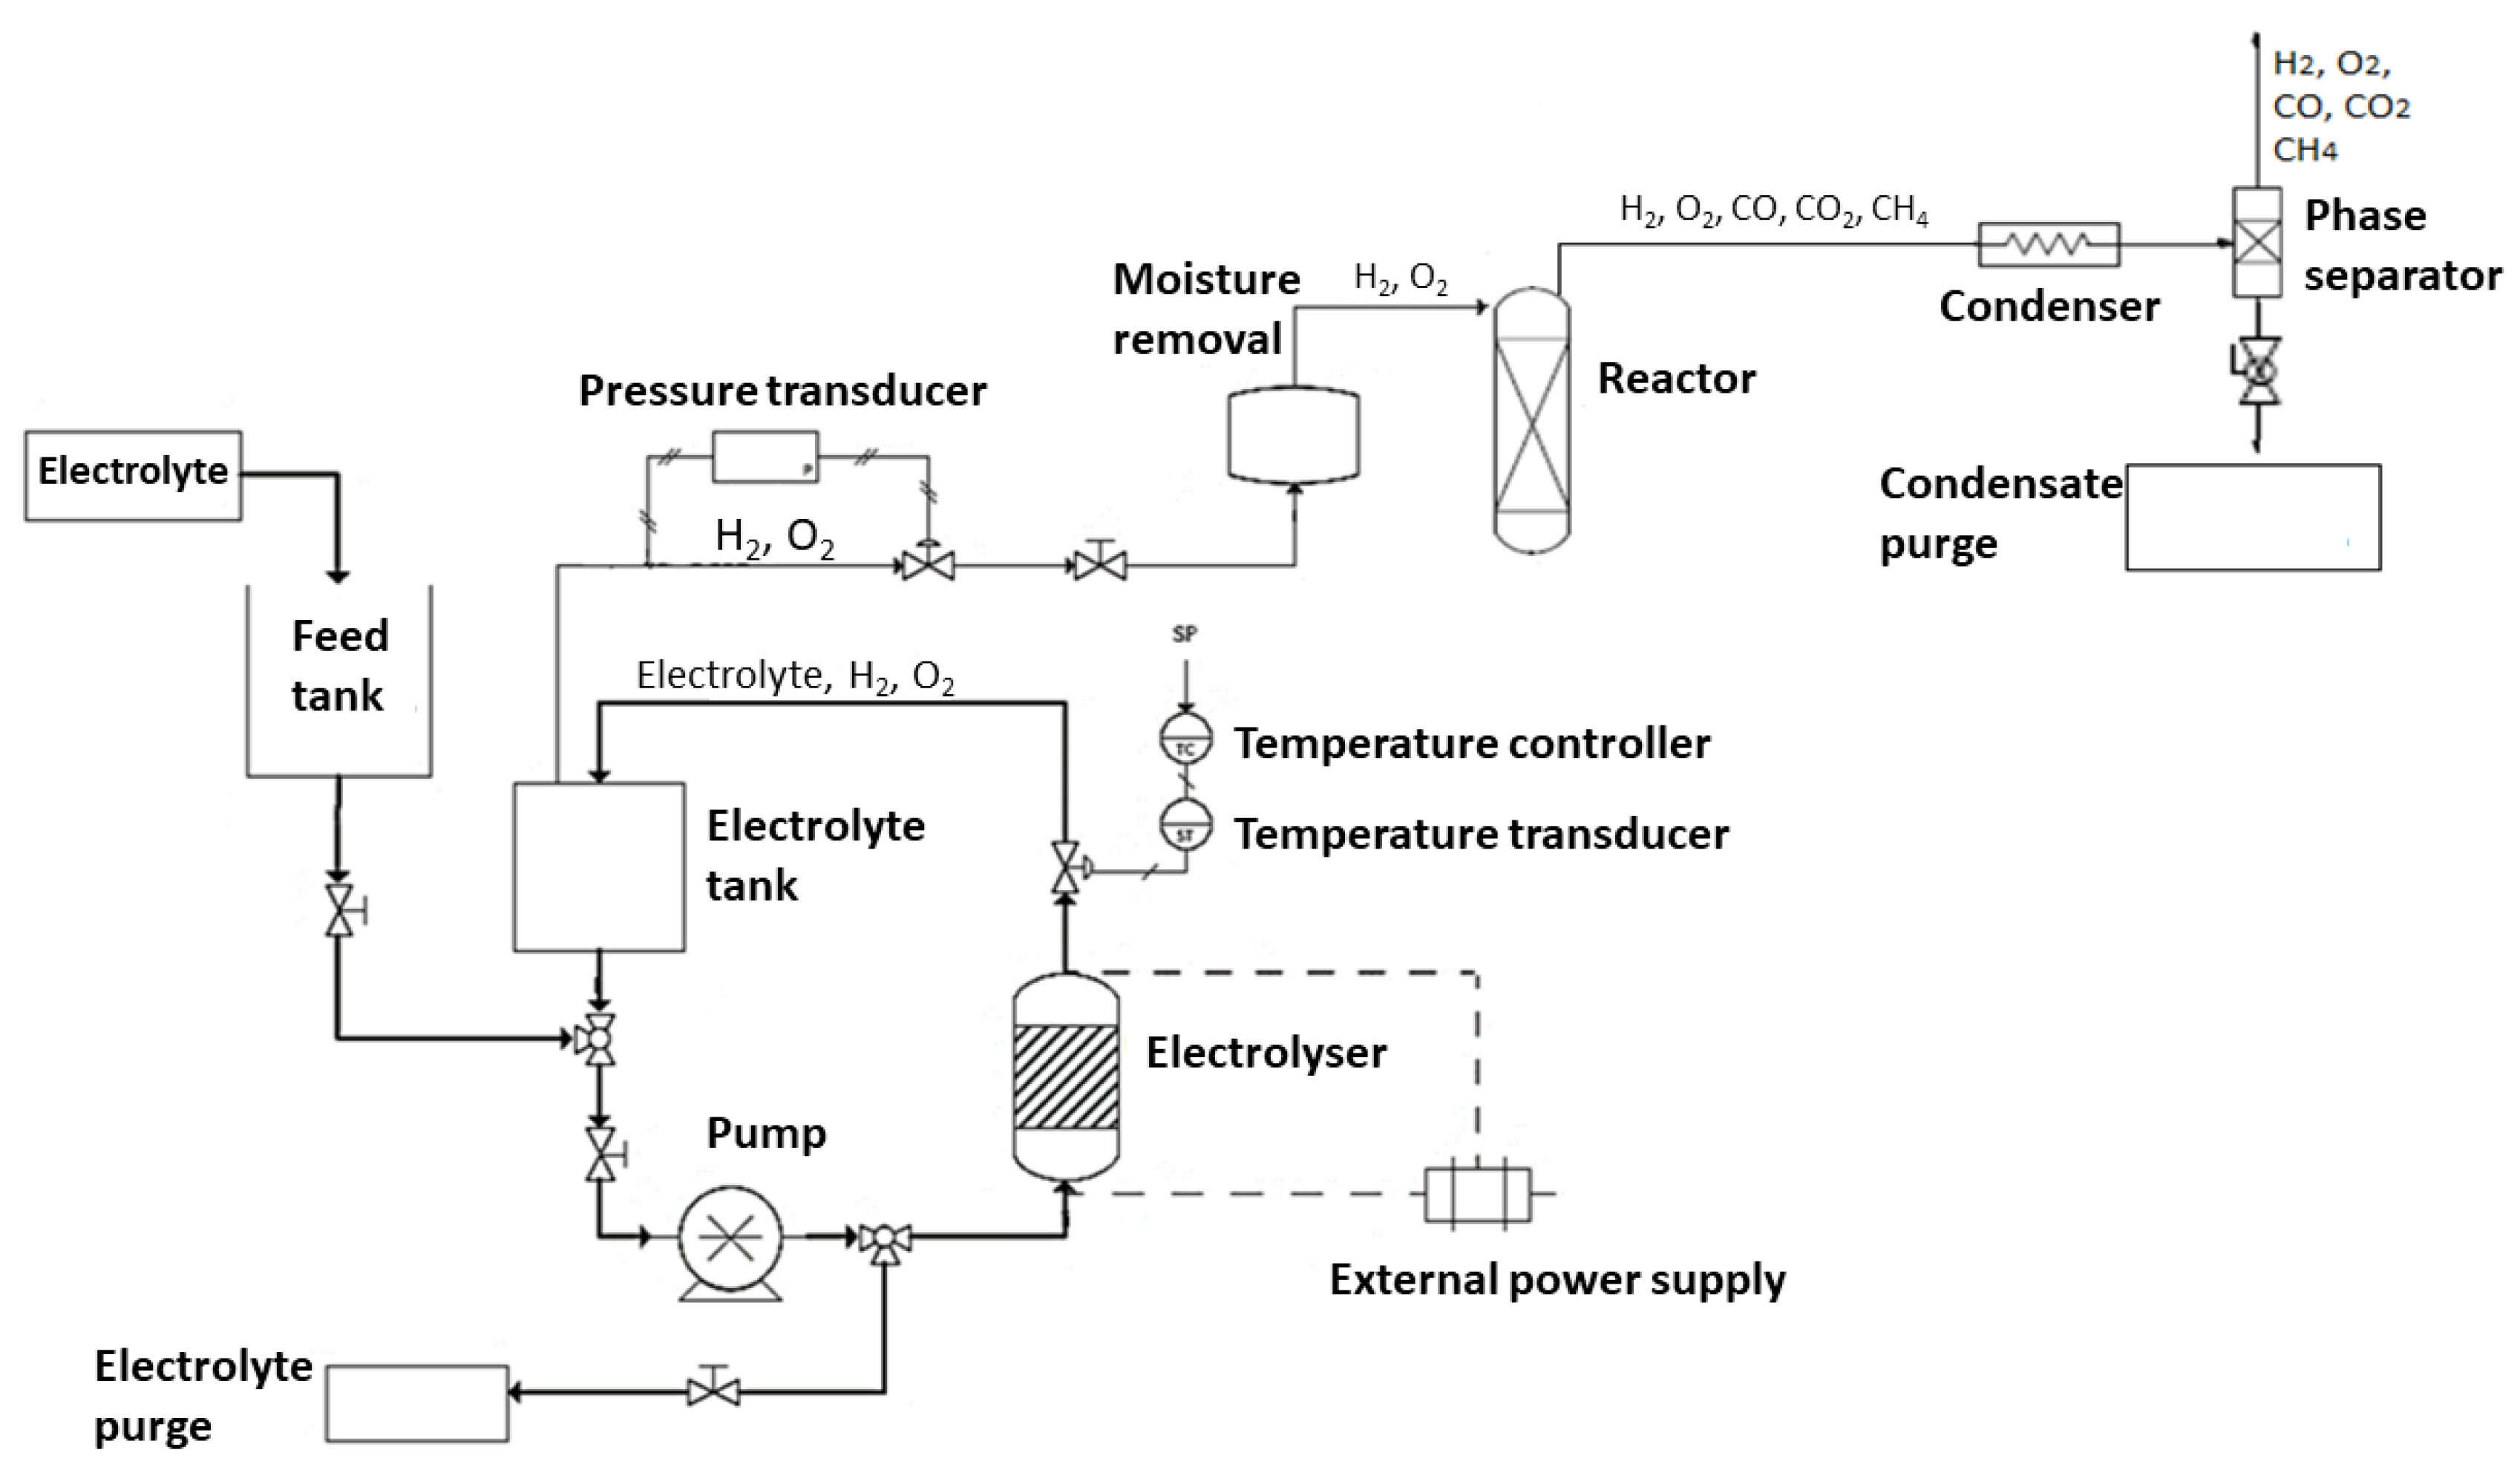
Figure 2.
Overview of the prototype unit.
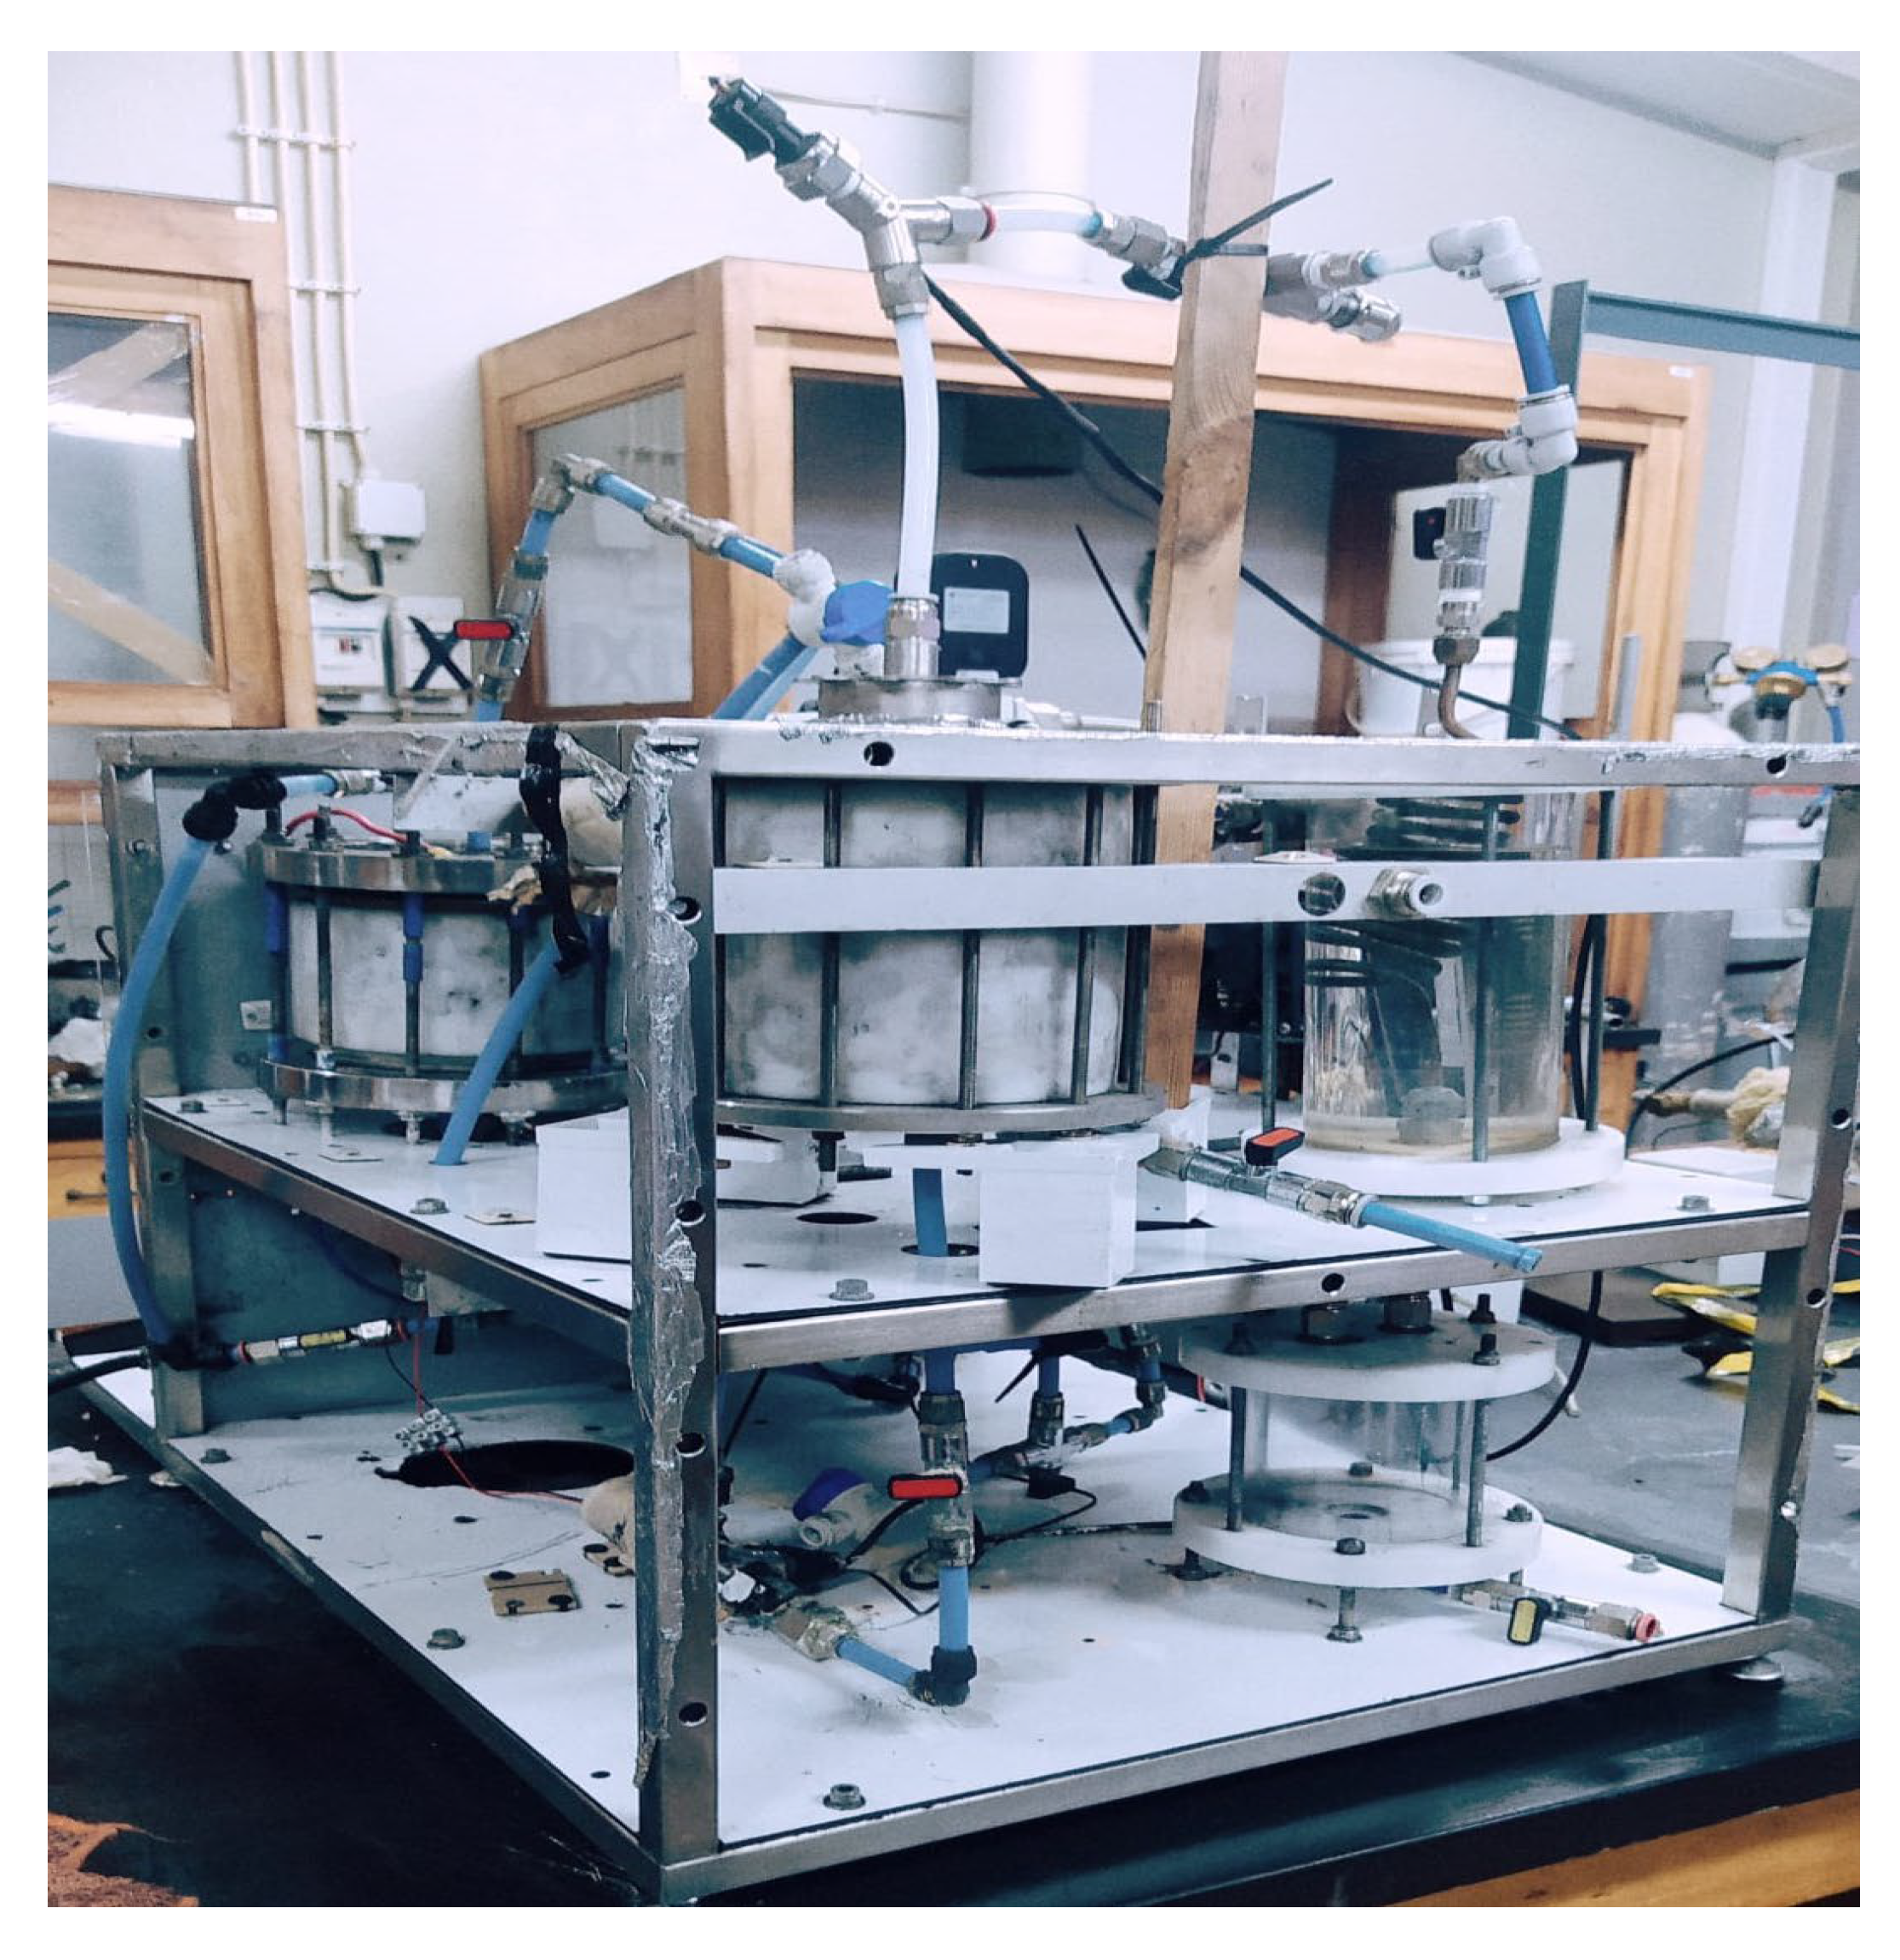
Figure 3.
Schematic representation of the operational set-up.
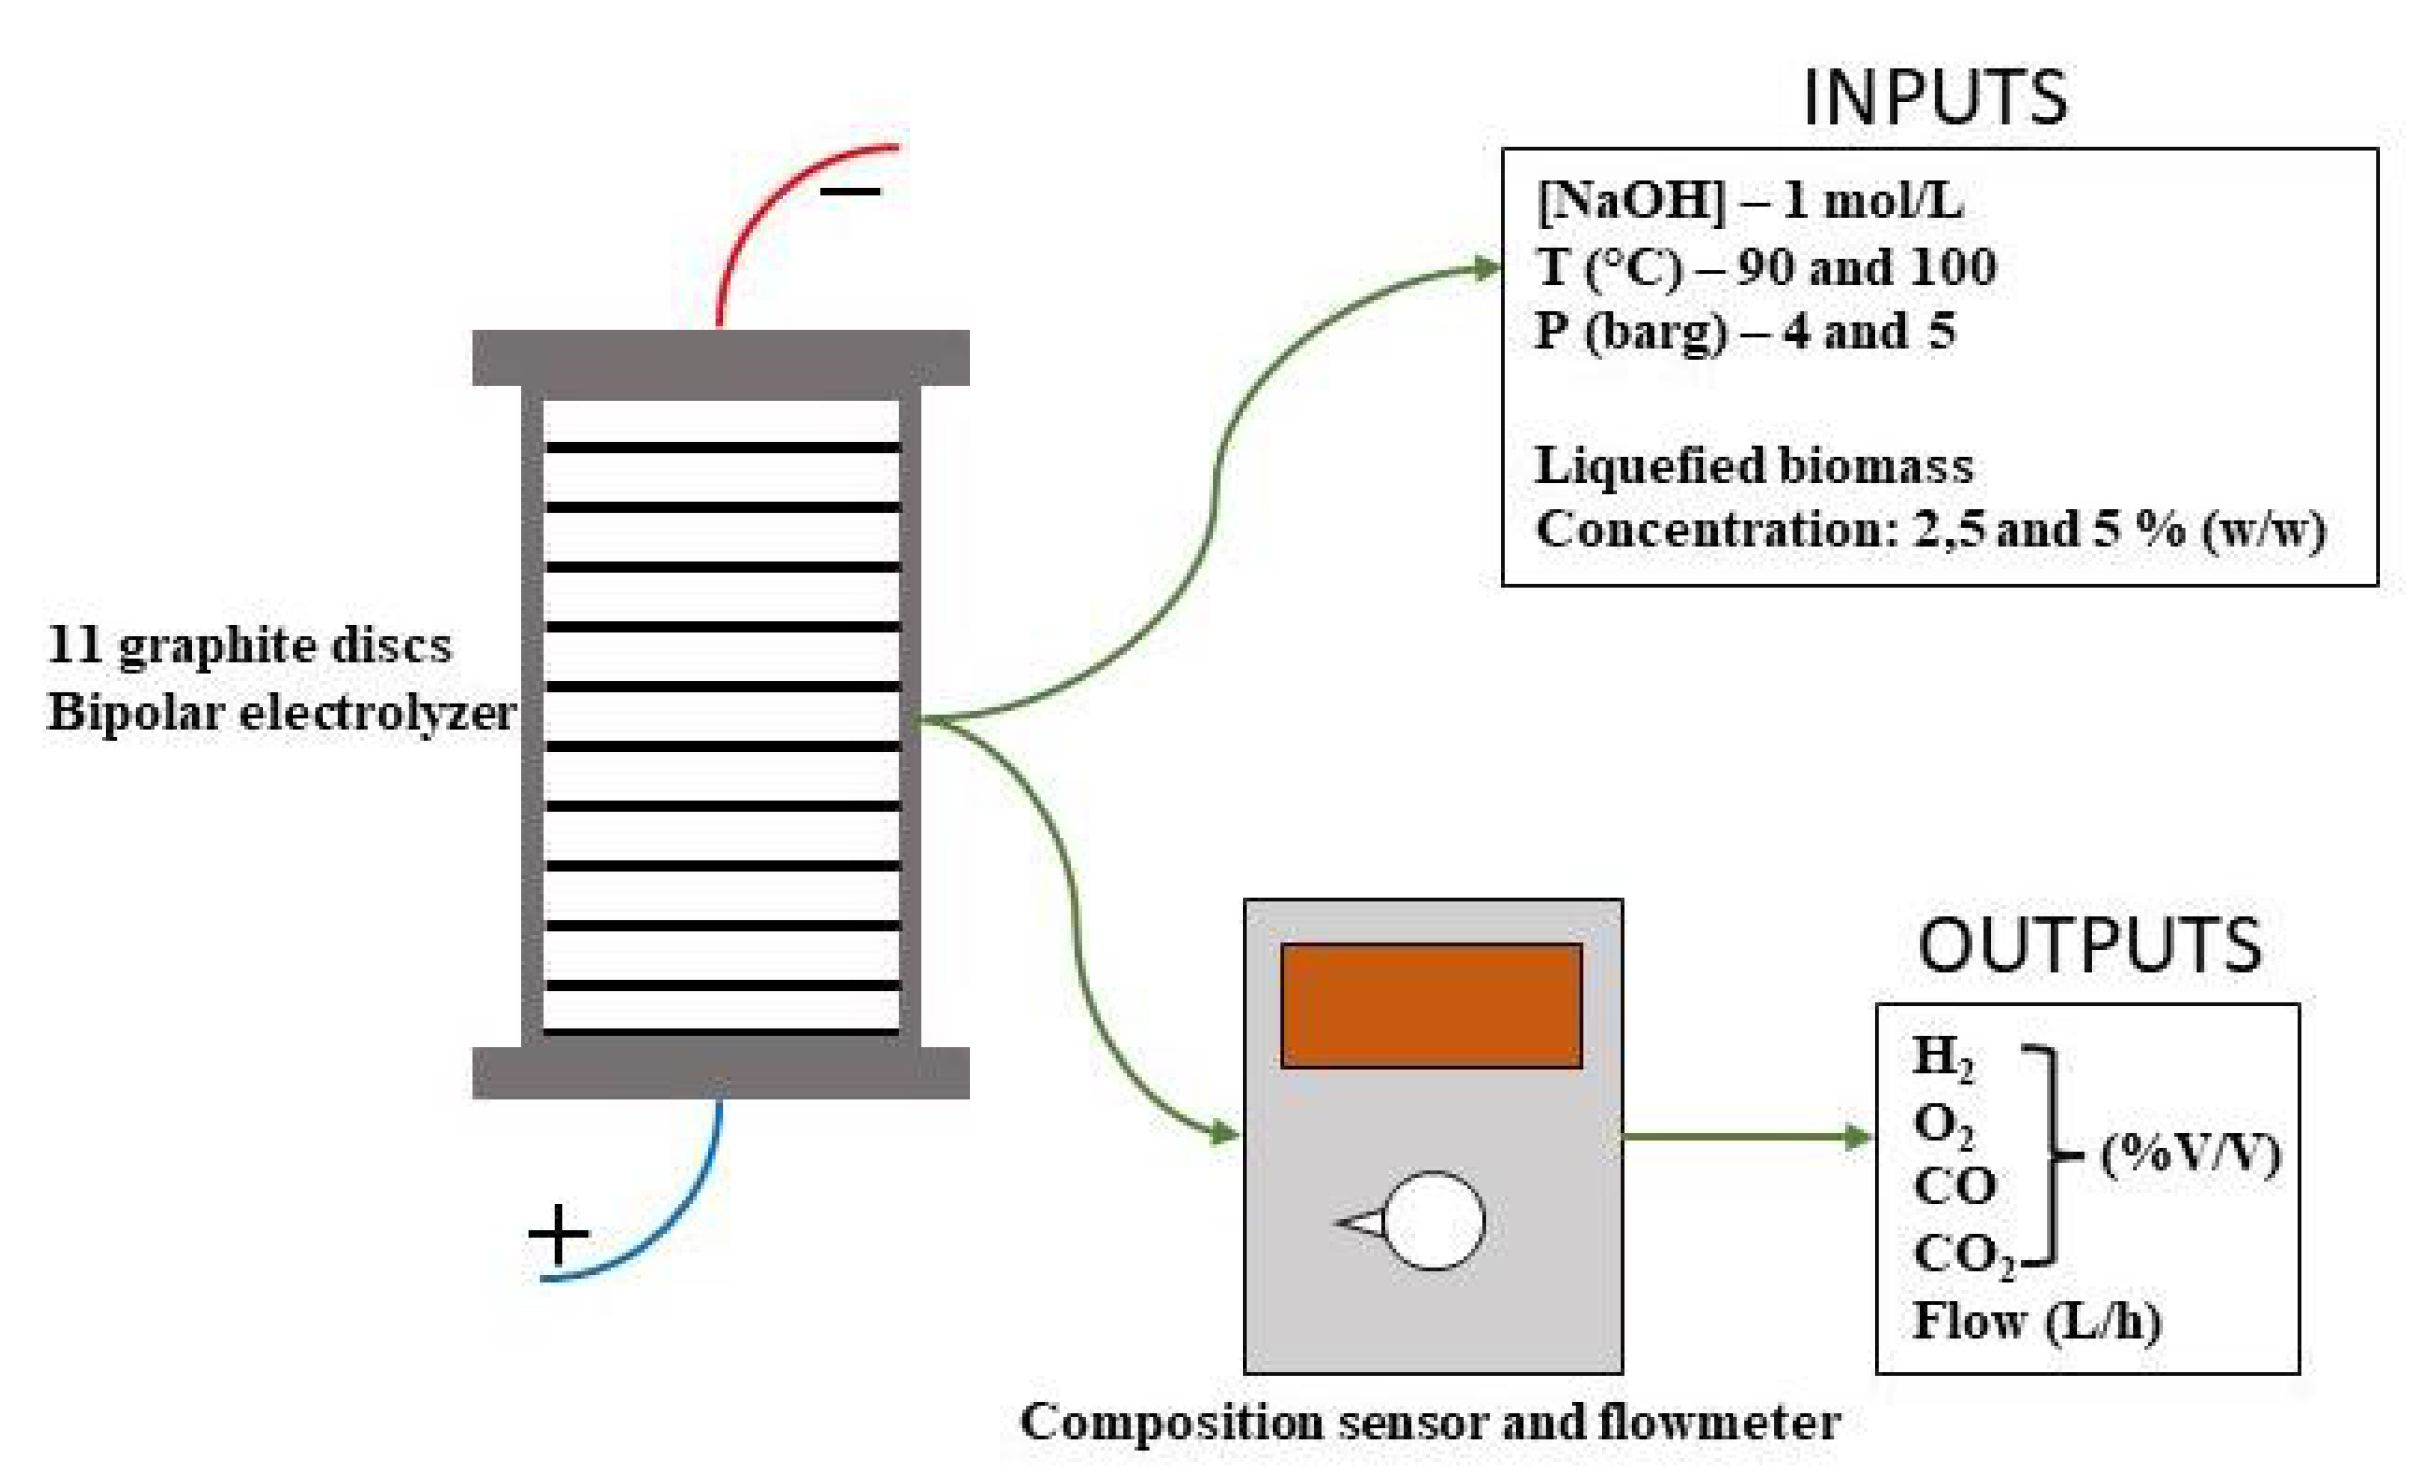
Figure 4.
Graphite disks dimensions/specifications (dimensions in mm).
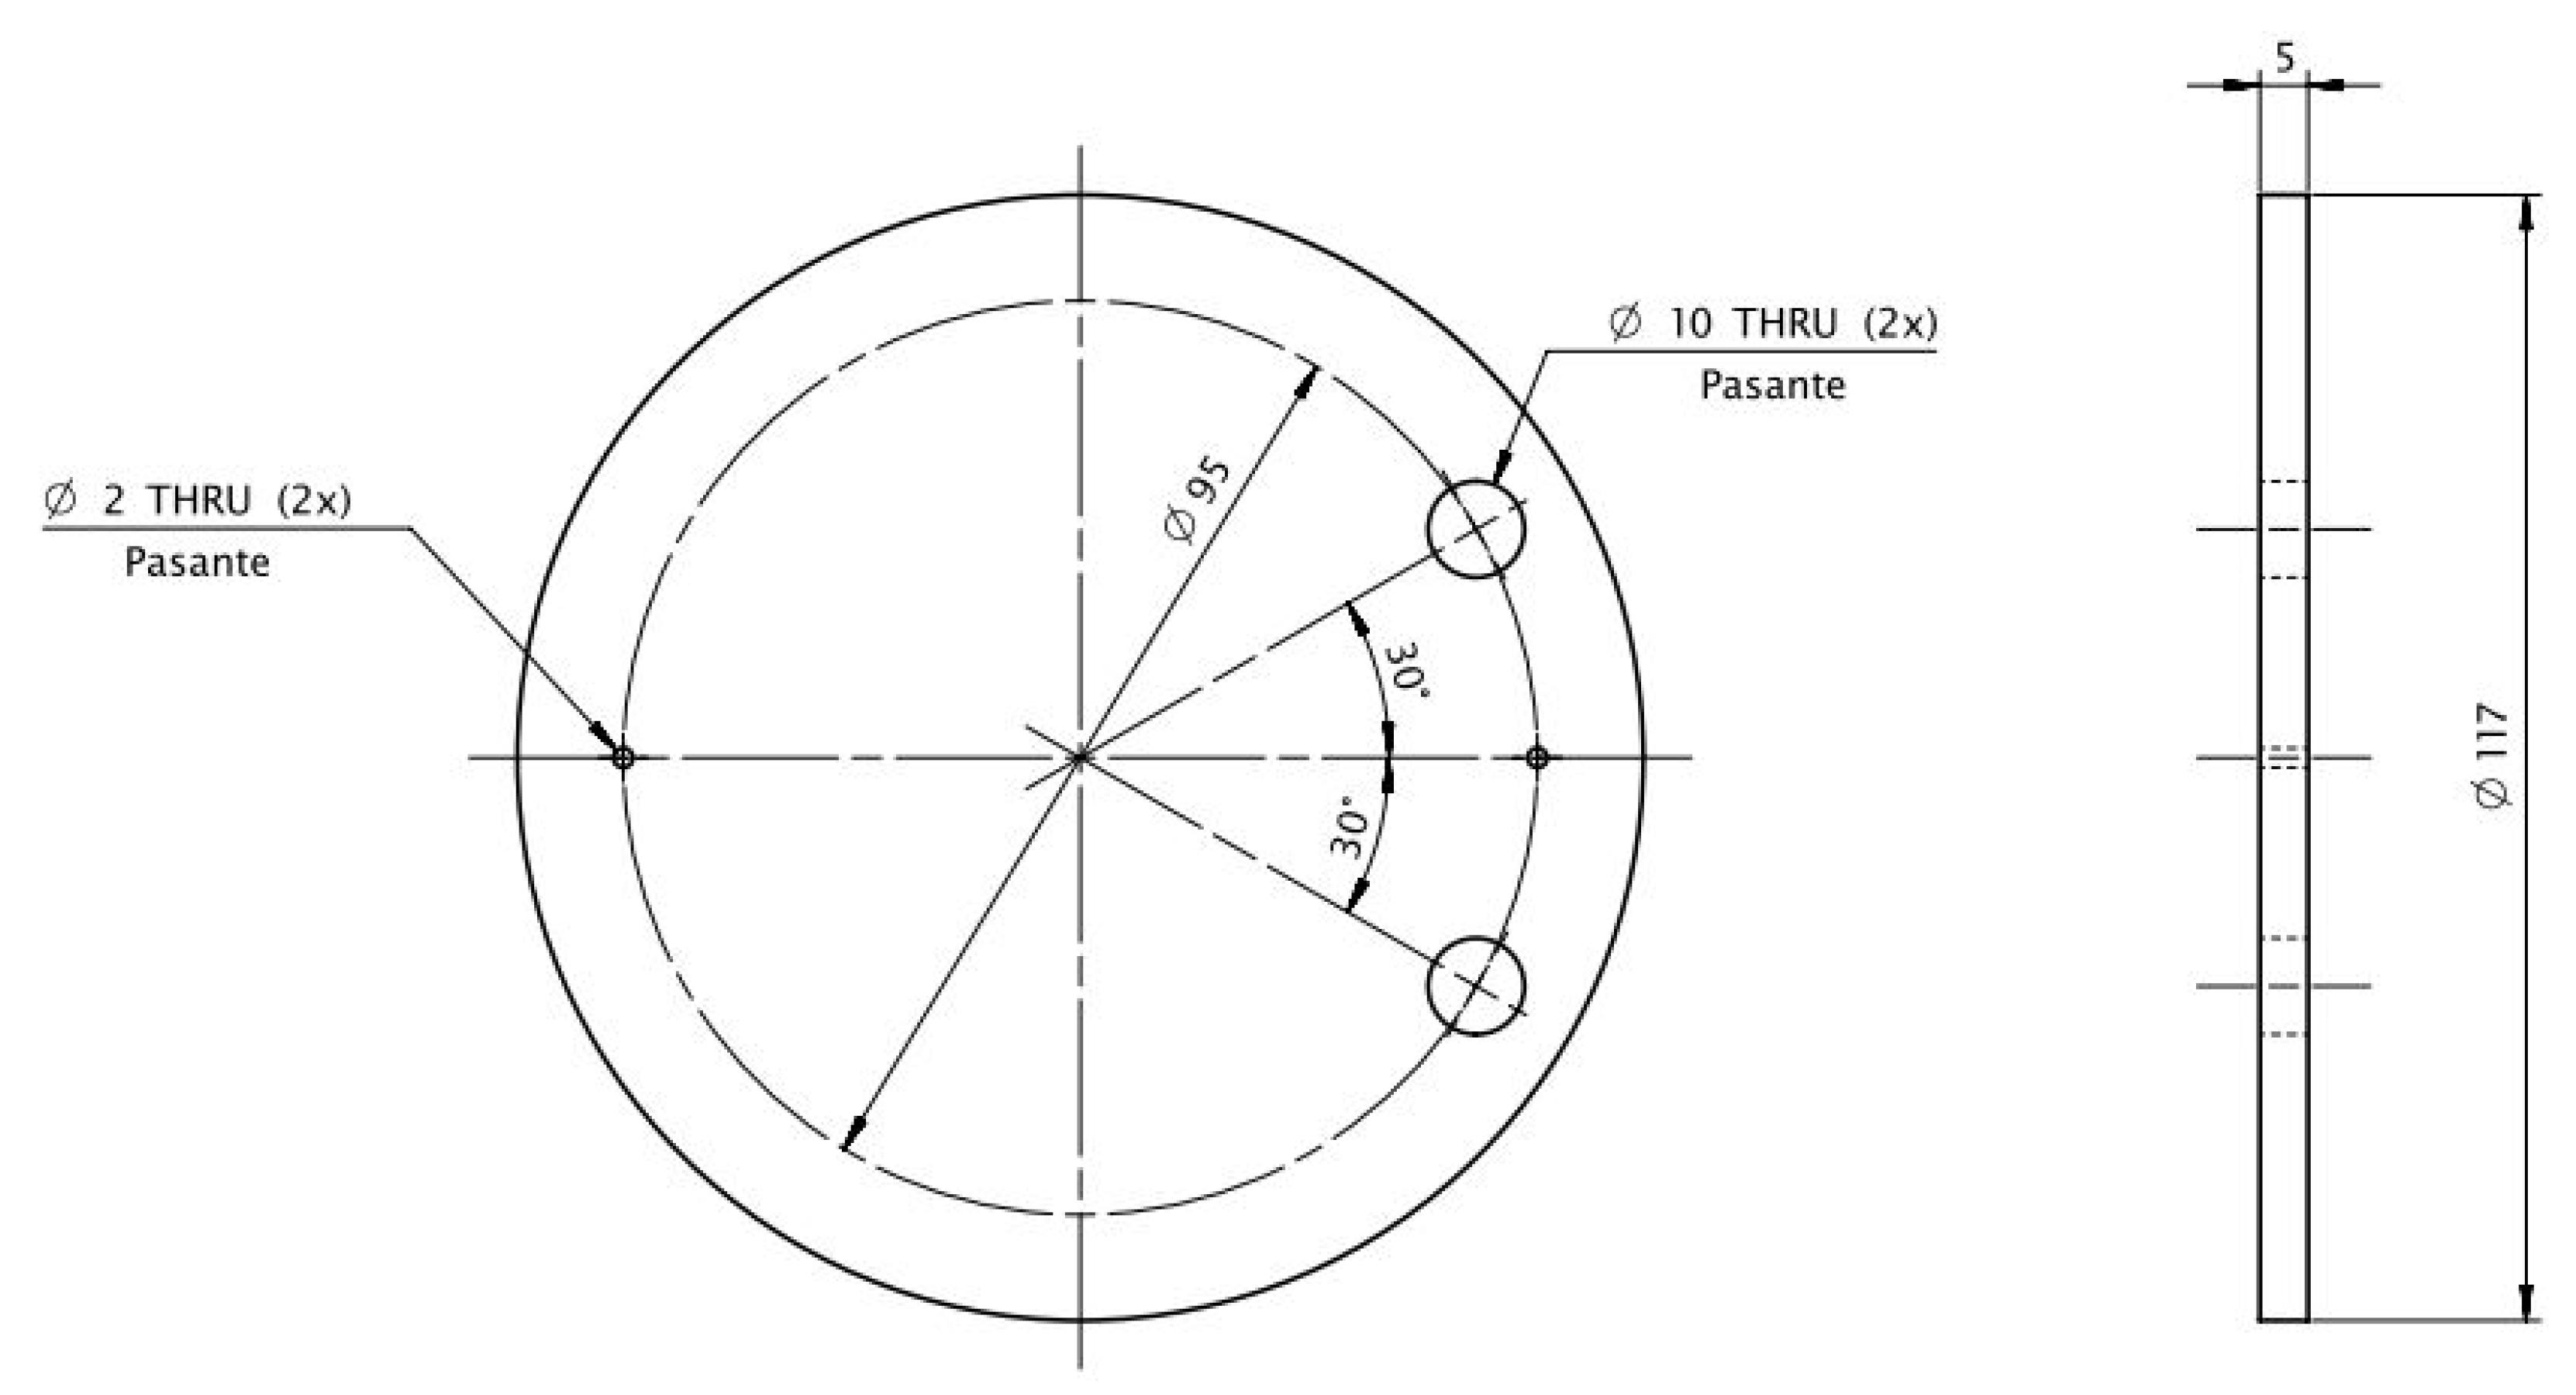
Figure 5.
Gas outlet composition throughout the test, 5% Acacia biomass, at 4 bar and 100 ºC.

Figure 7.
Performance results for tests without biomass for two different electrolytes (KOH and NaOH).
Figure 7.
Performance results for tests without biomass for two different electrolytes (KOH and NaOH).
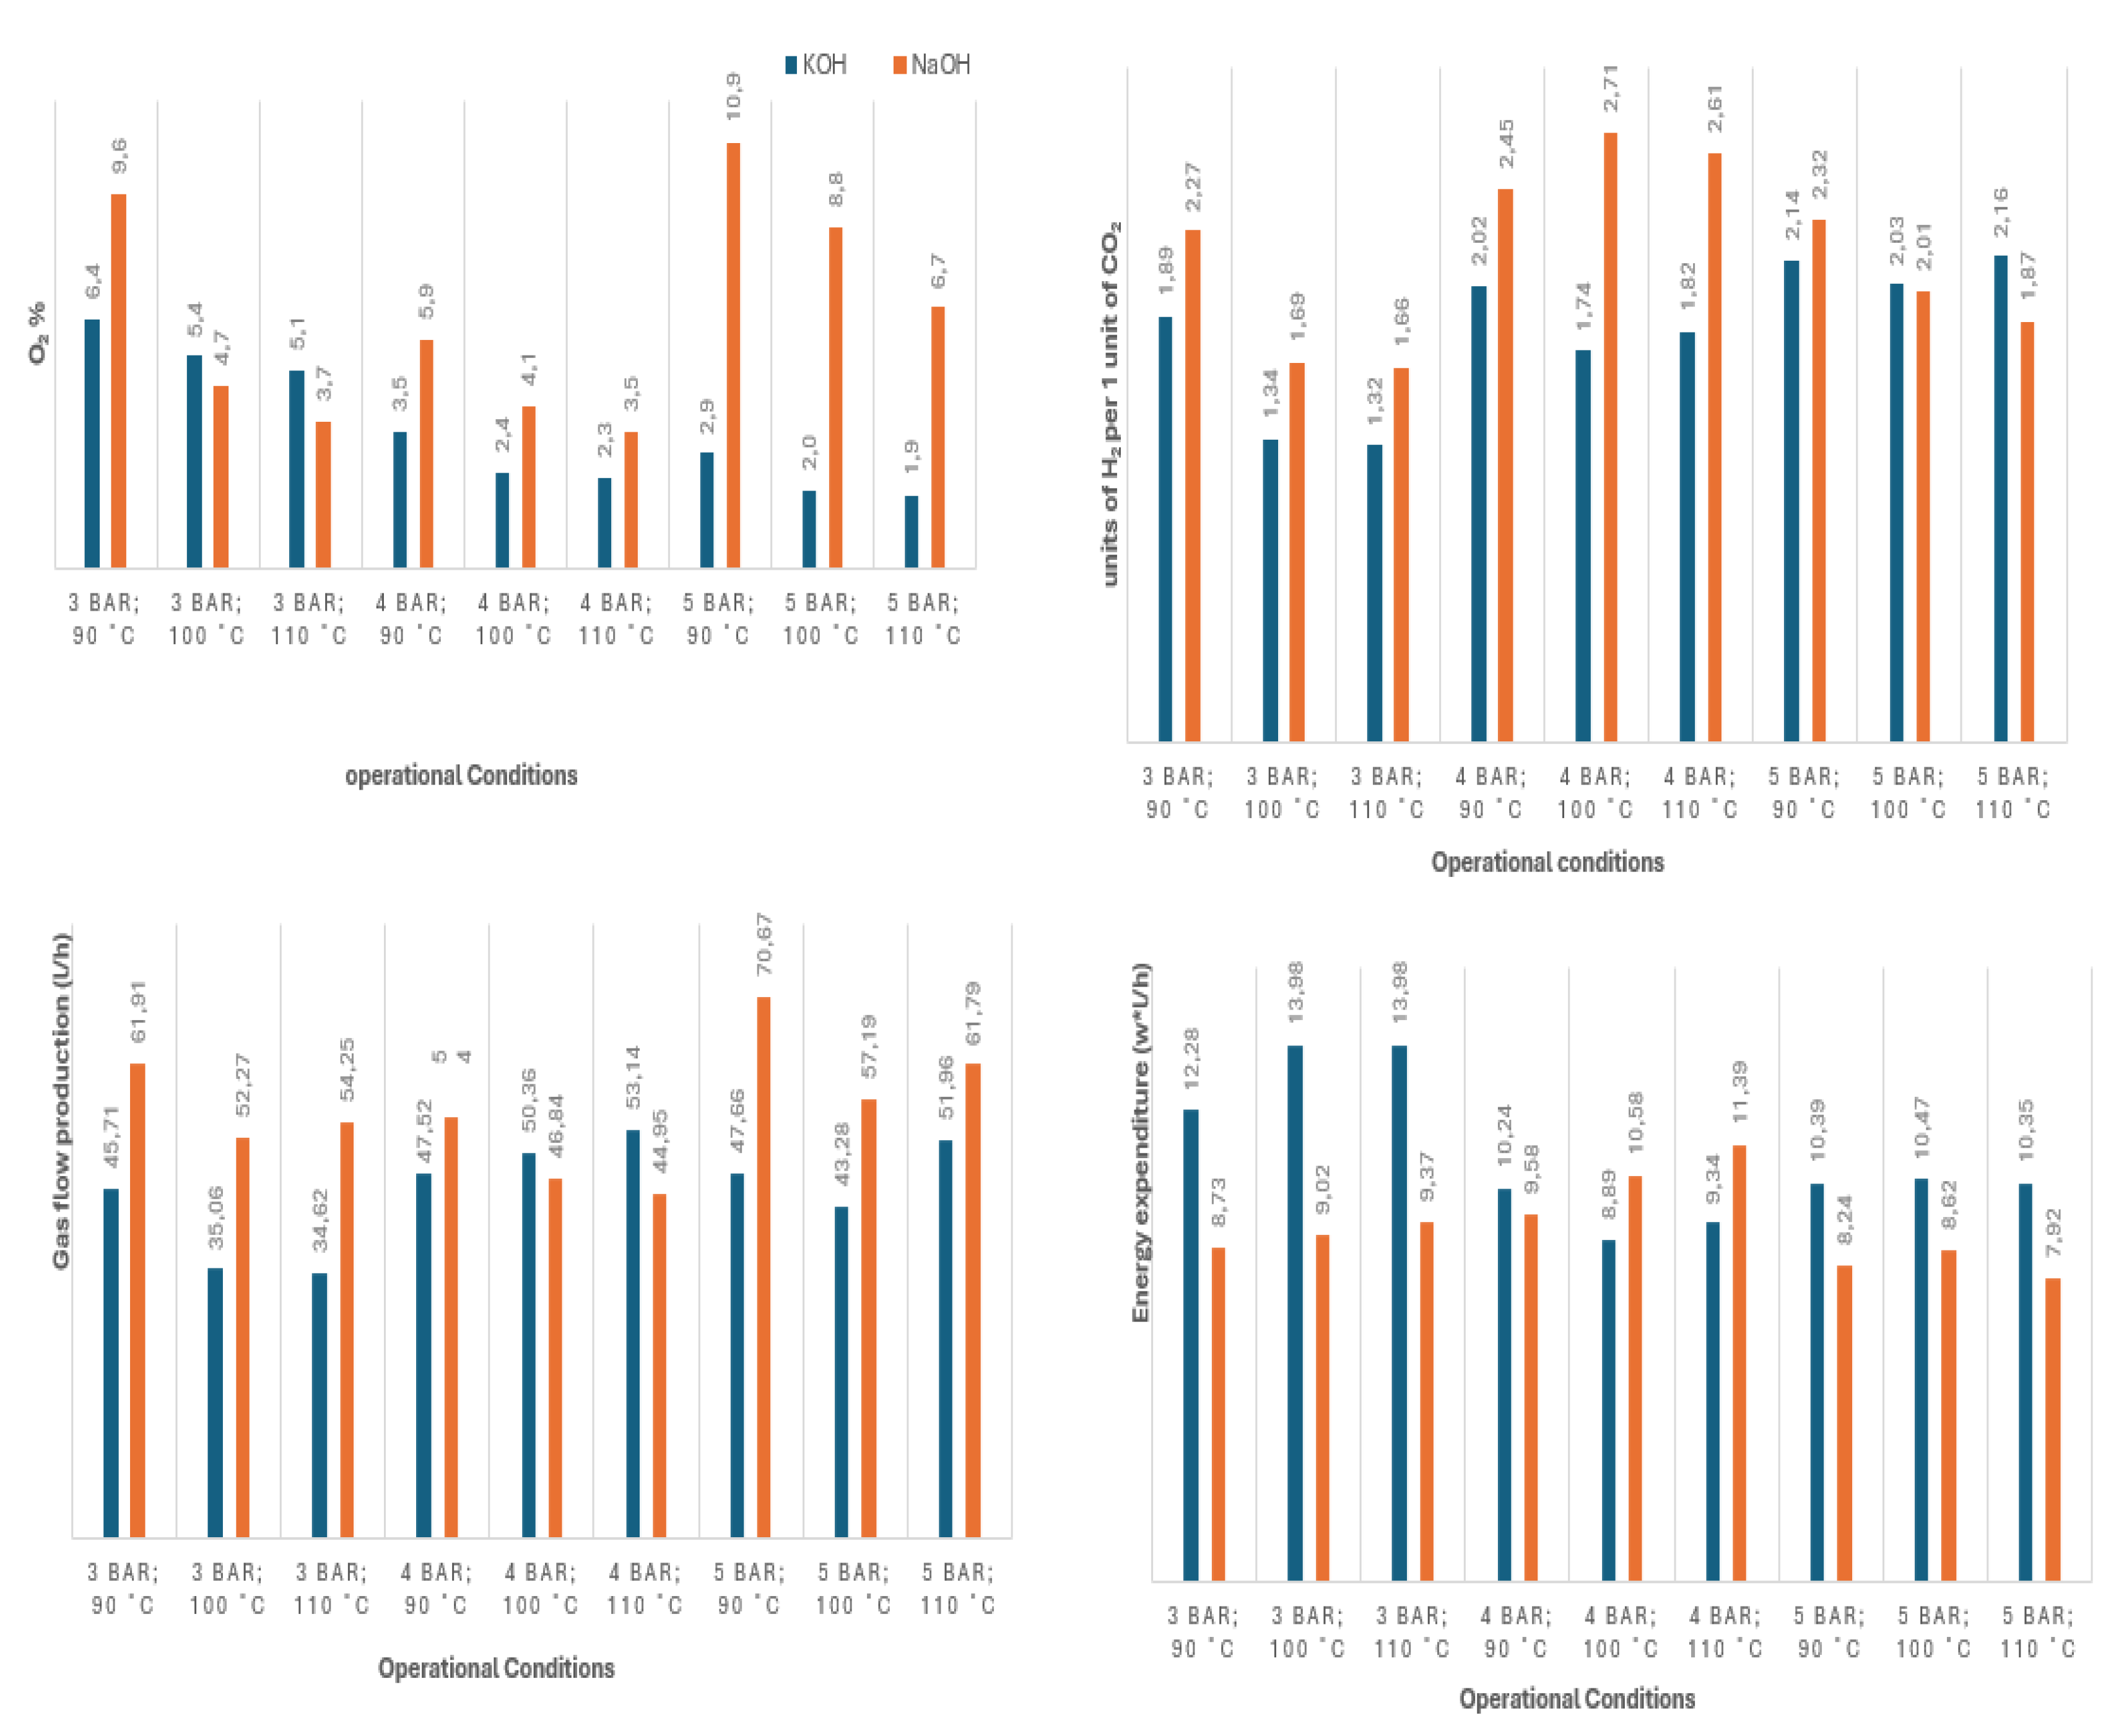
Figure 8.
Performance results for tests with different types of biomass (Acacia, Energreen).
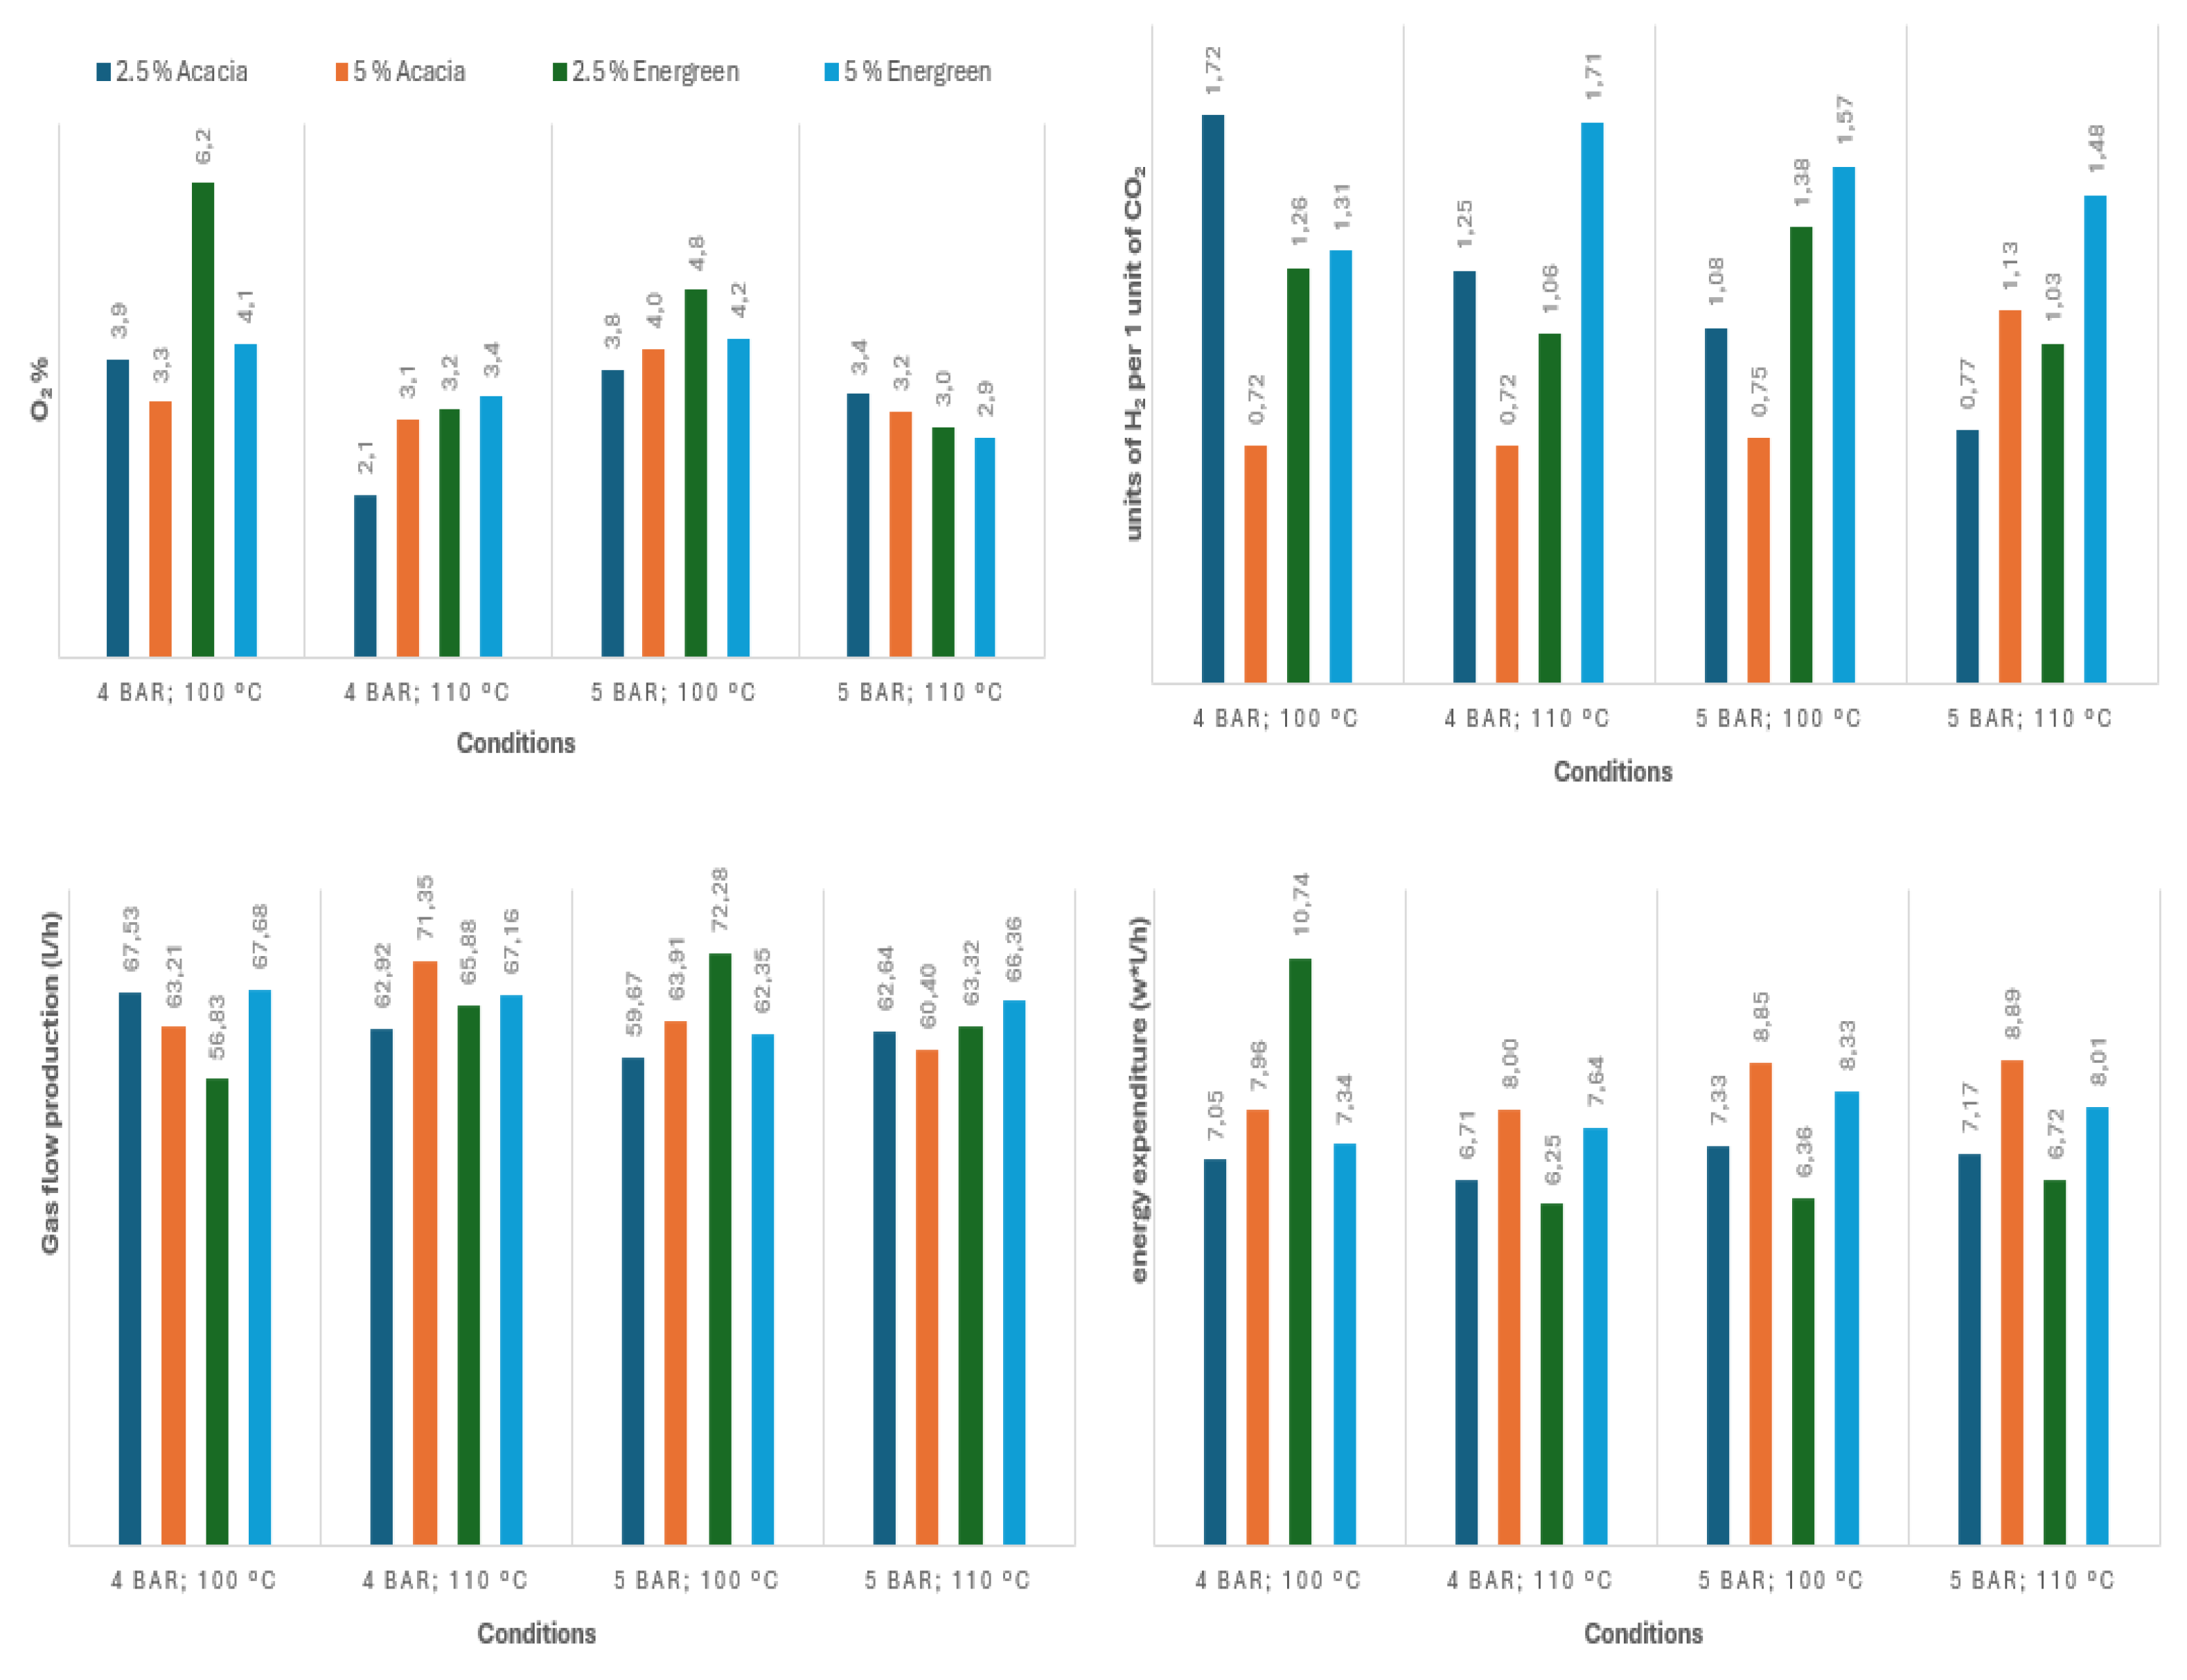

Table 1.
Results collected, 5% Acacia biomass, at 4 bar and 100 ºC.
| Time (min) | T (°C) | P (bar) | V (V) | I (A) | O2 (%) | CO (%) | CO2 (%) | H2 (%) | F (l/h) | W/f (Wh/L) |
|---|---|---|---|---|---|---|---|---|---|---|
| 0 | 100.9 | 4.6 | 34.52 | 13.69 | 4.4 | 2.0 | 35.5 | 58.1 | 58.89 | 8.03 |
| 15 | 100.8 | 4.6 | 34.93 | 13.67 | 3.8 | 2.0 | 53.1 | 41.1 | 60.98 | 7.83 |
| 30 | 103.1 | 4.4 | 36.56 | 15.96 | 3.6 | 2.0 | 54.8 | 39.6 | 75.10 | 7.77 |
| 45 | 104.5 | 4.2 | 36.56 | 15.92 | 3.6 | 2.0 | 54.8 | 39.6 | 76.87 | 7.57 |
| 60 | 105.7 | 3.1 | 36.57 | 15.68 | 3.5 | 2.0 | 54.8 | 39.7 | 78.49 | 7.31 |
| 75 | 106.3 | 3.8 | 36.57 | 15.99 | 3.5 | 2.0 | 54.8 | 39.7 | 71.62 | 8.16 |
| 90 | 107.1 | 3.9 | 36.57 | 15.62 | 3.4 | 2.0 | 54.9 | 39.7 | 71.95 | 7.94 |
| 105 | 103.8 | 4.0 | 35.68 | 14.78 | 3.3 | 2.0 | 54.8 | 39.9 | 70.77 | 7.45 |
| 120 | 105.9 | 4.3 | 35.68 | 14.51 | 3.2 | 2.0 | 55.0 | 39.8 | 64.59 | 8.02 |
| 135 | 105.6 | 4.6 | 35.67 | 14.17 | 3.3 | 2.0 | 55.1 | 39.6 | 66.22 | 7.63 |
| 150 | 105.1 | 3.1 | 35.68 | 14.15 | 3.4 | 2.0 | 54.8 | 39.8 | 65.41 | 7.72 |
| 165 | 105.3 | 3.8 | 35.67 | 14.22 | 3.3 | 2.0 | 54.8 | 39.9 | 62.07 | 8.17 |
| 180 | 105.2 | 4.3 | 35.68 | 13.92 | 3.3 | 2.0 | 55.2 | 39.5 | 62.14 | 7.99 |
Table 2.
Global test results.
| Carbon Source | Test Conditions | O2 (%) | CO (%) | CO2 (%) | H2 (%) | F (l/h) | W/f (Wh/L) | CO2:H2 ratio |
|---|---|---|---|---|---|---|---|---|
| No biomass added | 4 bar gauge; 100 ºC | 4.1 | 1.8 | 25.4 | 68.7 | 46.84 | 10.58 | 2.71 |
| 4 bar gauge; 110 ºC | 3.5 | 1.8 | 26.2 | 68.5 | 44.95 | 11.39 | 2.61 | |
| 5 bar gauge; 100 ºC | 8.8 | 2.1 | 29.6 | 59.5 | 57.19 | 8.62 | 2.01 | |
| 5 bar gauge; 110 ºC | 6.7 | 2.1 | 31.8 | 59.4 | 61.79 | 7.92 | 1.87 | |
| 2.5% Acacia biomass | 4 bar gauge 100 ºC | 3.9 | 2.0 | 34.5 | 59.6 | 67.53 | 7.05 | 1.72 |
| 4 bar gauge 110 ºC | 2.1 | 2.0 | 42.6 | 53.3 | 62.92 | 6.71 | 1.25 | |
| 5 bar gauge 100 ºC | 3.8 | 2.0 | 45.4 | 48.9 | 59.67 | 7.33 | 1.08 | |
| 5 bar gauge 110 ºC | 3.4 | 2.0 | 53.4 | 41.1 | 62.64 | 7.17 | 0.77 | |
| 5% Acacia biomass | 4 bar gauge 100 ºC | 3.3 | 2.0 | 54.9 | 39.7 | 63.21 | 7.96 | 0.72 |
| 4 bar gauge 110 ºC | 3.1 | 2.0 | 55.0 | 39.9 | 71.35 | 8.00 | 0.72 | |
| 5 bar gauge 100 ºC | 4.0 | 2.0 | 53.8 | 40.1 | 63.91 | 8.85 | 0.75 | |
| 5 bar gauge 110 ºC | 3.2 | 2.0 | 44.5 | 50.3 | 60.40 | 8.89 | 1.13 | |
| 2.5% Energreen biomass | 4 bar gauge 100 ºC | 6.2 | 2.0 | 40.6 | 51.2 | 56.83 | 10.74 | 1.26 |
| 4 bar gauge 110 ºC | 3.2 | 2.0 | 46.0 | 48.7 | 65.88 | 6.25 | 1.06 | |
| 5 bar gauge 100 ºC | 4.8 | 2.0 | 39.1 | 54.1 | 72.28 | 6.36 | 1.38 | |
| 5 bar gauge 110 ºC | 3.0 | 2.0 | 46.7 | 48.3 | 63.32 | 6.72 | 1.03 | |
| 5% Energreen biomass | 4 bar gauge 100 ºC | 4.1 | 2.0 | 40.6 | 53.3 | 67.68 | 7.34 | 1.31 |
| 4 bar gauge 110 ºC | 3.4 | 2.0 | 35.0 | 59.6 | 67.16 | 7.64 | 1.71 | |
| 5 bar gauge 100 ºC | 4.2 | 2.0 | 36.5 | 57.4 | 62.35 | 8.33 | 1.57 | |
| 5 bar gauge 110 ºC | 2.9 | 2.0 | 38.3 | 56.8 | 66.36 | 8.01 | 1.48 |
Disclaimer/Publisher’s Note: The statements, opinions and data contained in all publications are solely those of the individual author(s) and contributor(s) and not of MDPI and/or the editor(s). MDPI and/or the editor(s) disclaim responsibility for any injury to people or property resulting from any ideas, methods, instructions or products referred to in the content. |
© 2024 by the authors. Licensee MDPI, Basel, Switzerland. This article is an open access article distributed under the terms and conditions of the Creative Commons Attribution (CC BY) license (http://creativecommons.org/licenses/by/4.0/).
Copyright: This open access article is published under a Creative Commons CC BY 4.0 license, which permit the free download, distribution, and reuse, provided that the author and preprint are cited in any reuse.


