Submitted:
21 October 2024
Posted:
22 October 2024
You are already at the latest version
Abstract
Residual gas in exetainer vials leads to nitrous oxide (N2O) gas underestimation. This study compared four evacuation methods such as gas exchange by displacement (GED), evacuation with a vacuum pump (VP), evacuation with a syringe (VS) and pre-evacuated Exetainer (PEE) to assess the residual gas effect on gas sample concentration. PEE and VP methods showed superior performance, displaying lower deviations from actual gas concentrations with RMSE values of 0.239 and 0.179, respectively, at 12.5 ppm standard gas levels. Conversely, GED and VS methods exhibited higher deviations with RMSE values of 0.740 and 0.448, respectively, at 12.5 ppm. Errors were more pronounced at lower gas concentrations. To address residual gas effects in GED and VS methods, standard gases were stored for calibration in evacuated vials (EVM) matching the sample collection method, rather than in syringes (SM). This EVM approach enhanced precision by 14.43% and 6.24% for GED and VS methods, respectively, at 0.781 ppm standard gas levels. The study concludes that PEE and VP methods are more reliable for vial evacuation. Using vials prepared using the same method as sample collection vials can mitigate residual gas effects effectively. This study holds substantial importance in enhancing the accurate measurement of greenhouse gas emissions, particularly focusing on nitrous oxide.
Keywords:
calibration gas
; evacuation methods
; exetainer vials
; greenhouse gas
; nitrous oxide
; precision
; residual gas
; vacuum pressure
1. Introduction
Greenhouse gases (GHG) play a pivotal role in driving global warming by effectively trapping heat within the Earth’s atmosphere. The primary GHGs are carbon dioxide (CO2), methane (CH4), nitrous oxide (N2O) and fluorinated gases [1,2]. Anthropogenic activities such as deforestation, burning fuel, agriculture, and industrial processes exacerbate the release of GHG into the atmosphere, surpassing the natural rate of release [3,4]. The increasing concentrations of greenhouse gases are a significant driver of climate change, leading to the heightened frequency and intensity of extreme weather events, the rise of sea levels, and widespread disruptions to ecosystems [5,6].
Although N2O is present in lower concentrations than CO2 in the atmosphere, it possesses a global warming potential 300 times greater than that of CO2 [7,8] and has a very high half-life time of 121 years in the atmosphere [9]. Agricultural activities contribute to nearly 65% of the N2O emission, amounting to an estimated 2.8 (1.7– 4.8) Tg N2O-N year−1 of N₂O released into the atmosphere annually [7,10]. The primary sources of nitrous oxide (N₂O) emissions from agriculture are the application of nitrogen-based fertilizers [11,12,13] and the deposition of animal urine on soils [14]. Due to their low concentration in the atmosphere and episodic nature of flux, accurately measuring nitrous oxide levels presents significant challenges compared to other GHGs [15,16,17]. Ensuring the use of precise methodologies in the pipeline from gas collection to measurement is crucial for accurately representing N₂O emissions from agricultural soils [18,19,20].
Various factors are considered to ensure the precise measurement of agricultural emissions of N2O in academic research including design of the collection method [21], time and frequency of collection [17], sampling method [18], sample transferring method [16], storage time and temperature [22] and method used for measuring the N2O concentration [23]. In every stage of the process, it is imperative to validate the accuracy in order to attain a precise and representative measurement of N2O at the field level. In pursuit of this objective, only a limited number of research studies have documented the preparation method of vials and comparisons of the methodology employed in transferring N2O gas from the chamber to the vials. For example, Rochette, et al. [24] tested the performance of polypropylene syringes and glass vials for storing the N2O gas and found that gas losses and adsorption of gas on the inner surface were higher in the former than the latter. Rochette, et al. [24] reported that the double-wadded septa of the gas vials are suitable for gas sampling up to seven instances, beyond which continued use may lead to gas leakage. Only one study reported the comparison of different vial evacuation methods in accurately reflecting the actual N2O concentration of the gas collected from the field [16].
In this study, gas vials were evacuated using three methods: gas exchange by displacement (GED), vacuum by manual pump (VP) and vacuum by syringe (VS) [16]. Subsequent to this, N2O gas samples were gathered from 30 chambers, with the peak concentration from any of the aforementioned methods being considered as the N2O concentration in the field. Following this, the variance in N2O concentration from the peak level for each method was calculated, and the best evacuation technique was determined based on these findings. Nonetheless, several uncertainties are inherent in this experiment. Firstly, the peak N2O concentration was presumed to represent the actual concentration of N2O gas in the field, although it could potentially deviate from this value. Secondly, the collection of gas samples from the same chamber for all three methods may have led to a gradual decrease in N2O concentration within the chamber. Lastly, N2O gas concentrations vary from chamber to chamber, thereby rendering comparisons against a constant concentration unfeasible. Additionally, pre-evacuated gas vials are not tested in this study.
Understanding these uncertainties, the present research was designed to eliminate each of them. Instead of collecting the N2O gas directly from the chamber, a series of known N2O concentrations was employed in this research, effectively circumventing the aforementioned uncertainties. In light of this, the study was undertaken with the following aims: 1) to investigate the influence of the exetainer vial evacuation method on the residual gas, 2) to identify the most appropriate vial evacuation technique, and 3) to assess the effects of compensating for concentration disparities by introducing N2O gas into the vial from the corresponding evacuation method during calibration.
2. Materials and Methods
This study was conducted in two different experiments. The first experiment was conducted to achieve the first two objectives while the second experiment was to achieve the last objective.
2.1. Preparation of Standard N2O Gas Concentration for Calibration
Six different standard N2O gas concentrations were prepared using the following method [25]. From 100 ppm commercially available N2O and N2 gas cylinders, an adequate volume of each gas was transferred to separate rubber gas sampling bags. Subsequently, 25 ml of N2O gas was transferred from its sampling bag to a 60 ml syringe equipped with a 3-way stopcock valve. Similarly, 25 ml of N2 gas was transferred from its corresponding bag to a separate 60 ml syringe with a similar valve setup. The N2O and N2 gas syringes were then interconnected through the female luer lock port of the 3-way stopcock valve, with the male luer lock port sealed. Thorough mixing of the gases was achieved by alternately stroking the pistons of both syringes. This process resulted in the production of 25 ml of 50 ppm N2O gas in each syringe.
Subsequently, an additional 25 ml of N2 gas was extracted from its sampling bag and transferred to a new 60 ml syringe with a 3-way stopcock valve. This N2 gas was combined with the previously prepared 50 ppm N2O gas syringe and mixed thoroughly using the same method, yielding 25 ml of 25 ppm N2O gas in both syringes. By employing this series dilution technique with N2 gas, six distinct standard N2O gas concentrations were prepared: S1 (12.500), S2 (6.250), S3 (3.125), S4 (1.563), S5 (0.781), and S6 (0.391). These standardized N2O gases were subsequently utilized for calibration purposes.
2.2. Experiment 1: Residual Gas Effect on N2O Gas Concentration for Different Evacuation Methods
In this experiment, glass gas vials were evacuated using three methods such as gas exchange by displacement method (GED), evacuation with a vacuum pump (VP) and evacuation with a syringe (VS) and the performance of these methods was tested against a pre-evacuated vial (Labco® Limited, Lampeter, UK). All the vials used in this study were 12 mL in volume, made of glass with a flat bottom, free from creaks, damage of septum and air-leak. The vials used in this study were taken from the same production batch to minimize the variability in the residual gas level [26].
2.2.1. Gas Exchange by Displacement (GED) Method
This GED method was proposed by the United States Department of Agriculture [27]. In summary, a fine needle is inserted into the septum of a glass vial, while another needle connected to a syringe containing collected N2O gas is inserted into the septum (refer to Figure 1). By pressurizing the syringe plunger, the N2O gas is transferred into the vial, displacing the pre-existing gas. To ensure complete gas removal from the vial, an injection of N2O gas four times the volume of the vial is required. In this method, a 12 ml exetainer vial and a 60 ml syringe were used. Used 12 ml vials were pierced with a needle, and a syringe containing N2O (known concentration standard gas levels) was injected up to 40 ml to purge the vial. Subsequently, the needle used to release the existing gas was withdrawn, and the remaining 20 ml of N2O in the syringe was injected into the vial. Finally, the needle connected to the syringe was disengaged from the vial’s septum. This process for completed for 10 replicate vials and the gas concentration of them were measured using GC (GC-2010, Shimadzu, Tokyo, Japan).
2.2.2. Evacuation with Vacuum Pump (VP)
This method is widely employed in numerous research facilities and academic institutions due to its ease of use, rapidity, and cost-effectiveness. A small vacuum pump equipped with a pressure gauge was utilized to evacuate the gas from the 10 ml glass vials [26] (Figure 1). Two vials were simultaneously connected to the vacuum pump using two separate needles with a divider, and suction pressure was applied using the pump until a constant pressure reading of -90 Kpa was reached on the gauge. Subsequently, the needles were disengaged from the vials, and 20 ml of standard N2O gas from a syringe (known concentration series) was injected into the evacuated vial. Ten replicate vials were prepared using this procedure and the N2O gas concentrations were measured using the GC method.
2.2.3. Evacuation with a Syringe (VS)
In situations where gas evacuation facilities are unavailable, this method is employed. In this study, a 60 ml syringe equipped with a needle was inserted into the vial’s septum, and the syringe piston was fully extended to extract the residual air from the vial (Figure 1). Subsequently, the extracted residual air was released, and this procedure was iterated four times (possible maximum number of evacuations). Following this, a 20 ml volume of standard N2O gases (different known concentrations) was injected into the evacuated vials to prepare ten replicates. The N2O concentration in the vials was measured using GC.
2.2.4. Pre-Evacuated Exetainer (PEE)
Pre-evacuated exetainer (PEE) vials are commercially available vials used for gas collection. In this method, 12 ml pre-evacuated vials were used (Labco® Limited, Lampeter, UK). Ten vials were filled with 20 ml N2O standard gas (known concentration series) from the syringe and N2O gas concentrations were measured using GC.
2.3. Measure the Vacuum Level of the Exetainer
The vacuum levels in the exetainer vials prepared using all four methods were assessed following the approach outlined by Sturm, et al. [26]. In this procedure, a 25 ml syringe devoid of the piston was filled with 25 ml of double distilled water. The initial weight of the exetainer vial was determined using a precision balance. Subsequently, the syringe needle was inserted into the vial’s septum, allowing the water to be drawn into the vial due to the vacuum. Once the water ceased dripping into the vial, the needle was disengaged, and the final weight was recorded. The quantity of water introduced into the exetainer vial was calculated based on the weight differential and the vacuum pressure within the vial is expressed in terms of water weight.
2.4. Experiment 2: Impact of Standard N2O Gas Storage Method
This experiment was conducted to evaluate the influence of the vial and syringe employed for storing various concentrations of N2O standard gas utilized for calibration. For this purpose, two methods were selected: 1) preparing different N2O stand gas concentrations in a syringe and directly using it to inject into the GC and 2) preparing the N2O concentrations in a syringe and then transferring it to the exetainer vials for which the evacuation method is testing.
2.4.1. Standard N2O Gas in a Syringe (SM)
The standard procedure involves preparing known concentrations of N2O gas in a syringe using the previously outlined method in Section 2.1 and subsequently injecting the N2O gas directly into a gas chromatograph (GC) for the measurement of the N2O concentration. By obtaining readings for various standard N2O gases, a calibration curve was established. This curve facilitated the determination of the unknown N2O gas concentrations in the test vials, which were then compared to the standard concentrations for assessment. This method was followed for ten replicates for each standard N2O concentration level.
2.4.2. Standard N2O Gas in Exetainer Vials (EVM)
In this exetainer vial method (EVM), once various concentrations of stand N2O gas are prepared in the syringe, they were transferred to the corresponding exetainer vials designated for testing. For instance, in the evaluation of the GED method, standard N2O gas was also transferred to the vial prepared using the GED method for comparative analysis. Then different concentrations of standard N2O gas were injected into the GC and the readings were obtained. Followed by, the calibration curve was plotted and the unknown concentration of the testing vials were calculated. Thereafter, the calculated N2O concentrations were compared with the standard concentrations. For each standard N2O concentration level, ten replicates were used.
2.5. Statistical Analysis
The values were expressed as mean ± standard deviation (SD) of ten replicates. One-way analysis of variance (ANOVA) was performed to test the mean difference between different treatments at a 5% significance level. If at least one mean was different from the other, the Tukey honest significant difference (HSD) post hoc method at a 5% significance level was employed. The linear regression and hierarchical clustering were performed using Origin 8.5 software (OriginLab Corporation, Northampton, MA, USA).
3. Results and Discussion
3.1. Residual Air Pressure of the Exetainer Vials Prepared with Different Methods
The vacuum created by different evacuation methods is shown in Figure 2 and it is expressed as the weight of water (g) that is intruded from the syringe due to vacuum pressure. The vacuum levels created by the VP and PEE methods were found not to be statistically different but were significantly (P<0.05) higher compared to the VS method. The mean weights of water intruded into the vials using the VP, PEE, and VS methods were 1.71±0.1, 1.75±0.09, and 0.77±0.07 grams, respectively. Although the PEE method did not exhibit a statistical difference from the VP method, the average water weight was 2.6% higher than that of the VP method. Furthermore, the mean weights of the VP and PEE methods were 123% and 128% higher, respectively, than those of the VS method.
3.2. Residual Gas Effect on the N2O Gas Concentration for Different Excavation Methods
The linear relationship between the actual N2O concentration and the measured N2O concentration using different excavation methods is illustrated in Figure 3. Notably, all excavation methods exhibited a strong coefficient of determination (R2) close to 1. However, the deviation of the linear correlation line diverges significantly from the 1:1 line for the GED method (Figure 3-a), while it nearly aligns with the 1:1 line for the NEE method (Figure 3-d). This observation implies that the GED method displayed a more pronounced residual gas effect, whereas the NEE method demonstrated the least residual gas effect on the measured N2O concentration. According to Cosentino, et al. [16], the GED method measured gas concentration showed a high correlation with actual concentration (R2 = 0.99) which is in line with these findings. However, the VS method demonstrated a reduced correlation (R2 = 0.84) in contrast to the findings of the current study. Within this study, the peak gas concentration among all examined methods was defined as the effective gas concentration within the chamber. Nevertheless, deviations from this peak value could potentially account for this discrepancy in observations.
The difference in N2O concentration between excavation methods at all six standard N2O concentrations are shown in Figure 4. The VP (12.346 ppm) and PEE (12.271 ppm) methods showed insignificantly (P<0.05) highest N2O concentrations compared to the other two methods at 12.5 ppm (S1) standard gas concentration level (Figure 4-a). At the same standard concentration level, the GED method showed significantly (P<0.05) lower (11.785 ppm) concentration than the VS method (12.074 ppm). At 6.5 ppm standard gas concentration level (S2), the GED method exhibited significantly (P<0.05) lowest concentration (6.005 ppm) than the VP and PEE method, but not significantly different from the VS method (6.041 ppm) (Figure 4-b). However, the VP method showed comparable N2O concentration (6.126 ppm) with the PEE method (6.177 ppm).
The N2O gas concentrations showed a similar pattern at 3.125 (S3) and 1.563 ppm (S4) standard gas concentration levels (Figure 4-c & d). At both these levels, N2O gas concentrations did not statistically differ between VP and PEE methods but were significantly higher (P<0.05) than the other two methods. The N2O gas concentrations were 3.051 and 3.069 ppm for VP and PEE methods, respectively, at 3.125 ppm standard gas concentration level. The N2O concentration was significantly (P<0.05) lower for the GED method (2.884 and 1.259 ppm for S3 and S4, respectively) than the VS method (2.962 and 1.341 ppm for S3 and S4, respectively).
All evacuation methods exhibited consistent trends at standard gas concentrations of 0.781 ppm (S5) and 0.391 ppm (S6) as depicted in Figure 4 (e & f). At both concentration levels, the VP method demonstrated significantly higher N2O concentrations than the GED and VS methods (P<0.05). However, the N2O concentration of the VP method did not show a statistically significant difference from the PEE method. Remarkably, the GED method displayed the lowest N2O concentration significantly (P<0.05) for both S5 and S6 standard N2O concentrations. These findings indicate that the VP and PEE methods performed similarly, a conclusion further supported by cluster analysis as shown in Figure 5. In the cluster analysis, both the VS and NEE methods clustered together, distinct from the VP method at a distance of approximately 2.5 x 10⁻⁵. The GED method formed a separate cluster from the other three evacuation methods.
These findings collectively indicate that the GED method inadequately displaced residual gas with the purged sample gas, as noted by Cosentino, et al. [16]. According to the suggestion by Sturm, et al. [26], exetainer vials need to be flushed with at least 100 ml of sample gas to reduce the residual gas effect. However, practically collecting a 100 ml sample for purging the vial is cumbersome and laborious. Similarly, the VP method failed to thoroughly evacuate residual gas from the vials, as evidenced by the observed vacuum pressure in this method. Consequently, the sample gases become diluted within the vials, leading to the underestimation of gas concentration. Across all standard concentration levels, both the GED and VS methods consistently underestimate the gas concentration, aligning with similar conclusions reported by Cosentino, et al. [16]. Specifically, this study revealed that the GED method and VS method underestimate the gas concentration by 19% and 52%, respectively. Notably, while the highest underestimation was observed for the VS method in this study, the GED method demonstrated the highest underestimation in the current investigation.
The lower the RMSE and MAE values, the better the evacuation method. The RMSE and MAE values were lowest for PEE at S2, S3 and S4 standard N2O gas concentrations (Table 1). The corresponding RMSE values were 0.074, 0.067 and 0.147 whereas MAE values were 0.073, 0.056 and 0.146. Similarly, the RMSE and MAE values were lowest for the VP method at S1, S5 and S6 standard N2O concentrations. The highest RMSE and MAE values were recorded for the GED method. Generally, the RMSE and MAE values increased with decreased stand N2O concentration. This suggests that, at a low level N2O concentration the measured values are highly deviating from the actual N2O concentration (Table 1). Cosentino, et al. [16] also reported that the sample with lower N2O concentration was highly deviated from the actual concertation value. This observation is ascribed to the high dilution of small N2O concentrations due to the residual gas in the excavated vials. Therefore, more precautions need to be taken when low N2O concentrations are collected in the exetainer vials.
3.3. Impact of Standard N2O Gas Storage Method on N2O Concentration
The discrepancy in N2O gas concentrations was notably pronounced at low levels, which could be due to differences in gas collection methods. N2O gas collection in exetainer vials contrasts with the calibration process using syringes. When utilizing a syringe, residual gas can be entirely purged, a process not feasible with exetainer vials. Consequently, the standard gas remains free of dilution with residual gas, while N2O gas collected in exetainer vials undergoes dilution, leading to an underestimation of the N2O gas concentration. To rectify this bias and ensure consistent dilution levels for both the N2O standard gas and collected samples, standard gases were prepared in syringes and then transferred to exetainer vials for comparison with standard gases prepared solely in syringes. This comparative analysis was specifically conducted for the GED and Vs methods, given their notable deviations from the actual N2O gas concentrations.
The gas contained in exetainer vials (EVM) evacuated using the GED method exhibited significantly higher N2O concentrations (P<0.05) compared to the gas stored in syringes method (SM) across all standard N2O gas concentrations (Figure 6-a). This discrepancy highlights that the standard N2O gas stored in syringes (SM) for calibration has not undergone the same level of dilution as the gas collected in vials (EVM) evacuated using the GED method. Under the evacuation with syringe (VS) method, the concentrations of standard gases collected in exetainer vials (EVM) were significantly higher (P<0.05) than those collected using the syringe method (SM) at concentration levels from S3 to S6 (Figure 6-b). However, concentrations were comparable between the SM and EVM methods at the S1 and S2 standard N2O gas concentration levels. The RMSE and RAE values for the EVM method were lower than the SM method for both GED and VS vial evacuation methods (Table 2). This also suggests that the EVM method reduces the error in N2O concentration measurement. The precision of N2O concentration was increased between 2.4% to 14.43% for the GED method and between 0.73% to 7.63% for the VS method (Table 2). Overall, as the standard N2O concentration increases, the precision percentage also increases for both the GED and VS methods. These results suggest using the same evacuation method for standard N2O gases and sample gas. A comparable strategy was recommended by Laughlin, et al. [28] for storing calibration gas alongside collected N2O samples to compensate for measurement errors.
4. Conclusion
In this study, various evacuation methods of exetainer vials were evaluated concerning residual gas levels. The evacuation with a vacuum pump (VP) method demonstrated comparable performance to the pre-evacuated Exetainer (PEE) method, displaying minor deviations in N2O gas concentrations from the actual values. Conversely, N2O gas collected using the gas exchange by displacement (GED) method and the evacuation with a syringe (VS) method exhibited significant deviations from the actual concentrations, with higher deviations observed at lower gas concentrations.
To address the errors associated with the GED and VS evacuation methods, standard calibration N2O gases were stored in vials evacuated using the same method as the sample vials (SVM), instead of in syringes (SM). The findings indicated that aligning the evacuation method of standard gas vials with that of sample vials compensated for residual gas errors and enhanced measurement precision. This precision enhancement was pronounced at low gas concentrations. Therefore, the study concludes that utilizing the VP or PEE evacuation methods can enhance the precision of N2O gas measurements. In cases where these methods are unavailable, using vials evacuated with the same method for collecting standard and sample gases is recommended to improve measurement accuracy.
Funding
No special funding was received for this study.
Data Availability Statement
All the data are used in this study.
Conflicts of Interest
The authors affirm that they have no identifiable competing financial interests or personal relationships that might have influenced the outcomes presented in this paper.
References
- Jones, M.W.; Peters, G.P.; Gasser, T.; Andrew, R.M.; Schwingshackl, C.; Gütschow, J.; Houghton, R.A.; Friedlingstein, P.; Pongratz, J.; Le Quéré, C. National contributions to climate change due to historical emissions of carbon dioxide, methane, and nitrous oxide since 1850. Scientific Data 2023, 10, 155. [CrossRef]
- Abhiram, G.; Grafton, M.; Jeyakumar, P.; Bishop, P.; Davies, C.E.; McCurdy, M. The nitrogen dynamics of newly developed lignite-based controlled-release fertilisers in the soil-plant cycle. Plants 2022, 11, 3288. [CrossRef]
- Nunes, L.J. The rising threat of atmospheric CO2: a review on the causes, impacts, and mitigation strategies. Environments 2023, 10, 66.
- Edo, G.I.; Itoje-akpokiniovo, L.O.; Obasohan, P.; Ikpekoro, V.O.; Samuel, P.O.; Jikah, A.N.; Nosu, L.C.; Ekokotu, H.A.; Ugbune, U.; Oghroro, E.E.A. Impact of environmental pollution from human activities on water, air quality and climate change. Ecological Frontiers 2024. [CrossRef]
- Mora, C.; Spirandelli, D.; Franklin, E.C.; Lynham, J.; Kantar, M.B.; Miles, W.; Smith, C.Z.; Freel, K.; Moy, J.; Louis, L.V. Broad threat to humanity from cumulative climate hazards intensified by greenhouse gas emissions. Nature climate change 2018, 8, 1062-1071. [CrossRef]
- Babcock, R.C.; Bustamante, R.H.; Fulton, E.A.; Fulton, D.J.; Haywood, M.D.; Hobday, A.J.; Kenyon, R.; Matear, R.J.; Plagányi, E.E.; Richardson, A.J. Severe continental-scale impacts of climate change are happening now: Extreme climate events impact marine habitat forming communities along 45% of Australia’s coast. Frontiers in Marine Science 2019, 6, 466674.
- Guo, Y.; Naeem, A.; Mühling, K.H. Comparative effectiveness of four nitrification inhibitors for mitigating carbon dioxide and nitrous oxide emissions from three different textured soils. Nitrogen 2021, 2, 155-166. [CrossRef]
- Ramírez-Sandoval, M.A.; Loick, N.; Pinochet, D.E.; López-Aizpun, M.; Rivero, M.J.; Cárdenas, L.M. N Losses from an Andisol via Gaseous N2O and N2 Emissions Increase with Increasing Ruminant Urinary–N Deposition Rate. Nitrogen 2024, 5, 254-265.
- Pachauri, R.K.; Allen, M.R.; Barros, V.R.; Broome, J.; Cramer, W.; Christ, R.; Church, J.A.; Clarke, L.; Dahe, Q.; Dasgupta, P. Climate change 2014: synthesis report. Contribution of Working Groups I, II and III to the fifth assessment report of the Intergovernmental Panel on Climate Change; Ipcc: 2014.
- Grace, P.; De Rosa, D.; Shcherbak, I.; Strazzabosco, A.; Rowlings, D.; Scheer, C.; Barton, L.; Wang, W.; Schwenke, G.; Armstrong, R.; et al. Revised emission factors for estimating direct nitrous oxide emissions from nitrogen inputs in Australia’s agricultural production systems: a meta-analysis. Soil Research 2024, 62. [CrossRef]
- Abhiram, G.; Grafton, M.; Jeyakumar, P.; Bishop, P.; Davies, C.E.; McCurdy, M. Iron-rich sand promoted nitrate reduction in a study for testing of lignite based new slow-release fertilisers. Science of The Total Environment 2023, 864, 160949. [CrossRef]
- Abhiram, G.; Bishop, P.; Jeyakumar, P.; Grafton, M.; Davies, C.E.; McCurdy, M. Formulation and characterization of polyester-lignite composite coated slow-release fertilizers. Journal of Coatings Technology and Research 2023, 20, 307-320. [CrossRef]
- Xing, H.; Smith, C.J.; Wang, E.; Macdonald, B.; Wårlind, D. Modelling nitrous oxide emissions: comparing algorithms in six widely used agro-ecological models. Soil Research 2023, 61, 523-541.
- Maire, J.; Krol, D.; Pasquier, D.; Cowan, N.; Skiba, U.; Rees, R.; Reay, D.; Lanigan, G.J.; Richards, K.G. Nitrogen fertiliser interactions with urine deposit affect nitrous oxide emissions from grazed grasslands. Agriculture, Ecosystems & Environment 2020, 290, 106784. [CrossRef]
- Shang, Z.; Cai, C.; Guo, Y.; Huang, X.; Peng, K.; Guo, R.; Wei, Z.; Wu, C.; Cheng, S.; Liao, Y. Direct and indirect monitoring methods for nitrous oxide emissions in full-scale wastewater treatment plants: A critical review. Journal of Environmental Management 2024, 358, 120842. [CrossRef]
- Cosentino, V.R.N.; Romaniuk, R.I.; Lupi, A.M.; Gómez, F.M.; Korsakov, H.R.; Álvarez, C.R.; Ciarlo, E. Comparison of field measurement methods of nitrous oxide soil emissions: from the chamber to the vial. Revista Brasileira de Ciência do Solo 2020, 44, e0190100. [CrossRef]
- Charteris, A.F.; Chadwick, D.R.; Thorman, R.E.; Vallejo, A.; de Klein, C.A.; Rochette, P.; Cárdenas, L.M. Global Research Alliance N2O chamber methodology guidelines: Recommendations for deployment and accounting for sources of variability. Journal of Environmental Quality 2020, 49, 1092-1109. [CrossRef]
- Harvey, M.; Sperlich, P.; Clough, T.; Kelliher, F.; McGeough, K.; Martin, R.; Moss, R. Global Research Alliance N2O chamber methodology guidelines: Recommendations for air sample collection, storage, and analysis. Journal of Environmental Quality 2020, 49, 1110-1125.
- Lammirato, C.; Wallman, M.; Weslien, P.; Klemedtsson, L.; Rütting, T. Measuring frequency and accuracy of annual nitrous oxide emission estimates. Agricultural and Forest Meteorology 2021, 310, 108624. [CrossRef]
- de Klein, C.A.; Harvey, M.J.; Clough, T.J.; Petersen, S.O.; Chadwick, D.R.; Venterea, R.T. Global Research Alliance N2O chamber methodology guidelines: Introduction, with health and safety considerations. Journal of Environmental Quality 2020, 49, 1073-1080.
- Rochette, P.; Eriksen-Hamel, N.S. Chamber measurements of soil nitrous oxide flux: are absolute values reliable? Soil Science Society of America Journal 2008, 72, 331-342.
- Faust, D.R.; Liebig, M.A. Effects of storage time and temperature on greenhouse gas samples in Exetainer vials with chlorobutyl septa caps. MethodsX 2018, 5, 857-864. [CrossRef]
- Christensen, S.; Ambus, P.; Arah, J.; Clayton, H.; Galle, B.; Griffith, D.; Hargreaves, K.; Klenzedtsson, L.; Lind, A.-M.; Maag, M. Nitrous oxide emission from an agricultural field: Comparison between measurements by flux chamber and micrometerological techniques. Atmospheric Environment 1996, 30, 4183-4190. [CrossRef]
- Rochette, P.; Bertrand, N. Soil air sample storage and handling using polypropylene syringes and glass vials. Canadian Journal of Soil Science 2003, 83, 631-637. [CrossRef]
- Grace, P.R.; van der Weerden, T.J.; Rowlings, D.W.; Scheer, C.; Brunk, C.; Kiese, R.; Butterbach-Bahl, K.; Rees, R.M.; Robertson, G.P.; Skiba, U.M. Global Research Alliance N2O chamber methodology guidelines: Considerations for automated flux measurement. Journal of Environmental Quality 2020, 49, 1126-1140.
- Sturm, K.; Keller-Lehmann, B.; Werner, U.; Raj Sharma, K.; Grinham, A.R.; Yuan, Z. Sampling considerations and assessment of E xetainer usage for measuring dissolved and gaseous methane and nitrous oxide in aquatic systems. Limnology and Oceanography: Methods 2015, 13, 375-390.
- Collier, S.M.; Ruark, M.D.; Oates, L.G.; Jokela, W.E.; Dell, C.J. Measurement of greenhouse gas flux from agricultural soils using static chambers. JoVE (Journal of Visualized Experiments) 2014, e52110.
- Laughlin, R.J.; Stevens, R.J. Changes in composition of nitrogen-15-labeled gases during storage in septum-capped vials. Soil Science Society of America Journal 2003, 67, 540-543. [CrossRef]
Figure 1.
The schematic diagram explains the different residual gas evacuation method: gas exchange by displacement (GED), evacuation with vacuum pump (VP) and evacuation with syringe (VS).
Figure 1.
The schematic diagram explains the different residual gas evacuation method: gas exchange by displacement (GED), evacuation with vacuum pump (VP) and evacuation with syringe (VS).
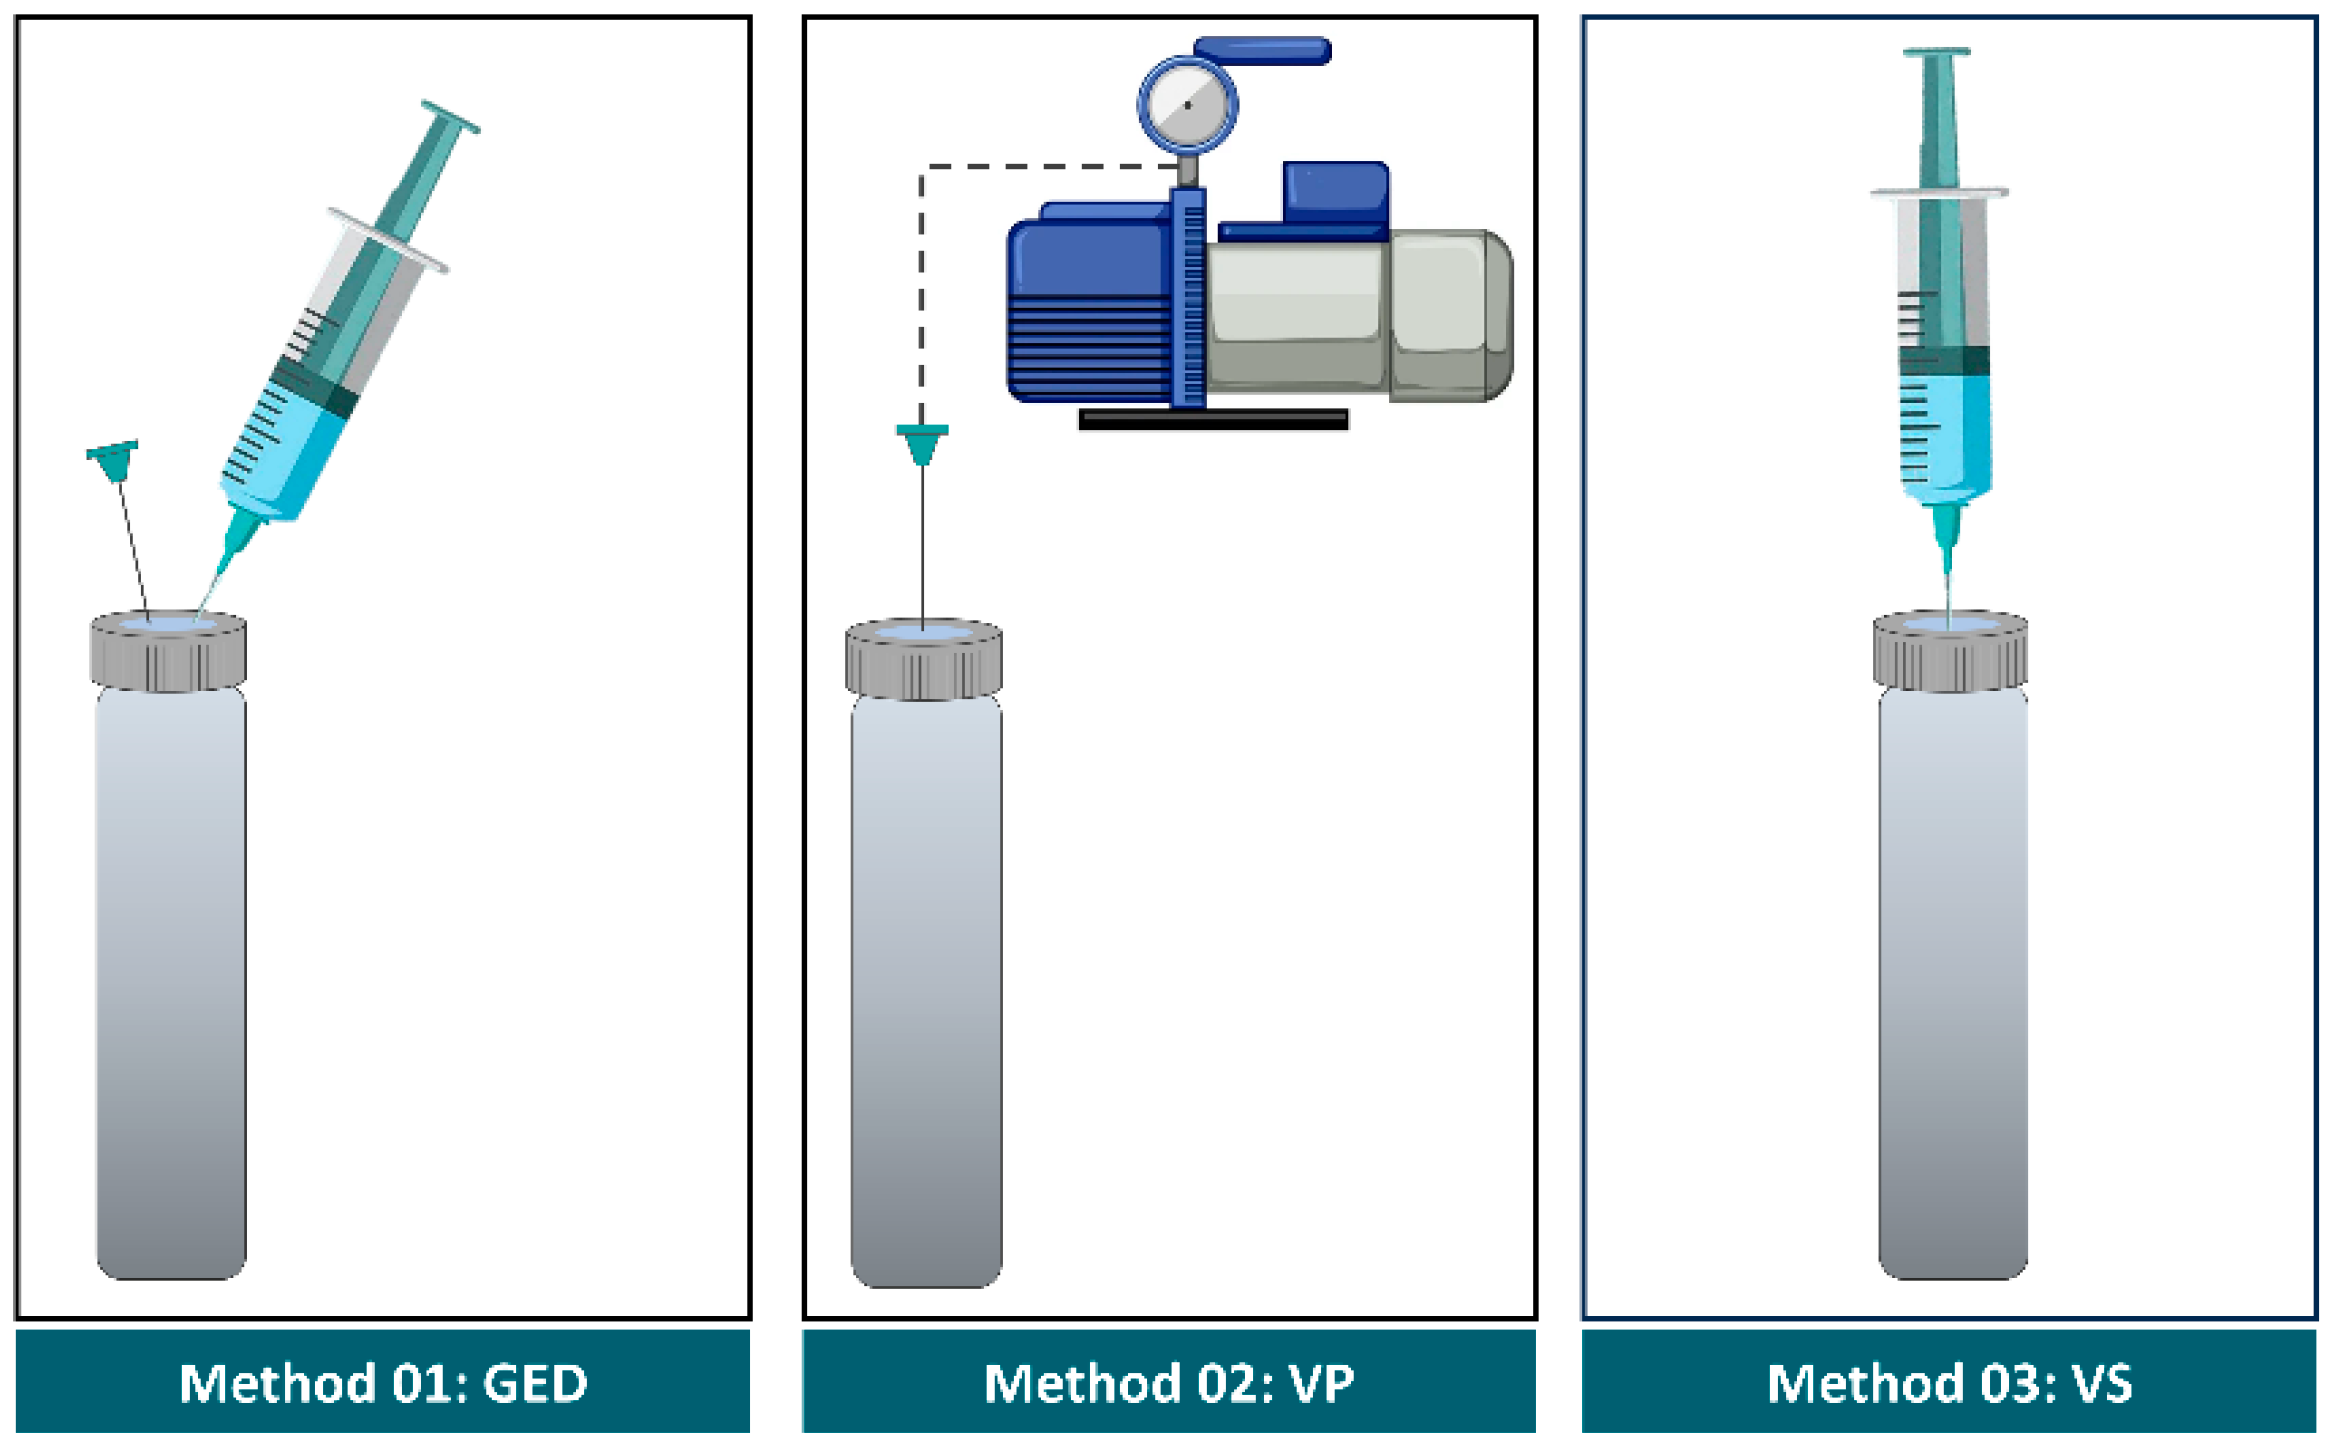
Figure 2.
The vacuum pressure of the vials evacuated using different methods (in weight basis).
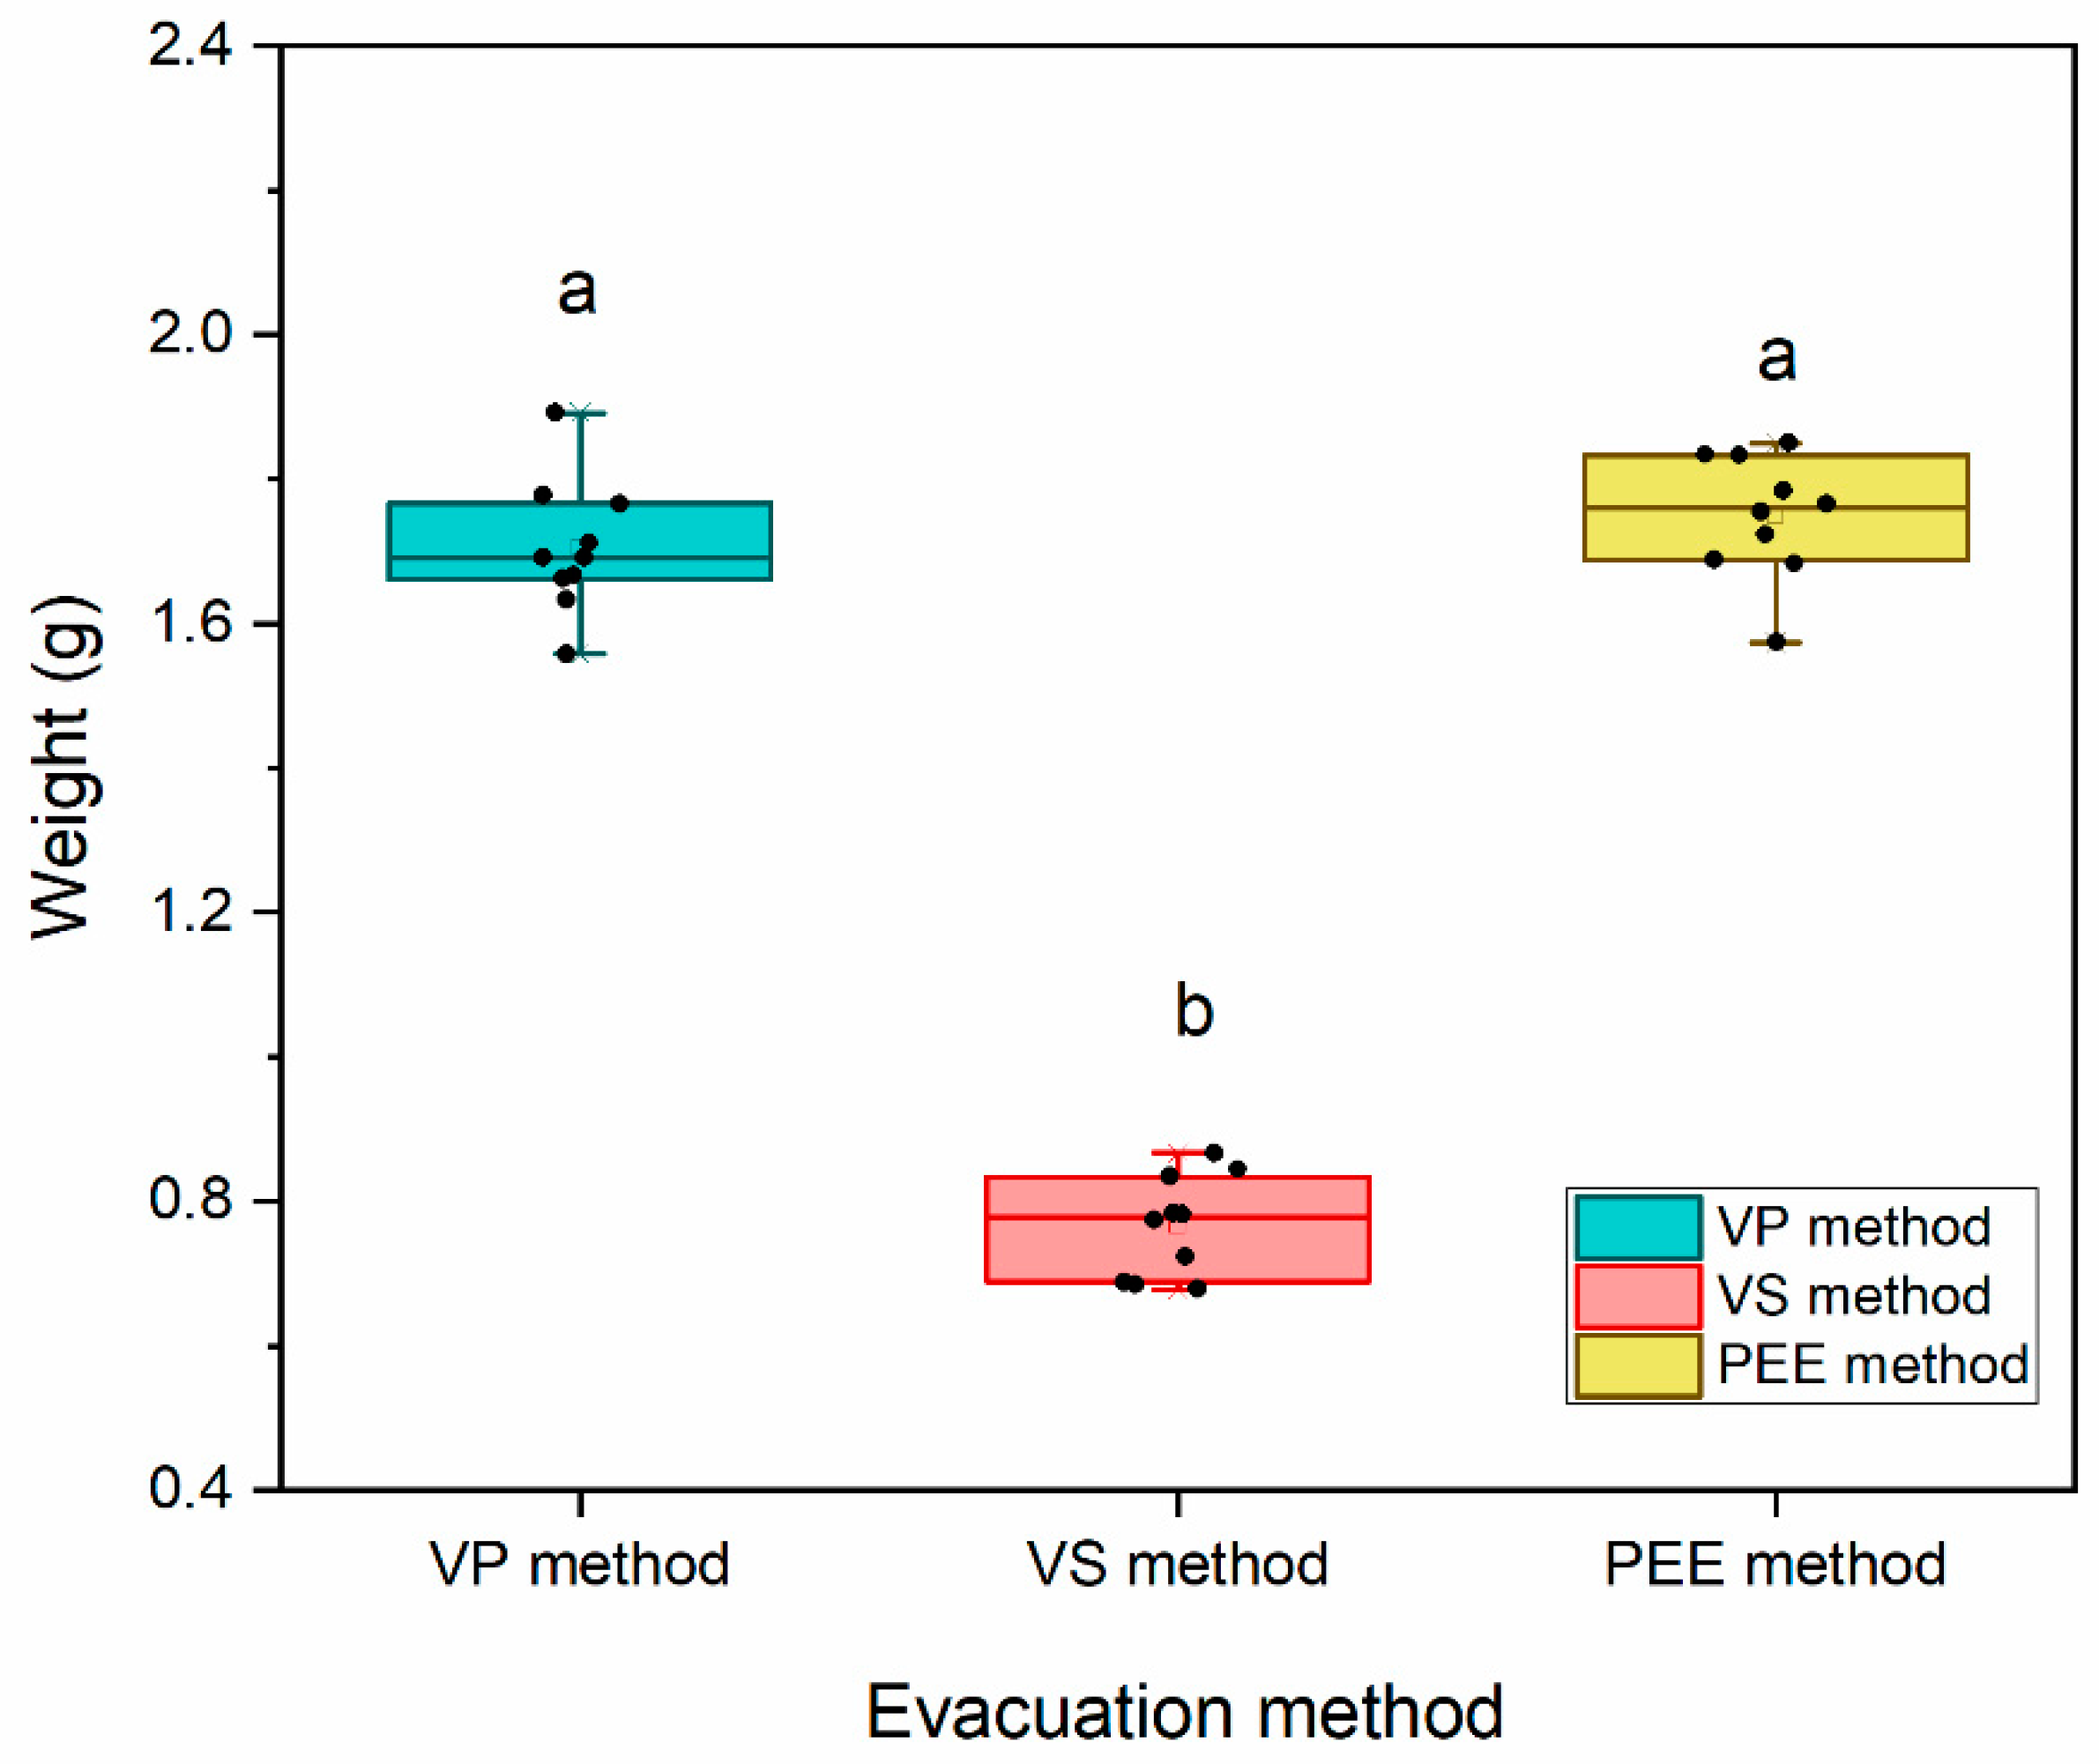
Figure 3.
The correlation between actual concentration of N2O (AC N2O (ppm)) and measured concentration of N2O (MC N2O (ppm)): a) gas exchange by displacement (GED) method, b) evacuation with vacuum pump (VP) method, c) evacuation with syringe (VS) method and d) pre-evacuated Exetainer (PEE) method (dashed line represents 1:1 line). Error bar represents SD (n=10).
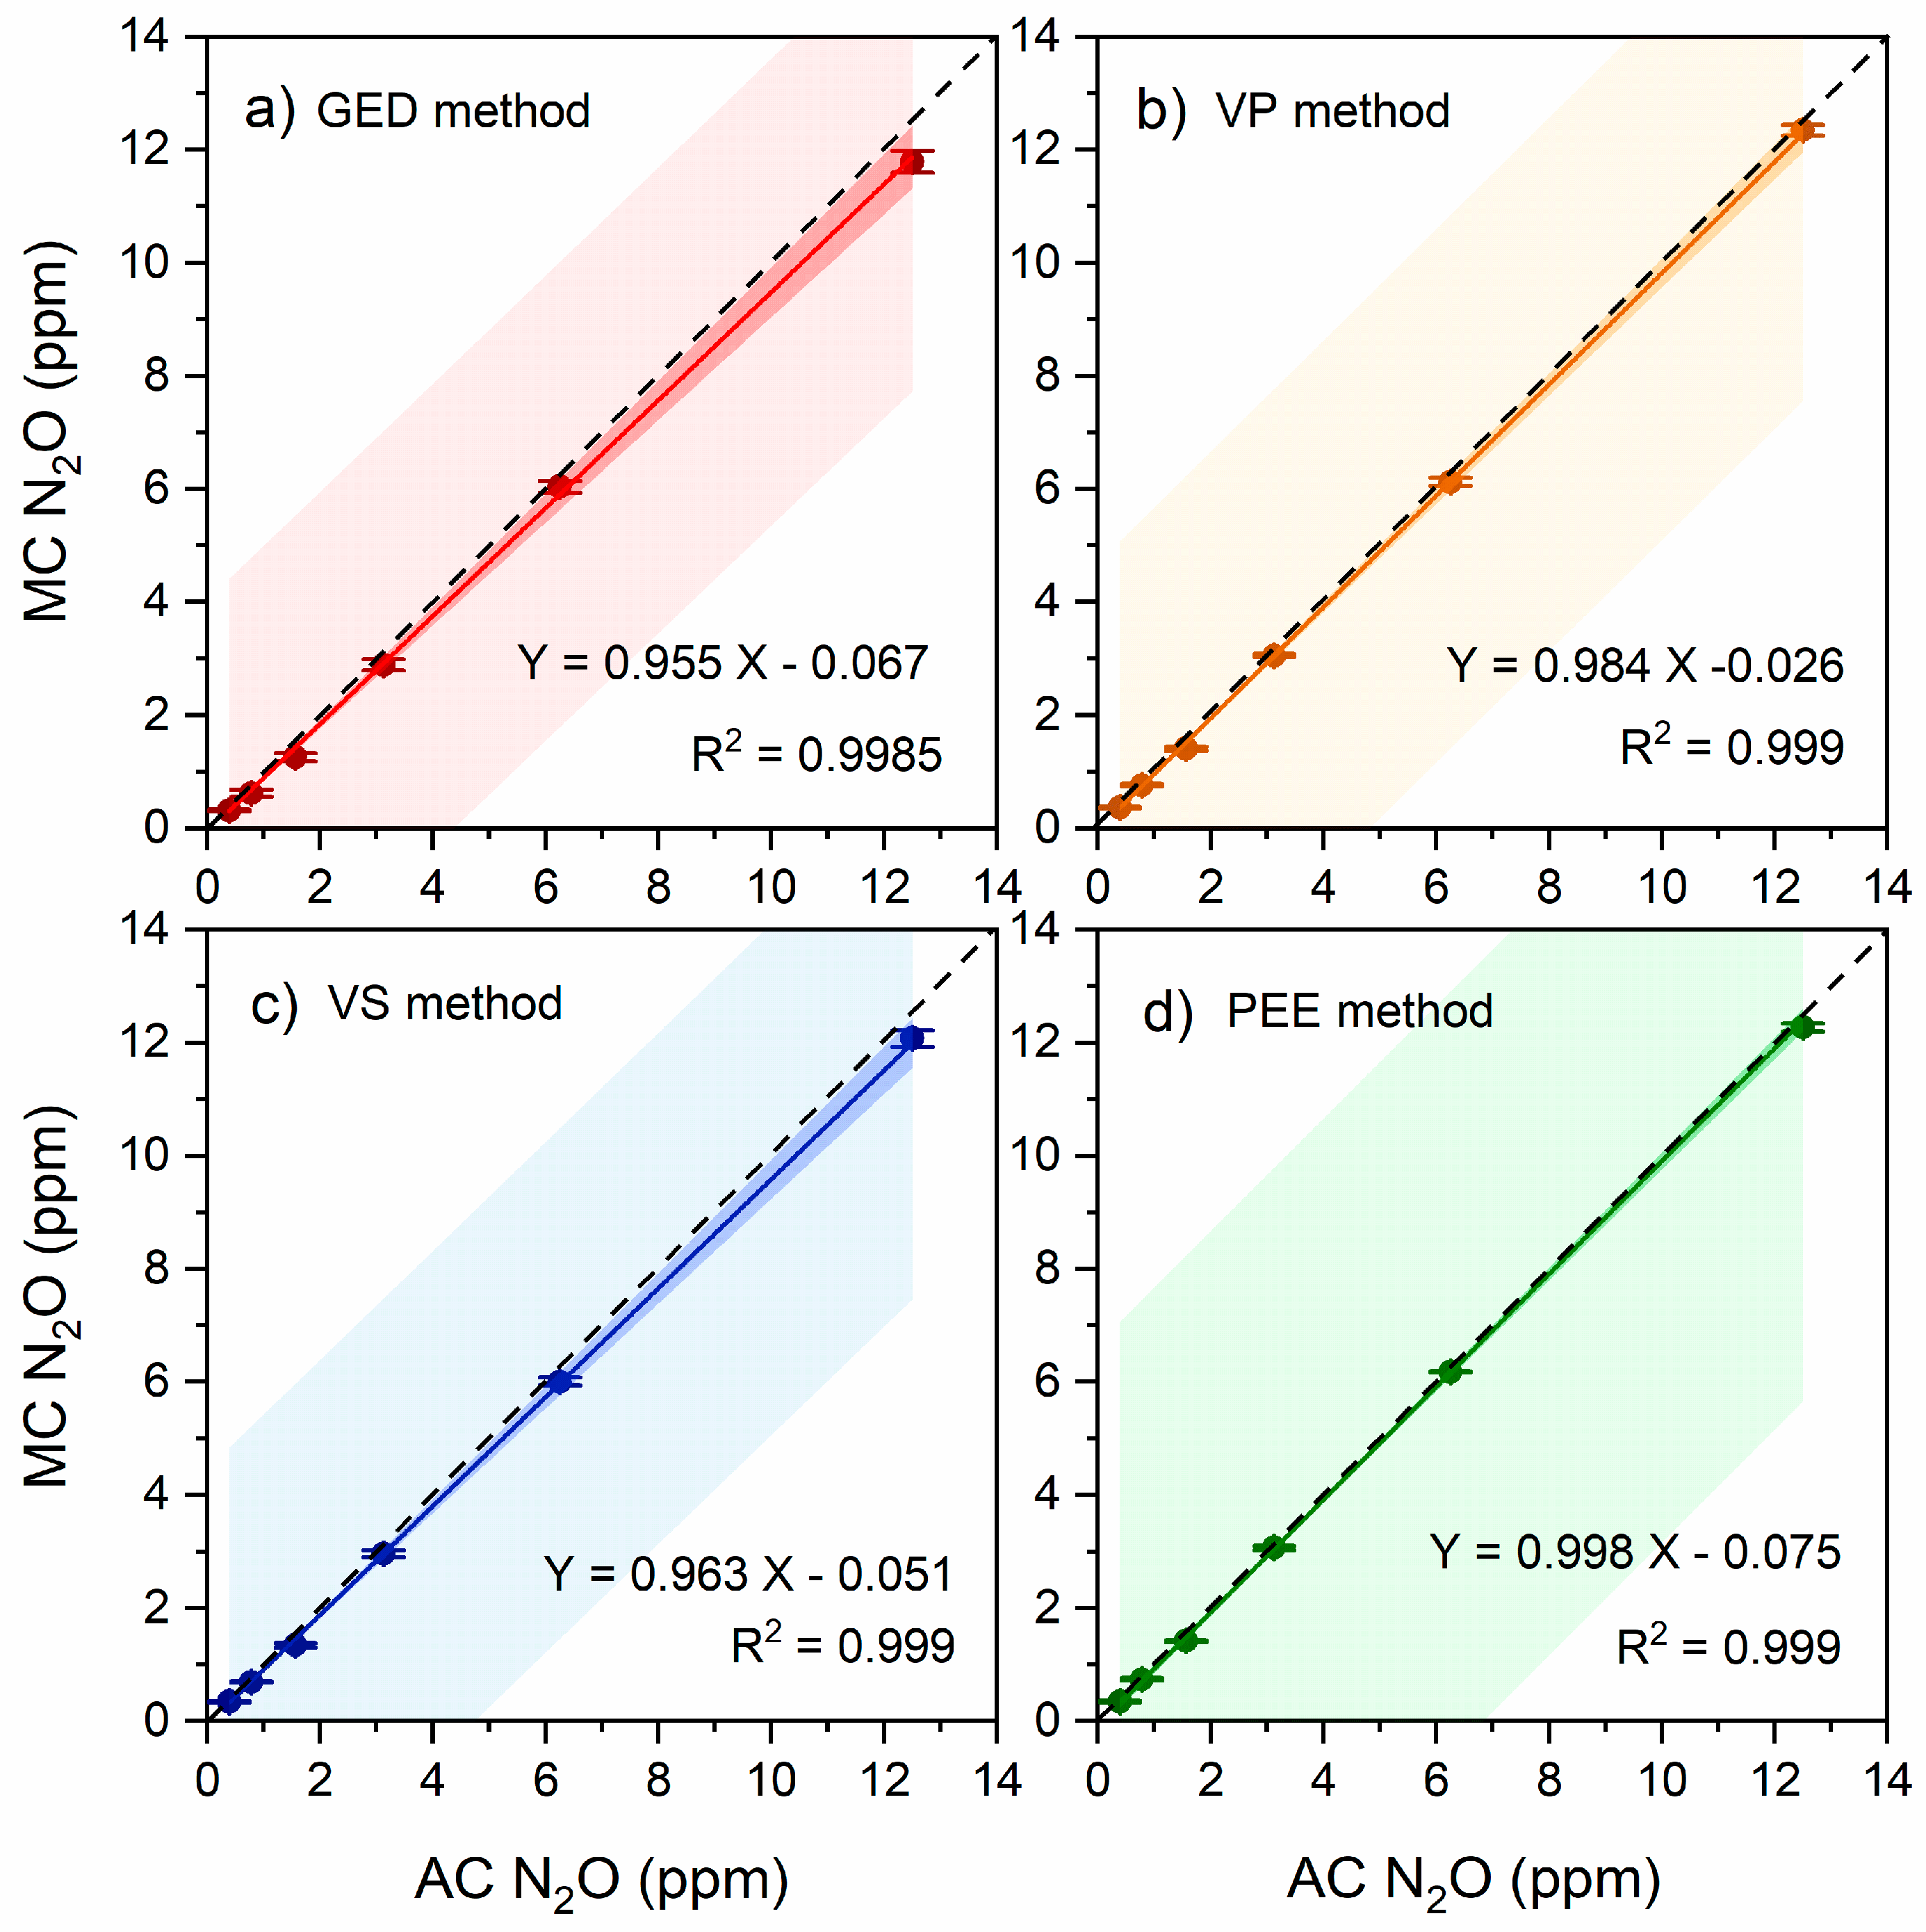
Figure 4.
The residual gas effect of different evacuation methods (GED, VP, VS and PEE) on measured concentration of N2O concentration (MC N2O): a) S1 (12.5 ppm), b) S2 (6.250 ppm), c) S3 (3.125 ppm), d) S4 (1.563 ppm), e) S5 (0.781 ppm) and f) S6 (0.391 ppm). Error bar represents SD (n=10).
Figure 4.
The residual gas effect of different evacuation methods (GED, VP, VS and PEE) on measured concentration of N2O concentration (MC N2O): a) S1 (12.5 ppm), b) S2 (6.250 ppm), c) S3 (3.125 ppm), d) S4 (1.563 ppm), e) S5 (0.781 ppm) and f) S6 (0.391 ppm). Error bar represents SD (n=10).
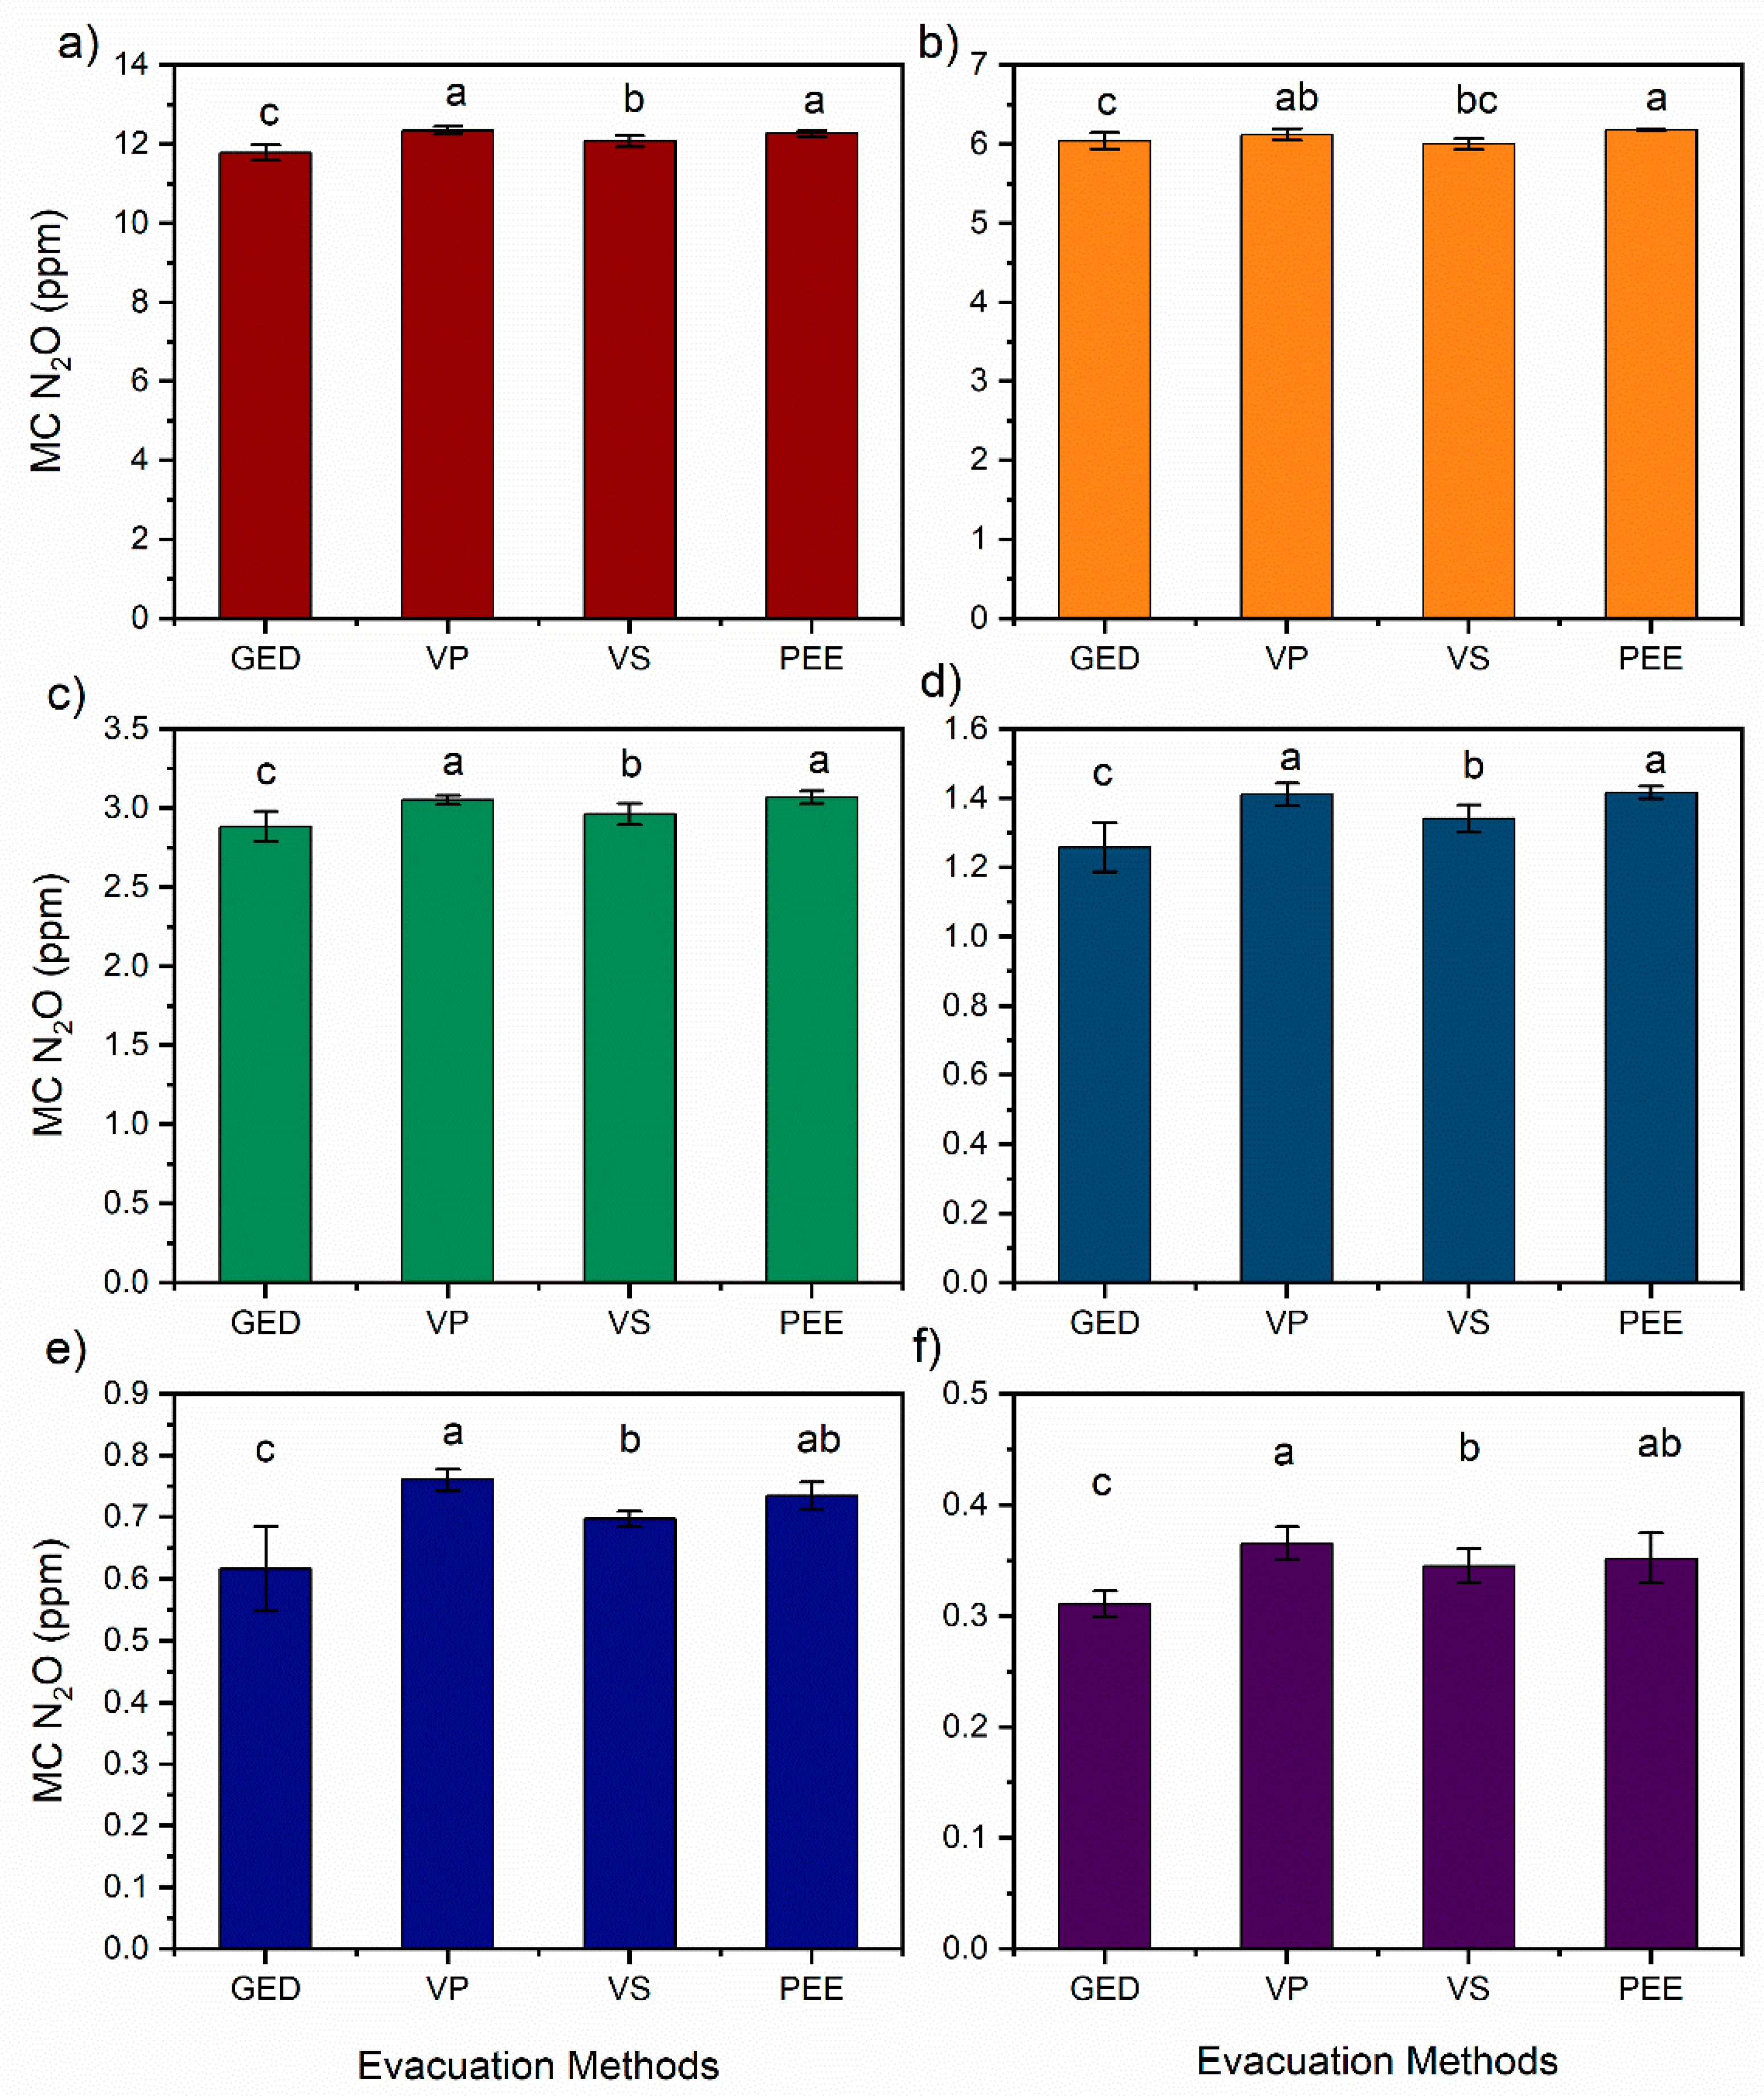
Figure 5.
The cluster analysis of different evacuation methods.
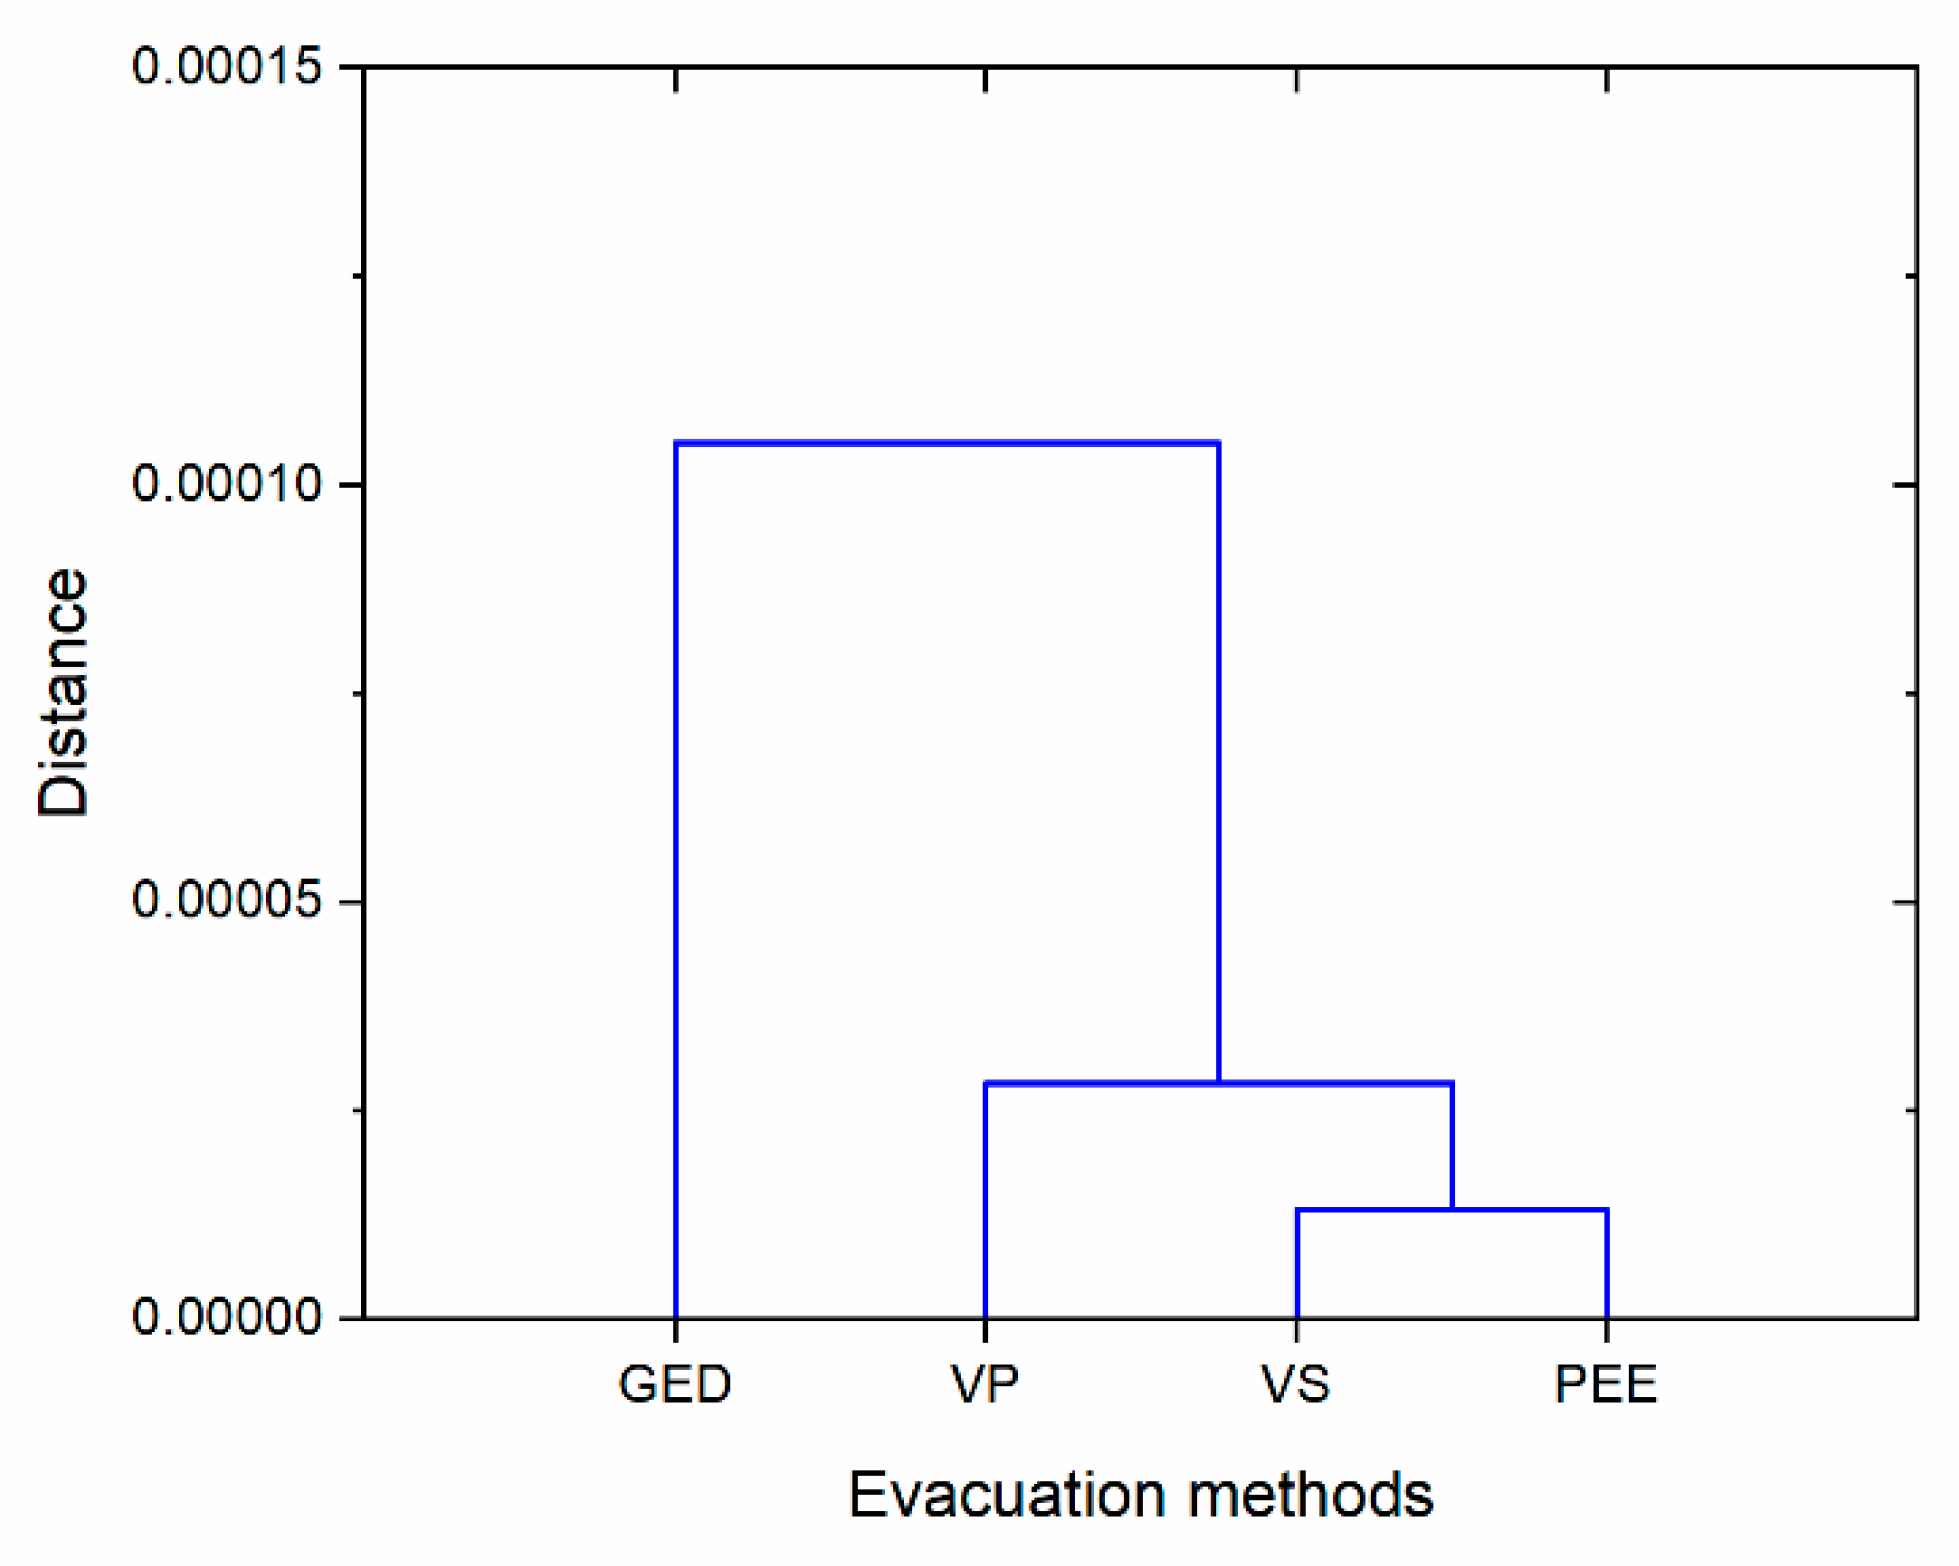
Figure 6.
The N2O concentrations of various N2O standards (S1: 12.500 ppm, S2: 6.250 ppm, S3: 3.125 ppm, S4: 1.563 ppm, S5: 0.781 ppm, and S6: 0.391 ppm) vary based on the storage method, either syringe method (SM) or exetainer vial method (EVM), for two different evacuation methods of exetainer vials: a) Gas exchange by displacement (GED) method and b) Evacuation with syringe (VS) method. Error bar represents SD (n=10).
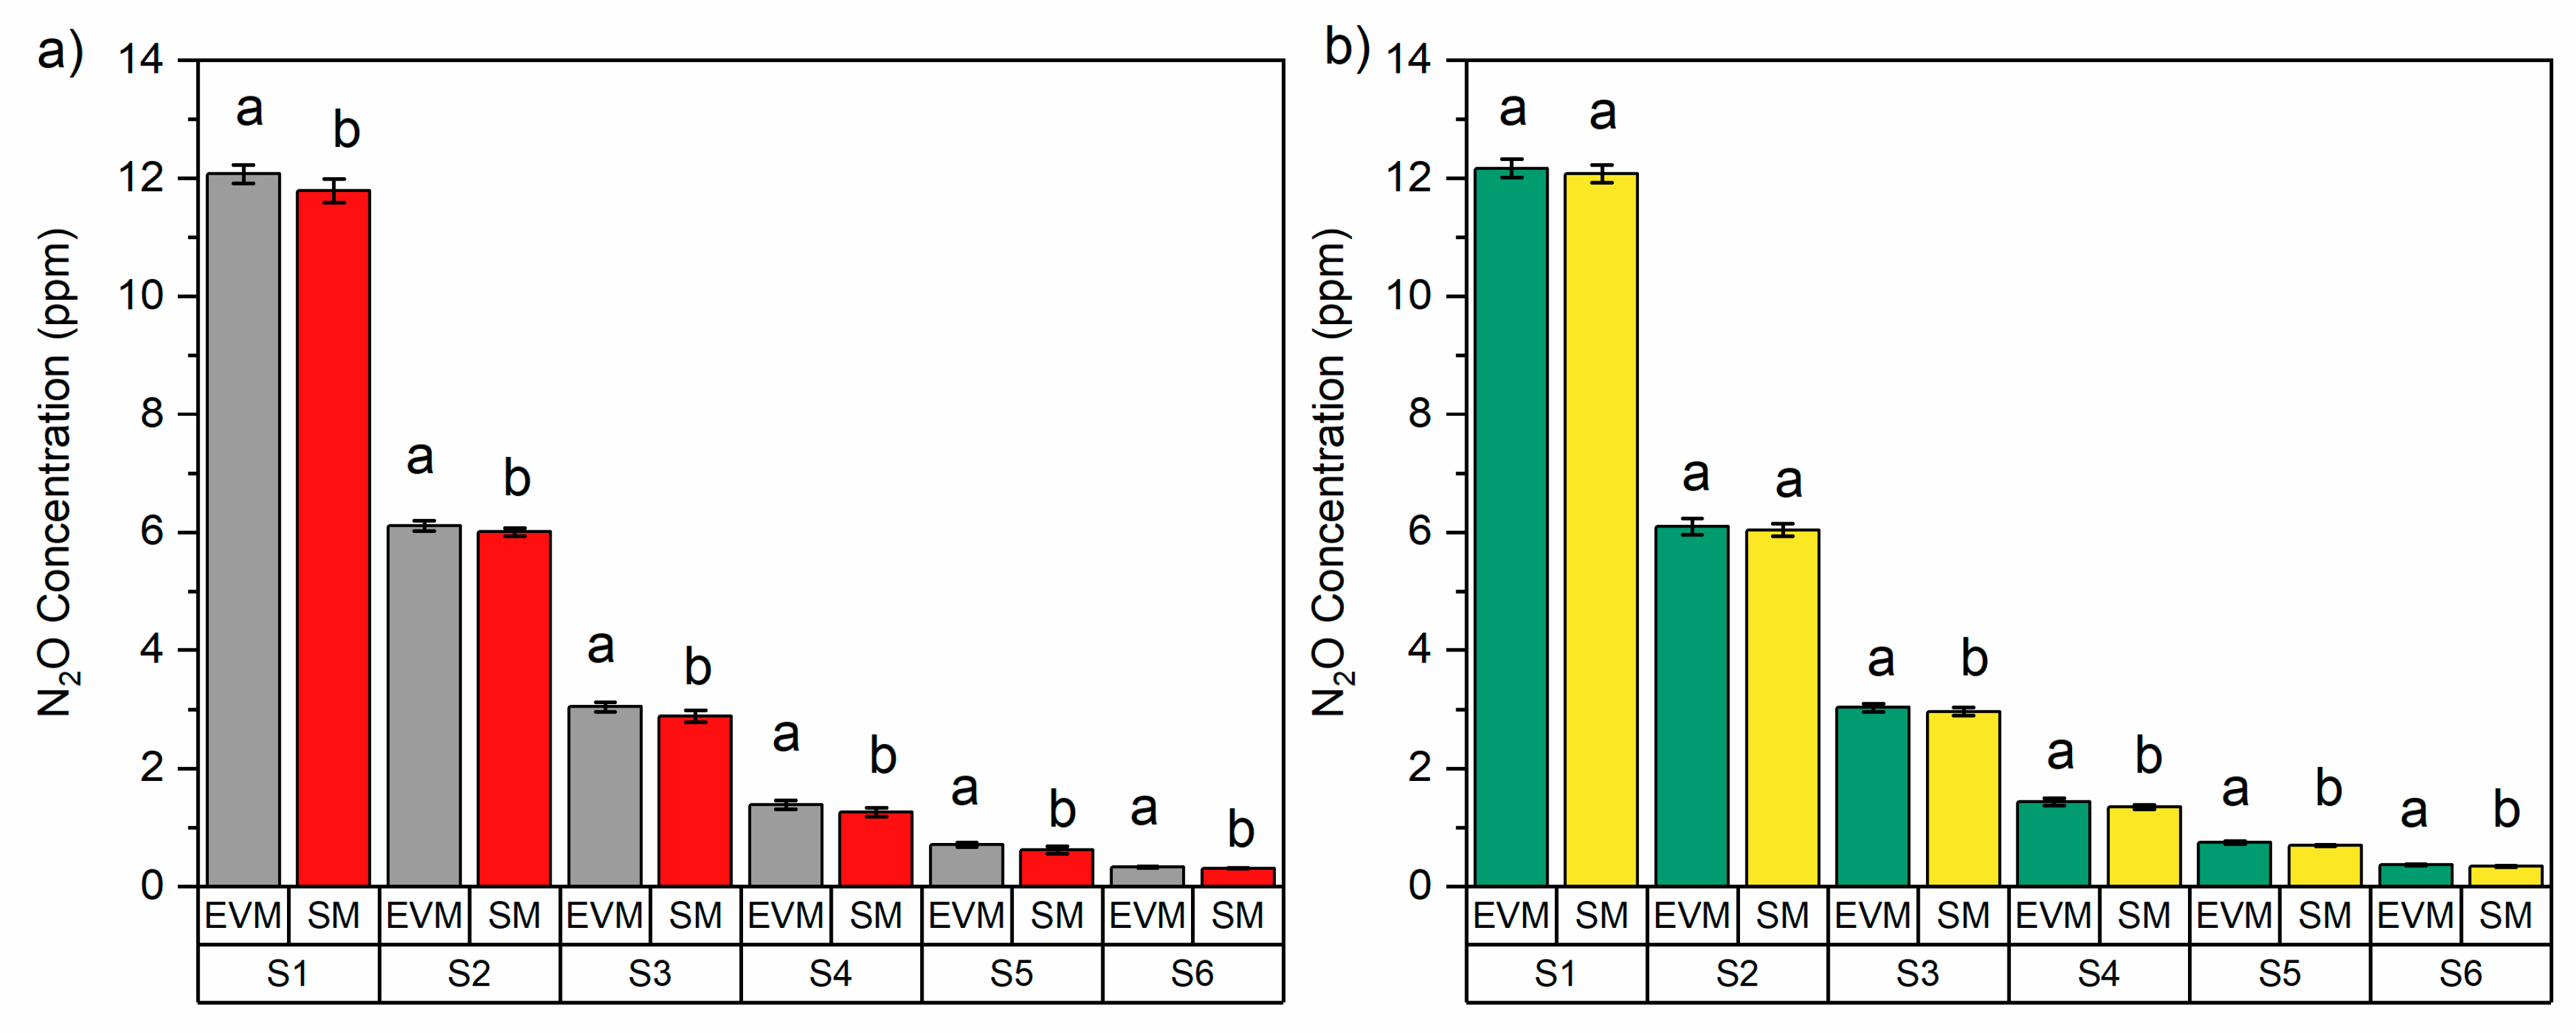

Table 1.
The Root Mean Square Error (RMSE) and Mean Absolute Error (MAE) of stand N2O gas measurements for different exetainer vials evacuation methods.
Table 1.
The Root Mean Square Error (RMSE) and Mean Absolute Error (MAE) of stand N2O gas measurements for different exetainer vials evacuation methods.
| N2O Standard | RMSE | MAE | ||||||
|---|---|---|---|---|---|---|---|---|
| GED | VP | VS | PEE | GED | VP | VS | PEE | |
| S1 (12.500) | 0.740 | 0.179 | 0.448 | 0.239 | 0.715 | 0.154 | 0.426 | 0.229 |
| S2 (6.250) | 0.254 | 0.141 | 0.231 | 0.074 | 0.245 | 0.124 | 0.209 | 0.073 |
| S3 (3.125) | 0.257 | 0.078 | 0.175 | 0.067 | 0.241 | 0.074 | 0.163 | 0.056 |
| S4 (1.563) | 0.311 | 0.154 | 0.224 | 0.147 | 0.304 | 0.151 | 0.221 | 0.146 |
| S5 (0.781) | 0.176 | 0.026 | 0.085 | 0.051 | 0.164 | 0.020 | 0.084 | 0.047 |
| S6 (0.391) | 0.080 | 0.029 | 0.048 | 0.044 | 0.080 | 0.025 | 0.046 | 0.039 |
*GED: Gas exchange by displacement method, VP: evacuation with vacuum pump method, VS: evacuation with syringe method and PEE: pre-evacuated Exetainer method.
Table 2.
Summary of the standard N2O gas storage methods; syringe method (SM) and exetainer vial method (EVM) for vial evacuation methods; gas exchange by displacement (GED) method and evacuation with syringe (VS) method.
Table 2.
Summary of the standard N2O gas storage methods; syringe method (SM) and exetainer vial method (EVM) for vial evacuation methods; gas exchange by displacement (GED) method and evacuation with syringe (VS) method.
| Evacuation Method | Storage Method | Parameter | Standard N2O gas concentration (ppm) | |||||
|---|---|---|---|---|---|---|---|---|
| S1 (12.500) | S2 (6.250) | S3 (3.125) | S4 (1.563) | S5 (0.781) | S6 (0.391) | |||
| GED | SM | RMSE | 0.740 | 0.254 | 0.257 | 0.311 | 0.176 | 0.080 |
| MAE | 0.715 | 0.245 | 0.241 | 0.304 | 0.164 | 0.08 | ||
| EVM | RMSE | 0.457 | 0.164 | 0.111 | 0.196 | 0.084 | 0.061 | |
| MAE | 0.432 | 0.142 | 0.082 | 0.184 | 0.075 | 0.06 | ||
| EVM | % Increase | 2.40 | 1.72 | 5.49 | 9.56 | 14.43 | 6.36 | |
| VS | SM | RMSE | 0.448 | 0.231 | 0.175 | 0.224 | 0.085 | 0.048 |
| MAE | 0.426 | 0.209 | 0.163 | 0.221 | 0.084 | 0.046 | ||
| EVM | RMSE | 0.370 | 0.200 | 0.112 | 0.140 | 0.048 | 0.023 | |
| MAE | 0.338 | 0.151 | 0.092 | 0.127 | 0.040 | 0.019 | ||
| EVM | % Increase | 0.73 | 0.96 | 2.38 | 7.02 | 6.24 | 7.63 | |
Disclaimer/Publisher’s Note: The statements, opinions and data contained in all publications are solely those of the individual author(s) and contributor(s) and not of MDPI and/or the editor(s). MDPI and/or the editor(s) disclaim responsibility for any injury to people or property resulting from any ideas, methods, instructions or products referred to in the content. |
© 2024 by the authors. Licensee MDPI, Basel, Switzerland. This article is an open access article distributed under the terms and conditions of the Creative Commons Attribution (CC BY) license (http://creativecommons.org/licenses/by/4.0/).
Copyright: This open access article is published under a Creative Commons CC BY 4.0 license, which permit the free download, distribution, and reuse, provided that the author and preprint are cited in any reuse.


