
Submitted:
21 October 2024
Posted:
22 October 2024
You are already at the latest version
Abstract
The chemical profiles of young and mature wines produced from three grape varieties Merlot, Mavrud and Sauvignon blanc were analyzed using 1H nuclear magnetic resonance (NMR) spectroscopy and advanced statistical methods. Moreover, grape ales, a hybrid of beer and wine, were subjected to analysis in order to facilitate a comparison of their composition with that of traditional wines. A total of 37 compounds were identified and quantified, and orthogonal partial least squares discriminant analysis (OPLS-DA) models were employed to distinguish the chemical profiles of young and mature wines, as well as those of grape ales. The findings demonstrate that the fermentation and aging processes result in the formation of distinctive chemical signatures in wines, with key compounds such as shikimic acid and fructose contributing to this differentiation. The identified compounds comprise seven alcohols (2,3-butanediol, glycerol, isobutanol, isopentanol, myo-inositol, 1-propanol, 2-phenylethanol), six organic acids (galacturonic, citric, lactic, malic, shikimic, succinic), three amino acids (alanine, proline, tyrosine), four sugars (arabinose, fructose, galactose), coutaric acid and acetoin. The levels of these 22 components enabled the successful differentiation of young and mature wines among the three grape varieties. These results highlight significant chemical differences between grape ales and wines, thereby underscoring the potential of grape ales as an innovative fermented beverage.
Keywords:
young and mature wines
; grape ale
; NMR metabolomics
; chemometrics
; OPLS-DA
1. Introduction
Fermentation is an important process in the production of alcoholic beverages, influencing the chemical composition and sensory characteristics of the final product. Wine has been extensively studied for of its cultural, historical, varietal and health implications. It has a complex chemical profile with over 1000 compounds. These are mainly influenced by factors such as grape variety, terroir and winemaking practices [1].
The growth in consumption of young wines, also known as "vin de primeur" or "nouveau", has highlighted the need to understand of the chemical differences between young and mature wines. Young wines tend to have fresh, fruity flavors and less tannin because they are consumed soon after fermentation. These wines have become increasingly popular, with festivals such as Beaujolais Nouveau in France and similar events in Bulgaria, Italy, Spain and other regions [2].
It is well known that aging contributes to the complexity and aromatic properties of wine. However, there is little comprehensive data concerning how specific compounds change over time [3]. Most of the research conducted on the aging of wine has concentrated on the sensory characteristics of the beverage or specific markers such as polyphenols and volatiles [4,5]. Nevertheless, a more profound comprehension of the alterations in metabolites that occur during the progression from a young to a mature wine is critical. The key compounds that influence taste of wine, including organic acids, amino acids, alcohols and sugars, undergo changes during the aging process. Furthermore, the ability to distinguish between young and mature wine classes could prove valuable for the purposes of authentication and control.
In recent years, there has also been a growing interest in grape ales, a hybrid drink that combines brewing techniques using grape must, grape skins and the same yeast used to make wine – Saccharomyces cerevisiae. This beer style is relatively recent, with its first appearance occurring around 2006–2007. Since 2015 it has experienced a notable surge in popularity [6]. Despite their growing presence in craft beer markets, there is a paucity of knowledge regarding the chemical profile of grape ales. The majority of research has concentrated on the volatile and phenolic components of grape ales along with the factors that influence their composition. These include the timing of grape must addition, fermentation methods, tank materials, yeast strains and changes that occur during fermentation [7,8,9,10,11,12]. To the best of our knowledge, there are no studies that directly compare the chemical composition of grape ales with that of traditional wines.
Nuclear magnetic resonance (NMR) metabolomics represents a powerful tool for elucidating and comparing the metabolomic profiles of young and mature wines, as well as grape ales. The insights gained from such analyses could prove invaluable in the context of quality control and standardization in winemaking. Furthermore, they could inform decision-making regarding aging, blending, and marketing strategies based on these profiles. This approach facilitates a detailed comprehension of the fundamental chemical processes underlying the formation of flavor, while contributing to the ongoing advancement of enology and fermentation science. The method is non-destructive, enabling the identification and quantification of multiple compounds in a single analysis. It has been officially approved by the OIV (International Organisation of Vine and Wine) [13]. When employed in conjunction with statistical techniques, it is widely utilized for the quality control and authentication of a range of beverages. The detailed analysis of complex data sets to identify minor differences in chemical profiles between product types, geographical origins or production methods is most commonly facilitated by principal component analysis (PCA) and orthogonal partial least squares discriminant analysis (OPLS-DA) [14,15,16]. These approaches are particularly effective for the detection of adulteration, the assurance of consistency and the verification of the authenticity of wines, beers and other fermented products [17,18,19]. While NMR has been widely applied in wine research, few studies have compared the chemical changes that occur during the aging process. One study focused on the comparison of compounds in wines produced from Italian grape varieties (Barbera, Nebbiolo, Ruchè, Grignolino, Cortese) that had been aged in bottles. Other investigations included comparisons of French red wine blends of Cabernet Sauvignon, Merlot, and Cabernet Franc that had been aged in oak barrels from different producers [20,21]. Moreover, no NMR studies were identified that examine on the chemical composition of grape ales, underscoring the necessity for further research in this domain.
In this study, we employed NMR spectroscopy to elucidate the chemical profiles of three wine varieties—Merlot, Mavrud, and Sauvignon blanc—at both young and mature stages, as well as four distinct grape ales. Merlot and Sauvignon blanc are among the most widely cultivated and internationally recognized grape varieties, renowned for producing wines of diverse styles across a range of different regions. Mavrud, an indigenous Bulgarian grape variety, is well known in Eastern Europe for its robust and full-bodied red wines. The inclusion of this variety in this study serves to highlight the importance of local varieties. Furthermore, it demonstrates how traditional grapes compare with international varieties in terms of chemical composition and fermentation profiles. A total of 37 compounds were identified and quantified. OPLS-DA was employed to distinguish the characteristic compounds of young and mature wines, and to compare these wines with grape ales. This approach offers novel insights into the influence of fermentation and aging processes on the development of key compounds and permits a comprehensive comparison of the chemical composition of different products and stages of aging.
2. Materials and Methods
2.1. Wine and Grape Ale Samples
The present study focused on three distinct wines. The selected varieties were Merlot, Mavrud, and Sauvignon blanc. Samples of both young and mature vintages were obtained from each variety. The wines were sourced from vineyards in Bulgaria. The young wines were subjected to analysis within three months of completion of the fermentation process. In contrast, the mature white and red wines were aged in oak barrels for six and 24 months, respectively, prior to undergoing analysis. Further details on the abbreviations used for of the samples, the grape varieties employed in their production, the vineyard from which they were sourced, and the years in which they were produced, can be found in Table S1a.
Four distinct grape ale samples procured from a specialty craft beer market were utilized in this investigation. These beers were crafted using conventional beer brewing techniques, augmented with grape must and grape skins during fermentation. Details regarding their age, grape variety, and producer are provided in Table S1b. Prior to analysis, samples were stored at 4°C.
2.2. Sample Preparation
The grape ale samples were prepared by degassing the beers in an ultrasonic bath for a period of 15 minutes. Subsequently, 500 µl of each sample was combined with 50 µl of deuterated buffer (pH 4.4) containing 0.1% TSP (3-(trimethylsilyl)-2,2,3,3-tetradeuteropropionic acid sodium salt) and 0.05% NaN3. The preparation of wine samples was conducted in accordance with the methodology initially outlined by Godelman and subsequently adopted by the OIV. This entailed the dilution 495 µl of the sample with 55 µl of the same buffer, followed by an adjustment of the pH to 3.10. The resulting solutions were then transferred to 5 mm NMR tubes.
2.3. NMR Analysis
One-dimensional proton (1D 1H) water suppression experiments were performed using the standard zgcppr pulse sequence at 300.0 ± 0.1 K on a Bruker Avance NEO 400 instrument, equipped with a triple resonance BBO probe head. A total of 256 scans and 16 dummy scans were accumulated for each sample, with a spectral width of 13.2 ppm and 42104 data points. The acquisition time and relaxation delay were set to four seconds. The resulting free induction decay (FID) was multiplied by a line broadening of 0.3 Hz, Fourier transformed with zero filling to 64K points. Before integration, careful manual phase and baseline corrections were applied. The chemical shifts were referenced to the TSP signal, which was assigned a value of 0 ppm. The 37 organic compounds were identified and confirmed by two-dimensional nuclear magnetic resonance (2D NMR) spectroscopy, including - correlation spectroscopy (COSY), total correlation spectroscopy (TOCSY), and heteronuclear single quantum coherence (1H-13C HSQC), as well as spiking experiments and/or literature data. The non-overlapping proton signals of each compound were selected for quantification. The integrated TSP signal was employed as an internal standard and the formula officially accepted by the OIV was used for quantification [22].
2.4. Statistical Analysis
A total of 37 compounds were identified and quantified in all wine and grape ale samples. The data were processed and subjected to multivariate statistical analysis were performed using SIMCA 17.0 software (Umetrics, Sweden). OPLS-DA was employed to distinguish the chemical profiles of young and mature wines and grape ales. The performance of the model was evaluated using R² (explained variance) and Q² (predictive variance) values. The model was able to successfully discriminate between the three groups with an R² of 0.724 and a Q² of 0.693. The key compounds responsible for the observed discrimination were identified through the use of variable importance in projection (VIP) values. A new OPLS-DA model was constructed using only the significant components (R² = 0.950, Q² = 0.746). A seven-fold cross-validation was performed, and the model's classification performance was further assessed with a receiver operating characteristic (ROC) curve, which is presented in Figure S1.
To assess the differences in the botanical origin of young and mature wines (Merlot, Mavrud, Sauvignon blanc), an OPLS-DA model was constructed using six orthogonal and nine predictive compounds. The model demonstrated effective separation of young and mature wines from the three grape varieties, with an R² of 0.998 and a Q² of 0.581, indicating robust predictive power. Furthermore, the Supplementary Information (Table S2) provides additional evidence to support this conclusion. The characteristic compounds for each variety were identified using the VIP parameters.
A principle component analysis (PCA) was conducted to ascertain the similarities in the composition of grape ales, with the first two components explaining 83.8% of the original data. An additional OPLS-DA analysis (R² = 0.647, Q² = 0.912) was conducted to investigate the similarities between young and mature Sauvignon blanc wines and the grape ale produced from Sauvignon blanc grapes. The misclassification table was employed to assess the accuracy of the grouping – see Table 2.
3. Results and Discussion
3.1. NMR Profiling and Differentiation of Young and Mature Wines and Grape Ales
The chemical profiles of nine young wines and nine mature wines, derived from three grape varieties, were investigated through the application of ¹H NMR spectroscopy. Furthermore, four grape ales were procured and subjected to the same analysis. A total of 37 compounds commonly found in beverages were identified across both products, including alcohols, organic acids, amino acids, saccharides, nucleosides, and other substances such as choline and trigonelline. The minimum and maximum concentrations of these compounds are presented in Table 1, along with the corresponding chemical shifts and multiplicities of the corresponding signals used for quantification.

Table 1.
Minimum and maximum concentrations in mg/L of the identified compounds in wines and grape ales, along with the chemical shifts/multiplicities used for quantitation at pH = 3.10.
Table 1.
Minimum and maximum concentrations in mg/L of the identified compounds in wines and grape ales, along with the chemical shifts/multiplicities used for quantitation at pH = 3.10.
| Compounds | Young wine | Mature wine | Grape ale | 1H δ | Multiplicity* |
|---|---|---|---|---|---|
| (mg/L) | (n=9) | (n=9) | (n=4) | (ppm) | |
| Alcohols | |||||
| 2,3-Butanediol (2,3Bd) | 218-429 | 337-730 | 120-595 | 1.13 | d |
| Glycerol (GlycOH) | 5148-8760 | 9847-13688 | 1317-5153 | 3.55 | dd |
| Isobutanol (iBuOH) | 13-75 | 29-67 | 36-214 | 1.73 | m |
| Isopentanol (iPentOH) | 91-136 | 156-299 | 76-150 | 1.43 | q |
| Methanol (MeOH) | 21-158 | 20-245 | 12-50 | 3.35 | s |
| Myo-Inositol (myoIn) | 217-406 | 349-3373 | 0-432 | 4.05 | t |
| 2-Phenylethanol (2PhEt) | 7-72 | 14-69 | 27-55 | 7.36 | m |
| 1-Propanol (1PrOH) | 9-31 | 19-73 | 31-58 | 1.54 | m |
| Organic acids | |||||
| Citric acid (CitA) | 60-117 | 0-519 | 0-224 | 2.93 | d |
| Galacturonic acid (GalA) | 118-826 | 41-1399 | 146-602 | 5.31 | d |
| Formic acid (FoA) | 0-2 | 0-21 | 0-1 | 8.31 | s |
| Lactic acid (LA) | 76-472 | 208-1816 | 42-3932 | 1.4 | d |
| Malic acid (MalA) | 0-923 | 0-1761 | 0-165 | 2.87 | dd |
| Shikimic acid (ShA) | 3-18 | 6-30 | 0 | 6.8 | m |
| Succinic acid (SA) | 131-836 | 328-1069 | 199-534 | 2.65 | s |
| Tartaric acid (TA) | 648-1300 | 1019-2295 | 572-879 | 4.55 | s |
| Amino acids | |||||
| Alanine (Ala) | 2-28 | 8-58 | 34-123 | 1.47 | d |
| Histidine (His) | 0 | 0 | 45293 | 7.84 | s |
| Proline (Pro) | 211-1269 | 301-3045 | 713-1467 | 2.35 | m |
| Tyrosine (Tyr) | 9-30 | 1-56 | 13-89 | 7.18 | d |
| Saccharides | |||||
| Arabinose (Ara) | 8-132 | 0-412 | 18-111 | 4.45 | d |
| Fructose (F) | 0-452 | 0-498 | 0 | 3.99 | m |
| Galactose (Gal) | 20271 | 23-180 | 16377 | 5.25 | d |
| Glucose (G) | 39-515 | 12-1033 | 331-922 | 4.59 | d |
| Sucrose (Su) | 11-47 | 0-97 | 28-164 | 5.43 | d |
| Phenolic compounds | |||||
| Caffeic acid (Caffa) | 0 | 0-21 | 0-6 | 6.33 | d |
| Caftaric acid (CaftA) | 0-214 | 0-85 | 7-13 | 6.43 | d |
| Coutaric acid (CoutA) | 0-15 | 0-24 | 5-10 | 6.45 | d |
| Nucleobases and nucleosides | |||||
| Adenosine (Ado) | 0 | 0 | 31-59 | 8.36 | s |
| Guanosine (Guo) | 0 | 0 | 14-45 | 8 | s |
| Inosine (Ino) | 0 | 0 | 2-56 | 8.34 | s |
| Thymidine (Thm) | 0 | 0 | 4-19 | 7.65 | s |
| Uracil (Urc) | 0 | 0 | 0-41 | 7.52 | d |
| Other | |||||
| Acetaldehyde (MeCHO) | 0-36 | 0-13 | 0-3 | 9.67 | q |
| Acetoin (Acet) | 0-11 | 0-103 | 6-34 | 2.22 | s |
| Choline (Cho) | 11-23 | 17-46 | 5-14 | 3.19 | s |
| Trigonelline (Tri) | 4-10 | 5-43 | 15-108 | 9.12 | s |
*Multiplicities: s – singlet, d – doublet, t – triplet, q – quartet, m – multiplet
Of the identified compounds, 29 were present in both the wine and the grape ale samples. However, six compounds — uracil, thymidine, histidine, guanosine, inosine, and adenosine—were identified as distinctive to grape ale. It is probable that these amino acids and nucleobases have their origin in the malts used in brewing, since the yeast species concerned is common to both beer and wine fermentation [23].
The presence of shikimic acid and fructose was exclusive to wines. This may be attributed to the distinctive attributes of grape fermentation. Shikimic acid, which is extracted from grape skins, is not typically found in the ingredients used in brewing, such as malted grains [24]. Furthermore, the fermentation of grapes in winemaking permits the retention of natural sugars such as fructose, which may not persist in grape ales due to the fermentation process employed in brewing, whereby yeast more efficiently consumes available sugars.
A comparison of the ¹H NMR spectra with water suppression for young and mature wines and grape ale is presented in Figure 1.
Figure 1.
¹H NMR spectra of mature wine (red, sb_m1), young wine (olive, sb_y2), and grape ale (orange, ga_3).
Figure 1.
¹H NMR spectra of mature wine (red, sb_m1), young wine (olive, sb_y2), and grape ale (orange, ga_3).
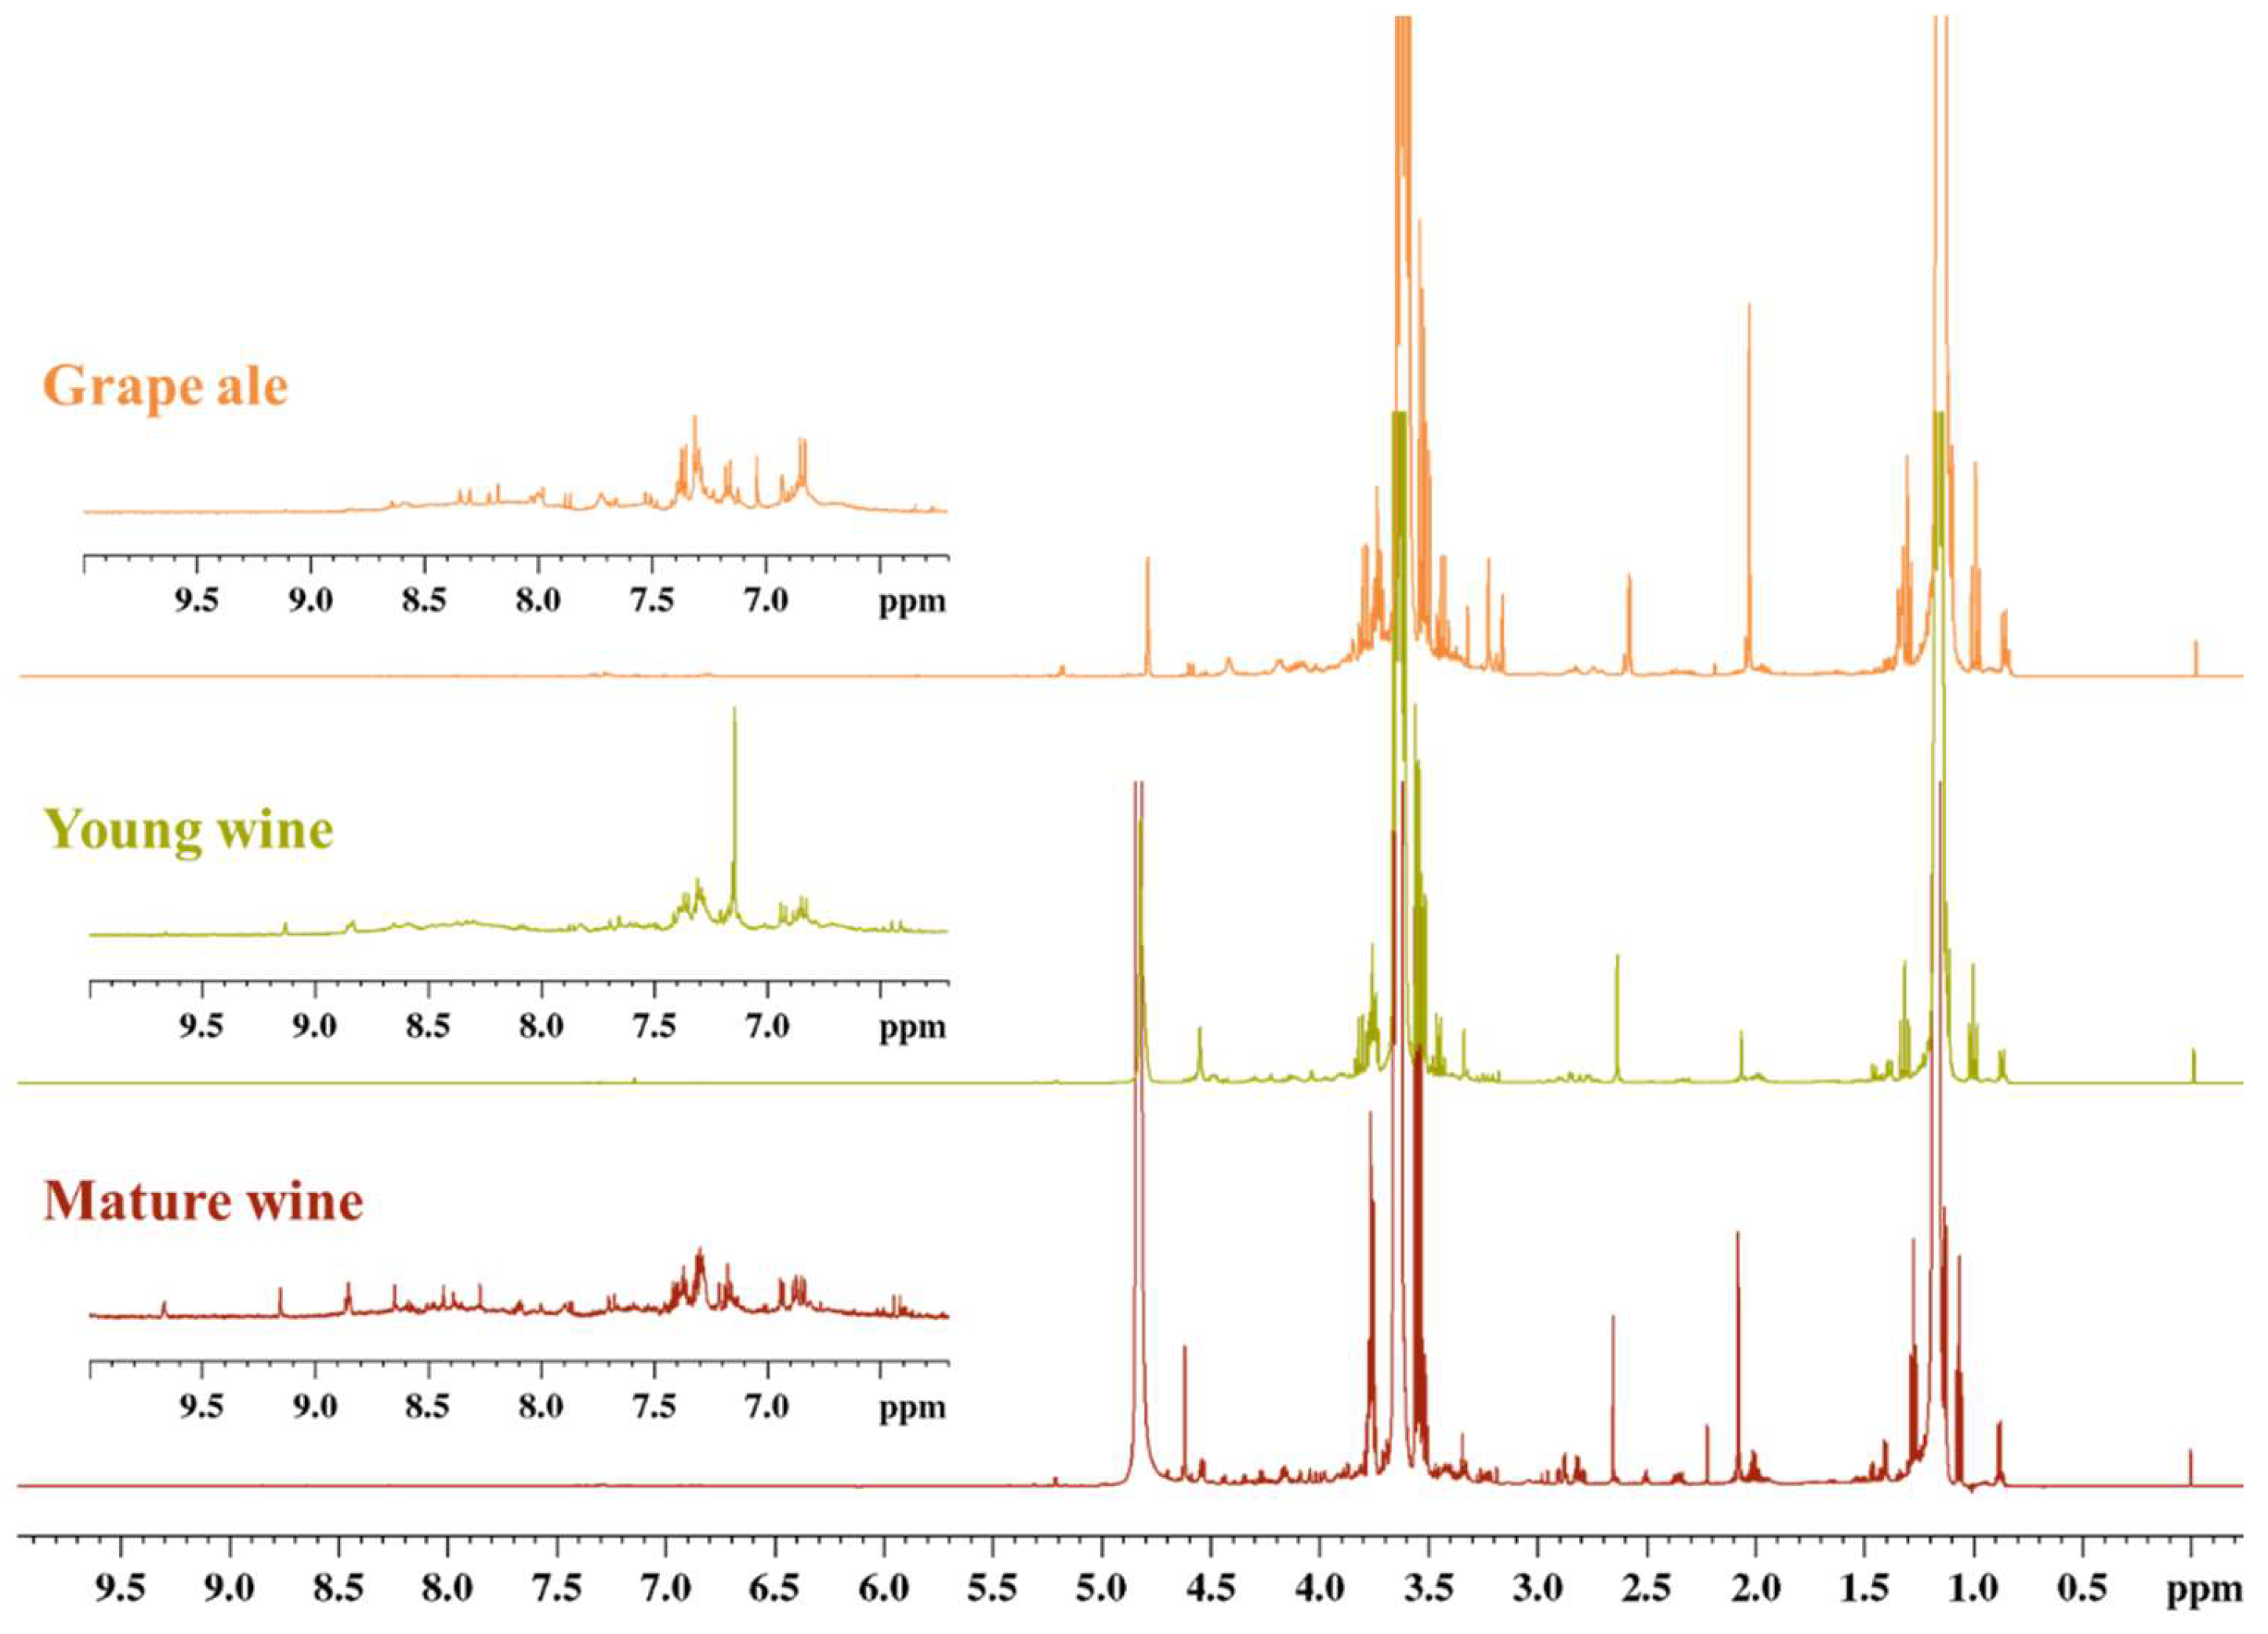
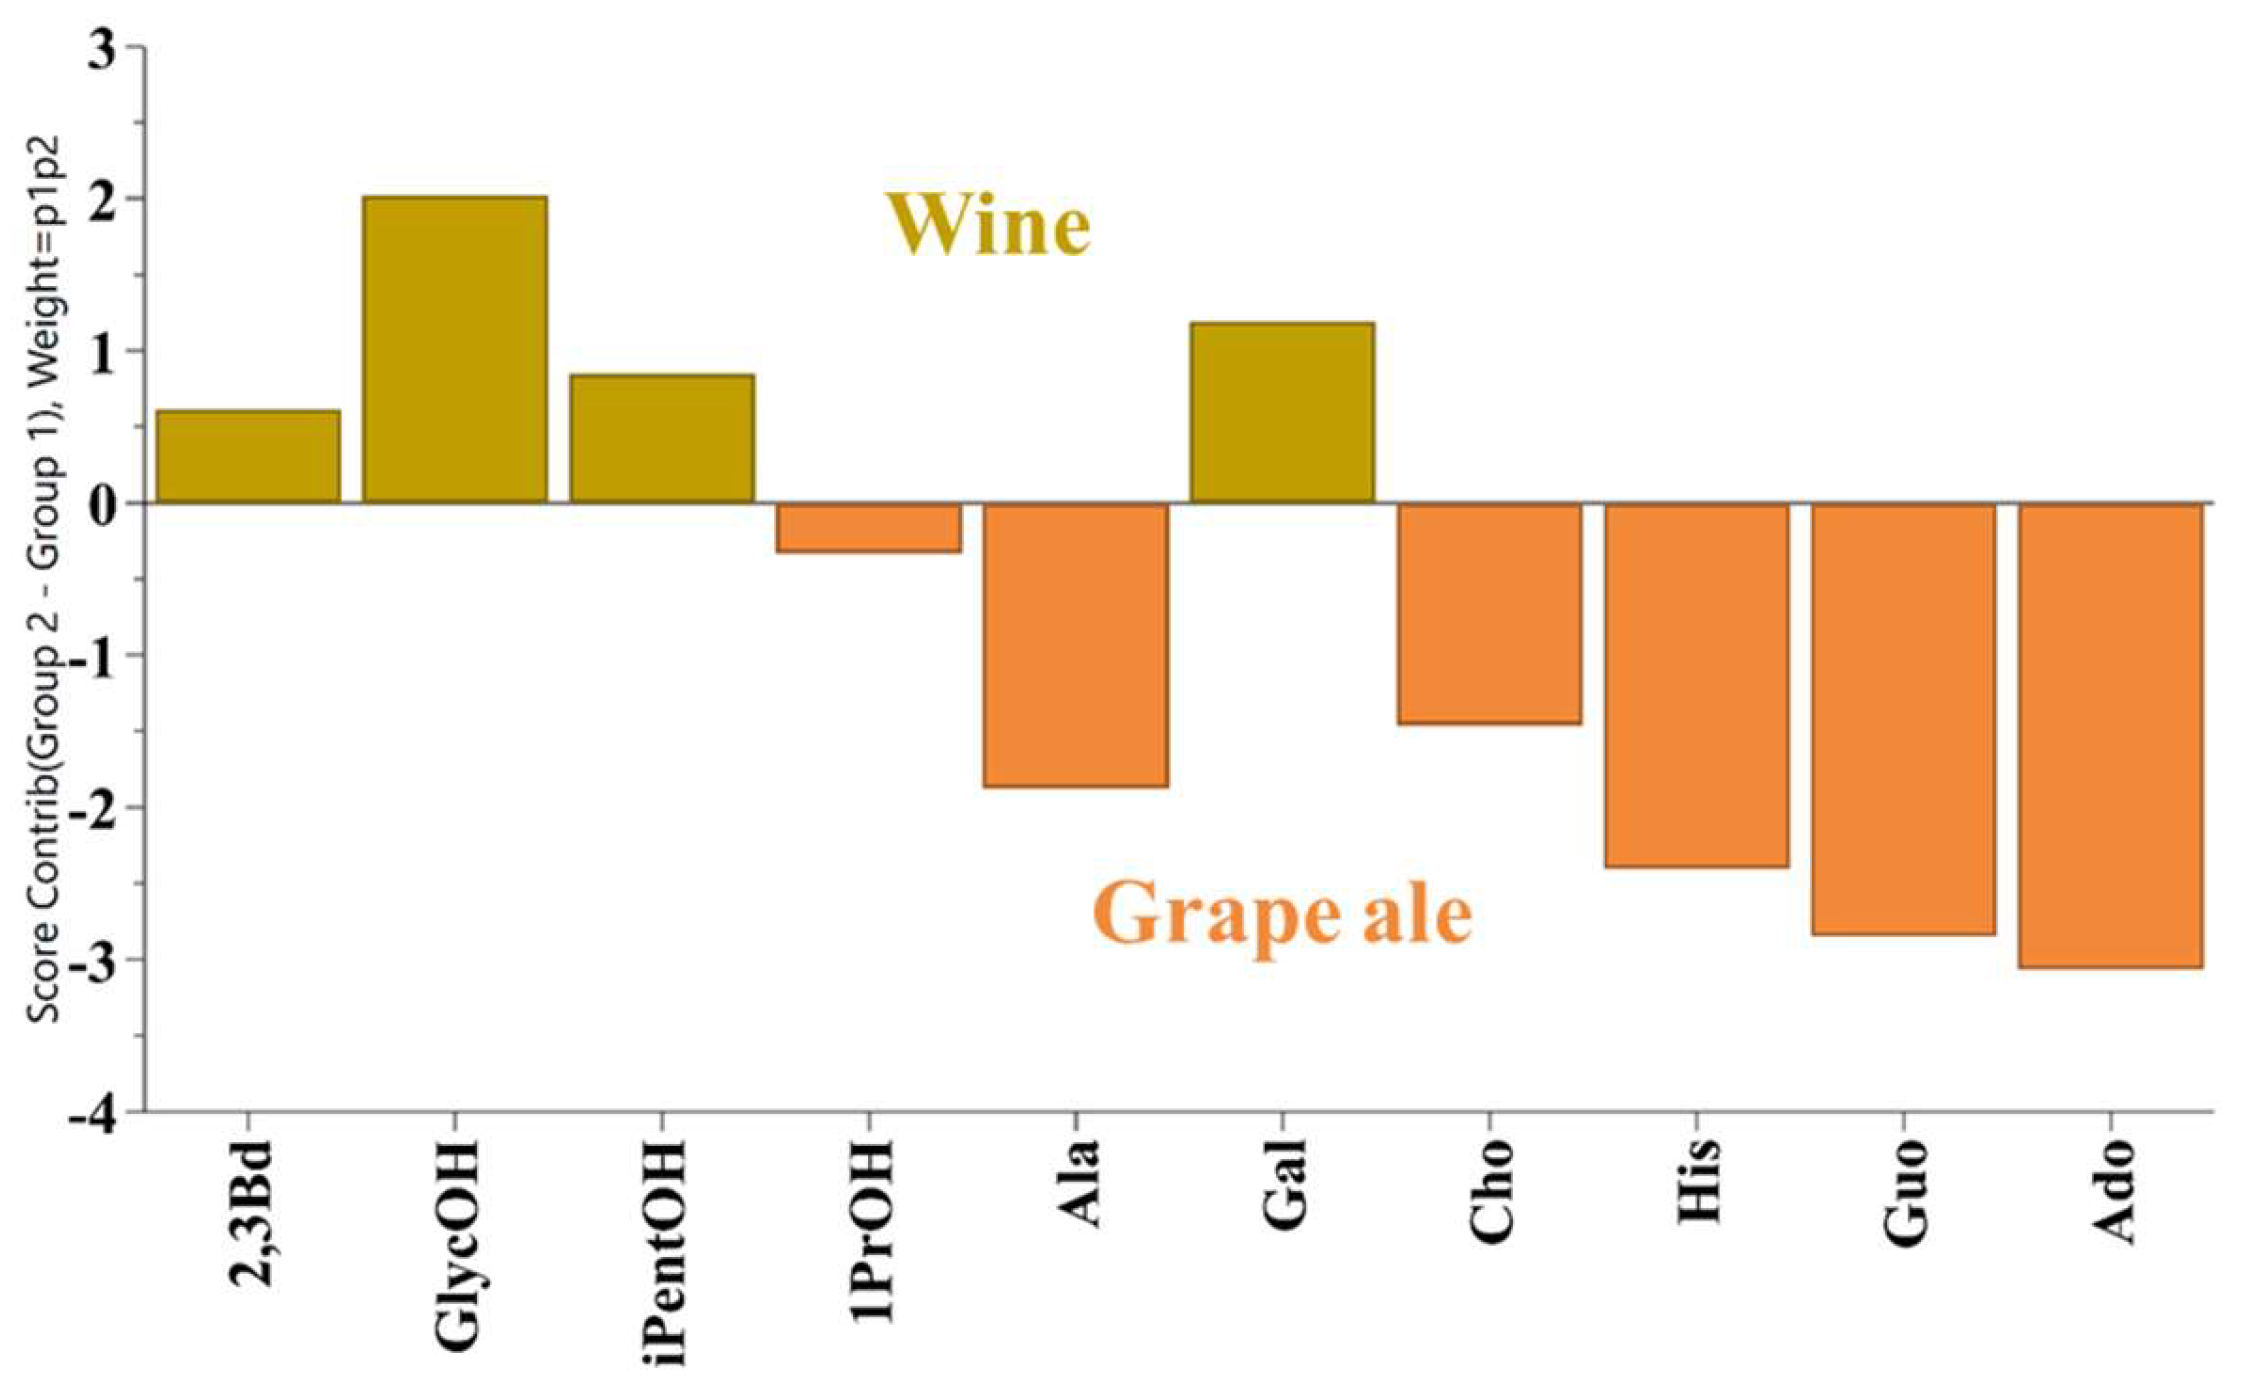
As anticipated, the primary compounds identified in the NMR spectra are ethanol and glycerol, in addition to organic acids such as acetic, lactic, succinic, tartaric and amino acid proline. The differences between the samples are slight, as illustrated in Figure 1. Only a comprehensive statistical examination of the quantitative data can elucidate the subtle distinctions between grape ale, young wine, and mature wine. To evaluate these differences, OPLS-DA was employed, utilizing the quantitative data of 37 compounds. Variable Importance in Projection (VIP) scores were used to identify statistically significant metabolites that could serve to discriminate between these classes. A total of 10 compounds with VIP scores greater than 0.94 were identified as significant. These included four higher alcohols (2,3-butanediol, glycerol, isopentanol and 1-propanol), two amino acids (alanine and histidine), one monosaccharide (galactose), two purine nucleosides (adenosine and guanosine), and choline. The contribution plot in Figure 2 elucidates the significant compounds that differentiate wine (young and mature) from grape ale. It demonstrates that wines are distinguished by elevated levels of 2,3-butanediol, glycerol, isopentanol, and galactose, whereas grape ales are more closely associated with 1-propanol, alanine, histidine, choline, adenosine, and guanosine.
Figure 2.
Contribution plot of wines (yellow) and grape ale (orange).
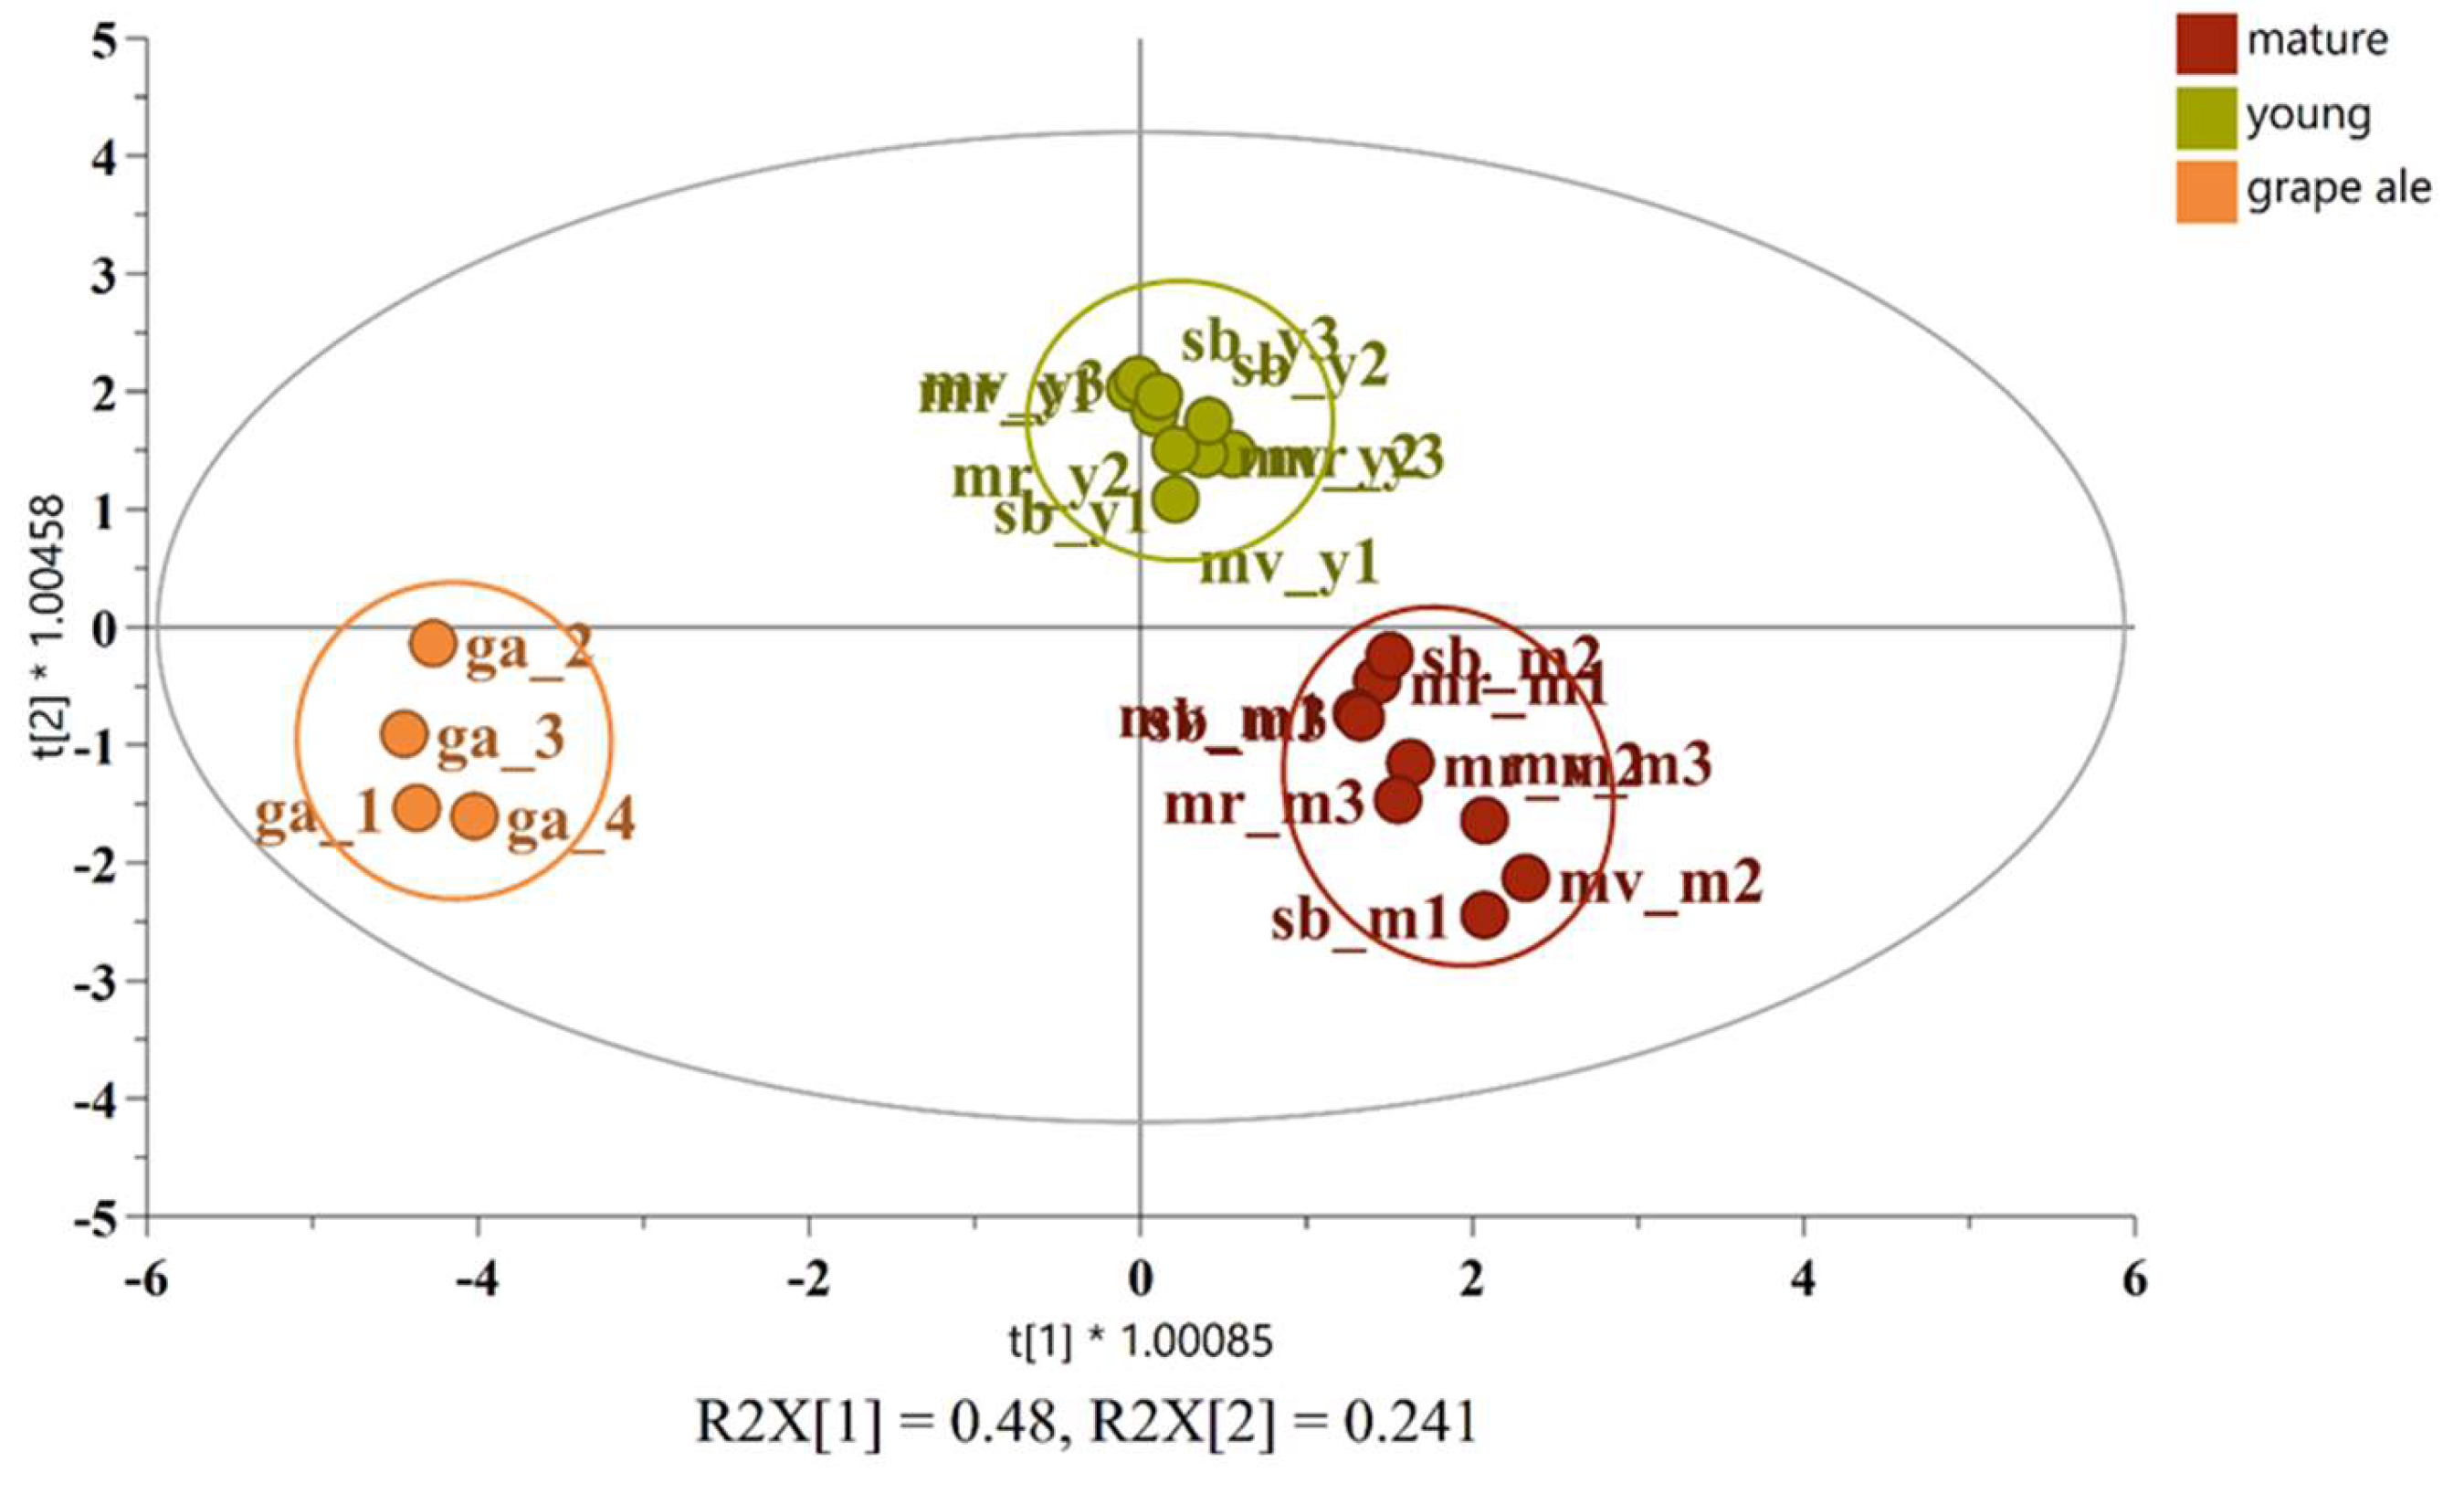
A novel OPLS-DA model was constructed based on the 10 most significant substances, enabling the clear differentiation of the three alcoholic products. The efficacy of this model in discerning between diverse sample types is illustrated by the score plot in Figure 3.
Figure 3.
OPLS-DA score plot for the classification of young wine (olive), mature wine (red), and grape ale (orange).
Figure 3.
OPLS-DA score plot for the classification of young wine (olive), mature wine (red), and grape ale (orange).
The mean content of the majority of identified alcohols, with the exception of isobutanol and 1-propanol, is markedly elevated in both young and mature wines in comparison to grape ale. For instance, the mean concentration of glycerol is 7299 mg/L in young wines, 12296 mg/L in aged wines, and only 3351 mg/L in grape ale. The differences in the concentration of specific alcohols between wines and ales span a considerable range from 3% to 78%. This can be attributed to the longer fermentation process of wine and the different yeast strains used, which are often more efficient at converting sugars to alcohol and producing a variety of higher alcohols. Additionally, wines contain higher concentration of galactose and fructose, which are naturally present in grape skins and seeds. Conversely, grape ales exhibit higher levels of alanine and histidine, which are likely derived from the malted grains. The comprehensive differences between young and mature wines are illustrated in the Nightingale diagram in Figure 4.
Figure 4.
Nightingale diagram comparing the average content of compounds in young (olive, Y) and mature (red, M) wines.
Figure 4.
Nightingale diagram comparing the average content of compounds in young (olive, Y) and mature (red, M) wines.
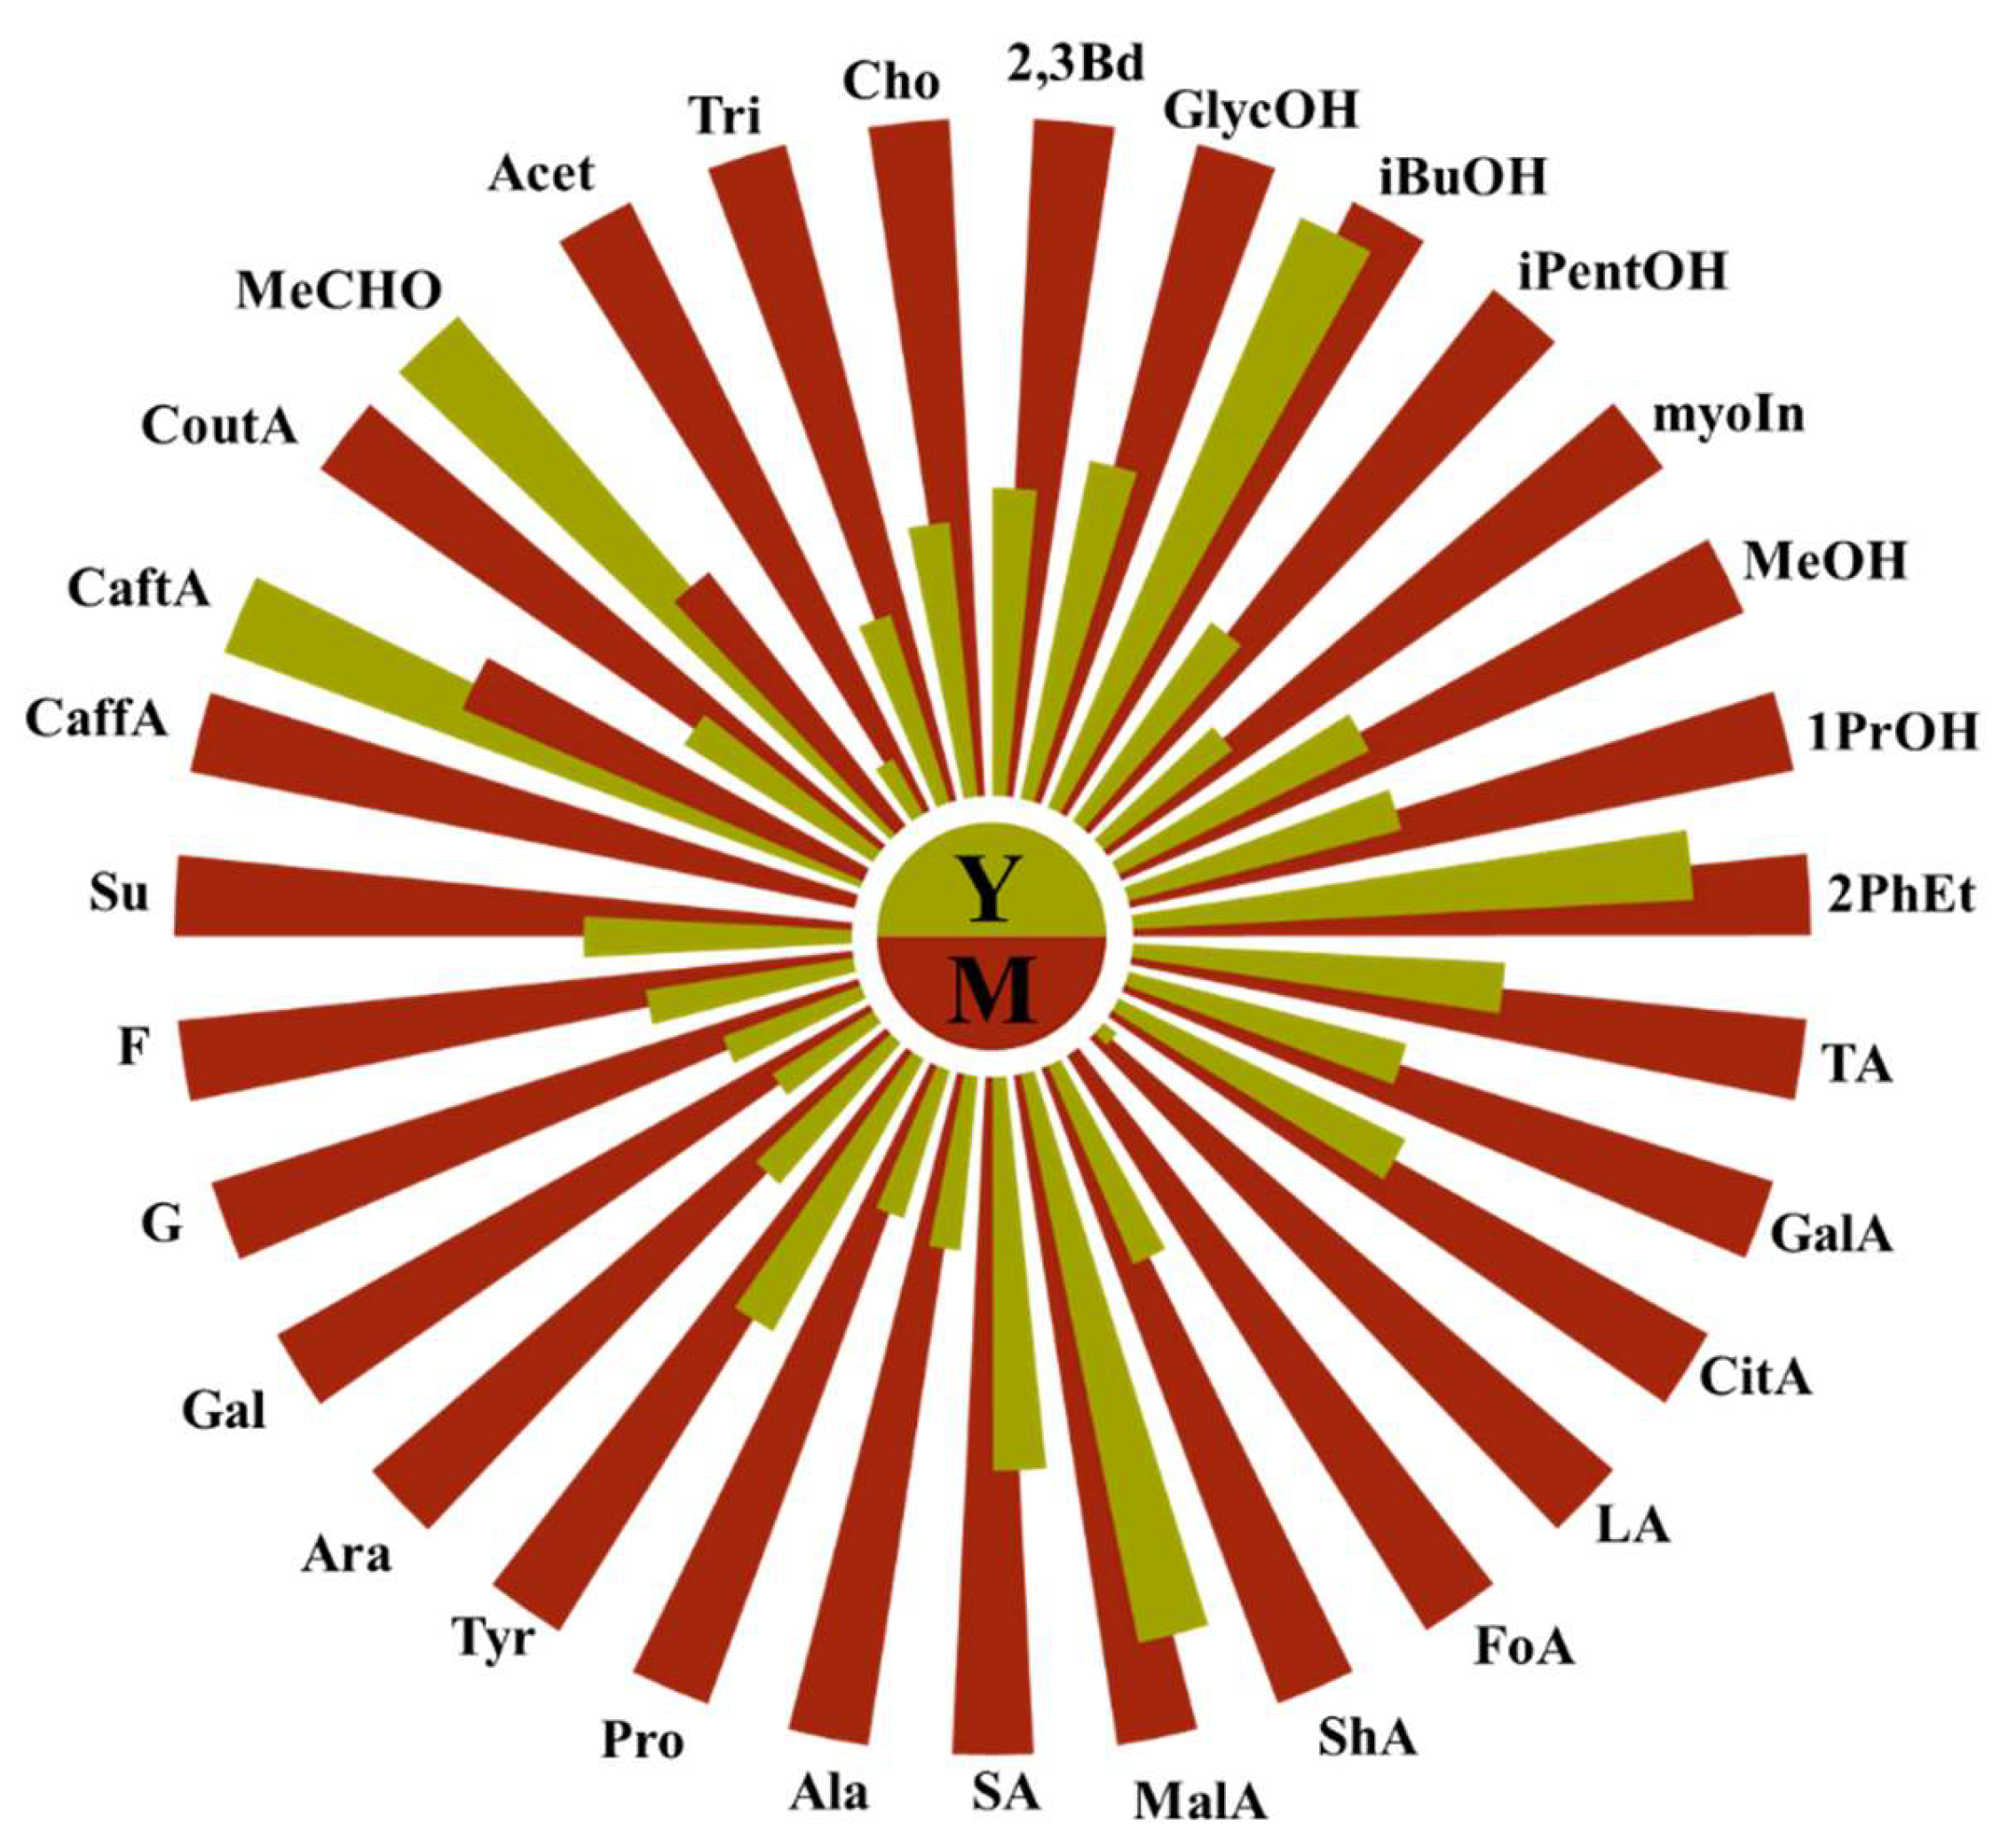
As illustrated in the diagram of average content of young (n=9) and aged (n=9) wines, almost all of the compounds identified by NMR increase during aging in oak barrels. In agreement with the literature, higher alcohols and organic acids increase during aging, primarily due to microbial activity such as malolactic fermentation, which converts malic acid into lactic acid, as well as chemical oxidative reactions and various chemical interactions. Contrary to some studies [21], amino acids also increase during aging, which can be attributed to biochemical processes, particularly yeast autolysis [25], especially when wines are aged on their lees (the sediment of dead yeast cells). The increase in sugar quantity may result from reactions with hemicellulose from oak barrels. The only compounds that show a decrease in quantity—caftaric acid and acetaldehyde—decline during aging primarily due to oxidation, microbial metabolism, or/and potential interactions with other wine components. A detailed comparison of each wine variety is needed, as the compounds in them can evolve differently during aging.
3.2. Differentiation of Young Wines by Grape Variety and Identification of the Changes in Their Profile During Aging Process
An OPLS-DA analysis was employed to distinguish between the young and aged wines based on their respective grape varieties. The 18 samples were classified into six groups: young and mature Merlot, young and mature Mavrud, and young and mature Sauvignon blanc. A total of 22 compounds with VIP scores exceeding 0.9 were incorporated into the OPLS-DA model. The principal discriminating compounds included seven alcohols (2,3-butanediol, glycerol, isobutanol, isopentanol, myo-inositol, 1-propanol, 2-phenylethanol), six organic acids (galacturonic, citric, lactic, malic, shikimic, succinic), three amino acids (alanine, proline, tyrosine), four sugars (arabinose, fructose, galactose, glucose), coutaric acid and acetoin. The OPLS-DA score plot is presented in Figure 5.
Figure 5.
OPLS-DA score plot illustrating the differentiation of young and aged Merlot (light blue and blue), Mavrud (pink and red violet) and Sauvignon blanc (yellow and orange) wines.
Figure 5.
OPLS-DA score plot illustrating the differentiation of young and aged Merlot (light blue and blue), Mavrud (pink and red violet) and Sauvignon blanc (yellow and orange) wines.
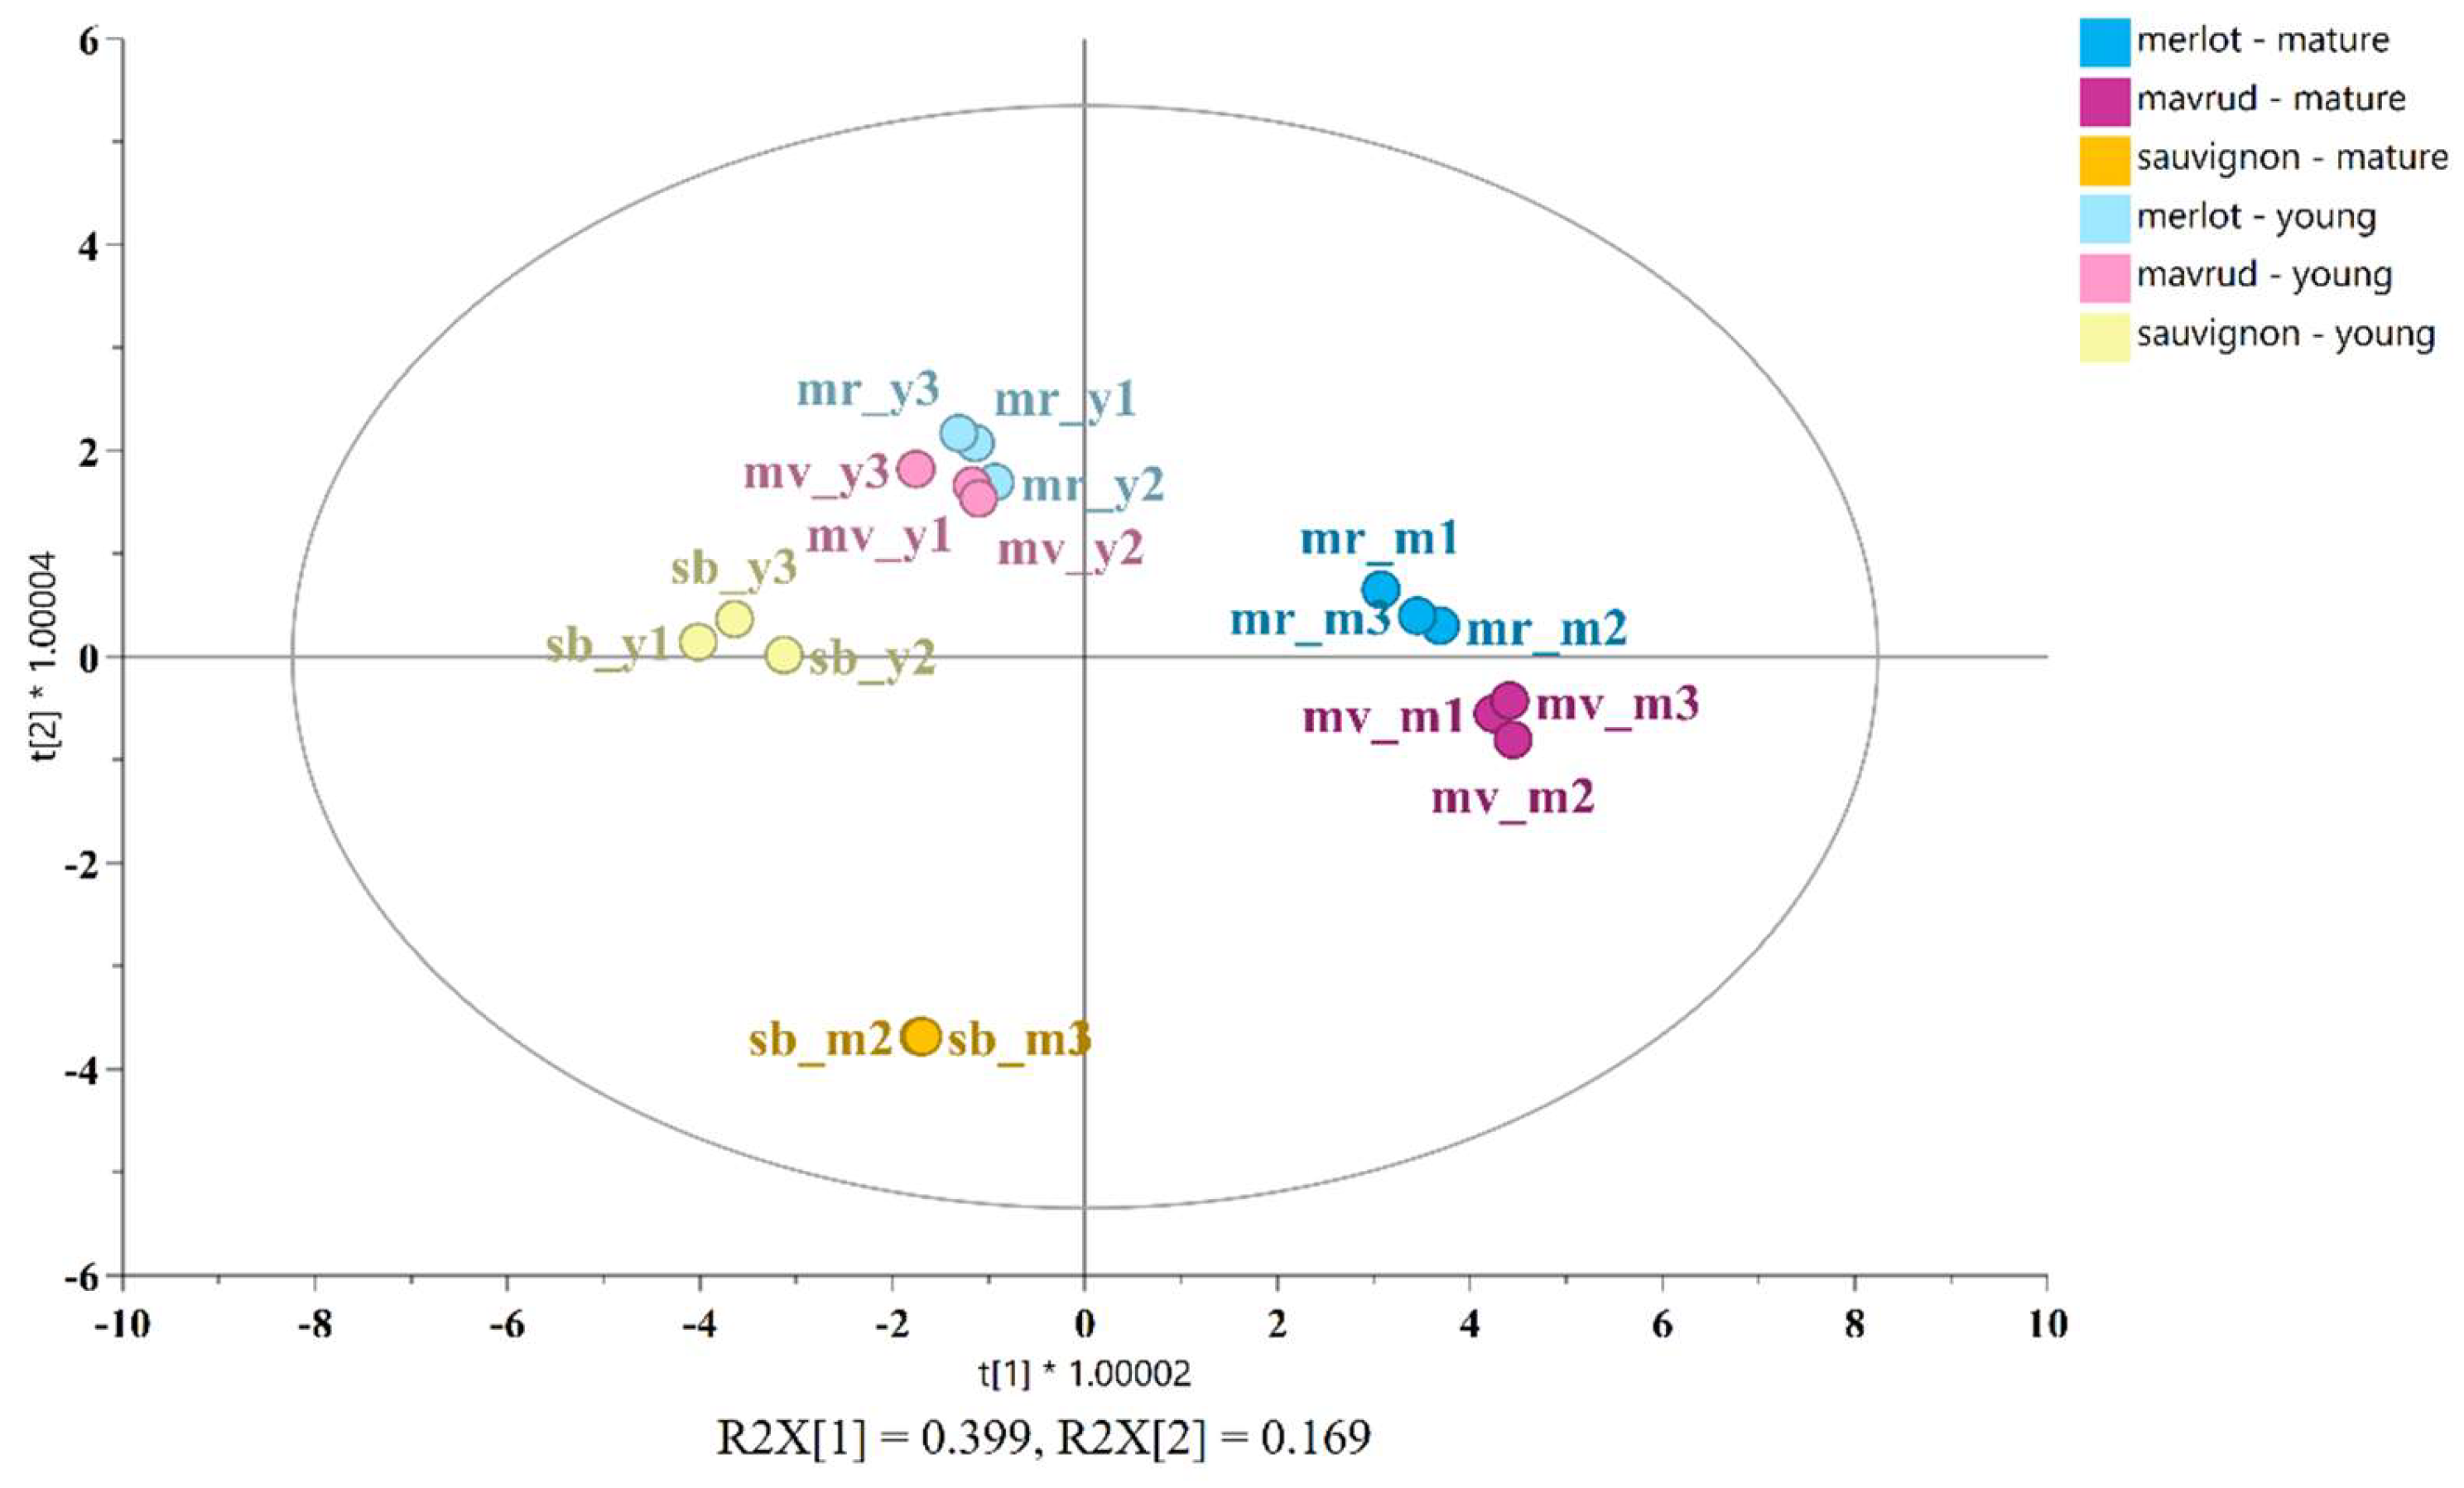
Figure 5 provides a clear illustration of the discrimination between the six classes, emphasizing the compositional variations among the wines. The wines retain their principal characteristic profiles, exhibiting characteristic changes between varieties and different changes between young and mature wines. For example, the young Merlot is distinguished by elevated levels of 2-phenylethanol and tyrosine, the young Mavrud variety contains higher levels of succinic acid, while young Sauvignon blanc is distinguished by higher concentrations of malic acid and fructose. In comparison, mature Merlot is characterized by the presence of lactic and coutaric acid, as well as arabinose. Mavrud, on the other hand, exhibits elevated levels of galacturonic and shikimic acids, along with galactose. Aged Sauvignon blanc displays a higher concentration of 1-propanol, citric acid and malic acid [16]. The corresponding contribution plots in Figure S2 illustrate the detailed differences between young and mature wines. This comparison suggests that the major characteristic profile of each wine variety is largely preserved throughout the aging process, despite the changes that occur during ageing.
The score plot also demonstrate that the young red wines (Merlot and Mavrud) are closely grouped, as are the mature red wines, indicating comparable compositions and ageing patterns. Conversely, the aged Sauvignon blanc wines are more distant from their younger counterparts, suggesting that white wines undergo a different aging process to red wines. The compositional alterations for each wine variety during the aging process are illustrated in the charts in Figure 6, which compare the concentration differences of the measured components in young and mature wines. For improved visual representation, the components have been divided into two categories: major (≥480 mg/L) and minor (<480 mg/L).
Figure 6.
Concentration changes in Merlot (A), Mavrud (B), and Sauvignon blanc (C) during the aging process from young to mature wine, represented as major (left, ≥480 mg/L) and minor (right, <480 mg/L) groups. Positive changes are indicated in green, while negative changes - in red.
Figure 6.
Concentration changes in Merlot (A), Mavrud (B), and Sauvignon blanc (C) during the aging process from young to mature wine, represented as major (left, ≥480 mg/L) and minor (right, <480 mg/L) groups. Positive changes are indicated in green, while negative changes - in red.
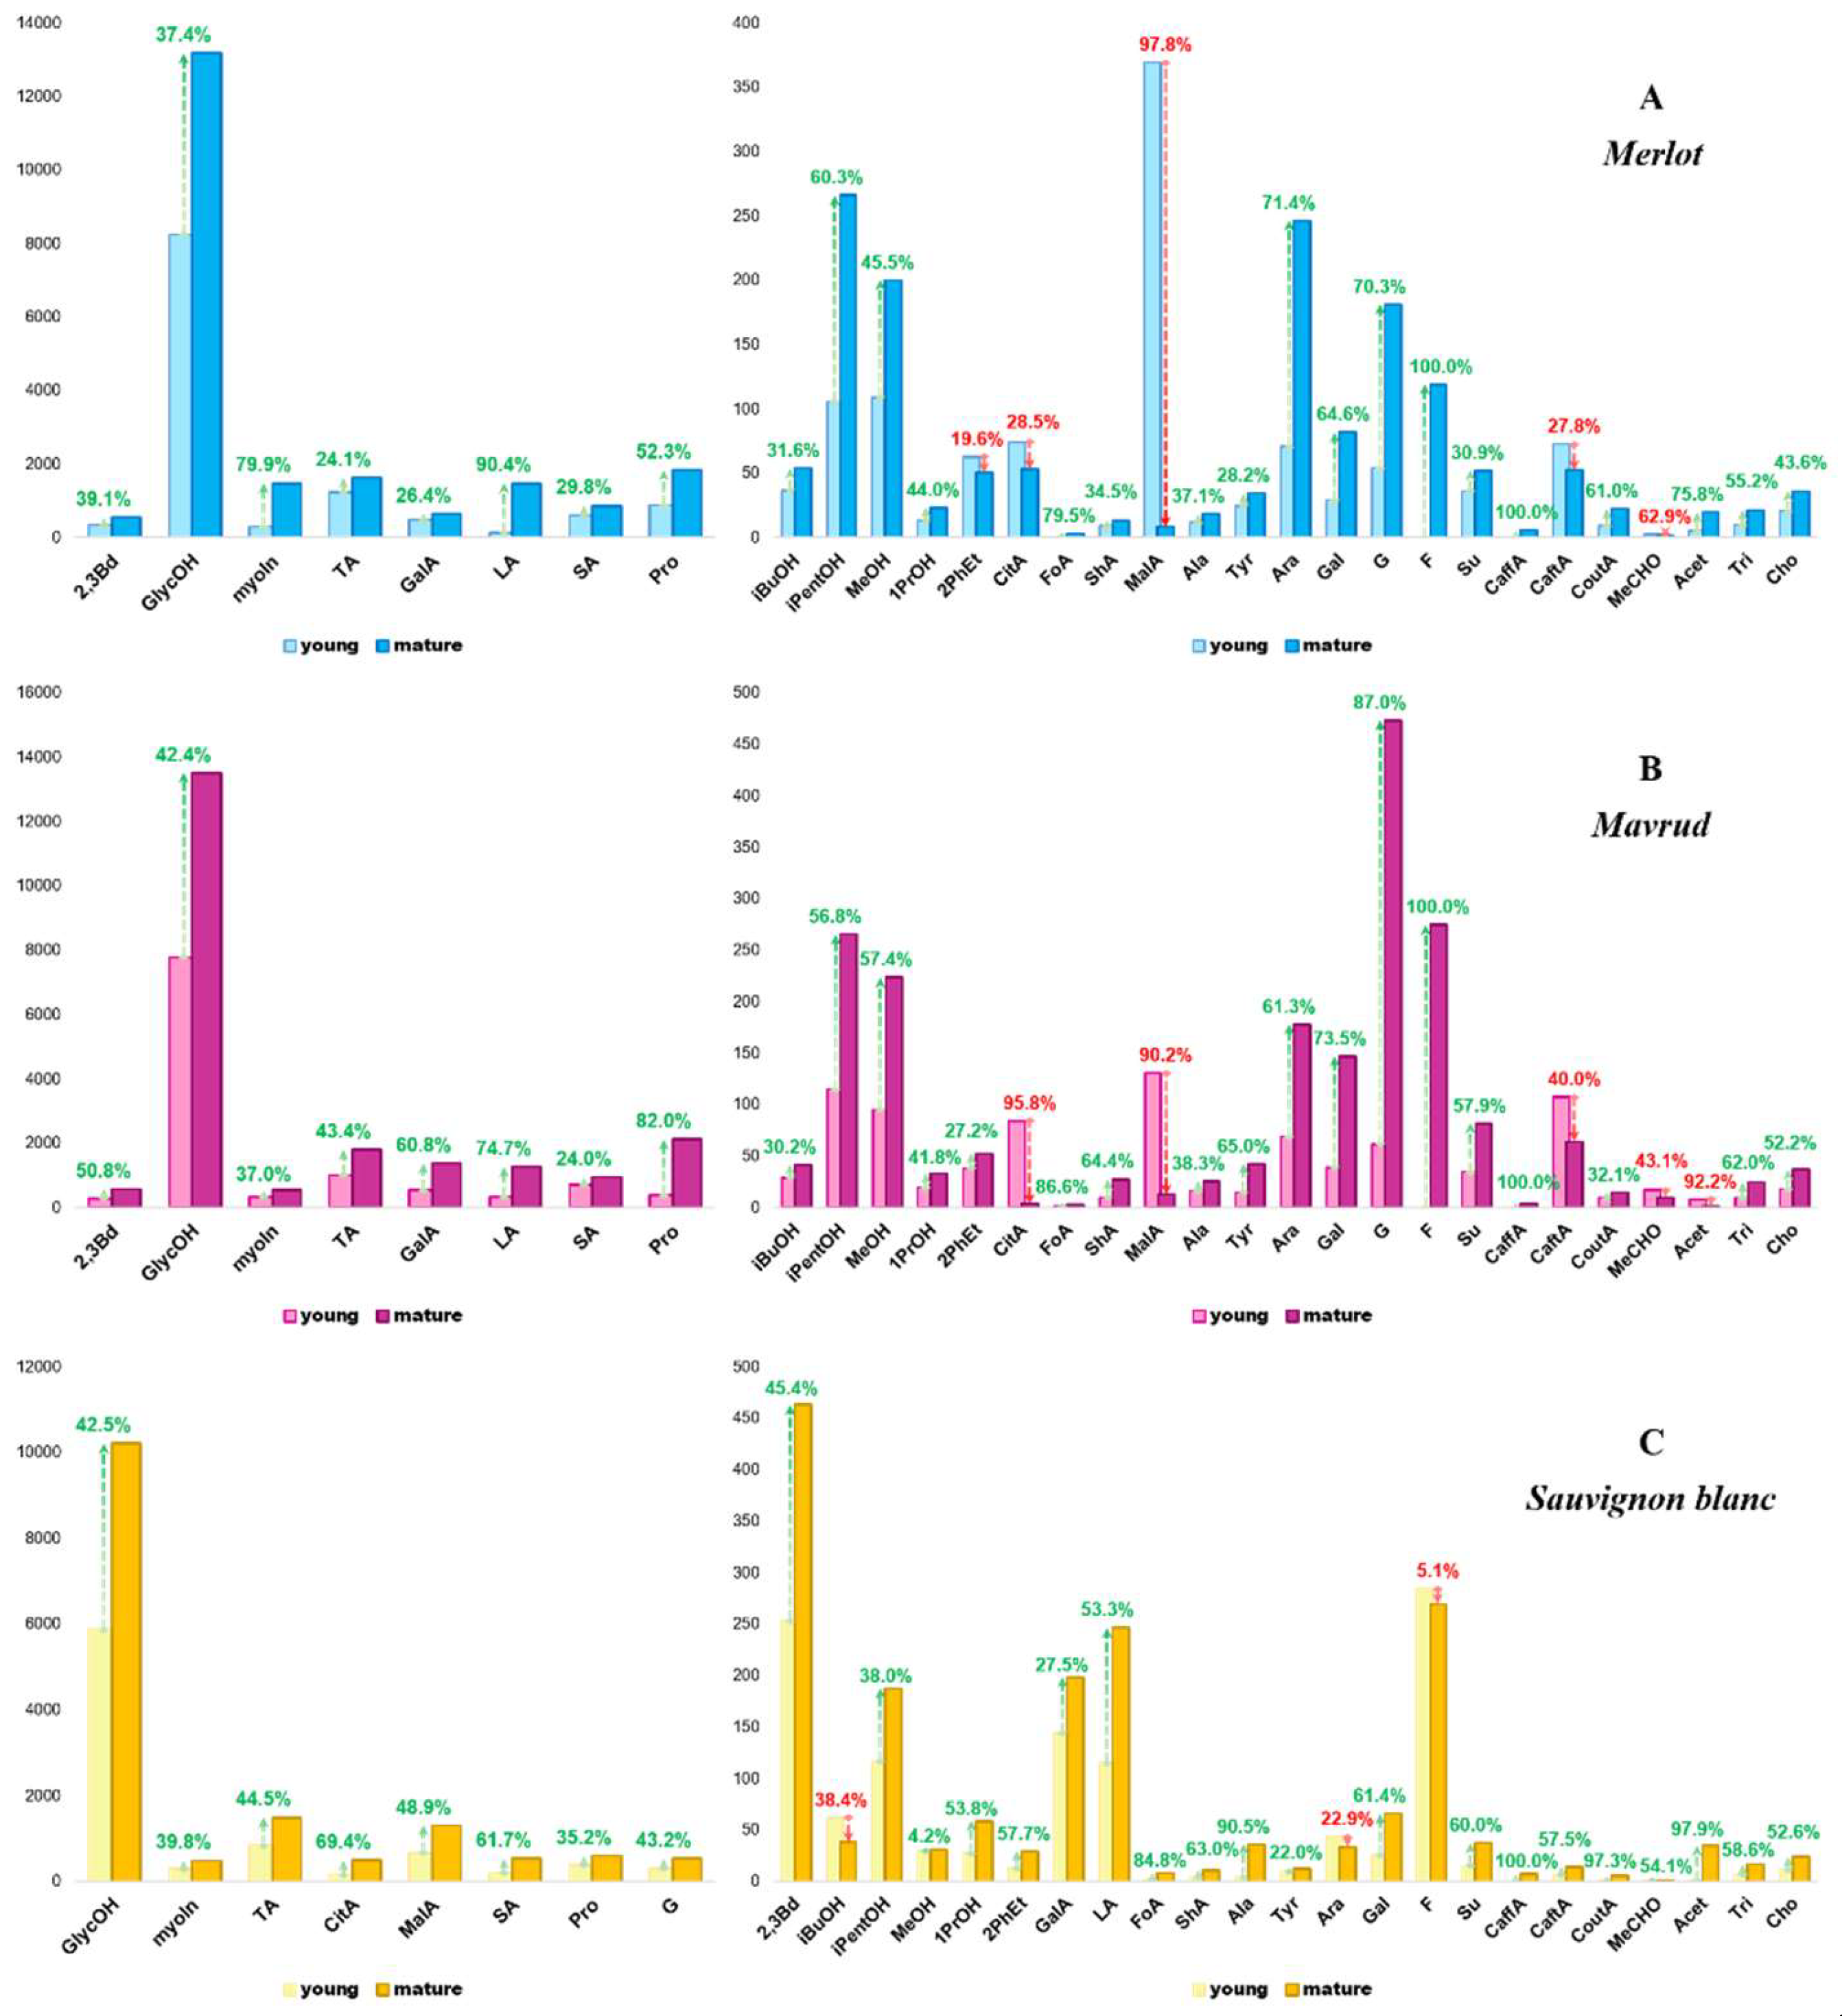
As illustrated in the graphs, the minor and major components in the red wines (Merlot and Mavrud) exhibit notable similarities, yet they diverge significantly from those observed in Sauvignon blanc. Notable differences in the rate of change for specific major substances are evident in the red wines, such as myo-inositol, which exhibits an increase of nearly 80% in Merlot, but only 37% in Mavrud. The concentrations of tartaric acid, galacturonic acid, and proline in Mavrud wines are approximately twice those observed in Merlot wines. The minor compounds in the red wines exhibit slight variations, with significant differences observed in only a few of them, such as 2-phenylethanol and acetoin. In Mavrud, the concentration of 2-phenylethanol increases with age, whereas that of acetoin decreases. In contrast, aged Merlot exhibits elevated acetoin levels relative to the younger wine, accompanied by a decline in 2-phenylethanol. This differs from the findings reported in the literature on other wine types, where some authors have observed increases in both 2-phenylethanol and acetoin, while others have noted declines in acetoin concentration [26]. It is likely that these differences are attributable to the grape variety used for wine production. The observed changes in red wines are likely due to a combination of biochemical transformations, including oxidation, ester formation, adsorption to wood during barrel aging, and environmental factors. The aging process of Sauvignon blanc has been observed to result in notable decreases in the concentration of certain sugars (arabinose and fructose) and isobutanol. These changes are likely driven by microbial activity, oxidation processes and the formation of esters. Given the distinct aging patterns observed in Sauvignon blanc, it is important to explore how the fermentation profiles of this variety vary not only with aging, but also among different products.
3.3. Fermentation products of Sauvignon blanc - comparison of grape ales vs. young and mature wines
To date, no studies have been published that directly compare grape ales and wines, particularly in terms of the impact of grape variety or the effects of aging. In order to evaluate the influence of grape variety on the composition of grape ales and to assess similarities between these products, a principal component analysis (PCA) was conducted. The analysis included quantitative data on 35 components from four samples: one grape ale (ga_1, producer Monyo) made from the red grape variety Kékfrankos, and three grape ales (ga_2, producer Monyo; ga_3, producer Kykao; ga_4, producer Kykao) made from white grape varieties – Sauvignon blanc, Malagouzia and Muscat, respectively. The PCA biplot, which illustrates both the score plot and the loading plot and thus the characteristic components for each grape ale, is presented in Figure 7.
Figure 7.
PCA biplot illustrating the differentiation of four grape ales based on their characteristic components.
Figure 7.
PCA biplot illustrating the differentiation of four grape ales based on their characteristic components.
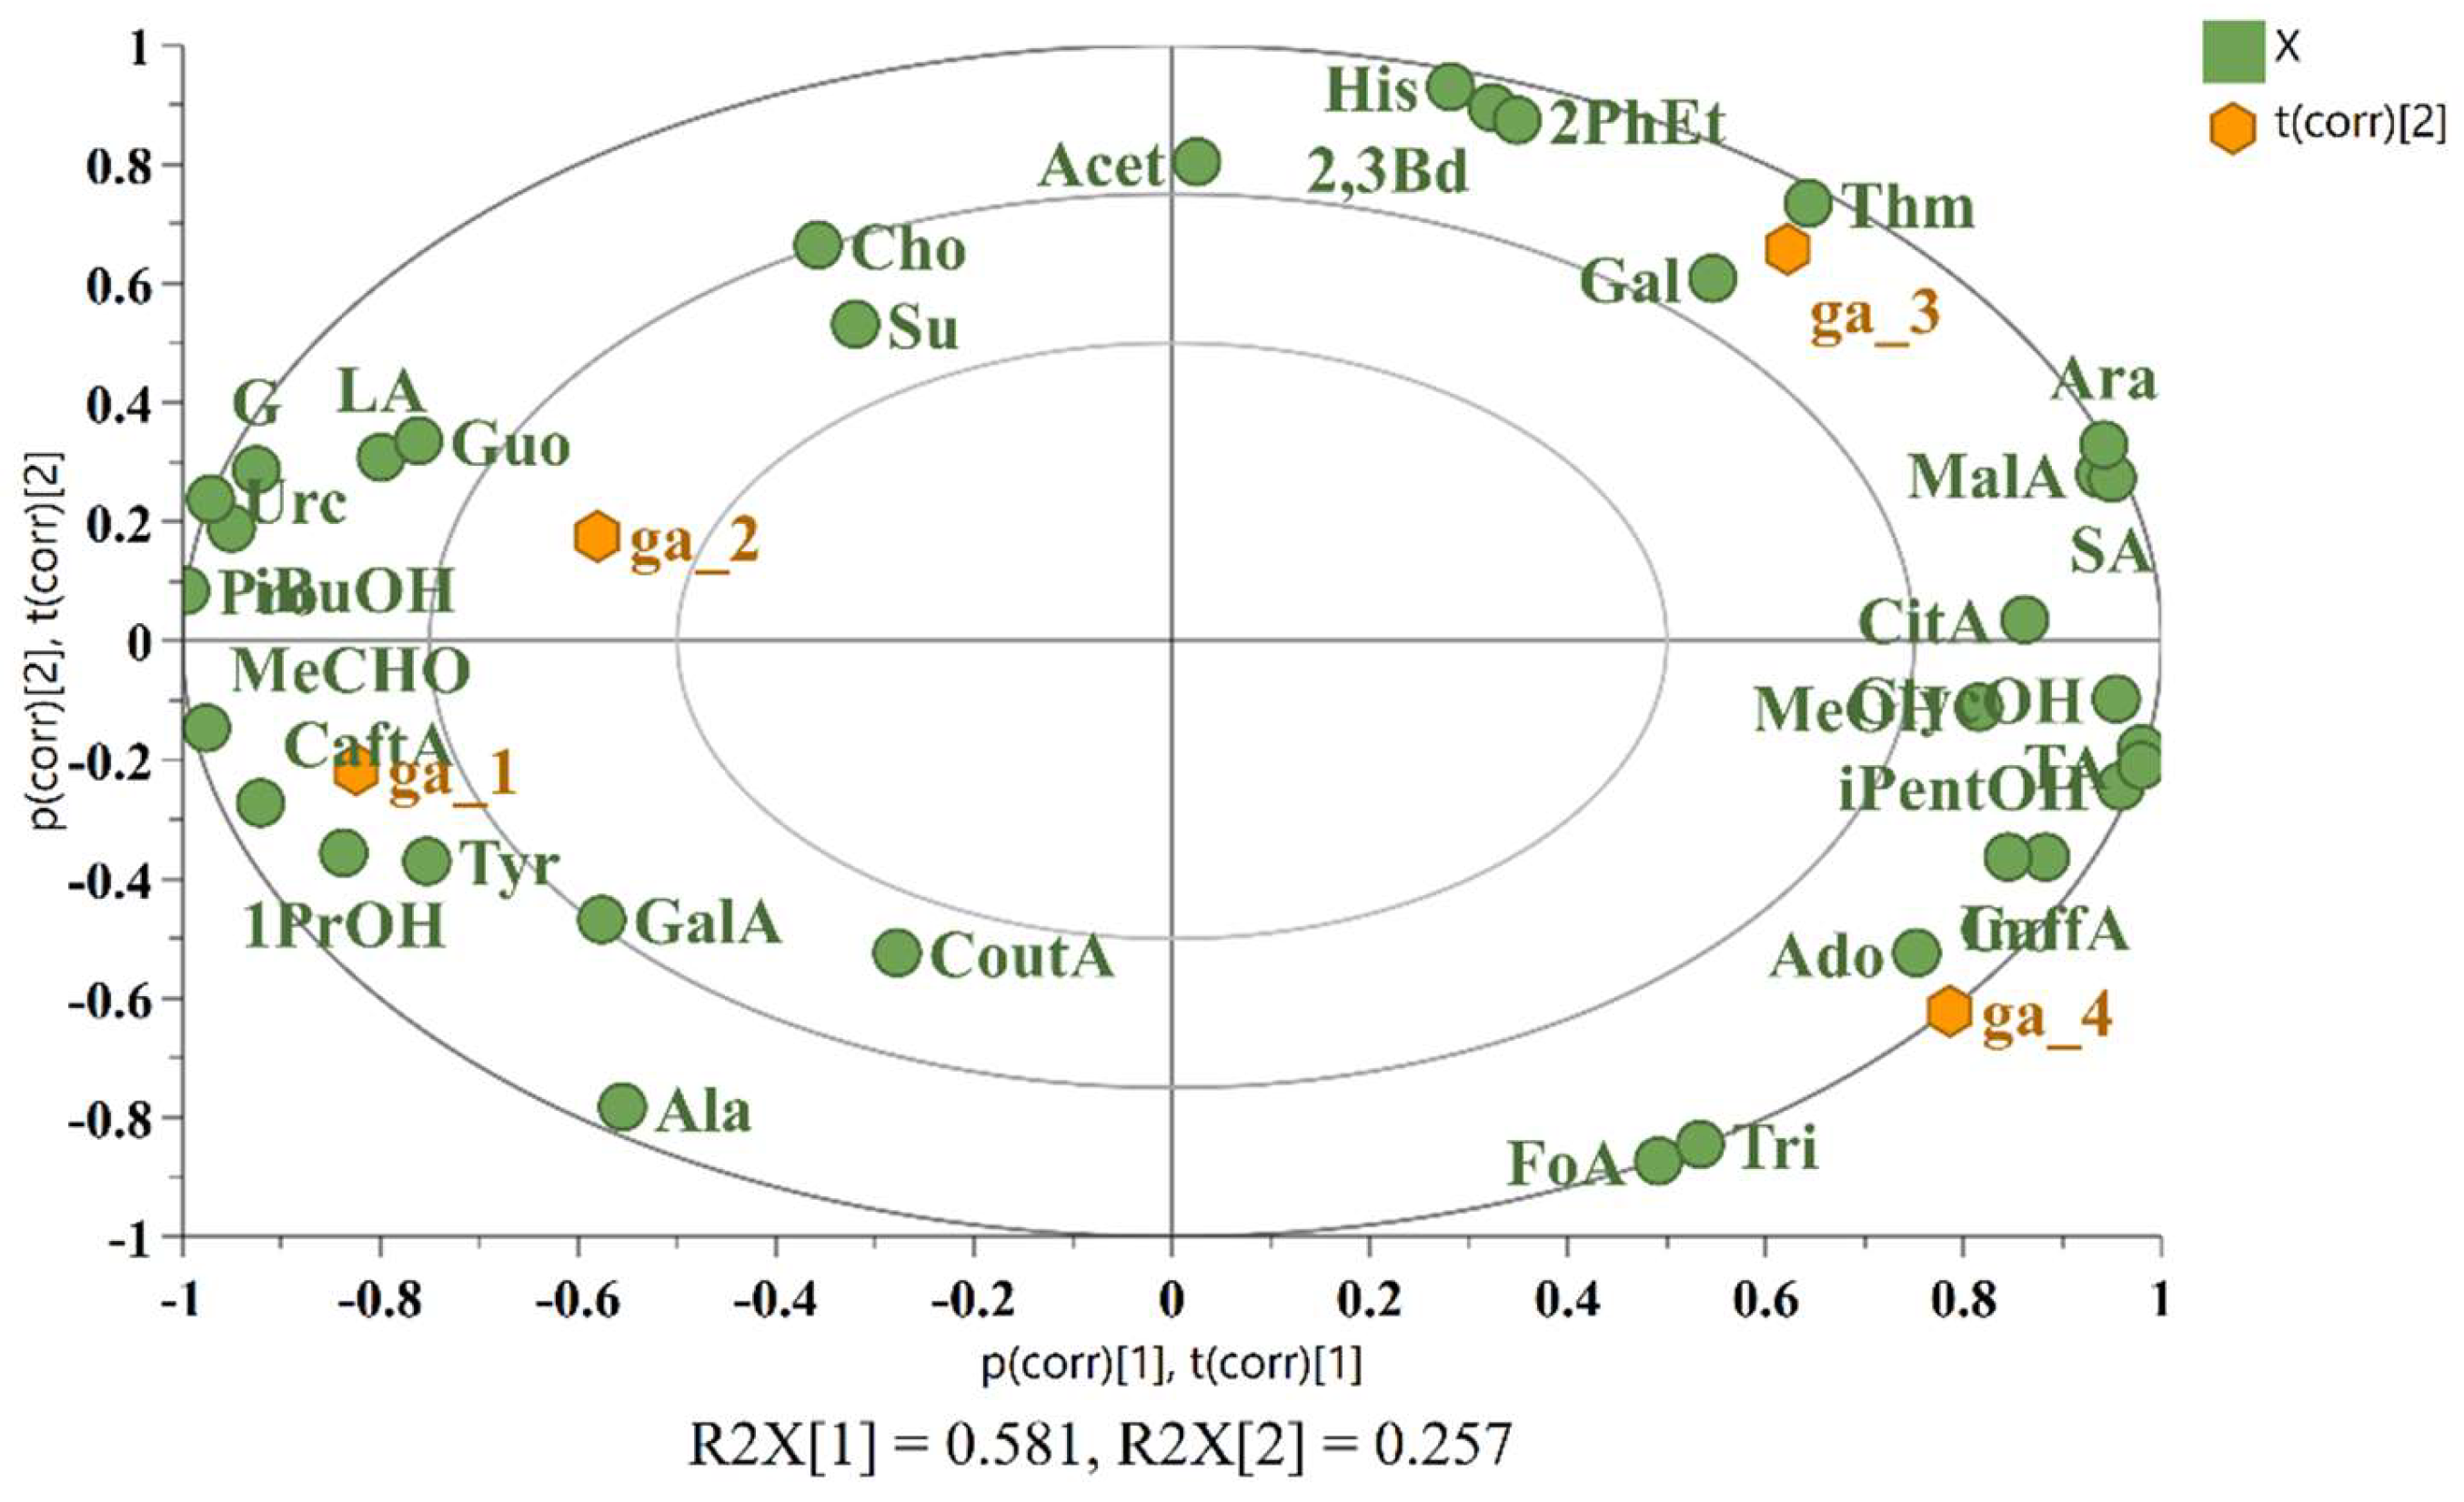
The PCA plot illustrates the presence of two distinct groups. The first comprises ga_1 (Kékfrankos) and ga_2 (Sauvignon blanc), while the second includes ga_3 (Malagouzia) and ga_4 (Muscat). This clustering indicates that the color of the grape variety utilized in the production of grape ale, in contrast to wine, exerts a comparatively lesser influence on the composition than the brewery. The first group (ga_1 and ga_2) is distinguished by elevated concentrations of iso-butanol, 1-propanol, galacturonic acid, lactic acid, tyrosine, glucose, caftaric acid, acetaldehyde, uracil and guanosine. In contrast, the second group (ga_3 and ga_4) is characterized by higher concentrations of glycerol, isopentanol, methanol, citric acid, malic acid, succinic acid, arabinose, caffeic acid and adenosine. The distinct chemical profiles observed between the two groups are likely to be influenced by several factors, including the fermentation techniques employed, the yeast selection used, the characteristics of the grape variety and the potential for aging.
A further comparison was conducted between the Sauvignon blanc grape ale (ga_2) and both young and mature Sauvignon blanc wines, with the objective of evaluating the similarities between them. Although the principal component analysis did not provide a clear distinction between the samples, the orthogonal projections to latent structures discriminant analysis was performed, including data from all 37 components, with two classes: young wine and mature wine. The misclassification table shown in Table 2 indicates that the grape ale was correctly identified as a mature wine, in accordance with the product label, which specified that the grape ale had undergone barrel aging. The probable cause of this classification is the closer concentrations of key compounds, including 2-phenylethanol, lactic acid, alanine, proline, tyrosine, arabinose, fructose, glucose, succinate, coutaric acid, and acetaldehyde, in the grape ale and the mature Sauvignon blanc.
Table 2.
Misclassification table for the prediction of grape ale ga_2 from data for Sauvignon blanc wines.
Table 2.
Misclassification table for the prediction of grape ale ga_2 from data for Sauvignon blanc wines.
| Members | Correct | Young | Mature | No class (Pred) | |
|---|---|---|---|---|---|
| Young | 3 | 100% | 3 | 0 | 0 |
| Mature | 3 | 100% | 0 | 3 | 0 |
| No class | 1 | 0 | 1 | 0 | |
| Total | 7 | 100% | 3 | 4 | 0 |
Given the limited sample size, the findings on grape ales should be regarded as preliminary and the necessity for further studies to corroborate these observations is evident.
4. Conclusions
The nuclear magnetic resonance (NMR) profiling of young and mature Merlot, Mavrud and Sauvignon blanc wines, as well as grape ales, demonstrates the influence of fermentation and aging on the chemical composition of these beverages. The aging process exerts a considerable influence on the chemical composition of wines, particularly on the concentration of organic acids, alcohols, amino acids, and sugars, which contribute to the formation of the distinctive profiles observed in these beverages. Despite the influence of grape variety, grape ales exhibit distinctive chemical profiles that diverge from those of traditional wines, attributable to variations in fermentation techniques. The study will enhance comprehension of the fermentation and aging processes, facilitating quality control, the differentiation of wine products, and the development of innovative fermented beverages that integrate traditional winemaking with brewing technology.
Supplementary Materials
The following supporting information can be downloaded at the website of this paper posted on Preprints.org. Figure S1: Receiver operating characteristic (ROC) curve employed to assess the classification performance of the orthogonal partial least squares-discriminant analysis (OPLS-DA) model in differentiating between grape ales, young wines, and mature wines; Figure S2: Contribution plots illustrating the key compounds that distinguish young and mature wines across three grape varieties (Merlot – light blue and blue, Mavrud – pink and red violet, and Sauvignon blanc – yellow and orange); Table S1a: Sample abbreviations, grape varieties, vineyards, and years of production for young and mature wines; Table S1b: Manufacturer, aging, grape variety, part of grape used, vintage and country of origin for the grape ale samples measured; Table S2. Misclassification table for the OPLS-DA model assessing the botanical origin of young and mature wines - Merlot, Mavrud, Sauvignon blanc.
Author Contributions
Conceptualization, D.G.; methodology, D.G. and S.S.; software, D.G. and P.C.; validation, D.G., P.C. and S.S.; formal analysis, D.G. and P.C.; investigation, D.G. and P.C.; resources, D.G. and S.S.; data curation, D.G.; writing—original draft preparation, D.G.; writing—review and editing, D.G. and S.S.; visualization, D.G. and P.C.; supervision, S.S.; project administration, D.G.; funding acquisition, D.G. and S.S. All authors have read and agreed to the published version of the manuscript.
Funding
This research was funded by Bulgarian National Science Fund, Project KP-06-М79/2.
Institutional Review Board Statement
Not applicable.
Informed Consent Statement
Not applicable.
Data Availability Statement
The data can be made available to bona fide researchers upon request.
Acknowledgments
Research equipment purchased by Project No BG05M2OP001-1.002-0012, "Sustainable utilization of bio-resources and waste from medicinal and aromatic plants for innovative bioactive products", funded by the OP "Science and Education for Smart Growth" 2014-2020, co-financed by the European Union through the European Regional Development Fund and equipment of the Distributed Research Infrastructure INFRAMAT, part of the Roadmap for Research Infrastructures of the Republic of Bulgaria 2020-2027, supported by the Ministry of Education and Science, were used in this investigation.
Conflicts of Interest
The authors declare no conflicts of interest.
References
- Waterhouse, A.L.; Sacks, G.L.; Jeffery, D.W. Understanding wine chemistry., 2nd ed.; John Wiley & Sons, Ltd.: Chichester, UK, 2024. [Google Scholar]
- Young wine festivals in Europe. Available online: https://inwander.io/young-wine-festivals-in-europe/; Young wine festival 2024, Available online: https://wineshowplovdiv.events/ (accessed on 15 October 2024).
- Jackson, R.S. Post-Fermentation Treatments and Related Topics. In Wine Science, 4th ed.; Jackson, R.S., Ed.; Academic Press: San Diego, CA, USA, 2014; pp. 535–676. [Google Scholar]
- Esteves, M.; Sequeira, M.; Malfeito-Ferreira, M. Definition of the Sensory and Aesthetic Spaces of Dry White Wines with Aging Ability by Experienced Tasters. Beverages 2024, 10, 44. [Google Scholar] [CrossRef]
- Echave, J.; Barral, M.; Fraga-Corral, M.; Prieto, M.A.; Simal-Gandara, J. Bottle Aging and Storage of Wines: A Review. Molecules 2021, 26, 713. [Google Scholar] [CrossRef] [PubMed]
- Strong, G.; England, K. J. B. A., Beer judge certification program: 2021 style guidelines. 2021.
- Postigo, V.; García, M.; Cabellos, J.M.; Arroyo, T. Wine Saccharomyces Yeasts for Beer Fermentation. Fermentation 2021, 7, 290. [Google Scholar] [CrossRef]
- De Francesco, G.; Marconi, O.; Sileoni, V.; Perretti, G. Barley malt wort and grape must blending to produce a new kind of fermented beverage: A physicochemical composition and sensory survey of commercial products. J. Food Compos. Anal. 2021, 103, 104112. [Google Scholar] [CrossRef]
- Rossi, S.; Turchetti, B.; Sileoni, V.; Marconi, O.; Perretti, G. Evaluation of strains isolated from non-brewing environments in beer production. J. Inst. Brew. 2018, 124, 381–388. [Google Scholar] [CrossRef]
- Leni, G.; Romanini, E.; Bertuzzi, T.; Abate, A.; Bresciani, L.; Lambri, M.; Dall’Asta, M.; Gabrielli, M. Italian Grape Ale Beers Obtained with Malvasia di Candia Aromatica Grape Variety: Evolution of Phenolic Compounds during Fermentation. Foods 2023, 12, 1196. [Google Scholar] [CrossRef] [PubMed]
- Pietrafesa, R.; Siesto, G.; Tufariello, M.; Palombi, L.; Baiano, A.; Gerardi, C.; Braghieri, A.; Genovese, F.; Grieco, F.; Capece, A. A multivariate approach to explore the volatolomic and sensory profiles of craft Italian Grape Ale beers produced with novel Saccharomyces cerevisiae strains. Front. microbiol. 2023, 14, 1234884. [Google Scholar] [CrossRef] [PubMed]
- Mastrangelo, N.; Bianchi, A.; Pettinelli, S.; Santini, G.; Merlani, G.; Bellincontro, A.; Baris, F.; Chinnici, F.; Mencarelli, F. Novelty of Italian Grape Ale (IGA) beer: Influence of the addition of Gamay macerated grape must or dehydrated Aleatico grape pomace on the aromatic profile. Heliyon 2023, 9, e20422. [Google Scholar] [CrossRef] [PubMed]
- OIV, Compendium of International Methods of Wine and Must Analysis. 2024.
- Viskić, M.; Bandić, L. M.; Korenika, A. J.; Jeromel, A. NMR in the Service of Wine Differentiation. Foods 2021, 10, 120. [Google Scholar] [CrossRef] [PubMed]
- Le Mao, I.; Martin-Pernier, J.; Bautista, C.; Lacampagne, S.; Richard, T.; Da Costa, G. (1)H-NMR Metabolomics as a Tool for Winemaking Monitoring. Molecules 2021, 26, 6771. [Google Scholar] [CrossRef] [PubMed]
- Gerginova, D.; Simova, S. Chemical Profiling of Wines Produced in Bulgaria and Distinction from International Grape Varieties. ACS Omega 2023, 8, 18702–18713. [Google Scholar] [CrossRef] [PubMed]
- Kuballa, T.; Brunner, T.S.; Thongpanchang, T.; Walch, S.G.; Lachenmeier, D.W. Application of NMR for authentication of honey, beer and spices. Curr. Opin. Food Sci. 2018, 19, 57–62. [Google Scholar] [CrossRef]
- Brigante, F. I.; Solovyev, P.; Bontempo, L. , Nuclear Magnetic Resonance Applications in Fermented Foods and Plant-Based Beverages: Challenges and Opportunities. Food Rev. Int. 2024, 1–28. [Google Scholar] [CrossRef]
- Gil, A.M.; Duarte, I.F. High-Resolution Nuclear Magnetic Resonance Spectroscopy of Wine, Beer, and Spirits. In Modern Magnetic Resonance; Webb, G.A., Ed.; Springer: Dordrecht, Netherlands, 2006; pp. 1689–1694. [Google Scholar]
- Cassino, C.; Tsolakis, C.; Bonello, F.; Gianotti, V.; Osella, D. Wine evolution during bottle aging, studied by 1H NMR spectroscopy and multivariate statistical analysis. Food Res. Int. 2019, 116, 566–577. [Google Scholar] [CrossRef] [PubMed]
- Le Mao, I.; Da Costa, G.; Leleu, G.; Richard, T. Monitoring red wine maturation in oak barrels using 1H NMR-based metabolomics. OENO One 2024, 58. [Google Scholar]
- Godelmann, R.; Kost, C.; Patz, C.D.; Ristow, R.; Wachter, H. Quantitation of Compounds in Wine Using 1H NMR Spectroscopy: Description of the Method and Collaborative Study. J. AOAC Int. 2016, 99, 1295–1304. [Google Scholar] [CrossRef] [PubMed]
- Almeida, C.; Neves, M.C.; Freire, M.G. Towards the Use of Adsorption Methods for the Removal of Purines from Beer. Molecules 2021, 26, 6460. [Google Scholar] [CrossRef] [PubMed]
- Tessini, C.; Mardones, C.; Rivas, L.; von Baer, D. Measurement uncertainty of shikimic acid in red wines produced in Chile. Accredit. Qual. Assur. 2009, 14, 381–387. [Google Scholar] [CrossRef]
- Cerbu, M. I.; Colibaba, C. L.; Popîrdă, A.; Toader, A.-M.; Niță, R.-G.; Zamfir, C.-I.; Niculaua, M.; Cioroiu, B.-I.; Cotea, V.V. Increasing amino acids and biogenic amines content of white and rosé wines during ageing on lees. BIO Web Conf. 2023, 68, 02014. [Google Scholar] [CrossRef]
- Dumitriu, G.-D.; Sánchez-Suárez, F.; Peinado, R.A.; Cotea, V.V.; de Lerma, N.L.; Gabur, I.; Simioniuc, V. Metabolomics of Red Wines Aged Traditionally, with Chips or Staves. Foods 2024, 13, 196. [Google Scholar] [CrossRef] [PubMed]
Disclaimer/Publisher’s Note: The statements, opinions and data contained in all publications are solely those of the individual author(s) and contributor(s) and not of MDPI and/or the editor(s). MDPI and/or the editor(s) disclaim responsibility for any injury to people or property resulting from any ideas, methods, instructions or products referred to in the content. |
© 2024 by the authors. Licensee MDPI, Basel, Switzerland. This article is an open access article distributed under the terms and conditions of the Creative Commons Attribution (CC BY) license (http://creativecommons.org/licenses/by/4.0/).
Copyright: This open access article is published under a Creative Commons CC BY 4.0 license, which permit the free download, distribution, and reuse, provided that the author and preprint are cited in any reuse.


