
Submitted:
21 October 2024
Posted:
21 October 2024
You are already at the latest version
Abstract
This study evaluates groundwater quality in the Nakivale sub-catchment, focusing on the inter-play of anthropogenic and geogenic influences. Hydrochemical analysis of 19 groundwater sam-ples revealed that 90% comply with World Health Organization drinking water standards, alt-hough localized contamination concerns were noted, particularly with total iron, nitrate and magnesium. Groundwater quality index indicated that over 90% of the samples fall within good to excellent quality categories. Alignment of nitrate levels with elevated chloride-bromide ratios suggest human impacts, likely from agricultural runoff and wastewater disposal. The irrigation groundwater quality assessment showed that 94% of samples possess low sodium, and medium to high salinity hazards, which could threaten crop productivity due to increasing osmotic stress. Vulnerability assessments indicated low contamination risks, attributed to overlying impermeable geological features, steeply sloping landscape, slow groundwater recharge, high depth to aquifer and clayey soil cover. The findings underscore the necessity for conjunctive management of water resources, incorporating strategies such as enhanced monitoring of groundwater quality, public education on sustainable practices, and protective measures for recharge zones. By addressing these concerns, the study aims to safeguard groundwater resources for both domestic and agri-cultural purposes, ensuring long-term sustainability in the region.
Keywords:
Groundwater Quality
; Groundwater Vulnerability
; Groundwater Management
; Victoria Basin
; Rwizi
; Nakivale
; Isingiro
; Uganda
1. Introduction
Access to clean and safe water is vital for human survival, economic growth, and sustainable development [1]. In many developing regions in Africa, water scarcity and poor water quality pose significant challenges, hindering development and trapping communities in cycles of poverty [2]. Recognizing the importance of clean water, international frameworks such as the United Nations Sustainable Development Goal (SDG) 6 which strives to ensure the availability and sustainable management of water and sanitation for all have placed water security at the forefront of global and local agendas [3,4]. SDG 6 emphasizes equitable access to clean water, improved water management, and the protection of water-related ecosystems [1].
One region where clean water supply is critically a challenge, is the Nakivale Sub-catchment in southwestern Uganda [5].This area is located within the Isingiro district and lies within Uganda’s cattle corridor [6]. The cattle corridor is known for its water stress [7], particularly during dry spells which are marked by declining groundwater levels from boreholes and the drying up of seasonal water bodies [8].
This situation greatly affects the socio-economic welfare of the 616,700 people in the area, a third of whom are refugees living in Nakivale refugee camp, one of the oldest in Uganda, hosting refugees from Burundi, the Democratic Republic of Congo, Rwanda, Somalia, Sudan, and South Sudan [9]. With an annual population growth rate projected at 3.6% [10], the challenge of accessing clean water is becoming increasingly urgent [9].
For the riparian communities in Nakivale, access to clean water is not just essential for survival but also a crucial factor in breaking the cycle of poverty [11]. Water is a key resource that supports livelihoods in agriculture, livestock farming, and small-scale industries within the project area [6,9,12]. However, scaled groundwater quality and its vulnerability to contamination are not well understood [13]. Evaluating the quality and susceptibility of groundwater is vital to ensure its sustainable use and to safeguard it for future generations [14].
Previous studies by [15] and [16] focused on the hydrogeochemical evolution of groundwater resources within the region, offering valuable insights into the factors controlling groundwater hydrochemistry. The latter also provided key information on groundwater recharge, flow, and occurrence within the study area. [17] conducted a national groundwater resources availability and demand assessment, which involved an evaluation of groundwater quality in various catchments, including the Rwizi catchment, where the project area is located. This study highlighted emerging groundwater quality issues, such as nitrate contamination in urban areas of Mbarara district, situated upstream of the project area. [18] identified growing water quality concerns in the region, driven by a rapidly increasing population and urbanization. [5,19,20] also provided important insights into contamination challenges within regional hydrological systems, with major focus on surface water.
Despite the valuable contributions from these studies, none have specifically focused on scaled assessment of groundwater quality and vulnerability within the Nakivale catchment. Localized assessments are crucial due to the inherent heterogeneity of the underlying hydrological systems [21,22]. Groundwater chemistry can vary significantly over small spatial scales, influenced by local geological, biological, and chemical factors [23]. These assessments account for these intrinsic variations which are essential for accurately understanding groundwater dynamics that broader assessments might overlook [24]. The groundwater quality and vulnerability assessment is of paramount importance to determine the current status of groundwater resources and the risks they face [25].
Therefore, this study aims to provide a comprehensive understanding of groundwater quality and the potential threats from contamination sources with Nakivale sub-catchment. The findings will inform policymakers, local authorities, and stakeholders to implement targeted interventions for the sustainable management of groundwater resources in the study area and the broader Victoria basin.
The specific objectives of this study are to assess the current groundwater quality for both domestic and agricultural usage in the Nakivale Sub-catchment by analyzing key physio-chemical parameters such as pH, electrical conductivity, total dissolved solids, and nutrients concentrations; to identify key sources of groundwater contamination; to evaluate the vulnerability of groundwater resources to contaminants emerging from the surface; and to provide recommendations for the sustainable management of groundwater resources, with a focus on enhancing resilience to climate variability and population growth in the Nakivale riparian communities.
2. Materials and Methods
2.1. Study Area
The study area is located between latitudes: (9900000N; 9930000N) and longitudes: (230000E; 280000E) within Isingiro district in Southwestern Uganda (Figure 1). It spans 760 km² and is part of the Rwizi catchment, which falls within the greater Victoria Basin [5]. The landscape is predominantly composed of remnants of lowland surfaces, which account for over 60% of the sub-catchment (Figure 1). These lowland surfaces are significant for groundwater discharge within the region [16].
Infill areas are found in the western and eastern parts of the sub-catchment, and are characterized by poorly sorted outwash fans that impact groundwater infiltration and quality due to the heterogeneity of the sediments. High-relief areas are located along the extreme margins of the catchment and are covered by remnants of upland surfaces, which are prone to erosion. According to [16], these elevated areas are zones of groundwater recharge, and are associated with high hydraulic head gradients relative to the lowlands.
The riparian communities, primarily engage in livestock farming and banana plantations [26]. These social-economic activities are heavily reliant on groundwater resources [5]. The local communities tend to settle on the lower flanks of the area in nucleated settlement patterns [27,28,29]. The lower lands are rich in thick loamy soils which support agricultural productivity [27]. Given the area's reliance on groundwater for both agriculture and domestic purposes [26], understanding its vulnerability to degradation from both geogenic and anthropogenic effects is of paramount importance.
This understanding is critical for ensuring the protection and sustainable use of groundwater resources in the Nakivale sub-catchment. Groundwater of good quality is not only essential for human survival [5], but it is also a cornerstone of economic development within the study area [30,31]. Safeguarding these water resources is, therefore, crucial for maintaining agricultural productivity, supporting livestock, and ensuring the well-being of the communities that depend on them [26].
2.2. Geological and Hydrogeological Setting
The study area is overlain by Proterozoic Karagwe-Ankolean system of meta-sedimentary rocks that exhibit varying degrees of metamorphism (Figure 2). These rocks include sandstones, shales, slates, and phyllites. These host rocks were intruded by younger granitic rocks of variable mineral compositions [32]. The area's hydrogeology is heavily influenced by these geological formations, which play a crucial role in determining groundwater recharge, flow, storage and quality [17]. The predominant aquifer in the region is the weathered and fractured aquifer [5,33], typically found at depths greater than 60 meters above sea level [34]. Additionally, other aquifer types include paleo-channels [34] and sedimentary alluvial aquifers [17], both of which also contribute to the local groundwater system [34,35].
Over 80% of the area is covered by fine-grained clayey soils formed from the weathering of in-situ argillaceous rocks [16]. These soils are associated with poor hydraulic properties [36], which significantly hinder groundwater flow and storage processes [37]. Active groundwater recharge in Nakivale sub-catchment area predominantly occurs in elevated areas that are characterized by a network of lineaments [16], which enhance water infiltration. In contrast, groundwater discharge zones are primarily located in the lowlands, particularly in areas occupied by Lake Nakivale and the Rwizi River (Figure 2). This distribution of recharge and discharge areas underscores the importance of the region's geological features in shaping the flow and storage processes of the underlying local aquifer systems.
2.3. Climate
The area experiences a tropical climate with two distinct rainy seasons: March-April-May and September-October-November, with annual rainfall ranging from 966 mm to 1,380 mm [5]. These seasonal rainfall patterns are primarily influenced by the movement of the inter-tropical convergence zone (ITCZ), a low-pressure belt [16]. The position of the ITCZ in relation to the study area has a significant effect on local seasonal variations [38]. The region also experiences a mean monthly temperature of 27°C and a mean monthly dew point of 19°C [5].
These meteorological conditions play a pivotal role in shaping the local hydrological system, as they influence the amount of hydrological input [39], which directly affects both surface and groundwater quantifiable attributes [13]. Rainfall largely determines water availability, while temperatures and dew points affect evapotranspiration rates [40], influencing how much water is lost to the atmosphere [41]. These factors together shape the overall water balance in the area, directly impacting the quantity of water stored in surface reservoirs and subsurface aquifers [42].
2.4. Groundwater Sample Collection and Analysis
This study is based on a total of 19 groundwater samples collected from strategically selected borehole locations to capture variations in geology, land use, geomorphology, and hydrology, ensuring that they represent the intrinsic heterogeneity of the area, as emphasized by [16]. According to the same study, sampling occurred during the dry season, from February 15 to February 20, 2024. The geographic coordinates of each borehole were recorded, and groundwater levels were measured using a dip meter to accurately assess the water table.
To guarantee representative samples, each borehole was purged for five minutes prior to sample collection. Water samples were collected in sterile containers to maintain their chemical integrity. Field measurements of key parameters, including dissolved oxygen, pH, temperature, and electrical conductivity, were carried out using a calibrated HANNATM multi-parameter meter (HI 9829_S/N 07100011101). Total alkalinity was determined through acid-base titration using 0.02 M hydrochloric acid.
For laboratory analysis, samples for cation and anion measurements were collected in tightly sealed 500 mL HDPE bottles. The cation samples were filtered using GF/C filter papers and acidified with concentrated nitric acid (analytical grade) to reduce the pH to less than 2, ensuring their stability for transport. These samples were then shipped to the Centre National de l’Energie des Sciences et des Techniques Nucléaires (CNESTEN) chemical laboratory in Morocco under the IAEA RAF7021 project for hydrochemical analysis.
The major ions in the water samples were analysed in mg/L using the ion chromatography method. These ions included Sodium (Na+), Potassium (K+), Calcium (Ca2+), Magnesium (Mg2+), Chloride (Cl-), Nitrate (NO3-), and Sulphate (SO42-). The bicarbonate concentration was determined through titration against a standardized acid, with the endpoint of the reaction identified using a pH indicator. Additionally, the minor ions: Aluminium (Al), Iron (Fe), Silicon (Si), and Boron (B), were analysed in their elemental forms using Inductively Coupled Plasma Mass Spectrometry (ICP-MS). This method allows for highly sensitive and precise measurements of elements at very low concentrations [43].
A robust quality control (QC) and quality assurance (QA) system was implemented to ensure the integrity and reliability of hydrochemical analyses. Both the sampling and laboratory hydrochemical analysis process strictly followed the IAEA Groundwater Sampling Procedures, ensuring that each sample was properly collected, labelled, and stored to prevent any contamination or alteration of its hydrochemical composition. Charge balance errors (CBE) were calculated for each sample as a critical QC measure. This was done using (Equation 1), with cations and anions expressed in meq/L. This process ensured that the ionic concentrations were correctly measured and balanced within acceptable limits, typically less than ±5%, considered acceptable or 5-15%, treated with caution [44].
2.5. Groundwater Quality Assessment
This methodology employed a threefold approach, integrating spatial analysis with Quantum Geographic Information System (QGIS) Version 3.36.3, groundwater quality index assessment, and an evaluation of irrigation groundwater quality.
2.5.1. Spatial Analysis
The spatial analysis involved generating groundwater quality maps for both major and some minor ions. Additionally, it included spatial mapping of the groundwater quality index and the chloride-bromide ratio. The maps were created using the Inverse Distance Weighting (IDW) interpolation method, a deterministic technique that assigns greater influence to nearby points based on distance, making it particularly effective for estimating values in areas with irregularly spaced data [45]. IDW is well-suited for groundwater quality mapping of sparse data as it does not rely on spatial autocorrelation, which requires evenly distributed data [46,47,48]. However, due to the complex and unpredictable nature of many underlying groundwater systems, it is essential to interpret the results cautiously, recognizing the basic principles inherent to the IDW method.
2.5.2. Groundwater Quality Index Assessment
Groundwater quality was assessed through computation of groundwater quality index for each groundwater sample. This method has been utilized by various researchers to assess groundwater quality based on its hydrochemical composition [49,50,51]. The approach involved assigning weights wi on a scale of 1 to 5 to each analysed chemical species deemed significant for groundwater potability needs. After assigning weights (wi), the relative weight (Wi) for each parameter was computed using the formula below (Equation 2).
The rating scale for each parameter, denoted by qi, was subsequently calculated by dividing the concentration (Ci) in mg/L of each parameter by the World Health (WHO) standard value (Si) in mg/L for portable water (Equation 3).
The relative weights (Wi) assigned to each parameter, along with their corresponding rating scales (qi), were then multiplied to derive the sub-index (SIi) for each parameter.
Finally, the groundwater quality index (GWQI) for each sample was calculated by summing the sub-indices of each parameter for a given water sample, as indicated by Equation 5.
The table below shows the water quality index range and the corresponding water quality classification for each sample.

Table 1.
Groundwater quality index range and class [50].
Table 1.
Groundwater quality index range and class [50].
| Groundwater Quality Index Range | Groundwater Quality Class |
| <50 | Excellent Groundwater |
| 50-100 | Good Groundwater |
| 100-200 | Poor Groundwater |
| 200-300 | Very Poor Groundwater |
| >300 | Unsuitable Groundwater |
2.5.3. Irrigation Groundwater Quality Assessment
This assessment involved both the sodium (alkali) and salinity hazard evaluation for the 19 samples. The Sodium Adsorption Ratio (SAR) measures the relative concentration (meq/L) of sodium (Na+) compared to calcium (Ca2+) and magnesium (Mg2+) in irrigation water [52]. It is an important tool for assessing the suitability of groundwater for irrigation, particularly in agricultural settings [53].
SAR helps identify potential sodium hazards in irrigation water, which can affect soil structure, permeability, and crop productivity [54]. Understanding SAR is essential for managing soil health and water quality, especially in regions that depend on groundwater for irrigation [54,55,56].
Salinity refers to the concentration of dissolved salts in water, typically dominated by ions such as sodium (Na+), calcium (Ca2+), magnesium (Mg2+), chloride (Cl-), sulfate (SO42-), and bicarbonate (HCO3-) [52,53,57]. The salinity of irrigation water is commonly measured using Electrical Conductivity (EC) [53], which reflects the water’s ability to conduct electricity due to dissolved salts [57]. It is measured in microSiemens per centimeter (µs/cm).
When the salt concentration in the soil solution is high, the osmotic potential of the soil water decreases, making it more difficult for plants to take up water [57,58]. This creates "salt stress," where plants need more energy to extract water from the soil, leading to reduced growth and productivity [58]. In extreme cases, plants may suffer from dehydration even when the soil appears wet [56].
2.6. Groundwater Vulnerability Assessment
This study employed the DRASTIC assessment approach to evaluate the vulnerability of groundwater resources to contaminants from surface sources. The DRASTIC model is based on seven critical hydrogeological parameters that influence the movement of contaminants into aquifer systems [24]. These parameters include Depth to groundwater (D), Net recharge (R), Aquifer media (A), Soil media (S), Topography (T), Impact of the vadose zone (I), and Hydraulic conductivity (C). The decision to use DRASTIC over other groundwater vulnerability models, such as GOD and GALDIT, stems from its capability to assess the intrinsic vulnerability of groundwater at each specific location [59,60,61]. While the GOD model is simple, it tends to overgeneralize and is unable to capture localized variations [62,63], and the GALDIT model is designed primarily for coastal aquifers [64,65].
In the DRASTIC model, weights (w) of 5, 4, 3, 2, 1, 5, and 3 were assigned to the respective parameters. Ratings were then applied on a scale of 1 to 10 based on the range of each parameter at each groundwater well, following the guidelines set by [66], for confined aquifers. This approach involved careful, yet subjective judgment informed by field experience and available data to ensure that the ratings accurately reflect the specific conditions of each site. The DRASTIC index was subsequently calculated using Equation 6 in Microsoft Excel, where subscripted parameters represent the ratings corresponding to each DRASTIC model input parameter.
3. Results and Discussion
3.1. Hydrochemical Parameter Analysis
All 19 analysed groundwater samples passed the charge balance error (CBE) test. 84% of the samples had a CBE of less than 5%, while 16% of the samples had a CBE between 5-15%. The results from the latter were treated with caution. The table below presents a descriptive summary of the hydrochemical test results for major parameters.
Table 2.
Summary of descriptive statistical analysis of major water quality parameters (Adapted from [16], with additional parameters).
Table 2.
Summary of descriptive statistical analysis of major water quality parameters (Adapted from [16], with additional parameters).
| Parameter | Mean | Standard Deviation break//(SD) | Max. | Min. | WHO Guideline Value (GV) | % of samples > WHO GV |
| pH | 6.7 | 1.0 | 9.3 | 4.5 | 6.5 - 8.5 | 31 |
| HCO3- (mg/L) | 141.5 | 134.0 | 439.3 | 10.0 | - | - |
| Cl- (mg/L) | 48.6 | 25.6 | 96.1 | 16.0 | 250.0 | - |
| NO3- (mg/L) | 16.4 | 14.1 | 46.1 | 0.0 | 50.0 | - |
| SO42- (mg/L) | 204.7 | 148.9 | 515.6 | 29.9 | 500.0 | 5 |
| Na+ (mg/L) | 59.9 | 27.4 | 134.6 | 8.7 | 200.0 | - |
| K+ (mg/L) | 6.6 | 3.8 | 15.1 | 2.8 | 12.0 | 5 |
| Mg2+ (mg/L) | 23.5 | 15.6 | 51.5 | 0.0 | 50.0 | 10 |
| Ca2+ (mg/L) | 59.0 | 42.3 | 144.0 | 0.7 | 300.0 | - |
| Total Fe (mg/L) | 0.8 | 1.5 | 5.1 | 0.02 | 0.3 | 47 |
| Alkalinity (mg/L CaCO3) | 145.2 | 136.1 | 445.3 | 11.4 | - | - |
| EC (µS/cm) | 746.8 | 366.3 | 1538.0 | 297.0 | 1857 | 5 |
3.1.1. Analysis of Major Cations
Sodium and calcium concentrations from all 19 analysed samples fall within acceptable WHO guideline ranges. Potassium (K+) concentrations vary from 2.8 to 15.1 mg/L, with a mean of 6.6 mg/L and a standard deviation (SD) of 3.8. The WHO guideline value for potassium is 12 mg/L, with only 5% of the samples exceeding this limit. This suggests minor potassium contamination, which may lead to taste issues in drinking water, but generally poses low health risks at these levels [67].
Magnesium (Mg2+) concentrations range from 0.0 to 51.6 mg/L, with an average of 23.5 mg/L and a standard deviation of 15.6. Only 10% of the samples exceed the WHO guideline of 50 mg/L, indicating potential localized magnesium issues. Elevated Mg2+ levels can contribute to water hardness, affecting taste and usability for domestic purposes. Additionally, high magnesium concentrations have been linked to an increased risk of ischemic heart disease [68].
Total iron (Fe) levels range from 0.01 to 5.1 mg/L, with a mean of 0.8 mg/L and a standard deviation of 1.5. The WHO guideline value for iron is 0.3 mg/L, and 47% of the samples slightly exceed this limit. Elevated iron levels can cause several issues, including staining of laundry and plumbing fixtures, a metallic taste in drinking water, and potential health effects such as gastrointestinal irritation [69]
3.1.2. Analysis of Major Anions
Chloride (Cl-), bicarbonate (HCO3-), and nitrate (NO3-) concentrations fall within acceptable WHO guideline values, with the exception of sulphate (SO42-). Sulphate levels range from 29.9 to 515.6 mg/L, with a mean of 204.7 mg/L and a standard deviation (SD) of 148.9. The WHO guideline for sulphate is 500 mg/L, with 5% of the samples exceeding this threshold. Elevated sulphate levels may lead to a bitter taste in water, laxative effects, and potential corrosion of plumbing systems [70].
The hydrochemical maps indicate both localized point contamination sources and diffuse sources (Figure 3), attributed to a combination of anthropogenic and geogenic factors. According to [16], groundwater chemistry in the region is primarily governed by water-rock interaction processes. Groundwater composition is significantly influenced by the mineralization of the underlying geological formations, predominantly composed of mafic and felsic feldspars (such as muscovite, orthoclase, anorthite, and biotite) [16], and sulfide minerals like pyrite and chalcopyrite, particularly evident in the Igayaza area of Isingiro district [71]. High localized iron concentrations are linked to the potential rusting of galvanized iron commonly used in the installation of handpumps in the Nakivale area.
Figure 3 highlights major contamination issues, with levels exceeding WHO guideline values for magnesium (50 mg/L), total iron (0.3 mg/L), potassium (12 mg/L) and sulfate (500 mg/L) in the northwestern and southwestern parts of the study area. Additionally, a central portion exhibits elevated concentrations of magnesium and sulfates, surpassing WHO guideline.
3.1.3. Analysis of Other Chemical Parameters
Electrical conductivity (EC) varies from 314 to 1726 µS/cm, with elevated values concentrated in low-lying areas (Figure 4). These high EC levels in the discharge zones suggest chemically enriched, metamorphosed water resulting from rock-water mineralization along groundwater flowlines, as noted by [16]. Additional potential sources of elevated EC include agricultural activities involving fertilizers and pesticides, as well as industrial waste in the region [5].
The analysis also reveals a range of Eh values across the study area, indicating different redox conditions. Lower Eh values (-500 to 0 mV) in the Lake Nakivale region indicate reducing conditions, typically found in older or deeper groundwater with limited oxygen exchange [72]. In contrast, higher Eh values (31 to 178 mV) in elevated areas suggest oxidizing conditions, commonly associated with recently recharged or shallow groundwater [73]. A comparable trend is also evident in dissolved oxygen levels. These results align with the findings of [16], which identified groundwater likely older than 20 years characterized by low tritium levels in the lower flanks of the study area.
3.2. Groundwater Quality Index Assessment
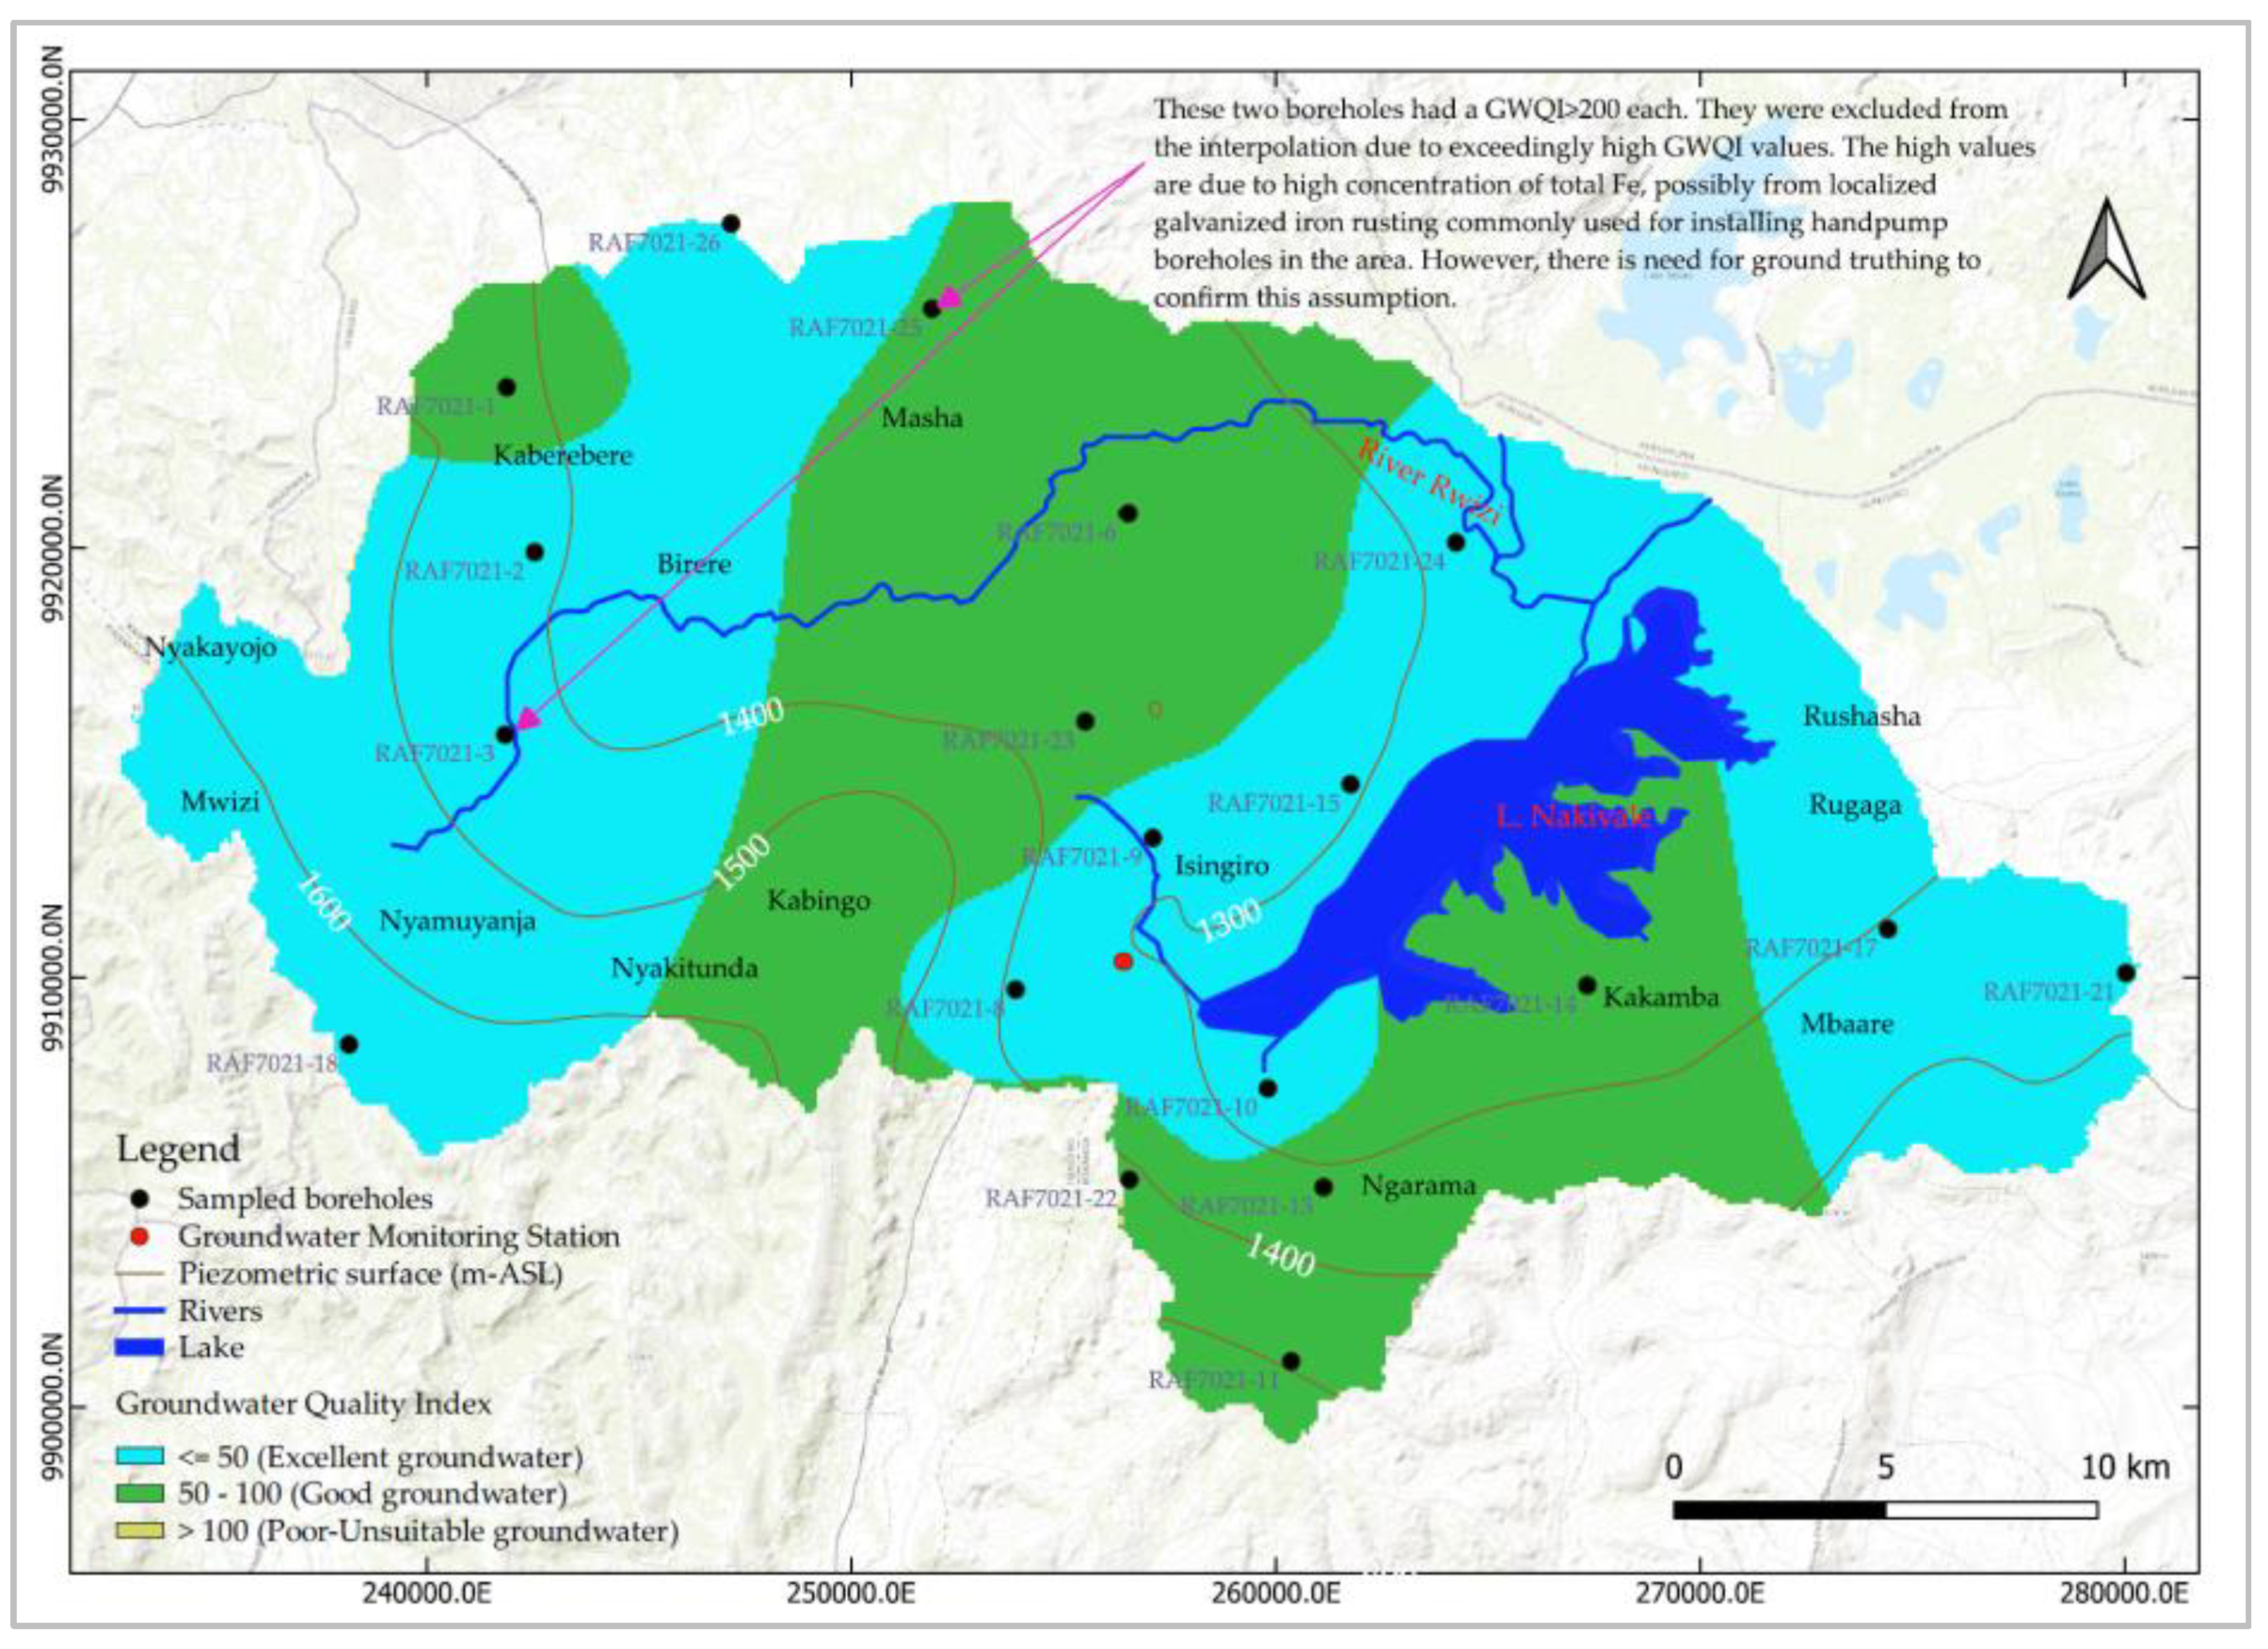
The majority of the groundwater samples (90%) have a groundwater quality index of less than 100. Ten groundwater samples (53%) have indices below 50 while seven samples (37%) have indices ranging from 50 to 100. However, two samples RAF7021-3 and RAF7021-25 obtained from Masha and Nyamuyanja respectively, exhibit exceedingly high groundwater quality indices above 200 due to high concentrations of total iron (Figure 3).
The elevated concentration of total iron can be attributed to localized anthropogenic sources from the use of galvanised iron pipes, commonly installed for handpump boreholes in the study area. However, this assumption needs to be confirmed through fieldwork. Overall, the study area is underlain by good to excellent quality groundwater as over 90% of the sampled groundwater points have a groundwater quality index below 100 (Table 3). 90% of all analysed parameters for all groundwater samples also fall within plausible values stipulated by the WHO for drinking water.
Figure 5.
Groundwater quality index map for Nakivale sub-catchment.
3.3. Analysis of the Chloride-Bromide Ratio
The chloride-bromide (Cl/Br) ratio is a valuable tool for tracing factors that influence groundwater quality due to its conservative nature [74,75,76]. However, its interpretation requires careful consideration of potential overlaps between geogenic and anthropogenic sources [75]. Geogenic processes, such as the dissolution of halite, generally result in high Cl/Br ratios because chloride is more prevalent in these natural sources compared to bromide [76]. Anthropogenic activities such as industrial waste disposal, agricultural pollution, and landfill leachate can also introduce significant amounts of chloride with minimal bromide, thereby elevating the Cl/Br ratio [77].
Figure 6.
Chloride-Bromide ratio map for tracing sources of groundwater contamination.
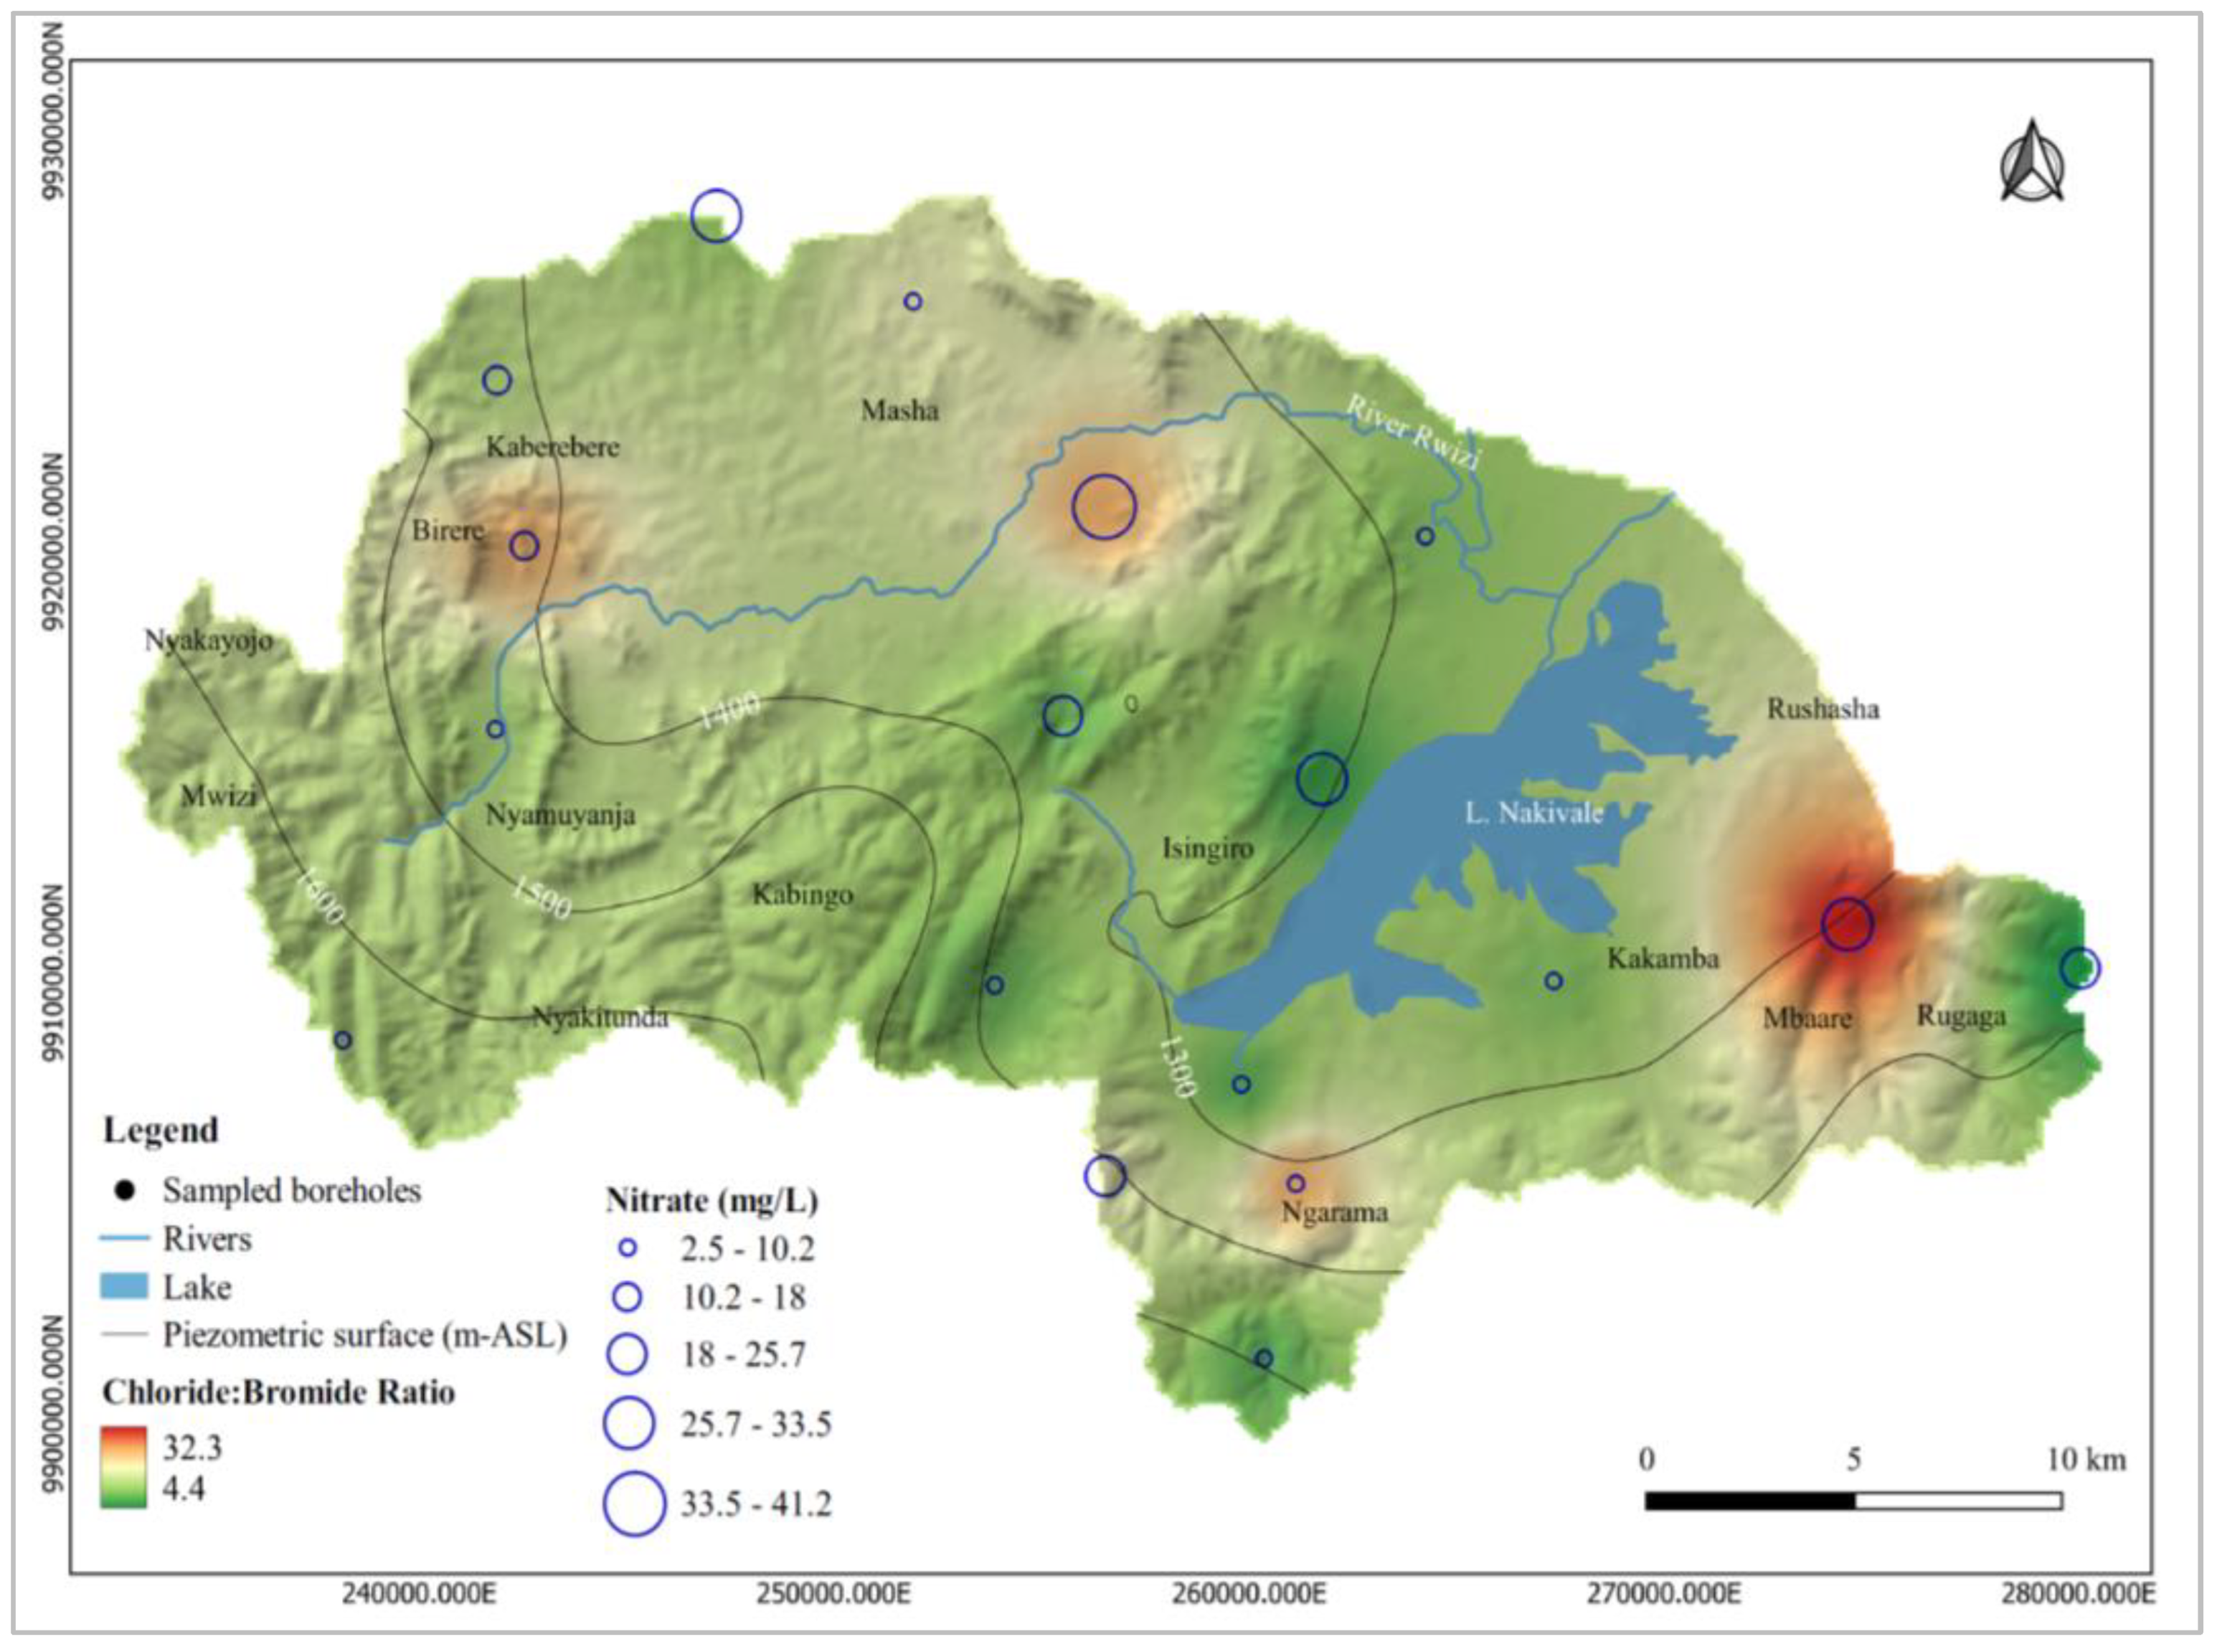
To accurately differentiate between geogenic and anthropogenic influences, the Cl/Br ratio was analysed alongside nitrate levels. This combined approach provides a more nuanced understanding of whether high Cl/Br ratios are due to natural processes or human activities [74]. Areas with high nitrate levels and elevated Cl/Br ratios likely indicate anthropogenic impacts on groundwater quality, possibly from chloride-rich wastes [74,78]. Nitrate concentrations vary from 2.5 to 41.2 mg/L, with higher levels linked to existing and emerging anthropogenic effects such as agricultural pollution, septic effluent and industrial waste discharge [5]. An increase in the Cl/Br ratio along groundwater flowlines indicates a systematic change in groundwater chemistry, potentially due to preferential adsorption of bromide, which is larger than chloride ions [75]. In the Lake Nakivale area, the rising ratio may reflect the effects of biologically mediated chloride removal [79].
3.4. Irrigation Groundwater Quality Assessment
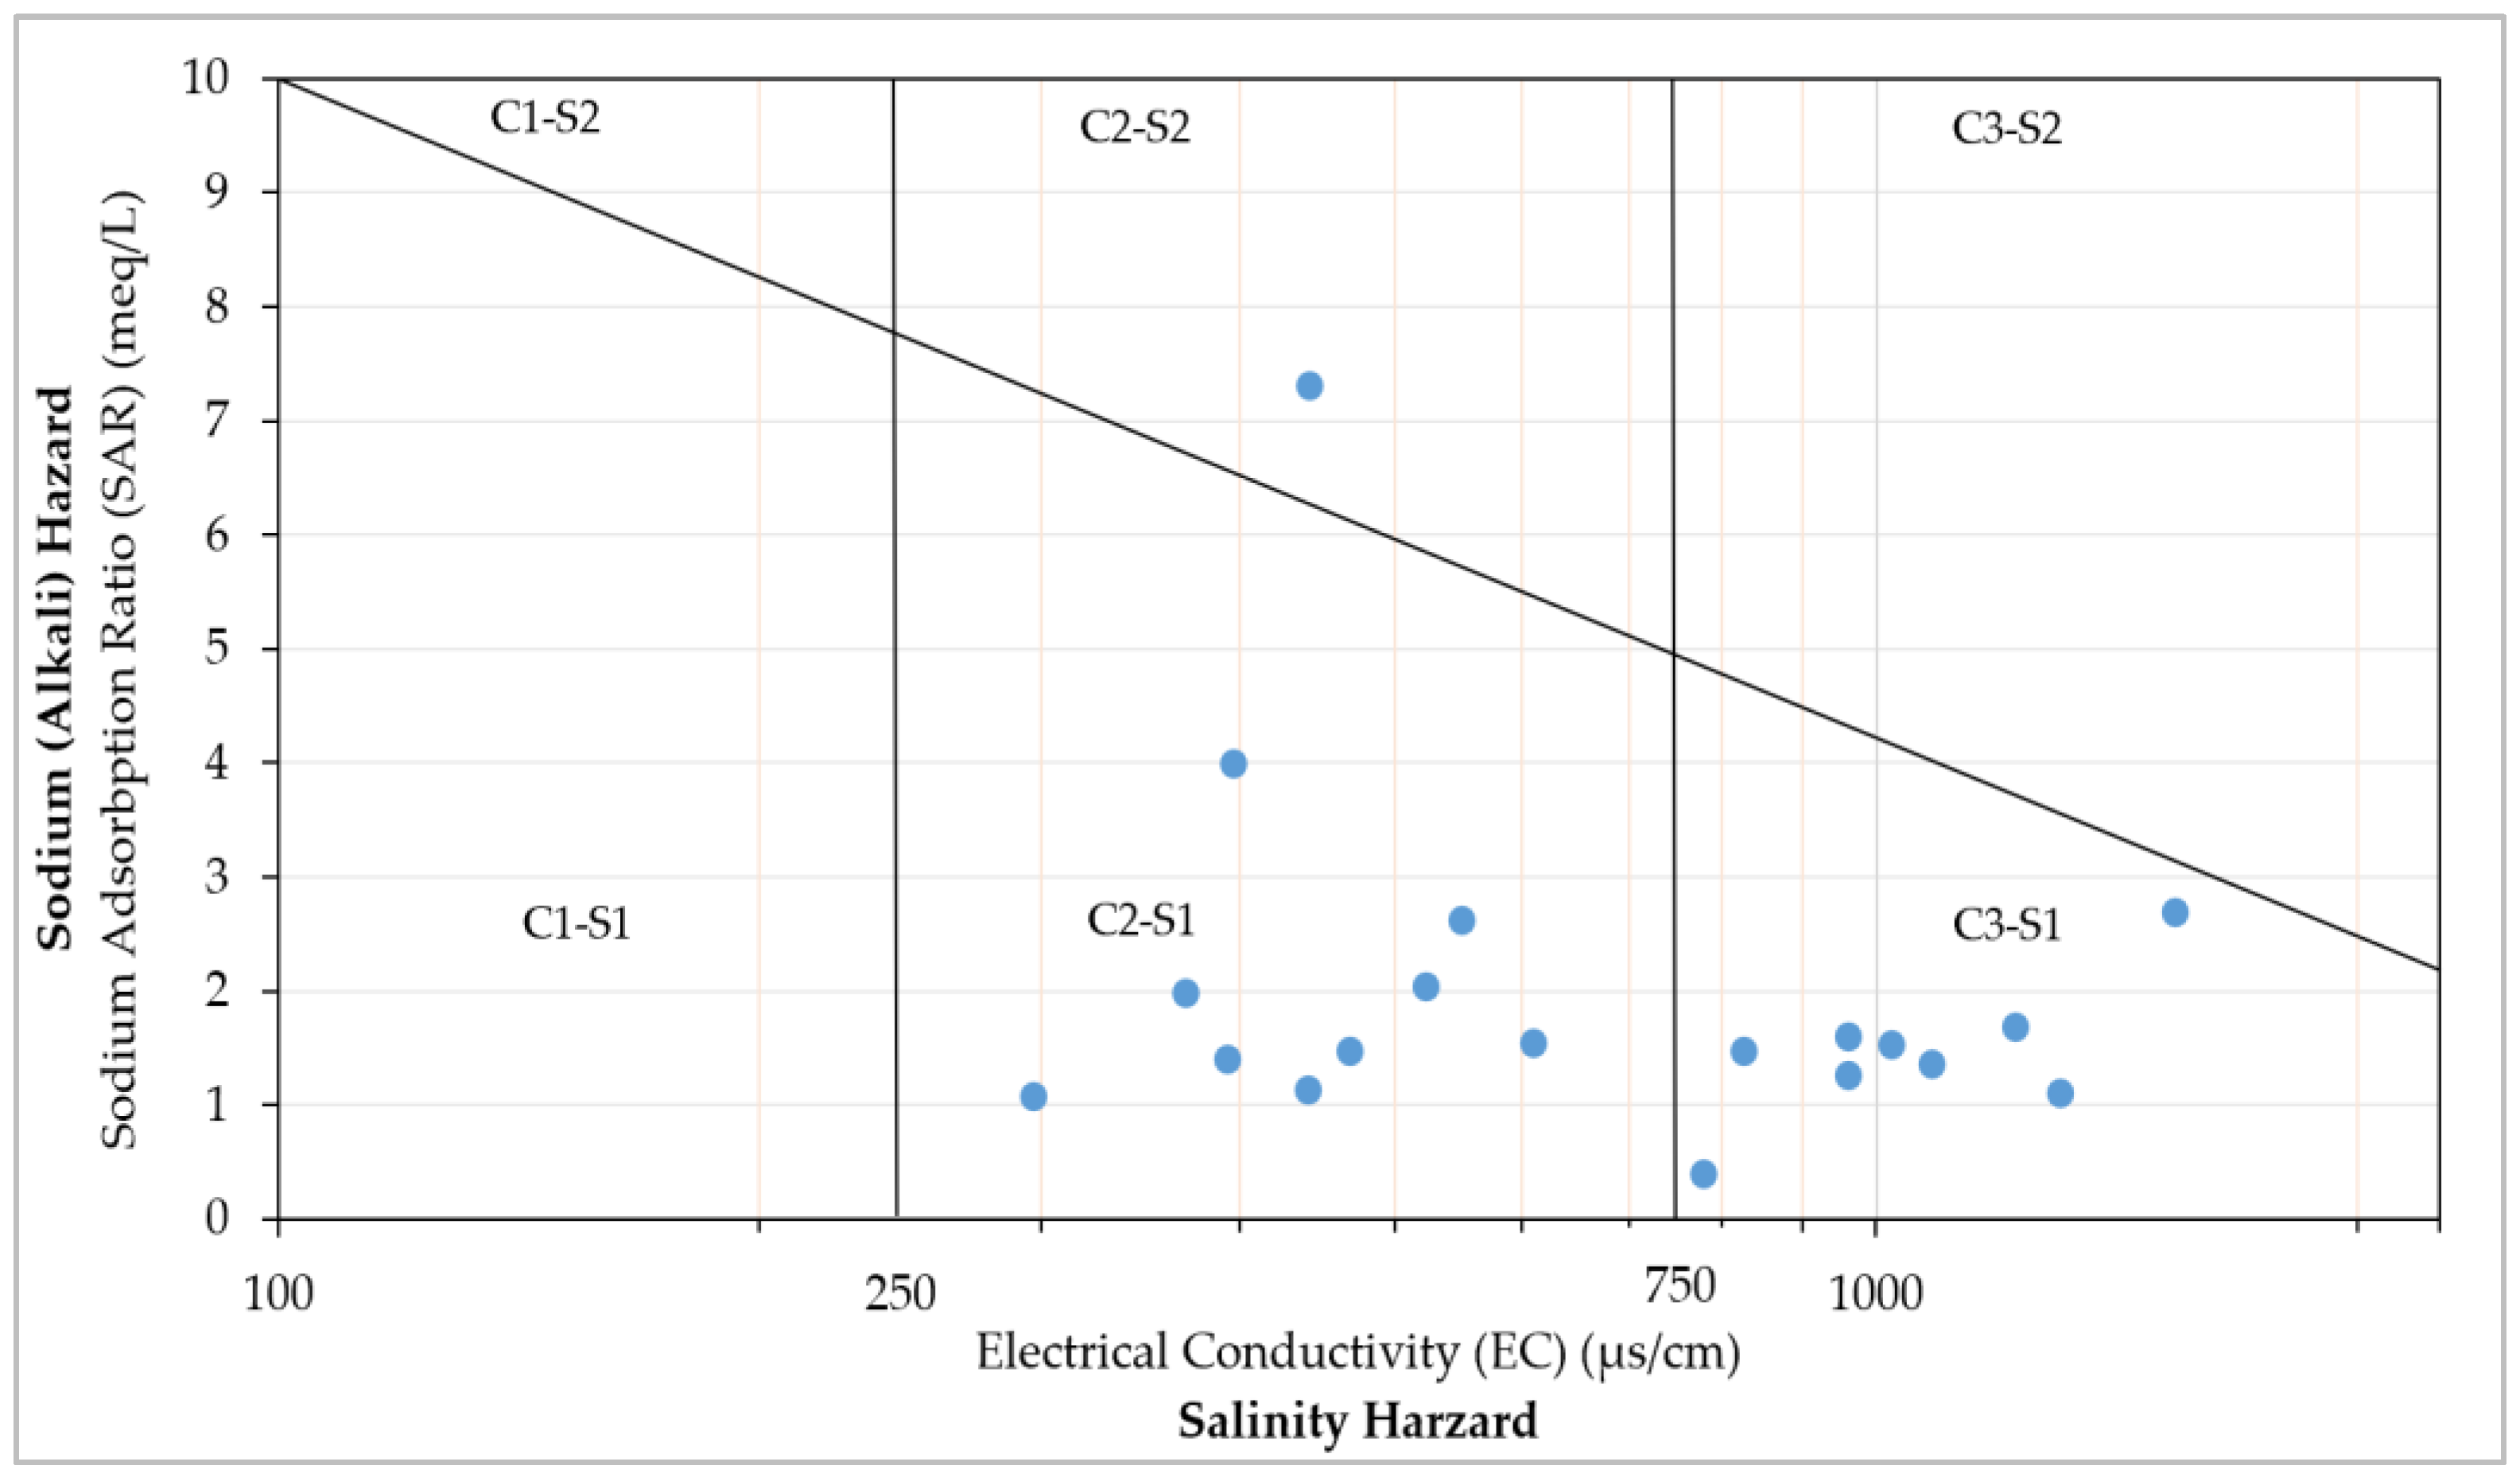
The analysis reveals that 94% of the samples fall within the C2-S1 (47%) and C3-S1 (47%) SAR-Electrical Conductivity regions. C2 and C3 indicate medium to high salinity hazards respectively, while S1 reflects a low sodium (alkali) hazard. Despite the low sodium hazard, the results suggest that the region could face emerging issues with reduced crop productivity, driven by potential changes in the osmotic potential of crops if salinity levels increase, which could impede their growth [54,55]. One sample falls in the C2-S2 region, indicating medium sodium and salinity hazards, which also highlights the risk of lower crop productivity if sodium and salinity levels rise in the future. This underscores the need for careful management and control of anthropogenic Na-rich chemical inputs, which may contribute to rising salinity and sodium levels in the region [58].
Figure 7.
SAR vs EC diagram for Classification of Irrigation water.
3.5. Groundwater Vulnerability Assessment
The assessment reveals low DRASTIC indices for the Nakivale sub-catchment (<110). These low values generally indicate a reduced risk of groundwater contamination from surface sources [24]. This is primarily due to the area's varied steep slopes and the presence of impervious shales, slates, and phyllites, which cover over 90% of the region and consequently impacting on groundwater recharge.
Table 4.
Groundwater vulnerability classes for the analysed (19) groundwater Samples.
| Sample Number | DI | Groundwater Vulnerability | Sample Number | DI | Groundwater Vulnerability |
| RAF7021-1 | 100 | Moderately Low | RAF7021-15 | 105 | Moderate |
| RAF7021-2 | 89 | Very Low | RAF7021-17 | 107 | Moderate |
| RAF7021-3 | 88 | Very Low | RAF7021-18 | 92 | Moderately Low |
| RAF7021-6 | 92 | Moderately Low | RAF7021-21 | 93 | Moderately Low |
| RAF7021-8 | 91 | Moderately Low | RAF7021-22 | 108 | Moderate |
| RAF7021-9 | 100 | Moderately Low | RAF7021-23 | 90 | Moderately Low |
| RAF7021-10 | 87 | Very Low | RAF7021-24 | 89 | Very Low |
| RAF7021-11 | 101 | Lower Moderate | RAF7021-25 | 90 | Moderately Low |
| RAF7021-13 | 92 | Moderately Low | RAF7021-26 | 100 | Moderately Low |
| RAF7021-14 | 89 | Very Low |
Figure 8.
Groundwater Vulnerability DRASTIC Index map for Nakivale sub-catchment.
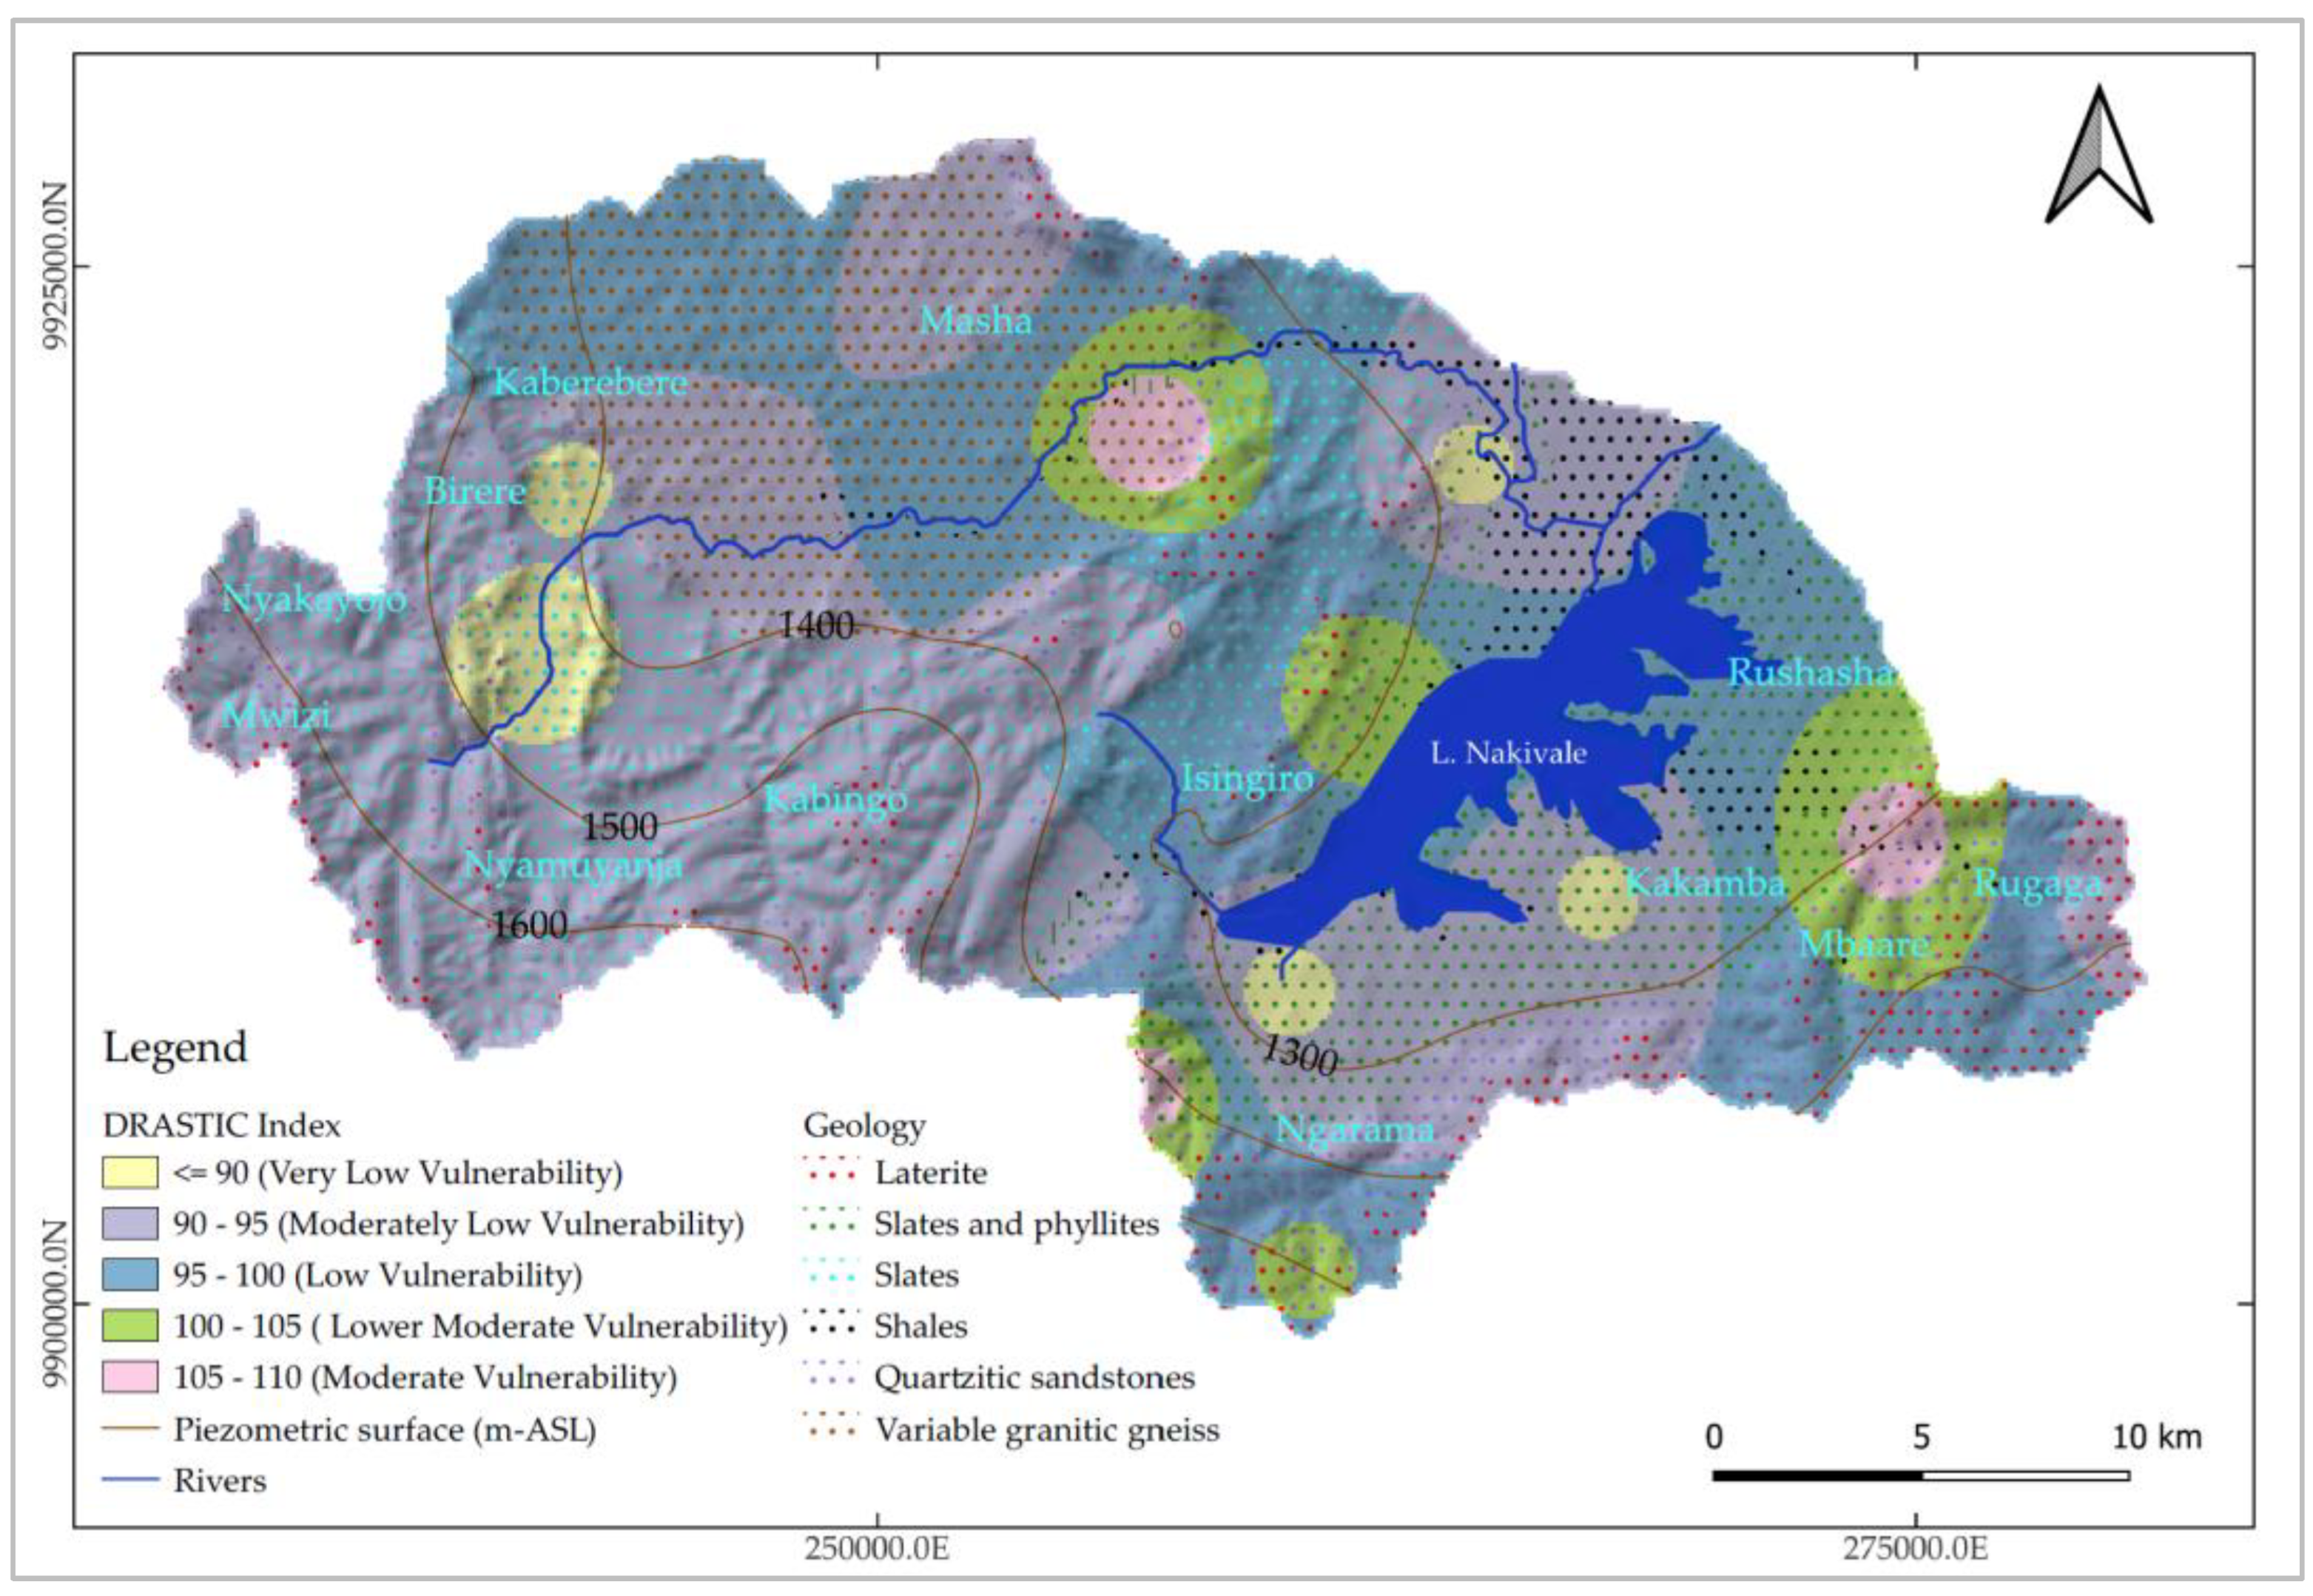
Additionally, the thick vadose zone, ranging from 40 to 60 meters, and an average static water level of 14 meters below ground level obtained from aquifer test data of existing boreholes further support the low risk assessment. However, parts of Masha, Mbaare, Isingiro and North East and South of Ngarama exhibit a higher risk of groundwater contamination compared to other regions within the Nakivale sub-catchment. This increased risk is attributed to the low hydraulic head gradients, gentle slope angles, and thin vadose zone, which create conditions conducive to the transport of contaminants from the surface to the water table. This risk is further evidenced by the higher nitrate concentrations observed in these areas compared to other parts of the catchment.
3.6. Implications to Water Resources Management
Groundwater quality is of paramount importance for any water resource usage, as each purpose requires water of appropriate quality to avoid negative consequences. For domestic use, particularly human consumption, water must be sufficiently clean, with all physical, chemical, and biological parameters falling within acceptable standard ranges to prevent health-related issues that could harm consumers.
Likewise, water used for irrigation must meet certain quality standards to promote healthy crop growth while avoiding soil degradation. Poor-quality irrigation water can lead to the accumulation of salts or other harmful substances, which may damage soils and compromise their long-term productivity for sustainable agriculture. Therefore, the findings of this research highlight the need for conjunctive management of water resources in the study area. Below are policy recommendations to ensure the sustainable use of groundwater resources within Nakivale sub-catchment:
- Regular monitoring of groundwater should be conducted to observe changes in groundwater quality due to anthropogenic and geogenic factors. This effort should include robust policies on fertilizer use and waste management practices in regions experiencing rising nitrate levels, along with the enforcement of stricter regulations on septic systems and waste disposal to minimize human-induced contamination;
- Implementation of a comprehensive soil and water management strategy that focuses on reducing sodium and salinity levels. This could include promoting the use of low-sodium irrigation water, encouraging farmers to adopt soil amendments such as gypsum to mitigate sodium buildup, and regulating the use of Na-rich chemical inputs;
- Active recharge zones, especially in elevated regions with networks of lineament features, should be safeguarded from intensive agricultural or industrial activities that may introduce contaminants. This protection should include the implementation of zoning regulations that limit potentially harmful land use in these sensitive areas. Additionally, promoting reforestation or vegetation cover in recharge zones is essential to reduce erosion and enhance infiltration, both of which are vital for maintaining groundwater recharge and quality;
- Educating riparian communities about the significance of preserving groundwater quality. This is essential, particularly in reducing anthropogenic contamination from improper waste disposal and excessive fertilizer use. Additionally, providing training for farmers on the advantages of adopting sustainable agricultural practices will help minimize fertilizer overuse and promote soil health, ensuring long-term productivity;
- Create an integrated water management plan that balances the use of both surface and groundwater resources, ensuring that neither is overexploited. The plan should be based on the specific hydrogeological and hydrochemical characteristics of the region. It should also ensure that water used for both domestic and agricultural purposes meets national and international water quality standards. Regular testing and enforcement of these standards are necessary to maintain public health and agricultural productivity;
4. Conclusions
The study provides a comprehensive assessment of groundwater quality in the Nakivale sub-catchment, revealing both positive aspects and potential risks associated with the region's water resources. While the majority of groundwater samples meet World Health Organization standards for drinking water, localized contamination issues related to total iron, magnesium, and nitrate levels warrant attention. Alignment of elevated chloride-bromide ratios with high nitrate concentration suggests anthropogenic influences stemming from agricultural practices, wastewater disposal, and industrial activities. The irrigation groundwater quality assessment indicates emerging salinity concerns that could impact crop productivity if not addressed. Despite an overall low groundwater vulnerability to contamination, certain areas, particularly those with gentle slopes and thinner vadose zones, exhibit a higher risk. This highlights the importance of proactive management strategies to mitigate these risks. Implementing targeted monitoring programs focusing on anthropogenic impacts on groundwater resources, promoting sustainable agricultural practices, and protecting recharge zones are essential for maintaining water quality. Ultimately, the findings advocate for a holistic approach to water resource management that balances agricultural needs with environmental protection, ensuring the long-term health and viability of the Nakivale sub-catchment’s and greater Victoria water resources for future generations. By prioritizing these strategies, stakeholders can safeguard water quality and promote sustainable practices that benefit both the community and the environment.
Author Contributions
Conceptualization, E.N.H. and R.M.K.; methodology, E.N.H. and R.M.K.; software, E.N.H.; validation, E.N.H. and R.M.K.; formal analysis, E.N.H. and R.M.K.; investigation, E.N.H.; resources, E.N.H. and R.M.K.; data curation, E.N.H. and R.M.K.; writing—original draft preparation, E.N.H.; writing—review and editing, E.N.H., R.M.K.; visualization, E.N.H.; supervision, R.M.K.; project administration, E.N.H.; funding acquisition, E.N.H., R.M.K. All authors have read and agreed to the published version of the manuscript.
Funding
This research received funding from the International Atomic Energy Agency (IAEA) through the RAF7021 project, in collaboration with Uganda's Ministry of Water and Environment. The study was carried out during a fellowship (Code: EVT2304936-0001-UGA) at the University of Strathclyde in the United Kingdom, spanning from October 9, 2023, to November 8, 2024.
Data Availability Statement
The data utilized in this research is available on request from the corresponding authors.
Acknowledgments
The authors gratefully acknowledge IAEA TC Project RAF7021 for the invaluable financial support extended throughout all stages of the project's implementation. The authors are also thankful for the financial support of the Scottish Government under the Climate Justice Fund Water Futures Program (research grant HN-CJF-03), awarded to the University of Strathclyde (Prof. R.M. Kalin PI).
Conflicts of Interest
The authors declare no conflicts of interest.
References
- United Nations Environment Programme. Goal 6: Clean Water and Sanitation [Internet]. 2024. Available from: https://www.unep.org/explore-topics/sustainable-development-goals/why-do-sustainable-development-goals-matter/goal-6.
- African Union. The African Union Commission Agenda 2063 Framework Document. African Union. 2015, 1–172. [Google Scholar]
- Cai J, Zhao D, Varis O. Match words with deeds: Curbing water risk with the Sustainable Development Goal 6 index. J Clean Prod. 2021; 318.
- de Lázaro Torres ML, Uribeondo PB, Yago FJM. Citizen and educational initiatives to support sustainable development goal 6: Clean water and sanitation for all. Sustainability (Switzerland). 2020; 12.
- Ministry of Water and Environment. Rwizi Catchment Management Plan. Kampala, Uganda: Ministry of Water and Environment; 2020.
- Adonia K, Kakurungu B. Assessment of the effects of changing land use from pastoralism to crop farming on Lake Nakivale wetland system in Isingiro District, Uganda. Journal of African Studies and Development. 2014; 6.
- Nanfuka S, Mfitumukiza D, Egeru A. Characterisation of ecosystem-based adaptations to drought in the central cattle corridor of Uganda. Afr J Range Forage Sci. 2020; 37.
- Nanfuka S, Mfitumukiza D, Egeru A. Characterisation of ecosystem-based adaptations to drought in the central cattle corridor of Uganda. Afr J Range Forage Sci. 2020; 37.
- Ronald, MA. An assessment of economic and environmental impacts of refugees in Nakivale, Uganda. Migr Dev. 2022, 11. [Google Scholar] [CrossRef]
- Uganda Bureau of Statistics. Census Population Counts (2002 and 2014) by Region, District, and Mid-Year Population Projections (2015-2021) [Internet]. 2023. Available from: https://www.ubos.org/explore-statistics/20/.
- Aturihaihi C, Tumwesigye W, Opio F, Beyihayo GA. Knowledge, Attitude and the Practice of Climate-Smart Agriculture among Smallholder Farmers in Isingiro District, South Western Uganda. East African Journal of Agriculture and Biotechnology. 2023; 6.
- Bjørkhaug, I. Revisiting the Refugee–Host Relationship in Nakivale Refugee Settlement: A Dialogue with the Oxford Refugee Studies Centre. J Migr Hum Secur. 2020, 8. [Google Scholar] [CrossRef]
- Ministry of Water and Environment. National Water Resources Assessment Report: Uganda 2013. Kampala, Uganda: Ministry of Water and Environment; 2013.
- Chenini I, Zghibi A, Kouzana L. Hydrogeological investigations and groundwater vulnerability assessment and mapping for groundwater resource protection and management: State of the art and a case study. Journal of African Earth Sciences. 2015; 109.
- Owor M, Muwanga A, Tindimugaya C, Taylor RG. Hydrogeochemical processes in groundwater in Uganda: a national-scale analysis. Journal of African Earth Sciences. 2021; 175.
- Nabala, EH. Hydrochemical and Isotopic Characterisation of Groundwater Resources in Nakivale Sub-catchment in Isingiro district, Southwestern Uganda. Glasgow: (unpublished Masters of Science Hydrogeology dissertation, (University of Strathclyde)). Glasgow; 2024. [Google Scholar]
- Ministry of Water and Environment. Baseline Groundwater Resources Assessment Report. 2022.
- Songa P, Rumohr J, Musota R. A shared water risk assessment for a vulnerable river basin: River Rwizi in Uganda. In: River Basin Management VIII. 2015.
- Nimusiima D, Byamugisha D, Omara T, Ntambi E. Physicochemical and Microbial Quality of Water from the Ugandan Stretch of the Kagera Transboundary River. Limnological Review. 2023, 23. [Google Scholar]
- Walter O, Wasswa J, Nakiguli CK, Ntambi E. Spatial Variation in Physicochemical Surface Water Quality in River Rwizi, Western Uganda. J Water Resour Prot. 2019; 11.
- Chatterjee R, Ray RK. A proposed new approach for groundwater resources assessment in India. Journal of the Geological Society of India. 2016, 88. [Google Scholar]
- Rojas R, Commander P, McFarlane D, Ali R, Dawes W, Barron O, Hodgson G, Charles S. Groundwater Resource Assessment and Conceptualization in the Pilbara Region, Western Australia. Earth Systems and Environment. 2018; 2.
- Lions J, Devau N, Elster D, Voutchkova DD, Hansen B, Schullehner J, Pantić TP, Samolov KA, Camps V, Arnó G, Herms I, Rman N, Cerar S, Grima J, Giménez-Forcada E, Luque-Espinar JA, Malcuit E, Gourcy L. A broad-scale method for estimating natural background levels of dissolved components in groundwater based on lithology and anthropogenic pressure. Water (Switzerland). 2021; 13.
- Aller L, Bennett T, Lehr JH, Petty RJ, Hackett G. DRASTIC : A Standardized Method for Evaluating Ground Water Pollution Potential Using Hydrogeologic Settings. NWWA/Epa-600/2-87-035. 1987.
- Tufano R, Allocca V, Coda S, Cusano D, Fusco F, Nicodemo F, Pizzolante A, Vita P De. Groundwater vulnerability of principal aquifers of the Campania region (southern Italy). J Maps. 2020; 16.
- Aturihaihi C, Tumwesigye W, Opio F, Beyihayo GA. Knowledge, Attitude and the Practice of Climate-Smart Agriculture among Smallholder Farmers in Isingiro District, South Western Uganda. East African Journal of Agriculture and Biotechnology. 2023; 6.
- Adonia K, Kakurungu B. Assessment of the effects of changing land use from pastoralism to crop farming on Lake Nakivale wetland system in Isingiro District, Uganda. Journal of African Studies and Development. 2014; 6.
- Bjørkhaug, I. Revisiting the refugee–host relationship in Nakivale Refugee Settlement: A dialogue with the Oxford Refugee Studies Centre. J Migr Hum Secur. 2020, 8, 266–281. [Google Scholar] [CrossRef]
- Ronald, MA. An assessment of economic and environmental impacts of refugees in Nakivale, Uganda. Migr Dev. 2022, 11. [Google Scholar] [CrossRef]
- Najib, MI. Assessing groundwater quality for drinking purpose in Jordan: application of water quality index. Journal of Ecological Engineering. 2019, 20, 101–111. [Google Scholar]
- Balan In, Kumar PDM, Shivakumar M. An assessment of groundwater quality using water quality index in Chennai, Tamil Nadu, India. Chronicles of Young Scientists. 2012; 3.
- Stheeman, HA. Various Phases of Folding — Nature of Contact — Manner of Intrusion. In The Geology of Southwestern Uganda. 1932.
- Ministry of Water and Environment. Baseline Groundwater Assessment Report-National Groundwater Study. Kampala, Uganda: Ministry of Water and Environment; 2022.
- Tindimugaya, C. Groundwater flow and storage in weathered crystalline rock aquifer systems of Uganda: evidence from environmental tracers and aquifer responses to hydraulic stress. UCL (University College London; 2008. [Google Scholar]
- Taylor RG, Howard KWF. Post-Palaeozoic evolution of weathered land surfaces in Uganda by tectonically controlled deep weathering and stripping. Geomorphology. 1998, 25, 173–192. [Google Scholar] [CrossRef]
- Kohno, M. Effects of hydraulic gradient and clay type on permeability of clay mineral materials. Minerals. 2020, 10, 1064. [Google Scholar] [CrossRef]
- Boynton SS, Daniel DE. Hydraulic conductivity tests on compacted clay. Journal of Geotechnical Engineering. 1985, 111, 465–478. [Google Scholar] [CrossRef]
- Toma VE, Webster PJ. Oscillations of the intertropical convergence zone and the genesis of easterly waves. Part I: Diagnostics and theory. Clim Dyn. 2010, 34, 587–604. [Google Scholar]
- Riedel T, Weber TKD. Review: The influence of global change on Europe’s water cycle and groundwater recharge. Hydrogeol J. 2020; 28.
- Bui A, Johnson F, Wasko C. The relationship of atmospheric air temperature and dew point temperature to extreme rainfall. Environmental Research Letters. 2019, 14, 74025. [Google Scholar] [CrossRef]
- Vicente-Serrano SM, McVicar TR, Miralles DG, Yang Y, Tomas-Burguera M. Unraveling the influence of atmospheric evaporative demand on drought and its response to climate change. Vol. 11, Wiley Interdisciplinary Reviews: Climate Change. 2020.
- Conicelli B, Hirata R, Galvão P, Bernardino M, Simonato M, Abreu MC, Aranda N, Terada R. Determining groundwater availability and aquifer recharge using GIS in a highly urbanized watershed. J South Am Earth Sci. 2021, 106. [Google Scholar]
- Broekaert JAC. Inductively coupled plasmas in analytical atomic spectrometry, edited by A. Montaser and D.W. Golightly. TrAC Trends in Analytical Chemistry. 1988, 7.
- Fritz, SJ. A Survey of Charge-Balance Errors on Published Analyses of Potable Ground and Surface Waters. Groundwater. 1994, 32. [Google Scholar] [CrossRef]
- Lu GY, Wong DW. An adaptive inverse-distance weighting spatial interpolation technique. Comput Geosci. 2008; 34.
- Gorantla SS, Kumar GNP. Spatial distribution of groundwater quality indices using decision support system in Cheyyeru Watershed, YSR District, India. Spatial Information Research. 2021; 29.
- Ketata-Rokbani M, Gueddari M, Bouhlila R. Use of Geographical Information System and Water Quality Index to Assess Groundwater Quality in El Khairat Deep Aquifer (Enfidha, Tunisian Sahel). Vol. 2, Official Peer Reviewed Journal of Babol Noshirvani University of Technology BUT Corresponding Author. 2011.
- Mahalingam B, Bhauso MD, Jayashree P. Assessment of Groundwater Quality Using GIS Techniques : A Case Study of Mysore City. International Journal of Engineering and Innovative Technology (IJEIT). 2014; 3.
- Balan In, Kumar PDM, Shivakumar M. An assessment of groundwater quality using water quality index in Chennai, Tamil Nadu, India. Chronicles of Young Scientists. 2012; 3.
- Ibrahim, MN. Assessing groundwater quality for drinking purpose in Jordan: Application of water quality index. Journal of Ecological Engineering. 2019, 20. [Google Scholar] [CrossRef]
- Shuaibu A, Kalin RM, Phoenix V, Banda LC, Lawal IM. Hydrogeochemistry and Water Quality Index for Groundwater Sustainability in the Komadugu-Yobe Basin, Sahel Region. Water (Switzerland). 2024; 16.
- Worwornyo, SK. Assessment of Groundwater Quality and Its Suitability for Domestic and Agricultural Purposes in the North-Western Part of the Central Region, Ghana. University Of Ghana, 2014. [Google Scholar]
- Taherian P, Joodavi A. Hydrogeochemical characteristics and source identification of salinity in groundwater resources in an arid plain, northeast of Iran: Implication for drinking and irrigation purposes. Acque Sotterranee-Italian Journal of Groundwater. 2021, 10, 21–31. [Google Scholar] [CrossRef]
- Alogayell HM, EL-Bana EMM, Abdelfattah M. Groundwater Quality and Suitability Assessment for Irrigation Using Hydrogeochemical Characteristics and Pollution Indices: A Case Study of North Al-Quwayiyah Governorate, Central Saudi Arabia. Water (Basel). 2023, 15, 3321. [Google Scholar]
- Hasan M, Shang Y, Akhter G, Jin W. Evaluation of groundwater suitability for drinking and irrigation purposes in Toba Tek Singh District, Pakistan. Irrig Drain Syst Eng. 2017, 6, 185. [Google Scholar]
- Markus UI, Ilori OP, Wada IM, Musa ST, Peter JE. Hydrogeochemical evaluation and geospatial distribution modeling of the major ion chemistry of groundwater and their suitability for drinking and irrigation in Lagelu, Southwestern Nigeria. Appl Water Sci. 2022, 12, 160. [Google Scholar] [CrossRef]
- Maurya PK, Ali SA, Zaidi SK, Wasi S, Tabrez S, Malav LC, Ditthakit P, Son CT, Cabral-Pinto MM, Yadav KK. Assessment of groundwater geochemistry for drinking and irrigation suitability in Jaunpur district of Uttar Pradesh using GIS-based statistical inference. Environmental Science and Pollution Research. 2023, 30, 29407–29431. [Google Scholar]
- Vranešević M, Zemunac R, Grabić J, Salvai A. Hydrochemical Characteristics and Suitability Assessment of Groundwater Quality for Irrigation. Applied Sciences. 2024, 14, 615. [Google Scholar] [CrossRef]
- Barbulescu, A. Assessing groundwater vulnerability: DRASTIC and DRASTIC-like methods: A review. Vol. 12, Water (Switzerland). 2020.
- Malakootian M, Nozari M. GIS-based DRASTIC and composite DRASTIC indices for assessing groundwater vulnerability in the Baghin aquifer, Kerman, Iran. Natural Hazards and Earth System Sciences. 2020; 20.
- Gonçalves V, Albuquerque A, Carvalho P, Almeida P, Cavaleiro V. Groundwater Vulnerability Assessment to Cemeteries Pollution through GIS-Based DRASTIC Index. Water (Switzerland). 2023; 15.
- Kaddour K, Hacen B El, Hlima D, Yasmina D. Groundwater vulnerability assessment using GOD method in Boulimat coastal District of Bejaia area North east Algeria. J Bio & Env Sci. 2018; 109.
- Huang CC, Yeh HF, Lin HI, Lee ST, Hsu KC, Lee CH. Groundwater recharge and exploitative potential zone mapping using GIS and GOD techniques. Environ Earth Sci. 2013, 68. [Google Scholar]
- Pisciotta A, Suozzi E, Tiwari AK. A modified GALDIT-NUTS index to assess Favignana Island aquifer vulnerability. Geocarto Int. 2022; 37.
- Recinos N, Kallioras A, Pliakas F, Schuth C. Application of GALDIT index to assess the intrinsic vulnerability to seawater intrusion of coastal granular aquifers. Environ Earth Sci. 2015, 73. [Google Scholar]
- Aller L, Bennett T, Lehr JH, Petty RJ, Hackett G. DRASTIC : A Standardized Method for Evaluating Ground Water Pollution Potential Using Hydrogeologic Settings. NWWA/Epa-600/2-87-035. 1987.
- Aizman RI, Gerasev AD, Aizman O, Krasheninina GI, Trofimovich EM. Physiological and hygienic basis of potassium norm in drinking water: Theoretical and practical implications. Novosibirsk State Pedagogical University Bulletin. 2018; 8.
- Marx A, Neutra RR. Magnesium in drinking water and ischemic heart disease. Vol. 19, Epidemiologic Reviews. 1997.
- Liap, Z. Environmental chemistry of trace elements and their biological effect. Chinese Environmental Science Press, Beijing. 1992, 320.
- Burlingame GA, Dietrich AM, Whelton AJ. Understanding the basics of tap water taste. J Am Water Works Assoc. 2007, 99. [Google Scholar]
- Nagudi, B. Status of Geological Resources in Uganda. Report for the Embassy of the Republic of Korea in Uganda. Kampala: Embassy of the Republic of Korea in Uganda; 2011.
- Glynn PD, Plummer LN. Geochemistry and the understanding of ground-water systems. Vol. 13, Hydrogeology Journal. 2005.
- McMaster, DN. Change of Regional Balance in the Bukoba District of Tanganyika. Geogr Rev. 1960, 50. [Google Scholar] [CrossRef]
- Ratri D, Putra DPE, Wilopo W. Nitrate Source Detection Using Nitrate/Chloride Ratios and Chloride/Bromide Ratios in Shallow Groundwater, Bantul, Yogyakarta, Indonesia. In: AIP Conference Proceedings. 2023.
- Goldowitz, J. The chloride to bromide ratio as an environmental groundwater tracer, with a field study at the Wellton-Mohawk Irrigation and Drainage District. The University of Arizona; 1989. [Google Scholar]
- Andreasen DC, Fleck WB. Use of bromide:Chloride ratios to differentiate potential sources of chloride in a shallow, unconfined aquifer affected by brackish-water intrusion. Hydrogeol J. 1997; 5.
- Katz BG, Eberts SM, Kauffman LJ. Using Cl/Br ratios and other indicators to assess potential impacts on groundwater quality from septic systems: A review and examples from principal aquifers in the United States. J Hydrol (Amst). 2011; 397.
- Hudak, PF. Chloride/bromide ratios in leachate derived from farm-animal waste. Environmental Pollution. 2003, 121. [Google Scholar] [CrossRef]
- Goldowitz, J. The chloride to bromide ratio as an environmental groundwater tracer, with a field study at the Wellton-Mohawk Irrigation and Drainage District. The University of Arizona; 1989. [Google Scholar]
Figure 1.
Location map of Nakivale sub-catchment within Southwestern Uganda.
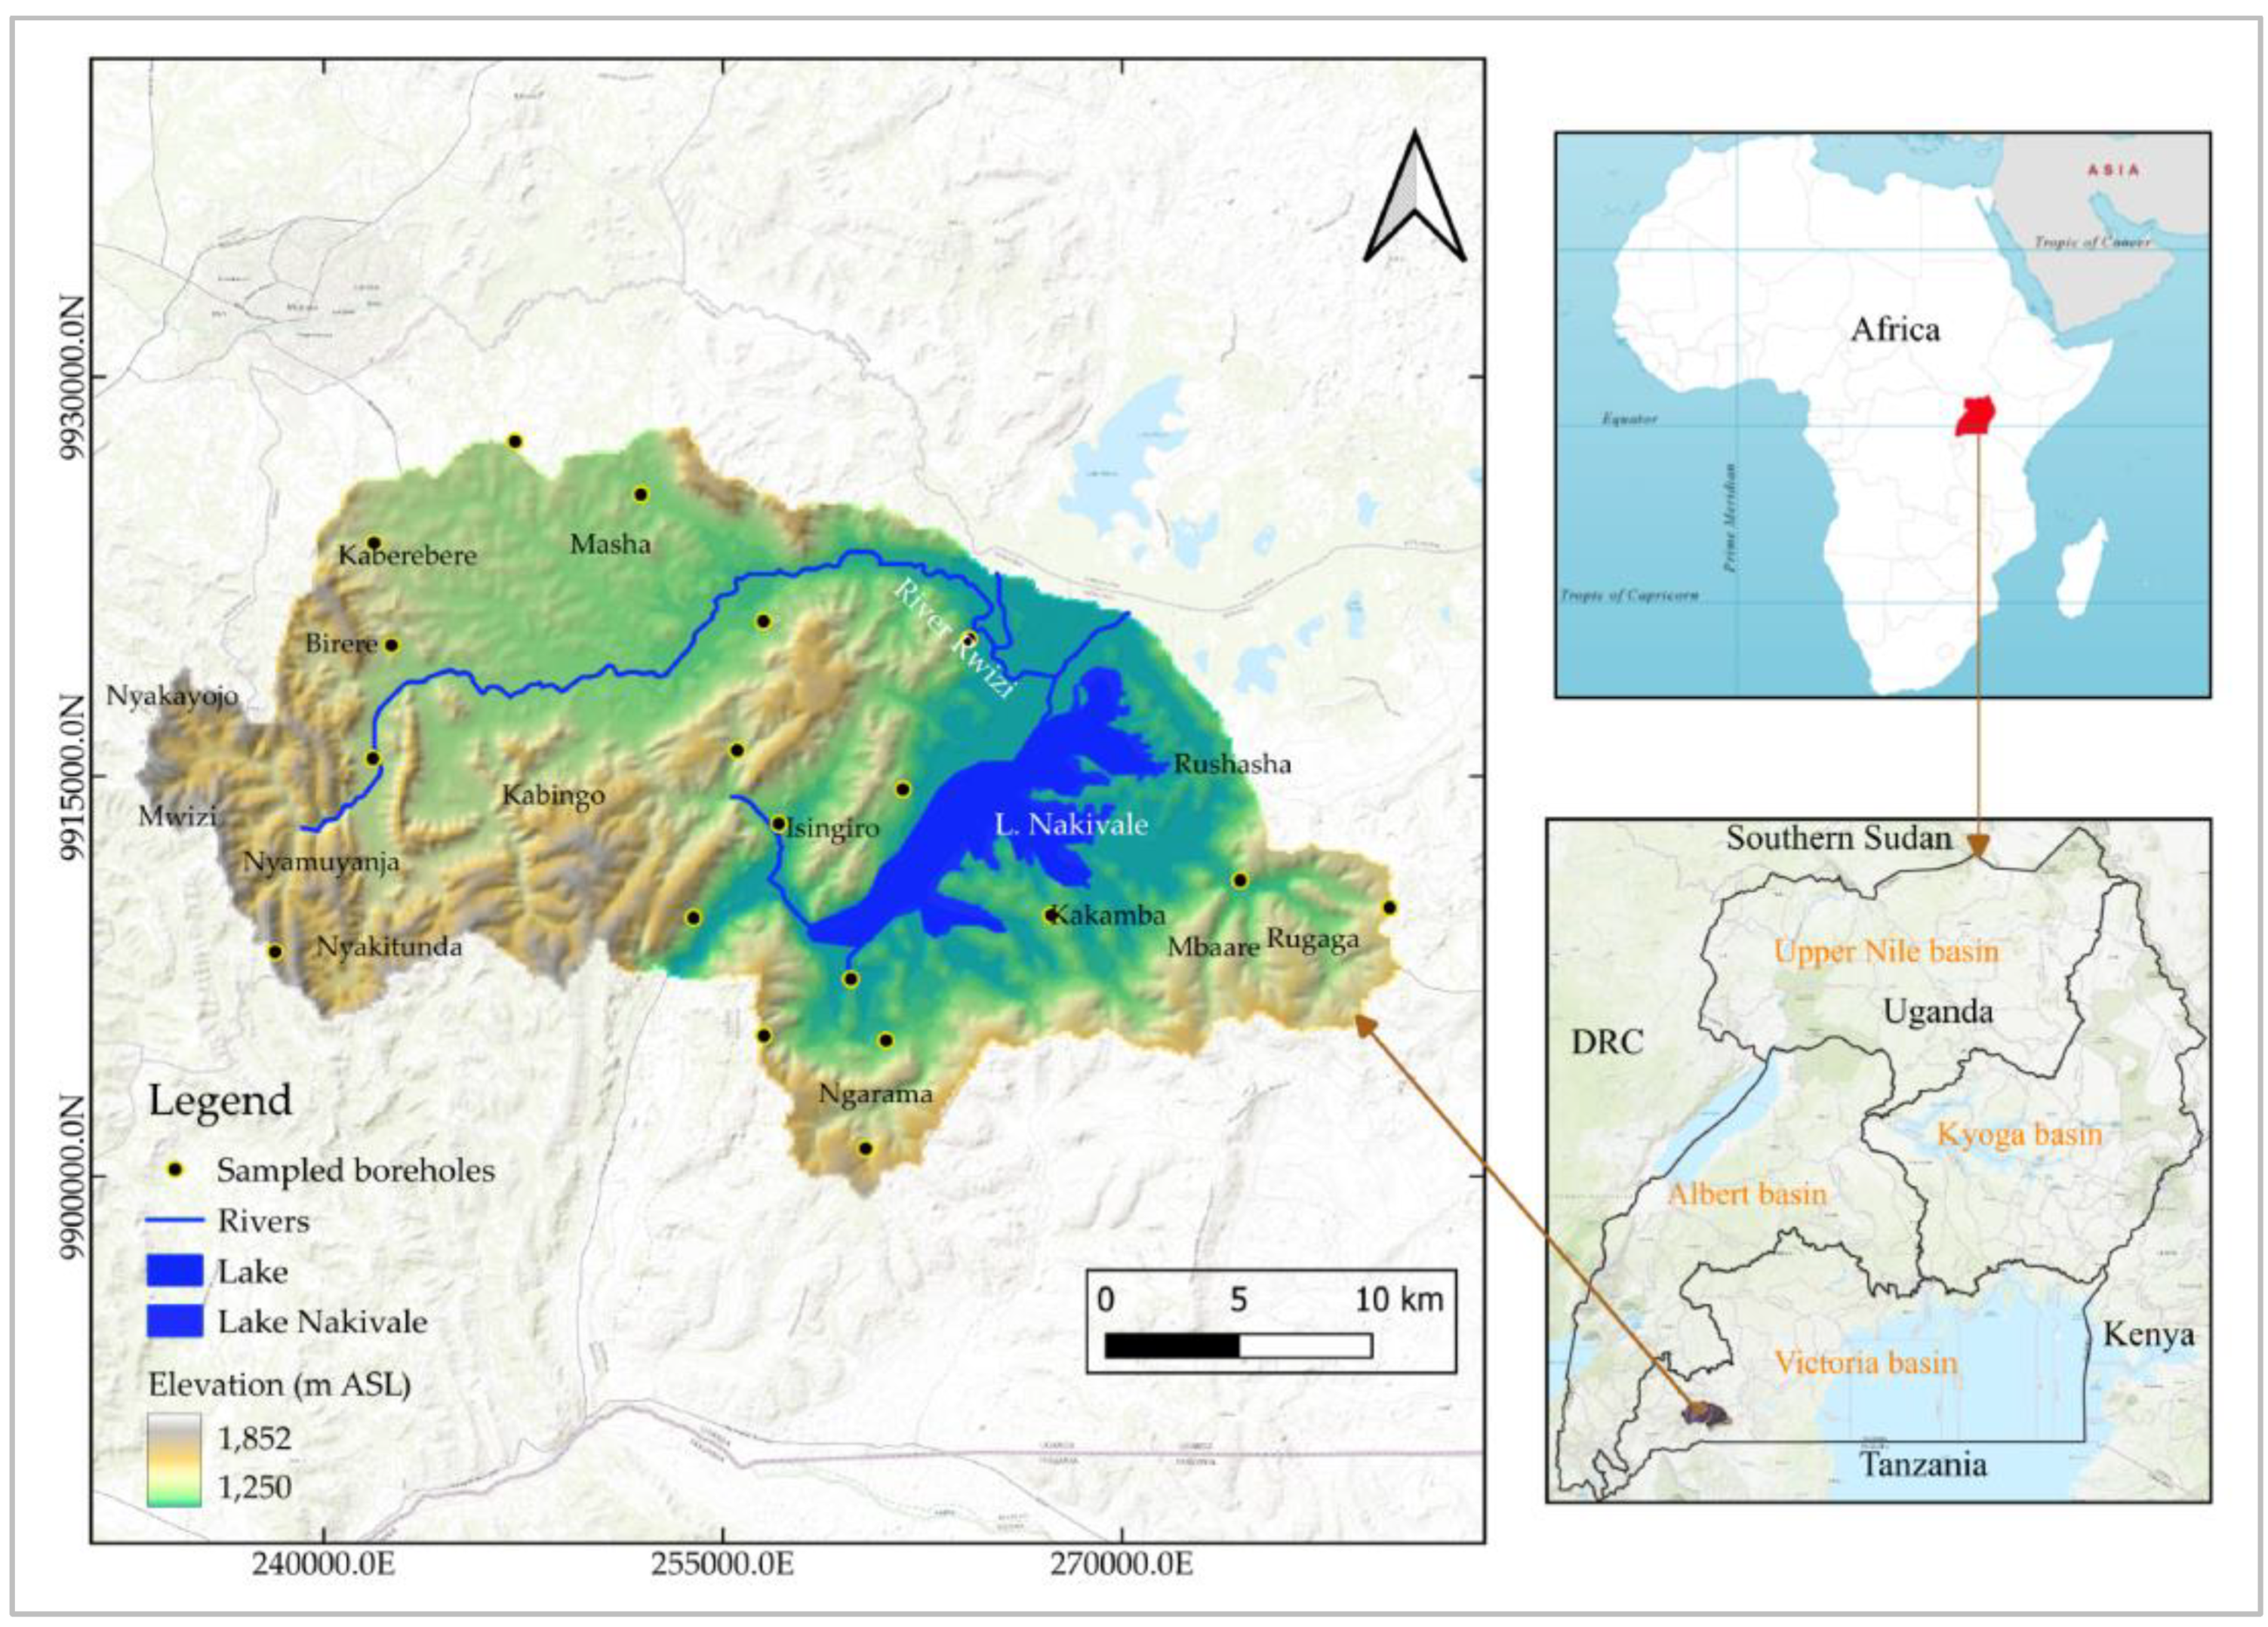
Figure 2.
Hydrogeological setting of Nakivale sub-catchment, Southwestern Uganda.
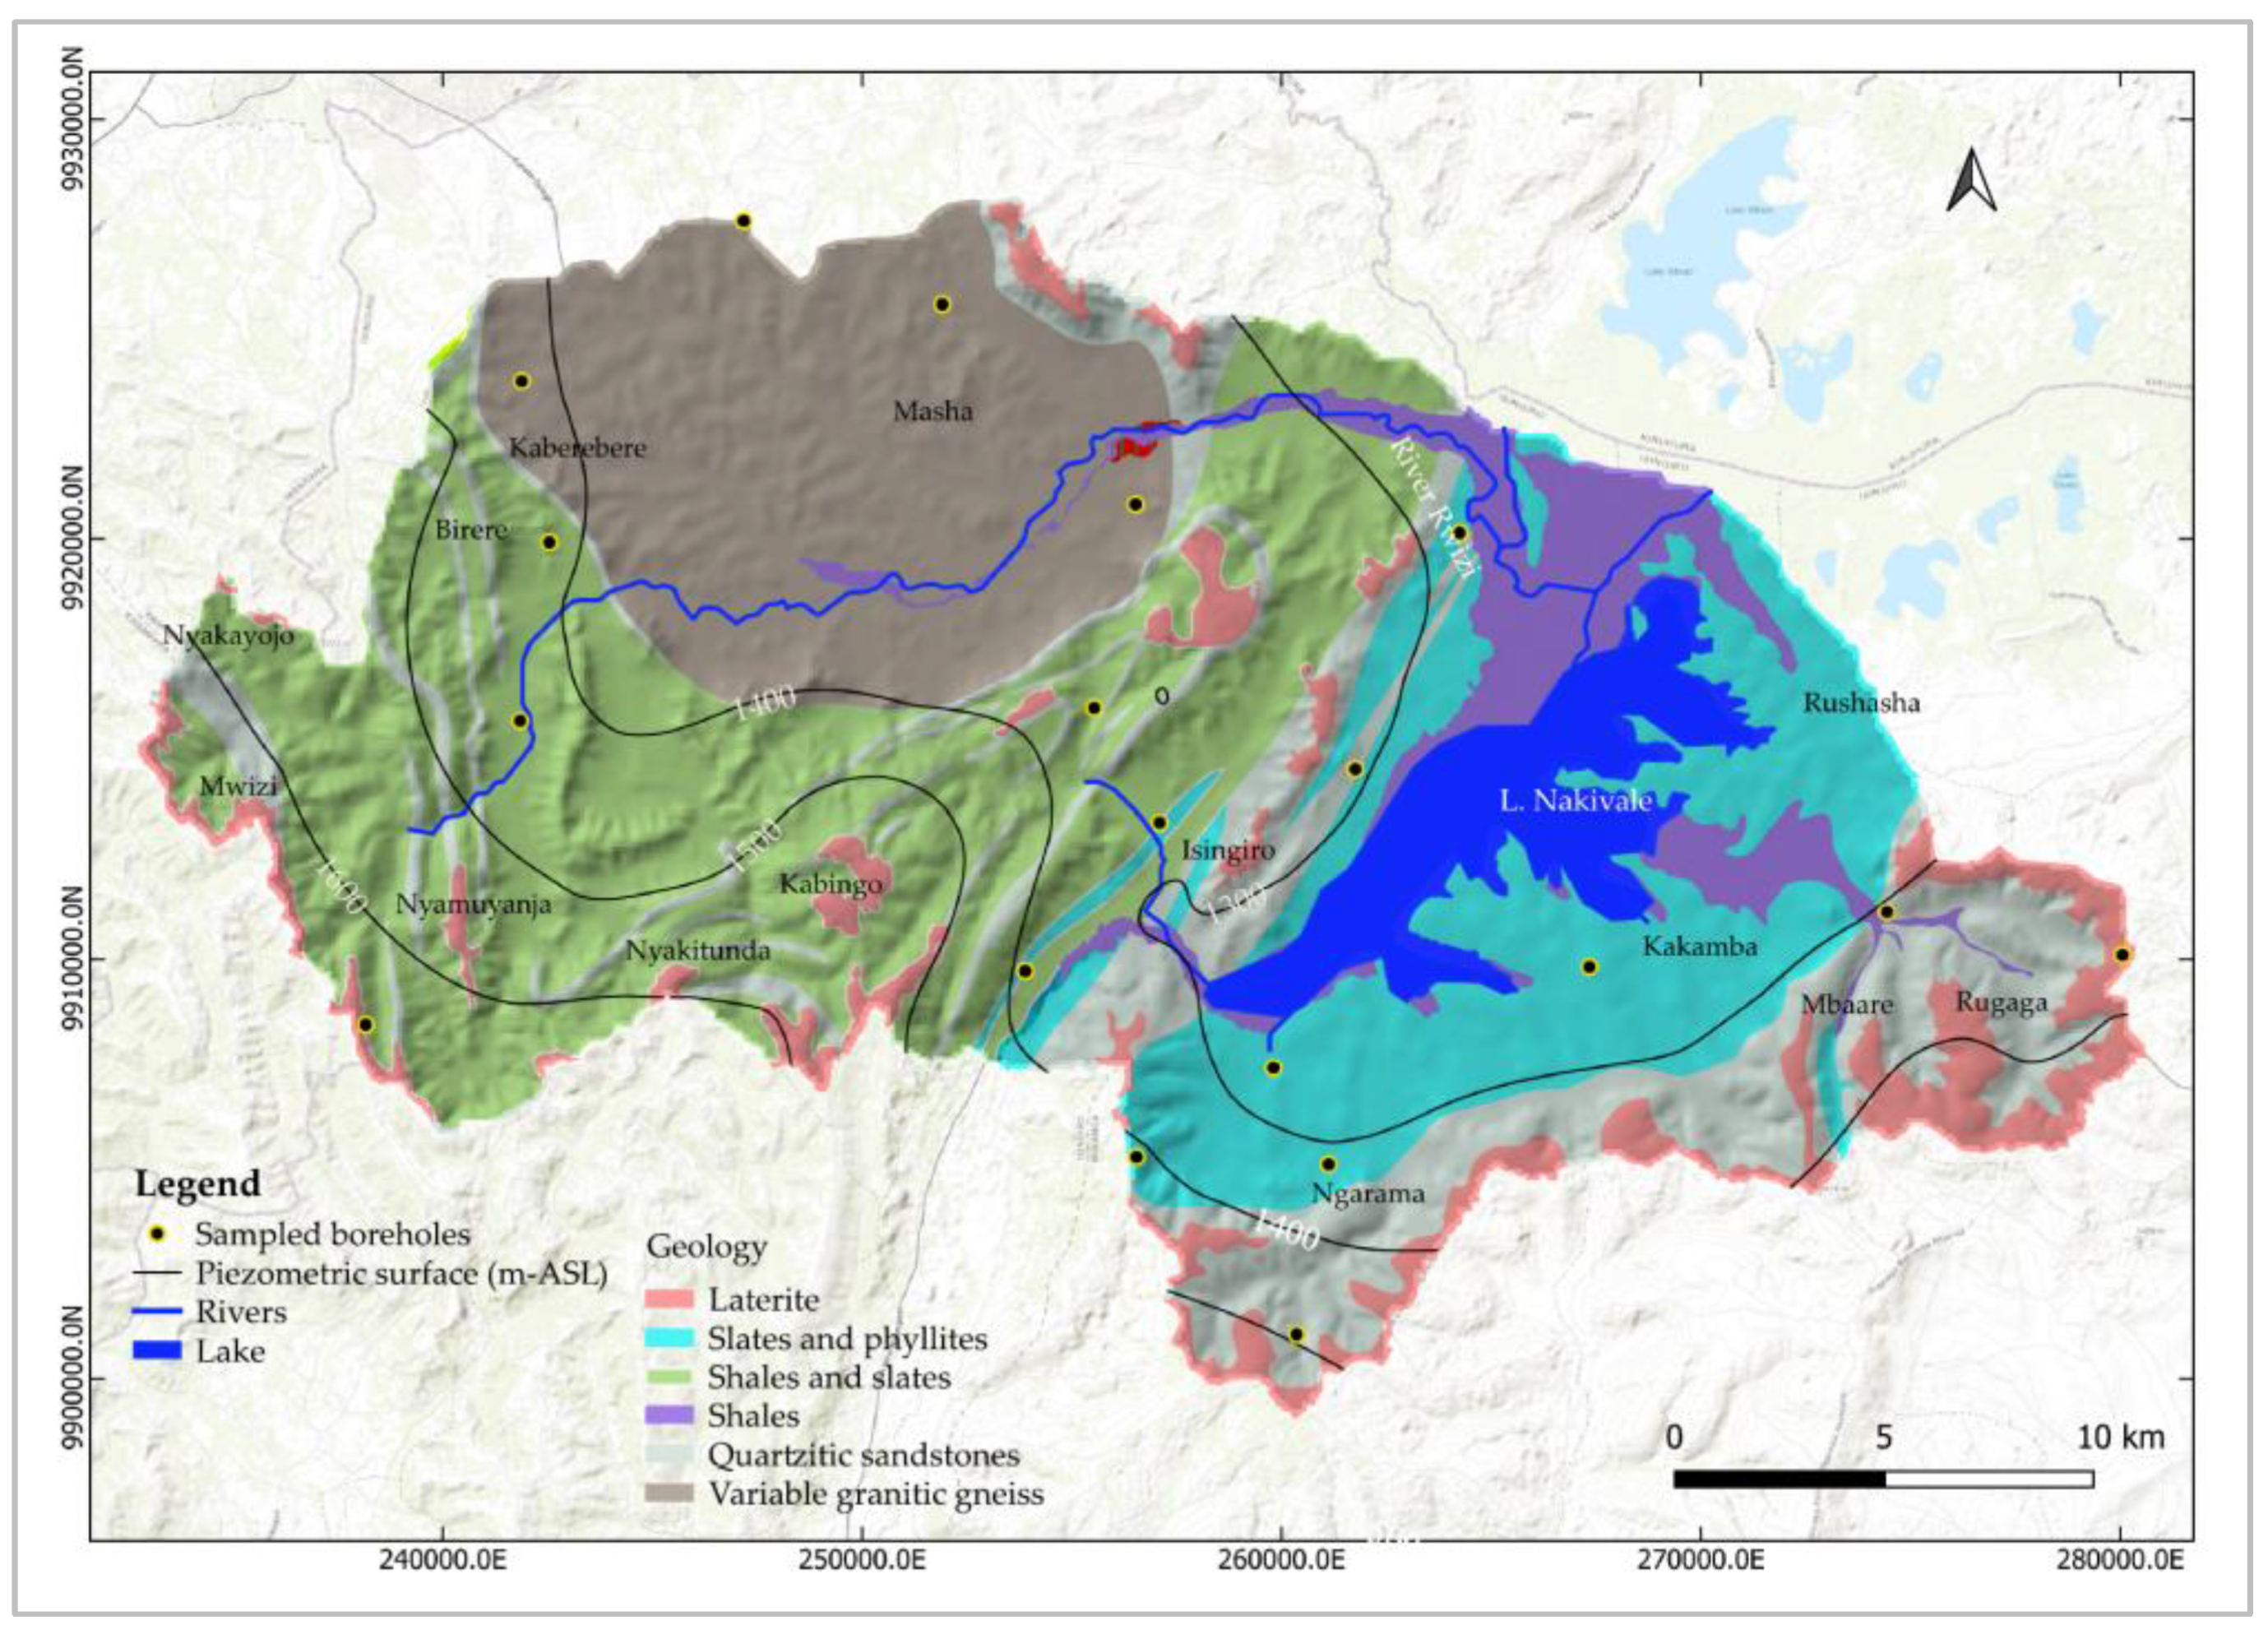
Figure 3.
Groundwater quality maps showing spatial distribution of major ions exceeding WHO guideline values for drinking water.
Figure 3.
Groundwater quality maps showing spatial distribution of major ions exceeding WHO guideline values for drinking water.
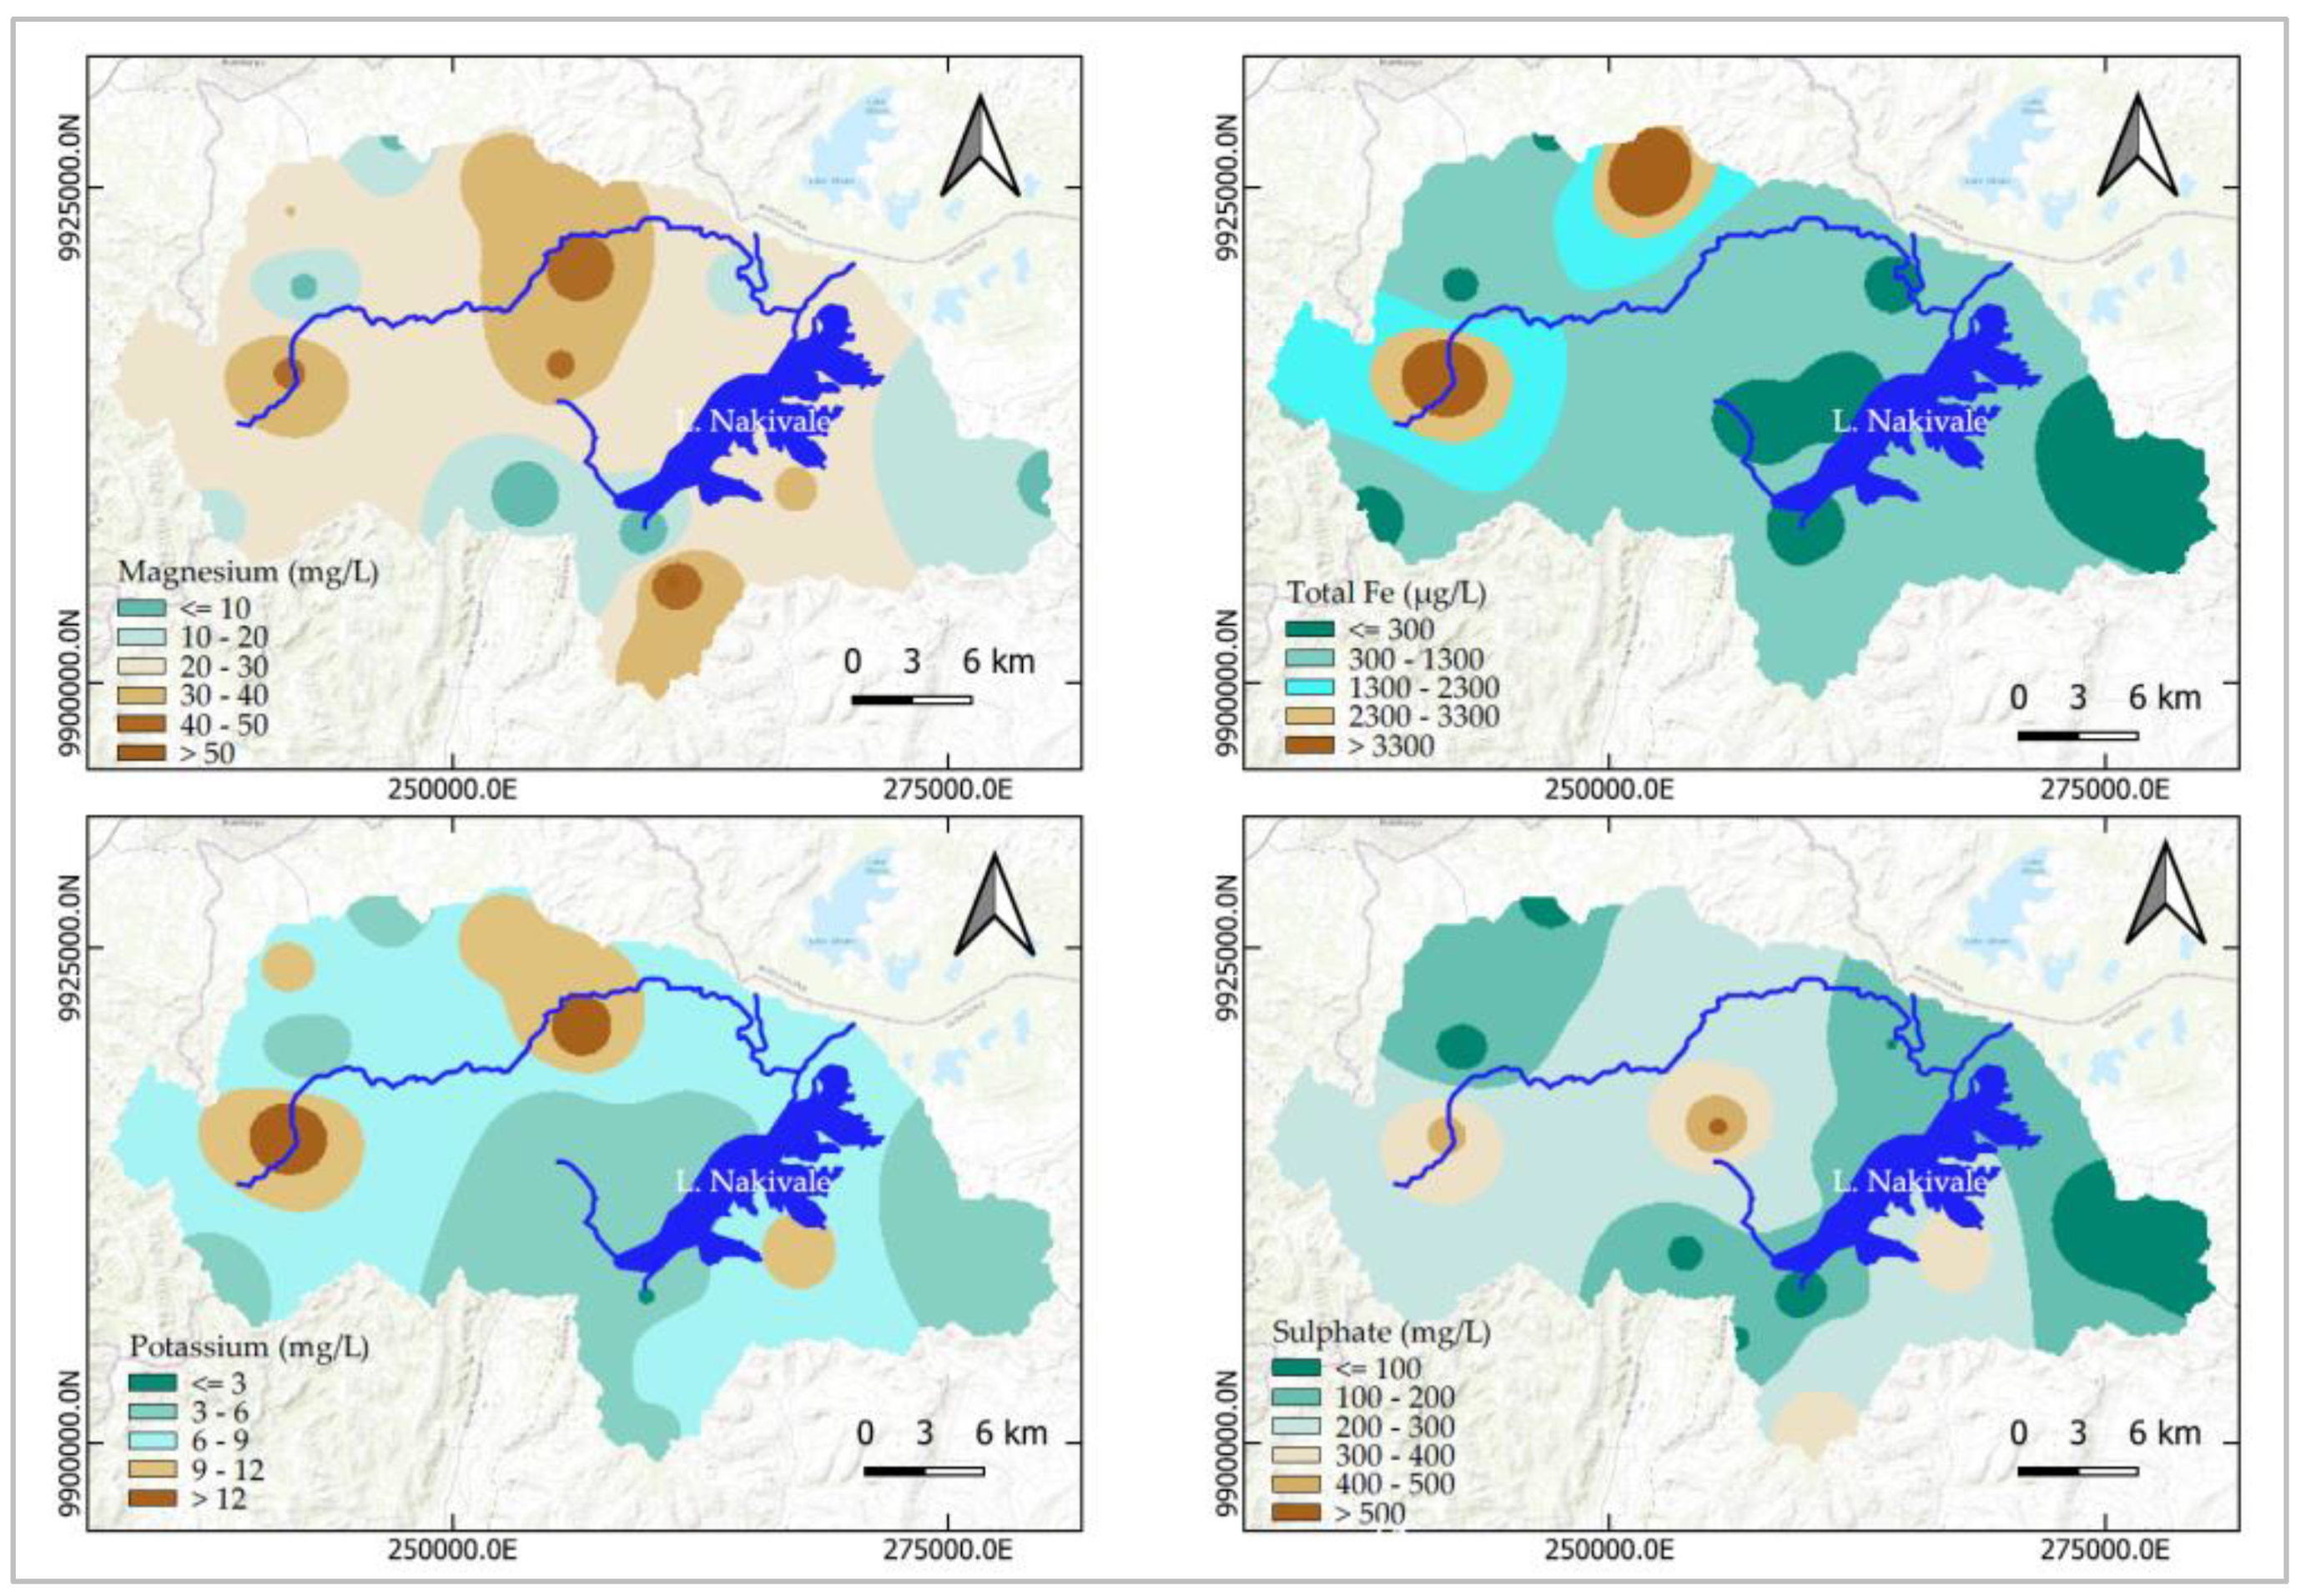
Figure 4.
Groundwater quality maps showing Electrical Conductivity, Dissolved Oxygen and Redox Potential spatial distribution within the project area.
Figure 4.
Groundwater quality maps showing Electrical Conductivity, Dissolved Oxygen and Redox Potential spatial distribution within the project area.
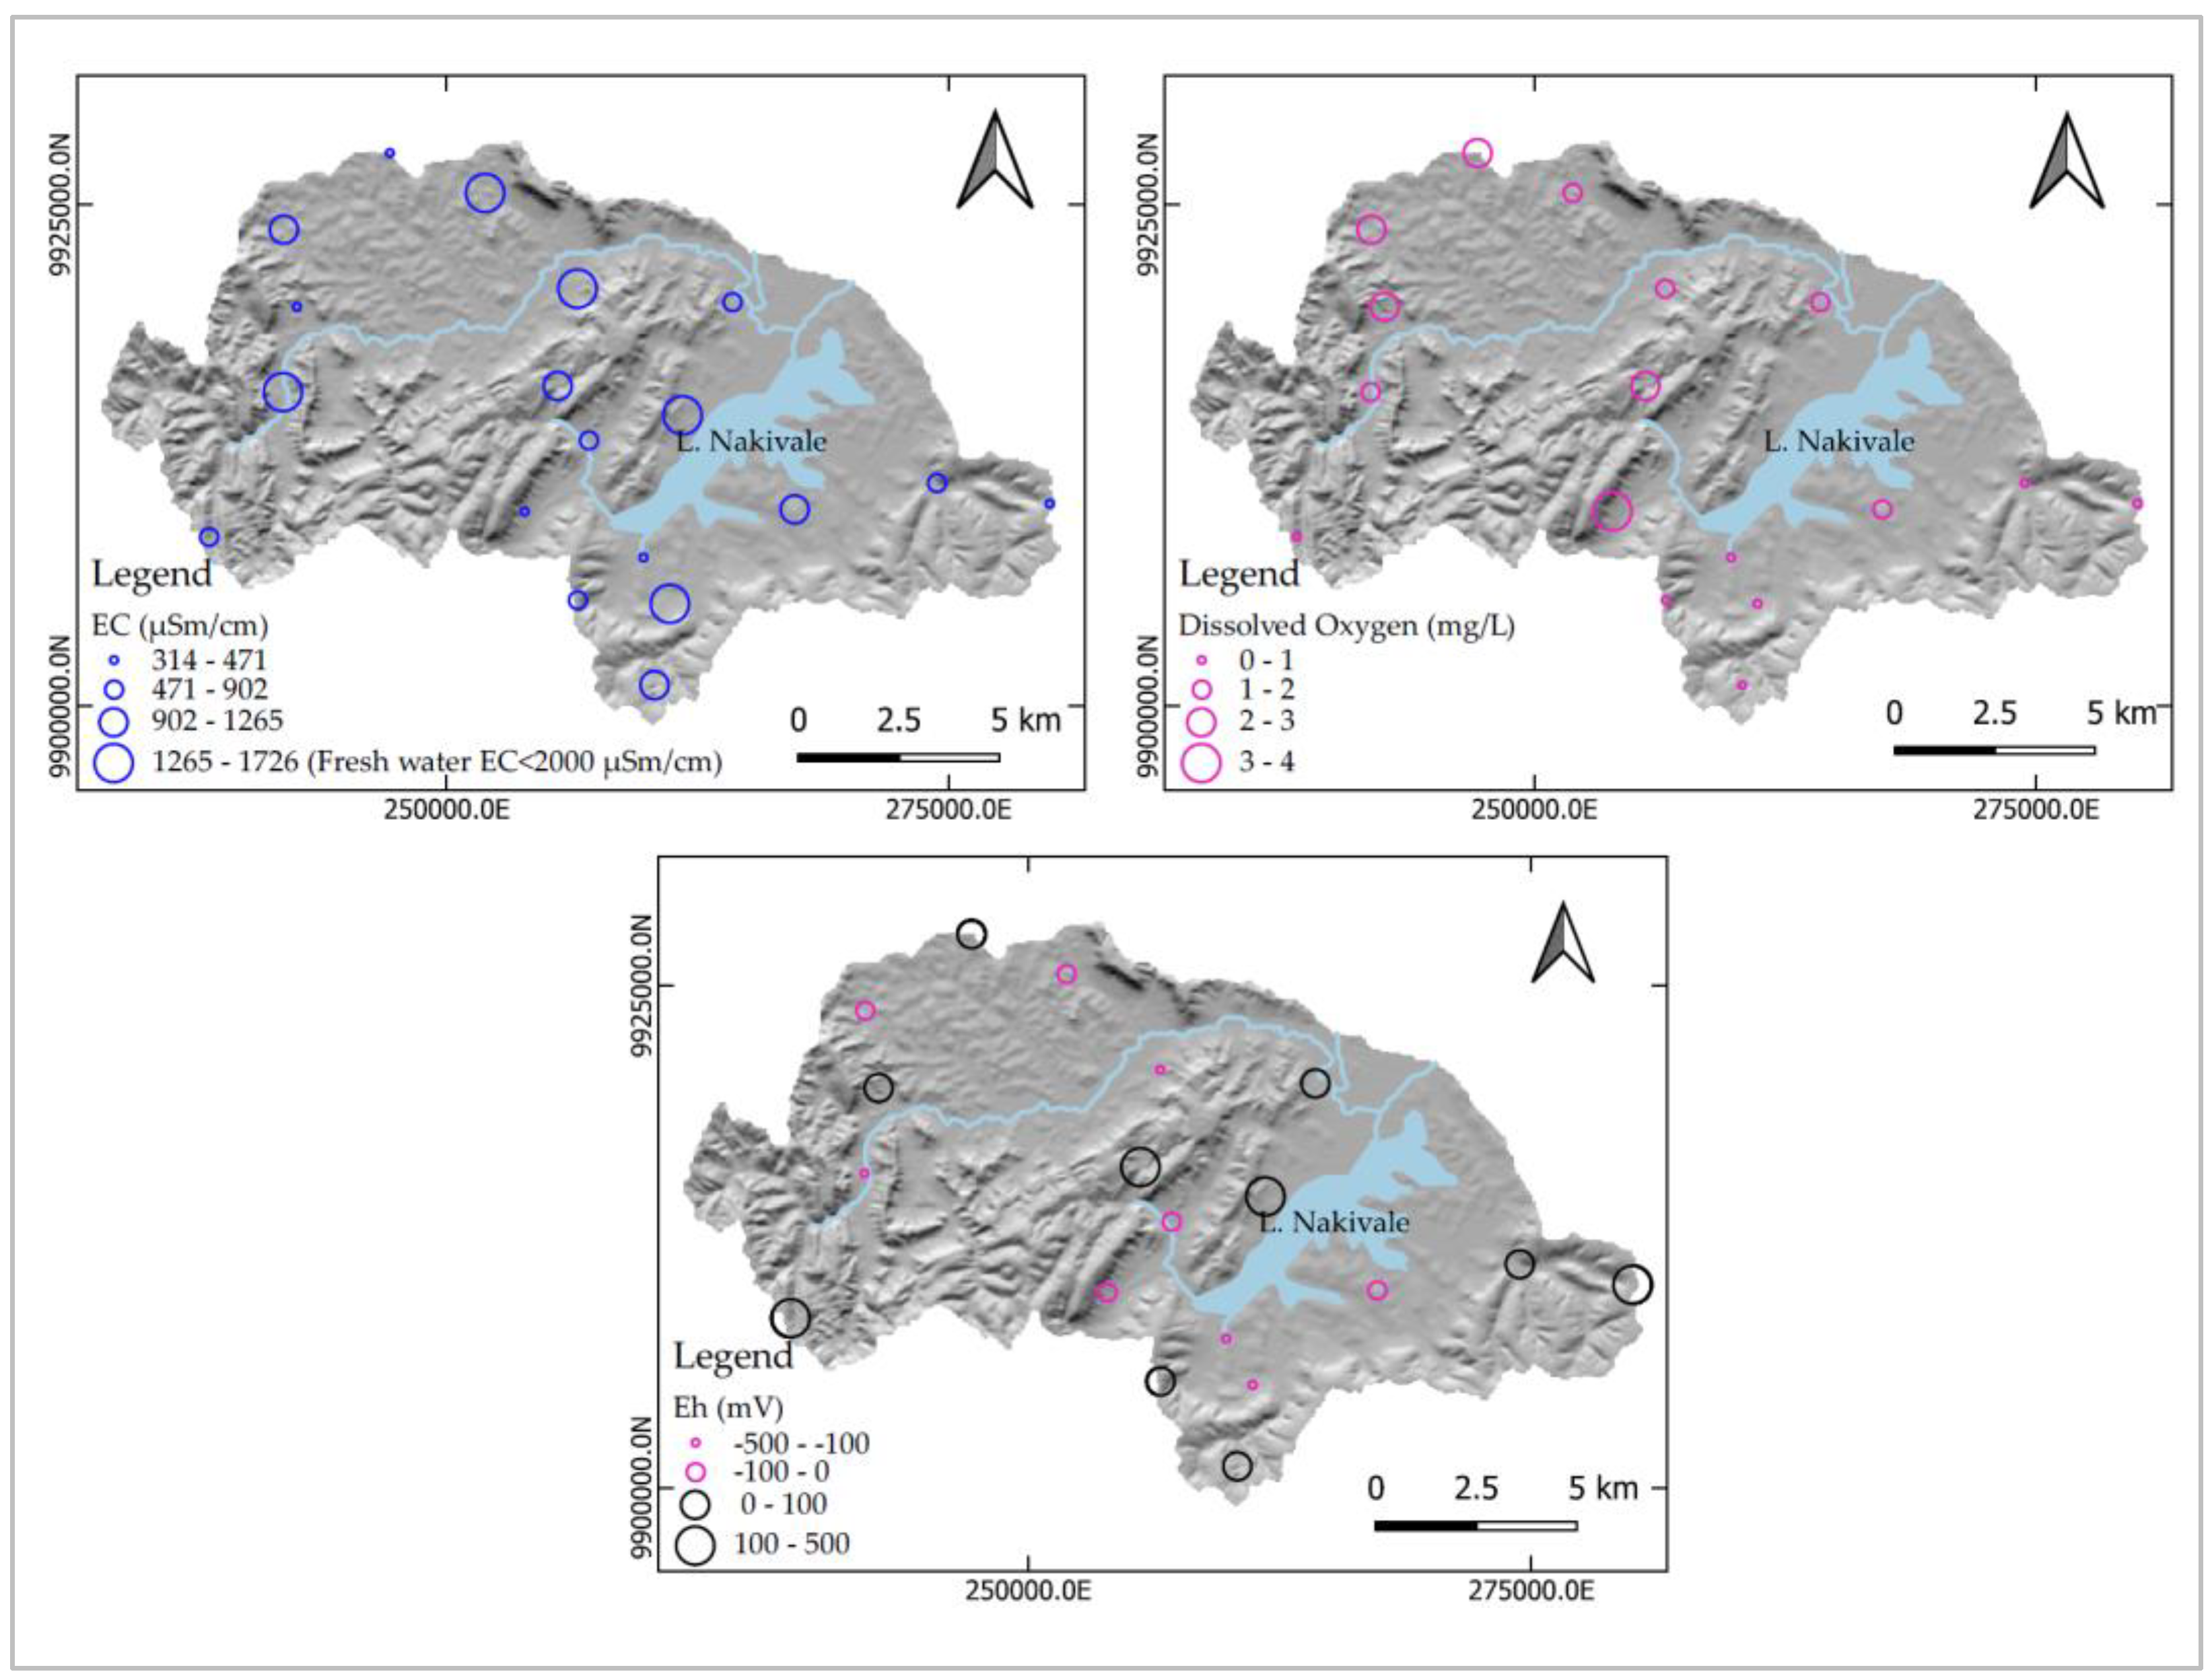
Table 3.
Groundwater quality index (GWQI)-based classification for groundwater samples collected from 19 hand pump boreholes in Nakivale sub-catchment, Southwestern Uganda.
Table 3.
Groundwater quality index (GWQI)-based classification for groundwater samples collected from 19 hand pump boreholes in Nakivale sub-catchment, Southwestern Uganda.
| Sample Number | GWQI | Groundwater Quality Type | Sample Number | GWQI | Groundwater Quality Type |
| RAF7021-1 | 64.2 | Good | RAF7021-18 | 45.8 | Excellent |
| RAF7021-2 | 25.0 | Excellent | RAF7021-21 | 25.2 | Excellent |
| RAF7021-3 | 276.0 | Poor | RAF7021-22 | 53.0 | Good |
| RAF7021-6 | 87.9 | Good | RAF7021-23 | 67.5 | Good |
| RAF7021-8 | 47.8 | Excellent | RAF7021-24 | 42.3 | Excellent |
| RAF7021-9 | 38.0 | Excellent | RAF7021-25 | 262.6 | Poor |
| RAF7021-10 | 22.1 | Excellent | RAF7021-26 | 34.7 | Excellent |
| RAF7021-11 | 98.3 | Good | |||
| RAF7021-13 | 76.8 | Good | |||
| RAF7021-14 | 80.1 | Good | |||
| RAF7021-15 | 38.2 | Excellent | |||
| RAF7021-17 | 30.0 | Excellent |
Disclaimer/Publisher’s Note: The statements, opinions and data contained in all publications are solely those of the individual author(s) and contributor(s) and not of MDPI and/or the editor(s). MDPI and/or the editor(s) disclaim responsibility for any injury to people or property resulting from any ideas, methods, instructions or products referred to in the content. |
© 2024 by the authors. Licensee MDPI, Basel, Switzerland. This article is an open access article distributed under the terms and conditions of the Creative Commons Attribution (CC BY) license (https://creativecommons.org/licenses/by/4.0/).
Copyright: This open access article is published under a Creative Commons CC BY 4.0 license, which permit the free download, distribution, and reuse, provided that the author and preprint are cited in any reuse.


