
Submitted:
18 October 2024
Posted:
21 October 2024
You are already at the latest version
Abstract
Objectives: We aimed to assess the relationship between circulating extracellular vesicles (EVs), hypoxia-related proteins and conventional risk factors of the life threatening coro-nary artery disease (CAD) to find more precise novel biomarkers.
Methods: Patients were categorized based on coronary CT angiography (CCTA). Patients with a Segment Involvement Score (SIS) > 5 were identified as CAD patients. Individuals with a SIS < 5 were considered as control subjects. Characterization of EVs and analysis of plasma concentration of GDF15 were performed by multicolor or bead-based flow cytom-etry. Plasma protein levels of PYGM, clusterin, CPN1 were determined by ELISA. Multiple logistic regression was used to determine the association of the biomarkers with the CAD outcome after accounting for established risk factors. The analysis was built in 3 steps: first, we included the basic clinical and laboratory variables (Model 1), then we integrated the plasma protein values (Model 2), and finally complemented it with the circulating EV pattern (Model 3). To assess the discrimination value of the models, an area under the re-ceiver operating curve was calculated and compared across the three models.
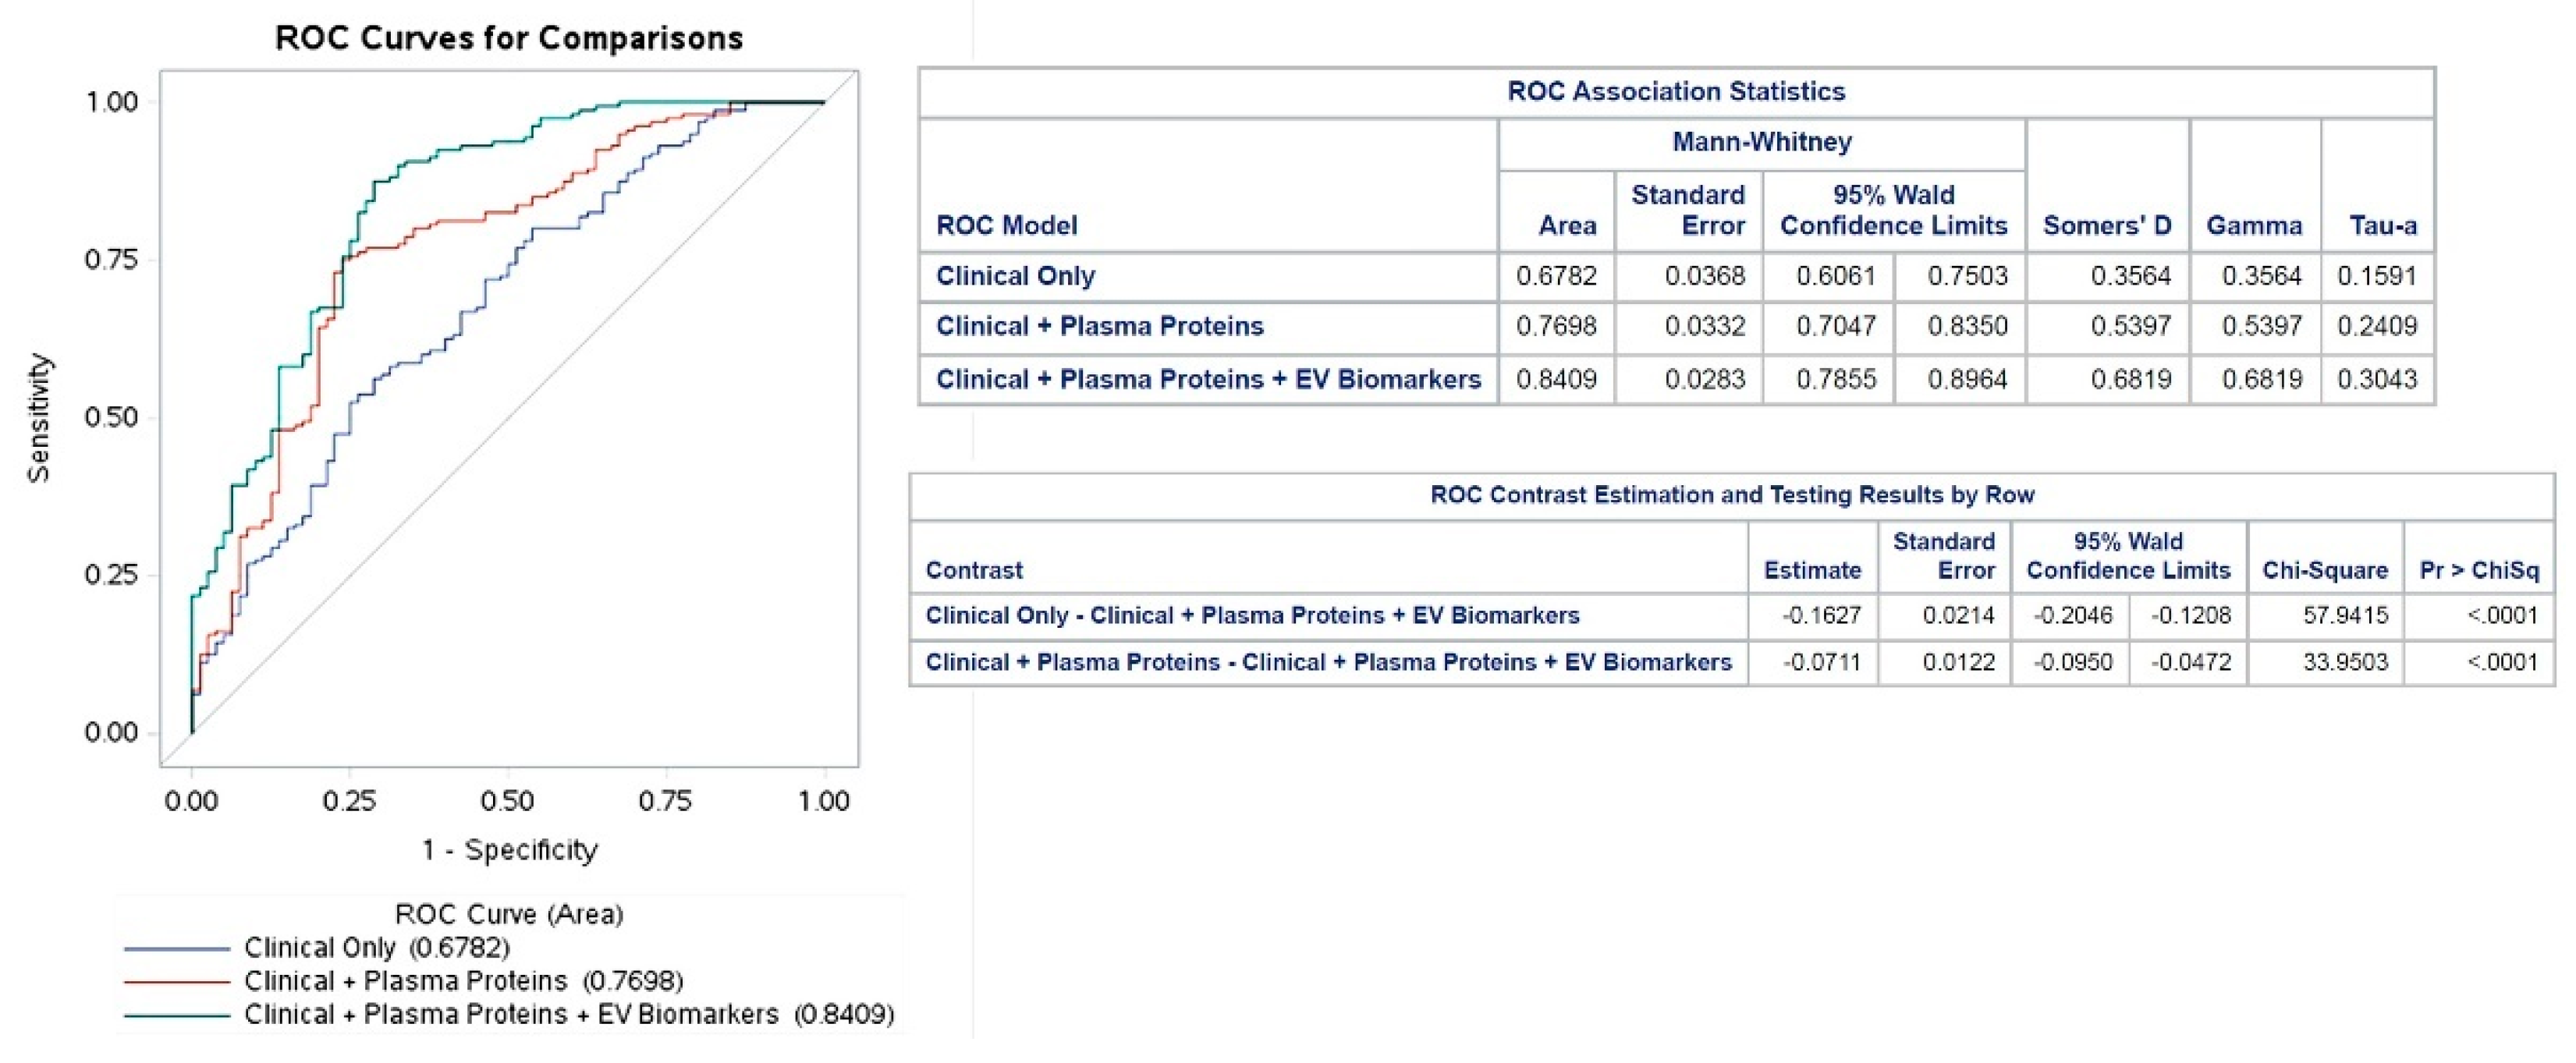
Results: The AUC values were 0.68, 0.77 and 0.84 in Models 1, Model 2 and Model 3, re-spectively. The variables with the greatest impact on the AUC values were Hemoglobin 0.2 (0.16-0.26) in Model 1, CPN1 0.12 (0.09-0.14) in Model 2, and circulating CD41+/CD61+ EVs 0.31 (0.15-0.5) in Model 3. Correlation analysis showed a significant impact of circu-lating CD41+/CD61+ platelet-derived EVs (p=0.03, r=-0.4176) in Model 3.
Conclusion: Based on our results, the circulating EV profile can be used as a supportive biomarker along with the conventional laboratory markers of CAD, and it enables a more sensitive, non-invasive diagnostic analysis of CAD.
Keywords:
cardiovascular disease
; circulating extracellular vesicles
; flow cytometry
; diagnosis
; supportive biomarker
; blood ectosome
; exosome
1. Introduction
Coronary artery disease (CAD) is an atherosclerotic cardiovascular disease, which is the most common cause of death worldwide [1]. Genetic, environmental, and lifestyle factors are important determinants of cardiovascular diseases (CVD) [2,3,4]. Although many risk factors are known from large clinical studies, there has been an increase in the number of biomarker studies for CVD. Biomarkers are defined as “substances, structures, or processes that can be measured in the body or its products and influence or predict the incidence of outcome or disease” according to the World Health Organization (WHO) [5]. Biomarker research has made tremendous progress in all areas of medicine, especially CVD.
Cell-derived extracellular vesicles (EV) are membrane-enclosed subcellular particles present in bodily fluids, including blood, urine, cerebrospinal fluid, and pericardial fluid [6,7]. By their biogenesis, we distinguish endosome-derived exosomes and plasma membrane derived ectosomes [8]. However, unless EVs are captured during their release, the biogenesis of EVs cannot be determined with certainty. Therefore, an operational nomenclature is suggested to be used distinguishing small-sized EVs (sEVs, average diameter around 100-150 nm), and large EVs (lEVS) including vesicles between 200-800 nm and those ≥ 1 micrometer [9]. EVs carry specific membrane and cytosolic components, the so-called specific molecule cargo. EVs perform homeostatic and cell-cell signaling functions through their special molecular composition [10,11]. Although cargo molecules including proteins, nucleic acids, and lipid entries are available in a database [12,13]. The correct interpretation of these data strongly depends on clinical conditions and sample preparation methods. On the other hand, the complex relationship between detectable biomarkers is not even completed. Numerous studies have investigated the role of CVD-associated EVs and their applicability as biomarkers [14,15,16,17,18].
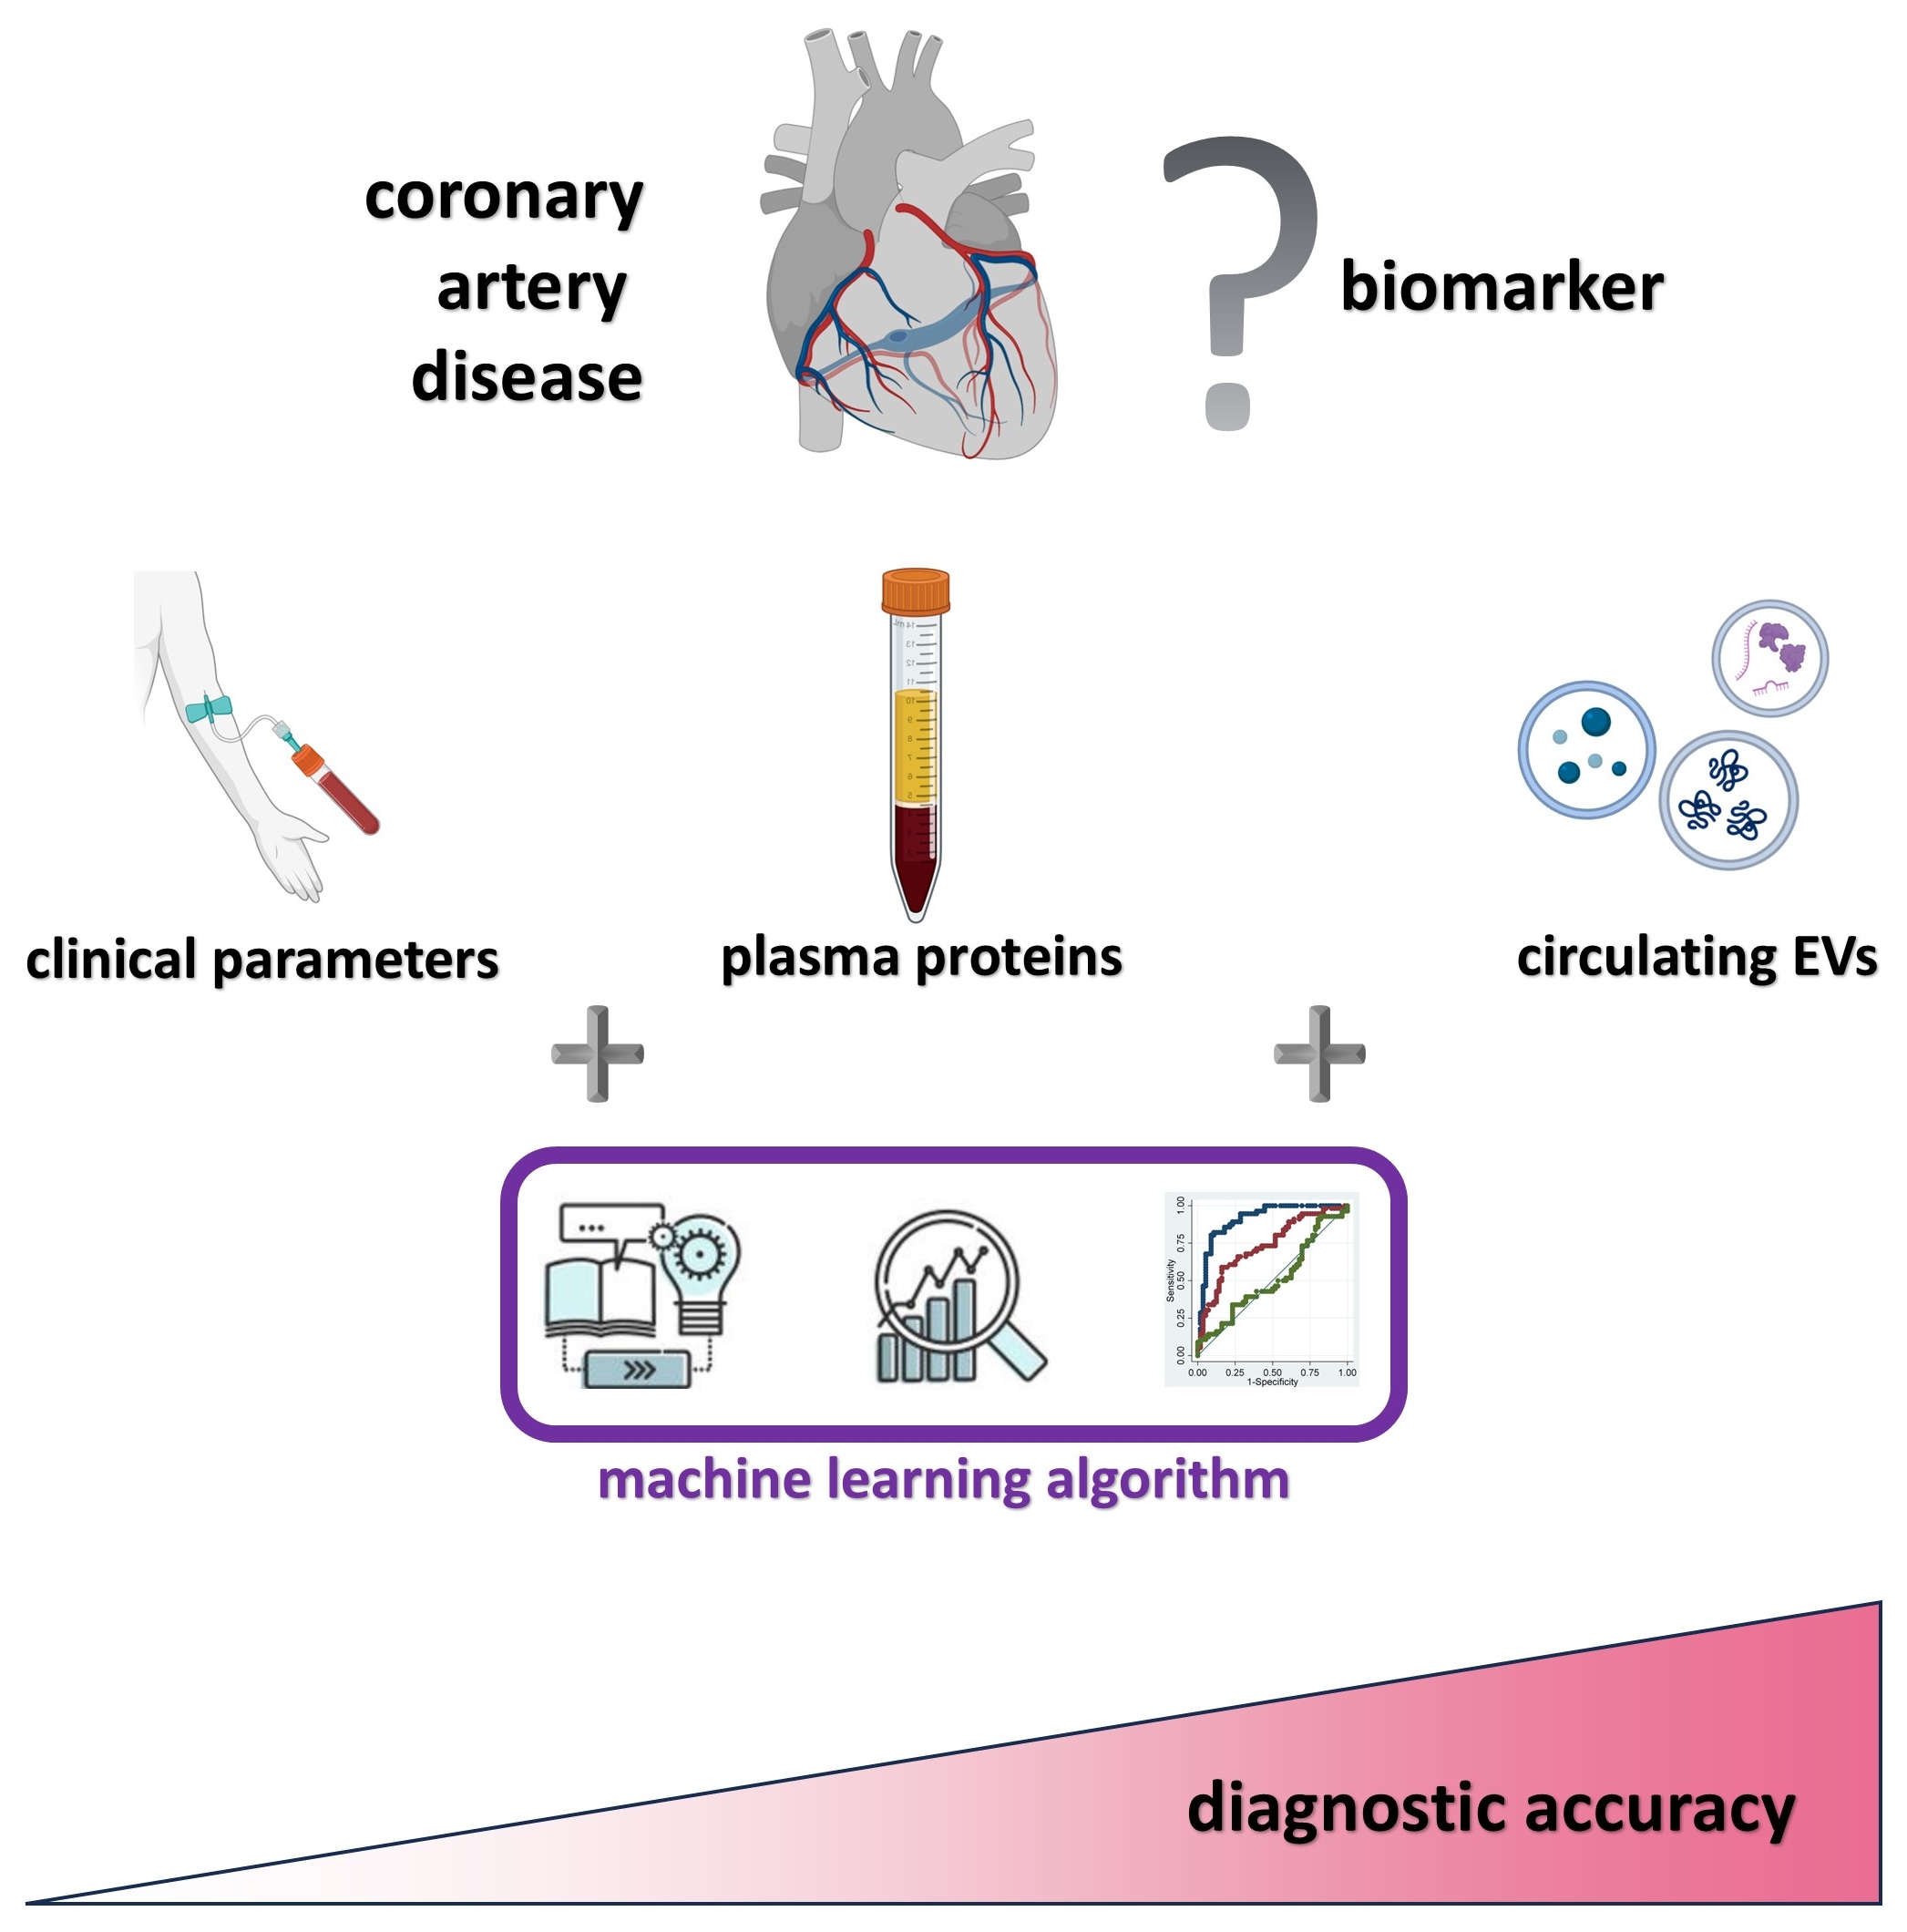
We tested the hypothesis that circulating EV patterns can provide incremental diagnostic value in addition to clinical parameters and laboratory tests in detecting CAD.
2. Materials and Methods
2.1. Patients and Sample Collection
Individuals who underwent Coronary Computed Tomography Angiography (CCTA) at the Heart and Vascular Center of Semmelweis University were retrospectively identified as CAD cases and healthy subjects. Cases were defined as patients with a Segment Involvement Score (SIS) of more than 5, while controls were patients with less than 5 of SIS. Moreover, the control (CAD negative) group was matched in age, gender, height, and body weight. Peripheral venous blood samples of 26 CAD patients and of 14 healthy age-matched control subjects were collected from the median cubital vein using the Vacutainer® Brand Plus ACD-A Tubes of Becton Dickinson (BD San Jose, California, USA). Biochemical and hematological parameters were evaluated by standardized clinical laboratory methods. Based on the guidelines and regulations of the Helsinki Declaration, each donor signed donor-informed consent. The Ethics Committee of Scientific Research of Hungary (ETT-TUKEB 192/2015) approved the study.
2.2. Flow Cytometry
Flow cytometry was used for the characterizations of circulating EVs (validation of EVs by “common” EV-markers and identification of cellular origin of EVs) and quantification of plasma GDF15. The tests were carried out using a FACSCalibur flow cytometer (BD, San Jose, CA, USA) and data were analyzed by CellQuestPro software (BD, San Jose, CA, USA).
In the cases of EV measurements, Megamix-Plus SSC (BioCytex Marseille, France) calibration beads and 1 μm Silica Beads Fluo-Green Green (Kisker Biotech GmbH & Co; Steinfurt, Germany) were used for the optimization of cytometer settings and also for definition of “EV gate” (Supplementary Figure S1).
2.3. Identification of the Cellular Origin of EVs by Flow Cytometry
Plasma samples were centrifuged at 800 g for 5 minutes to sediment any remaining cells. The supernatant was removed, and platelet poor plasma (PPP) was prepared by centrifugation at 2,500 g for 15 min, at room temperature. Platelet free plasma (PFP) was prepared from PPP samples by centrifugation at 12,500 g for 20 minutes at 16◦C (Z216 MK Microlite centrifuge, fixed angle 200.88 rotor, Hermle Labortechnik GmbH, Wehingen, Germany). PFP samples were divided into 300 L aliquots and were stored at −80°C. Cell free diluted plasma samples (1:100 in filtered PBS) were incubated with fluorochrome-conjugated monoclonal antibodies for 15 minutes at room temperature for immunophenotyping of EVs (Supplementary Table S2). Annexin V staining was carried out in 2.5 mM Ca++ containing Annexin binding buffer. Unstained diluted plasma samples and EV-free monoclonal antibody solutions (staining control) were used for evaluation of fluorescence background according to the guideline of MIFlowCytISEV [19]. Aspecific binding of fluorochrome-conjugated antibodies were examined by isotype control immunoglobulins. Differential detergent lysis by 0.1% Triton X-100 (Sigma-Aldrich) was used to confirm the vesicular nature of events, as described by György et al [20]. (Supplementary Figure S2) The absolute number of EVs was determined by adding internal counting standard beads (Count Check Beads; Partec, Germany) to the diluted plasma samples. The absolute number of EVs was calculated by the following formula:
Absolute EV Count (EVs/μL) = (detected EV events inside the EV gate - Triton X-100 resistant events) / acquired beads inside bead gate) x absolute count of Count Check beads in the tube x plasma dilution.
2.4. Flow Cytometry Multiplexed Bead-Based Immunoassays
Plasma GDF15 was quantified by bead-based flow cytometry method (AimPlex® assay technology AimPlex Biosciences, Inc, USA), according to the manufacturer’s instructions.
2.5. Enzyme-Linked Immunosorbent Assay (ELISA)
Plasma PYGM (glycogen phosphorylase, muscle associated), clusterin and CPN1 (carboxypeptidase N subunit 1) levels were determined by ELISA immunological assay method. PYGM concentration was measured by the Human PYGM (Glycogen Phosphorylase, Muscle) ELISA Kit (Elabscience Biotechnology Houston, Texas), and CPN1 concentration was determined by Human Carboxypeptidase N1 ELISA Kit (CPN1) of ABclonal Technology company (California, USA). Clusterin concentration was assessed by the Human CLU / Clusterin ELISA Kit (Sigma, St Louis, MO, USA) according to the instructions of manufacturers.
2.6. Statistical Analysis
Continuous variables were expressed as mean (SD) and compared using t-test or Mann-Whitney U test, according to normal or non-normal distribution. Categorical variables were expressed as numbers (percentage). Comparisons among variables between control and CAD groups was performed using Pearson’s chi-square test (or Fisher’s exact test) for continuous variables, and Mantel-Haenszel Chi-square test for categorical and ordinal data, respectively. All continuous predictor variables were standardized to allow for direct comparison. Missing data was imputed using multiple imputation.
Logistic regression was performed to evaluate the association of the common clinical parameters, plasma protein biomarkers and the EV biomarkers with the outcome of CAD diagnosis.
Three models were built to evaluate the incremental predictive value of the plasma proteins and EV biomarkers. The first model involved only the baseline clinical covariates (Model 1); then the plasma protein biomarkers were integrated (Model 2); and finally, EV biomarkers were added to complete the model system (Model 3). Area Under Curve (AUC) values and Receiver Operating Characteristic (ROC) curves were calculated for each model and the contribution of each analyte to the change in AUC value was determined.
To determine the relationships between the EV biomarkers, plasma biomarkers and conventional clinical parameters, Pearson’s correlation coefficients were calculated. A p value <0.01 was defined as significant (2-tailed). Statistical analysis was performed using SAS software version 9.4.
3. Results
3.1. Patient Population
The study design is presented in Figure 1. Of the 40 total patients, 26 were diagnosed with CAD (mean age 68±1.8) and 14 were healthy control patients (mean age 62±2.6). Baseline characteristics of the patient population are shown in Supplementary Table S1. Height, monocytes, red blood cells, creatine kinase, LDH, hemoglobin, hematocrit, and mean corpuscular hemoglobin concentration (MCHC) were significantly different between the two groups (p<0.05). The coronary CT angiography (CCTA) results of cases and controls were all significantly different between the CAD and control groups (Supplemental Figure S3).
3.2. Circulating Plasma Proteins
Based on the results of animal experiments, we selected those proteins that distinguished the hypoxic and healthy groups, including muscle glycogen phosphorylase (PYGM), clusterin and CPN1 [21,22,23,24,25]. The clinical relevance of GDF15 has been confirmed by numerous earlier studies [26,27,28], therefore, we also investigated its concentration in our patient groups. Significantly elevated levels of GDF15 (CAD:1600 ± 188 pg/mL; control: 1003 ± 94.1 pg/ml; p=0.039) and CPN1 (CAD: 142,5 ± 4.7 pg/ml; control:126.2 ± 6.2 pg/mL; p=0,04) could be detected in coronary artery disease patients, but the plasma concentrations of PYGM (CAD: 7,740 ± 4,45 ng/mL; control: 1,213 ± 0,76 ng/ml; p>0,05) and clusterin (CAD: 972.4 ± 246.8 pg/mL; control: 942,4 ± 306 pg/mL; p>0,05) did not differ compared to the control individuals. Although the correlation analysis showed that the concentration changes of the detected plasma proteins were independent, the ROC analysis of GDF15 and CPN1 (Figure 2) validated that these parameters can distinguish the two diagnostic groups. According to the correlation matrix analysis, the investigated proteins were identified as independent variables. The distribution of the measured plasma proteins in control and CAD patients are illustrated in Supplemental Figure S4.
3.3. Circulating EV Pattern in Human Plasma Samples
Platelet-derived EVs were specified by CD41 (alpha IIb integrin, platelet GPIIb) and CD61 (platelet glycoprotein GPIIIa), while activated platelet-derived EVs were determined by the CD62P (P-selectin / GMP-140 / PADGEM) expressions. EVs secreted by endothelial cells were identified by the exofacial presence of CD31 (platelet endothelial cell adhesion molecule /PECAM-1). CD14 (co-receptor for bacterial lipopolysaccharide) was used for the classification of monocyte–derived EVs, and CD142 (coagulation factor III / thromboplastin) for the analysis of tissue factor expressing procoagulant vesicles. CRP-associated circulating EVs were also measured. Fluorchrome-labelled annexinV binding was used as a “common EV marker”, although its positivity also reflects activation in the case of platelet–derived EVs [29]. The distribution of the EV biomarkers in control and CAD patients is illustrated in Supplemental Figure S5.
Incremental diagnostic value and correlations of plasma proteins and EV biomarkers ROC analysis was performed to assess the diagnostic value of the selected plasma proteins and EV biomarkers. The AUC values were used to analyze the diagnostic accuracy of the tests, i.e. how well the detected parameters differentiate the patient groups.30 The AUC values were 0.68 in Model 10.77 in Model 2, and 0.84 in Model 3 (Figure 2). The variables with the greatest impact on the AUC values were Hemoglobin 0.2 (0.16-0.26) in Model 1, CPN1 0.12 (0.09-0.14) in Model 2, and circulating CD41+/CD61+ EVs 0.31 (0.15-0.5) in Model 3) (Supplemental Figure S6).
4. Discussion
In the present study, we characterized the circulating EV pattern of patients with CAD from the perspective of cells involved in the pathomechanism of the disease, completed with vesicular markers of hypoxia-reperfusion injury. We hypothesized that the complementation of conventional CAD risk factors with plasma protein markers and the circulating EV pattern can result in a more sensitive prediction system.
Diagnosis of CAD is usually based on imaging in combination with laboratory testing. It would be beneficial if CAD could be detected before imaging studies are performed and could be attenuated prior to irreversible complications or death. This could be accomplished through a potent biomarker panel to detect CAD. Traditional serum biomarkers are valuable because they allow for earlier diagnosis of disease and can be measured relatively easily [31].
Several working groups are looking for potential EV-associated biomarkers in CVD [32,33]. A recent study used multicolor flow cytometry for the identification of the cellular origin of circulating EVs [34]. In our study, we compared the circulating EV patterns of CVD patients and healthy controls, to detect markers capable of distinguishing them from each other. We found that the absolute number of circulating CD142 +, and CD31 + EVs could clearly distinguish the CAD patients from the control individuals. Significantly elevated levels of CPN1 could be detected in coronary artery disease patients and the ROC analysis of CPN1 validated, that this parameter can also distinguish the two diagnostic groups.
Based on our results, circulating EV profiles can be used as an additional biomarker along with the conventional laboratory markers of CAD, which may enable a more sensitive, non-invasive diagnosis of CAD. In addition to their diagnostic significance, our results contribute to a better understanding of both the pathophysiology and biological mechanisms of CAD.
5. Conclusions
Based on our results, we recommend integration of the detection of CRP-associated, circulating platelet-, endothelial cell- and monocyte-derived EVs, and plasma CPN1 concentrations to the CAD diagnostic/prognostic panel as supportive biomarkers.
Supplementary Materials
Table S1: Clinical parameters of patients Table S2: List of antibodies and dyes used for immunofluorescence studies. Figure S1 Instrument settings: Figure S2: Flow cytometric analysis of EVs according to MIFlowCyt guidelines, Figure S3: CTTA parameters of control and CAD groups. Figure S4: Plasma proteins in cases and controls. Figure S5: EVs in the blood of cases and controls, Figure S6: Feature importance ranking.
Author Contributions
PMG, HH, and EP designed the study. NF and EP performed all experimental measurement (ELISA, flow cytometry), CT angiography was made by PMH, ZSD and BM. PMG, HH, EP and LM performed statistical analysis and wrote the manuscript. EIB and EP supervised the study and corrected and approved the final manuscript. All authors have read and approved the final manuscript.
Funding
Please add This research was funded by the NVKP_16-1-2016-0004 grant of the Hungarian National Research, Development and Innovation Office (NKFIH), VEKOP-2.3.2-162016-00002, VEKOP-2.3.3-15-2017-00016, the Therapeutic Thematic Programme TKP2021-EGA-23. This study was also supported by the grants RRF-2.3.121-2022-00003 (National Cardiovascular Laboratory Program) and 2019-2.1.7-ERA-NET-2021-00015. The project has received funding from the EU’s Horizon 2020 Research and Innovation Programme under grant agreement No. 739593
Institutional Review Board Statement
Not applicable
Informed Consent Statement
Informed consent was obtained from all subjects involved in the study. Written informed consent has been obtained from the patient(s) to publish this paper.
Data Availability Statement
Our data are available on request from the Institute's repository. The datasets used and/or analyzed during the current study are available from the corresponding author upon reasonable request.
Acknowledgments
No.
Conflicts of Interest
The authors declare no conflicts of interest The funders had no role in the design of the study; in the collection, analyses, or interpretation of data; in the writing of the manuscript; or in the decision to publish the results.
References
- Nowbar AN, Gitto M, Howard JP, Francis DP, Al-Lamee R. Mortality From Ischemic Heart Disease. Circ Cardiovasc Qual Outcomes. 2019;12(6): e005375. [CrossRef]
- Malakar AK, Choudhury D, Halder B, Paul P, Uddin A, Chakraborty S. A review on coronary artery disease, its risk factors, and therapeutics. J Cell Physiol. 2019;234(10):16812-16823. [CrossRef]
- Girelli D, Martinelli N, Peyvandi F, Olivieri O. Genetic architecture of coronary artery disease in the genome-wide era: implications for the emerging "golden dozen" loci. Semin Thromb Hemost. 2009 ;35(7):671-82. [CrossRef]
- Ojeda-Granados C, Campisi E, Barchitta M, Agodi A. Genetic, lifestyle and metabolic factors contributing to cardiovascular disease in the Italian population: a literature review. Frontiers in Nutrition. 2024; 04(11):1-10. doi=10.3389/fnut.2024.1379785.
- WHO International Programme on Chemical Safety Biomarkers in Risk Assessment: Validity and Validation. 2001; RetrEVed from http://www.inchem.org/documents/ehc/ehc/ehc222.htm.
- Buzas EI. The roles of extracellular vesicles in the immune system. Nat Rev Immunol. 2023;23(4):236-250. [CrossRef]
- Margolis L, Sadovsky Y. The biology of extracellular vesicles: The known unknowns. PLoS Biol. 2019;17(7): e3000363. https://doi.org/10.1371/journal.pbio.3000363.
- Théry C, Zitvogel L. & Amigorena S. Exosomes: composition, biogenesis and function. Nat Rev Immunol. 2002;2:569–579. https://doi.org/10.1038/nri855.
- Welsh JA, Goberdhan DCI, O'Driscoll L, et al. Minimal information for studies of extracellular vesicles (MISEV2023): From basic to advanced approaches. J Extracell Vesicles. 2024;13(2):e12404. [CrossRef]
- Somiya, M. Where does the cargo go? Solutions to provide experimental support for the “extracellular vesicle cargo transfer hypothesis”. J. Cell Commun. Signal. 2020;14(2):135-146. [CrossRef]
- Kowal J, Arras G, Colombo M, et al. Proteomic comparison defines novel markers to characterize heterogeneous populations of extracellular vesicle subtypes. Proc Natl Acad Sci U S A 2016; 113(8):968-977. [CrossRef]
- Kalra H, Simpson RJ, Ji H, et al. Vesiclepedia: A compendium for extracellular vesicles with continuous community annotation. PLoS Biology. 2012;10(12):e1001450. Epub 2012 Dec 18. [CrossRef]
- Kim DK, Lee J, Kim SR, et al. EVpedia: a community web portal for extracellular vesicles research. Bioinformatics. 2015;31(6):933-9. Epub 2014 Nov 10. [CrossRef]
- Usta AH, Akbas F, Aral H. Relationship between circulating microparticles and hypertension and other cardiac disease biomarkers in the elderly. BMC Cardiovasc Disord. 2019;19(1):164. [CrossRef]
- Chong SY, Lee CK, Huang C, et al. Extracellular Vesicles in Cardiovascular Diseases: Alternative Biomarker Sources, Therapeutic Agents, and Drug Delivery Carriers. Int J Mol Sci. 2019;20(13):3272. [CrossRef]
- Jansen F, Nickenig G, Werner N. Extracellular Vesicles in Cardiovascular Disease; Potential Applications in Diagnosis, Prognosis, and Epidemiology. Circulation Research. 2017;120:(10):1649-1657. [CrossRef]
- Osteikoetxea X, Németh A, Sódar BW, Vukman KV, Buzás EI. Extracellular vesicles in cardiovascular disease: are they Jedi or Sith? J Physiol. 2016;594(11):2881-2894. [CrossRef]
- Verwer MC, Mekke J, Timmerman N, et al. Comparison of cardiovascular biomarker expression in extracellular vesicles, plasma and carotid plaque for the prediction of MACE in CEA patients. Sci Rep. 2023;13(1):1010. [CrossRef]
- Welsh JA, Van Der Pol E, Arkesteijn GJA, et al. MIFlowCyt-EV: a framework for standardized reporting of extracellular vesicle flow cytometry experiments. J Extracell Vesicles. 2020;9(1):1713526. [CrossRef]
- György B, Módos K, Pállinger E, et al. Detection and isolation of cell-derived microparticles are compromised by protein complexes resulting from shared biophysical parameters. Blood. 2011;117(4):e39-e48. [CrossRef]
- Osteikoetxea X, Benke M, Rodriguez M, et al. Detection and proteomic characterization of extracellular vesicles in human pancreatic juice. Biochem Biophys Res Commun 2018;499(1):37-43. [CrossRef]
- Turiák L, Misják P, Szabó TG, et al. Proteomic characterization of thymocyte-derived microvesicles and apoptotic bodies in BALB/c mice. J. Proteomics. 2011;74(10):2025-33. [CrossRef]
- Cox J, Mann M. MaxQuant enables high peptide identification rates, individualized p.p.b.-range mass accuracies and proteome-wide protein quantification. Nat Biotechnol. 2008 ;26(12):1367-72. [CrossRef]
- Hajian-Tilaki K. The choice of methods in determining the optimal cut-off value for quantitative diagnostic test evaluation Stat Methods Med Res. 2018;27(8):2374-2383. [CrossRef]
- Shah R, Patel T, Freedman JE. Circulating Extracellular Vesicles in Human Disease. N Engl J Med. 2018;379(10):958-966. [CrossRef]
- Kempf T, Wollert KC. Growth differentiation factor-15: a new biomarker in cardiovascular disease. Herz. 2009;34(8):594-599. [CrossRef]
- Adela R, Banerjee SK. GDF-15 as a Target and Biomarker for Diabetes and Cardiovascular Diseases: A Translational Prospective. J Diabetes Res. 2015; 2015:490842. [CrossRef]
- Wang J, Wei L, Yang X, Zhong J. Roles of Growth Differentiation Factor 15 in Atherosclerosis and Coronary Artery Disease. J Am Heart Assoc. 2019;8(17):e012826. [CrossRef]
- French SL, Butov KR, Allaeys I, et al. Platelet-derived extracellular vesicles infiltrate and modify the bone marrow during inflammation. Blood Adv. 2020;4(13):3011-3023. [CrossRef]
- Zhang Z, Castelló A. Principal components analysis in clinical studies. Ann Transl Med. 2017;5(17):351. [CrossRef]
- Cassar A, Holmes DR Jr, Rihal CS, Gersh BJ. Chronic coronary artery disease: diagnosis and management. Mayo Clin Proc. 2009;84(12):1130-1146. [CrossRef]
- Maas SLN, Breakefield XO, Weaver AM. Extracellular Vesicles: Unique Intercellular Delivery Vehicles. Trends Cell Biol. 2017;27(3):172-188. [CrossRef]
- Fu S, Zhang Y, Li Y, et al. Extracellular vesicles in cardiovascular diseases. Cell Death Discov. 2020; 30:6:68. eCollection 2020. [CrossRef]
- Hegyesi H, Pallinger É, Mecsei S, et al. Circulating cardiomyocyte-derived extracellular vesicles reflect cardiac injury during systemic inflammatory response syndrome in mice. Cellular and Molecular Life Sciences. 2022;79(2):84. uthor 1, A.B.; Author 2, C.D. Title of the article. Abbreviated Journal Name Year, Volume, page range. [CrossRef]
Figure 1.
Study design.Selection of CAD and control patients. Study rationale for the prognostic biomarker study. CAD coronary artery disease, AUC area under the curve.
Figure 1.
Study design.Selection of CAD and control patients. Study rationale for the prognostic biomarker study. CAD coronary artery disease, AUC area under the curve.
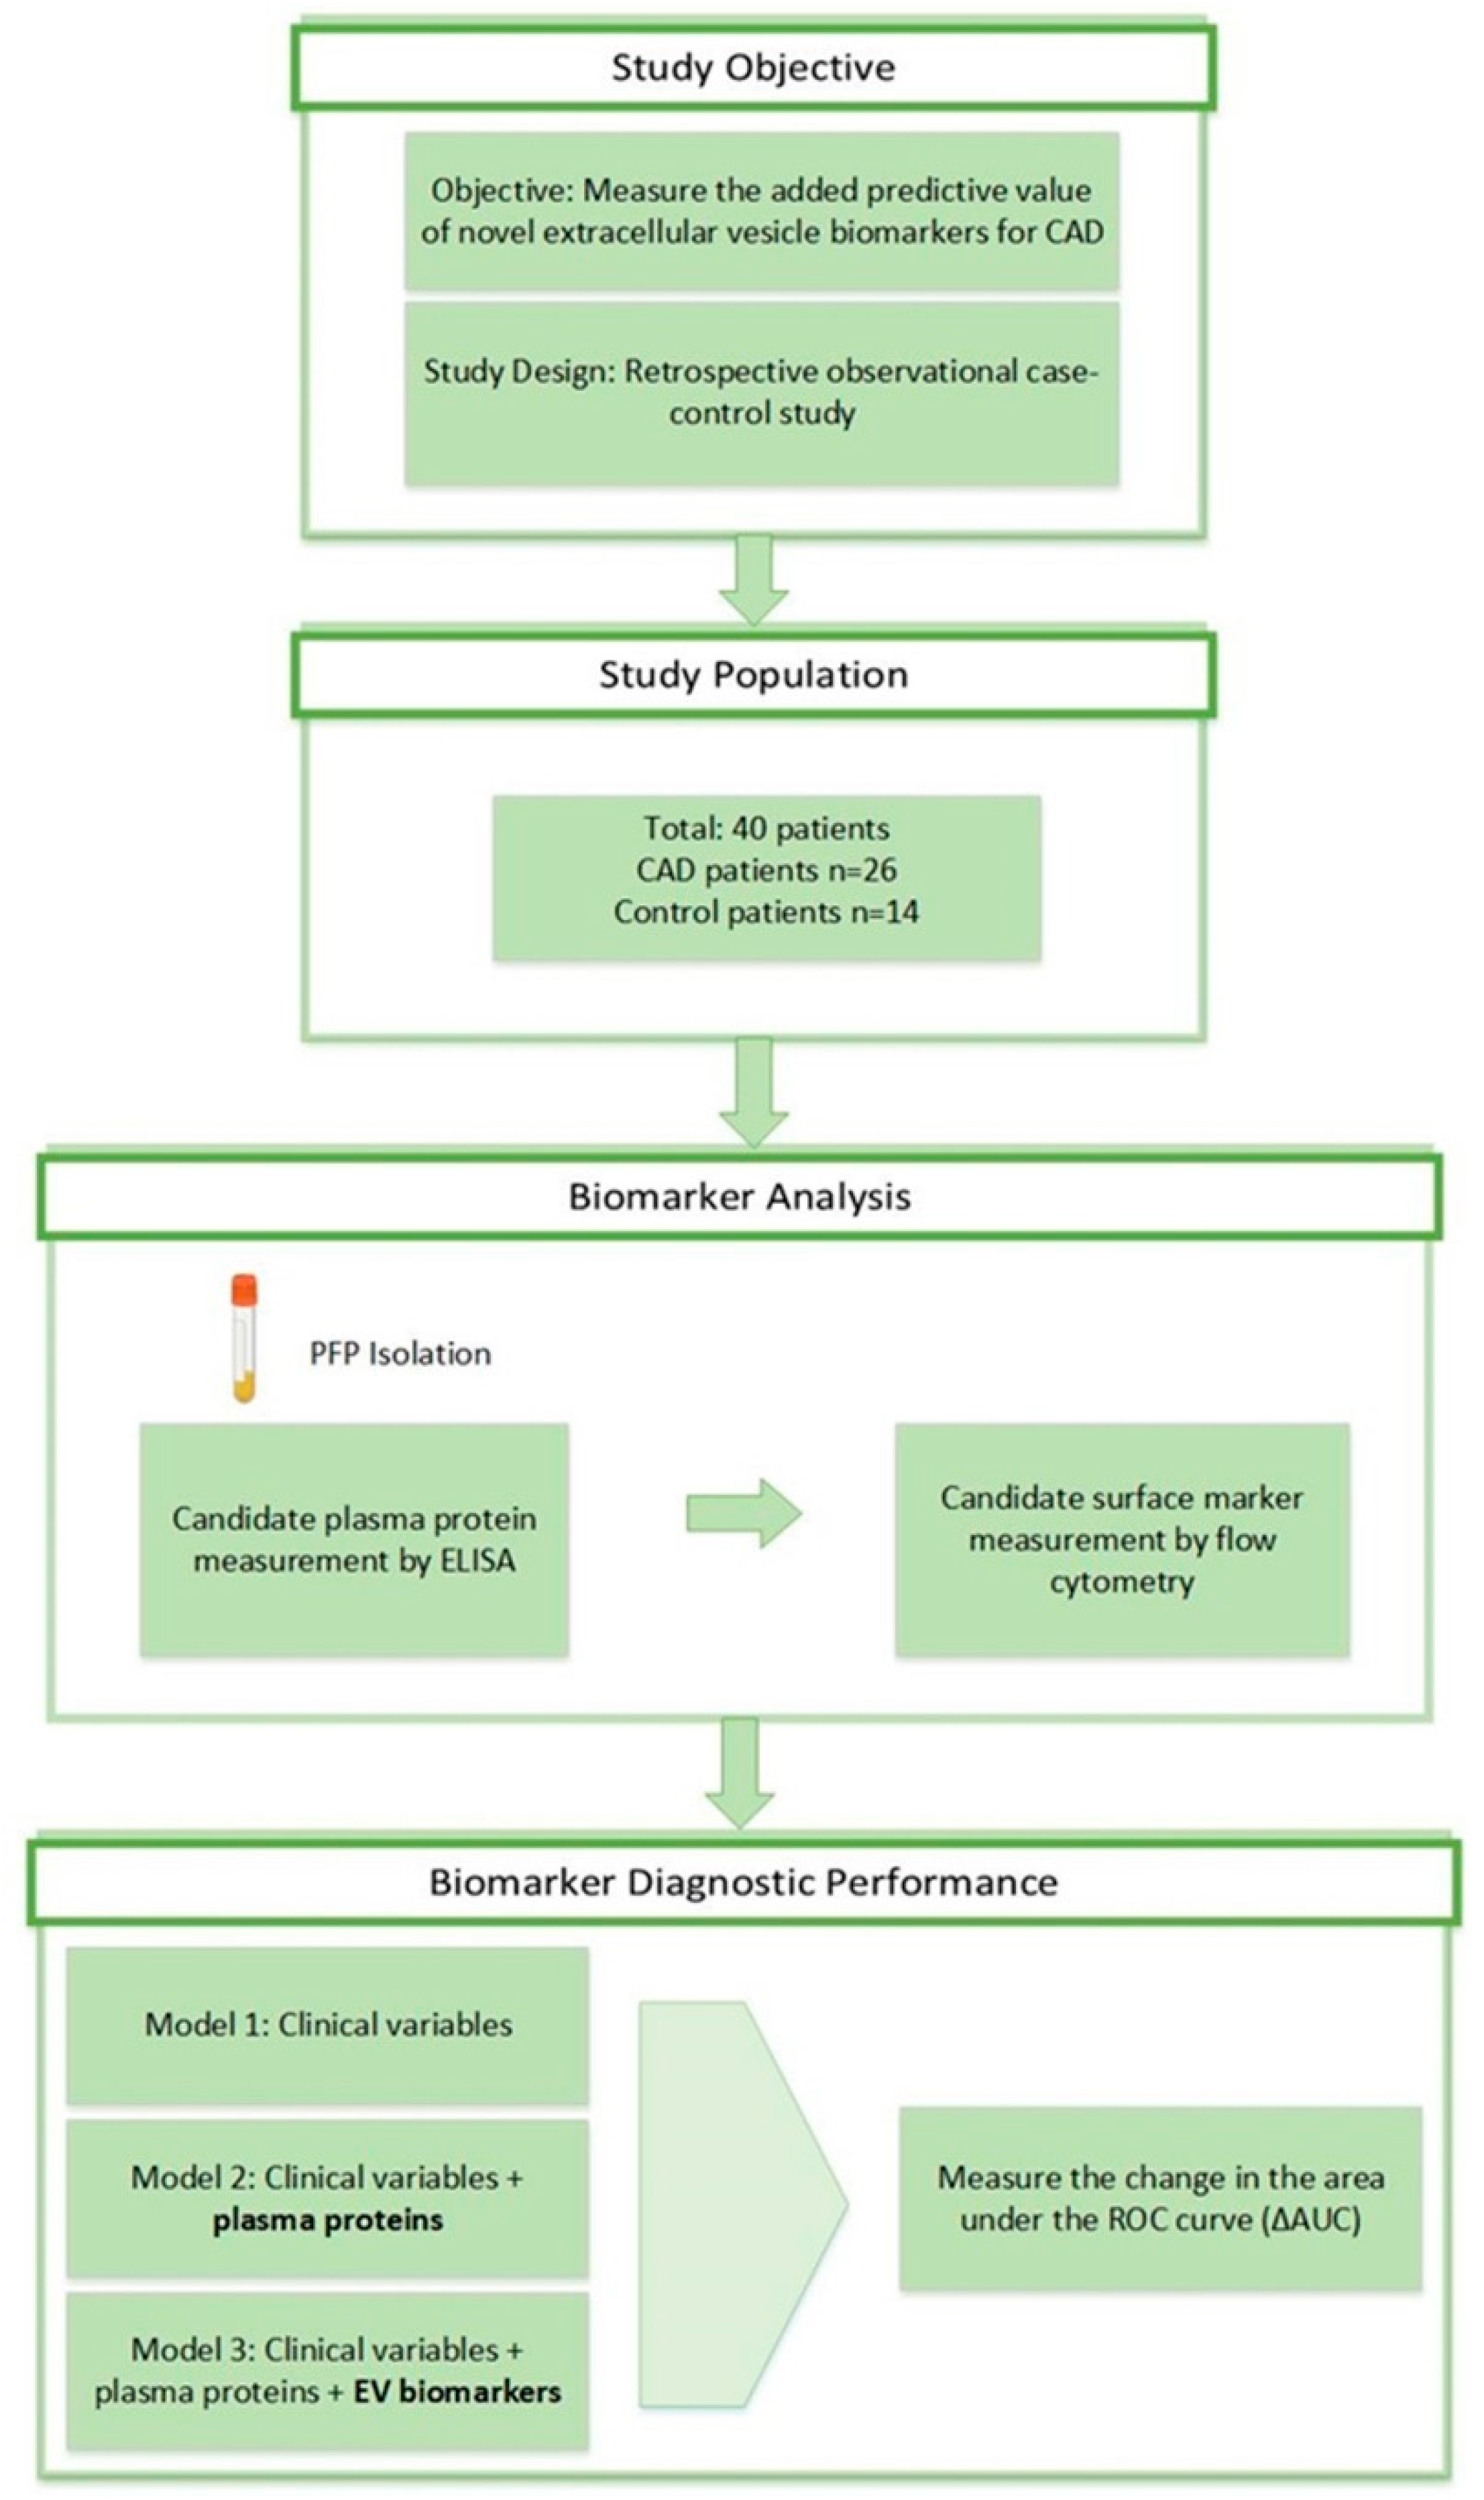
Figure 2.
ROC Curves to predict measures of CAD in the tree models. Discrimination analysis for extracellular vesicle (EV) biomarkers for predicting coronary artery disease diagnosis represented by areas under the receiver operating characteristic (ROC) curve.his is a figure. Schemes follow the same formatting.
Disclaimer/Publisher’s Note: The statements, opinions and data contained in all publications are solely those of the individual author(s) and contributor(s) and not of MDPI and/or the editor(s). MDPI and/or the editor(s) disclaim responsibility for any injury to people or property resulting from any ideas, methods, instructions or products referred to in the content. |
© 2024 by the authors. Licensee MDPI, Basel, Switzerland. This article is an open access article distributed under the terms and conditions of the Creative Commons Attribution (CC BY) license (http://creativecommons.org/licenses/by/4.0/).
Copyright: This open access article is published under a Creative Commons CC BY 4.0 license, which permit the free download, distribution, and reuse, provided that the author and preprint are cited in any reuse.


