Submitted:
17 October 2024
Posted:
17 October 2024
You are already at the latest version
Abstract
Generally playing group management performance and financial management performance of sports clubs are assessed separately. We adopt a non-parametric methodology to assess overall performance first conceptualising overall management as a production process comprising of two serially-linked subprocesses; playing group management and financial management. Thereafter, we decompose overall performance to obtain estimates of performance at the subprocess level. Through this procedure it is possible to determine whether it is a sports club’s on-field performance or off-field performance or both may contribute towards its inefficiency, if any, in overall management. Further, a model is developed to determine targets for inefficient clubs to become overall efficient. The method is applied to 18 clubs in Australian rules football league. In 2021 season, the results reveal that on-field performance, on average, is better than off-field performance and variability in off-field performance is higher than that of on-field performance. Observed overall management inefficiency is mainly due to inefficiency in financial management. Results are robust to weighting scheme adopted in overall efficiency configuration.
Keywords:
Performance appraisal
; data envelopment analysis
; overall management efficiency
; on-field management efficiency
; off-field management efficiency
1. Introduction
Australian rules football (ARF) is a contact sport played by two teams each comprising of eighteen players. Australian Football League (AFL) is the highest level senior men's ARF competition in Australia. ARF is a highly competitive team sport played predominantly in Australia. It is gaining popularity in Canada, Unites States and Europe. ARF has its own rules and, in many ways, may be considered as a unique sport.
The aim of this paper is to determine how efficiently AFL clubs are managed and suggest pathways for performance improvement for inefficiently managed clubs. A sporting club’s overall performance to a great extent depends on the skill of coaches, players and administration. They are responsible for on-field and off-field performance. Where we differ from previous studies of sports club performance is that we assess overall club performance incorporating both these aspects under a unified framework. In the literature, it is the on-field performance that gets much of the attention. How a club performs overall considering both on-field and off-field performance as a collective receive less attention in the literature. In this paper, we attempt to fill this void.
The methodology that we adopt to assess performance is data envelopment analysis (DEA). In DEA, management process of an entity (in our case, an AFL club) is conceptualized as a production process. Application of DEA for sports team performance appraisal is not new. Such studies are found in different sporting codes. However, most studies focus on soccer. Examples of studies that use DEA for sports team performance are [1,2,3,4,5,6,7,8,9,10,11,12]. For a review of DEA application in sports, see [13]. Our study adds to sports club performance appraisal using DEA literature with evidence from a different sporting code- ARF.
An extension of DEA is network DEA. In network DEA, a production process is conceptualized as comprising of multiple subprocesses. In the case of sports club management, we conceptualize overall management as a production process comprising of two subprocesses; playing group management (PGM) and financial management (FM). In DEA literature, subprocesses are also referred to as stages. Here, we deal with a two-stage process. The two stages are assumed linked serially with PGM as the first stage and FM as the second stage. The idea is to develop a DEA model to assess club overall performance and decompose at the stage level. Thereby, we are able to determine how a club performs overall and from two different management perspectives. How well a sporting team manages its resources to generate on-filed performance is useful information to coaching staff and how well a club manages off-field operations to generate revenue is useful information to club administration. In addition, we develop a DEA model to determine a pathway for a club that performs inefficiently to become efficient in overall management. Through the empirical investigation, we attempt to answer the questions; how efficiently a sports club manages its resources overall, in PGM (on-field activity management) and FM (off-field activity management). Established clubs generate revenue in many ways such as through merchandise sales, sponsorship deals and ticket sales. Some AFL clubs have limited resources due to small membership (fanbase) and their inability to attract lucrative sponsorship deals. Profitability also varies across AFL clubs. AFL has introduced measures to balance out financial-disparity across clubs through equalization measures such as revenue sharing. AFL has taken measures also to even out on-filed competition through salary caps and draft rules. These measures are intended to assist relatively poor performing clubs. When sports clubs operate under adverse financial and economic conditions, resource management becomes even more challenging. This study intends to provide sports club management teams information that they may find useful in PGM and FM. Some studies consider detailed information on the play to explain match performance [14]. Another area of study is assessing effectiveness of playing strategies or tactics adopted by the teams [15,16,17,18]. Further, there is evidence of using various algorithms and machine learning techniques for performance prediction. See for example, [19]. These studies investigate key areas that reveal information useful in player selection and strategizing game plans. All of these studies focus on on-field performance.
Using DEA for performance appraisal has advantages. Briefly, DEA is a non-parametric frontier technique. Being non-parametric, there is no requirement to prespecify a functional form for the efficient frontier. DEA establishes frontier from known levels of attainment. Performance of a club is assessed with respect to the established frontier of best performance. Hence, DEA assesses relative performance. Further, DEA can assess performance in a multidimensional framework by accommodating multiple inputs and multiple outputs. Network DEA can also uncover which of on-field and off-field management may require more attention in overall management.
We assess performance using output-oriented DEA models under the variable returns to scale (VRS) technology assumption. VRS implies all clubs may not have access to the same level of technology. Given the significant differences in total assets of clubs, it is plausible that some clubs have access to advanced technology such as training facilities that may enhance their chances to excel on-field performance. Differences in training facilities may be attributed to availability of resources and budget. Rich clubs often have state-of-the-art facilities. When assessing sports team performance using DEA, revenue and points earned are invariably used as output. An objective of PGM is increasing points earned and an objective of FM is increasing revenue. Hence it is reasonable to assume that output augmentation is more important than input conservation.
The rest of the paper is organized as follows. In the next section, we provide a brief description of Australian rules football and review the literature on performance appraisal of sporting teams with special reference to DEA. Section 3 discusses development of a network DEA model under the proposed two-stage framework and Section 4 presents the empirical framework. Section 5 demonstrates application of the proposed model and Section 6 discusses robustness of the results. The paper concludes in Section 7.
2. Model Development
We conceptualise AFL club overall management process as a serially linked two-stage production process as depicted in Figure 1. Stage A is the PGM process and stage B is the FM process. Generally, PGM process includes activities associated with coaching staff managing the playing group with available resources and FM process includes activities associated with income generation and fanbase expansion given an outcome of the PGM process. Our aim is to assess overall and stage-level performance assuming the two-stage process operates under VRS technology. As shown in Figure 1, PGM and FM processes are linked through variables that plays a dual role. That is, certain stage A output variables serves as input at stage B. In DEA, such variables are referred to as intermediate variables. In this paper, we conceptualize overall AFL club management process as a production process comprising of two functionally different subprocesses (PGM- stage A and FM- stage B) linked through intermediate variables. Individual stages are also conceptualized as production processes. When formulating DEA models at the stage level, we consider output-oriented models. This is driven by the nature of variables selected for stages A and stage B operations. In both stages, we consider that output augmentation is more appropriate than input conservation. When developing a DEA model to assess relative performance of overall management process comprising of subprocesses, an assumption has to be made on how individual stage-level performance contribute towards overall performance. Following Wang and Chin (2010), we express overall efficiency as harmonic average of stage-level efficiencies. In DEA, appraised entities are referred to as decision-making units (DMUs).
Let n = the number of DMUs appraised, = the number of independent inputs at stage A, denote stage A inputs of , = the number of independent inputs at stage B, denote independent inputs of at stage B, = the number of intermediate variables that links stage A to stage B, denote intermediate variables of , = the number of independent outputs at stage A, denote outputs of at stage A, = the number of independent outputs at stage B, and denote outputs of at stage B.
When stage-level operations are assumed independent, stage-level relative efficiencies of , and , under output-orientation and VRS assumption can be obtained using models (1) and (2).1
Subject to , ; unrestricted
Subject to ; unrestricted
As shown in Figure 1, stage A and stage B are linked. Therefore, when determining overall-efficiency of the two-stage process, individual stages cannot not be considered as independent. Hence, some form of aggregation of stage-level efficiencies is required. In this case, following [20] and [21], we express overall-efficiency of the two-stage process, labelled , as a weighted harmonic average of stage A efficiency and stage B efficiency . That is where and are user specified weights and add to 1. [20] use harmonic average under the CRS assumption. [21] use harmonic average under the VRS assumption. Both these studies assess stage-level efficiency using output-oriented DEA models. Harmonic weighted mean is a valid aggregation procedure because DEA efficiency scores may be interpreted as ratios. Common approach in weight selection is to define weights so that aggregated efficiency would be fractional linear. We define the weights as proportion of implied value of stage-level output to sum of the implied values of outputs of both stages. Definition of weights as ratio of the implied value of the outputs of the stage to the total implied value of the outputs of both stages is a reasonable assumption in the output-oriented case because the objective of such models is to achieve the efficient frontier through output augmentation [22]. Further, we assume that the multipliers associated with intermediate variables, and are the same (say ) when they are used as input and as output. This is common in DEA-based performance appraisal of serially linked multi-stage processes. See for example, [23,24,25]. An implication of this assumption is that implied value of an intermediate variable as output at stage A is equal to its implied value as an input at stage B. Then, for DMU0, stage A weight would be and stage B weight would be and the harmonic weighted average of the two stage-level efficiencies is . This simplifies to .
We estimate in model (3).
Subject to , ; unrestricted
and are lower bounds on the weights, and . For example, when the weights are unrestricted, and when the weights are assumed equal, . Model (3) is a fractional linear programming model and may be linearized by adopting Charnes-Cooper transformation [26]. See Appendix A. Let ,, , ,, denote optimal decision variable values and denote optimal value of a solution to model (3). Then, the overall-efficiency of the two-stage process is given by . Efficiencies of stage A and B denoted by and may be obtained as and . and obtained this way may not be unique. One way of resolving this issue is to treat one of the two stages as the preferred stage as in [24]. See Appendix B.
Proposition 1.DMU0 is overall efficient if and only if stage A and stage B are efficient.
Proof of Proposition 1. Consider model (3). Model (3) is solved considering its linear programming counterpart where is a constraint. If stage A and B are efficient, and . Hence, follows . Now we have numerator and denominator of the objection function of model (3) is 1. Now suppose that DMU0 is overall efficient. Then, as , we have leading to . Re-arranging the terms we obtain . From the first and the second constraints of model (3), we have that each component in the round brackets are non-negative. Hence their sum is zero only when each component is zero suggesting stage A and stage B are efficient. □
This means, under our modelling framework, a club may be overall efficient, if an only if it manages on-field and off-field operations efficiently. It is possible that a club which is not overall efficient is efficient either on-field or off-field operations and inefficient in the other or inefficient in both operations. Improving efficiency in different types of operations require different sets of management skills. In the proposed analytical framework, is possible to determine which of the two operations (on-field and off-field) render a club overall inefficient.
2.1. Empirical Framework
In total, we selected three input variables, two output variables and one intermediate variable. Stage A is a process comprising of two inputs and two outputs and stage B is a process comprising of two inputs and one output as shown in Figure 2. One output of stage A serves as an input of stage B and hence it serves as an intermediate variable that links stage A and stage B. The two output variables proxy athletic output and commercial output. [27] alludes to three outputs that a football club may aspire to satisfy. They are athletic output, commercial output and social output. In DEA application, number of variables used is constrained by sample size. A norm is three times the number of input-output variables used should not exceed sample size. If not, discriminatory power of DEA may diminish. In our empirical analysis we investigate performance of 18 clubs. Hence, to be in line with this norm, we restrict the number of variables to six. As a consequence, social output is not accommodated in overall performance appraisal.2
We regard stage A as a process that utilises financial resources available for football operations to train the players for on-field success. Stage A inputs are football operation expenses and AFL distribution. AFL distribution is funding that a club receives from the AFL.3 These funds generally vary from one club to another. They are given to clubs by the AFL based on their financial need to level out the competition. Invariably, new clubs receive the most funding. Football operation expenses include wages paid to coaching staff and players, travelling expenses, administration expenses and expenditure on facilities used in playing group management. We investigate performance in the cross-section and hence we do not model time lag between playing field achievement and availability of financial resources. Moreover, as money spent on construction and renovation of stadiums incur at different points in time we do not consider such expenses in the analysis. We postulate that football operation expenses and AFL distribution reflect funds available within the year for football operations in that year.
Playing group return is captured through playing group rating and points earned in the regular national competition. At the end of the season all players who took part in the competition are ranked by Stats Insider.4 We compute for each club a composite score labelled ‘playing group rating’ based on their individual player ratings. To compute playing group rating, we consider the players who are ranked between 1 (top rank) and 560. One club had only 28 players ranked within 1 and 560 and therefore we compute playing group rating of each club by averaging the ratings of its highest ranked 28 players. Playing group rating may be viewed as a proxy for technical ability of the playing group. Points earned is a commonly used measure of on-field performance. Inefficiency in stage A operations implies that finances available for football operations is not utilised to its full potential for on-field success and playing group technical ability improvement.
Stage B is a process that generates commercial output. We proxy commercial output with revenue. Revenue includes membership fees, corporate marketing, sponsorships, sale of merchandise, gate receipts, gaming revenue, food and beverage sales. Points earned in the competition and leverage risk are the inputs at stage B. Leverage risk is computed as the ratio of liabilities to total assets. While leverage can be a useful tool for financing growth and investments, it also exposes sports clubs to additional financial risks. In the context of sports clubs, leverage risk can manifest in several ways. We focus on the aspect that if a club fails to generate sufficient revenue to service its debt, it may face financial distress or even bankruptcy. We conceptualise that while stage A aims to earn as many points as possible, stage B aims to generate as much revenue as possible through good use of on-field performance. By virtue of playing a dual role, points earned (an output at stage A and an input at stage B) is internal to the overall management process and hence becomes an intermediate variable. The rationale for using points earned as an input at stage B is that on-field success may have considerable influence on revenue. On-field success may increase attendance at matches (high ticket sales) and increase enthusiasm of fans (increase merchandise sales). Advertisers and sponsors also tend to associate with clubs that perform well in the field. Inefficiency in stage B operations implies that on-field success is not utilised to its full potential in revenue generation while undertaking financial risk. In 2021, eighteen clubs took part in the AFL national competition.5 We obtained data from multiple sources.6
3. Results
3.1. Stage Level Performance When Assumed Independent
First, we discuss stage-level performance assuming they are independent processes. Table 1 presents the relative efficiency scores and the corresponding rankings. PGM and FM performance are assessed using models (1) and (2) respectively. Table 1 reveal that seven clubs are efficient in PGM and six clubs are efficient in FM. Two clubs manage both stages efficiently. They are Brisbane and West Coast. Five out of the seven PGM efficient clubs played in the finals. On the other hand, only one club (Brisbane) out of the six FM efficient clubs played in the finals. Melbourne deemed efficient in stage A management topped the points table and went on to win the premiership.
Coefficient of variation (CV) reported in the last row of Table 1 reveal that variation in FM performance is much higher than the variation in PGM performance. The CV of PGM efficiency scores is 0.0792 and that of the FM efficiency scores is 0.2472. In this preliminary investigation, it appears that off-field management performance may induce variability in overall management performance more than on-field performance.
The rank correlation between PGM and FM efficiency scores is 0.036 and is not statistically significant at the 10 per cent level. The evidence here reveals that there is no association between PGM performance and FM performance. This is not surprising given the that they are functionally different processes. However, as discussed later in Section 5.3, these two subprocesses have a strong association with some club specific characteristics not considered in overall performance appraisal. This we advance as empirical evidence to justify linking the two subprocesses for overall performance appraisal and dismiss the notion of their independence. Therefore, independently assessed stage-level performance may not be aggregated to determine overall performance.
3.2. Overall Performance
Here, we discuss the overall performance of the 18 AFL clubs in the 2021 regular season. Table 2 reports the VRS relative efficiency scores and the corresponding rankings of clubs determined under two weighting schemes of stage-level-efficiency aggregation. In one scheme, there is no weight restriction and in the other, both stages are given equal weight in aggregation. Later, we check robustness of the results to two more sets of weighting schemes; 0.75, and , .
Table 2 reveal that average overall-efficiency under no weight restriction is higher than when PGM performance and FM performance are considered equally important. This is an expected result. When weights are unrestricted, there is more freedom to choose values for multipliers and show overall performance in the best possible manner than when the weights are restricted. Hence, the overall-efficiency scores obtained under the unrestricted weights case is higher than or equal to the overall-efficiency scores obtained under weight restriction. When weights are unrestricted, seven clubs are overall efficient and under the restricted case, only two clubs (Brisbane and West Coast) are overall efficient. In fact, they are overall efficient under both weighting schemes. Moreover, the difference in the average and the variability in overall officiency scores obtained under the two weighting schemes are also considerable. When the weights are unrestricted, the average overall efficiency score is 0.9503 and CV is 0.0780 and when the weights are assumed equal, the average overall efficiency is 0.7929 and CV is 0.1583. A higher average overall efficiency score under the unrestricted weighting scheme implies, generally, the clubs operate closer to the frontier of best performance than when the weights are restricted.
In DEA analysis, rankings are more informative than efficiency scores as efficiency scores are relative. Therefore, we refer to the rankings of the clubs when discussing performance at the individual club level. The correlation between the rankings obtained under the two weighting schemes is 0.820 (statistically significant at the 1 per cent level). Under the weight restriction, Geelong suffers the most. Geelong is relative efficient when weights are unrestricted and loses 8 positions in ranking when weights are restricted. The rankings of six clubs do not change. Two out of these six clubs (Brisbane and West Coast) are efficient under both weighting schemes and thereby retain their ranking. The other four clubs that retain their ranking under both weighting schemes are inefficient performers. They are Melbourne (ranked 13), GWS (ranked 16), Gold Coast (ranked 17) and North Melbourne (ranked 18). Change in the weighting scheme favours only two clubs. They are Collingwood and St Kilda. It appears that, for clubs that perform poorly overall, choice of weighting scheme does not make a notable difference in their rankings based on overall efficiency scores.
The top eight teams on points earned during the regular season play in the finals. When weights are unrestricted, seven clubs are deemed overall-efficient. The senior team of three of the seven clubs deemed overall efficient under the unrestricted weight case played in the finals. They are Brisbane, Essendon and Geelong. Relative efficiency score of Port Adelaide under this weighting scheme is 0.9950 (). Hence, four out of the eight clubs that played in the finals may be considered as among the best overall performers that DEA analysis identified. Under the unrestricted-weights case, four teams deemed overall inefficient also did play in the finals. They are ranked 10 (Sydney), 11 (Western Bulldogs), 13 (Melbourne) and 16 (GWS). Their average overall efficiency score is 0.9383. These four clubs are deemed overall inefficient under the equal weighting scheme as well. In that case, their average overall efficiency is 0.6966 and the rankings of two of these four clubs gets worse.
Melbourne is an exception. Melbourne which topped the points table and won the premiership in 2021 perform poorly in overall management.7 Melbourne is PGM efficient when stages are analysed independently and is ranked 13 on overall performance under both weighting schemes. Overall performance is assessed combining both on-field and off-field performance. Therefore, Overall efficiency score masks stage-level performance in aggregation. We discuss overall-efficiency decomposition next.
3.2.1. Decomposition of Overall Performance
In overall efficiency decomposition, one stage is given priority (preference) over the other. Giving priority to a particular stage implies that performance of that stage is considered more important than the performance of the other stage. Then, the stage with priority will be able to obtain the highest efficiency score possible conditional on maintaining the overall efficiency determined in model (3). For the discussion, we consider the overall efficiency computed in model (3) assuming equal weights.8
We decompose overall efficiency obtained under the equal-weighted scenario under two priority schemes; giving priority to PGM and giving priority to FM. Table 3 reports the results. Second column of Table 3 reveal that, when PGM is given priority over FM, six clubs seem to manage their playing groups efficiently. They are Brisbane, Essendon, Geelong, Hawthorn, Port Adelaide, and West Coast. Four of them (Port Adelaide, Geelong, Brisbane and Essendon) played in the finals. A noteworthy absentee is the club that won the premiership- Melbourne. The other three inefficient clubs that played in the finals are Sydney, Western Bulldogs and GWS. Their PGM efficiency scores are 0.9358, 0.9314, 0.7625. PGM efficiency score of Melbourne is 0.6745. Under the equal-weighted scheme, Adelaide, Richmond and Freemantle also record high overall-efficiency scores; 0.9791, 0.9578 and 0.9518. They did not play in the finals. Gold Coast with relative efficiency score 0.5948 is at the bottom of the list (ranked 18). Overall, when PGM is given priority over FM in overall efficiency decomposition, PGM efficiency is positively associated with points earned during the regular season. Rank correlation between PGM performance and points earned during the regular season is statistically significant at the 1 per cent level with rank correlation at 0.604. Consistency in the rankings based on PGM efficiency and points earned is more pronounced among the top (best) five and bottom (worst) five teams. The exception is with Melbourne. Melbourne earned 70 out of maximum possible 88 points during the regular season and went on to win the premiership. However, Melbourne is ranked 17 based on PGM performance.
Last column of Table 3 gives FM efficiency scores when FM is given priority over PGM. In this case, four clubs are FM efficient. They are Brisbane, Carlton, Richmond and West Coast. The next best performer is Collingwood with FM efficiency score at 0.9570. FM efficiency scores of the remaining 13 clubs varies between 0.8057 and 0.5222. The two worst performers in terms of FM under the equal weighting scheme are GWS (ranked 18) and Gold Coast (ranked 17). Their FM efficiency scores are 0.5222 and 0.5315. These two clubs have relatively low asset base, low membership and operate under high financial risk. Membership of Gold Coast is 18,823 and that of GWS is 25,000. These are low compared to the other clubs. The average club membership is approximately 60,000. These two clubs have low asset base as well. GWS reports $19.25 million and Gold Coast reports $20.12 million. Average total asset base of clubs is at $55.86 million. This average is more than double the amount reported for GWS and for Gold Coast. Leverage ratio of these two clubs are close to 1. Leverage ratio of GWS and Gold Coast are 0.986 and 1.075. There is only one other club that has leverage ratio close to 1. That is Sydney with leverage ratio at 1.074. Leverage ratio is an input of the FM process. The other input at the FM process is points earned. Gold Coast earned 28 points and GWS earned 40 points in the regular home and away season. The clubs that played in the finals obtained 44 or higher number of points in the regular season.
When PGM is given priority over FM, the average PGM efficiency score (0.8794) is higher than the average FM efficiency score (0.7237). This pattern is unchanged when priority is reversed. The average FM efficiency score then is 0.7395 and the average PGM efficiency score is 0.8954. However, overall efficiency decomposition at the individual club level may not always follow this pattern. For example, when FM is given priority over PGM, the PGM efficiency scores of ten clubs are higher than the corresponding FM efficiency scores. When PGM is given priority over FM, the FM efficiency scores of four clubs exceeds their corresponding PGM efficiency scores. As expected, PGM and FM efficiency scores are equal to 1 when overall efficiency score is 1. See Proposition 1 in Section 2.
Table 3 reveal that irrespective of priority assignment, the average PGM efficiency score is higher than the average FM efficiency score. An approximate estimate of average overall efficiency under priority given to PGM over FM is = 2/(1.1371+1.3818) = 0.7940. When FM is assigned priority PGM, an estimate of average overall efficiency may be obtained as = 2/(1.1168+1.3523) = 0.8100. These two overall efficiency estimates are comparable with average overall efficiency obtained using model (3), which is 0.7929. Since differences in priority assignment does not make a significant difference on average stage-level performance under equal-weighted scenario, next turn attention to variability in the efficiency scores.
Table 3 reveal that the variation in FM efficiency scores is much higher than the variation in PGM efficiency scores. This disparity is seen under both priority schemes. Th coefficient of variation of the FM efficiency scores are 0.2277 and 0.2413 and the coefficient of variation of the PGM efficiency scores are 0.1583 and 0.1612. Further, the average FM efficiency of the six PGM efficient clubs shown in the second column of Table 3 is 0.7646 and the average PGM efficiency of the four FM efficient clubs shown in the fifth column of Table 3 is 0.9158. Given these notable differences in average performance and variation in performance at the stage level, we infer that, generally FM performance may contribute more towards variation in overall performance than PGM performance. This is consistent with what we observed when both stages are assumed to operate independently. More can be learnt on this issue with correlation between overall and stage-level performance. This we discuss in the next section.
3.3. Determinants of Performance
Here, we investigate the association between overall and stage-level performance and total Brownlow votes received by the playing group and club size (proxied by membership and total assets). Table 4 reports rank correlation between overall, on-field and off-field performance and total Brownlow votes, membership and total assets.
First, we discuss the association between PGM performance and total Brownlow votes. The results reveal that association between PGM efficiency and total Brownlow votes is positive. Rank correlation is 0.31 and is statistically significant at the 1 per cent level. On the other hand, there is no evidence to suggest that FM efficiency is associated with total Brownlow votes. Rank correlation is -0.02 and is not statistically significant at the 10 per cent level. FM performance indicates how well a club manages on-field success to generate revenue under risk. Moreover, the association between Brownlow votes and overall performance is not statistically significant. Rank correlation is 0.06. We advance these findings as empirical evidence that conceptualisation of overall club management process as a two-stage process separating on-field operation from off-field operation as subprocesses may be a valid proposition.
Membership has strong positive association with overall efficiency and stage-level efficiency. Spearman rank correlation between overall efficiency and membership is 0.63, FM efficiency is 0.53 and PGM efficiency is 0.45. Membership plays a part in both subprocesses. Attendance of supporters at games is well known to influence player performance. In a study of home advantage in AFL, [29] highlight crowd effect and ground familiarity as two determinants of home advantage. Membership may play a part in FM as well. Large attendances benefit clubs financially. Association between total assets and performance is similar. Clubs with large financial asset base generally have modern training equipment and facilities. That can have an impact on player performance. Clubs with high financial asset base may have modern stadiums that attract crowds resulting in increased revenue.
Rank correlation between FM performance and overall management performance (0.87) is higher than that of between PGM performance and overall management performance (0.68). However, association between PGM performance and FM performance is weak. Spearman rank correlation is 0.29. This evidence indirectly suggests that FM performance may influence overall performance more than PGM performance.
Good FM performance is important for financial health of the club. Clubs that adopts wasteful practises and resort to inefficient practices may end up being cash trapped. Financial status of a club depends on many factors including membership, sponsorships and on-field performance. As on-field performance may have an impact on revenue, stage A and stage B operations are seemingly linked. Hence, justification for using a serially linked two-stage process for overall performance appraisal.
3.4. Determinantion of a Pathway for an Overall Inefficient Club to Become Efficient
We determine overall efficiency using model (A1) given in Appendix A. Model (A1) is the linear programming counterpart of model (3). Model (A1) solution does not provide estimates of intermediate measures to project inefficient units to the frontier and thereby become efficient. Following [30] and [31], we obtain estimates of input, intermediate and output measures for frontier projection by solving model (C.2) given in Appendix C.
For the demonstration we selected two clubs, Richmond and North Melbourne. Under the equal-weight scenario, overall efficiency of Richmond is 0.9785 and of North Melbourne is 0.5982. Richmond has the highest overall efficiency score among all overall inefficient clubs and North Melbourne has the lowest. Table 5 gives the observed input, intermediate and output measures and a set of input, intermediate and output targets that makes these two clubs efficient.
The targets shown in Table 5 reveal that points earned is a major concern for both clubs. Revenue target for North Melbourne suggests doubling. This is a big ask in the short-term. According to the targets in Table 5, North Melbourne requires considerable increase in playing group rating as well. For both clubs, targets suggest reduction in AFL distribution. In practise, this may be interpreted as funds available for spending to boost playing group performance is not utilised effectively. Model (C.2) provides one pathway for performance improvement. Targets, in general, may be used as guidance as they are established relative to how all clubs in the league utilise their resources.
4. Robustness Check
4.1. Change in Weighting Scheme
Table 2 reports overall efficiency obtained when stage-level efficiencies are unweighted () and equally weighted (). Here we consider two more weighting schemes; , (on-field performance is more important than off-field performance) and , (off-field performance is more important than on-field performance). Table 6 reports these results. Analysis of the rankings reported in Table 2 and the rankings reported in Table 6 reveal high positive correlation between them. Rank correlation varies between 0.663 (rank correlation between equal-weighted and unweighted schemes) and 0.946 (rank correlation between 0.75-0.25 and 0.25-0.75 weighting schemes). Under all three weight schemes investigated, same two clubs (West Coast and Brisbane) are assessed overall efficient. Here we find that, overall efficiency-based ranking is robust to weighting scheme used in stage-level efficiency aggregation for overall performance appraisal.
4.2. Influence of Potential Outliers
West Coast is the only club that is overall efficient under all four weighting schemes (including the unweighted case) considered in the analysis. Because West Coast overall efficiency score is robust to different weighting schemes, we checked whether West Coast has any influence (is an outlier) on relative performance of the other clubs. To investigate this issue, we removed West Coast from the sample and repeated the analysis. The results reveal that correlation between the rankings of clubs based on overall performance with and without West Coast is very high with Spearman rank correlation at 0.914 (statistically significant at the 1 per cent level). We advance this finding as evidence that our results may not be influenced by outliers.
4.3. Change in Returns to Scale
Here, we check whether change in assumption from VRS to CRS makes a significant difference in the results. CRS assumption implies that clubs have access to the same technology. For the discussion, we present the results obtained in the unrestricted-weights case. The results under the VRS assumption are reported in Table 2. The results under the CRS assumption are given in Table 7. Under the CRS assumption, only two clubs are overall efficient. They are West Coast and Geelong. In the VRS case we observed seven efficient clubs including West Coast and Geelong.9 Being efficient under both returns to scale schemes, West Coast and Geelong are scale efficient with scale efficiency equal to 1. Scale efficiency does not imply technical efficiency. For example, St Kilda and North Melbourne also have very high scale efficiency scores. However, they perform poorly overall. CRS efficiency of St Kilda and North Melbourne is 0.8817 and 0.7569 and their VRS efficiency is 0.8844 and 0.7574. Inefficiency of St Kilda and North Melbourne may not be attributed to their scale of operation. St Kilda and North Melbourne perform poorly overall due to their inefficient management practices.
The overall-efficiency score-based rankings obtained under the two technologies are positively correlated. Rank correlation is 0.644 and is statistically significant at the 0.1 per cent level. Three clubs, Carlton, Hawthorn and Richmond stand out in terms of the difference in the rankings under the two returns to scale schemes. Overall-efficiency based rankings of Carlton, Hawthorn and Richmond under CRS technology are 8, 9 and 15 placings lower than the overall efficiency-based rankings under VRS technology. These three clubs are overall efficient under VRS. Carlton, Hawthorn and Richmond suffer from scale inefficiency.10 Scale efficiency of Carlton, Hawthorn and Richmond is 0.8419 (ranked 18th), 0.9145 (ranked 17th) and 0.9534 (ranked 14th) respectively. This is an indication that their size of operations may not be optimal. These clubs have high asset base. Carlton and Richmond are ranked second and third in terms of assets. Asset base of Hawthorn is about the average. Membership of these clubs is also high. Richmond’s membership is the highest at 103,450. Carlton and Hawthorn membership exceeds 81,000 and 70,000 respectively. The average membership of all clubs is approximately 60,000. Carlton and Richmond dominate in revenue as well.
4.4. Using a Single Stage Model
Thus far we have been discussing the results obtained under a two-stage modelling framework. Here, we conceptualise overall club management operation as a single stage process. In the two-stage case we consider points earned as an intermediate (linking) variable. Some studies disregard intermediate variables when a two-stage process is conceptualised as a single-stage process. See, Kern, et al. (2012). We do differently. As points-earned is clearly a desirable outcome, we consider points earned as an output variable. Using points earned as an output variable is common practice in sports team performance appraisal using a single-stage DEA model. See, Soleimani-Damaneh et al. (2011) for example. Our single stage modelling framework is depicted in Figure 3.
When we assume CRS, the number of clubs deemed overall efficient is eight. The average efficiency under the CRS case is 0.9461. The results obtained under output-orientation and VRS assumption, eleven clubs are overall efficient with average efficiency at 0.9614. We find here that, as expected, discriminatory power of relative performance diminishes when the overall management process is conceptualised as a single-stage process. In this case, eight clubs are scale efficient. They are Brisbane, Essendon, Geelong, Melbourne, Port Adelaide, Richmond, West Coast and Western Bulldogs. Six of these eight clubs played in the finals. Under both technologies, North Melbourne is the worst performer. However, its scale efficiency is 0.9884. This is an indication that North Melbourne operates close to its most productive scale size and its inefficiency may be attributed to poor management. The average scale efficiency is 0.9841. The evidence here suggests that, generally, AFL clubs’ inefficiency in overall management may be due to managerial inefficiency. In our modelling framework, AFL club operation involves two distinguishable management functions; PGM and FM. These functions require different sets of management skills. Inefficiency of which of these two skill sets may contribute more towards overall inefficiency can be determined by the methodology we propose in this paper.
5. Concluding Remarks
We conceptualize the overall management process of a sports club as comprising two subprocesses: on-field management and off-field management. The survival of sports clubs hinges on the efficient collective management of these subprocesses. This study aims to highlight how the performance in on-field and off-field management can impact the club's overall performance.
To achieve this, we employ data envelopment analysis (DEA). Initially, we assess the overall performance and then decompose it into subprocess performance under two priority schemes: one where on-field performance is prioritized over off-field performance, and another where off-field performance is prioritized over on-field performance. Our modelling framework allows for the investigation of the sensitivity of overall performance to the weights assigned to on-field and off-field performance in their aggregation and the sensitivity of subprocess-level performance to the priority scheme. This approach enables clubs to evaluate their overall, on-field, and off-field performance relative to other clubs in the league. It also helps identify whether managerial inefficiency, scale inefficiency, or both contribute to overall inefficiency.
In our empirical investigation using 2021 data, we assess the overall performance (relative efficiency) of Australian rules football league clubs. The results indicate that, during the investigation period, the average on-field performance surpassed the average off-field performance, and off-field performance exhibited greater variability than on-field performance. Analysis at the individual club level reveals that efficient on-field performance or efficient off-field performance alone does not guarantee overall efficiency. These model-driven insights align with outcomes that may be desired by sports clubs in their overall management.
The proposed methodology offers valuable information to club management for making short-term decisions in line with long-term strategic plans. Applying this approach over a longer period could reveal how resilient clubs' on-field and off-field performances are to non-discretionary factors, changing economic conditions, and financial positions. Additionally, our method can be easily adapted to assess the performance of clubs in other team sports.
Author Contributions
Conceptualization, D.G.; methodology, D.G.; coding in R, P.P.T.; validation, P.P.T.; data curation, P.P.T.; formal analysis, D.G. and P.P.T.; writing—original draft preparation, D.G. All authors have read and agreed to the published version of the manuscript.
Funding
This research received no external funding.
Data Availability Statement
Data is available from the corresponding author. Data in Excel file format was submitted to the publisher.
Conflicts of Interest
The authors declare no conflicts of interest.
Appendix A
Linear programming counterpart of model (3) is model (A.1).
Subject to , ; unrestricted
Objective function value of model (A.1) is equal to the objective function value of model (3). (a small positive value) ensures that no observed input-output variable value is ignored in performance appraisal. Overall efficiency of labelled is given by the optimal objective function value of model (A.1).
Appendix B
All appendix we discuss a procedure to decompose overall-efficiency computed in model (A), , assuming stage A is preferred to stage B. Maintaining overall-efficiency at the level computed in model (A.1) implies . When stage A is preferred to stage B, stage A efficiency is allowed to obtain the maximum possible efficiency in the decomposition. This can be done by solving model (B.1).
Subject to , ; unrestricted
Linear programming counterpart of model (B.1) is given by model (B.2).
Subject to , ; unrestricted
Under the scenario where stage A performance is preferred to stage B performance, stage A efficiency of labelled is reciprocal of the optimal objective function value of model (B.2). Suppose optimal decision variable values of model (B.2) are , , and . Then, associated weights and can be obtained by computing and substituting in . Stage B efficiency of labelled can be obtained from . is the overall efficiency of computed in model (A.1). An analogous procedure may be adopted to obtain stage-level efficiency scores when stage B performance is preferred to stage A performance.
Appendix C
Dual of model (A.1) is given in model (C.1).
Subject to unrestricted
Suppose an optimal solution of model (C.1) is and . Then, it follows from LP duality theorem that is equal to the optimal objective function value of model (A.1) which is . As pointed out in Chen et al. (2010), models of (C.1) type do not provide full information to determine a set of input, intermediate and output values for frontier projection. Therefore, to obtain a frontier projection for an inefficient , following Galagedera (2019), we formulate model (C.2).
Subject to , unrestricted
Model (C.2) includes all constraints of model (C.1), two additional constraints and for and another constraint (the last constraint) that maintains overall efficiency of at . A frontier projection point of inefficient can be obtained as , , , , and where and is a set of optimal decision variable values obtained in model (C.2). This we verified empirically.
| 1 | CRS counterparts of models (1) and (2) can be obtained by substituting and . |
| 2 | |
| 3 | Sourced from https://resources.afl.com.au/afl/document/2022/03/10/76a16be1-6439-4020-af33-1cac86639f7e/2021-AFL-Annual-Report.pdf. Accessed on 19 May 2023. |
| 4 | Stats Insider ranks every player in the AFL based on multiple factors such as media votes, coaches’ votes, match reports and from other sources where the player has received mention. Individual player rankings are available in https://www.statsinsider.com.au/sport-hub/afl/player-ratings. Accessed on 19 June 2023. |
| 5 | In the 2021 season each club played 22 home-and-away games. The season was played during the second year of the COVID-19 pandemic. There were some disruptions- relocation of games outside their originally fixtured venues and re-scheduling some match dates. |
| 6 | AFL club annual reports are available in: https://www.footyindustry.com/?page_id=90122
|
| 7 | Melbourne is one of the oldest clubs in the league and won their last premiership in 1964. Given this drought Melbourne was the sentimental favourite in 2021. AFL faced challenges and disruptions in 2021. Some games were played in empty stadiums or with limited attendance to avoid spread of the COVID-19 virus. This resulted in revenue losses. Disruptions had an impact on players mental health too. Given these, 2021 may not be considerd as a typical AFL season. |
| 8 | Then, the overall efficiency may be expressed as where and are PGM and FM efficiency scores. |
| 9 | Higher number of clubs deemed DEA-efficient under the VRS assumption than in the CRS case is an expected result. |
| 10 | [32] show that overall scale efficiency in two-stage network DEA is consistent with scale efficiency in conventional DEA. Therefore, as our modelling framework falls under the two-stage network DEA framework, we interpret scale efficiency similar to the conventional case. |
References
- Espitia-Escuer, M.; Garci ́a-Cebria ́n, L.I. Performance in sports teams- Results and potential in the professional soccer league in Spain. Mgmt. Decision. 2006, 44, 1020–1030. [Google Scholar] [CrossRef]
- Guzma ́n, I.; Morrow, S. Measuring efficiency and productivity in professional football teams: evidence from the English Premier League. Central Eur. J. Oper. Res. 2007, 15, 309–328. [Google Scholar] [CrossRef]
- Barros, C.P.; Leach, S. Performance evaluation of the English Premier Football League with data envelopment analysis. Appl. Econ. 2007, 38, 1449–1458. [Google Scholar] [CrossRef]
- Bosca ́, J.E.; Liern, V.; Marti ́nez, A.; Sala, R. Increasing offensive and defensive efficiency? An analysis of Italian and Spanish football. OMEGA 2009, 37, 63–78. [Google Scholar]
- Soleimani-Damaneh, J.; Hamidi, M.; Sajadi, N. Evaluating the performance of Iranian football teams utilizing linear programming. Amer. J. of Oper. Res. 2011, 1, 65–72. [Google Scholar] [CrossRef]
- Kern, A.; Schwarzmann, M.; Wiedenegger, A. Measuring the efficiency of English Premier League Football: A two-stage data envelopment analysis approach. Sport, Bus. Management: An Int. J. 2012, 2, 177–195. [Google Scholar] [CrossRef]
- Zambom-Ferraresi, F.; García-Cebrián, L.l.; Lera-López, F.; Iráizoz, B. Performance evaluation in the UEFA champions league. J. Sports Eco. 2017, 18, 448–470. [Google Scholar] [CrossRef]
- Bhat, Z. ul Haq; Sultana, D.; Lone, Sh.B. Efficiency Evaluation of Football Teams in English Premier League: Application of Data Envelopment Analysis. Int. J. of Data Envel. Anal. https://ijdea.srbiau.ac.ir/article_13945_14c18d3fe8658ce34cb309ca5142d703.pdf Accessed 27 July 2023.; https, 2017; IJDEA-00422. [Google Scholar]
- Bouzidis, T. On-field Performance Assessment in Football: Applying the Connected Network Data Envelopment Analysis Model. Discussion Paper Series 12, 2018, Department of Economics, University of Macedonia.
- Guzmán-Raja, I.; Guzmán-Raja, M. Measuring the Efficiency of Football Clubs Using Data Envelopment Analysis: Empirical Evidence From Spanish Professional Football. SAGE Open, 2021, 11, 215824402198925. [Google Scholar] [CrossRef]
- Šíma, J.; Voráček, J.; Kraft, J.; Krause, V. Productive efficiency of Premier League teams using an enhanced data envelopment analysis approach. AUC Kinanthropologica. 2023, 59, 29–44. [Google Scholar] [CrossRef]
- Bhat, Z.U.H.; Sultana, D.; Dar, Q.F. A comprehensive review of data envelopment analysis (DEA) in sports. J. Sports Econ. Manag. 2019, 9, 82–109. [Google Scholar]
- Zambom-Ferraresi, F.; García-Cebrián, L.l.; Lera-López, F.; Iráizoz, B. Performance evaluation in the UEFA champions league. J. Sports Econ. 2017, 18, 448–470. [Google Scholar] [CrossRef]
- Robertson, S.; Back, N.; Bartlett, J.D. Explaining match outcome in elite Australian Rules football using team performance indicators. J. Sports Sci. 2015, https://www.researchgate.net/deref/http%3A%2F%2Fdx.doi.org%2F10.1080%2F02640414.2015.1066026.
- Young, C.M.; Luo, W.; Gastin, P.; Tran, J.; Dwyer, D.B. The relationship between match performance indicators and outcome in Australian Football. J. Sci. Med. Sport. 2019, 22, 467–471. [Google Scholar] [CrossRef] [PubMed]
- Alexander, J.P.; Bedin, T.; Jackson, K.B.; Robertson, S. Team numerical advantage in Australian rules football: A missing piece of the scoring puzzle? PLOS, Published: July 16, 2021. https://doi.org/10.1371/journal.pone.0254591.
- Sheehan, W.B.; Tribolet, R.; Novak, A.R.; Fransen, J.; Watsford, M.L. A holistic analysis of collective behaviour and team performance in Australian Football via structural equation modelling. Sci. Med. Football. 2023, 7, 64–73. [Google Scholar] [CrossRef] [PubMed]
- Aarons, M.F.; Young, C.M.; Bruce, L.; Dwyer, D.B. The effect of team formation on defensive performance in Australian football. J. Sc. and Med. in Sport. 2022, 25, 178–182. [Google Scholar] [CrossRef]
- Bunker, R.P.; Thabtah, F. A machine learning framework for sport result prediction. Appl. Comp. Informatics. 2019, 15, 27–33. [Google Scholar] [CrossRef]
- Wang, Y.-M.; Chin, K.-S. Some alternative DEA models for two-stage process. Exp. Syst. Appl. 2010, 37, 8799–8808. [Google Scholar] [CrossRef]
- Galagedera, D.U.A. Modelling social responsibility in mutual fund performance appraisal: A two-stage data envelopment analysis model with non-discretionary first stage output. Eur. J. Oper. Res. 2019, 273, 376–389. [Google Scholar] [CrossRef]
- Aviles-Sacoto, S.; Cook, W.D.; Imanirad, R.; Zhu, J. Two-stage network DEA: when intermediate measures can be treated as outputs from the second stage. J. Oper. Res. Soc. 2015, 66, 1868–1877. [Google Scholar] [CrossRef]
- Liang, L.; Yang, F.; Cook, W.D.; Zhu, J. DEA models for supply chain efficiency evaluation. Ann. Oper. Res. 2006, 145, 35–49. [Google Scholar] [CrossRef]
- Kao, C.; Hwang, S.N. Efficiency decomposition in two-stage data envelopment analysis: an application to non-life insurance companies in Taiwan, Network Data Envelopment Analysis. Eur. J. Oper. Res. 2008, 185, 418–429. [Google Scholar] [CrossRef]
- Chen, Y.; Cook, W.D.; Li, N.; Zhu, J. Additive efficiency decomposition in two-stage DEA. Eur. J. Oper. Res. 2009, 196, 1170–1176. [Google Scholar] [CrossRef]
- Charnes, A.; Cooper, W.W. Programming with Linear Fractional Functionals. Naval Res. Log. Q. 1962, 9, 181–186. [Google Scholar] [CrossRef]
- Hass, D.J. Technical efficiency in the major league soccer. J. Sports Econ. 2003, 4, 203–215. [Google Scholar] [CrossRef]
- Papahristodoulou, C. Team performance in UEFA champions league 2005-05, MPRA Working Paper 138. 2007, https://www.researchgate.net/deref/http%3A%2F%2Fmpra.ub.uni-muenchen.de%2F138%2F. Accessed 24 July 2023.
- Clarke, S.R. Home advantage in the Australian football league. J. of Sports Sci. 2005, 23, 375–385. [Google Scholar] [CrossRef]
- Premachandra, I.M.; Zhu, J.; Watson, J.; Galagedera, D.U.A. Best-performing US mutual fund families from 1993 to 2006: evidence from a novel two-stage DEA model for efficiency decomposition. J. Bank. Fin. 2012, 36, 3123–3482. [Google Scholar] [CrossRef]
- Chen, Y.; Cook, W.D.; Zhu, J. Deriving the DEA frontier for two-stage processes. Eur. J. Oper. Res. 2010, 202, 138–142. [Google Scholar] [CrossRef]
- Chen, K.; Zhu, J. Scale efficiency in two-stage network DEA. J. Oper. Res. Soc. 2019, 70, 101–110. [Google Scholar] [CrossRef]
Figure 1.
Serially linked two-stage process.
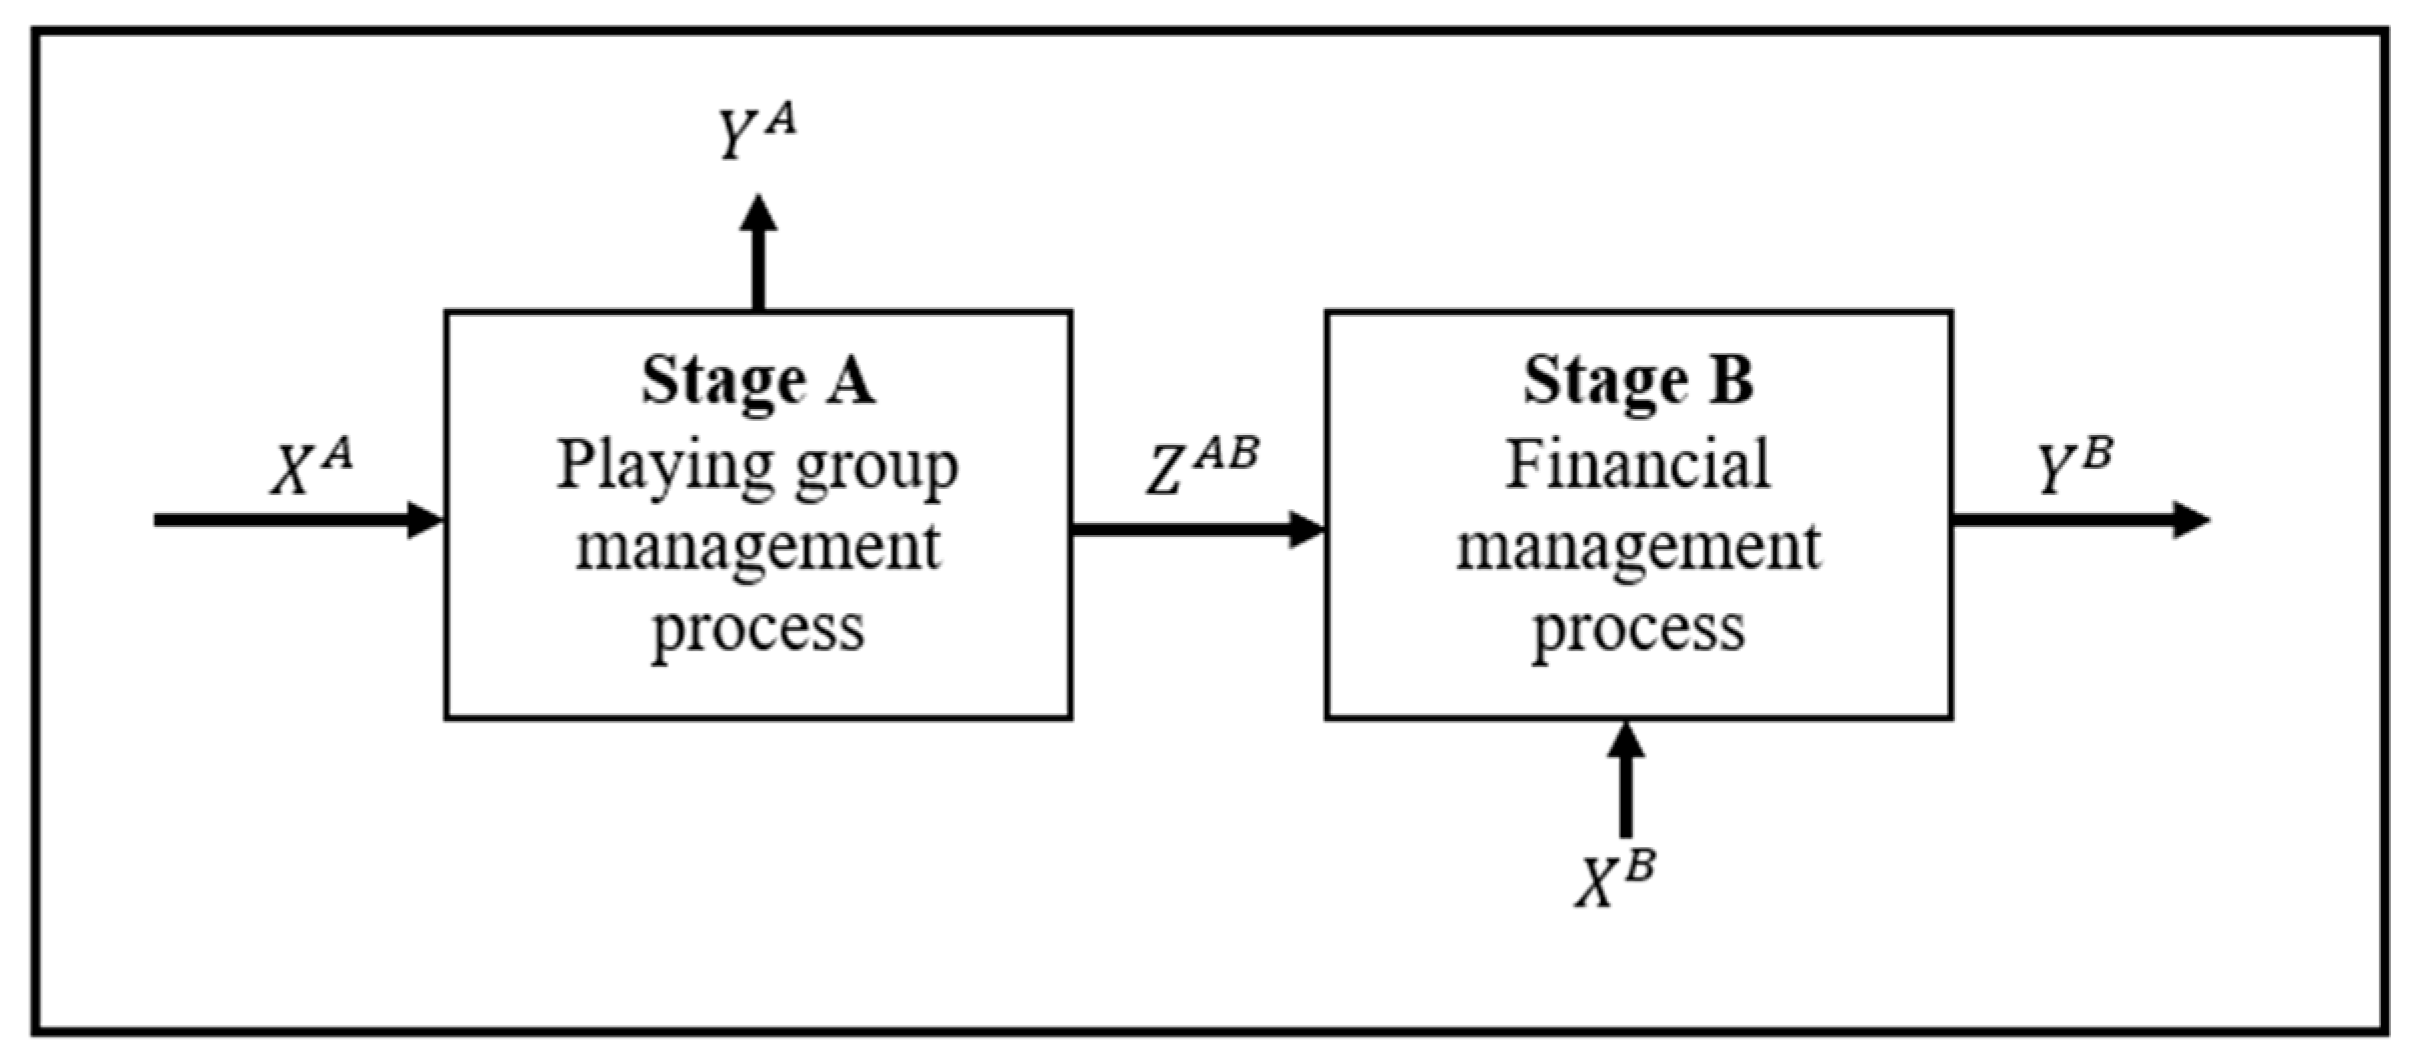
Figure 2.
Two-stage overall management process.
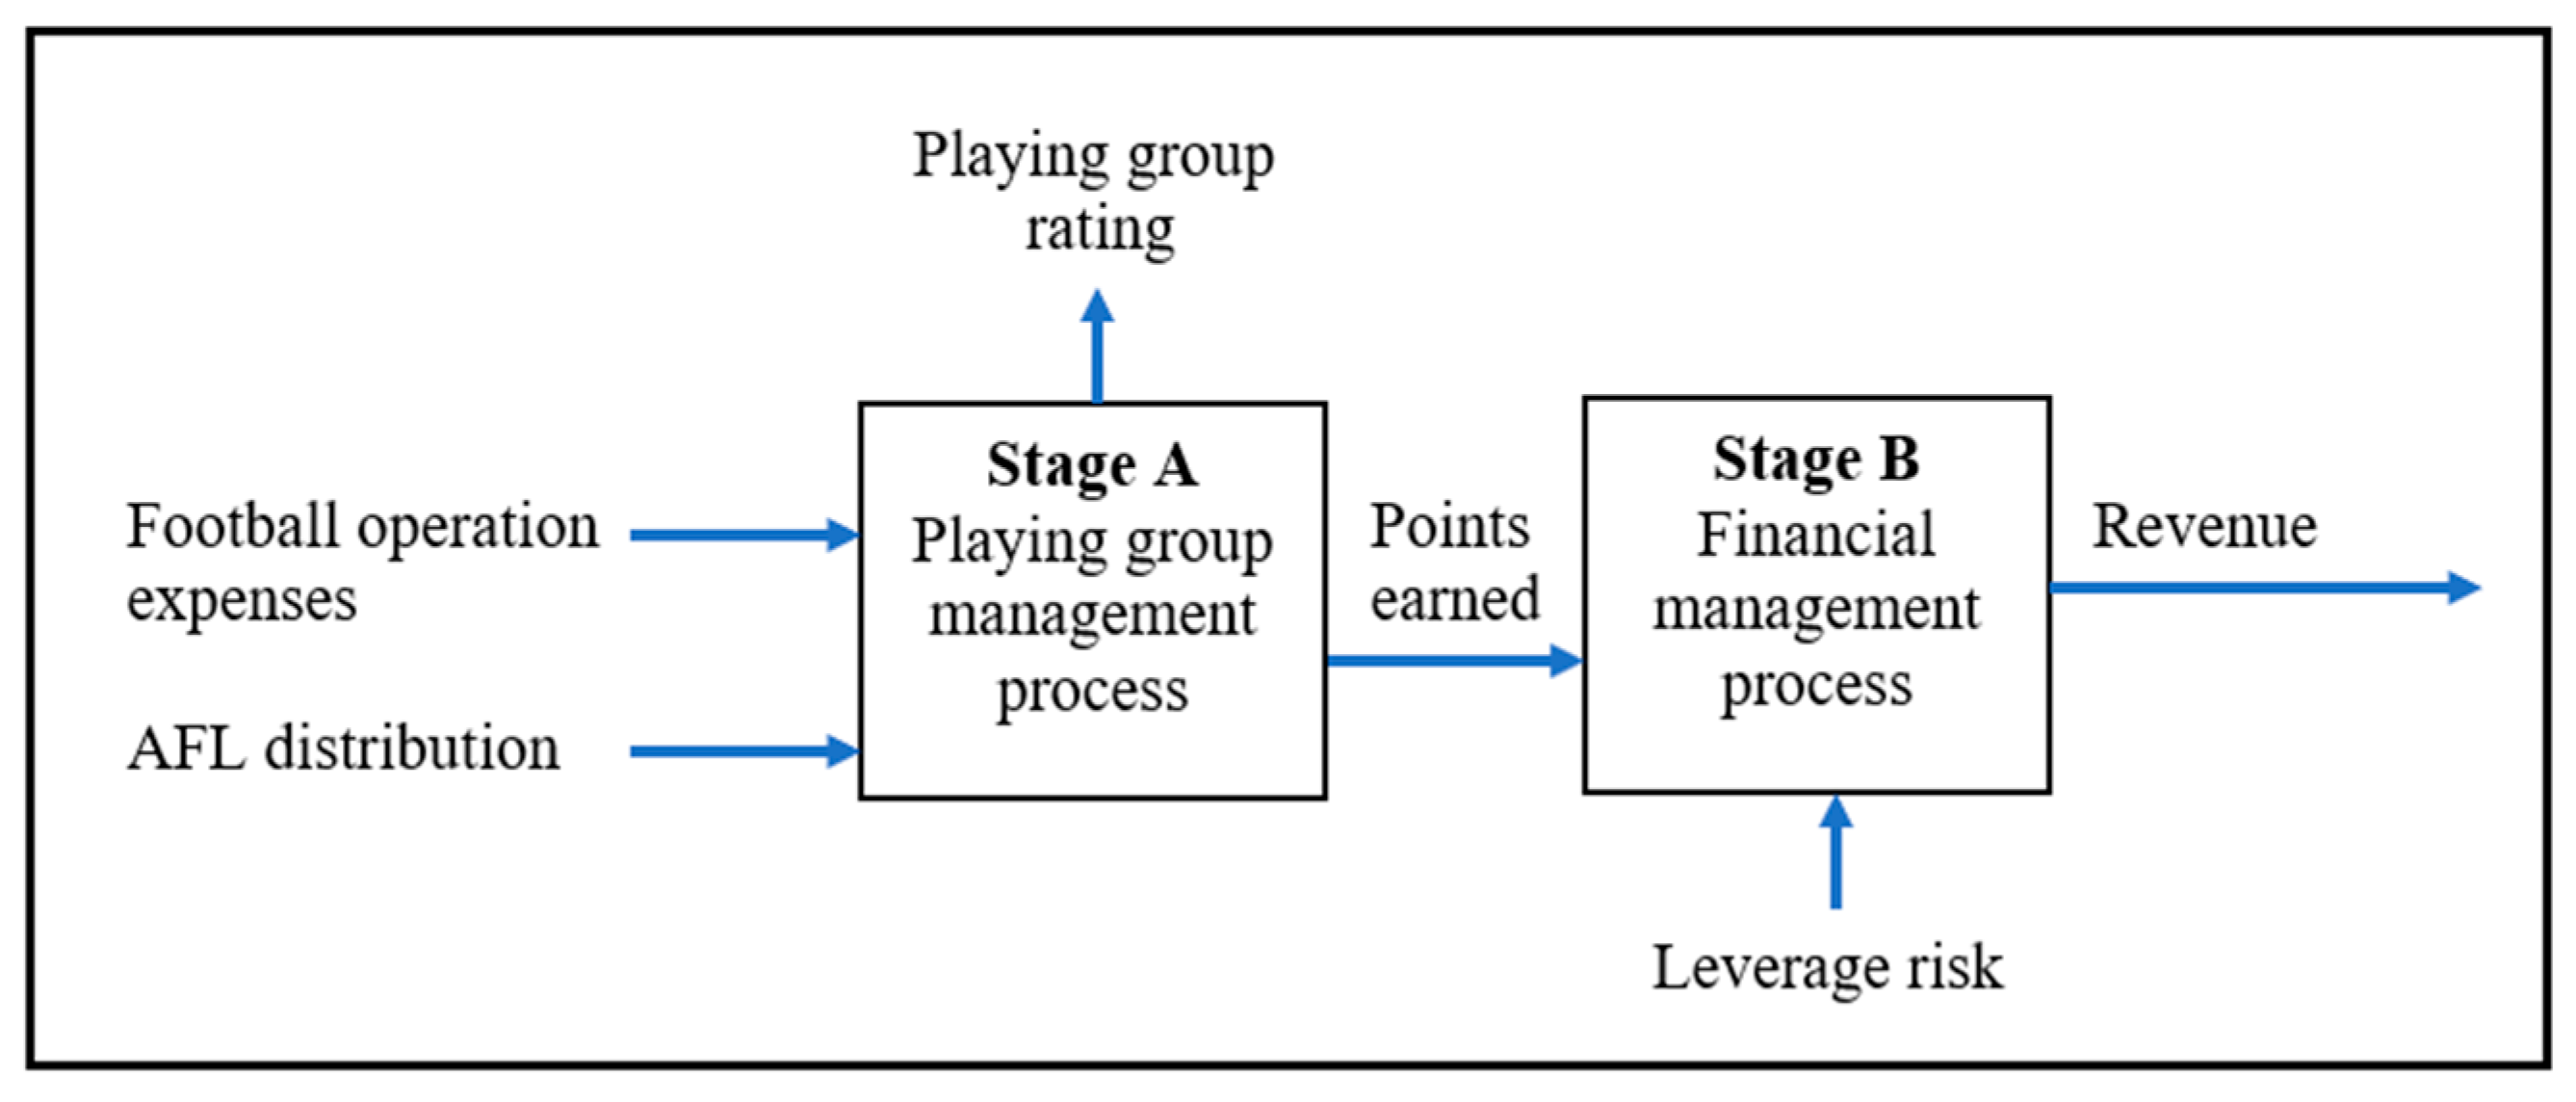
Figure 3.
Overall management as a single-stage process.
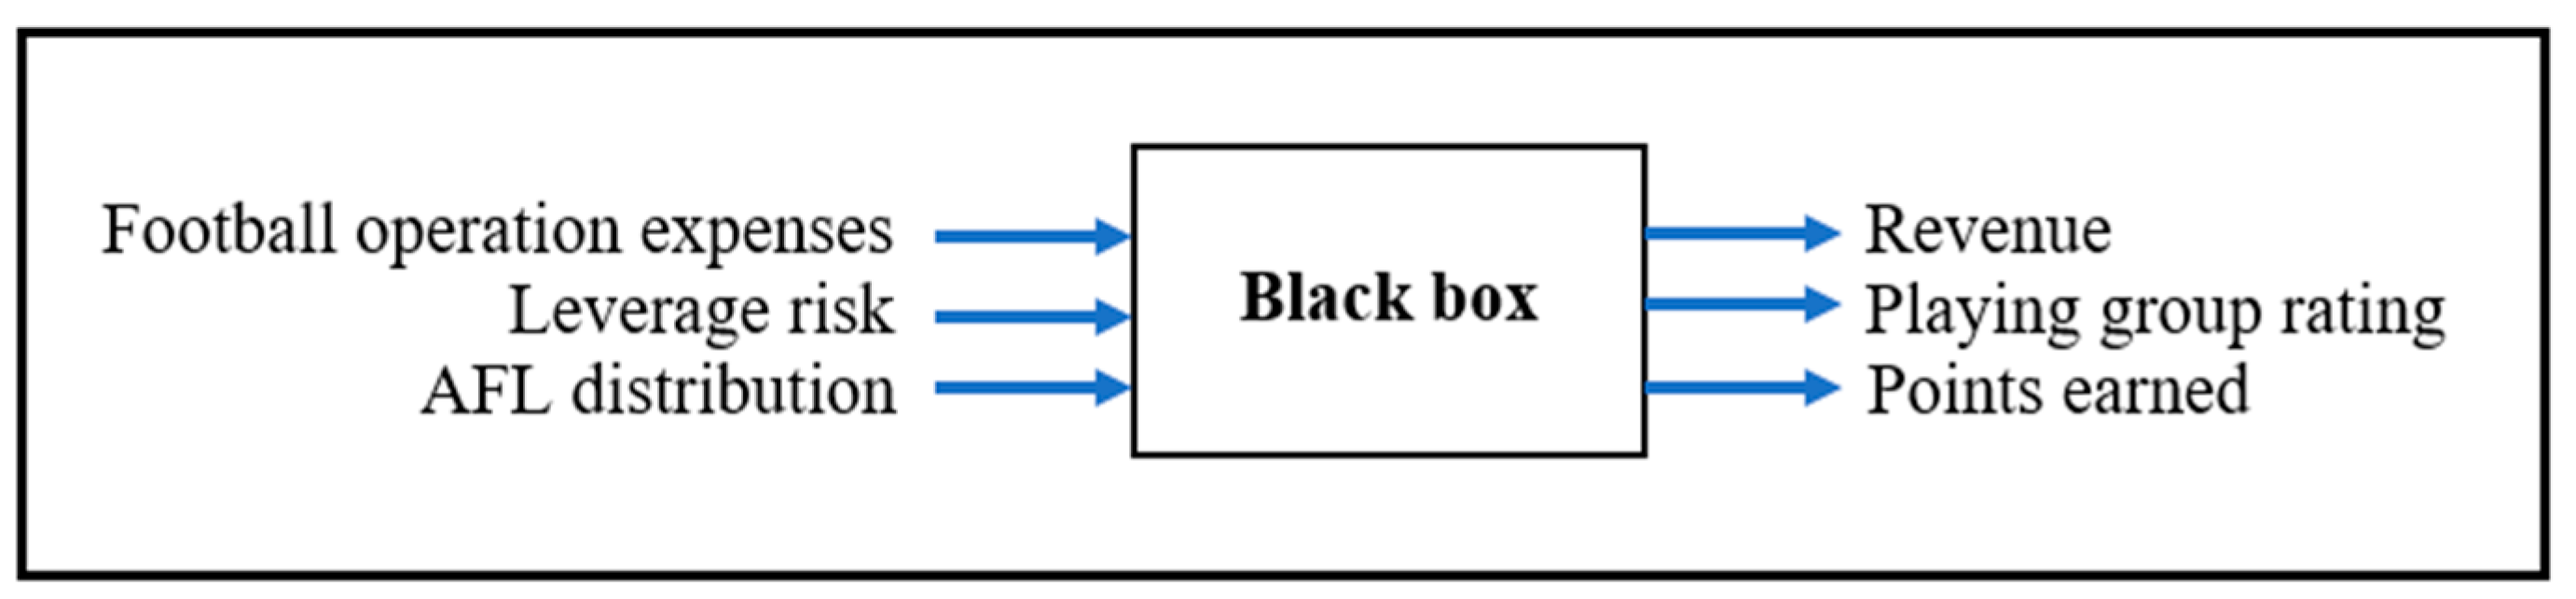

Table 1.
Stage-level efficiency assuming stages operate independently.
| Club | Playing group management (PGM) performance | Financial management (FM) performance | ||
|---|---|---|---|---|
| Efficiency | Ranking | Efficiency | Ranking | |
| Adelaide | 0.9924 | 8 | 0.7092 | 10 |
| Brisbane | 1.0000 | 1 | 1.0000 | 1 |
| Carlton | 0.8865 | 14 | 1.0000 | 1 |
| Collingwood | 0.9594 | 11 | 1.0000 | 1 |
| Essendon | 1.0000 | 1 | 0.7577 | 7 |
| Fremantle | 0.9518 | 13 | 0.6664 | 11 |
| Geelong | 1.0000 | 1 | 0.6500 | 12 |
| Gold Coast | 0.8111 | 17 | 0.5773 | 15 |
| GWS | 0.8497 | 16 | 0.5222 | 18 |
| Hawthorn | 1.0000 | 1 | 0.7326 | 8 |
| Melbourne | 1.0000 | 1 | 0.6056 | 14 |
| North Melbourne | 0.7574 | 18 | 1.0000 | 1 |
| Port Adelaide | 1.0000 | 1 | 0.6137 | 13 |
| Richmond | 0.9578 | 12 | 1.0000 | 1 |
| St Kilda | 0.8844 | 15 | 0.7154 | 9 |
| Sydney | 0.9817 | 9 | 0.5448 | 17 |
| West Coast | 1.0000 | 1 | 1.0000 | 1 |
| Western Bulldogs | 0.9702 | 10 | 0.5505 | 16 |
| Average | 0.9446 | 0.7581 | ||
| Standard deviation | 0.0748 | 0.1874 | ||
| CV | 0.0792 | 0.2472 | ||
Table 2.
Overall-efficiency.
| Club | Weighting scheme | Difference in the UW and EW ranking | |||
|---|---|---|---|---|---|
| Unrestricted weights (UW) | Equal weight (EW) | ||||
| Efficiency | Ranking | Efficiency | Ranking | ||
| Adelaide | 0.9924 | 9 | 0.7434 | 12 | -3 |
| Brisbane | 1.0000 | 1 | 1.0000 | 1 | 0 |
| Carlton | 1.0000 | 1 | 0.9398 | 4 | -3 |
| Collingwood | 0.9594 | 12 | 0.7952 | 7 | 5 |
| Essendon | 1.0000 | 1 | 0.8622 | 5 | -4 |
| Fremantle | 0.9518 | 14 | 0.7839 | 10 | 4 |
| Geelong | 1.0000 | 1 | 0.7879 | 9 | -8 |
| Gold Coast | 0.8111 | 17 | 0.6052 | 17 | 0 |
| GWS | 0.8497 | 16 | 0.6428 | 16 | 0 |
| Hawthorn | 1.0000 | 1 | 0.8409 | 6 | -5 |
| Melbourne | 0.9541 | 13 | 0.7409 | 13 | 0 |
| North Melbourne | 0.7574 | 18 | 0.5982 | 18 | 0 |
| Port Adelaide | 0.9950 | 8 | 0.7592 | 11 | -3 |
| Richmond | 1.0000 | 1 | 0.9785 | 3 | -2 |
| St Kilda | 0.8844 | 15 | 0.7910 | 8 | 7 |
| Sydney | 0.9808 | 10 | 0.7007 | 15 | -5 |
| West Coast | 1.0000 | 1 | 1.0000 | 1 | 0 |
| Western Bulldogs | 0.9686 | 11 | 0.7020 | 14 | -3 |
| Average | 0.9503 | 0.7929 | |||
| Standard deviation | 0.0742 | 0.1255 | |||
| CV | 0.0780 | 0.1583 | |||
Table 3.
Stage-level performance when weights are equal.
| Club | Priority assigned to stage A | Priority assigned to stage B | ||
|---|---|---|---|---|
| Stage A efficiency | Stage B efficiency | Stage A efficiency | Stage B efficiency | |
| Adelaide | 0.9791 | 0.5992 | 0.8434 | 0.6646 |
| Brisbane | 1.0000 | 1.0000 | 1.0000 | 1.0000 |
| Carlton | 0.8694 | 0.6455 | 0.8865 | 1.0000 |
| Collingwood | 0.6941 | 0.9308 | 0.6802 | 0.9570 |
| Essendon | 1.0000 | 0.7577 | 1.0000 | 0.7577 |
| Fremantle | 0.9518 | 0.6664 | 0.9518 | 0.6664 |
| Geelong | 1.0000 | 0.6500 | 1.0000 | 0.6500 |
| Gold Coast | 0.5948 | 0.6159 | 0.7025 | 0.5315 |
| GWS | 0.7625 | 0.5555 | 0.8358 | 0.5222 |
| Hawthorn | 1.0000 | 0.7255 | 1.0000 | 0.7255 |
| Melbourne | 0.6745 | 0.8218 | 0.9541 | 0.6056 |
| North Melbourne | 0.6912 | 0.5272 | 0.4756 | 0.8057 |
| Port Adelaide | 1.0000 | 0.6118 | 0.9950 | 0.6137 |
| Richmond | 0.9578 | 1.0000 | 0.9578 | 1.0000 |
| St Kilda | 0.7863 | 0.7957 | 0.8844 | 0.7154 |
| Sydney | 0.9358 | 0.5600 | 0.9817 | 0.5448 |
| West Coast | 1.0000 | 1.0000 | 1.0000 | 1.0000 |
| Western Bulldogs | 0.9314 | 0.5633 | 0.9686 | 0.5505 |
| Average | 0.8794 | 0.7237 | 0.8954 | 0.7395 |
| SD | 0.1392 | 0.1648 | 0.1443 | 0.1784 |
| CV | 0.1583 | 0.2277 | 0.1612 | 0.2413 |
Notes: Stage A is PGM and stage B is FM. Overall-efficiency is decomposed assuming priority to stage A (stage A performance is preferred to stage B performance) and priority to stage B (stage B performance is preferred to stage A performance). Overall-efficiency scores obtained under the equal weighted scheme is given in Table 1. Underlined clubs played in the finals. SD is standard deviation and CV is coefficient of variation.
Table 4.
Rank correlation.
| Rank correlation | Efficiency | Memb. | Brownlow votes | Points earned | ||||||
|---|---|---|---|---|---|---|---|---|---|---|
| PGM | FM | Overall | ||||||||
| PGM eff | 1.00 | |||||||||
| FM eff | 0.29 | 1.00 | ||||||||
| Overall eff | 0.68 | 0.87 | 1.00 | |||||||
| Membership | 0.45 | 0.53 | 0.63 | 1.00 | ||||||
| Brownlow votes | 0.31 | -0.02 | 0.06 | -0.14 | 1.00 | |||||
| Points earned | 0.31 | 0.02 | 0.08 | -0.14 | 0.98 | 1.00 | ||||
| Total assets | 0.49 | 0.55 | 0.64 | 0.55 | 0.09 | 0.04 | ||||
Notes: The club that receives the highest value for a variable is ranked 1. PGM and FM efficiency rankings are based on the relative efficiency scores obtained when PGM is afforded priority in overall efficiency decomposition. The relative efficiency scores are given in columns 2 and 3 of Table 2.
Table 5.
Input, intermediate and output targets for overall efficiency.
| Richmond | North Melbourne | |||||
|---|---|---|---|---|---|---|
| Observed | Target | % change | Observed | Target | % change | |
| Inputs | ||||||
| Football operation expenses ($) | 23.428 | 23.428 | 0.00 | 23.647 | 23.647 | 0.00 |
| AFL distribution ($) | 14.192 | 13.661 | -3.74 | 17.441 | 13.707 | -21.41 |
| Leverage risk | 0.419 | 0.419 | 0.00 | 0.514 | 0.513 | -0.19 |
| Intermediate measure | ||||||
| Points earned | 38 | 61.340 | 61.42 | 18 | 63.634 | 253.52 |
| Outputs | ||||||
| Playing group rating | 63.029 | 65.803 | 4.40 | 50.507 | 66.684 | 32.03 |
| Total revenue ($) | 78.376 | 78.376 | 0.00 | 39.268 | 79.442 | 102.31 |
Notes: Input, intermediate and output targets for overall efficiency are obtained in model (C.2) given in Appendix C.
Table 6.
Overall-efficiency under two other weighting schemes.
| Club (Listed in alphabetical order) | Weighting scheme | |||||||
|
and |
and |
|||||||
| Efficiency | Ranking | Efficiency | Ranking | |||||
| Adelaide | 0.8500 | 11 | 0.6605 | 13 | ||||
| Brisbane | 1.0000 | 1 | 1.0000 | 1 | ||||
| Carlton | 0.9124 | 6 | 0.9690 | 4 | ||||
| Collingwood | 0.8696 | 8 | 0.7325 | 8 | ||||
| Essendon | 0.9260 | 4 | 0.8066 | 5 | ||||
| Fremantle | 0.8597 | 10 | 0.7204 | 9 | ||||
| Geelong | 0.8814 | 7 | 0.7124 | 10 | ||||
| Gold Coast | 0.6932 | 17 | 0.5365 | 18 | ||||
| GWS | 0.7319 | 16 | 0.5729 | 16 | ||||
| Hawthorn | 0.9164 | 5 | 0.7690 | 6 | ||||
| Melbourne | 0.8341 | 13 | 0.6664 | 12 | ||||
| North Melbourne | 0.6684 | 18 | 0.5413 | 17 | ||||
| Port Adelaide | 0.8612 | 9 | 0.6787 | 11 | ||||
| Richmond | 0.9680 | 3 | 0.9891 | 3 | ||||
| St Kilda | 0.8351 | 12 | 0.7513 | 7 | ||||
| Sydney | 0.8177 | 14 | 0.6130 | 15 | ||||
| West Coast | 1.0000 | 1 | 1.0000 | 1 | ||||
| Western Bulldogs | 0.8140 | 15 | 0.6171 | 14 | ||||
| Average | 0.8577 | 0.7409 | ||||||
| Standard deviation | 0.0933 | 0.1556 | ||||||
| CV | 0.1087 | 0.2101 | ||||||
Table 7.
Overall-efficiency under CRS and scale efficiency.
| Club | CRS efficiency | Ranking | Scale efficiency | Ranking |
|---|---|---|---|---|
| Adelaide | 0.9618 | 7 | 0.9692 | 10 |
| Brisbane | 0.9889 | 3 | 0.9889 | 7 |
| Carlton | 0.8419 | 16 | 0.8419 | 18 |
| Collingwood | 0.8802 | 14 | 0.9174 | 16 |
| Essendon | 0.9627 | 6 | 0.9627 | 11 |
| Fremantle | 0.9145 | 11 | 0.9608 | 13 |
| Geelong | 1.0000 | 1 | 1.0000 | 2 |
| Gold Coast | 0.7794 | 17 | 0.9609 | 12 |
| GWS | 0.8486 | 15 | 0.9987 | 4 |
| Hawthorn | 0.9145 | 10 | 0.9145 | 17 |
| Melbourne | 0.9035 | 12 | 0.9469 | 15 |
| North Melbourne | 0.7569 | 18 | 0.9994 | 3 |
| Port Adelaide | 0.9724 | 4 | 0.9773 | 9 |
| Richmond | 0.9534 | 9 | 0.9534 | 14 |
| St Kilda | 0.8817 | 13 | 0.9970 | 5 |
| Sydney | 0.9702 | 5 | 0.9892 | 6 |
| West Coast | 1.0000 | 1 | 1.0000 | 1 |
| Western Bulldogs | 0.9551 | 8 | 0.9861 | 8 |
| Average | 0.9159 | 0.9647 |
Disclaimer/Publisher’s Note: The statements, opinions and data contained in all publications are solely those of the individual author(s) and contributor(s) and not of MDPI and/or the editor(s). MDPI and/or the editor(s) disclaim responsibility for any injury to people or property resulting from any ideas, methods, instructions or products referred to in the content. |
© 2024 by the authors. Licensee MDPI, Basel, Switzerland. This article is an open access article distributed under the terms and conditions of the Creative Commons Attribution (CC BY) license (http://creativecommons.org/licenses/by/4.0/).
Copyright: This open access article is published under a Creative Commons CC BY 4.0 license, which permit the free download, distribution, and reuse, provided that the author and preprint are cited in any reuse.


