
Submitted:
16 October 2024
Posted:
17 October 2024
You are already at the latest version
Abstract
In the outskirts of the Pinios dam reservoir (Ilia Regional Unit, Greece) a freshwater refinery serves the water supply needs of the surrounding Municipalities, in which high concentrations of Fe and Mn, before treatment, have been observed. The main purpose of this research is to investigate the mechanism of increased iron (Fe) and manganese (Mn) levels in the reservoir of the Pinios dam, which impacts its freshwater refinery's operation. A comprehensive hydrochemical and sedimentological analysis was conducted over a hydrological year, focusing on the spatial and temporal distribution of Fe and Mn in both water and sediment samples across the established research monitoring stations. Sediment samples from the reservoir's bottom revealed predominantly fine-grained material, rich in total organic carbon, with elevated Mn and Fe oxide levels. Significant seasonal variations in Fe and Mn levels were also discovered, with higher Mn levels observed in the anoxic bottom waters of the reservoir during the dry season, attributed to the reduced conditions favoring Mn oxide dissolution over Fe. Conversely, during the wet season, a homogenization of metal concentrations throughout the water column was observed due to increased oxygenation and freshwater inflow. These outcomes were confirmed by the hydrochemical analysis, indicating that the redox conditions, pH, temperature, as well as the presence of organic matter significantly influence the mobility and bioavailability of these metals in the reservoir. The findings of this study clarify that the high concentration of Fe and Mn can be linked to the mineral composition of the upstream Neogene and flysch formations in the study area. As these formations are affected by geological weathering, they tend to enrich the streams, through soil erosion and runoff processes, in metals like Fe and Mn, which are eventually transported into the dam reservoir. This study highlights the critical role of geological, sedimentological and hydrological factors in shaping the hydrochemistry of dam reservoirs, providing essential insights for water resource management and environmental conservation strategies.
Keywords:
iron
; manganese
; concentration levels
; water sediment quality
; dam reservoir
; Greece
1. Introduction
Water reservoirs serve a crucial role in addressing the continuously rising demand for freshwater resources, providing essential sources of potable water, irrigation, and industrial supply. They preserve a consistent water supply and have a vital role in mitigating flood risks by reducing excessive runoff through water flow regulation [1]. Maintaining the water quality within these reservoirs is essential for ensuring their functionality and preserving the health and welfare of the communities that depend on them. Nevertheless, numerous reservoirs encounter persistent issues with water quality, with a primary focus on the increased concentrations of heavy metals. Heavy metals constitute a significant peril to ecosystems and human health, owing to their potential for contaminating food chains. This risk is driven by their enduring presence in the environment, their toxicity to living organisms, and their bioaccumulation potential [2,3,4].
The quality of dam reservoir water is influenced by a range of natural and anthropogenic factors, with their interactions becoming more pronounced during extreme weather conditions. Precipitation undergoes a process of pollutant assimilation as it naturally absorbs various contaminants that are prevalent in the atmosphere and then after contacting the Earth’s surface it generates runoff and proceeds to wash pollutants from the surrounding land and deposit them into waterbodies [5,6,7], potentially leading to elevated levels of certain substances, including heavy metals like Fe and Mn. Storm runoff rapidly conveys significant pollutant loads into rivers [6] transporting these contaminants into lakes and water reservoirs where they are concentrated, swiftly degrading their water quality. Therefore, sediments are widely acknowledged as the predominant reservoir of heavy metals within aquatic environments [4] exhibiting the capacity to retain nearly 99% of adsorbed metals following their introduction into aquatic ecosystems [8].
In general, the majority of variations in water quality in reservoirs, lakes and lagoons are caused by two primary physical processes: sediment and nutrient entrapment and reservoir thermal stratification [9,10,11]. Specifically, the variation in heavy metals within reservoir and lake sediments is typically influenced by a complex interaction of chemical, physical, and biological processes, leading to both temporal and spatial variability [3]. The inherent dangers posed by heavy metals to aquatic ecosystems are closely associated with the complex interplay of these metals with water and sediment components, as these interactions significantly influence the behavior, distribution, and overall consequences of heavy metal presence within these environments [12]. The primary modes of heavy metal interactions with water and sediments involve adsorption and desorption processes [12,13]. In contrast to the water column, the sediments remain mainly stationary, preventing pollutants’ subsequent release and dissolution of pollutants back into the water [14]. However, various changes in environmental conditions (e.g., temperature, pH, Eh), can lead to the release of heavy metals from the sediments into the water above, consequently causing secondary pollution [4,15,16,17,18].
The heavy metal supply in waterbodies is generally associated with natural phenomena like chemical weathering, erosion and runoff, atmospheric deposition as well as biological processes of organisms, and human activities including industrial and agricultural production, mining activities, residential sewage, and industrial wastewater discharge [4,8,10,13,19] . Research indicates that soil erosion is typically associated with the transportation of pollutants like heavy metals which are bound to soil particles, because of the high adsorption ability of soil colloids, and organic matter [20]. Through this process, finer particles like clay and silt, with attached heavy metals, are selectively detached and carried, therefore accumulating these heavy metals in the eroded sediments [20,21]. Thus, soil erosion significantly contributes to redistributing heavy metals within the environment.
Iron and manganese are two of the most prevalent metals that contribute to the contamination of reservoirs and lakes by elevated metal concentrations [22]. In general, Fe and Mn are considered essential trace elements within aquatic ecosystems [23]. However, their overabundance can result in adverse consequences such as deteriorated water quality, escalated treatment expenses, and potential health risks. The effects of Mn and Fe, specifically, on water quality include changes in colour, marks and alterations in taste and smell of drinking water, which can lead to serious health problems [10]. High concentrations of Mn and Fe in drinking water are also linked to neurodevelopmental disorders in children like attention deficit hyperactivity disorder [24,25].
The elevated amounts of Fe and Mn in a dam reservoir can be attributed to various factors. The geochemistry of the catchment area plays a significant role in the concentrations of these metals in the water as the concentrations of Fe and Mn that prevail in the geological formations manifest divergences, with levels either below or surpassing those discerned in the reservoir sediments, thereby implying their potential influence on the water column [26]. Furthermore, the sediment present in the dam emerges as a plausible reservoir for Fe and Mn, primarily attributable to physico-biogeochemical processes. The variations observed across seasons and the brief-term dynamics governing the cycling of Fe and Mn within lakes and reservoirs, modulated by stratification dynamics and redox conditions, also contribute significantly to their escalated concentrations [27].
On the outskirts of the Pinios dam reservoir in Ilia Regional Unit, Greece, a freshwater refinery serves the water supply needs of the Municipalities of Elis, Pinios and Andravida-Killini. The refinery operated smoothly until November 2016, when a significant increase in Fe and Mn levels at the water intake point, surpassing the refinery's design limits, was observed. Consequently, the refinery was temporarily suspended. The primary objective of this research is to investigate the increased Fe and Mn in the reservoir of the Pinios dam and to understand the mechanism between them. The study, which was carried out during one hydrological year (May 2018 - May 2019), examines the dynamics of Fe and Mn through hydrochemical and sedimentological analyses at all monitoring stations established in the reservoir for this purpose. The research aimed to evaluate the spatial and temporal distribution of Fe and Mn, along with the analysis of major oxides, and other sediment characteristics in the reservoir bottom sediments, to understand the geochemical processes affecting the quality of water entering the reservoir. Moreover, the research seeks to propose strategies to mitigate elevated Fe and Mn levels in the reservoir, thereby ensuring that high water quality standards are maintained for the local population.
2. Background of the Study Area
The study area and the sampling stations selected for this research refer to the Pinios dam drainage basin and reservoir, located in the Ilia Regional Unit, in Western Greece. This dam is a heterogeneous earth-filled dam 50m high, 2175m long, with a final crest elevation of 100m and a reservoir with a total area of 19.87km2 completed in 1968. The reservoir collects the surface waters of a catchment area of 673.41 km2 and, according to the design, its total capacity at the level of +93m, (above which the overflow of the dam begins), is 415*106 m3 of water, while the reservoir's useful capacity is 365*106 m3 of water. The water is used for drinking and irrigation purposes and below +58m 50*106 m3 of water remains to maintain the ecological balance of the reservoir.
The geological setting of the research area consists mainly Alpine bedrock which is composed of formations from the Ionian, Gabrovo-Tripolis, and Pindos geotectonic zones of Greece (flysch and limestones) as well as Neogene and Quaternary sediments. The following map representing the geological formations of the surrounding area was created in ArcGIS Pro 3.3 based on four geological sheets of the Hellenic Survey of Geological and Mineral Exploration (Figure 1).
Increased rates of soil erosion [28,29] and shallow landslides [30] have been observed in the area around the dam, mainly due to the extensive fires that have occurred in the last 20 years [31]. This contributes to an increase in sediment deposition in the reservoir, which affects the concentration and distribution of Mn and Fe remaining in the artificial lake and thus the water quality.
Underneath the dam, a Water Treatment Plant (WTP), with a capacity of 2,014 m3/h, is supplied with water from the Pinios reservoir and, after treatment, it provides drinking water to the surrounding municipalities. The treatment includes pre-chlorination, screening, ozonation, flocculation, sedimentation, filtration and post-chlorination. The WTP temporarily ceased operation in November 2016 due to the recording of high concentrations of Fe and Mn in the untreated water, which did not allow the required treated water quality to be achieved. Since then, regular sampling and chemical analyses of the water entering the refinery have been carried out to identify the temporal variation of Fe and Mn concentrations in the raw water. The results of this variation for the years 2016-2017 are shown in Figure 2.
According to the Public Officials Act (Government Gazette 3282/B/19/09/2017) "Quality of water for human consumption in compliance with the provisions of Directive 98/83/EC of the Council of the European Union, of 3 November 1998 as amended by Directive (EU) 2015/1787", the drinking limit for manganese and iron are set at 50 μg/l and 200 μg/l respectively. As shown in Figure 2, these limits were exceeded several times during the years 2016-2017 and this triggered the present study.
As determined by the results of the measurements, Mn concentrations from April to early October 2016 were in the range of 75-100 μg/L. However, from late October to early December 2016, very high Mn concentrations were recorded, which in November of the same year exceeded 500 μg/l in several cases reaching a maximum of 890 μg/L (4/11/2016). In contrast, between the beginning of December 2016 and the second week of September 2017, Mn levels were low with an average value of 50 μg/L. Nevertheless, during the last ten days of October 2017, an increase in Mn concentrations was again recorded which ranged between 185-345 μg/l. Since then and until almost the beginning of December 2017, Mn levels in untreated water decreased again to values generally lower than 50 μg/l, except on 30/11/2017 when a high Mn value of 170 μg/l was again observed.
Similarly, Fe concentrations from April to early October 2016 were in the range of 200 μg/l. In contrast, from late October to early December 2016, very high Fe concentrations were recorded which averaged over 500 μg/l reaching a maximum of 1280 μg/l (29/11/2016). Since then, and until early December 2017, lower Fe levels were recorded with values varying between 35-270 μg/l. The exceeding of the acceptable water potability limits for Mn and Fe is related to the redox conditions prevailing into the reservoir during the referred periods.
3. Materials and Methods
Within the research area, monitoring and sampling stations were established for the analysis of reservoir sediments as well as incoming and stagnant water. The monitoring and sampling period covered a full hydrological year, from late May 2018 to late May 2019, focusing on Mn and Fe concentration values in water and sediments.
3.1. Sediment and Water Sampling in the Reservoir
Sediments were collected using a Van-Veen type grab with a sampling area of 0.04m2 from the bottom of the dam reservoir at stations P1, P2, P3, P4, P5, P6 and P7 (Figure 3), on 4/6/2018 and 9/10/2018, covering the summer and autumn seasons, respectively. Water column sampling to a depth of 30m was carried out at stations P1, P3 and P7 (Figure 3) on 9/10/2018 and at stations P3 and P7 on 22/02/2019, covering the autumn and winter seasons, respectively. The water depth at each sampling station during the above periods is presented in Table 1.
At sites P3 and P7, an in situ recording of the profile of the water column physicochemical properties, temperature (T °C), pH and dissolved oxygen (DO mg/L), per meter depth (1m) was carried out in the autumn (9/10/2018) and winter period (22/02/2019). In addition, at sites P1, P3 and P7, water samples were collected to a depth of 30m for laboratory analyses with a step of 5m using a 2.2L vertical device. The sediments as well as the water samples were placed in a portable refrigerator for transport to the laboratory, while the preservation of the sediment was done at -4 °C and the water was analysed within twenty-four hours for nutrients and acidified for heavy metal analysis.
Surface water sampling was also carried out on 04/06/2018, 09/10/2018 and 22/02/2019. Water was sampled at a depth of 0.5 m from the surface of the reservoir using one litre polyethene plastic bottles. Samples were also collected in a 100ml polyethene bottle after filtering with a 0.45μm filter to remove particles and acidification with HNO3.
3.2. Runoff Water Sampling
During the current research runoff water sampling was carried out on 24/05/2018, 12/10/2018, 29/11/2019, 18/12/2019, 30/01/2019, 22/02/2019 and 31/03/2019 at six locations (Stations: S1-S6) which correspond to the tributaries and the main branch of the Pinios River basin (Figure 4). The samples were collected in two polyethene bottles of 1L and 100ml. The samples in the 100 ml bottle were collected after filtering in situ with a 0.45μm filter to remove particles and acidification with HNO3 [32].
All water samples collected from both the reservoir and the surrounding tributaries covered a full hydrological year, as well as episodes of heavy rainfall, to investigate the effect of heavy rainfall on the water chemistry of the rivers flowing into the dam reservoir. The samples were transferred to the Hydrogeology Laboratory of the Department of Geology of the University of Patras for chemical analysis and in particular for the determination of iron and manganese concentrations, as well as the main cations calcium, magnesium, sodium and potassium. In situ measurements of the unstable physicochemical parameters of temperature, conductivity and pH were also carried out with a YSI 63 multiparameter measuring electrode, while alkalinity was determined using the HACH titration method.
3.3. Granulometric Analysis of Sediments
For the particle size analysis of the collected sediment samples, the most common methodological scheme for sediment particle size analysis was used, which is divided into two sub-methods: (i) the dry sieving method for the granulometric classes of gravel and sand, and (ii) the granulometric analysis using the Malvern Mastersizer 2000 Hydro (Laser Analysis) for the granulometric classes of silt and clay. This analysis aims to describe the collected sediments in terms of their lithological nomenclature and statistical description. The separation of the fine-grained material (silt and clay) from the coarse-grained material (gravel and sand) was carried out by wet sieving. In the coarse fraction the particle size analysis was carried out using sieves and in the fine fraction using the Malvern Mastersizer 2000 Hydro.
The results of the analyses are presented as a cumulative percentage by weight curve and as triangular diagrams according to [33] and [34]. The results of the particle size analysis and the calculation of the statistical parameters were processed using the GRADISTAT software [35]. The statistical parameters that were calculated are Md (Median), Mz (Mean size), σi (Standard deviation), Ski (asymmetry) and KG (Kurtosis). They were calculated using the graphical method (graphic measure: [36]).
3.4. Geochemical Analysis of Sediments
The geochemical analyses that were performed on the collected sediments included: (i) the determination of Total Organic Carbon (TOC), Total Phosphorus (TP), Calcium Carbonate (CaCO3), Total Carbon (TC), Total Nitrogen (TN), and (ii) the determination of major elements. The quantification of organic carbon was carried out by the potassium dichromate (K2Cr2O7) oxidation method according to [37] and [38]. The determination procedure is based on the oxidation of organic substances with potassium dichromate and concentrated sulphuric acid. The amount of potassium dichromate consumed is determined by titration of the excess with a solution of divalent iron. Diphenylamine is used as an indicator for the end of the volumetric measurement.
For the determination of total carbon (TC) and total nitrogen (TN), a CHNS-O EA 1108 Elemental Analyzer type from Carlo Erba was used. The measurements were carried out at the Instrumental Analysis Laboratory of the University of Patras. The operating principle of this instrument is based on chromatographic analysis by heating the sample under study at 1020 °C. The final results after the measurement are normalized based on standard samples and then the weight calculation is performed. The apparatus for storing and processing the data uses the Eager 200 software. The percentage of carbonate in the samples was determined using the FOG II/Digital hand-held soil calcimeter Version 2/2014 of BD INVENTIONS. The operating principle of the device is based on the measurement of CO2 emissions after the reaction of the sample with 6 N hydrochloric acid according to [39] and [40].
Total phosphorus was determined according to the APHA 2005-4500-P method [41], using a DR 2800 spectrophotometer from HACH. Initially, for each sample, 0.3 grams were weighed on a four-decimal precision scale. The samples were then powdered and placed in 100 ml volumetric flasks. 50 ml of H20, 0,5 gr of K2S2O8 and 1 ml of H2SO4 were added and the samples were boiled for 30 min. For the preparation of H2SO4, 300 ml of H2SO4 was used and diluted in 1 l H2O. After boiling - digestion the samples were filtered into 100 ml volumetric tubes. The filtration products were then placed in standard HACH-Lange LCK 349 reagents and measured spectrometrically.
The concentrations of 10 major elements (Si, Al, Ca, Mg, Mn, P, Fe, Na, K and Ti) measured by comparing the X-ray intensities of each element with those of calibration curves, constructed from the analysis of known concentrations in 32 international standards. For the preparation of the pressed "tablets", 1.8g of dry sample powder was used, which was mixed with 0.2g of wax, which acts as an adhesive, and 15 tons of pressure was applied to the final product. The compressed "tablets" were analyzed with the X-ray Fluorescence Wavelength Dispersive Spectrometer (WD-XRF) type ZSX PRIMUS II, RIGAKU, which is equipped with a 4 kW Rh lamp. The instrument is located at the premises of the Electron Microscopy and Microanalysis Laboratory of the University of Patras.
3.5. Chemical Analysis of Water Samples
After each sampling, water samples were transferred to the laboratory for chemical analysis and determination of the main cations (Ca+2, Mg+2, Na+, K+, ΝH4+), the main anions (NO3-, ΝO2-, PO4-3, HCO3-, SO42-και Cl-), and the metals (Fe and Mn). Using the Hach DR/4000 spectrophotometer, nitrate (NO3-), nitrite (NO2-), ammonia (NH4+), sulfate (SO42-), and phosphate (PO4-3) were determined using the HACH DR/4000 spectrophotometer. The analyses for the determination of nitrogen and phosphate compounds were performed within 24 hours of sampling. Alkalinity, from which bicarbonate (HCO3-) was calculated, was determined by the HACH titration method, while chloride ions (Cl-) were determined by titration with AgNO3.
The cations Ca+2, Mg+2, Na+ and K+ as well as the metals Fe and Mn were determined by atomic absorption spectroscopy using the Perkin Elmer Pinacle 900. The flame technique was used for the determination of the above elements and the proposed methodologies for each element were followed as described by both the company PerkinElmer Inc. [42] and the international literature [43,44,45]. The detection limit, i.e. the lowest concentration that can be detected by the device using the methodology followed for manganese is 10 µg/l.
4. Results
4.1. Classification of the Reservoirsediments
The results of the particle size analysis show that the bottom sediments of the Pinios dam reservoir at the sampling locations P1, P2, P3, P5, and P6 are classified as M-Mud and at the locations P4 and P7 as Z-SILT. The distribution of percentages and the ranking of samples using a triangular FOLK diagram are shown in Figure 5.
The aggregated results with the percentage of each class and their calculated statistical parameters are presented in Figure 6. The sand content in the analyzed samples ranged from 0.87 to 7.53 % with an average value of 3.59 %, the percentage of silt varied between 53.09 and 71.77 % with an average value of 60.52 % and the clay component ranged from 25.20 % to 45.16 % averaging at 35.89 %. It seems that silt prevails among the sediment compounds. Sand is lowest at station P3 which is located at the central part of the reservoir and highest at the P2 which is near the Velitseiko mouth while clay has the higher percentage at station P6 and the lowest at P4 where the Pinios River's primary channel enters the water reservoir.
4.2. Geochemical Analysis of the Reservoir Sediments
4.2.1. TOC / TN / TP / TC / CaCO3
The results of the determination of Total Organic Carbon (TOC), Total Phosphorus (TP), Calcium Carbonate (CaCO3), Total Carbon (TC) and Total Nitrogen (TN) of the bottom sediments of the reservoir are presented in the following table (Table 2) and chart of Figure 7.
The bars represent the percentage composition of TOC and TN, and the green line with markers indicates the concentration of TP in mg/kg for each sample. It seems that there is variability in the concentration of each component across the samples. For instance, TOC and TC percentages show a pattern where they peak at P1, decrease until P4, and rise again towards sample P7. TP concentration, shown by the green line, does not follow the same pattern as the bar chart components as it peaks at P1, decreases significantly at P2, and varies less significantly in the subsequent samples. The concentration of TP does not seem to correlate directly with the percentage of TOC, TC, or TN as the peaks and troughs of TP do not align with the changes in TOC, TC, or TN, suggesting that the processes influencing phosphorus content may be different from those affecting organic and total carbon or nitrogen content.
4.2.2. Major Elements
The results from the determination of the major elements of the sediment samples are presented in the following charts. Figure 8 is a horizontal stacked bar chart that shows the composition of major elements in samples P1 through P7, expressed as a percentage of the total composition. Each coloured segment within a bar represents a different element, and the length of the segment corresponds to the proportion of that element in the sample. Below the chart, there are two rows of values labelled "UCC" and "SHALES", that represent average compositions for the upper continental crust and average shale compositions, respectively, which serve as reference.
The observed levels of manganese (MnO) and iron (Fe2O3) oxides in the sediment samples exhibit elevated concentrations when compared to typical shale compositions as documented by [46], as well as the averages found in the Upper Condimental Crust (UCC) as reported by [47], indicating a possible source material rich in Fe and Mn and a depositional environment that promotes Fe oxidation. The variation of MnO and Fe2O3 concentrations in each sediment sample is presented in Figure 9.
The spatial distribution of MnO and Fe2O3 in the reservoir sediments (Figure 10) is represented with the Inverse Distance Weighting (IDW) technique using ArcGIS Pro. This approach calculates the values for cells in a raster grid by considering the inverse proportion of their distance from a set of known sample points.
4.3. Water Column Stratification
Based on the in-situ measurements of the water column at sampling stations P3 and P7 on 9/10/2018 (dry season), a stratification of the water column was identified in which three main sections were distinguished. The first one is superficial and is up to a depth of about 15m (+61m) from the reservoir surface and is well oxygenated, the second one is identified between 15 and 18m(+58m) and is hypoxic and the third one is identified below 18m and fully anoxic. Typical plots of stratification in the water column with the distribution of dissolved oxygen, temperature and pH per depth are presented for the sampling stations P7 and P3 in Figure 11.
The distribution of the physicochemical parameters of the water column for the respective sampling on 22/02/2019 shows a different behaviour. During the winter sampling the values of pH, dissolved oxygen and temperature at both sampling stations (P3 and P7) do not vary with depth. This indicates a lack of stratification and homogenization of the water column during the winter months, due to the inflow of freshwater from rainfall events and the subsequent homogenization of the water column which is also confirmed by the increase of dissolved oxygen in the water column compared to the results from the dry season. Characteristic plots of the water column measurements for the dissolved oxygen, temperature and pH in the wet season are shown in Figure 12.
4.4. Chemical Analysis of Water Samples
Figure 13, Figure 14 and Figure 15 present the results of the chemical analyses of the runoff water samples from the sampling stations located in the tributaries of the Pinios River network from May 2018 to March 2019.The water samples were analyzed for major cations/anions, Fetot and Mn content, as well as for pH, Temperature (°C), and Conductivity at 25 ◦C.
Total iron concentrations vary significantly, ranging from non-detectable (ND) to 0.65 mg/l. Manganese levels remain relatively low, varying between 0.01 mg/l and 0.08 mg/l. The seasonal trends reveal that iron concentrations tend to increase in the winter months, while manganese shows a less pronounced seasonal variation, though concentrations are generally higher in autumn and winter.
Calcium concentrations range from 48 mg/l to 108.4 mg/l across the stations and dates, with the highest values observed at S3 and S2. Magnesium levels fluctuate between 1.2 mg/l and 19.2 mg/l, with peaks at stations like S6 and S2. These elevated levels of calcium and magnesium may suggest significant input from limestone or dolomite weathering. Sodium shows considerable variation, from as low as 7.9 mg/l to as high as 49.3 mg/l, with S2 consistently showing higher values. Potassium concentrations are consistently low, ranging between 0.2 mg/l and 1.6 mg/l. Bicarbonate concentrations are relatively high, ranging from 162.3 mg/l to 308.7 mg/l. The highest values observed at S2 and S3 may suggest significant carbonate rock weathering or groundwater inputs, which also contribute to increased conductivity in these stations. Sulfate levels range from 0.8 mg/l to 69 mg/l, with a significant spike at S3 in February 2019. Chloride values range from 19.4 mg/l to 72.6 mg/l, with the highest concentrations observed in S2, likely due to agricultural runoff. Nitrate concentrations are generally low, between 0 mg/l and 12 mg/l, with higher values recorded at S1 and S3 in December 2018. Nitrite levels are very low across the stations, typically below 0.1 mg/l with a maximum value equal to 0.175 mg/l at S4. Ammonium concentrations range from 0 mg/l to 1.316 mg/l, with a notable spike at S4 in January 2019. Phosphate levels are mostly low, ranging from 0 mg/l to 2.073 mg/l, with the highest value recorded at S1 in March 2019.
The pH values remain slightly alkaline, ranging from 7.5 to 8.6. Water temperatures (°C) vary seasonally, with values between 9.6 °C and 24 °C. Conductivity at 25°C (μS/cm) from 257 μS/cm to 779 μS/cm, with the highest values observed at S2. Elevated conductivity is linked to higher concentrations of dissolved ions, particularly at stations with significant bicarbonate, sulfate, and chloride levels.
The following maps (Figure 16) present the spatial distribution of Mn and Fetot of the reservoir’s surface water samples from June 2018 to January 2019.The distribution is visualized using the Inverse Distance Weighting (IDW) method in ArcGIS Pro, which estimates cell values in a raster from a set of sample points based on the inverse of their distance to the points. The northern part of the reservoir consistently shows higher concentrations of both Mn and Fe throughout all sampling periods, possibly due to localized geochemical or hydrological processes, such as the inflow of water rich in these metals or reducing conditions in the sediments that promote metal solubilization. Seasonal variations seem to play a significant role, with concentrations of both Mn and Fe increasing from June to October, possibly due to temperature and redox changes in the reservoir water, which enhance the dissolution of metals from sediments.
Furthermore, the following charts present the variations of Fe and Mn concentrations of the reservoir’s surface water samples for the dates 04/06/2018, 09/10/2018 and 22/02/2019 in contrast with the Fe and Mn influx from the surrounding tributaries on 31/01/2019 as well as on 22/02/2019(Figure 17). Considering these charts and the spatial distribution maps above, it is concluded that on 04/06/2018the Mn fluxes from the tributaries Piniakos Ladonas and Velitseiko are slightly higher than the maximum allowed concentration of 50 μg/l, which is also reflected in the stations P5 and P2, that are close to these tributaries, respectively.
On 09/10/2018the Mn fluxes from the Velitseiko tributary are slightly higher than the maximum allowed concentration of 50 μg/l, which is also reflected in the nearby P2 station. However, at depths greater than 20m, at stations P1 and P7, Mn concentrations reach values over 200 μg/l, which occur with the same values at the outlet of the water from the dam gate (station P8).
On 22/02/2019the Mn fluxes from the Pinios River, and the tributaries Piniakos Ladons and Velitseiko are significantly reduced and range below the permitted limits of 50 μg/l, while on the contrary, Fe fluxes increase significantly and range above the permitted limits of 200 μg/l. Correspondingly, the values of Mn on the surface of the reservoir and at the water outlet range between 50μg/l-100μg/l, while those of Fe are close to the limit of 200μg/l. At depths greater than 20m, at stations P1 and P7, Mn concentrations range between 50μg/l-100μg/l, while those of Fe are close to the limit of 200μg/l.
The stratification that was identified on 9/10/2018 (dry season) is also visible in the variation of manganese concentrations. As shown in Figure 18, the manganese concentration at station P3 (20m depth), where reducing conditions (anoxic) prevail, increases and reaches 112 µg/l. In the same depth at station P1, it reaches 331 µg/l, while at station P7 it reaches 210 µg/l. The station P7 also recorded a value of 379 µg/L at a depth of 25 meters. Therefore, at the outlet of the water from the dam gate at depths from +58 to +61, the concentration of Mn is high, reaching 226 μg/l. Iron concentrations are elevated relative to Mn concentrations with the highest concentrations occurring up to a depth of 10m. The stratification of the column is also followed by the concentration of ammonium ion (NH4+), which at P7 from 0.032 mg/l at 0.5 m reaches 0.305 mg/l at 25m.
5. Discussion
The examined sedimentological parameters show that the bottom sediments of the reservoir’s dam consist of fine-grained sediments which are classified as M-Mud and Z-SILT and are characterized by medium to rich in total organic carbon (TOC>0.5%). The geochemical analyses of the sediments at most sampling stations show high values of manganese (MnO) and iron (Fe2O3) oxides in relation to the corresponding values of the clays (shales) and the surface part of the earth's crust (Upper Condimental Crust – UCC). This finding is mainly due to the fluxes of the above Fe and Mn oxides, as weathering materials of the Neogene formations and the flysch, which structure a large part of the upstream reservoir's catchment area, reach through soil erosion and runoff processes into the tributaries and then into the dam water reservoir. Upon entering the surface layer of the reservoir, iron and manganese oxides participate in biogeochemical processes. The main geochemical process is their partial dissolution during their journey from the surface water layer to the bottom of the reservoir. The conditions related to their dissolution are the Eh which is linked to the availability of oxygen, pH, pressure, and temperature of the lake water. Based on the analysis of the hydrochemical parameters of the reservoir water column, it can be inferred that in reducing conditions (lack of oxygen) the partial dissolution of the oxides results in the enrichment of the water column in iron and manganese ions. The chemical reactions for manganese (Mn) and iron (Fe) under anoxic conditions in water are shown below.
Fe2O3(s) + 6H+ +2e− ⟶ 2Fe2+(aq) + 3H2O(l)
MnO2(s) + 4H+ + 2e− ⟶ Mn2+ + 2H2O
During the autumn/dry season, high manganese concentrations (Mn>200 μg/l) are observed below the +61m altitude, where there is an outlet of water from the dam gate, which flows to the Water Treatment Plant. Between the altitudes of 61-65m, a layer of manganese concentration is observed with values ranging between 100<Mn<200μg/l. Finally, at altitudes higher than +65m, which is the minimum ecological and operational level of water of the dam, Mn concentrations have values of Mn<50μg/l. In contrast, during the winter/wet period, manganese concentrations are homogenized and range throughout the water column between 50<Mn<100μg/l. It is noticeable that the variation of Fe and Mn oxides at the bottom of the reservoir shows that the concentration of Fe oxides in the sediment is higher compared to the Mn oxides at all positions. The thermodynamic stability of Fe and Mn oxides indicates that Mn oxides are more sensitive to reducing conditions and dissolve more easily than Fe oxides. As a result, in the anoxic layers of the water column in the autumn/dry season, below the +58 m altitude, very high Mn concentrations are observed, which exceed Fe concentrations, while in the oxygenated surface layer (+61 m to +86m) Fe concentrations predominate over Mn. The above hydrogeochemical process is confirmed by the stratification of the reservoir water column and the distribution with depth of the hydrochemical analyses of Fe and Mn, a phenomenon that was observed during the autumn/dry period. Conversely, during the winter/wet season no stratification of the water column is observed due to the influx of fresh water originating from rainfall events as the larger amounts of water received by the reservoir seem to lead to the subsequent homogenization of the water column with a decrease in Mn levels. This is confirmed by the increase of dissolved oxygen in the water column by 35% on average, comparing the relative dissolved oxygen versus depth plots for the wet and dry seasons, respectively.
The accumulation of Fe and Mn in sediment is intricately influenced by factors including redox processes, mixing dynamics, and biological activity [48]. Their concentrations in bottom sediments are typically much higher than those in the water, a distinction attributable to the limited solubility of these elements in the form of salts [23]. The behavior of Fe and Mn is additionally influenced by sediment resuspension, a variable that can be impacted by external factors such as inflow patterns and the direction and speed of the wind [22,49]. In their 2020 study, Krueger et al. investigated the dynamics of Fe and Mn fluxes in the hypolimnion of Falling Creek water reservoir in Virginia (USA) during thermal stratification, revealing the significant influence of dissolved oxygen (DO) and redox conditions on the solubilization and release of these metals from sediments into the water column. Low dissolved oxygen in the hypolimnion of drinking water reservoirs can reduce oxidized, insoluble Fe and Mn in sediments to soluble forms, which are then released into the water column [50]. Munger et al. studied the spatial and seasonal variability of Mn and Fe in a reservoir which is influenced mainly by the reservoir stratification as the accumulation of Fe and Mn in the water column is driven by the reduced conditions within the bottom sediments [10]. Several studies have also pointed out the importance of managing Mn release at the interface between sediment and water through the application of hypolimnetic oxygenation techniques [51,52,53].
The results of the hydrochemical analyses in early summer (04/06/2018) showed that the Mn fluxes from the tributaries Piniakos Ladonas and Velitseiko were slightly higher than the maximum allowable concentration of 50 μg/l, which was recorded at stations P5 and P2 at the margins of the reservoir. On09/10/2018the Mn fluxes from the Velitseikotributary were found to be slightly higher than the maximum allowed concentration of 50 μg/l, which was recorded in the nearby station P2. However, at depths greater than 18-20m, at stations P1 and P7, the concentrations of Mn soar to values above 200 μg/l, which also appears at the water outlet of the dam gate, at station P8.On22/02/2019theMn fluxes from the Pinios River, and the tributaries Piniakos Ladonas and Velitseiko were significantly reduced and ranged below the permitted limits of 50 μg/l, while on the contrary, Fe inputs increased significantly and fluctuated above the permitted limits of 200 μg/l. Correspondingly, the values of Mn on the surface waters of the reservoir and at the water outlet ranged between 50mg/l to 100mg/l, while those of Fe are close to the limit of 200μg/l. At depths greater than 18-20m, the concentrations of Mn vary between 50mg/l to 100mg/l, while those of Fe are close to the limit of 200μg/l.
Concerning the hydrochemical analyses of water in the river system of the Pinios basin, it appears that the most predominant ions in the water are calcium (Ca2+) and bicarbonate (HCO3-). Their average values reach73.3mg/l for calcium and 233mg/l for bicarbonate. According to the Geochemical Atlas of Europe [54], calcium values in European river waters range from 0.02 mg/l to 592 mg/l with an average value of 40 mg/l. The presence of these ions originates from the mineral components of the carbonate rocks, which structure the catchment area of the Pinios River. Nitrogen and phosphate vary in very low concentrations, so there is no pollution in the river waters from these compounds.
However, the presence of Fe and Mn ions in the water is quite remarkable. Manganese values in the European river waters range from <0.05 µg/l to 698 µg/l with an average value of 15.9 µg/l, while the global average is 10 µg/l [54]. The average value of manganese in the Pinios River and its tributaries is 39.3µg/l, which is above the average concentration of manganese in European rivers. Iron values in European river waters range from <1µg/l to 4820µg/l with an average value of 67µg/l, while the global average is 40µg/l [54]. The average value of Fe in the Pinios River and its tributaries is 189µg/l, which is also above the average concentration of iron in European rivers. Manganese concentration values do not differ significantly in the different periods and fluctuate at the same levels, while iron concentrations show an increase during the winter months especially during January, February, and March, when high and intense rainfall occurs in the research area. Since the manganese and iron ions in the river waters originate from the erosion of the Neogene and Flysch formations that constitute a large part of the Pinios river basin, it seems that intense precipitation causes this increased concentration inf iron and manganese. The mobility of these ions in surface waters is a complex process and is affected by many factors, such as redox potential, pH, and the presence of organic matter [55].
Similar concentrations of manganese and iron ions are also present in the surface water of the reservoir, which receives the water of the Pinios River and its tributaries, with an average value of 46µg/l for Mn and 81µg/l for Fe during the summer season (04/06/2018)and an average value of 63μg/l for Mn and 186μg/l for Fe during the sampling of the winter season (22/02/2019).Thus, it appears that in the surface layer of the reservoir (0.5 m from the surface) the concentration of these ions is influenced by the concentration of ions in the waters of the rivers flowing into the reservoir. In the deeper layers of the reservoir, the concentrations of iron and manganese ions are modulated by the redox conditions, temperature, water pH and the presence of organic matter.
6. Conclusions
This comprehensive study, conducted around the Pinios dam basin over a hydrological year from May 2018 to May 2019, has provided significant insights into the sedimentological and hydrochemical characteristics of the area. The research revealed that the bottom sediments of the dam’s reservoir are predominantly fine-grained, with a medium to high content of total organic carbon, indicating a rich organic material presence. Geochemical analyses highlighted high levels of Mn and Fe oxides, surpassing typical concentrations found in clays and the upper continental crust, attributed to the weathering materials from the upstream area reaching the streams and the water reservoir through soil erosion and runoff processes. This study also detailed the dynamic hydrochemical processes within the water column, showing the partial dissolution of Fe and Mn oxides under reducing conditions, leading to their enrichment in the water. Seasonal variations were observed in Mn and Fe concentrations, with higher Mn levels noted during the autumn/dry season in deeper water layers, while winter brought about homogenization of these concentrations across the water column due to the increased rainfall and subsequent influx of fresh water.
Moreover, the study's findings on the exceedance of potability limits for Mn and Fe in water entering the Water Treatment Plant (WTP), which is supplied with water from the Pinios reservoir and after treatment, it provides drinking water to the surrounding municipalities underscore the environmental and public health implications of metal ion concentration in water sources. The continuous presence of calcium ions and bicarbonate ions in the river waters of the Pinios basin, together with the remarkable concentrations of Mn and Fe, indicates the significant geochemical influence on water quality of the mineral components of the geological bedrock of the upstream part of the basin, which are precipitated through soil erosion and surface runoff into the reservoir.
In conclusion, this research underlines the critical need for ongoing monitoring and management of water quality in dam reservoirs and their contributing river basins. The observed fluctuations in metal ion concentrations, particularly Mn and Fe, highlight the intricate balance between geological, sedimentological and hydrological, processes influencing the water chemistry. These insights are vital for informing water treatment practices and ensuring the safety and sustainability of water resources in regions similar to the Pinios dam basin.
Author Contributions
Conceptualization, M.M. and N.D.; methodology, M.M., N.D., P.A., E.Z.; validation, N.D. and P.A.; formal analysis, M.M. and P.A.; investigation, M.M., N.D., P.A. and E.Z.; resources, N.D. and P.A.; data curation, M.M., N.D., P.A. and E.Z.; writing—original draft preparation, M.M.; writing—review and editing, M.M., N.D. and P.A.; visualization, M.M. and N.D.; supervision, N.D.; project administration, N.D.; funding acquisition, N.D. All authors have read and agreed to the published version of the manuscript.
Funding
Water Supply Association "Pinios Ilias"
Data Availability Statement
Data are available from the authors upon request
Conflicts of Interest
The authors declare no conflict of interest. The funders had no role in the design of the study; in the collection, analyses, or interpretation of data; in the writing of the manuscript; or in the decision to publish the results.
References
- Herschy, D. Dams and Reservoirs, Role. In Encyclopedia of Earth Sciences Series; 2012; pp. 191–199 ISBN 978-1-4020-5616-1.
- Moldovan, A.; Török, A.I.; Kovacs, E.; Cadar, O.; Mirea, I.C.; Micle, V. Metal Contents and Pollution Indices Assessment of Surface Water, Soil, and Sediment from the Arieș River Basin Mining Area, Romania. Sustainability 2022, 14, 8024. [Google Scholar] [CrossRef]
- Sojka, M.; Jaskuła, J.; Barabach, J.; Ptak, M.; Zhu, S. Heavy Metals in Lake Surface Sediments in Protected Areas in Poland: Concentration, Pollution, Ecological Risk, Sources and Spatial Distribution. Sci. Rep. 2022, 12, 15006. [Google Scholar] [CrossRef] [PubMed]
- Wu, D.; Liu, H.; Wu, J.; Gao, X. Spatial Distribution, Ecological Risk Assessment and Source Analysis of Heavy Metals Pollution in Urban Lake Sediments of Huaihe River Basin. Int. J. Environ. Res. Public Health 2022, 19, 14653. [Google Scholar] [CrossRef] [PubMed]
- Pochodyła-Ducka, E.; Glińska-Lewczuk, K.; Jaszczak, A. Changes in Stormwater Quality and Heavy Metals Content along the Rainfall–Runoff Process in an Urban Catchment. Water 2023, 15, 3505. [Google Scholar] [CrossRef]
- Yang, L.; Li, J.; Zhou, K.; Feng, P.; Dong, L. The Effects of Surface Pollution on Urban River Water Quality under Rainfall Events in Wuqing District, Tianjin, China. J. Clean. Prod. 2021, 293, 126136. [Google Scholar] [CrossRef]
- Szeląg, B.; Górski, J.; Bąk, Ł.; Górska, K. The Impact of Precipitation Characteristics on the Washout of Pollutants Based on the Example of an Urban Catchment in Kielce. Water 2021, 13, 3187. [Google Scholar] [CrossRef]
- Rezapour, S.; Asadzadeh, F.; Nouri, A.; Khodaverdiloo, H.; Heidari, M. Distribution, Source Apportionment, and Risk Analysis of Heavy Metals in River Sediments of the Urmia Lake Basin. Sci. Rep. 2022, 12, 17455. [Google Scholar] [CrossRef]
- Avramidis, P.; Samiotis, A.; Kalimani, E.; Papoulis, D.; Lampropoulou, P.; Bekiari, V. Sediment Characteristics and Water Physicochemical Parameters of the Lysimachia Lake, Western Greece. Environ. earth Sci. 2013, 70, 383–392. [Google Scholar] [CrossRef]
- Munger, Z.W.; Shahady, T.D.; Schreiber, M.E. Effects of Reservoir Stratification and Watershed Hydrology on Manganese and Iron in a Dam-regulated River. Hydrol. Process. 2017, 31, 1622–1635. [Google Scholar] [CrossRef]
- Winton, R.S.; Calamita, E.; Wehrli, B. Reviews and Syntheses: Dams, Water Quality and Tropical Reservoir Stratification. Biogeosciences 2019, 16, 1657–1671. [Google Scholar] [CrossRef]
- Miranda, L.S.; Wijesiri, B.; Ayoko, G.A.; Egodawatta, P.; Goonetilleke, A. Water-Sediment Interactions and Mobility of Heavy Metals in Aquatic Environments. Water Res. 2021, 202, 117386. [Google Scholar] [CrossRef] [PubMed]
- Katsaros, D.; Panagiotaras, D.; Kontopoulos, N.; Avramidis, P. Sediments Characteristics and Heavy Metals Distribution of a Very Shallow Protected Coastal Lagoon, Prokopos Lagoon, Mediterranean Sea Western Greece. Feb-Fresenius Env. Bull 2017, 26, 6093. [Google Scholar]
- Ustaoğlu, F.; Tepe, Y. Water Quality and Sediment Contamination Assessment of Pazarsuyu Stream, Turkey Using Multivariate Statistical Methods and Pollution Indicators. Int. Soil Water Conserv. Res. 2019, 7, 47–56. [Google Scholar] [CrossRef]
- Wang, C.; Wang, K.; Zhou, W.; Li, Y.; Zou, G.; Wang, Z. Occurrence, Risk, and Source of Heavy Metals in Lake Water Columns and Sediment Cores in Jianghan Plain, Central China. Int. J. Environ. Res. Public Health 2023, 20, 3676. [Google Scholar] [CrossRef]
- Wijesiri, B.; Liu, A.; Goonetilleke, A. Impact of Global Warming on Urban Stormwater Quality: From the Perspective of an Alternative Water Resource. J. Clean. Prod. 2020, 262, 121330. [Google Scholar] [CrossRef]
- Bing, H.; Zhou, J.; Wu, Y.; Wang, X.; Sun, H.; Li, R. Current State, Sources, and Potential Risk of Heavy Metals in Sediments of Three Gorges Reservoir, China. Environ. Pollut. 2016, 214, 485–496. [Google Scholar] [CrossRef]
- Fu, J.; Zhao, C.; Luo, Y.; Liu, C.; Kyzas, G.Z.; Luo, Y.; Zhao, D.; An, S.; Zhu, H. Heavy Metals in Surface Sediments of the Jialu River, China: Their Relations to Environmental Factors. J. Hazard. Mater. 2014, 270, 102–109. [Google Scholar] [CrossRef]
- Debnath, A.; Singh, P.K.; Sharma, Y.C. Metallic Contamination of Global River Sediments and Latest Developments for Their Remediation. J. Environ. Manage. 2021, 298, 113378. [Google Scholar] [CrossRef]
- Meng, Y.; Li, P.; Xiao, L.; Wang, R.; Yang, S.; Han, J.; Hu, B. Heavy Metal Content and Pollution Assessment in Typical Check Dam Sediment in a Watershed of Loess Plateau, China. Sustainability 2022, 14, 8597. [Google Scholar] [CrossRef]
- Quinton, J.N.; Catt, J.A. Enrichment of Heavy Metals in Sediment Resulting from Soil Erosion on Agricultural Fields. Environ. Sci. Technol. 2007, 41, 3495–3500. [Google Scholar] [CrossRef]
- Semasinghe, C.; Rousso, B.Z. In-Lake Mechanisms for Manganese Control—A Systematic Literature Review. Sustainability 2023, 15, 8785. [Google Scholar] [CrossRef]
- Koszelnik, P.; Bartoszek, L. Influence of Sedimentary Fe and Mn on the Oxygenation of Overlying Waters in Dam Reservoirs. J. Ecol. Eng. 2018, 19. [Google Scholar] [CrossRef] [PubMed]
- Schullehner, J.; Thygesen, M.; Kristiansen, S.M.; Hansen, B.; Pedersen, C.B.; Dalsgaard, S. Exposure to Manganese in Drinking Water during Childhood and Association with Attention-Deficit Hyperactivity Disorder: A Nationwide Cohort Study. Environ. Health Perspect. 2020, 128, 97004. [Google Scholar] [CrossRef] [PubMed]
- Schildroth, S.; Kordas, K.; Bauer, J.A.; Wright, R.O.; Claus Henn, B. Environmental Metal Exposure, Neurodevelopment, and the Role of Iron Status: A Review. Curr. Environ. Heal. Reports 2022, 9, 758–787. [Google Scholar] [CrossRef]
- Tometin, L.A.S.; Avahounlin, F.R.; Topanoun, K.N.; Bawa, L.M.; Mama, D. Iron and Manganese Assessment in Surface and Under Profile Sediment of Water Dam and His Under-Catchment Area: Case of Okpara Dam in Benin, West Africa. J. Appl. Sci. Environ. Manag. 2023, 27, 191–196. [Google Scholar] [CrossRef]
- Hammond, N.W.; Birgand, F.; Carey, C.C.; Bookout, B.; Breef-Pilz, A.; Schreiber, M.E. High-Frequency Sensor Data Capture Short-Term Variability in Fe and Mn Concentrations Due to Hypolimnetic Oxygenation and Seasonal Dynamics in a Drinking Water Reservoir. Water Res. 2023, 240, 120084. [Google Scholar] [CrossRef]
- Depountis, N.; Michalopoulou, M.; Kavoura, K.; Nikolakopoulos, K.; Sabatakakis, N. Estimating Soil Erosion Rate Changes in Areas Affected by Wildfires. ISPRS Int. J. Geo-Information 2020, 9. [Google Scholar] [CrossRef]
- Michalopoulou, M.; Depountis, N.; Nikolakopoulos, K.; Boumpoulis, V. The Significance of Digital Elevation Models in the Calculation of LS Factor and Soil Erosion. Land 2022, 11, 1592. [Google Scholar] [CrossRef]
- Lainas, S.; Depountis, N.; Sabatakakis, N. Preliminary Forecasting of Rainfall-Induced Shallow Landslides in the Wildfire Burned Areas of Western Greece. Land 2021, 10, 877. [Google Scholar] [CrossRef]
- Panagiotaras, D.; Kokkoris, I.P.; Avramidis, P.; Papoulis, D.; Koulougliotis, D.; Gianni, E.; Lekka, D.; Christodoulopoulos, D.C.; Nifora, D.; Druvari, D. A Local-Scale, Post-Fire Assessment in a Double-Burned Area: A Case Study from Peloponnisos, Greece. L. 2024, 13. [Google Scholar] [CrossRef]
- Appelo, C.A.J.; Postma, D. Geochemistry, Groundwater and Pollution: Leiden, The Netherlands 2005.
- Folk, R.L.; Andrews, P.B.; Lewis, D.W. Detrital Sedimentary Rock Classification and Nomenclature for Use in New Zealand. New Zeal. J. Geol. Geophys. 1970, 13, 937–968. [Google Scholar] [CrossRef]
- Folk, R.L. Petrology of Sedimentary Rocks; Hemphill publishing company, 1980; ISBN 0914696149.
- Blott, S.J.; Pye, K. GRADISTAT: A Grain Size Distribution and Statistics Package for the Analysis of Unconsolidated Sediments. Earth Surf. Process. Landforms 2001, 26, 1237–1248. [Google Scholar] [CrossRef]
- Folk, R.L.; Ward, W.C. Brazos River Bar [Texas]; a Study in the Significance of Grain Size Parameters. J. Sediment. Res. 1957, 27, 3–26. [Google Scholar] [CrossRef]
- Walkley, A.; Black, I.A. An Examination of the Degtjareff Method for Determining Soil Organic Matter, and a Proposed Modification of the Chromic Acid Titration Method. Soil Sci. 1934, 37, 29–38. [Google Scholar] [CrossRef]
- Walkley, A. A Critical Examination of a Rapid Method for Determining Organic Carbon in Soils—Effect of Variations in Digestion Conditions and of Inorganic Soil Constituents. Soil Sci. 1947, 63, 251–264. [Google Scholar] [CrossRef]
- Müller, G.; Gastner, M. The’Karbonat-Bombe’, a Simple Device for the Determination of Carbonate Content in Sediment, Soils, and Other Materials. Neues Jahrb. für Mineral. 1971, 10, 466–469. [Google Scholar]
- Jones, G.A.; Kaiteris, P. A Vacuum-Gasometric Technique for Rapid and Precise Analysis of Calcium Carbonate in Sediments and Soils: Research-Method Paper. J. Sediment. Res. 1983, 53. [Google Scholar] [CrossRef]
- Greenberg, A.E.; Clesceri, L.S.; Eaton, A.D. APHA Standard Methods for the Examination of Water and Waste Water. Am. Public Heal. Assoc. Washingt. DC 2005. [Google Scholar]
- Elmer, P. Analytical Methods for Atomic Absorption Spectroscopy. USA Perkin-Elmer Corp. 1996, 132–142.
- Bosnak, C.P.; Grosser, Z.A. The Analysis of Drinking Water and Bottled Water by Flame AA and GFAA. At. Spectrosc. Connect. 1996, 17, 218–224. [Google Scholar]
- Brown, E.; Skougstad, M.W.; Fishman, M.J. Methods for Collection and Analysis of Water Samples for Dissolved Minerals and Gases; US Govt. Print. Off., 1970.
- Tautkus, S.; Steponeniene, L.; Kazlauskas, R. Determination of Iron in Natural and Mineral Waters by Flame Atomic Absorption Spectrometry. J. Serbian Chem. Soc. 2004, 69, 393–402. [Google Scholar] [CrossRef]
- Turekian, K.K.; Wedepohl, K.H. Distribution of the Elements in Some Major Units of the Earth’s Crust. Geol. Soc. Am. Bull. 1961, 72, 175–192. [Google Scholar] [CrossRef]
- Taylor, S.R.; McLennan, S.M. The Continental Crust: Its Composition and Evolution. 1985.
- He, W.; You, L.; Chen, M.; Tuo, Y.; Liao, N.; Wang, H.; Li, J. Varied Sediment Archive of Fe and Mn Contents under Changing Reservoir Mixing Patterns, Oxygenation Regimes, and Runoff Inputs. Ecol. Indic. 2023, 147, 109967. [Google Scholar] [CrossRef]
- Björnerås, C.; Persson, P.; Weyhenmeyer, G.A.; Hammarlund, D.; Kritzberg, E.S. The Lake as an Iron Sink-New Insights on the Role of Iron Speciation. Chem. Geol. 2021, 584, 120529. [Google Scholar] [CrossRef]
- Krueger, K.M.; Vavrus, C.E.; Lofton, M.E.; McClure, R.P.; Gantzer, P.; Carey, C.C.; Schreiber, M.E. Iron and Manganese Fluxes across the Sediment-Water Interface in a Drinking Water Reservoir. Water Res. 2020, 182, 116003. [Google Scholar] [CrossRef]
- Gantzer, P.A.; Bryant, L.D.; Little, J.C. Controlling Soluble Iron and Manganese in a Water-Supply Reservoir Using Hypolimnetic Oxygenation. Water Res. 2009, 43, 1285–1294. [Google Scholar] [CrossRef]
- Bryant, L.D.; Hsu-Kim, H.; Gantzer, P.A.; Little, J.C. Solving the Problem at the Source: Controlling Mn Release at the Sediment-Water Interface via Hypolimnetic Oxygenation. Water Res. 2011, 45, 6381–6392. [Google Scholar] [CrossRef]
- Munger, Z.W.; Carey, C.C.; Gerling, A.B.; Hamre, K.D.; Doubek, J.P.; Klepatzki, S.D.; McClure, R.P.; Schreiber, M.E. Effectiveness of Hypolimnetic Oxygenation for Preventing Accumulation of Fe and Mn in a Drinking Water Reservoir. Water Res. 2016, 106, 1–14. [Google Scholar] [CrossRef]
- Salminen, R.; Batista, M.J.; Bidovec, M.; Demetriades, A.; DE VIVO, B.; DE VOS, W.; Duris, M.; Gilucis, A.; Gregorauskiene, V.; Halamic, J. FOREGS Geochemical Baseline Mapping: A New European Wide Database and Geochemical Atlas. In Geoanalysis 2003; 2003; pp. 152–153.
- Heal, K.V.; Kneale, P.E.; McDonald, A.T. Manganese in Runoff from Upland Catchments: Temporal Patterns and Controls on Mobilization/Teneur En Manganèse de l’écoulement En Bassins Versants d’altitude: Variations Temporelles et Contrôles de La Mobilisation. Hydrol. Sci. J. 2002, 47, 769–780. [Google Scholar] [CrossRef]
Figure 1.
Study area with the prevailing geological formations.
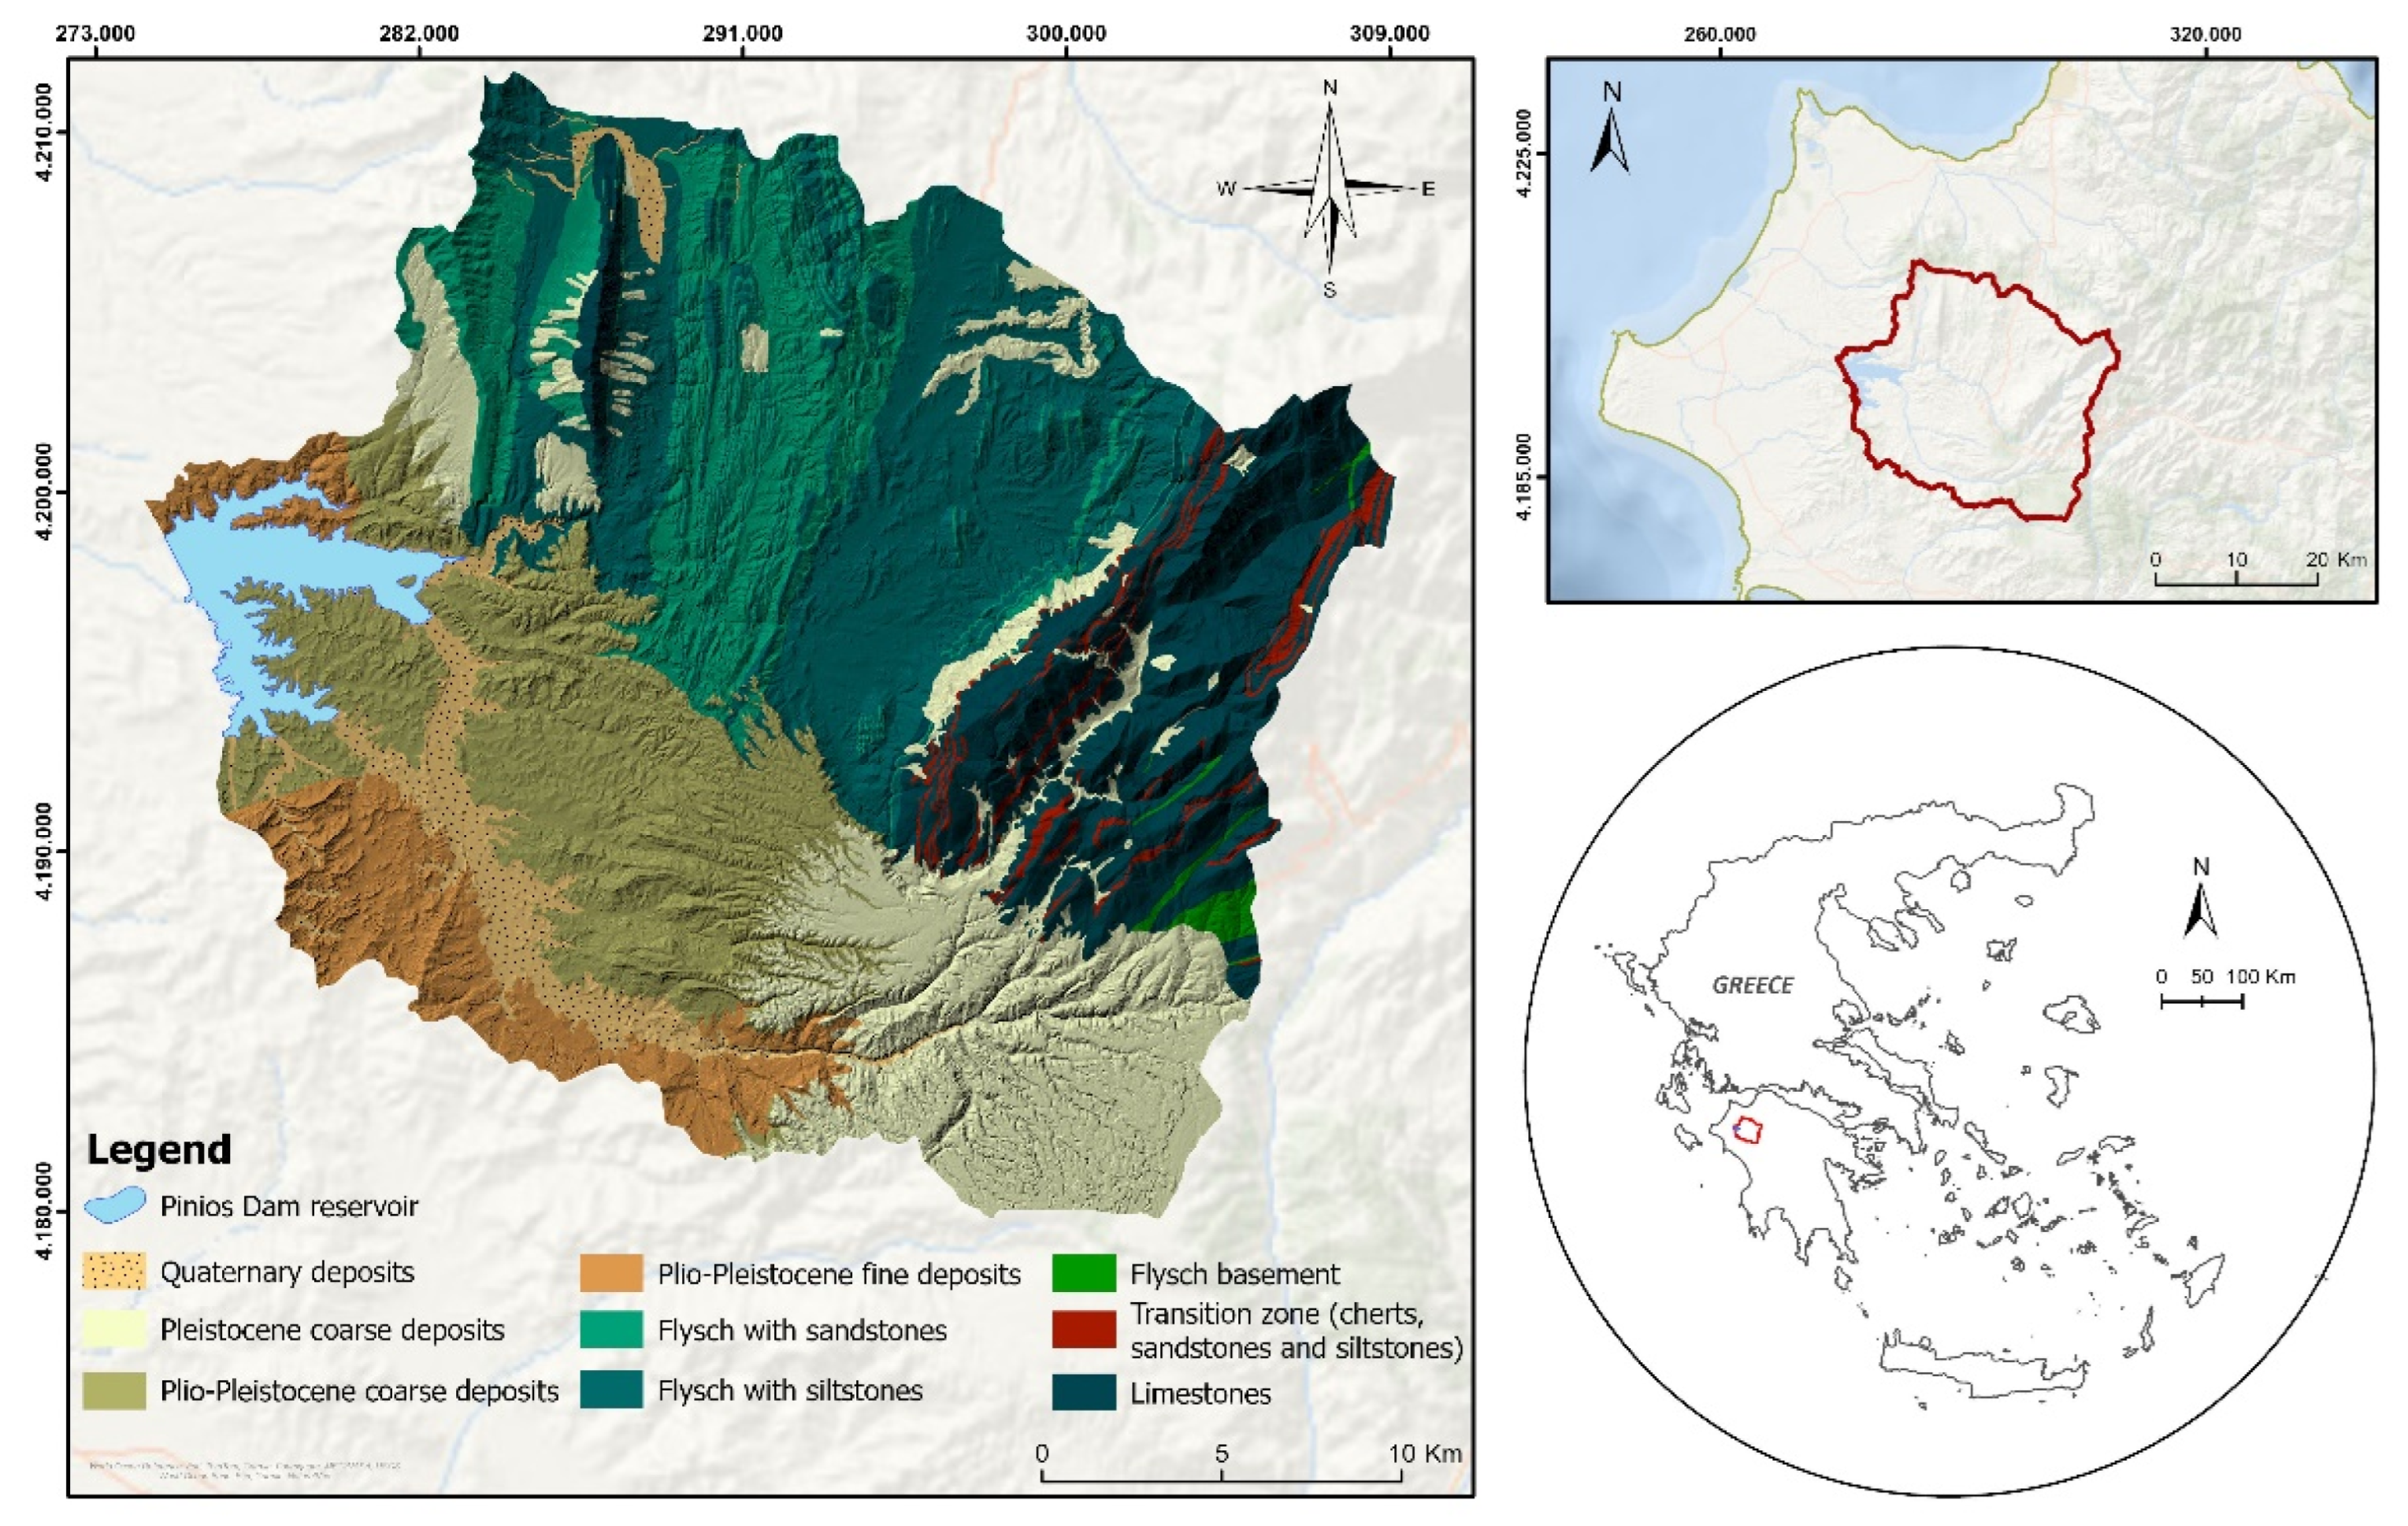
Figure 2.
Temporal variation of manganese and iron concentration for the period 2016 to 2017.
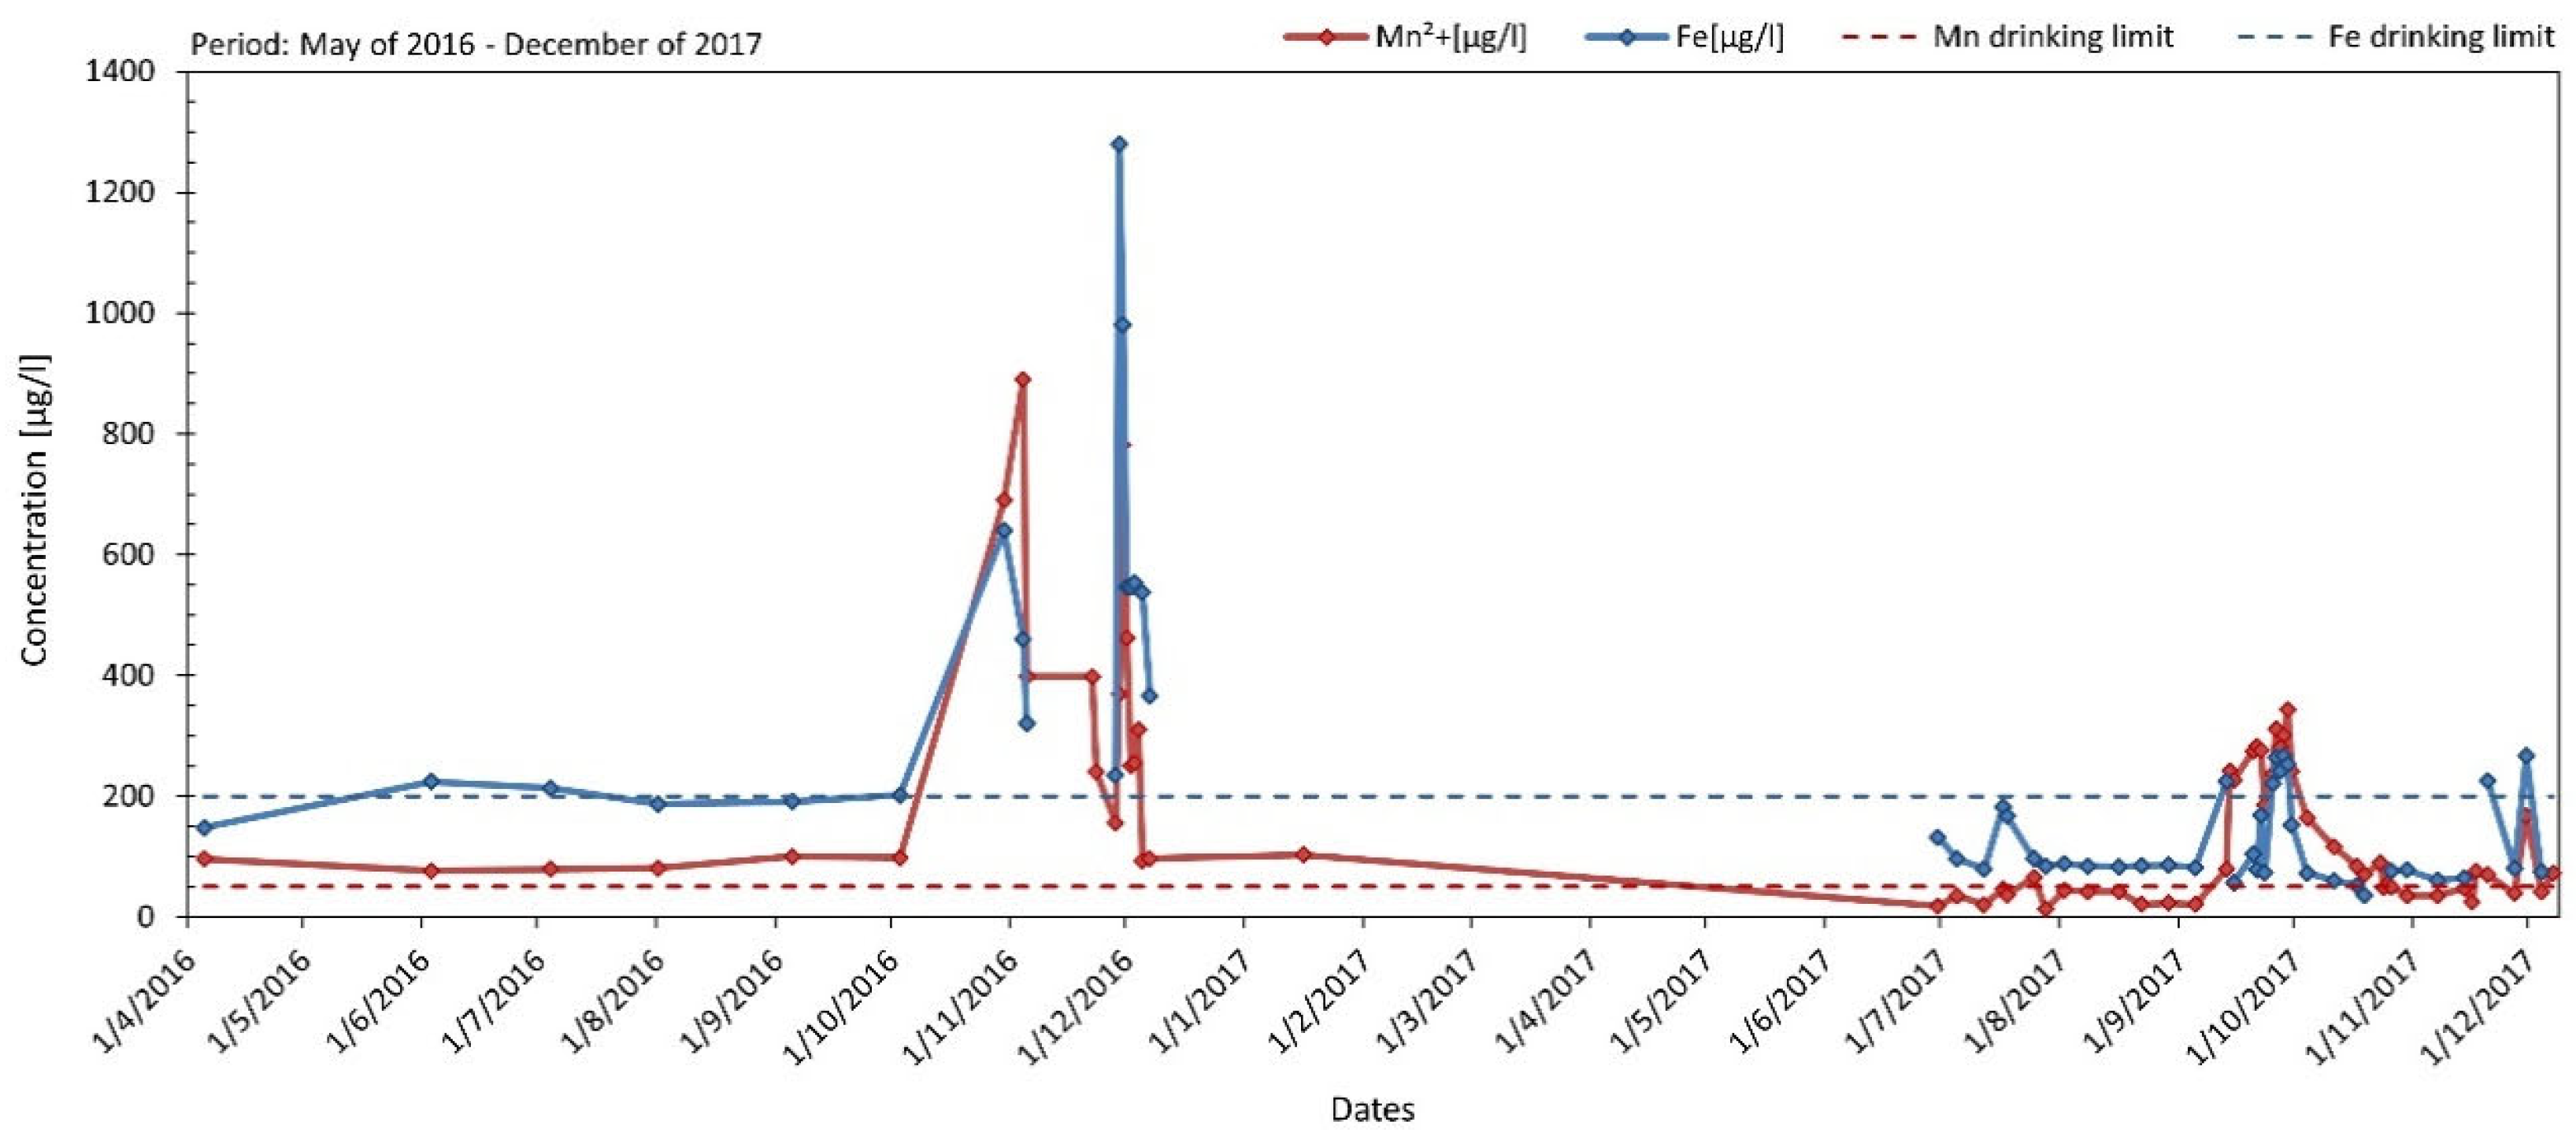
Figure 3.
Sediment and water column sampling locations in the reservoir.
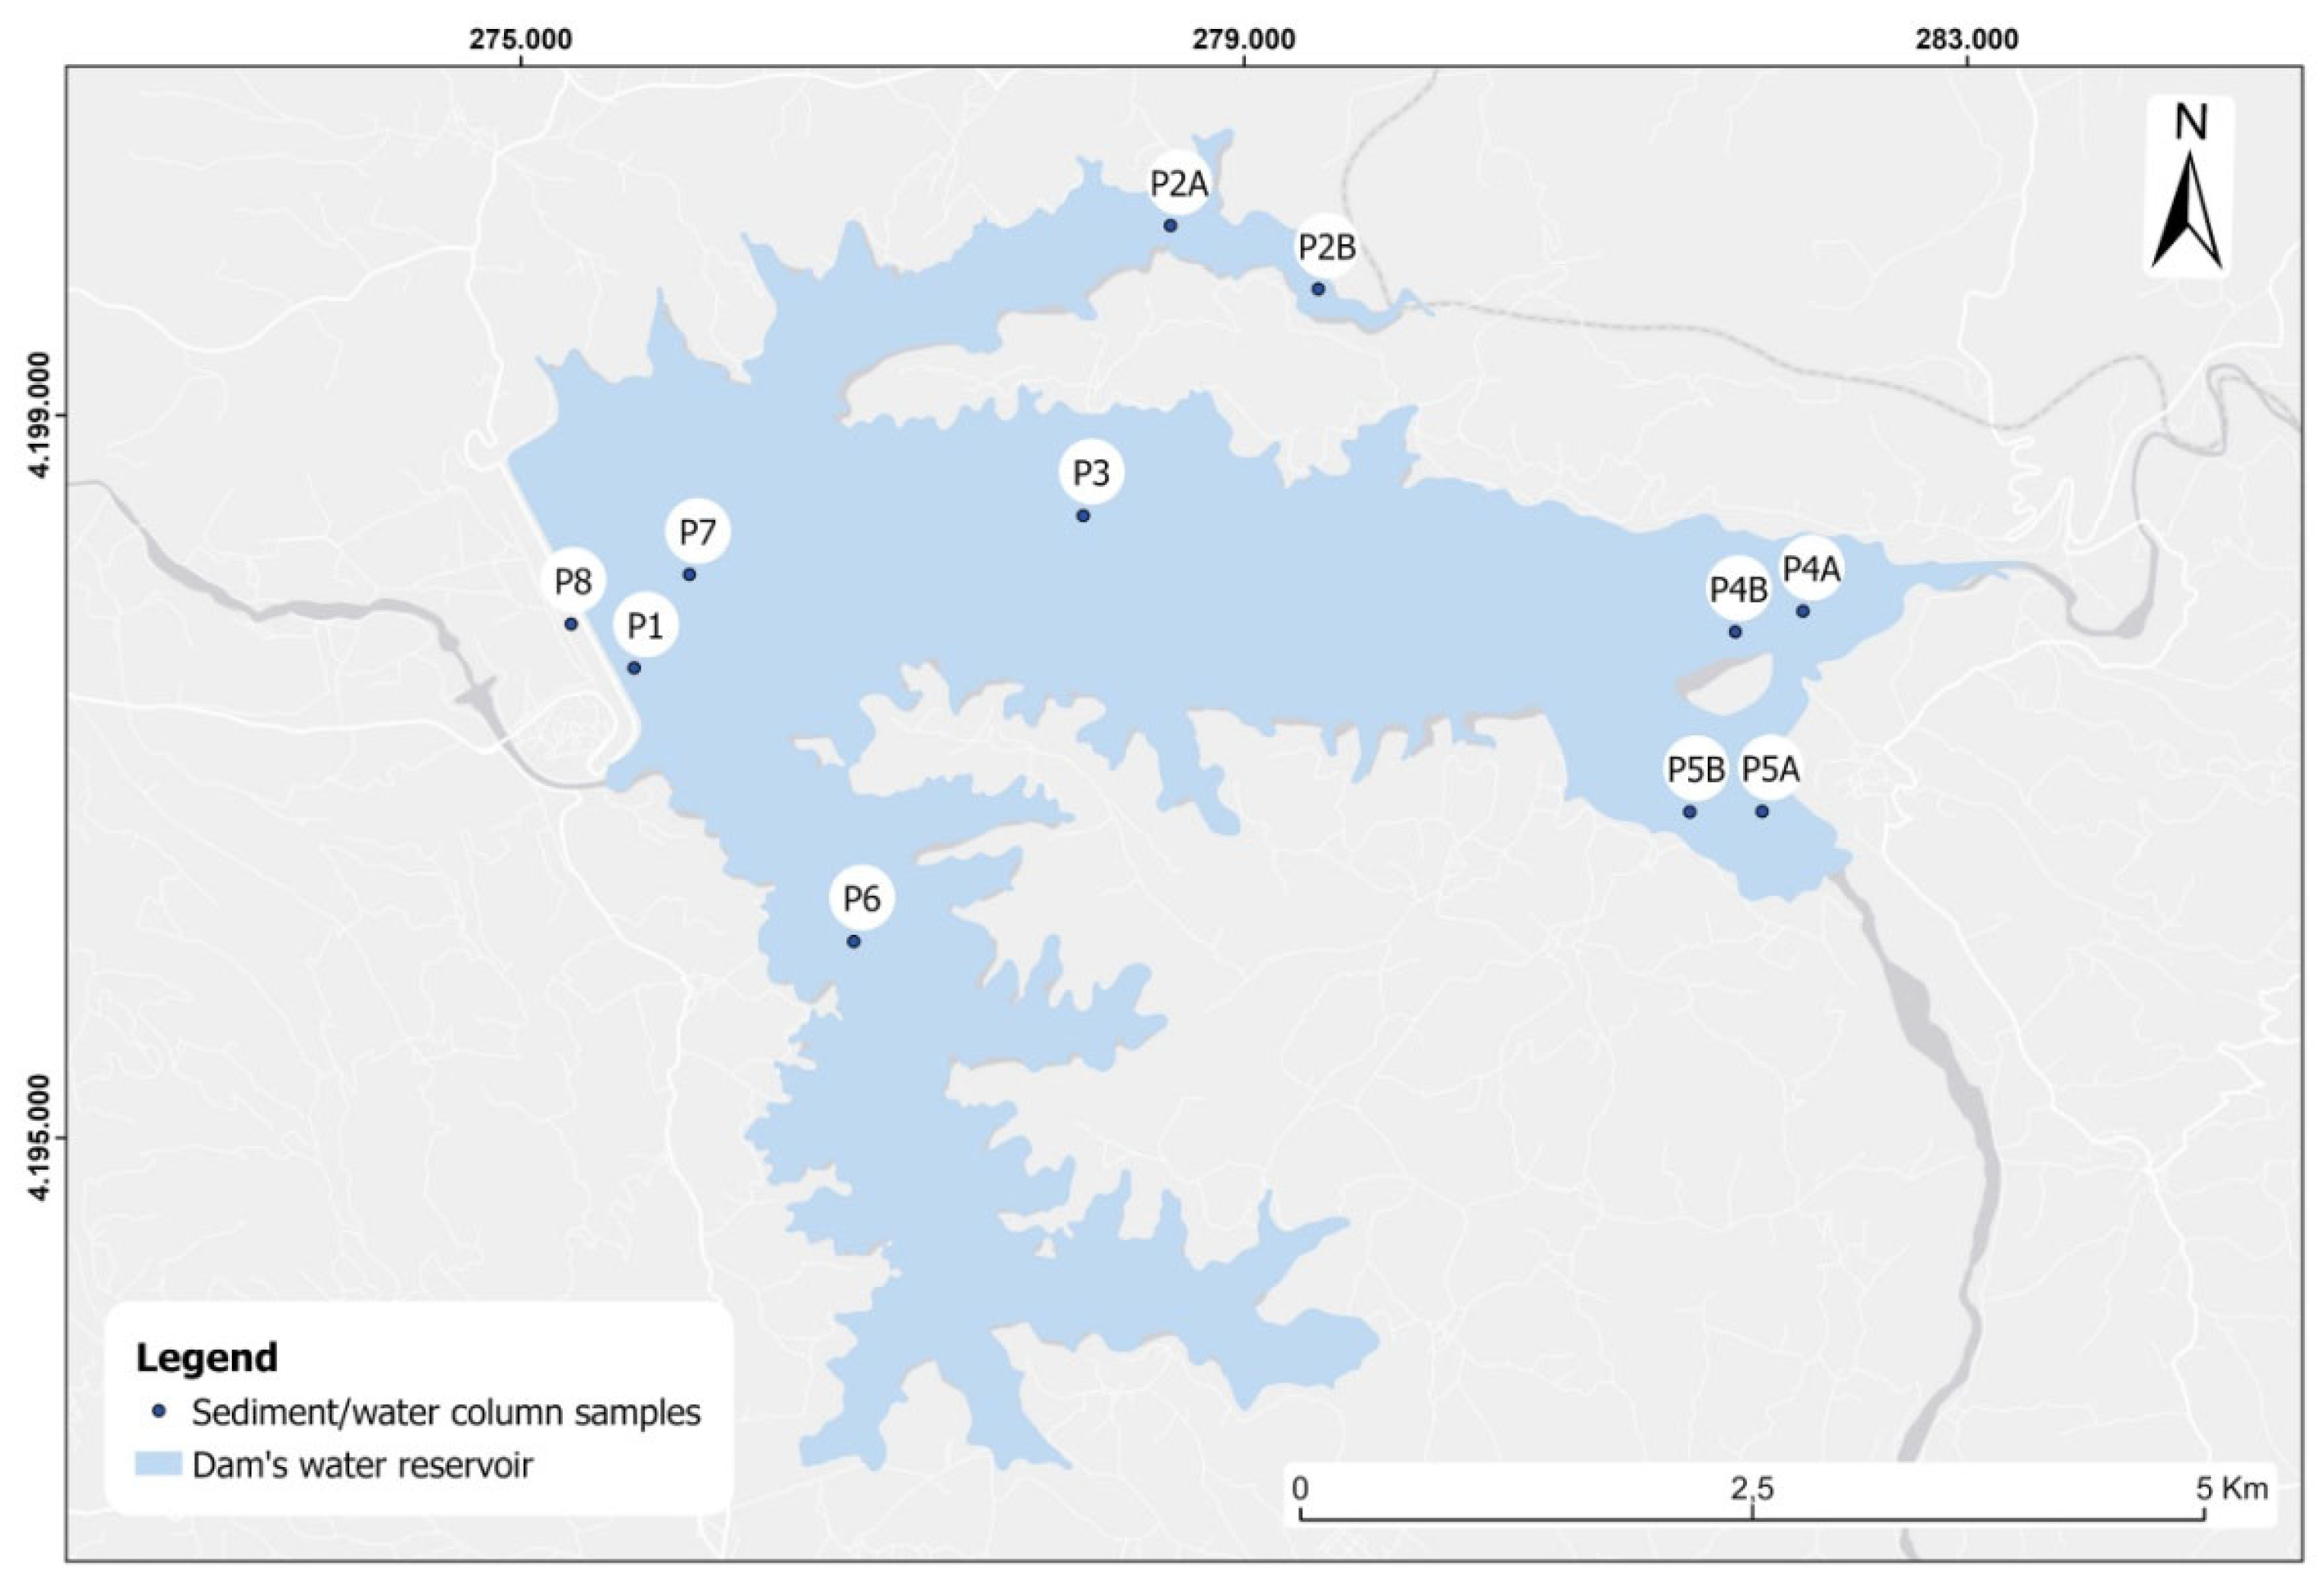
Figure 4.
Runoff water sampling locations.
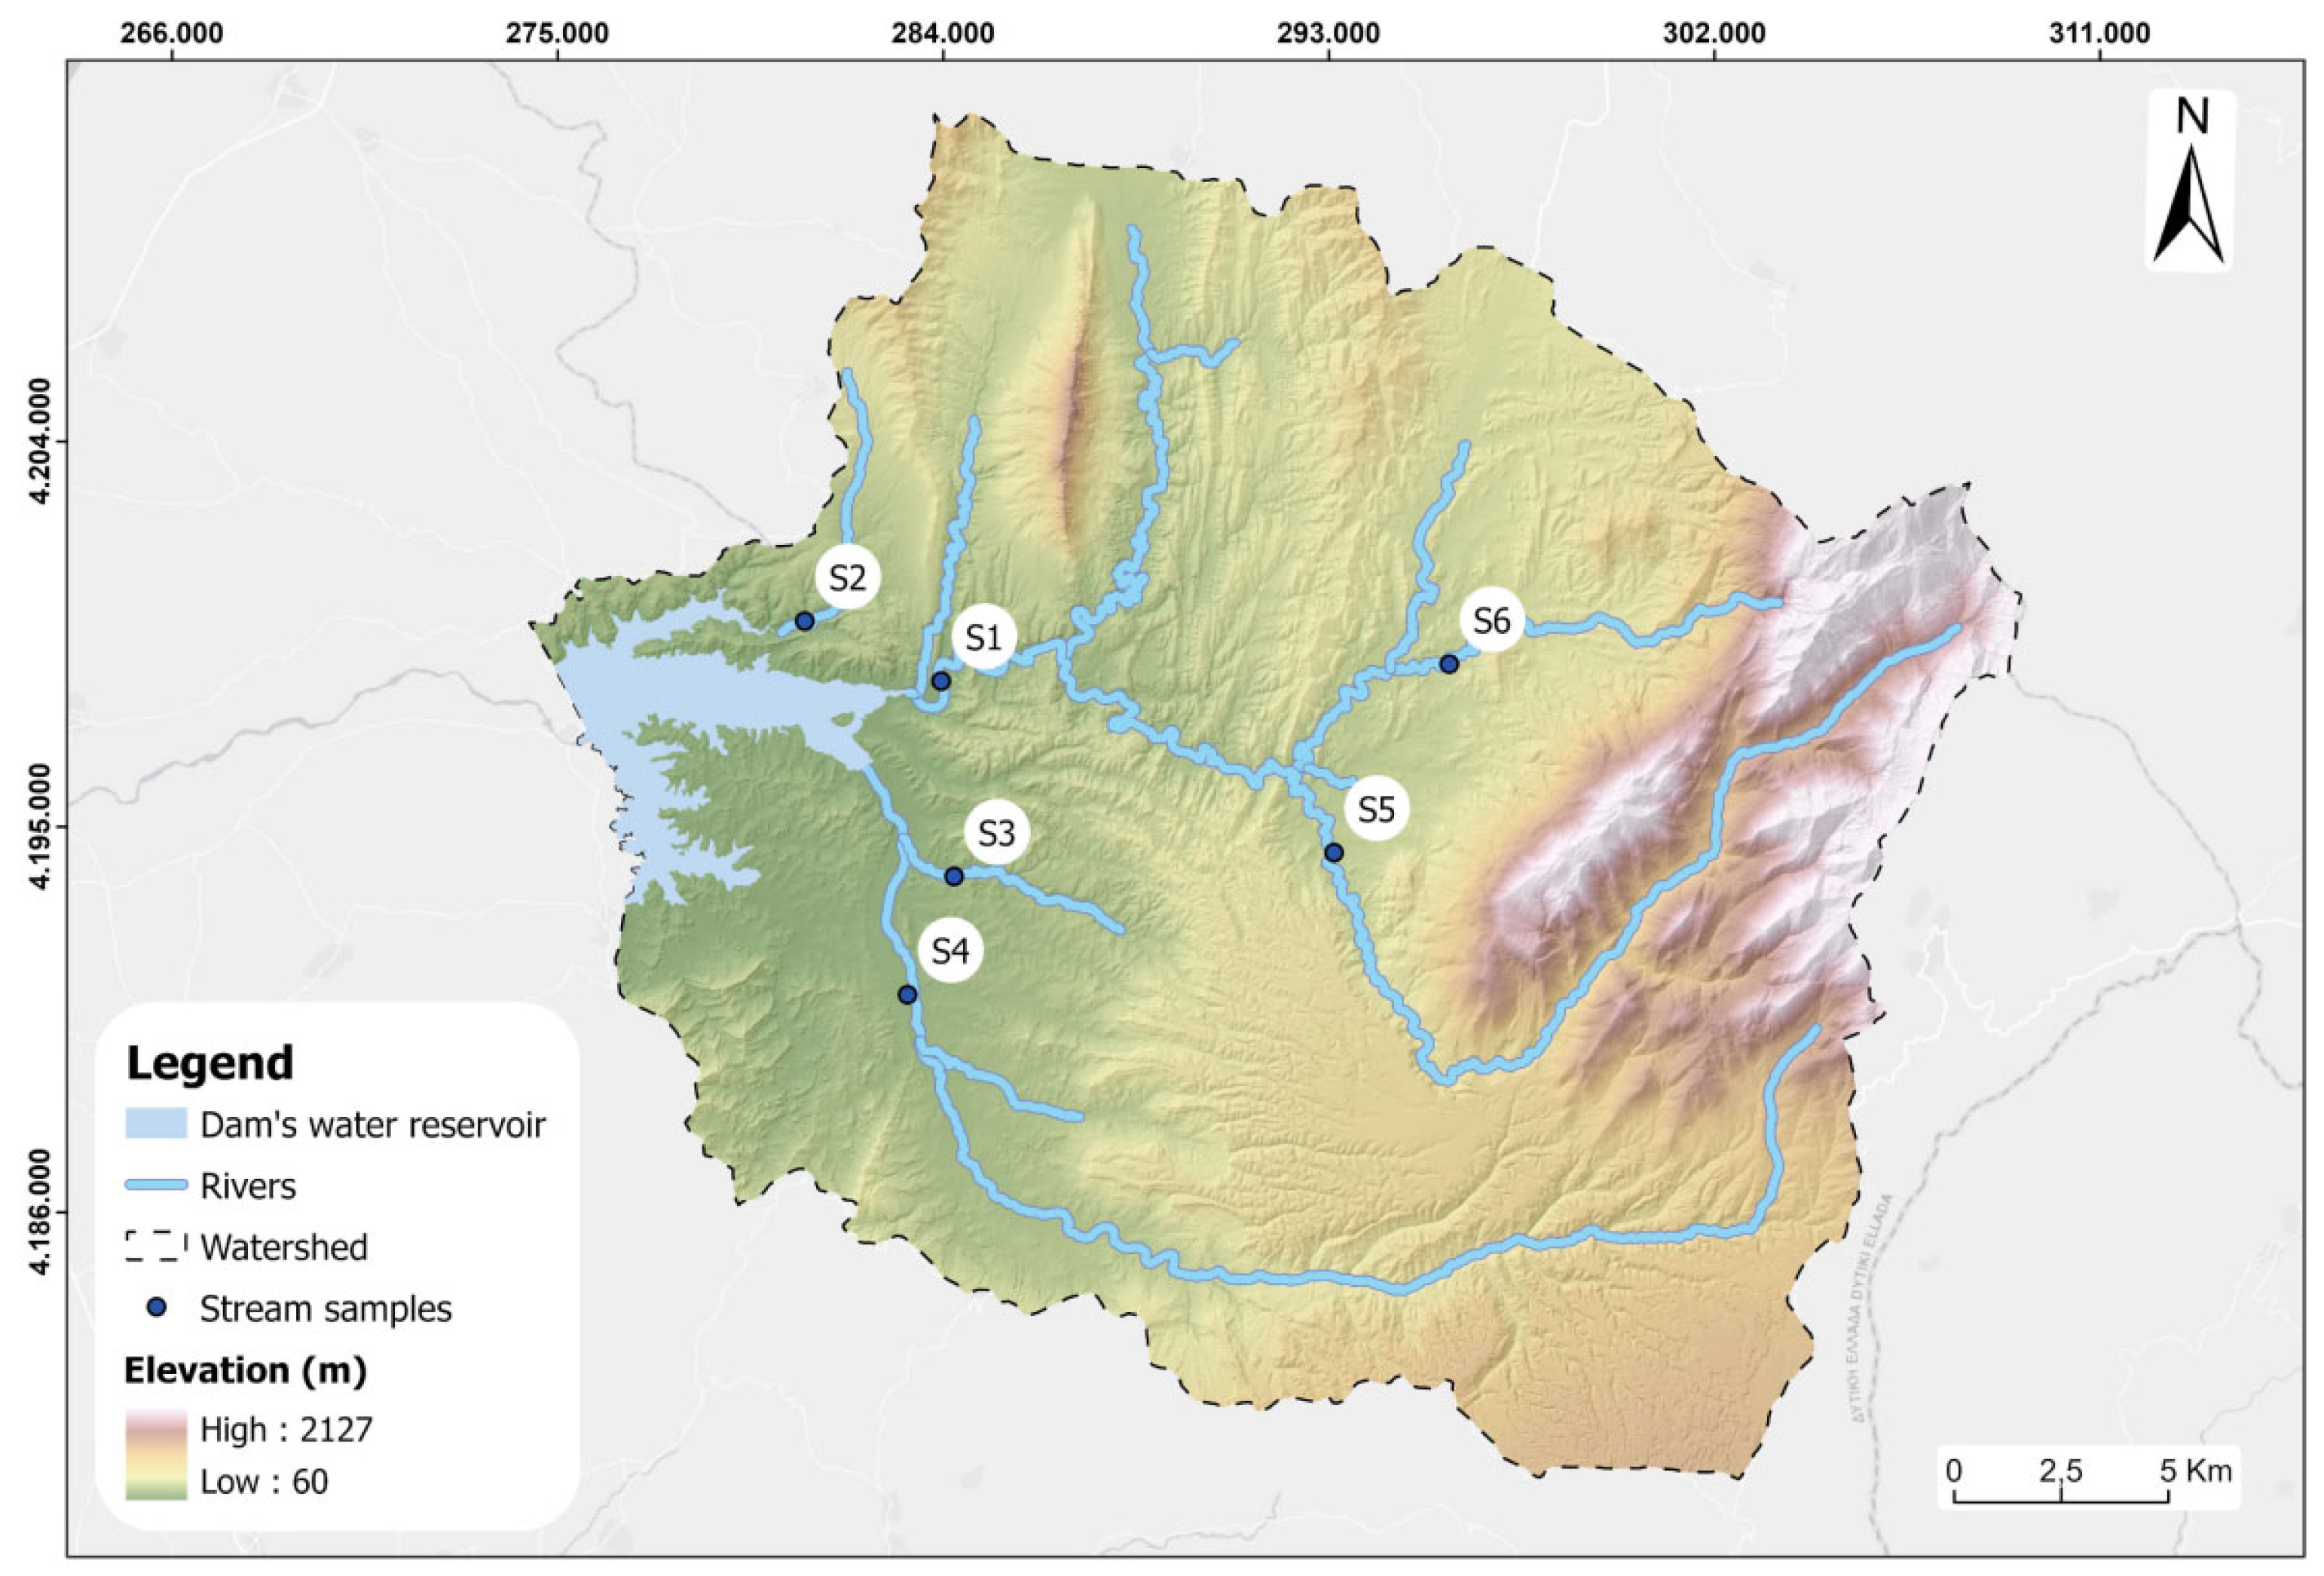
Figure 5.
Triangular classification diagram of the analysed sediments.
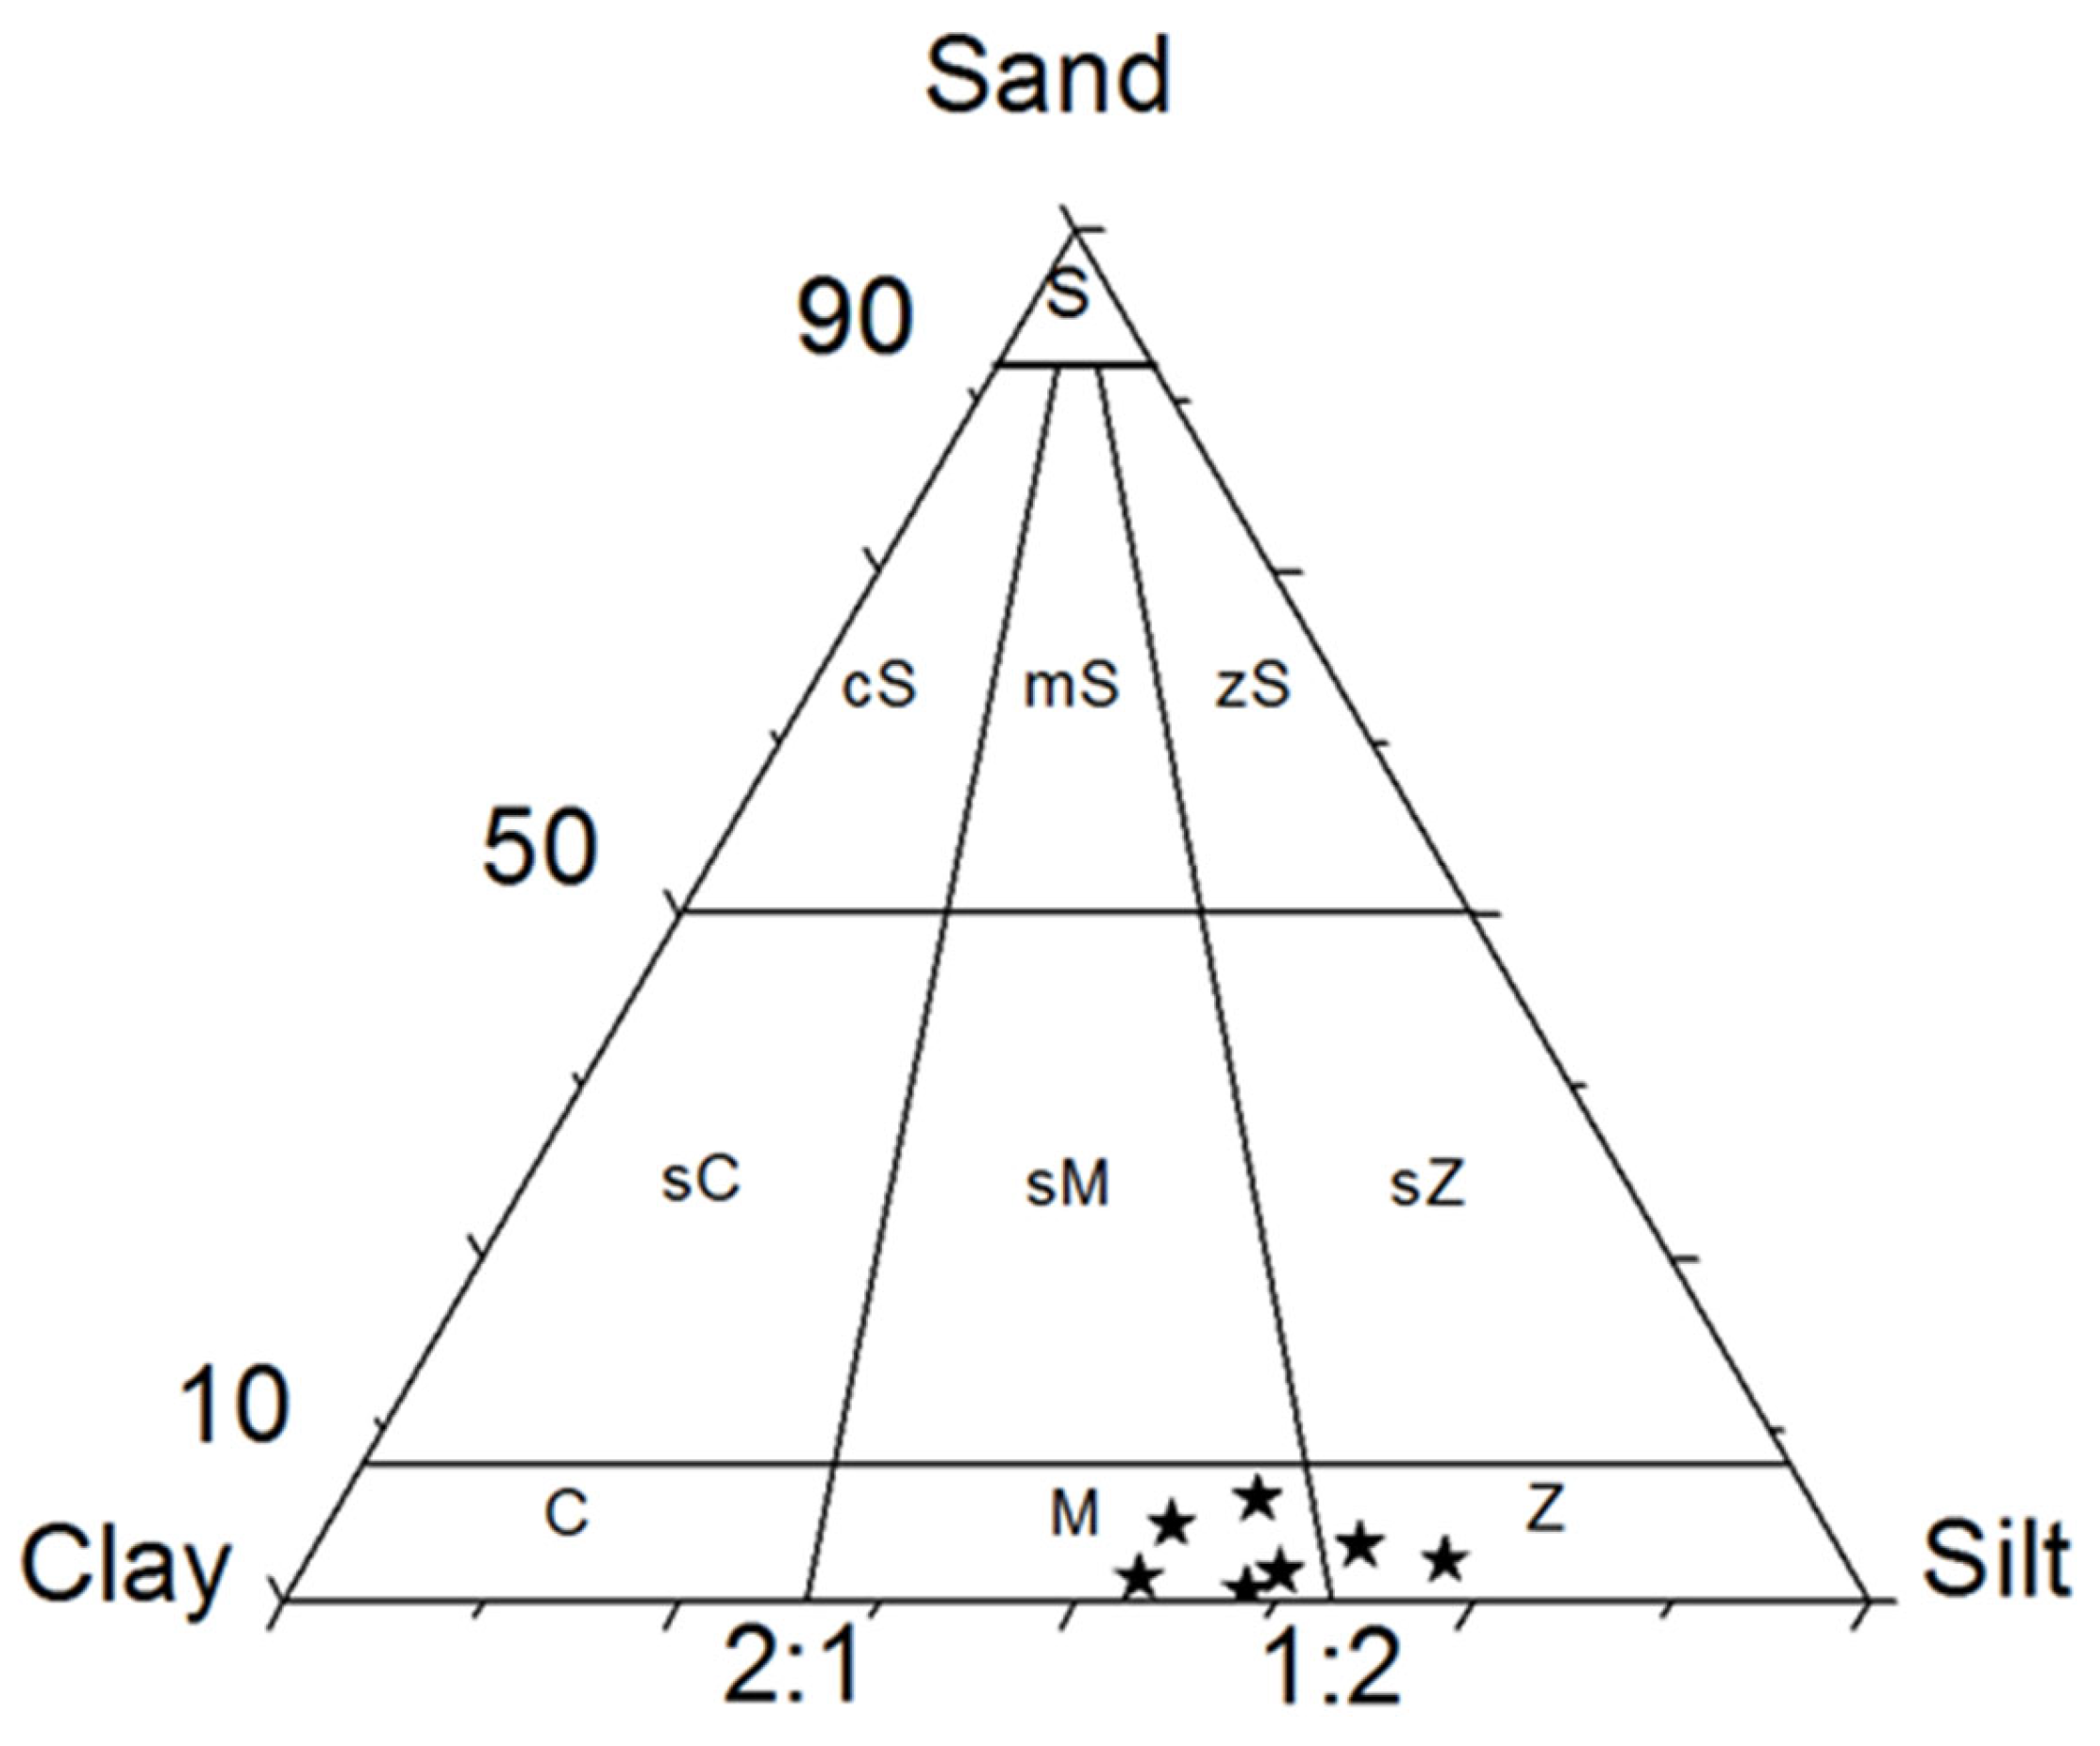
Figure 6.
Grain size percentage and statistical parameters of the reservoir sediments.
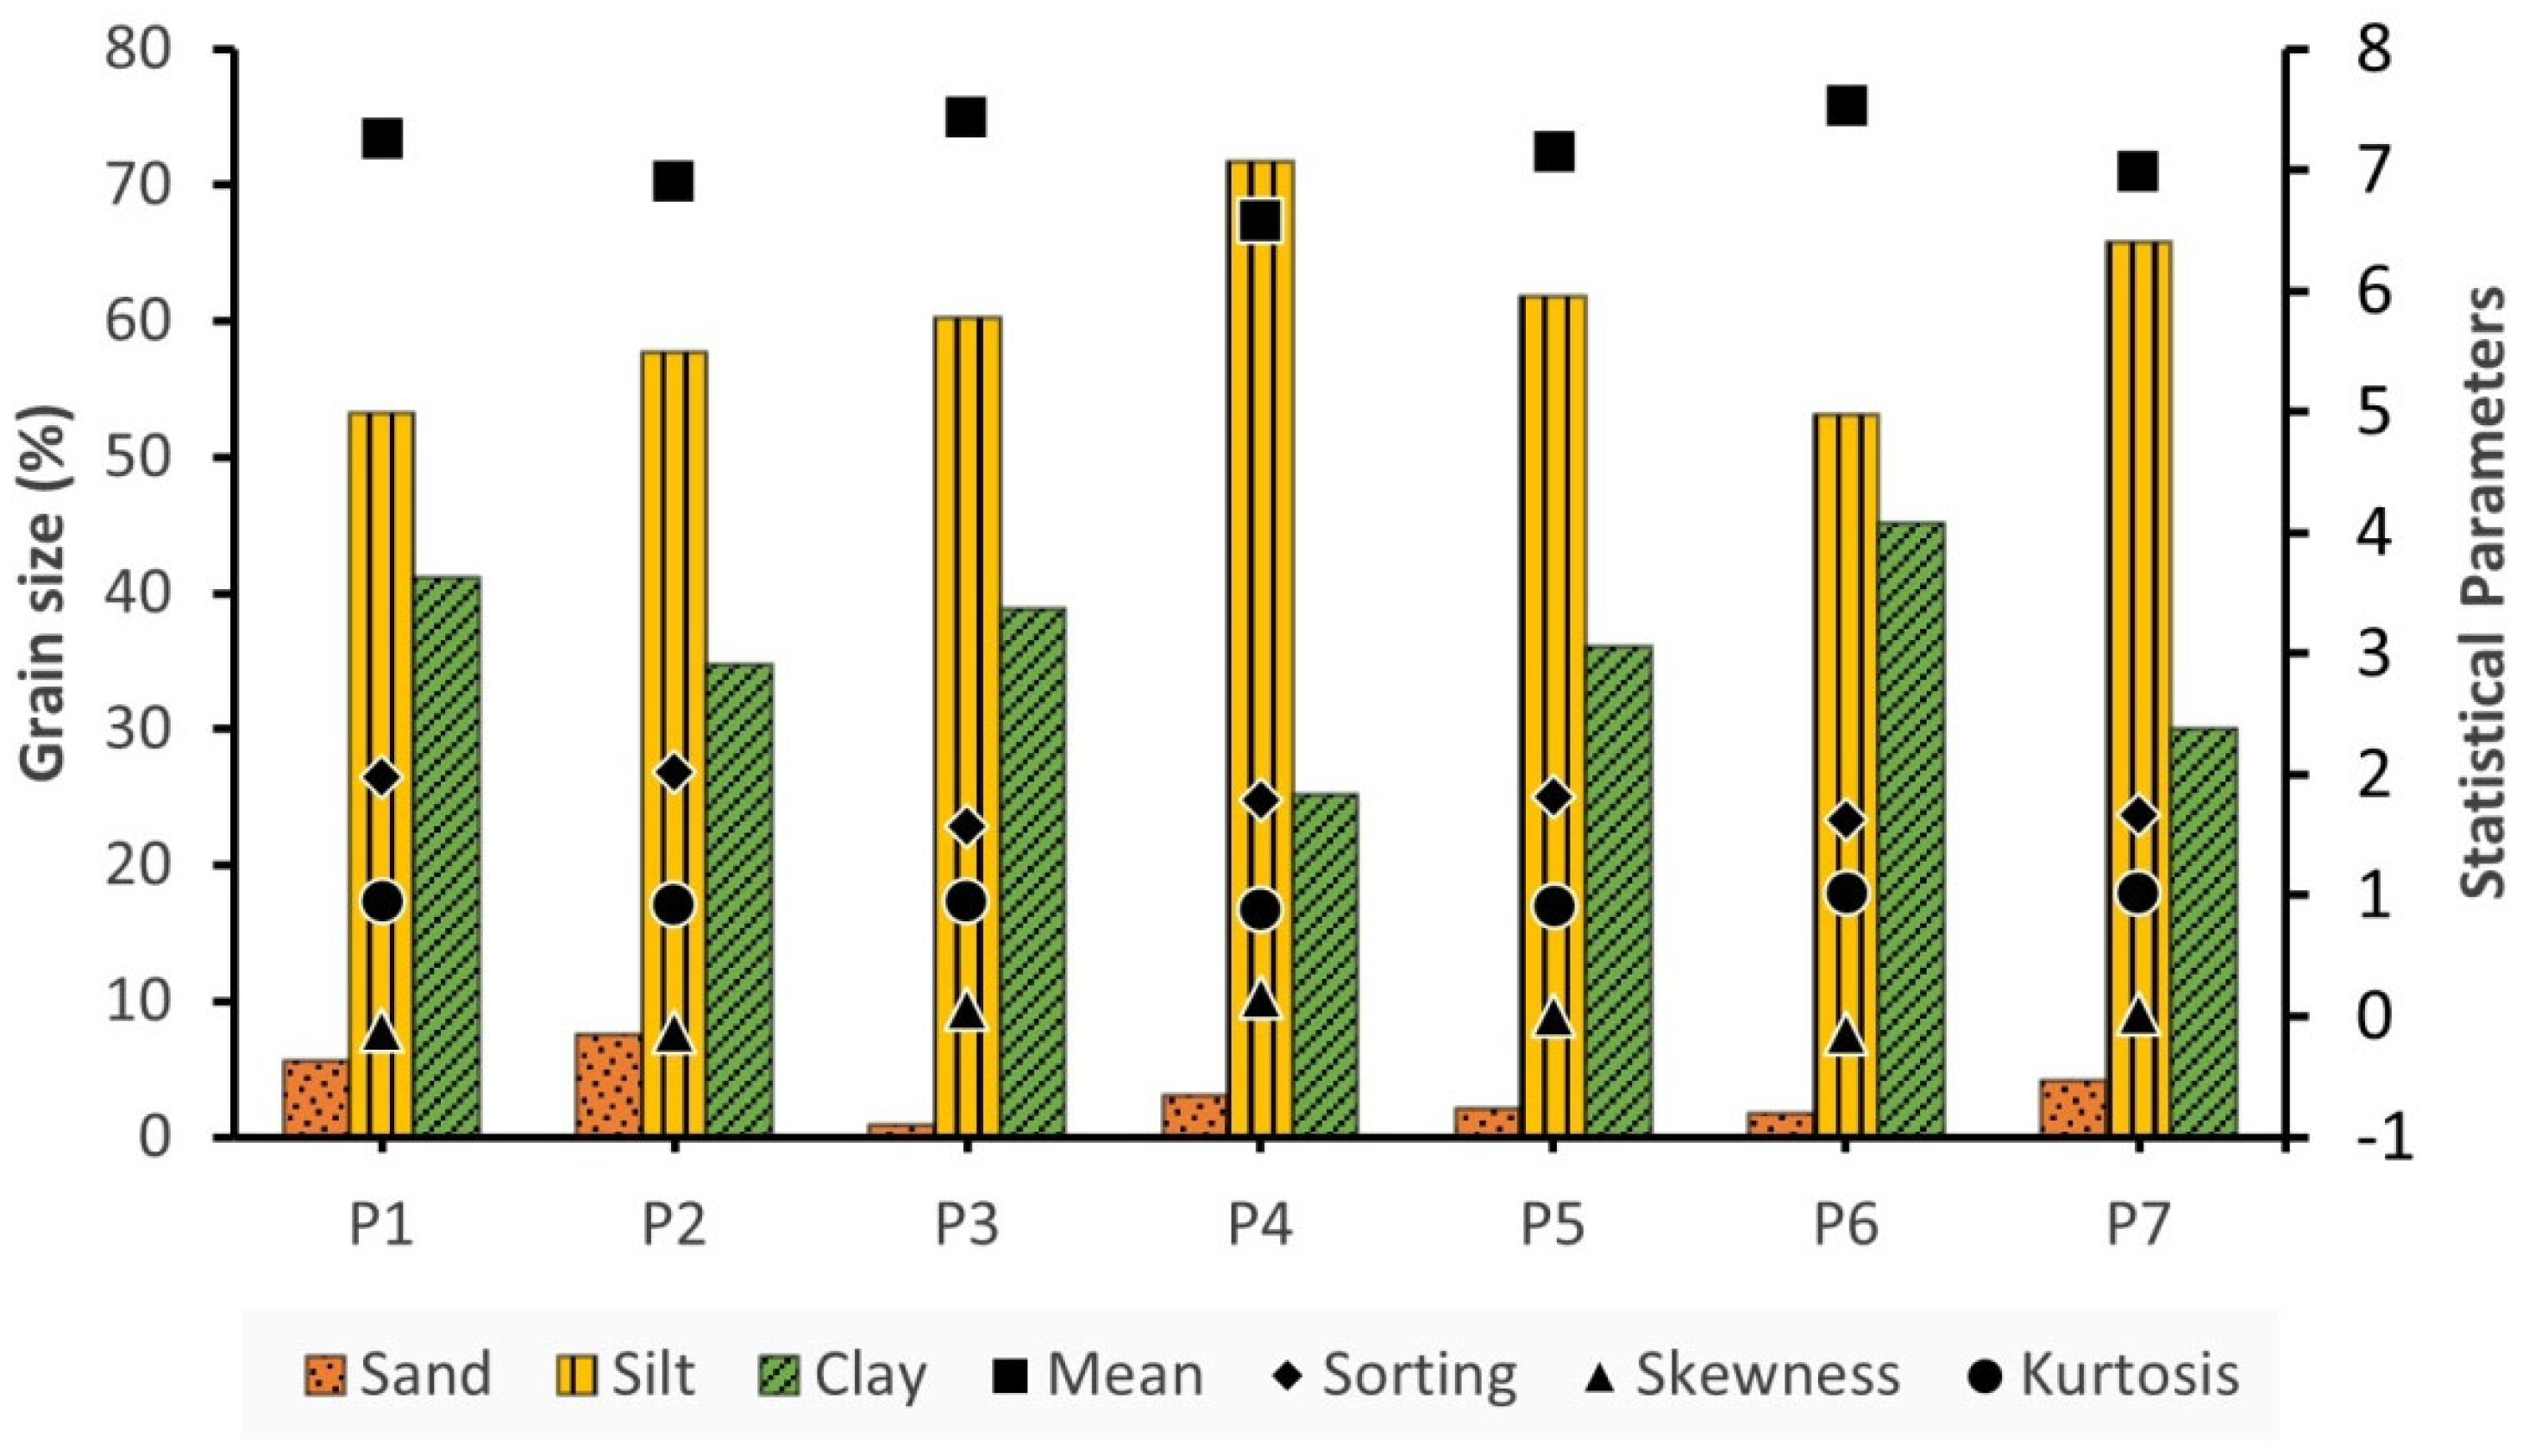
Figure 7.
Bar charts of TOC / TN / TP of the reservoir sediments.
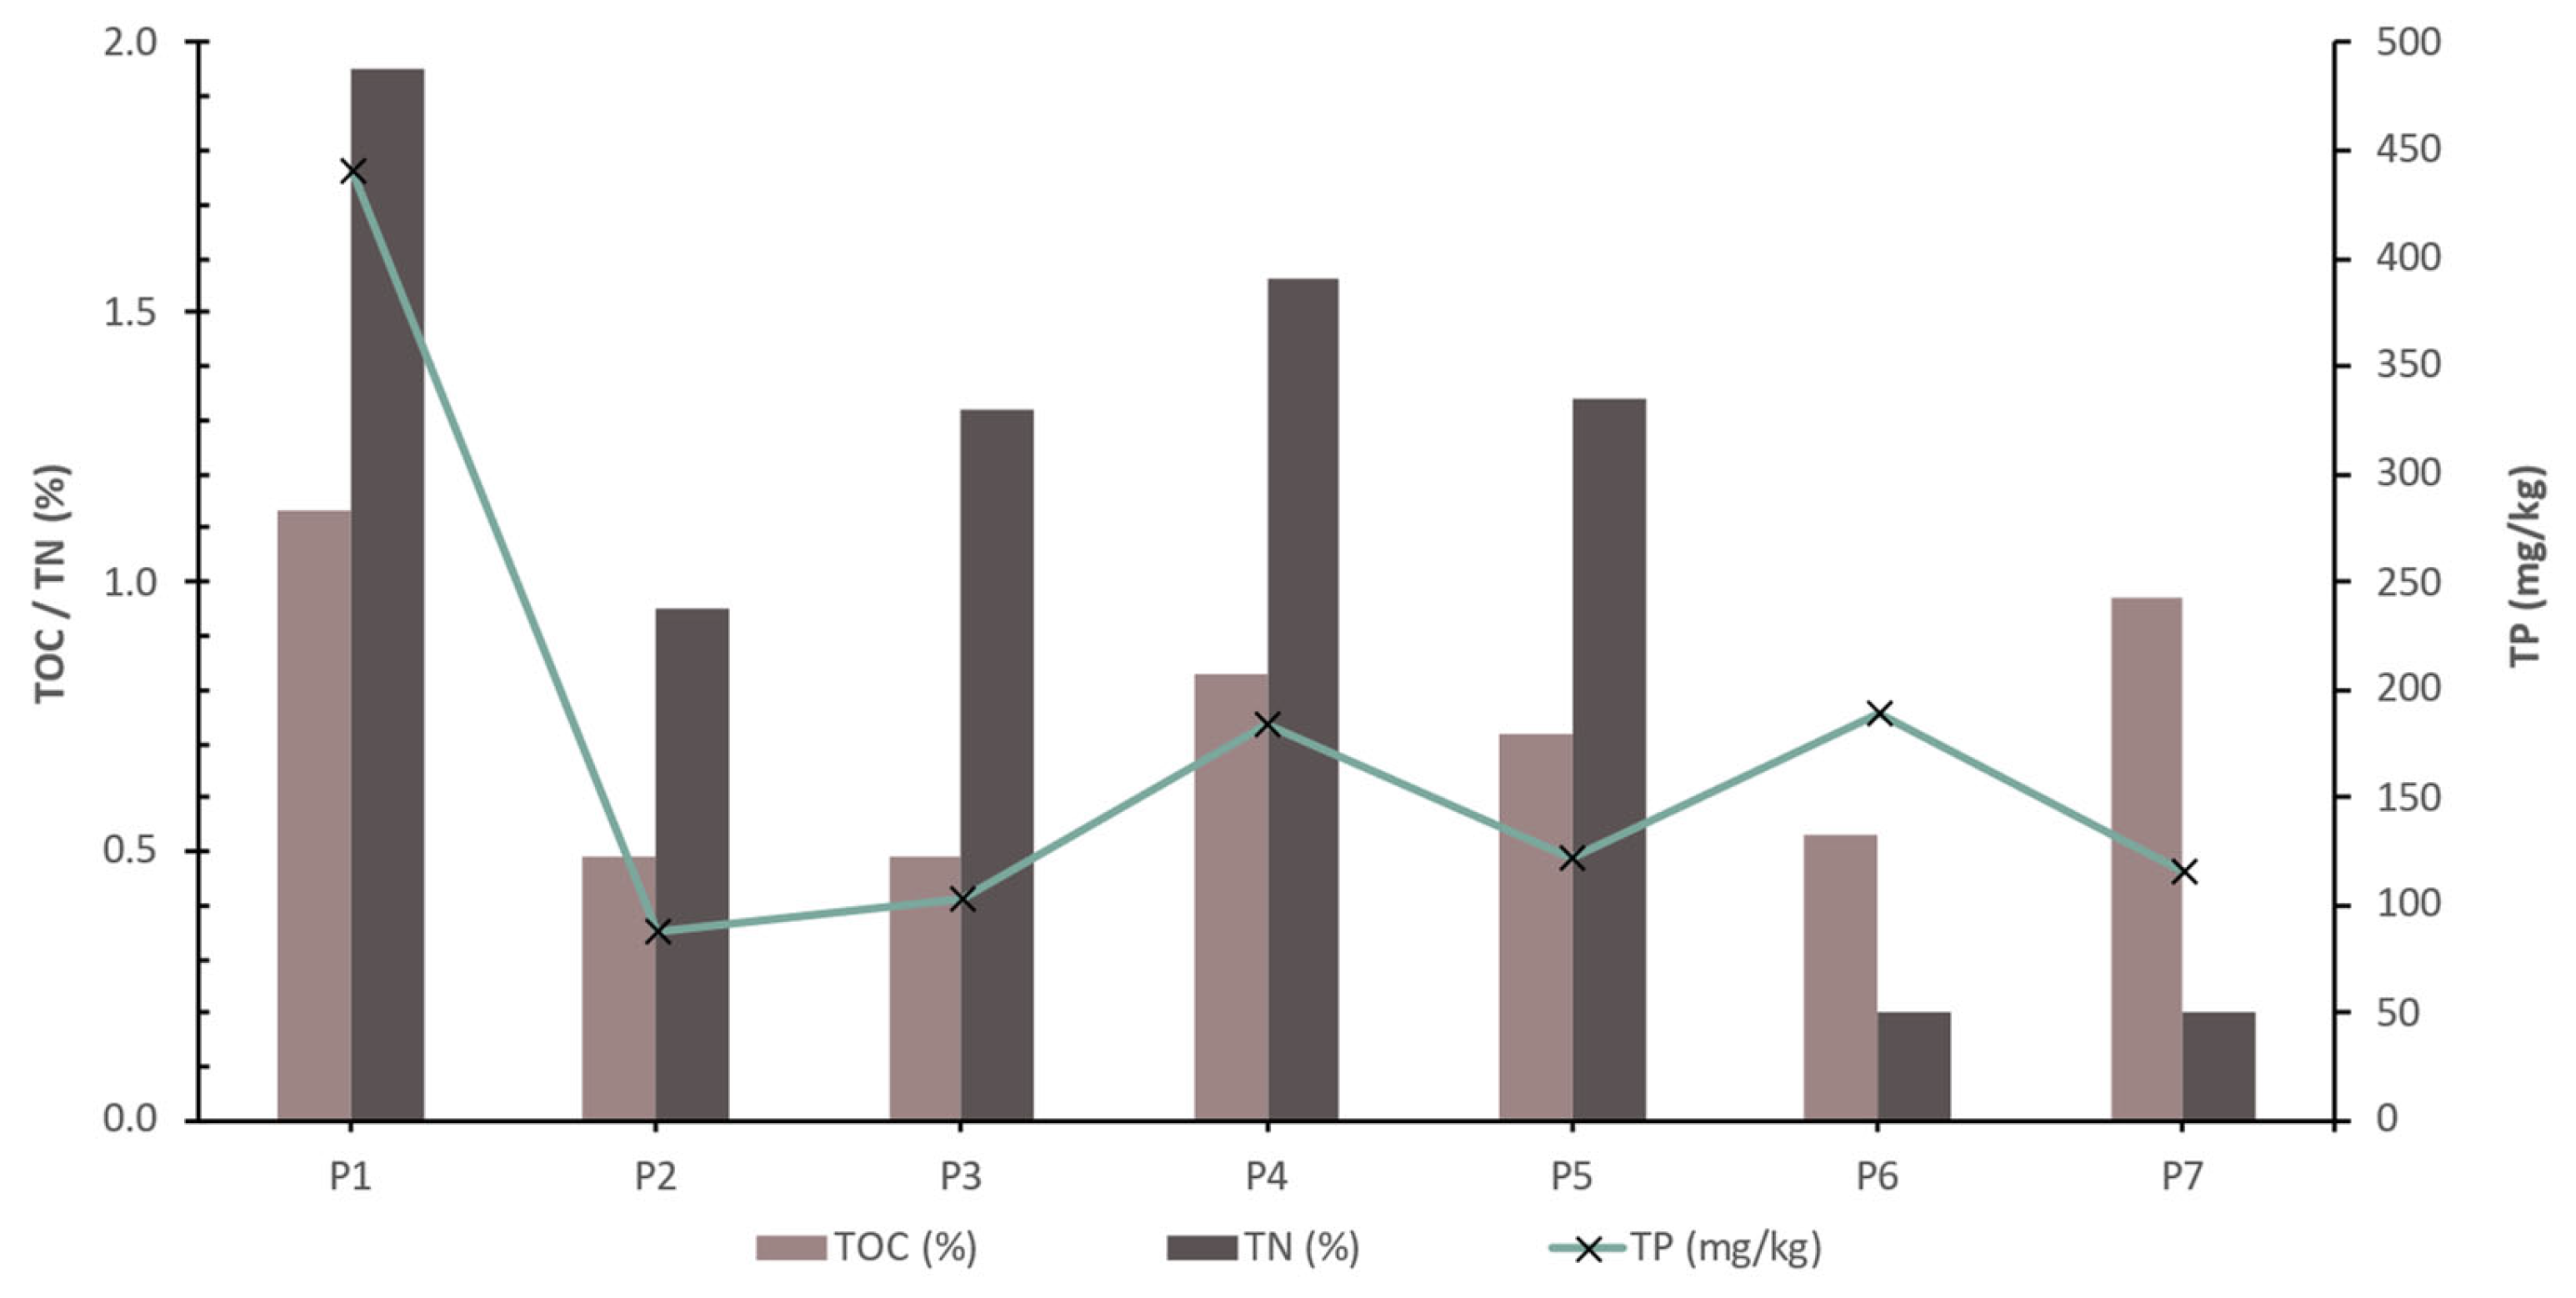
Figure 8.
Bar charts of the major elements of the reservoir sediments.

Figure 9.
Variation of MnO and Fe2O3 of the reservoir sediments.
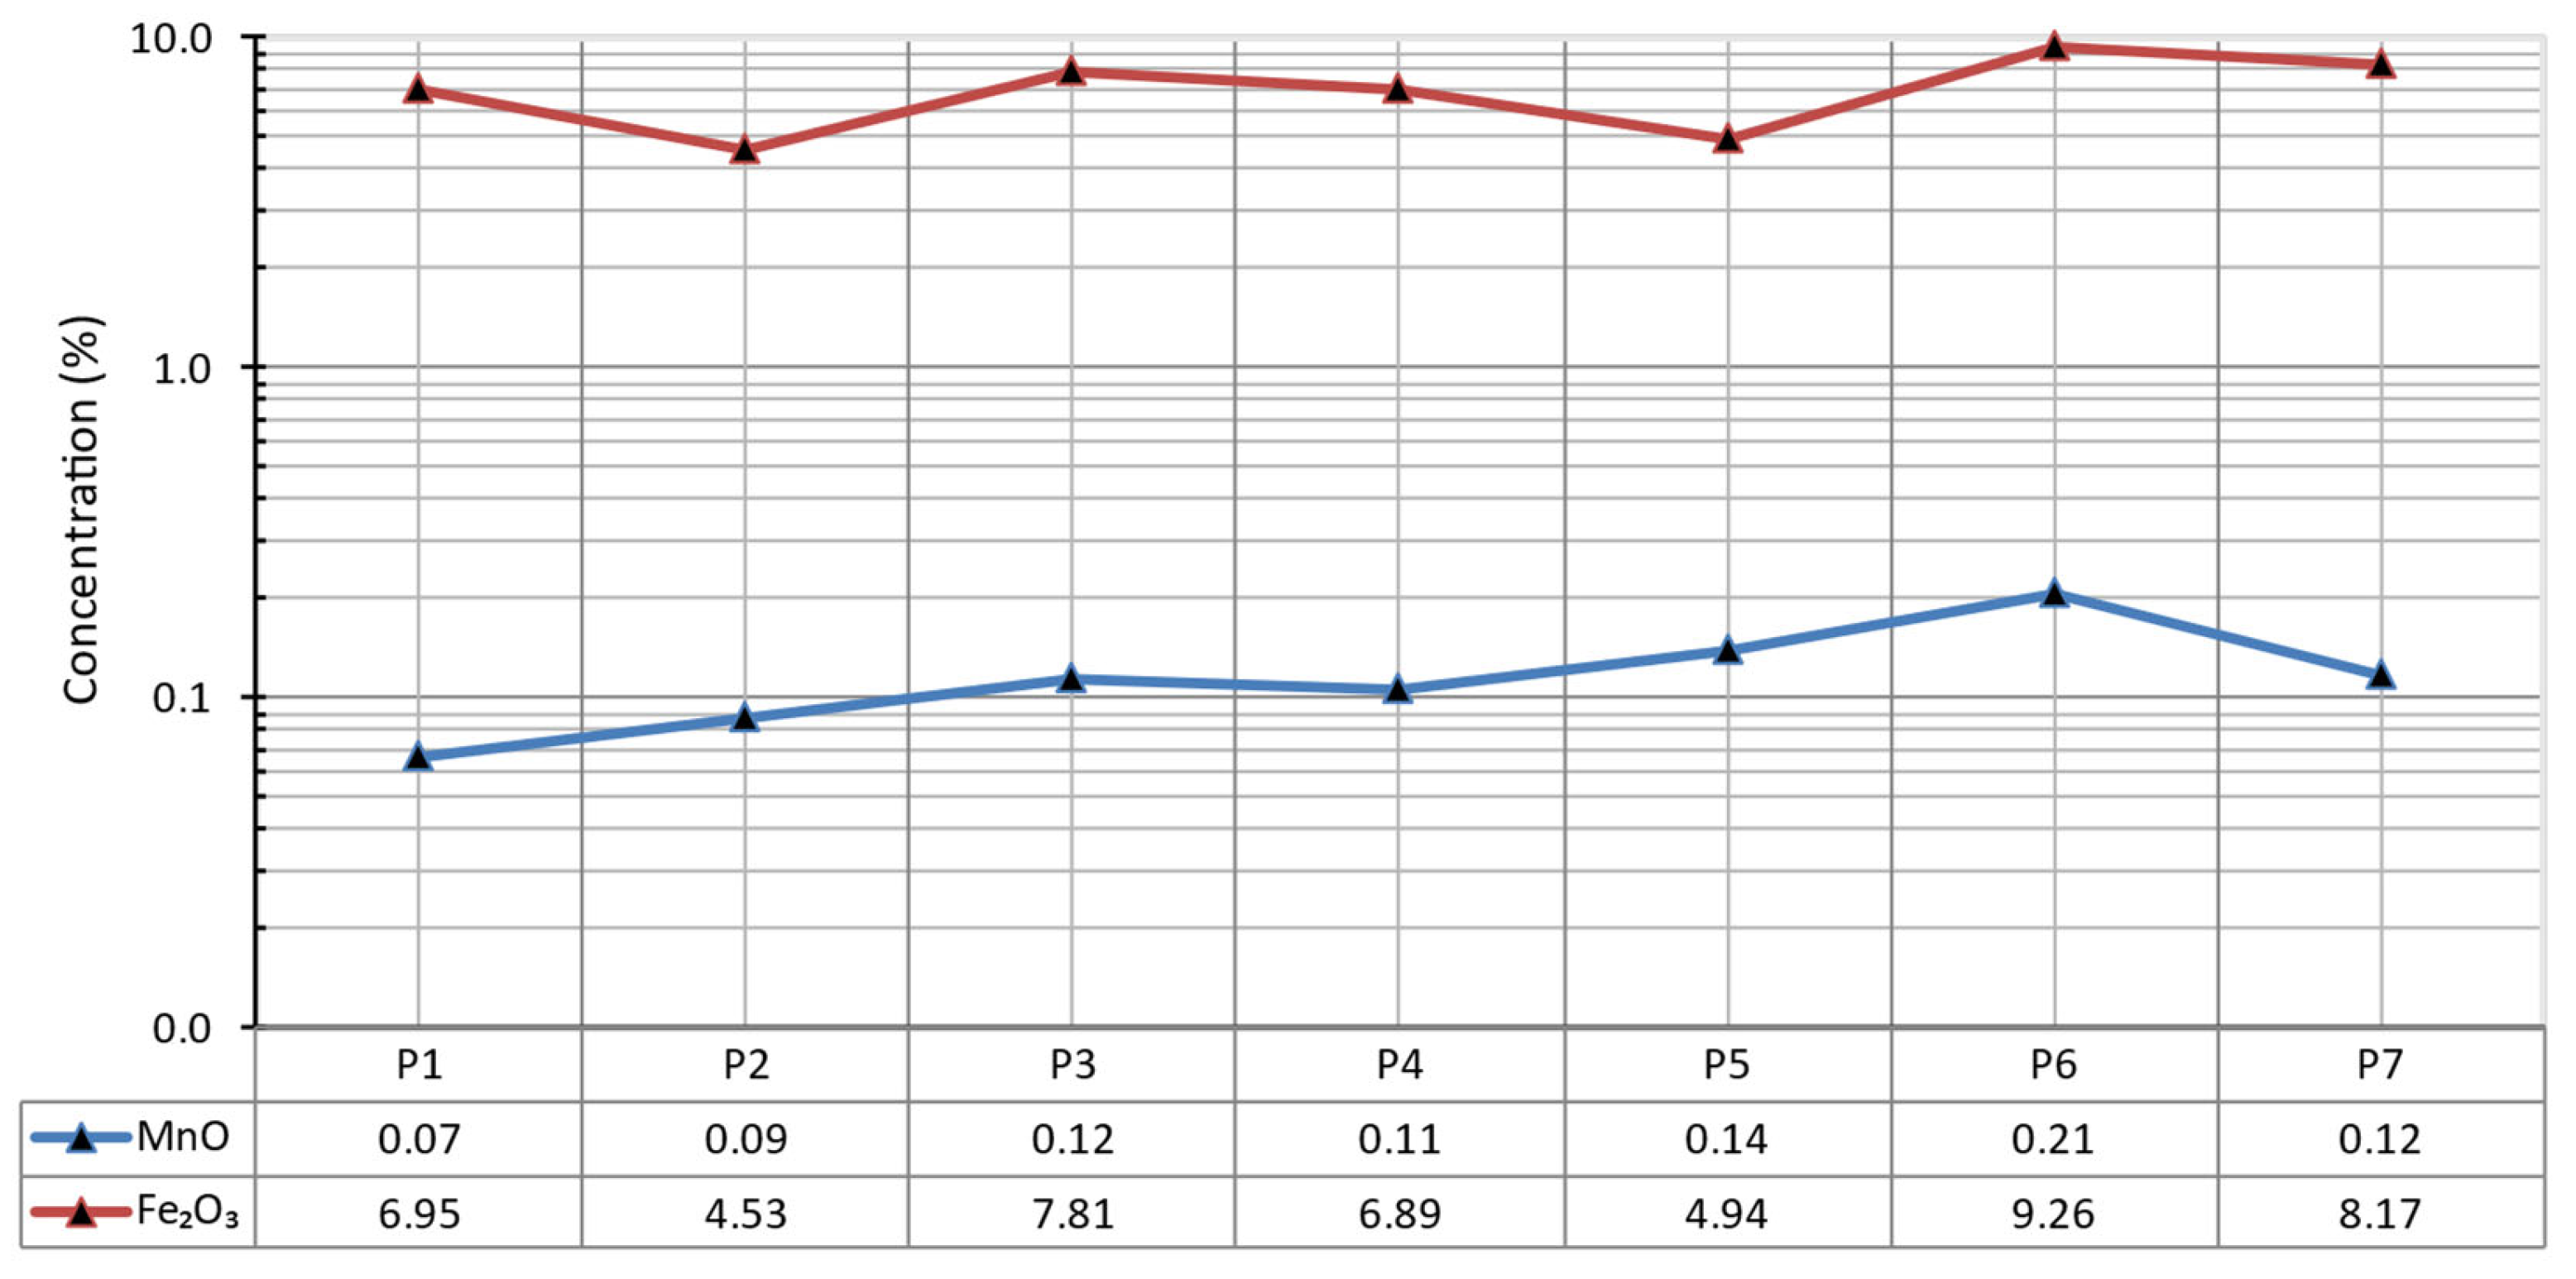
Figure 10.
The spatial distribution of MnO and Fe2O3 of the reservoir sediments.
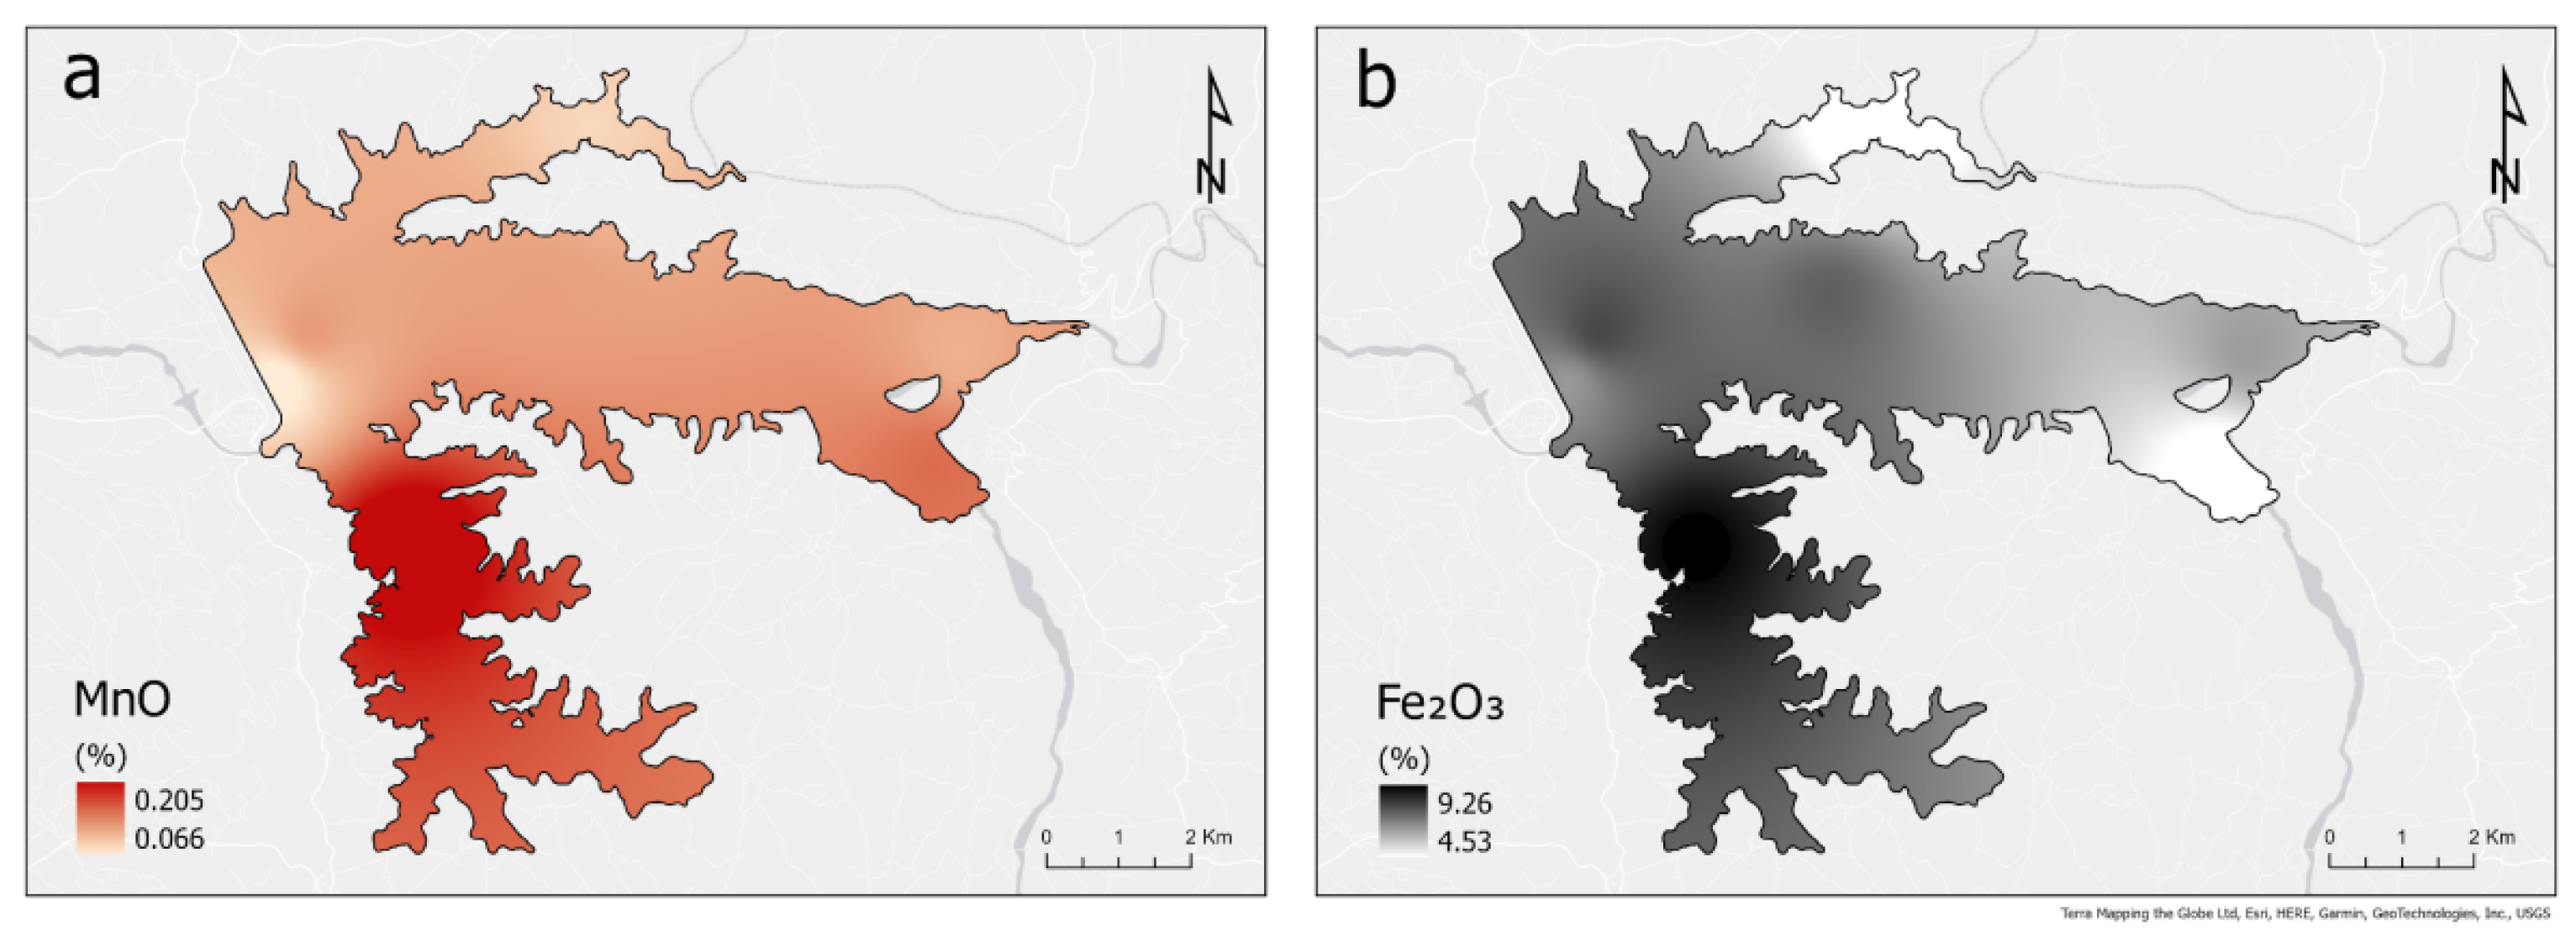
Figure 11.
Distribution of physicochemical parameters in the water column (9/10/2018). StationP7:(a) D.O. (mg/L), (b) T (°C) and (c) pH & Station P3:(d) D.O. (mg/L), (e)T(°C) and (f) pH.
Figure 11.
Distribution of physicochemical parameters in the water column (9/10/2018). StationP7:(a) D.O. (mg/L), (b) T (°C) and (c) pH & Station P3:(d) D.O. (mg/L), (e)T(°C) and (f) pH.
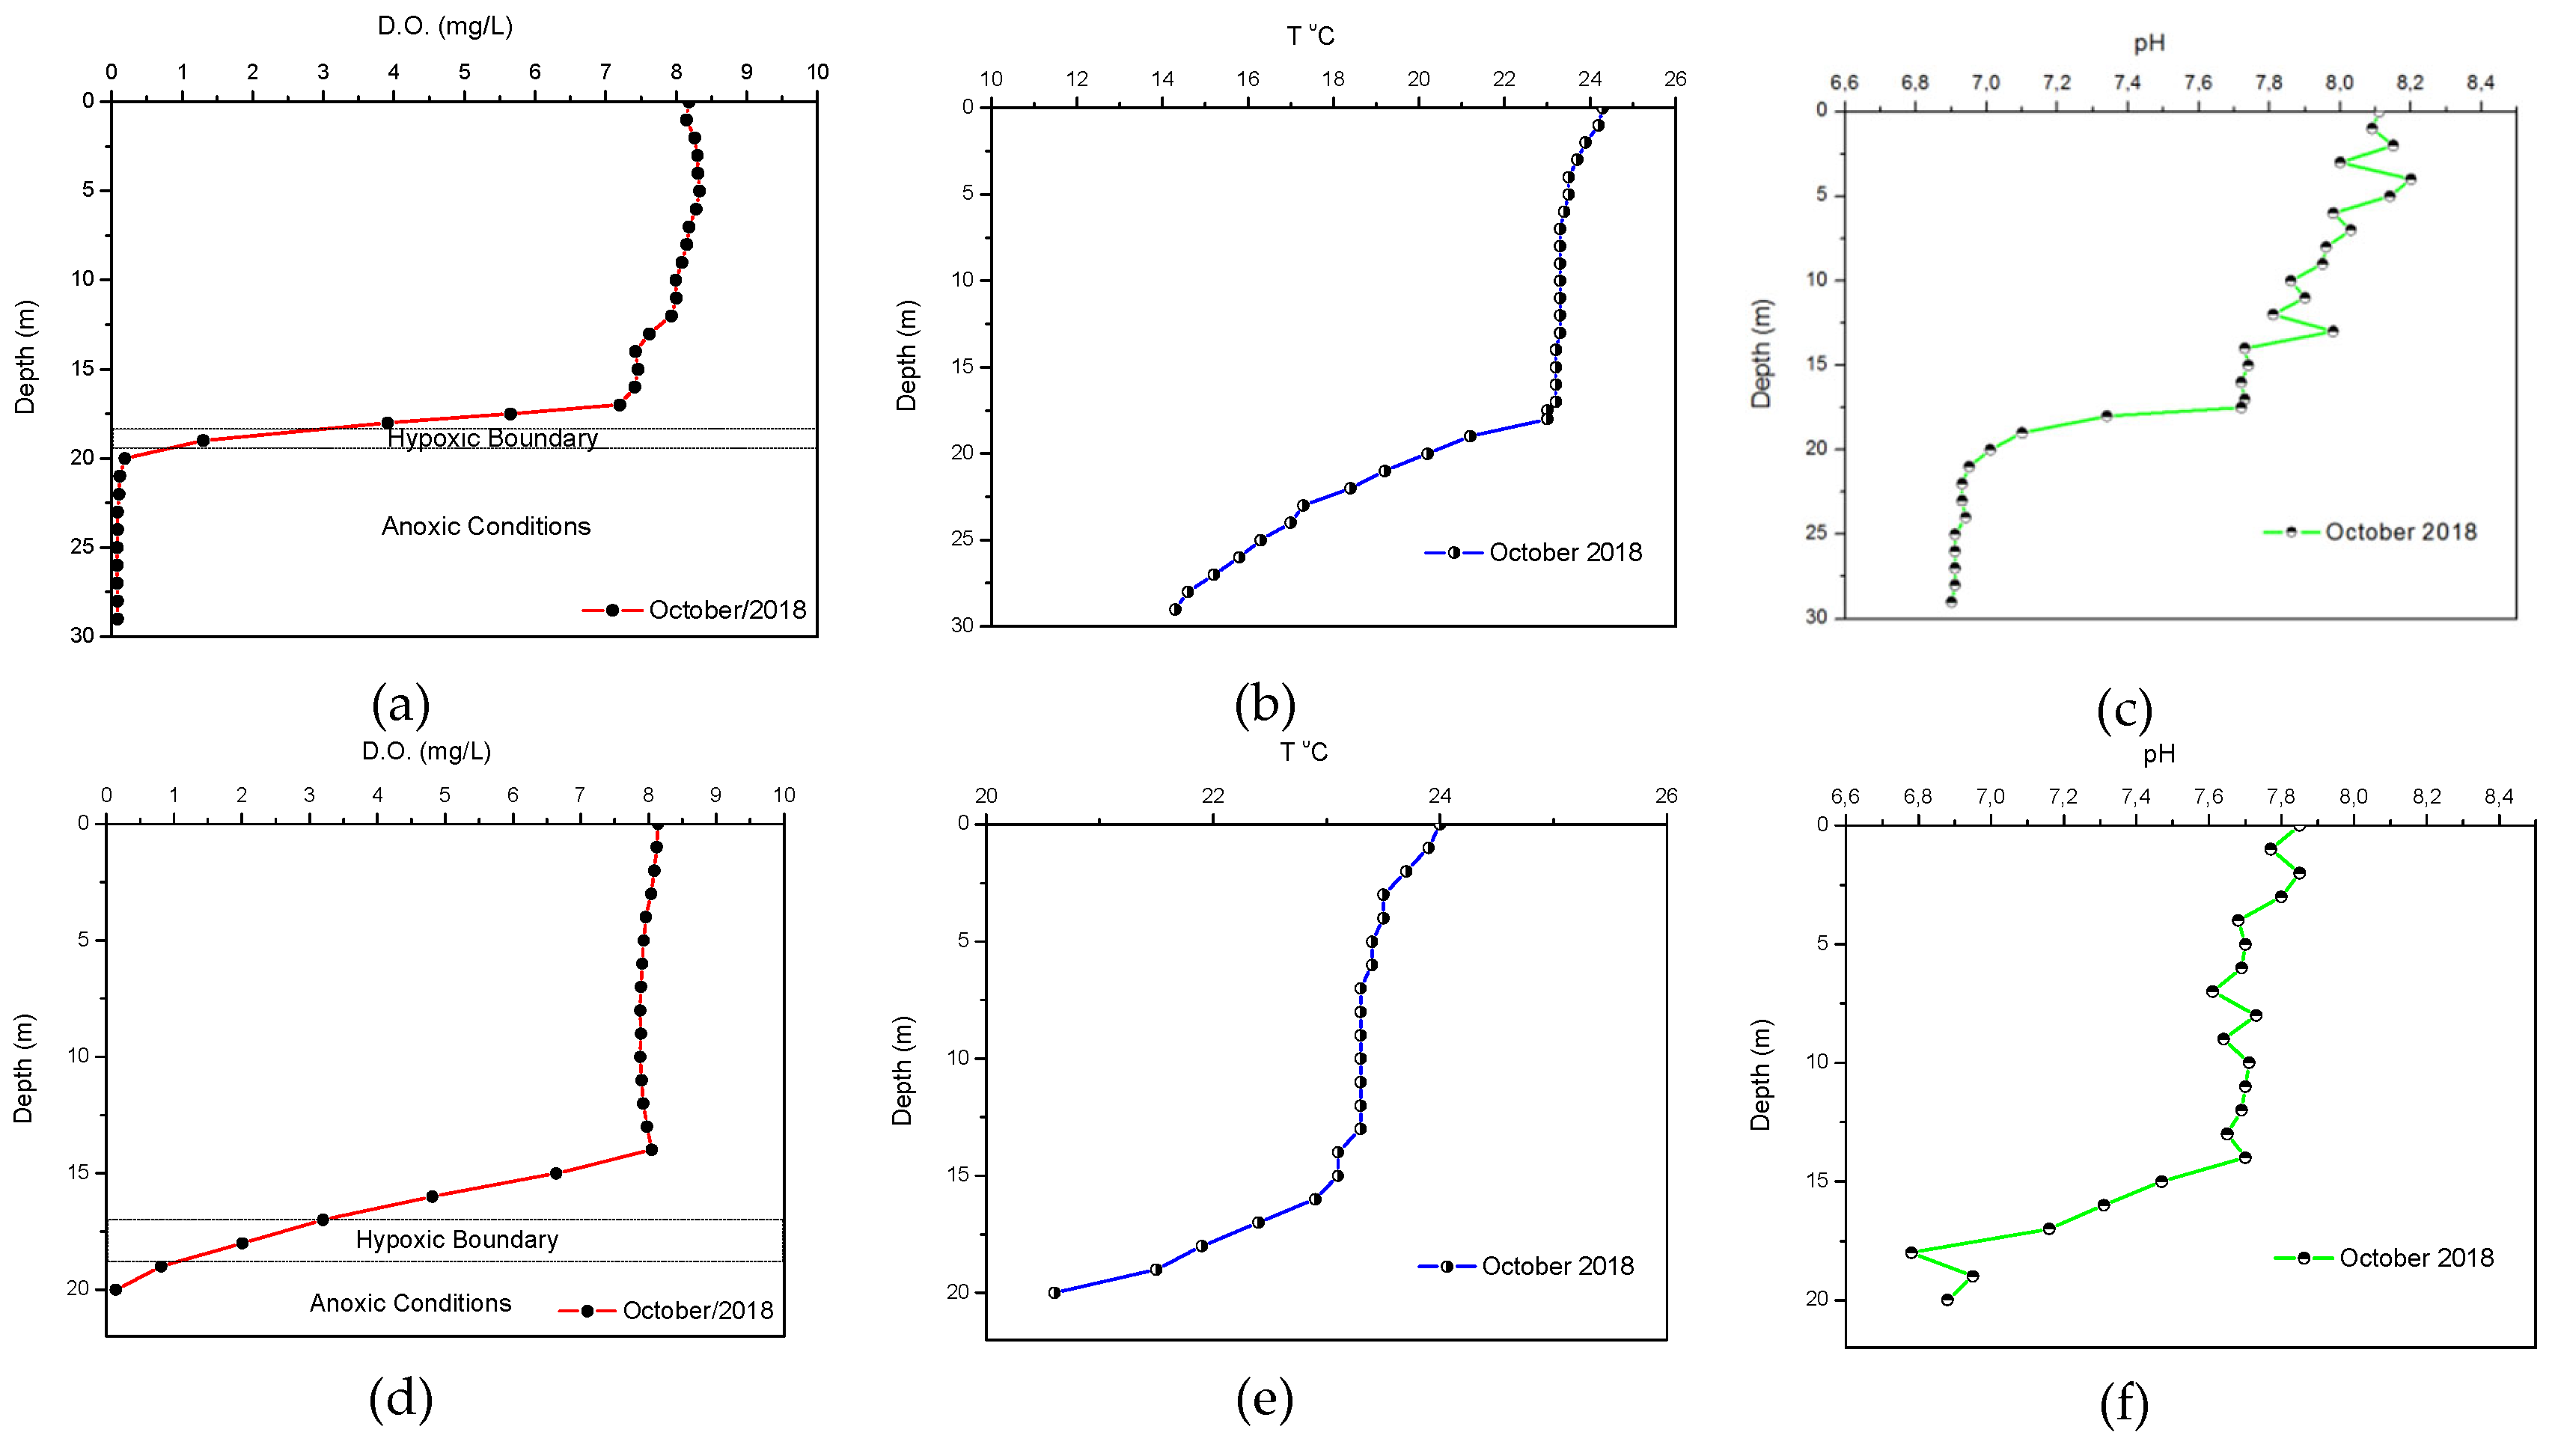
Figure 12.
Distribution of physicochemical parameters in the water column (22/02/2019). Station P7: (a) D.O. (mg/L), (b) T (°C) and (c) pH& station P3: (d) D.O. (mg/L), (e)T(°C) and (f) pH.
Figure 12.
Distribution of physicochemical parameters in the water column (22/02/2019). Station P7: (a) D.O. (mg/L), (b) T (°C) and (c) pH& station P3: (d) D.O. (mg/L), (e)T(°C) and (f) pH.
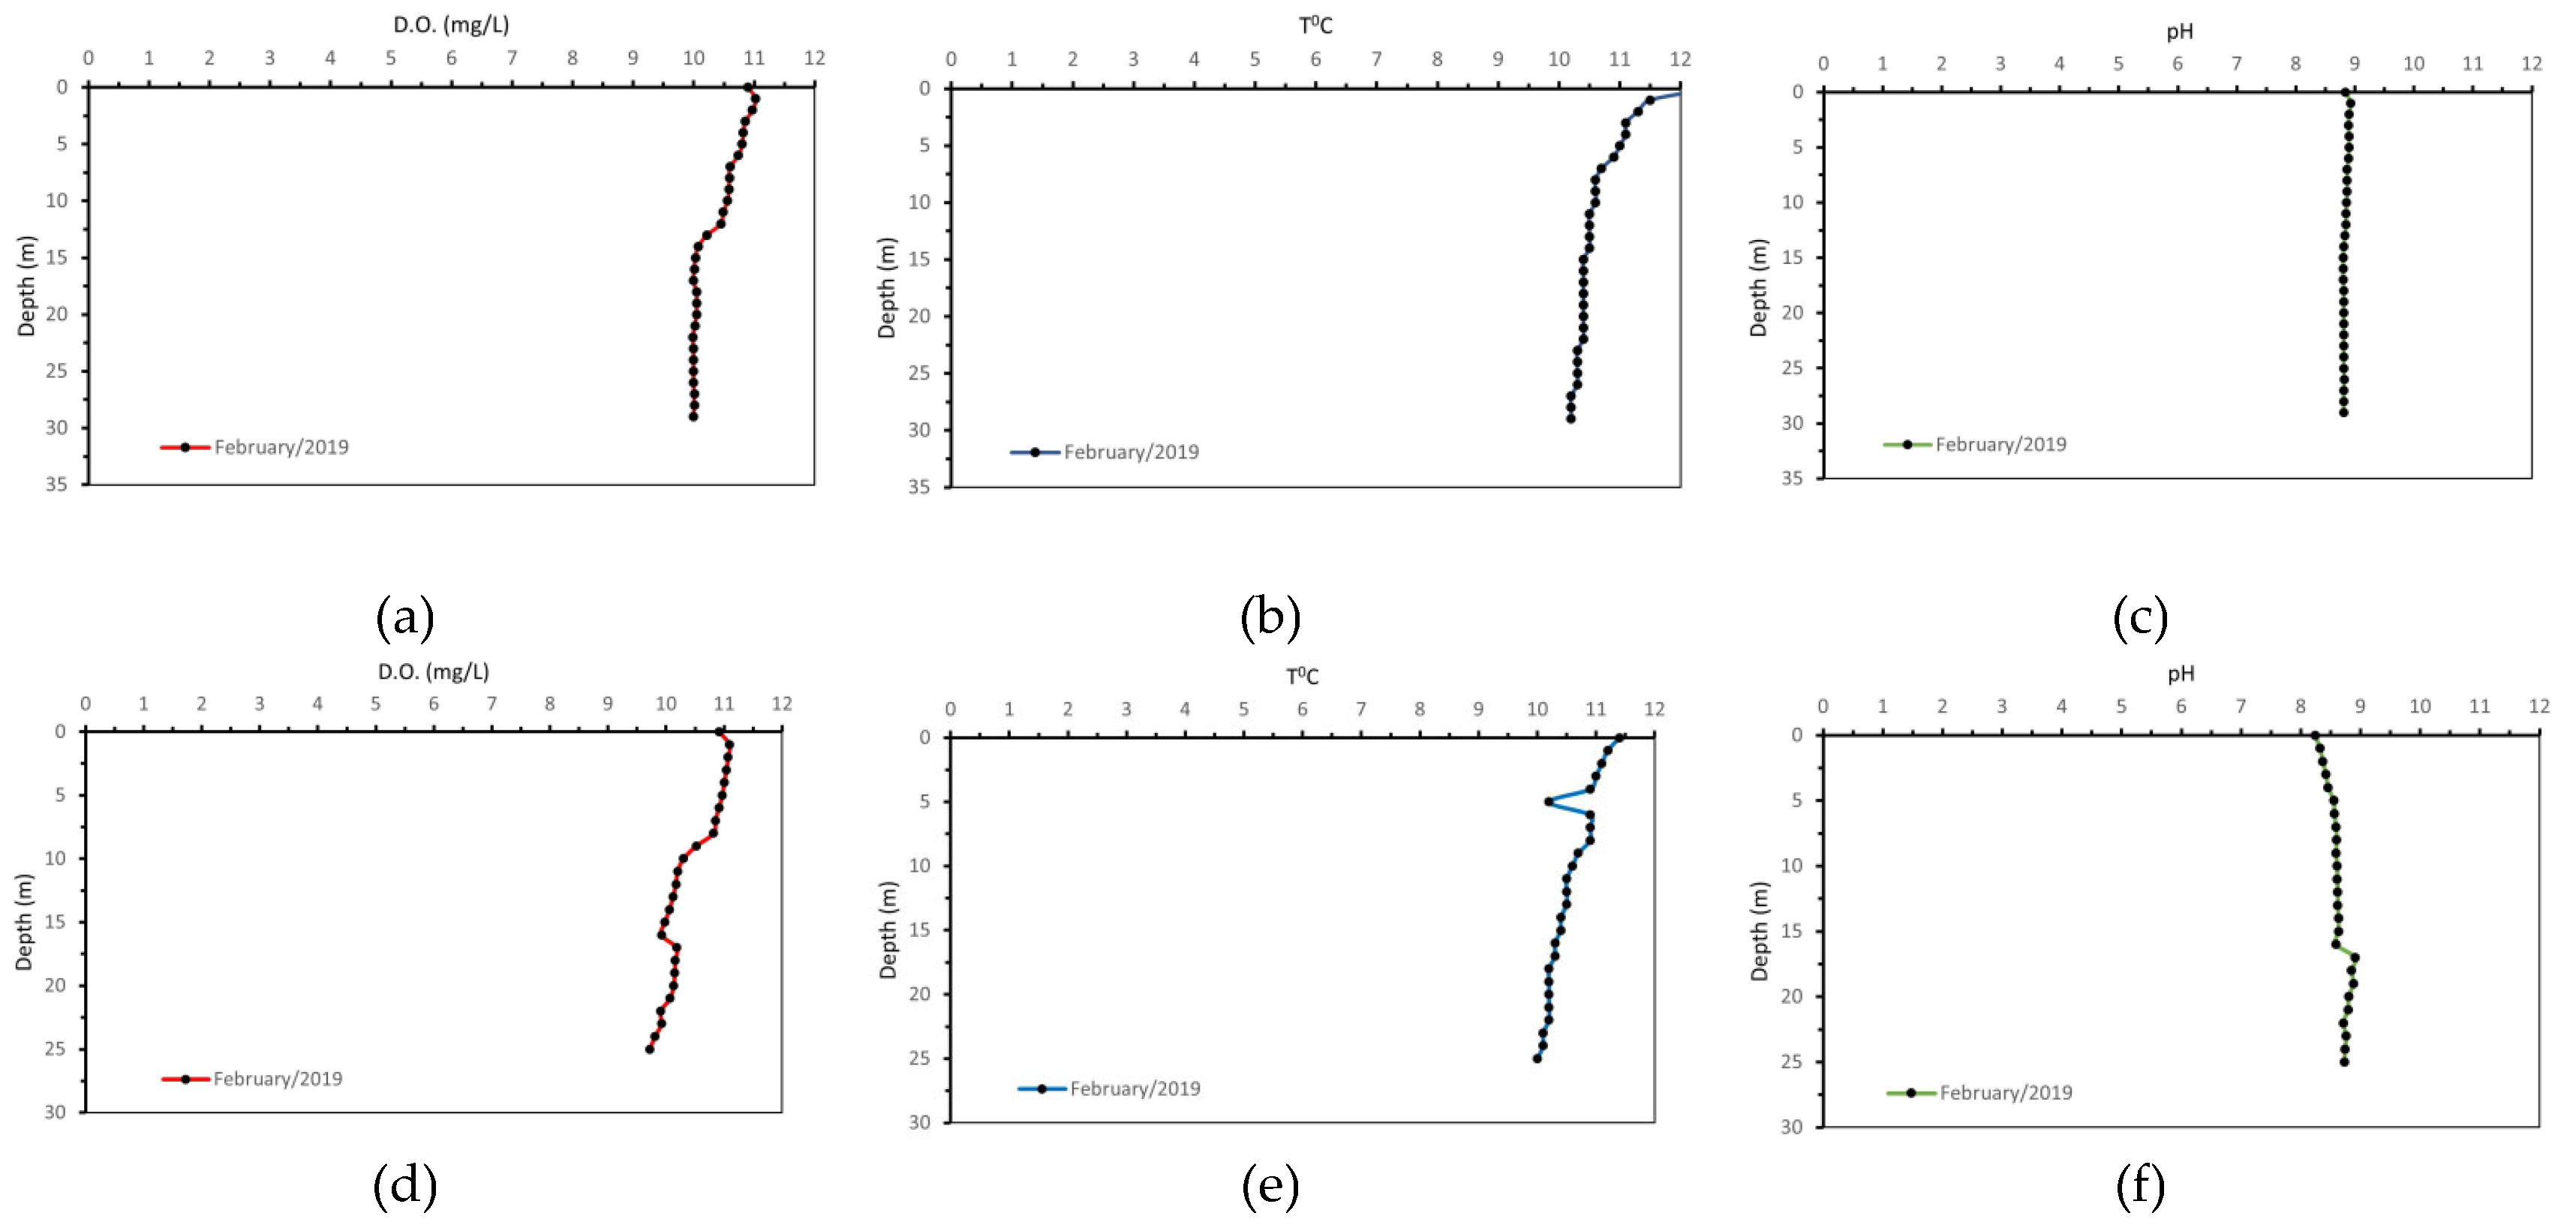
Figure 13.
Chemical analyses of the runoff water samples from the Pinios River network (Ca2+, Mg2+, Na+, HCO3-, SO42-, Cl-, NO3-).
Figure 13.
Chemical analyses of the runoff water samples from the Pinios River network (Ca2+, Mg2+, Na+, HCO3-, SO42-, Cl-, NO3-).
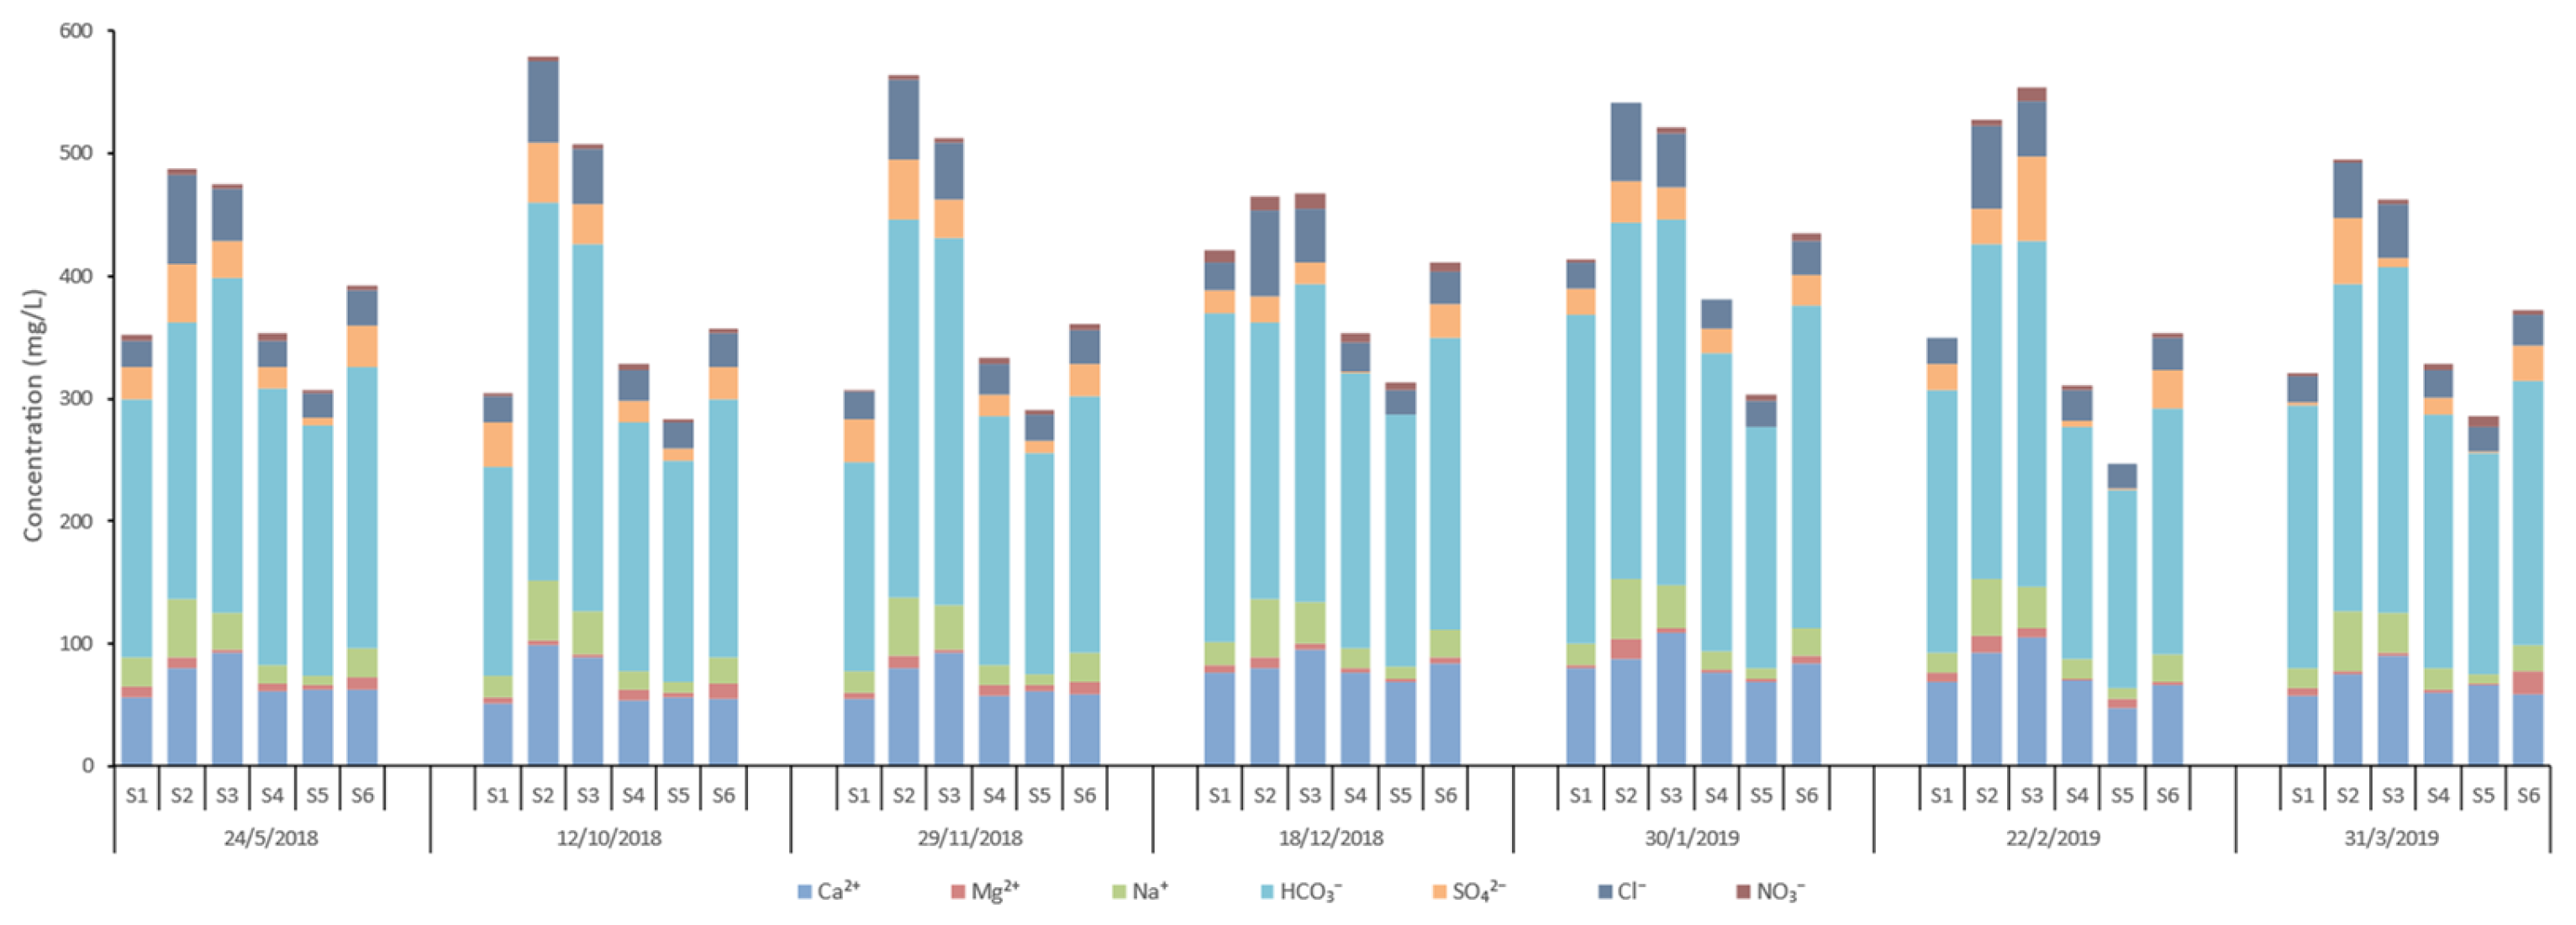
Figure 14.
Chemical analyses of the runoff water samples from the Pinios River network (K+, NO2-, NH4+, PO43-, Fetot, Mn).
Figure 14.
Chemical analyses of the runoff water samples from the Pinios River network (K+, NO2-, NH4+, PO43-, Fetot, Mn).
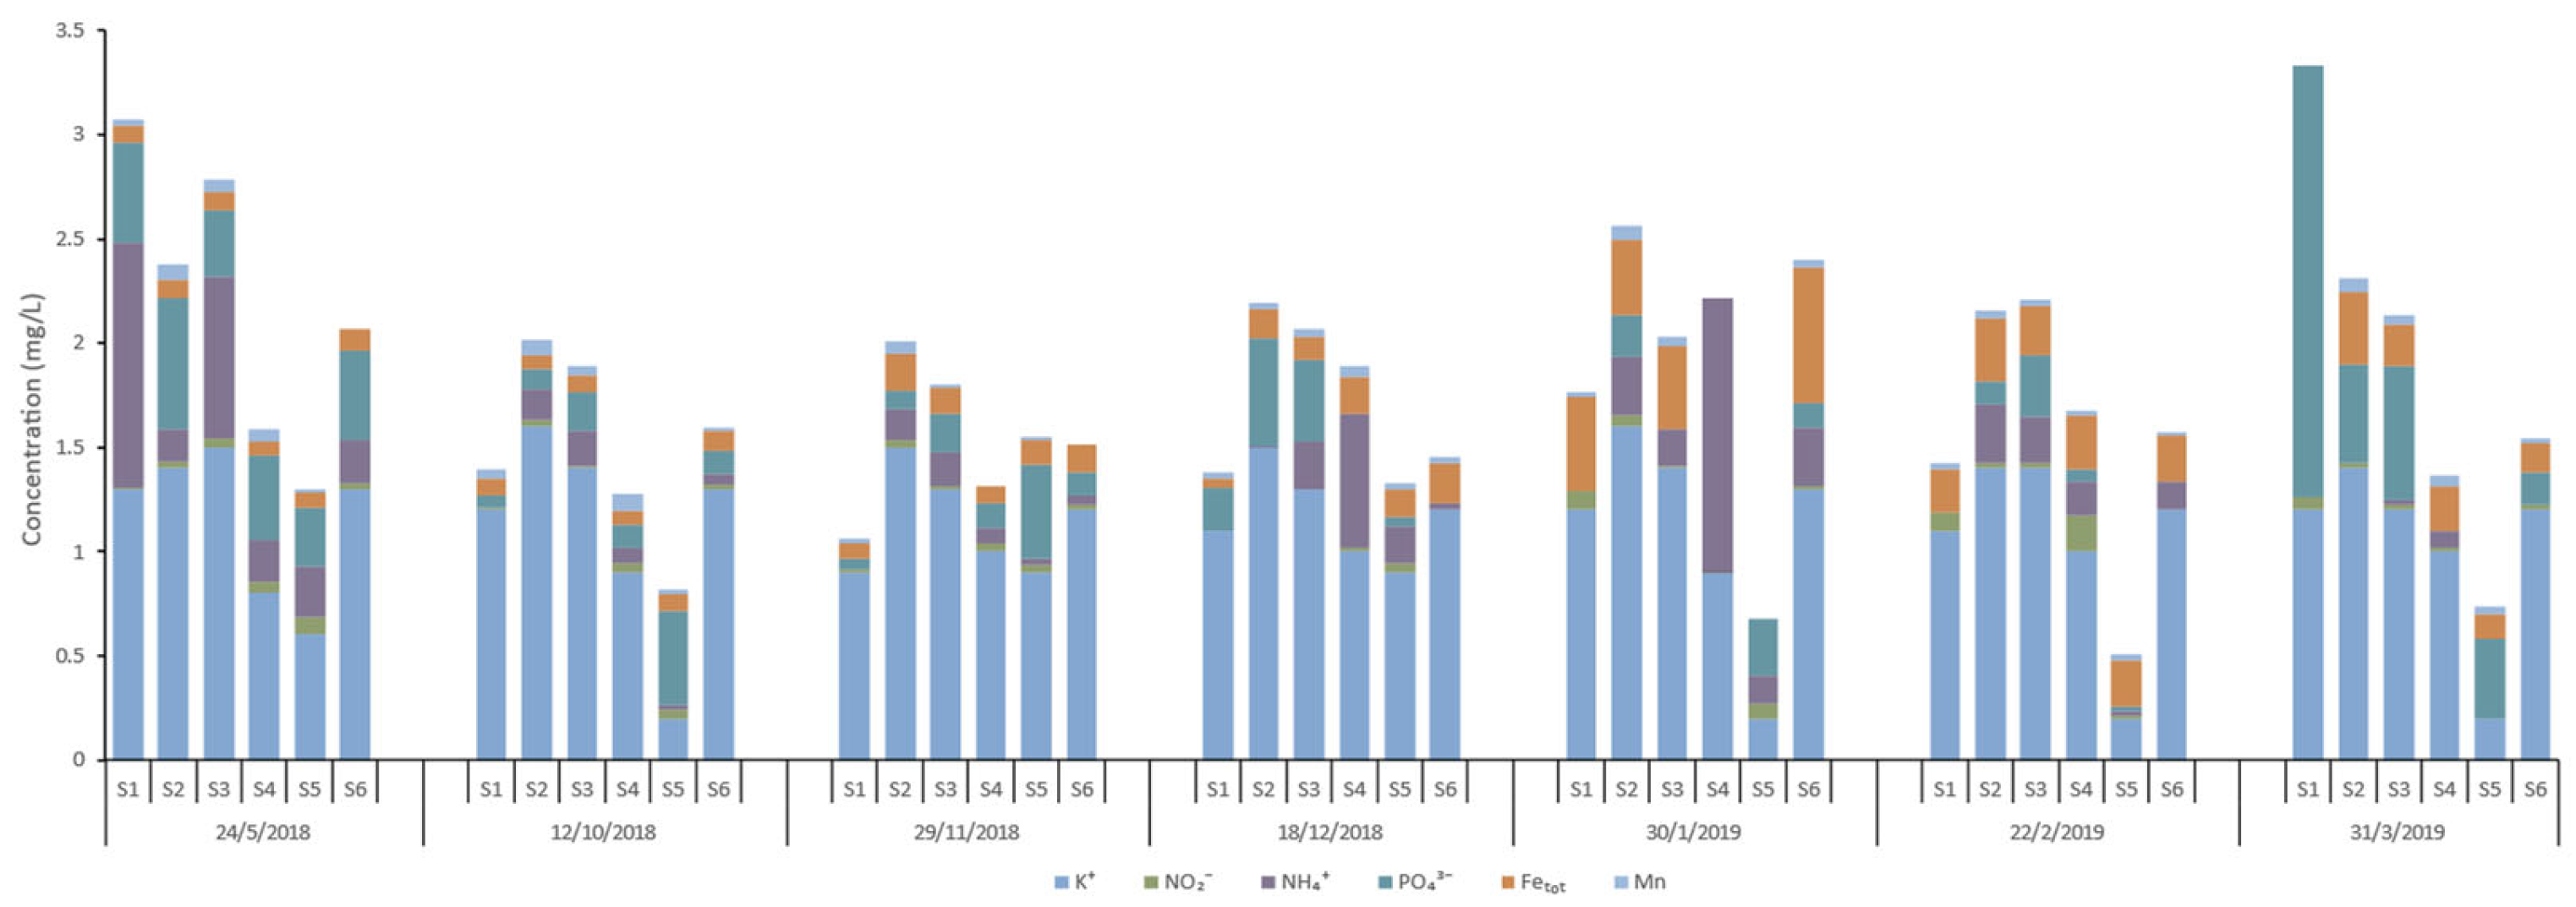
Figure 15.
Chemical analyses of the runoff water samples from the Pinios River network (pH, Temperature (°C), Conductivity at 25 ◦C).
Figure 15.
Chemical analyses of the runoff water samples from the Pinios River network (pH, Temperature (°C), Conductivity at 25 ◦C).
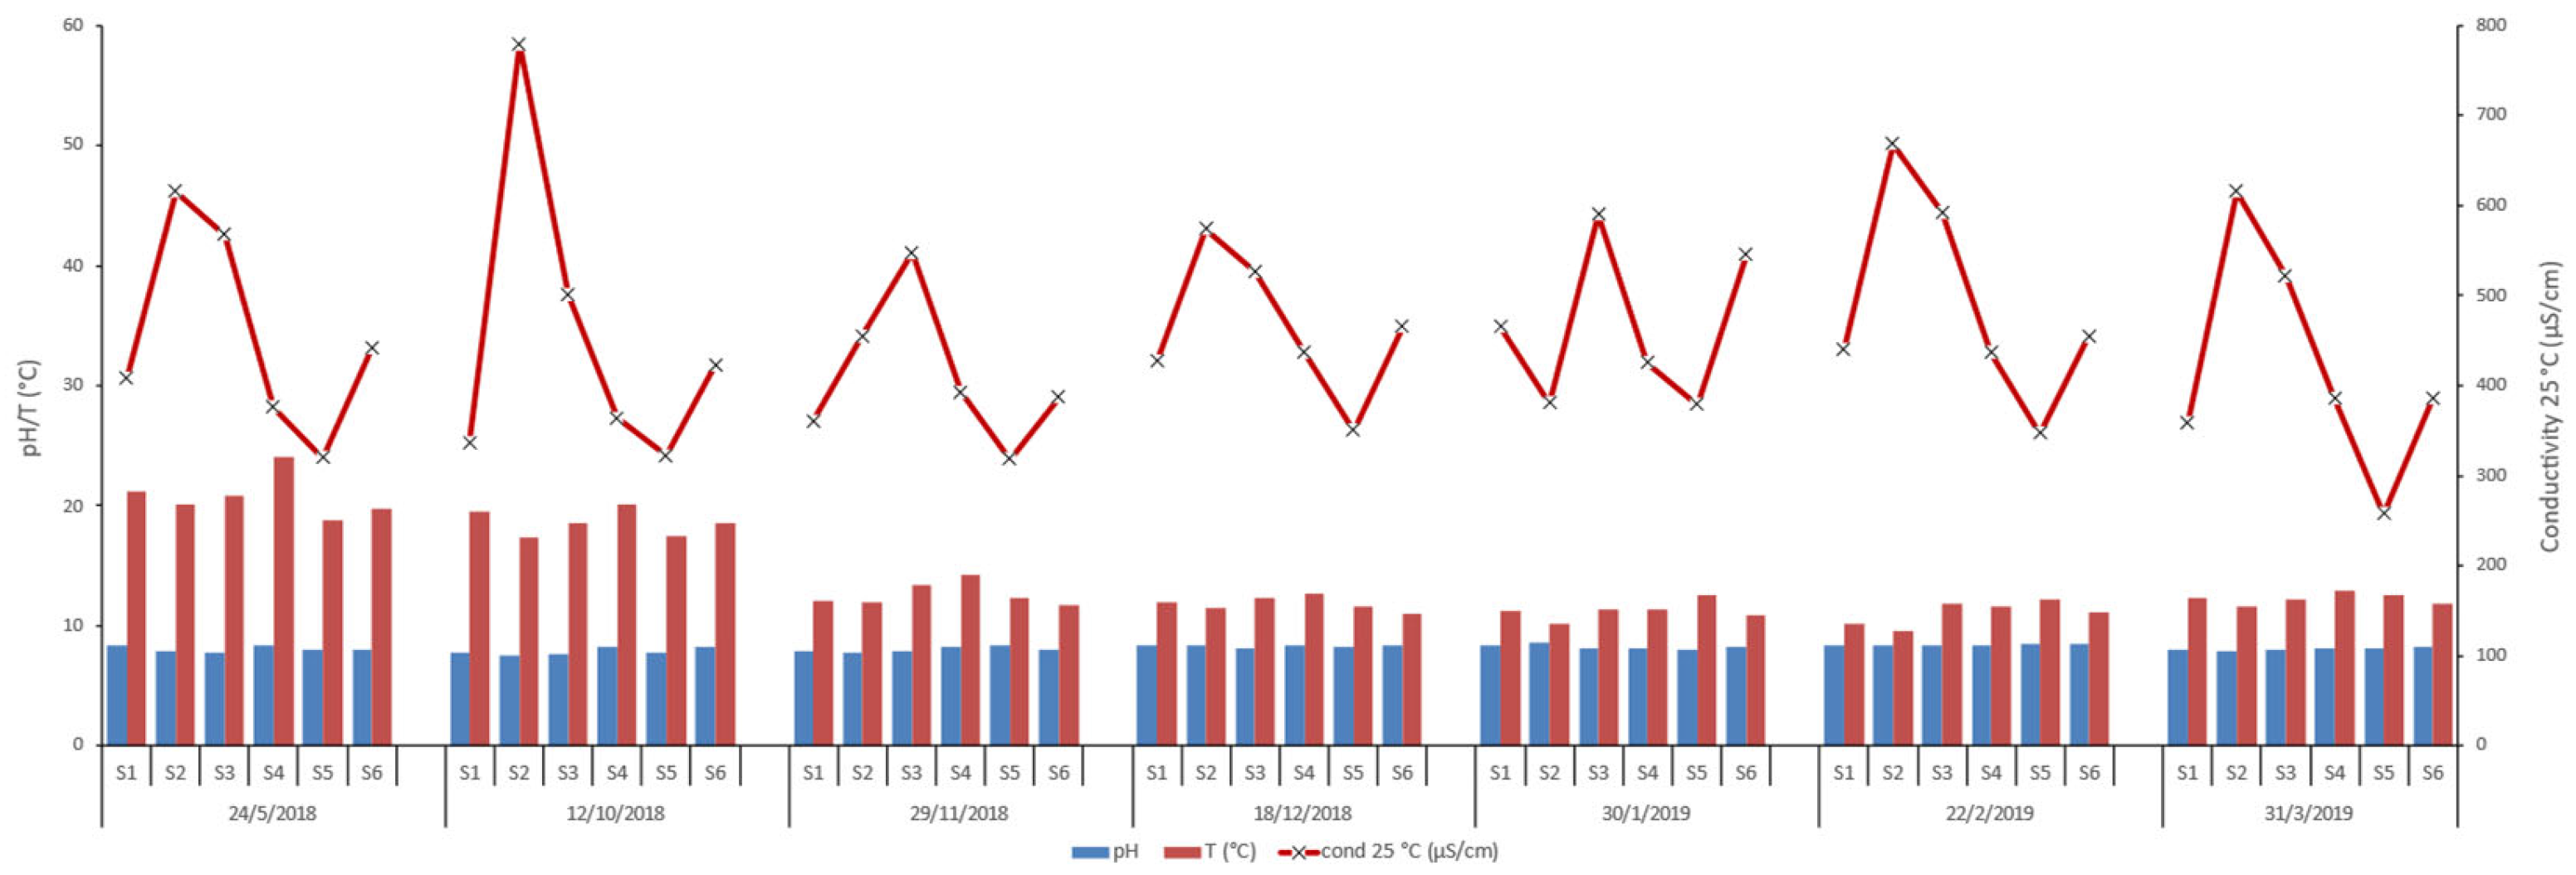
Figure 16.
Spatial distribution of Mn (a, b, c) and Fetot (d,e,f)of the reservoir’s surface water samples. Sampling dates: (a and d, 04/06/2018), (b and e, 09/10/2018), (c and f, 22/02/2019).
Figure 16.
Spatial distribution of Mn (a, b, c) and Fetot (d,e,f)of the reservoir’s surface water samples. Sampling dates: (a and d, 04/06/2018), (b and e, 09/10/2018), (c and f, 22/02/2019).

Figure 17.
Variation of manganese and iron concentration of the reservoir water samples on (a) 04/06/2018, (b) 09/10/2018, (c) 22/02/2019 in contrast with the Fe and Mn influx from the surrounding tributaries on 31/01/2019, and (d) 22/02/2019 in contrast with the Fe and Mn influx from the surrounding tributaries on 22/02/2019.
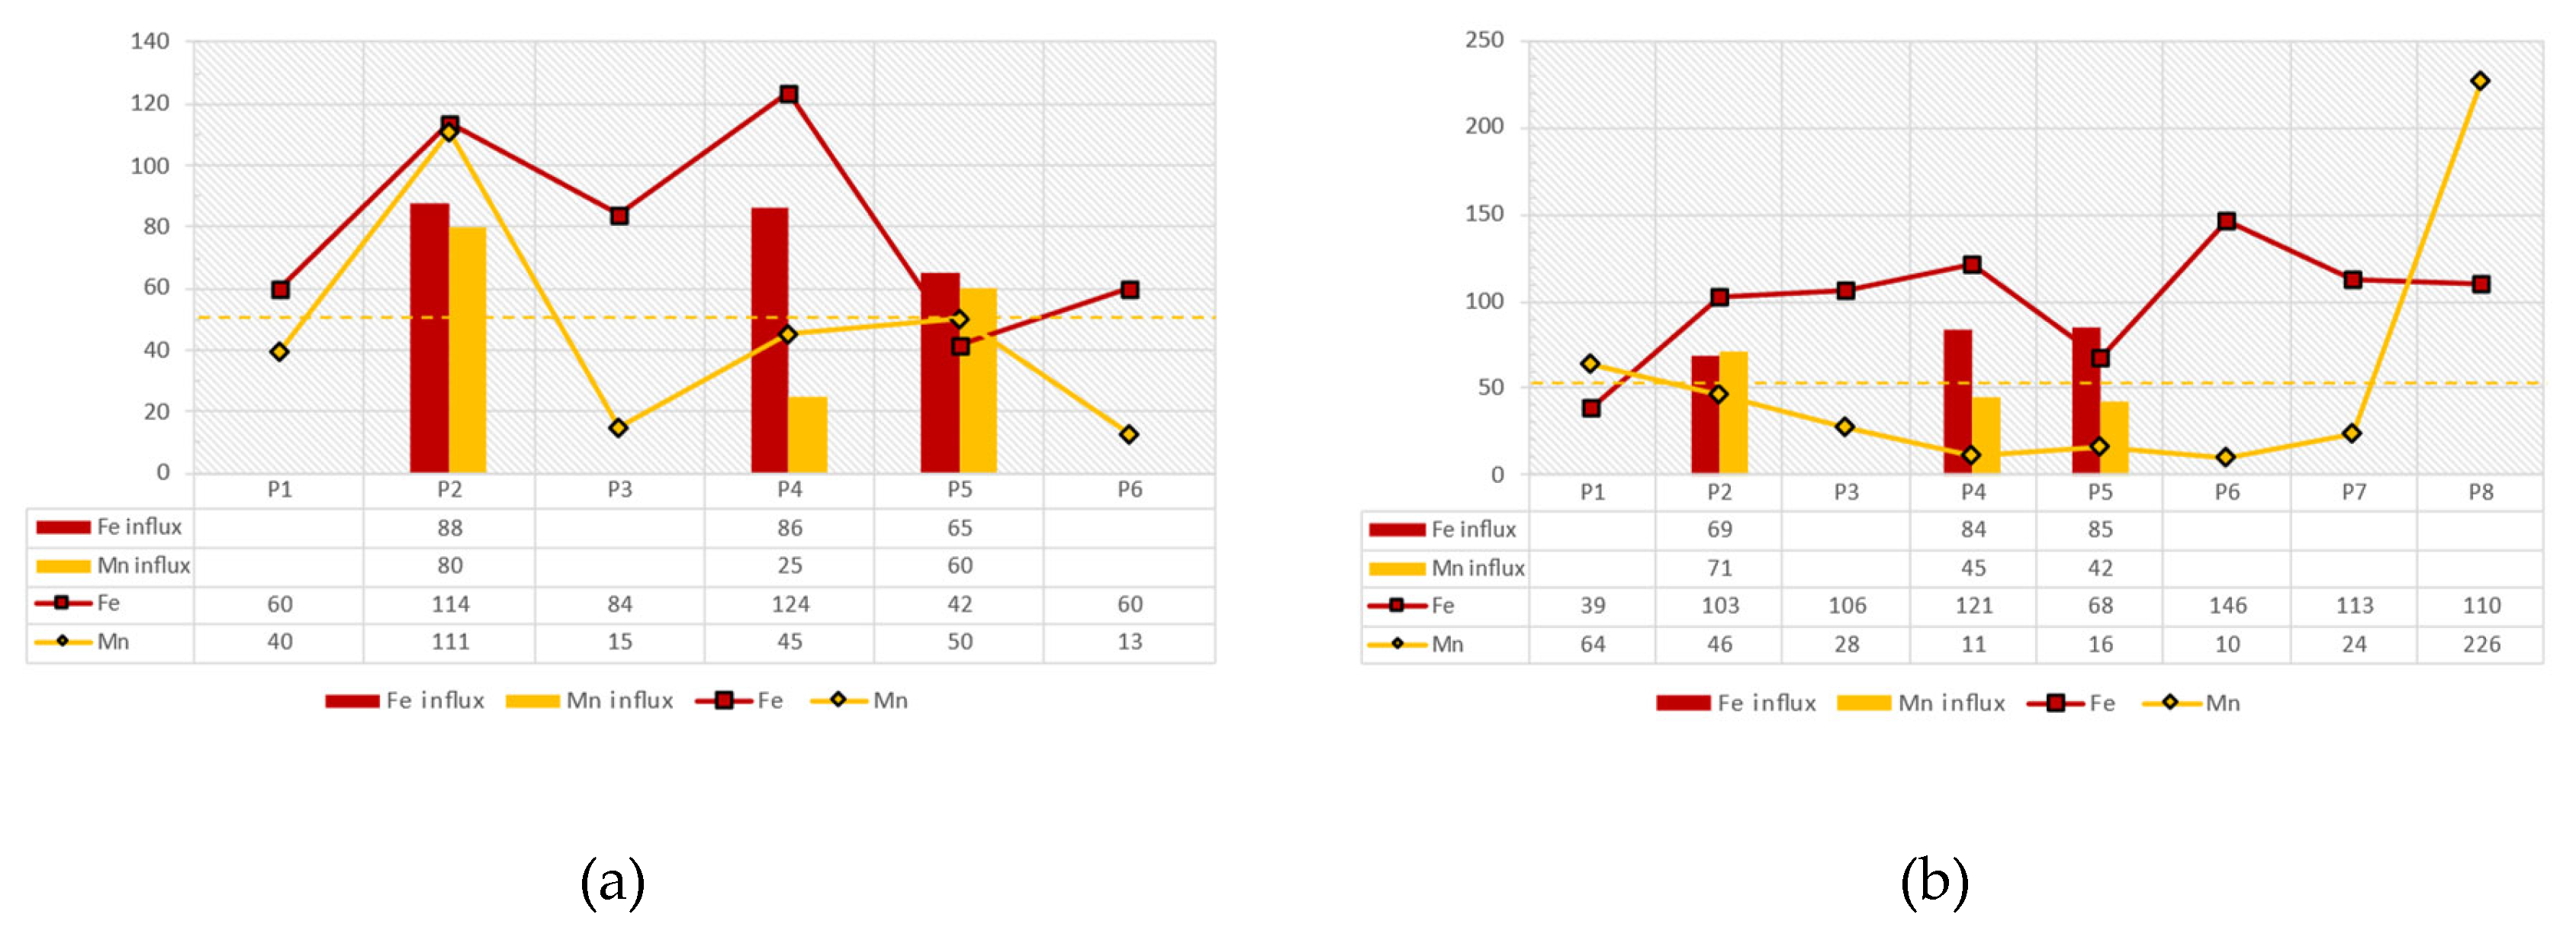
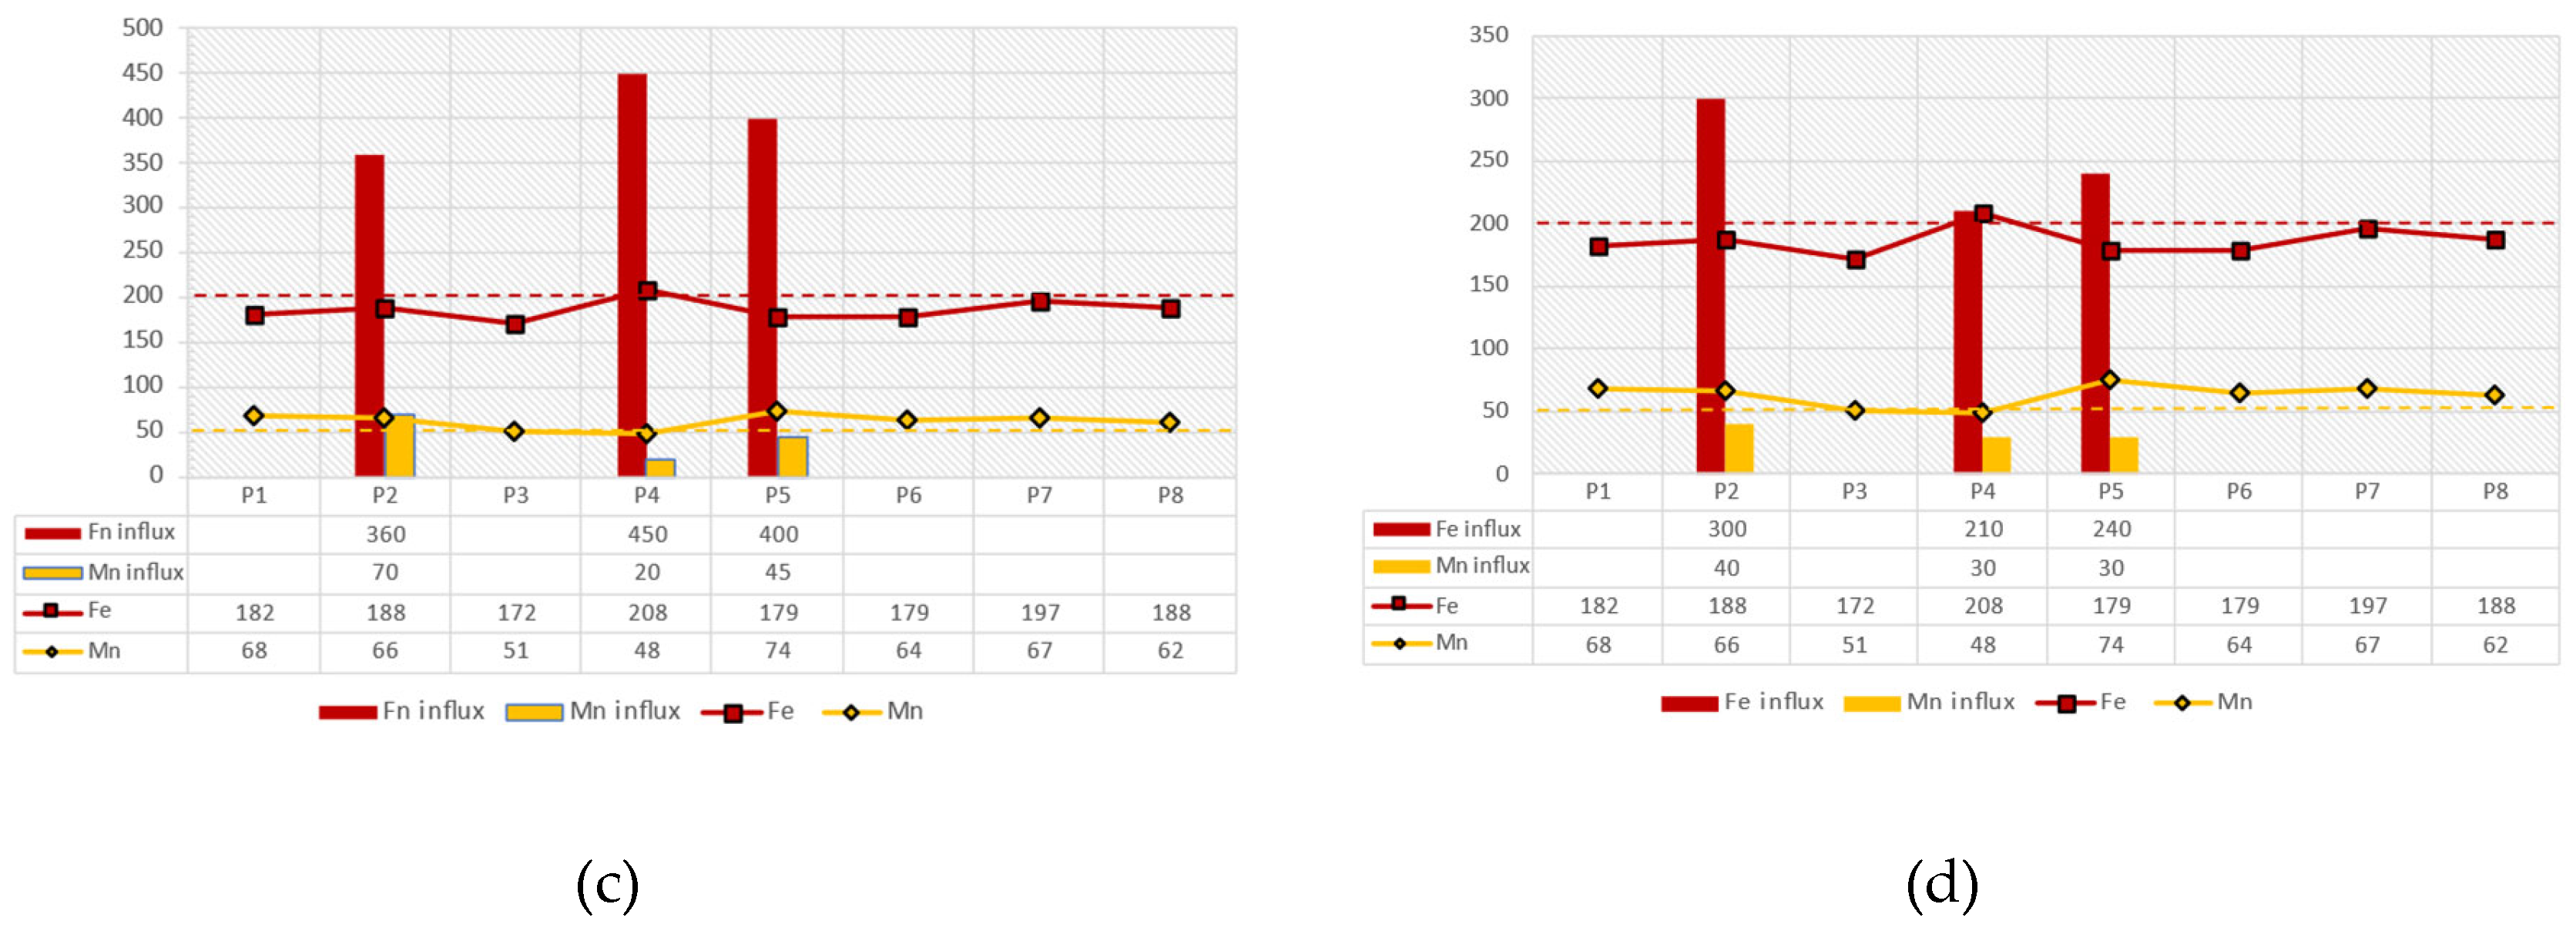
Figure 18.
Variation of manganese and iron concentration of the reservoir water samples on 09/10/2018 (a) Fetot & (b) Mn, and 22/02/2019(c) Fetot & (d) Mn.
Figure 18.
Variation of manganese and iron concentration of the reservoir water samples on 09/10/2018 (a) Fetot & (b) Mn, and 22/02/2019(c) Fetot & (d) Mn.
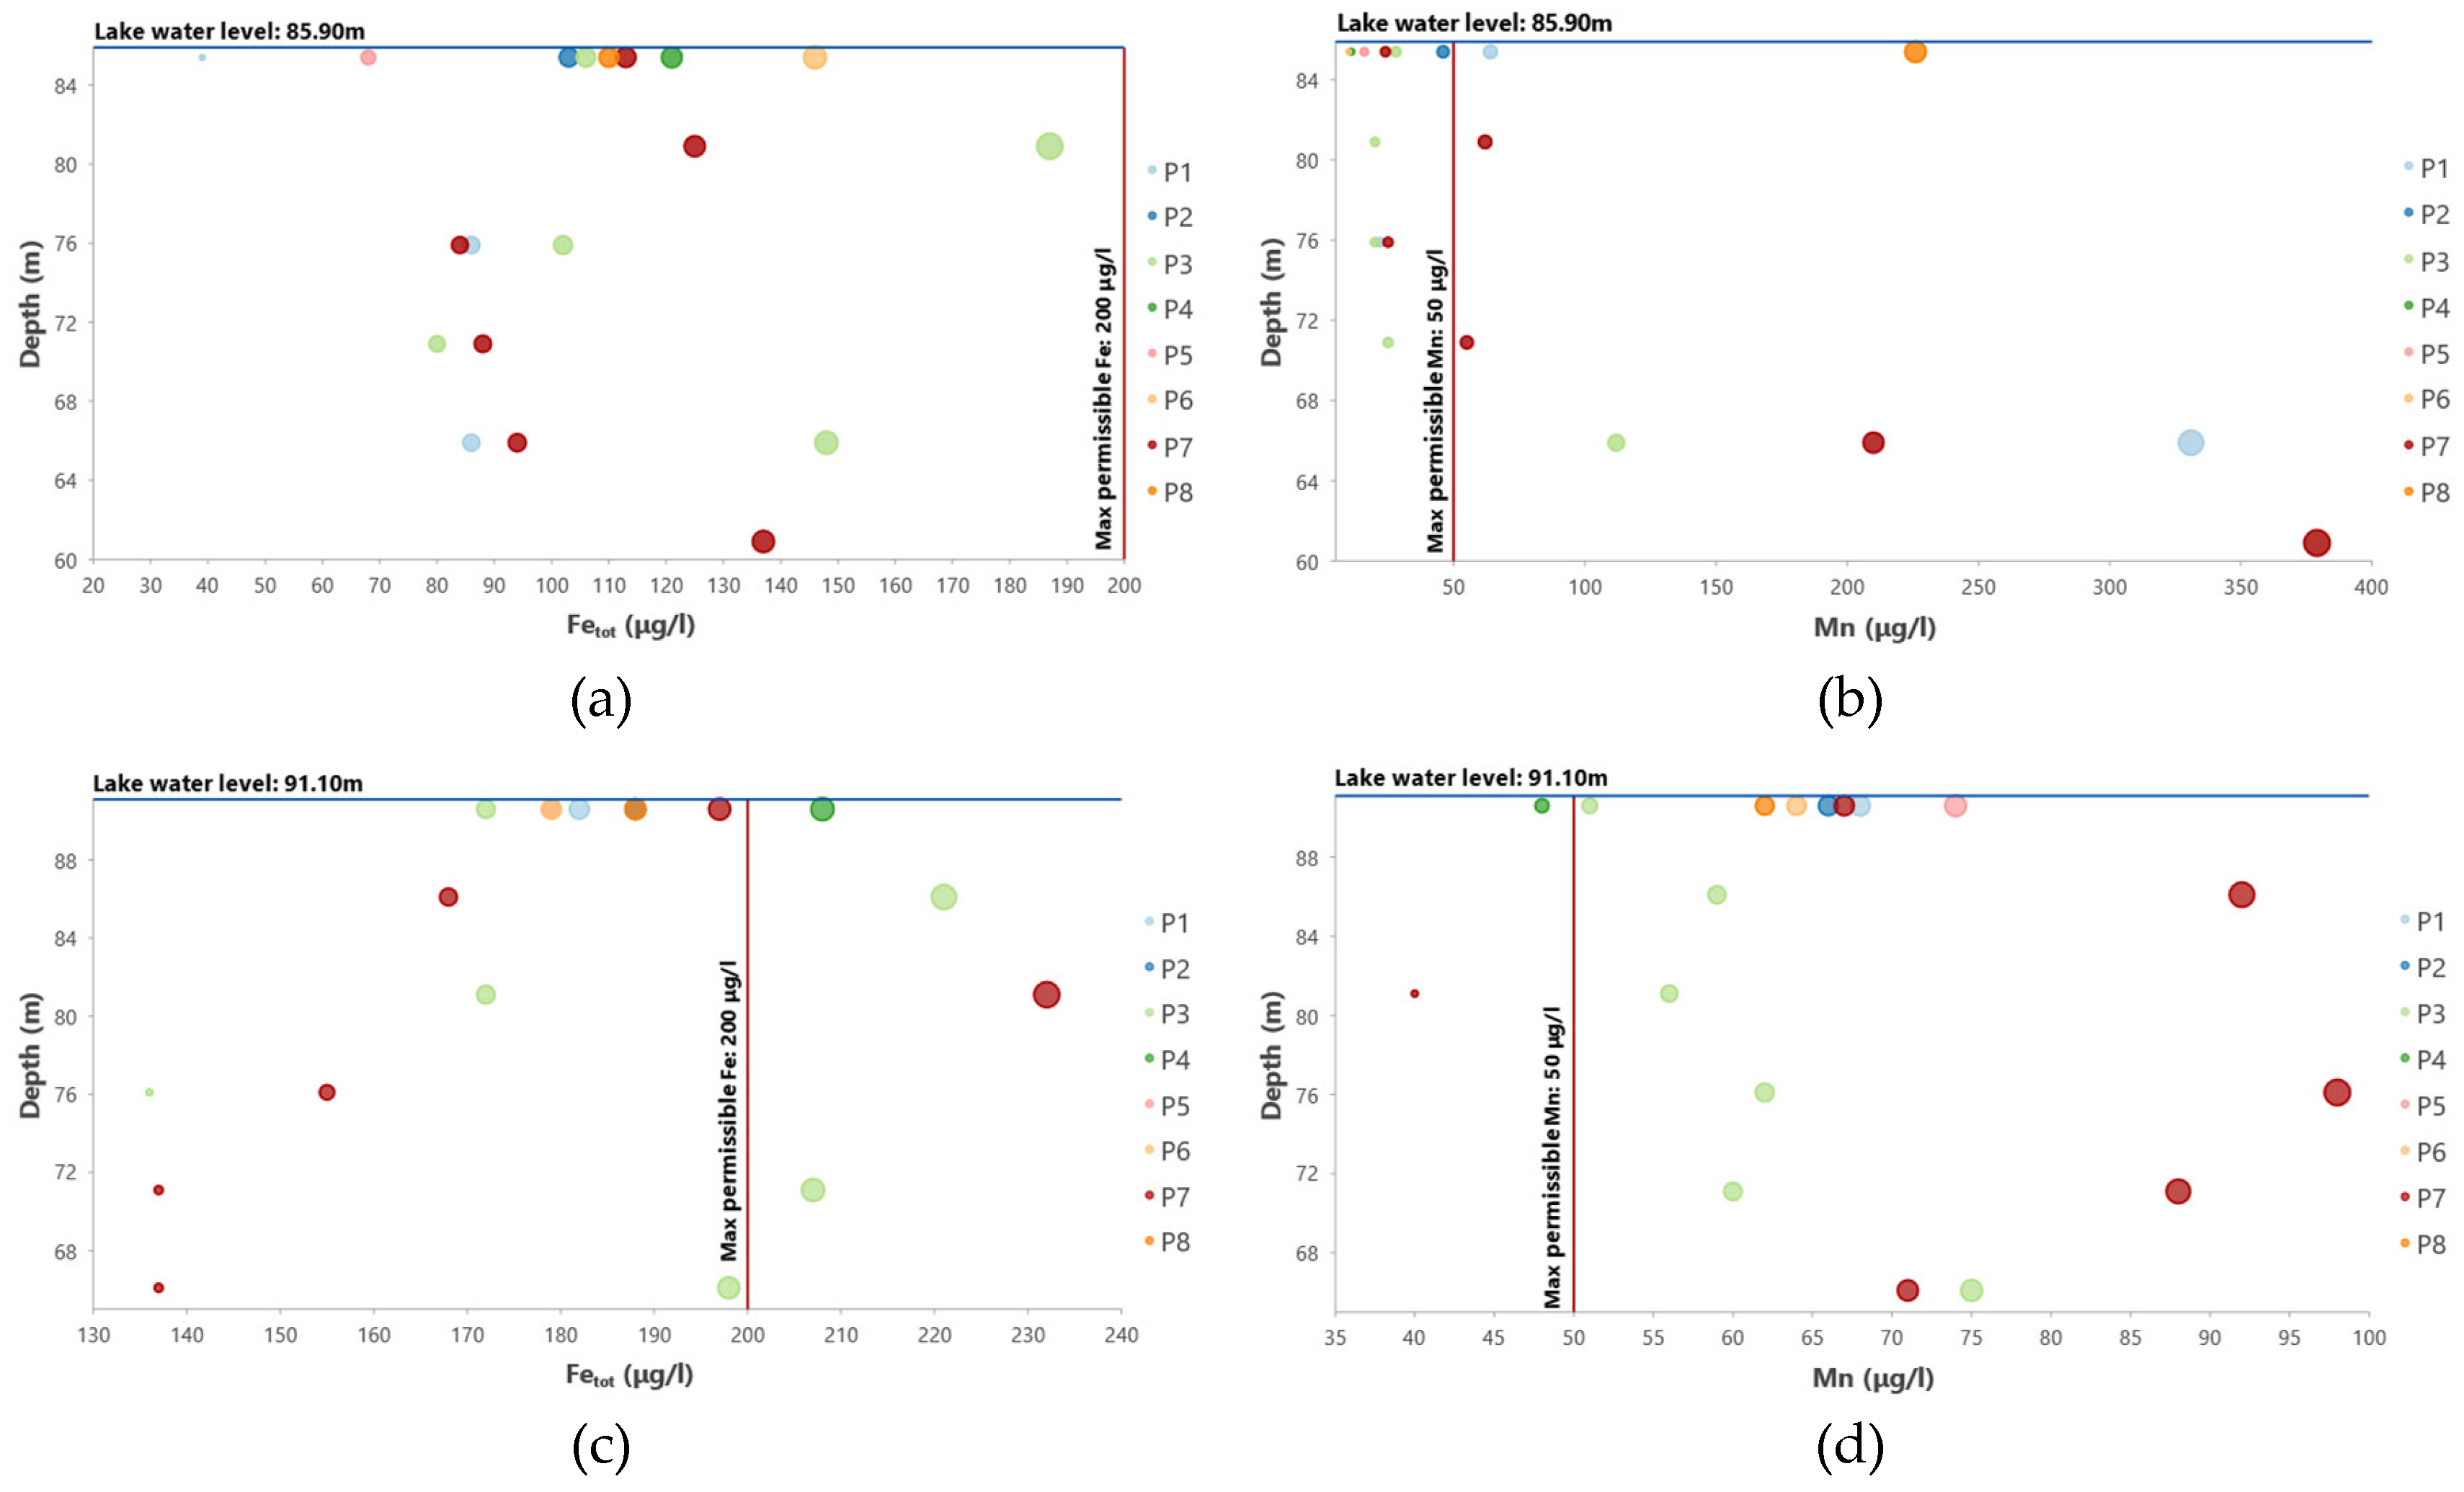

Table 1.
Water depth in the reservoir during the sampling periods.
| Codes | Stations | Water depth (m) 04.06.2018 (Lake water level:92.50m) |
Water depth (m) 09.10.2018 (Lake water level:85.90m) |
Water depth (m) 22.02.2019 (Lake water level:91.10m) |
|---|---|---|---|---|
| P1 | Water intake pipe entrance | 27.0 | 21.8 | - |
| P2A | Velitseiko mouth | 14.8 | 8.4 | - |
| P2B | Velitseiko mouth | - | 1.9 | 7.0 |
| P3 | Daouti Ksenies (north) | 27.8 | 20.7 | 25.6 |
| P4A | Pinios mouth | 6.6 | - | - |
| P4B | Pinios mouth | - | 0.5 | 6.5 |
| P5A | Piniakos Ladonas mouth | 6.5 | - | - |
| P5B | Piniakos Ladonas mouth | 7.9 | 2.1 | 5.0 |
| P6 | Agios Ilias | - | 18.4 | 24.0 |
| P7 | Water intake pipe (north) | - | 37.0 | 41.7 |
Table 2.
Table of TOC / TN / TP / TC / CaCO3 of the reservoir sediments.
| Samples | TOC (%) | TP (mg/kg) | CaCO3 (%) | TC (%) | TN (%) |
|---|---|---|---|---|---|
| P1 | 1.13 | 440 | 31.9 | 8.26 | 1.95 |
| P2 | 0.49 | 87.33 | 12.5 | 4.63 | 0.95 |
| P3 | 0.49 | 103.33 | 17.8 | 3.06 | 1.32 |
| P4 | 0.83 | 183.67 | 14.2 | 2.8 | 1.56 |
| P5 | 0.72 | 121.67 | 27 | 3.89 | 1.34 |
| P6 | 0.53 | 189 | 17.3 | 3.01 | 0.2 |
| P7 | 0.97 | 115.33 | 23.6 | 3.81 | 0.2 |
| Min | 0.49 | 87.33 | 12.5 | 2.8 | 0.2 |
| Max | 1.13 | 440 | 31.9 | 8.26 | 1.95 |
| Average | 0.74 | 177.19 | 20.61 | 4.21 | 1.07 |
Disclaimer/Publisher’s Note: The statements, opinions and data contained in all publications are solely those of the individual author(s) and contributor(s) and not of MDPI and/or the editor(s). MDPI and/or the editor(s) disclaim responsibility for any injury to people or property resulting from any ideas, methods, instructions or products referred to in the content. |
© 2024 by the authors. Licensee MDPI, Basel, Switzerland. This article is an open access article distributed under the terms and conditions of the Creative Commons Attribution (CC BY) license (http://creativecommons.org/licenses/by/4.0/).
Copyright: This open access article is published under a Creative Commons CC BY 4.0 license, which permit the free download, distribution, and reuse, provided that the author and preprint are cited in any reuse.


