
Submitted:
16 October 2024
Posted:
17 October 2024
You are already at the latest version
Abstract
Accurate estimation of the state of health (SOH) of batteries for automotive applications, particularly in electric vehicle battery management systems (EV-BMS), is still under study and is highly relevant to ensure battery system availability. This paper proposes a comprehensive SOH estimation method that goes beyond the methods that are based on the estimation of the battery available capacity by the integral of the current, or the estimation of the increase of the internal resistance of the battery. The SOH estimator is based on a partial capacity discharge method and a linear state of charge (SOC) observer based on an equivalent electrical circuit model. This method uses readily available manufacturer data and is designed for real-time applications. The proposed method was tested and validated with three different automotive battery technologies in a Model-In-Loop (MIL) environment with OPAL-RT platform, utilizing voltage and current measurements of pulsed discharge current profiles at temperature-controlled conditions and an electric vehicle’s driving profile.
Keywords:
Electric vehicles
; model in the loop (MIL)
; state-of-charge estimation
; state-of-health estimation
; real-time estimation
1. Introduction
Technological developments that have facilitated a significant shift towards sustainable transportation, enabling the adoption and accessibility of Electric Vehicles (EVs) worldwide, include advancements in Battery Management Systems (BMS). These advancements have improved the safe operation, performance, and service life of batteries [1,2].
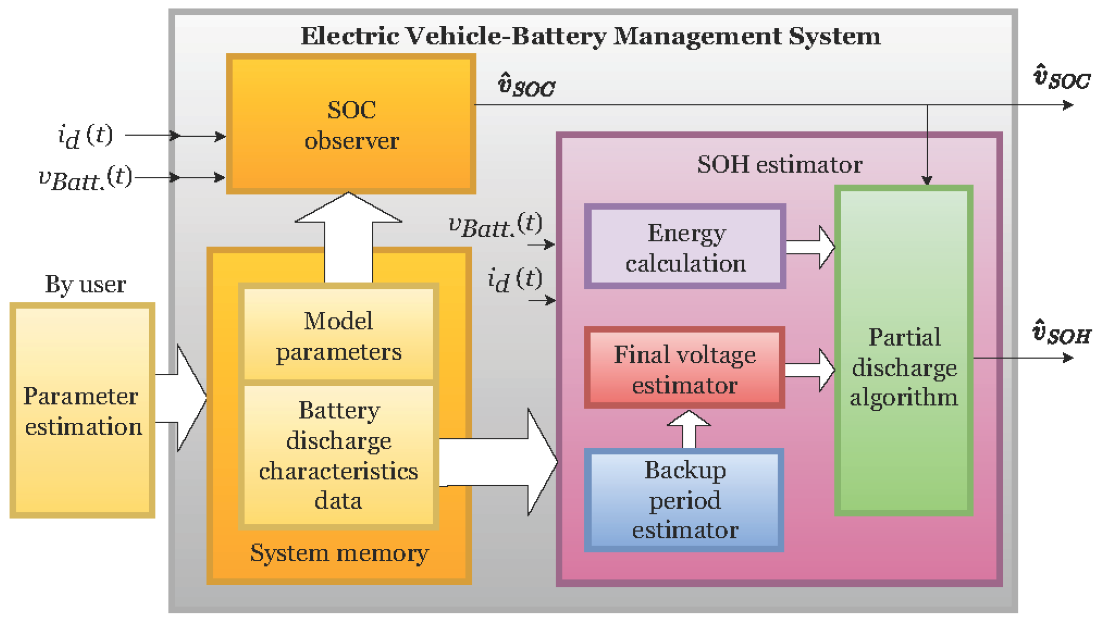
The BMS function of monitoring the State of Health (SOH) of the battery is crucial for assessing the aging of the battery over time. The SOH estimation enables the determination of the available capacity of the batteries, thereby allowing accurate estimations of the available energy and power. Any battery-powered system must consider this evaluation for optimal performance [3,4]. Supervising the battery SOH is key to identifying when maintenance or replacement is needed, thereby reducing downtime and costs to ensure system availability [5]. Accurate and robust real-time estimation of SOH faces challenges related to the battery model complexity, variable conditions, computational constraints, and the need for relevant experimental validation [6,7]. Overcoming these challenges requires advanced research in algorithms and modeling techniques, and bridging the gap between SOH estimation methods from academia and industry by experimentally validating these proposals in real-world environments and conditions [8].
In this sense, a study of the SOH estimation methods proposed by the scientific community was conducted to highlight their attributes. According to [4,6,7,9,10,11,12], there are different classifications; the priority of this work is on the methods used for online estimation and how these methods have significant potential for integration into real-time systems. Based on this context, the study considers the following classification: direct methods such as the Coulomb Counting Method (CCM), derived from integrating the battery current [13]; differential analysis methods like the Incremental Capacity Analysis (ICA) and the Differential Voltage Analysis (DVA) [14,15]; model-based methods including the Peukert Equation (PE), Shepherd’s Model (SM) [16], Kalman Filters (KF) [17], and Observer Methods (OM) [18]; Data-Driven Methods (DDM) such as the Fuzzy Logic (FL), Genetical Algorithms (GA), and Artificial Neural Networks (ANN) [19,20]; advanced sensing-based methods like the Ultrasonic Method (UM) [21] and Electrochemical Impedance Spectroscopy (EIS) [22]; and combined or fused methods such as the Open-Circuit Voltage (OCV) method [23] and Internal Resistance Measurement (IRM) method [24].
Table 1 presents a compilation of ten essential attributes for evaluating the effectiveness of the main SOH estimation methods for real-time applications, as well as the desired characteristics of each attribute. This allows for a clear comparison of methods that exhibit optimal characteristics. According to the results shown in Table 1, the SOH estimator proposed in this paper consists of a combination of CCM and OM, along with a Partial Discharge Method (PDM), featuring the following attributes:
- Easy integration into real-time applications by reducing computational resources, computational burden, and the complexity of its start-up.
- Adaptability of the SOH estimator to changes in battery behavior according to different applications.
- Utilization of generally available battery datasheet parameters and low-cost instrumentation for parametric estimation and validation of online SOH estimation (as well as state-of-charge (SOC) estimation).
- Versatility in modeling different battery technologies, considering implementation cost and applicability to battery management and optimization systems in engineering and research.
The contribution of this work lies in incorporating a PDM that combines techniques exhibiting attributes closely aligned with the desired characteristics. The proposed PDM consists of detecting small intervals of battery discharge (partial discharges), processing the information obtained from the battery during these intervals based on the use of the CCM and OM (methods that exhibit attributes closely aligned with the desired characteristics), and relating the results obtained to the expected values of the battery at 100 % of SOH conditions, thereby deducing the current state of the battery. This approach results in a method that meets these desired attributes and enables SOH estimation using data from defined intervals, enhancing efficiency and accuracy. In essence, the method has been carefully developed to meet the demand for comprehensive approaches that consider practical feasibility, efficient integration with real systems, and economic and environmental effects, alongside technical improvements in accuracy and robustness.
This paper is organized into the following sections: Section II describes the proposed method for real-time SOH estimation based on a partial discharge method, Section III discusses the results of the real-time implementation of the SOH estimator, and Section IV presents the conclusion.
2. Proposed Real-Time SOH Estimator Based on a Partial Discharge Method
The method proposed is based on a PDM and the energy concept to identify the available energy and the SOH in real-time applications, fulfilling all the desired attributes outlined in Table 1. First, the concept of SOH energy and partial discharge will be defined. Then, the SOH model for partial discharge will be deducted, and the algorithm for real-time SOH estimation will be presented.
2.1. SOH Energy
Consider the SOH voltage proposed in (1), which establishes its relationship with the battery energy and involves the energy SOH estimation concept [25]:
where takes values from 0 V to 1 V, equivalent to to of SOH; is the available energy obtained during a full-discharge test by integrating battery power, given by the multiplication of the battery voltage and the battery current , from 0 to (where is the backup period); is the maximum energy that the tested battery can store according to manufacturer design, given by the nominal capacity of the battery (found in the battery datasheet), and the average value of open-circuit voltage , which can be obtained by integrating the open-circuit voltage during a full-discharge test and dividing it by the backup period .
Since estimating SOH based on (1) is not feasible for real-time applications (it is only useful for full-discharge tests under controlled conditions) it is proposed to adapt it using a partial discharge method.
2.2. Partial Discharge Method
A PDM is documented in [26], which is used in periodic scheduled maintenance. Based on this definition, Figure 1 illustrates an example of a partial discharge, where the battery is discharged when is negative, this discharge continues until the battery current becomes positive, and the partial discharge process is interrupted when becomes positive. The signal is the estimated SOC voltage, which takes values from 0 V to 1 V and represents the values from 0 % to 100 % of SOC, respectively. The proposed method uses the information obtained from a discharge difference represented by , and corresponding to , between the periods and (where ). If the value of is not reached during a partial discharge, the process for SOH estimation is interrupted, and a new estimation is restarted with the next partial discharge process.
To obtain an equation for describing the partial discharge, consider the definition of the discharge difference and the CCM equation in its energy calculation form, instead of the capacity calculation form, as described in (2):
where the =1 V is the initial condition of the SOC voltage equivalent to 100 % of SOC, and is the faradic efficiency obtained by the ratio between the energy delivered on the discharging and the energy absorbed on the charging of a battery; and in this case, =1 is considered, because this work does not contemplate battery aging test cycles, only tests with batteries at different ages [27].
Thus, the discharge difference observed between and is characterized by the CCM equation in (2), according to (3):
Hence, simplifying in (3) gives the discharge difference denoting the partial discharge (the PDM proposed in this work) between and , as shown in (4):
For the SOC estimation, consider the Equivalent Circuit Model (ECM) in Figure 2(a) to model the battery dynamics. It consists of two RC circuit arrays, and it is also known as the dual polarization model. It is widely used to model batteries for EV applications due to its outstanding state estimation accuracy and excellent dynamic performance [18,27,28]. Additionally, It was decide to use this model based on the principle of easy and feasible implementation for real-time applications. To obtain the model parameters, a pulse discharge test is required to be performed, where the battery is discharged fully from 100 % to 0 % of SOC; Figure 2(b) depicts an example of a full-discharge test indicating the characteristics considered to perform it. The values of and in Figure 2(b) indicate the start and end of the discharge, respectively, and will be described in detail later.
Table 2 summarizes the methods used to estimate ECM parameters.
Figure 3 illustrates in blue points the j-th ECM parameters estimated at every discharge segment of the full-discharge pulse test; in red lines are depicted the average values of resistance and capacitance values, and also the linear function of for three battery technologies.
Table 3 lists the ECM parameters used to model the batteries of interest in this work; also, some characteristics required from the datasheet of each battery used are listed.
A validated mathematical model derived from the ECM depicted in Figure 2(a) was taken from [18] and simplified to become a linear model to facilitate the implementation of SOC estimation, for validation of the proposed SOH estimator. The result is the linear mathematical model in (5).
where the state variables are: , and (in Volts). Additionally, the state-space model of the battery (5) can be represented by: and , respectively; and then, a Luenberger observer for SOC estimation is designed in the form of (6):
where the error is , the dynamic of the error is . Thus, the observer vector is designed to make the system asymptotically stable, and the constant coefficients of vector are shown in Table 4 for the three battery technologies considered in this work.
2.3. SOH Model Deduction
The deduction of the SOH model begins by taking (1) and converting it to allow estimation of the , the , and the SOH based on the previously proposed PDM in (4) and without requiring a full-discharge test or controlled conditions of constant current profiles.
Then, solving from (4), the estimated denoted by the PDM is represented by (7):
where the estimation of the involves the measured and , and the estimated during a partial discharge interval (from to ), and where will be a constant.
The value of in (1) is constant for a continuous full-discharge test under controlled conditions; this means having a well-defined constant current profile during the continuous full-discharge test, mainly. However, the value of can vary depending on the constant current profile demanded from the battery in the full-discharge test, being one of the most important nonlinear behaviors to be represented within the proposed battery modeling. Therefore, within a real-time application, it is not feasible to work with an approximation that uses constant current profiles; a real-time application must consider the high variability and different operating conditions of the battery. If that weren’t challenging enough, this work also considers this battery nonlinear behavior under sudden and unpredictable conditions such as driven profiles.
Thus, the deduction of is founded on (1), which posits the existence of a constant reference current profile for each battery. This reference profile is obtained from carefully controlled full-discharge tests conducted by the battery manufacturer, and it serves to define the value of . The is correlated with the maximum energy storage capacity of the battery and will be used as a constant. The calculation of in (1) also requires defining the average value of the open-circuit voltage . It can be calculated as the ratio between the integral of the open-circuit voltage and the backup period in a full-discharge test, as described in (1). However, to calculate during a partial discharge in a real-time application, alternatively, the can also be approximated using (8):
where, in a real-time application, the value of is proposed to be calculated using the following battery characteristics:
- A battery voltage level that indicates when the battery is fully charged and it is also used to indicate the battery voltage at the beginning of the discharge ; this value is defined as the float voltage and will be used as a constant because it is obtained from battery datasheet, and
- A battery voltage level that indicates when the battery is fully discharged (the battery voltage value at the end of the backup period ), which is known as the final voltage , and this voltage level changes for every constant current profile.
Thus, in a scenario where a vehicle is accelerating and decelerating unpredictably, the range of conditions is uncertain but necessary to determine a representative value of final voltage to estimate the value during a partial discharge. Then, the value of in (8) will be replaced by the average value of the final voltages presented during a partial discharge due to the time-varying current profile of a real-time application.
Therefore, the real-time estimation of during a partial discharge is possible using the proposed expression described in (9):
Subsequently, to define the function , refer to the discharge characteristics in the battery datasheet. Figure 4 shows the discharge characteristics of three different battery technologies, which contains relevant information about test results conducted by manufacturers using different constant current profiles (where the subscript p=1, 2, 3, ..., P, and P represents the total number of current profiles for each battery technology in Figure 4). For each , the datasheet provides the following information: (i) the battery capacity, (ii) the battery voltage performance, (iii) the backup period of each current profile , (iv) the effects of temperature on battery behavior, and (v) the final voltage value of each current profile (red points in Figure 4). The discharge characteristic curves of the batteries at various values of and temperatures allow correlating the final voltage values with the five variables mentioned above by proposing the calculation of within a real-time application by (10):
where represents a nonlinear function obtained by finding the best functions to fit most of the voltage points in the discharge curves of each battery technology; in this way, becomes the estimated instantaneous value of final voltage due to the instantaneous and time-varying value of the battery current in a real-time application, and to ensure that the value of is meaningful throughout a partial discharge process, it is averaged over the interval and . In other words, the average value of obtained by the discharge difference occurred into a partial discharge over the interval and will provide a representative result, that will encompass all the voltage values of obtained during the unpredictable conditions in which the load has demanded battery current in a real-time application.
Then, it is proposed to estimate the value of depending of the variables of time t, backup period , battery current , and temperature T, based on a two-term exponential function, which is the proposed function used to determine the for the three battery technologies, as given in (11):
where coefficients from to were obtained by the Curve Fitting Toolbox in MATLAB, for each battery technology, and their values are presented in Table 5. The gray dots in Figure 4 represent the graph of the nonlinear functions of in each battery technology.
Also, it should be clarified that in (11), depends on rather than on t, and this is because is a function of , as explained in the following.
It is important to acknowledge that identifying in (11) is only achievable once an instantaneous value of backup period is determined for a value of in the real-time application. To address this, and taking into account the discharge characteristics of the batteries, a correlation between and is proposed by using a reference point. The reference point selected is the constant current profile at 1C of every battery tested, where usually 1C is given at =1 h, and (where , and are the reference points). Subsequently, for any battery technology the proposed Equation (12) represents the correlation (or proportion) between and in the discharge characteristics curves, and the reference values , and :
where the reference temperature T is not represented although it is implicit and influences the value of the proportion; this relationship is illustrated as a proportion in Figure 5, using red dots to indicate the real values of W for the different current profiles , which are provided by the manufacturer datasheet in the discharge curves. The real values of the correlation W are used to define a nonlinear function of correlation for any time-variant value of (see nonlinear function presented in gray dots in Figure 5). Then, it was decided to use the nonlinear relationship in (13) since it was the function that best approximated the correlation data for each battery technology.
where coefficients from to were obtained by the Curve Fitting Toolbox in MATLAB, and are presented in Table 6, along with the value of and used for each battery technology.
With the nonlinear function of is possible to define a proportion among the infinite possible values of the battery current to estimate an instantaneous value of in a real-time application, and in consequence, also the real-time estimation of by replacing (13) instead of W on (12), and solving from the resulted equation, and then, using the real-time estimated in (11) to obtain the instantaneous value of according to the time-varying current presented in the battery. Then, the is estimated by (14).
Finally, substituting (7) and (9) in (1), it is obtained the model proposed for the SOH estimation during a real-time partial discharge, and it is presented in (15):
where it could be seen like a value of represents an n-th sample to be obtained not periodically and sporadically due to the unpredictable energy profile required in the real-time application, and it requires at least 8 variables and battery characteristics completely available to estimate the value during a short discharge period.
2.4. Algorithm for Real-Time SOH Estimation
Figure 6 shows the algorithm used for real-time SOH estimation in (15) using the proposed partial discharge method.
Before the algorithm starts working, the initial conditions are set, including the initial conditions of the SOC observer state variables, the variable n=0, and V (100 % of SOH).
The process begins by checking if a discharge has been initiated.
When a discharge is started, it records the initial value of by taking its value from the current output of the SOC estimator ; so, it proceeds to calculate the integrals of the power and the instantaneous final voltage, while checking if the discharged SOC is equal to or greater than the selected discharge difference .
If yes, it calculates the n-th sample of SOH. If not, it checks whether the discharge continues; if yes, it continues integrating, and if not, the discharge stops, and it returns to the condition where it checks if a discharge has started again.
3. Test Results of the Proposed Method for Estimating SOH and SOC in Real-Time
This section presents the successful outcomes of implementing the proposed SOH and SOC estimation schemes. To validate the comprehensive proposal, two simulations have been put forward:
- 1.
- An offline Simulink-MATLAB simulation is conducted to validate the SOH estimator, using the models of the three different battery technologies.
- 2.
- A real-time simulation of an EV-BMS into the MIL environment on OPAL-RT is performed to validate the SOH estimation proposal by using the Lithium-ion battery model.
Also, to estimate each sample in real-time application it is proposed to start the calculation when a zero crossing coincides with a negative current step, indicating the start of a discharge, or when a negative current is detected (discharging current). As a result of the sampling, it is proposed to display as "SOH estimator output" a continuous-time SOH voltage by calculating a modified-simple moving average using the non-periodic samples estimated from (15), according to (16):
where N is the number of samples used to calculate the average, is the current sample of SOH voltage, is the previous sample, and is the last sample used to obtain the average (all the samples are obtained with (15)).
3.1. Simulation 1
This simulation uses the data of the full-discharge pulse tests of the three battery technologies used to obtain the ECM parameters (as described in Figure 2 and Figure 3).
Figure 7 presents the simulation results of the three battery technologies tested; from top to bottom: (i) the measured (blue line), observed (green dashed line), and data used for SOH estimation (red lines) of battery voltage; (ii) the measured (blue line), and data used for SOH estimation (red lines) of battery current; (iii) the observed (blue line), and data used for SOH estimation (red lines) of SOC voltage obtained by the SOC observer; and (iv) the SOH estimator output (blue line of the continuous-time SOH voltage obtained by moving average of (16)), and the estimated SOH voltage samples (red dots obtained by (15)).
This Figure 7 illustrates how the observed voltages closely track the measured battery voltages in all three cases, indicating the model’s usefulness in describing the battery behavior. Table 7 displays the battery voltage’s root mean square error (RMSE) for the three observed battery technologies. In all three cases, a value close to zero was obtained, indicating the observer and model validity and the quality of the estimation results and confirming the accuracy of the linear SOC observer’s estimation; also, the level of accuracy in estimating SOC is demonstrated in the SOC voltage graphs, showcasing optimal battery discharge in all three scenarios.
To optimize accuracy, the model was designed to estimate the only within the 0.1 V and 0.9 V range of for each battery (10 % to 90 % of SOC); this deliberate focus aims to minimize errors that arise from the proposed parameter approximation in the unconsidered regions, ultimately reducing estimation error. Table 7 presents the expected SOH voltage () values for each tested battery technology, which is calculated by the relationship between the and values provided in Table 3. The is derived for comparison with the proposed SOH voltage; based on this expected value, it is confirmed that the proposal estimation of the is reasonably accurate, and this highlights the validity and accuracy of the proposed scheme. The value used in each simulation whose value determines the starting and ending points for each partial discharge interval used in estimating SOH voltage. It’s important to emphasize that there are deliberately showcased results featuring different values of this variable for each battery technology to highlight the adaptability of the proposed modeling. Additionally, Table 7 presents the value used in the simulation of battery technology, and whose value determines the starting and ending points for each partial discharge interval used in estimating SOH voltage.
3.2. Simulation 2
A MIL simulation was developed on the OPAL-RT platform (model OP4510) to validate the proposal SOH estimation scheme in a relevant environment. The employed simulation of an electric vehicle was taken from Mathworks of MATLAB software. It can be accessed from the MATLAB command window with the instruction: "autoblkEvStart", where the FTP75 driving profile is employed; see the simulation environment at the top box of Figure 8(a). To seamlessly integrate the developed Lithium-ion battery model with the simulation of the EV on Mathworks, it was scaled the voltage and current demanded by the simulated vehicle. The voltage was divided by 96, reflecting the number of cells in the series connection specified in the original Mathworks battery package. Similarly, the current was divided by 8, aligning with the number of cells in a parallel connection needed to allow a discharging profile between 0.8 to 0.2 Volts of ; see the illustration of the battery pack in the bottom of the Figure 8(a). Therefore, the real-time simulation results presented in Figure 8(b) represent the results of only one cell of a set of series-parallel connected batteries that make up the entire battery pack in the EV simulation on Mathworks (see green-colored battery 1 in Figure 8(a)); thus, the observer (for SOC estimation), and the SOH estimator were integrated into the Mathworks MIL simulation to validate their performance.
To initialize the SOC observer, the approximation was automated by solving for the variable, from the open-circuit voltage equation presented in Table 2, and the initial value of is taken as the first measurement of the open-circuit battery voltage before EV start-up. Results in Figure 8(b) show how the observed battery voltage (green dashed line at the top graph) closely tracks the measured battery voltage (blue line) during the driving profile simulation, indicating the model’s usefulness in describing the battery behavior and demonstrating the accuracy of the SOC observer’s estimation (see third graph, from top to bottom, in Figure 8(b)).
Table 8 indicates the RMSE value obtained for observed battery voltage, and the value close to zero indicates the observer and model validity, the quality of the estimation results, and confirms the accuracy of the estimation. Also, the battery current profile demanded in the simulation is depicted in the second graph of Figure 8(b).
In this simulation, the model was designed to estimate the only within the 0.275 and 0.875 V range of (27.5 to 87.5 % of SOC), and the constant-value used in this simulation is presented in Table 8; in general, the selection of could be made between 0.01 V and 0.1 V (between 1 and 10 % of SOC), considering that in a real scenario, it is feasible that a battery energy consumption around these values of SOC and provides the necessary information to update the SOH voltage value. Also, the expected SOH voltage () is the same as in Simulation 1 for the Lithium-ion battery (see value in Table 8); thus, based on this expected value, it is confirmed that the proposal estimation of the is reasonably accurate, and this highlights the validity and accuracy of the proposed scheme in real-time MIL environment. Additionally, and in contrast to conventional methods for SOH estimation the proposed SOH scheme considers, in real-time, at least 8 variables and battery characteristics, allowing for a more comprehensive description of the battery’s SOH.
Finally, the successful implementation of the proposed method to estimate SOH and SOC for real-time MIL environment is evident in its ability to meet the multiple attributes outlined in the design. Notably, the computational burden required for the proposal is less than 3 % of the computation allocated by the OPAL-RT for an integration step of 50s (see computational consumption results on OPAL-RT monitoring window displayed in Figure 9). This demonstrates that the proposal can be feasibly implemented in a real application system and also has the potential to be implemented in computationally resource-poor systems to provide real-time estimation of the SOH and SOC.
4. Conclusion
The proposed method fulfills a crucial need in the electric vehicle industry by enabling accurate estimation of SOH and SOC, which is essential for optimizing battery performance, energy efficiency, and longevity. This method offers real-time estimation of SOH and SOC for three different battery technologies used in electric vehicles (Nickel-metal hydride, Lead-acid, and Lithium-ion) without requiring highly detailed manufacturer information. Its versatility makes it applicable to a wide range of applications. The method has demonstrated computational efficiency and is well-suited for implementation in embedded systems, making it ideal for real-time applications in electric vehicles and applications with low computational burden.
The proposal approach leverages a combination of measured and estimated variables and readily available battery characteristics to describe battery performance. Also, by integrating conventional modeling based on equivalent electrical circuits, conventional SOH and SOC estimation methods, and the concept of partial discharge used in scheduled maintenance testing, our approach ensures accurate and robust estimation under varying operating conditions in real-time applications. These attributes make it a highly valuable method in the field of battery management for electric vehicles. Furthermore, our method has undergone thorough validation through offline and MIL simulation environments using experimental test data and data from relevant environments. This validation process has demonstrated the effectiveness and reliability of our approach in estimating SOH and SOC.
The proposal anticipates several future challenges, including validating and dynamically adapting method parameters for various long-term driving profiles and real-world conditions. These conditions encompass highly variable operating temperatures. Additionally, the proposal aims to expand the method to estimate additional parameters, such as internal resistance and capacity of individual cells, to ensure comprehensive battery pack management. Moreover, the method will be integrated into electric vehicle battery management systems to develop optimization algorithms for maximizing energy efficiency and battery lifetime. Lastly, the proposal aims to verify the method’s adaptability as a tool for state estimation in emerging battery technologies like solid-state batteries.
Author Contributions
Conceptualization of this study, Methodology, Software, and Data curation, E.C.; Formal analysis, Writing - Review & Editing, and Project administration, N.V.; Validation, Investigation, and Supervision, C.N.; Resources, funding acquisition, and Writing - Original Draft, J.S.; All authors have read and agreed to the published version of the manuscript.
Funding
This work was supported by CONAHCyT [project numbers: A1-S-29705, 1311344/2020, and academic postdoctoral fellow number 4692589 (CVU: 209440)].
Conflicts of Interest
The authors declare no conflicts of interest.
Abbreviations
| ANN | Artificial Neural Networks |
| BMS | Battery Management Systems |
| CCM | Coulomb Counting Method |
| Com | Complex |
| DDM | Data-Driven Methods |
| DVA | Differential Voltage Analysis |
| EIS | Electrochemical Impedance Spectroscopy |
| ECM | Electrical circuit model |
| EVs | Electric Vehicles |
| EV-BMS | Electric Vehicles-Battery Management Systems |
| FL | Fuzzy Logic |
| GA | Genetic Algorithms |
| ICA | Incremental Capacity Analysis |
| IRM | Internal Resistance Measurement |
| KF | Kalman Filter |
| Lim | Limited |
| Li-ion | Lithium-ion |
| Med | Medium |
| MIL | Model in loop |
| Mod | Moderately |
| NiMH | Nickel-methal hydride |
| OCV | Open-Circuit Voltage |
| Off | Offline |
| OM | Observer Methods |
| On | Online |
| Pb-acid | Lead-acid |
| PDM | Partial Discharge Method |
| PE | Peukert Equation |
| RMSE | Root Mean Square Error |
| SM | Shepherd’s Model |
| SOC | State of Charge |
| SOH | State of Health |
| UM | Ultrasonic Method |
References
- Hasan, M.K.; Mahmud, M.; Ahasan Habib, A.; Motakabber, S.; Islam, S. Review of electric vehicle energy storage and management system: Standards, issues, and challenges. Journal of Energy Storage 2021, 41, 102940. [Google Scholar] [CrossRef]
- Liu, K.; Peng, Q.; Che, Y.; Zheng, Y.; Li, K.; Teodorescu, R.; Widanage, D.; Barai, A. Transfer learning for battery smarter state estimation and ageing prognostics: Recent progress, challenges, and prospects. Advances in Applied Energy 2023, 9, 100117. [Google Scholar] [CrossRef]
- Schmitt, J.; Rehm, M.; Karger, A.; Jossen, A. Capacity and degradation mode estimation for lithium-ion batteries based on partial charging curves at different current rates. Journal of Energy Storage 2023, 59, 106517. [Google Scholar] [CrossRef]
- Swarnkar, R.; Ramachandran, H.; Ali, S.H.M.; Jabbar, R. A Systematic Literature Review of State of Health and State of Charge Estimation Methods for Batteries Used in Electric Vehicle Applications. World Electric Vehicle Journal 2023, 14. [Google Scholar] [CrossRef]
- Li, X.; Yuan, C.; Wang, Z.; He, J.; Yu, S. Lithium battery state-of-health estimation and remaining useful lifetime prediction based on non-parametric aging model and particle filter algorithm. eTransportation 2022, 11, 100156. [Google Scholar] [CrossRef]
- Wang, Z.; Feng, G.; Zhen, D.; Gu, F.; Ball, A. A review on online state of charge and state of health estimation for lithium-ion batteries in electric vehicles. Energy Reports 2021, 7, 5141–5161. [Google Scholar] [CrossRef]
- Cong, L.; Wang, W.; Wang, Y. A review on health estimation techniques of end-of-first-use lithium-ion batteries for supporting circular battery production. Journal of Energy Storage 2024, 94, 112406. [Google Scholar] [CrossRef]
- Wang, Z.; Shi, D.; Zhao, J.; Chu, Z.; Guo, D.; Eze, C.; Qu, X.; Lian, Y.; Burke, A.F. Battery health diagnostics: Bridging the gap between academia and industry. eTransportation 2024, 19, 100309. [Google Scholar] [CrossRef]
- Jamila, E.H.; Taoufik, N., A Review of the Estimation of State of Charge (SOC) and State of Health (SOH) of Li-Ion Batteries in Electric Vehicles. In Technical and Technological Solutions Towards a Sustainable Society and Circular Economy; Springer Nature Switzerland: Cham, 2024; chapter 1, pp. 519–541. [CrossRef]
- Jiang, M.; Li, D.; Li, Z.; Chen, Z.; Yan, Q.; Lin, F.; Yu, C.; Jiang, B.; Wei, X.; Yan, W.; Yang, Y. Advances in battery state estimation of battery management system in electric vehicles. Journal of Power Sources 2024, 612, 234781. [Google Scholar] [CrossRef]
- S, V.; Che, H.S.; Selvaraj, J.; Tey, K.S.; Lee, J.W.; Shareef, H.; Errouissi, R. State of Health (SoH) estimation methods for second life lithium-ion battery—Review and challenges. Applied Energy 2024, 369, 123542. [Google Scholar] [CrossRef]
- Demirci, O.; Taskin, S.; Schaltz, E.; Acar Demirci, B. Review of battery state estimation methods for electric vehicles-Part II: SOH estimation. Journal of Energy Storage 2024, 96, 112703. [Google Scholar] [CrossRef]
- Vignesh, S.; Che, H.S.; Selvaraj, J.; Tey, K.S. State of health indicators for second life battery through non-destructive test approaches from repurposer perspective. Journal of Energy Storage 2024, 89, 111656. [Google Scholar] [CrossRef]
- Gismero, A.; Nørregaard, K.; Johnsen, B.; Stenhøj, L.; Stroe, D.I.; Schaltz, E. Electric vehicle battery state of health estimation using Incremental Capacity Analysis. Journal of Energy Storage 2023, 64, 107110. [Google Scholar] [CrossRef]
- Ko, C.J.; Chen, K.C.; Su, T.W. Differential current in constant-voltage charging mode: A novel tool for state-of-health and state-of-charge estimation of lithium-ion batteries. Energy 2024, 288, 129826. [Google Scholar] [CrossRef]
- Theodore, A.M.; Şahin, M.E. Modeling and simulation of a series and parallel battery pack model in MATLAB/Simulink. Turk J. Electr Power Energy Syst 2024. [Google Scholar] [CrossRef]
- Fahmy, H.; Hasanien, H.; Alsaleh, I.; Ji, H.; Alassaf, A. State of health estimation of lithium-ion battery using dual adaptive unscented Kalman filter and Coulomb counting approach. Journal of Energy Storage 2024, 88, 111557. [Google Scholar] [CrossRef]
- Du, J.; Liu, Z.; Wang, Y.; Wen, C. An adaptive sliding mode observer for lithium-ion battery state of charge and state of health estimation in electric vehicles. Control Engineering Practice 2016, 54, 81–90. [Google Scholar] [CrossRef]
- Fan, Y.; Lin, Q.; Huang, R. Non-Invasive Method-Based Estimation of Battery State-of-Health with Dynamical Response Characteristics of Load Surges. Energies 2024, 17. [Google Scholar] [CrossRef]
- Hong, J.; Li, K.; Liang, F.; Yang, H.; Zhang, C.; Yang, Q.; Wang, J. A novel state of health prediction method for battery system in real-world vehicles based on gated recurrent unit neural networks. Energy 2024, 289, 129918. [Google Scholar] [CrossRef]
- Wang, Y.; Lai, X.; Chen, Q.; Han, X.; Lu, L.; Ouyang, M.; Zheng, Y. Progress and challenges in ultrasonic technology for state estimation and defect detection of lithium-ion batteries. Energy Storage Materials 2024, 69, 103430. [Google Scholar] [CrossRef]
- Camboim, M.; Moreira, A.; Rosolem, F.; Beck, R.; Arioli, V.; Omae, C.; Ding, H. State of health estimation of second-life batteries through electrochemical impedance spectroscopy and dimensionality reduction. Journal of Energy Storage 2024, 78, 110063. [Google Scholar] [CrossRef]
- Ko, C.J.; Chen, K.C. Using tens of seconds of relaxation voltage to estimate open circuit voltage and state of health of lithium ion batteries. Applied Energy 2024, 357, 122488. [Google Scholar] [CrossRef]
- Singh, K.; Tjahjowidodo, T.; Boulon, L.; Feroskhan, M. Framework for measurement of battery state-of-health (resistance) integrating overpotential effects and entropy changes using energy equilibrium. Energy 2022. [Google Scholar] [CrossRef]
- Diao, W.; Jiang, J.; Zhang, C.; Liang, H.; Pecht, M. Energy state of health estimation for battery packs based on the degradation and inconsistency. Energy Procedia 2017, 142, 3578–3583. [Google Scholar] [CrossRef]
- EEE. IEEE Recommended Practice for Maintenance, Testing , and Replacement of Vented Lead-Acid Batteries for Stationary Applications. IEEE Std 450-2002 2003, pp. 1–56. [CrossRef]
- Nejad, S.; Gladwin, D.; Stone, D. A systematic review of lumped-parameter equivalent circuit models for real-time estimation of lithium-ion battery states. Journal of Power Sources 2016, 316, 183–196. [Google Scholar] [CrossRef]
- Singh, A.; Izadian, A.; Anwar, S. Nonlinear Model Based Fault Detection of Lithium Ion Battery Using Multiple Model Adaptive Estimation. IFAC Proceedings Volumes 2014, 47, 8546–8551, 9th IFACWorld Congress. [Google Scholar] [CrossRef]
- Chen, M.; Rincon-Mora, G.A. Accurate electrical battery model capable of predicting runtime and I-V performance. IEEE Transactions on Energy Conversion 2006, 21, 504–511. [Google Scholar] [CrossRef]
- Energizer. Energizer NH15-2300 (HR6), 2024. Available online: https://data.energizer.com (Accessed on may, 2024).
- Mouser. PS-260 Rechargeable sealed Lead acid battery, 2024. Available online: https://www.mouser.com (Accessed on may, 2024).
- GmbH, S.P. Li-ion NCR18650P-H93VA, 2024. Available online: https://www.liontecshop.com (Accessed on may, 2024).
Figure 1.
Example of partial discharge in a real-time application requiring a time-varying battery current profile.
Figure 1.
Example of partial discharge in a real-time application requiring a time-varying battery current profile.

Figure 2.
(a) Equivalent Circuit Model (ECM) of the battery. (b) Example of full-discharge pulse test.
Figure 2.
(a) Equivalent Circuit Model (ECM) of the battery. (b) Example of full-discharge pulse test.
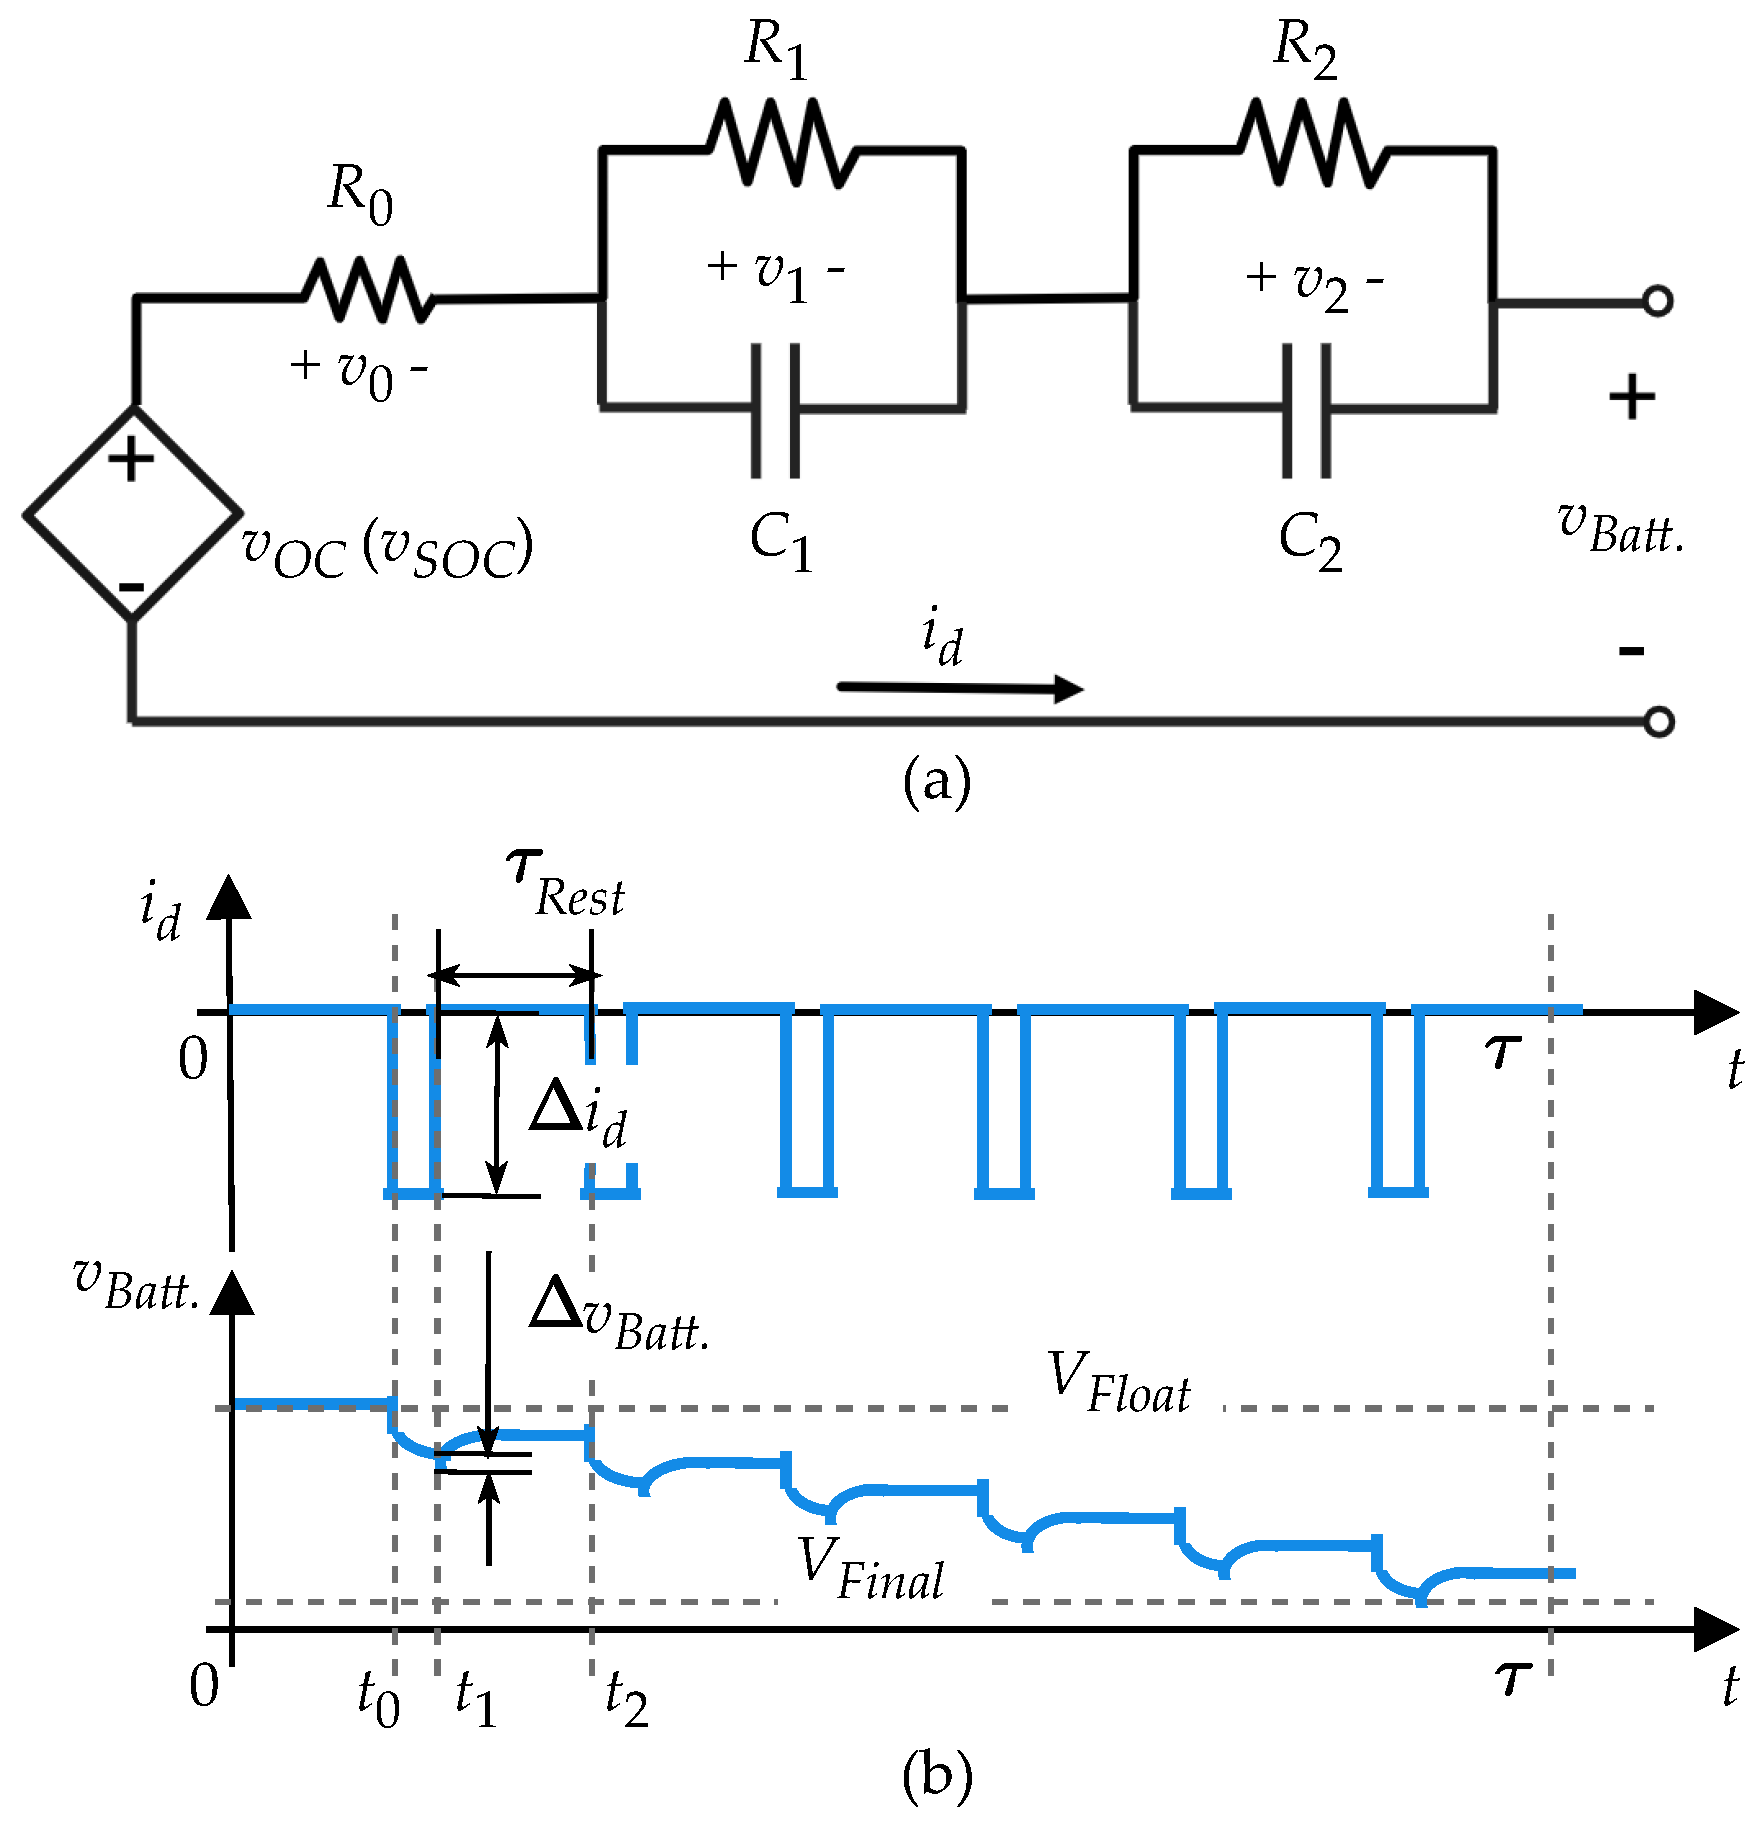
Figure 3.
Plot of the j-th estimated parameters versus the corresponding j-th segment value of (in blue points), and the average values of the ECM parameters and -linear function (in red lines), of (a) Nickel–metal hydride (NiMH), (b) Lead-acid (Pb-acid), and (c) Lithium-ion (Li-ion) batteries (at T=25 °C).
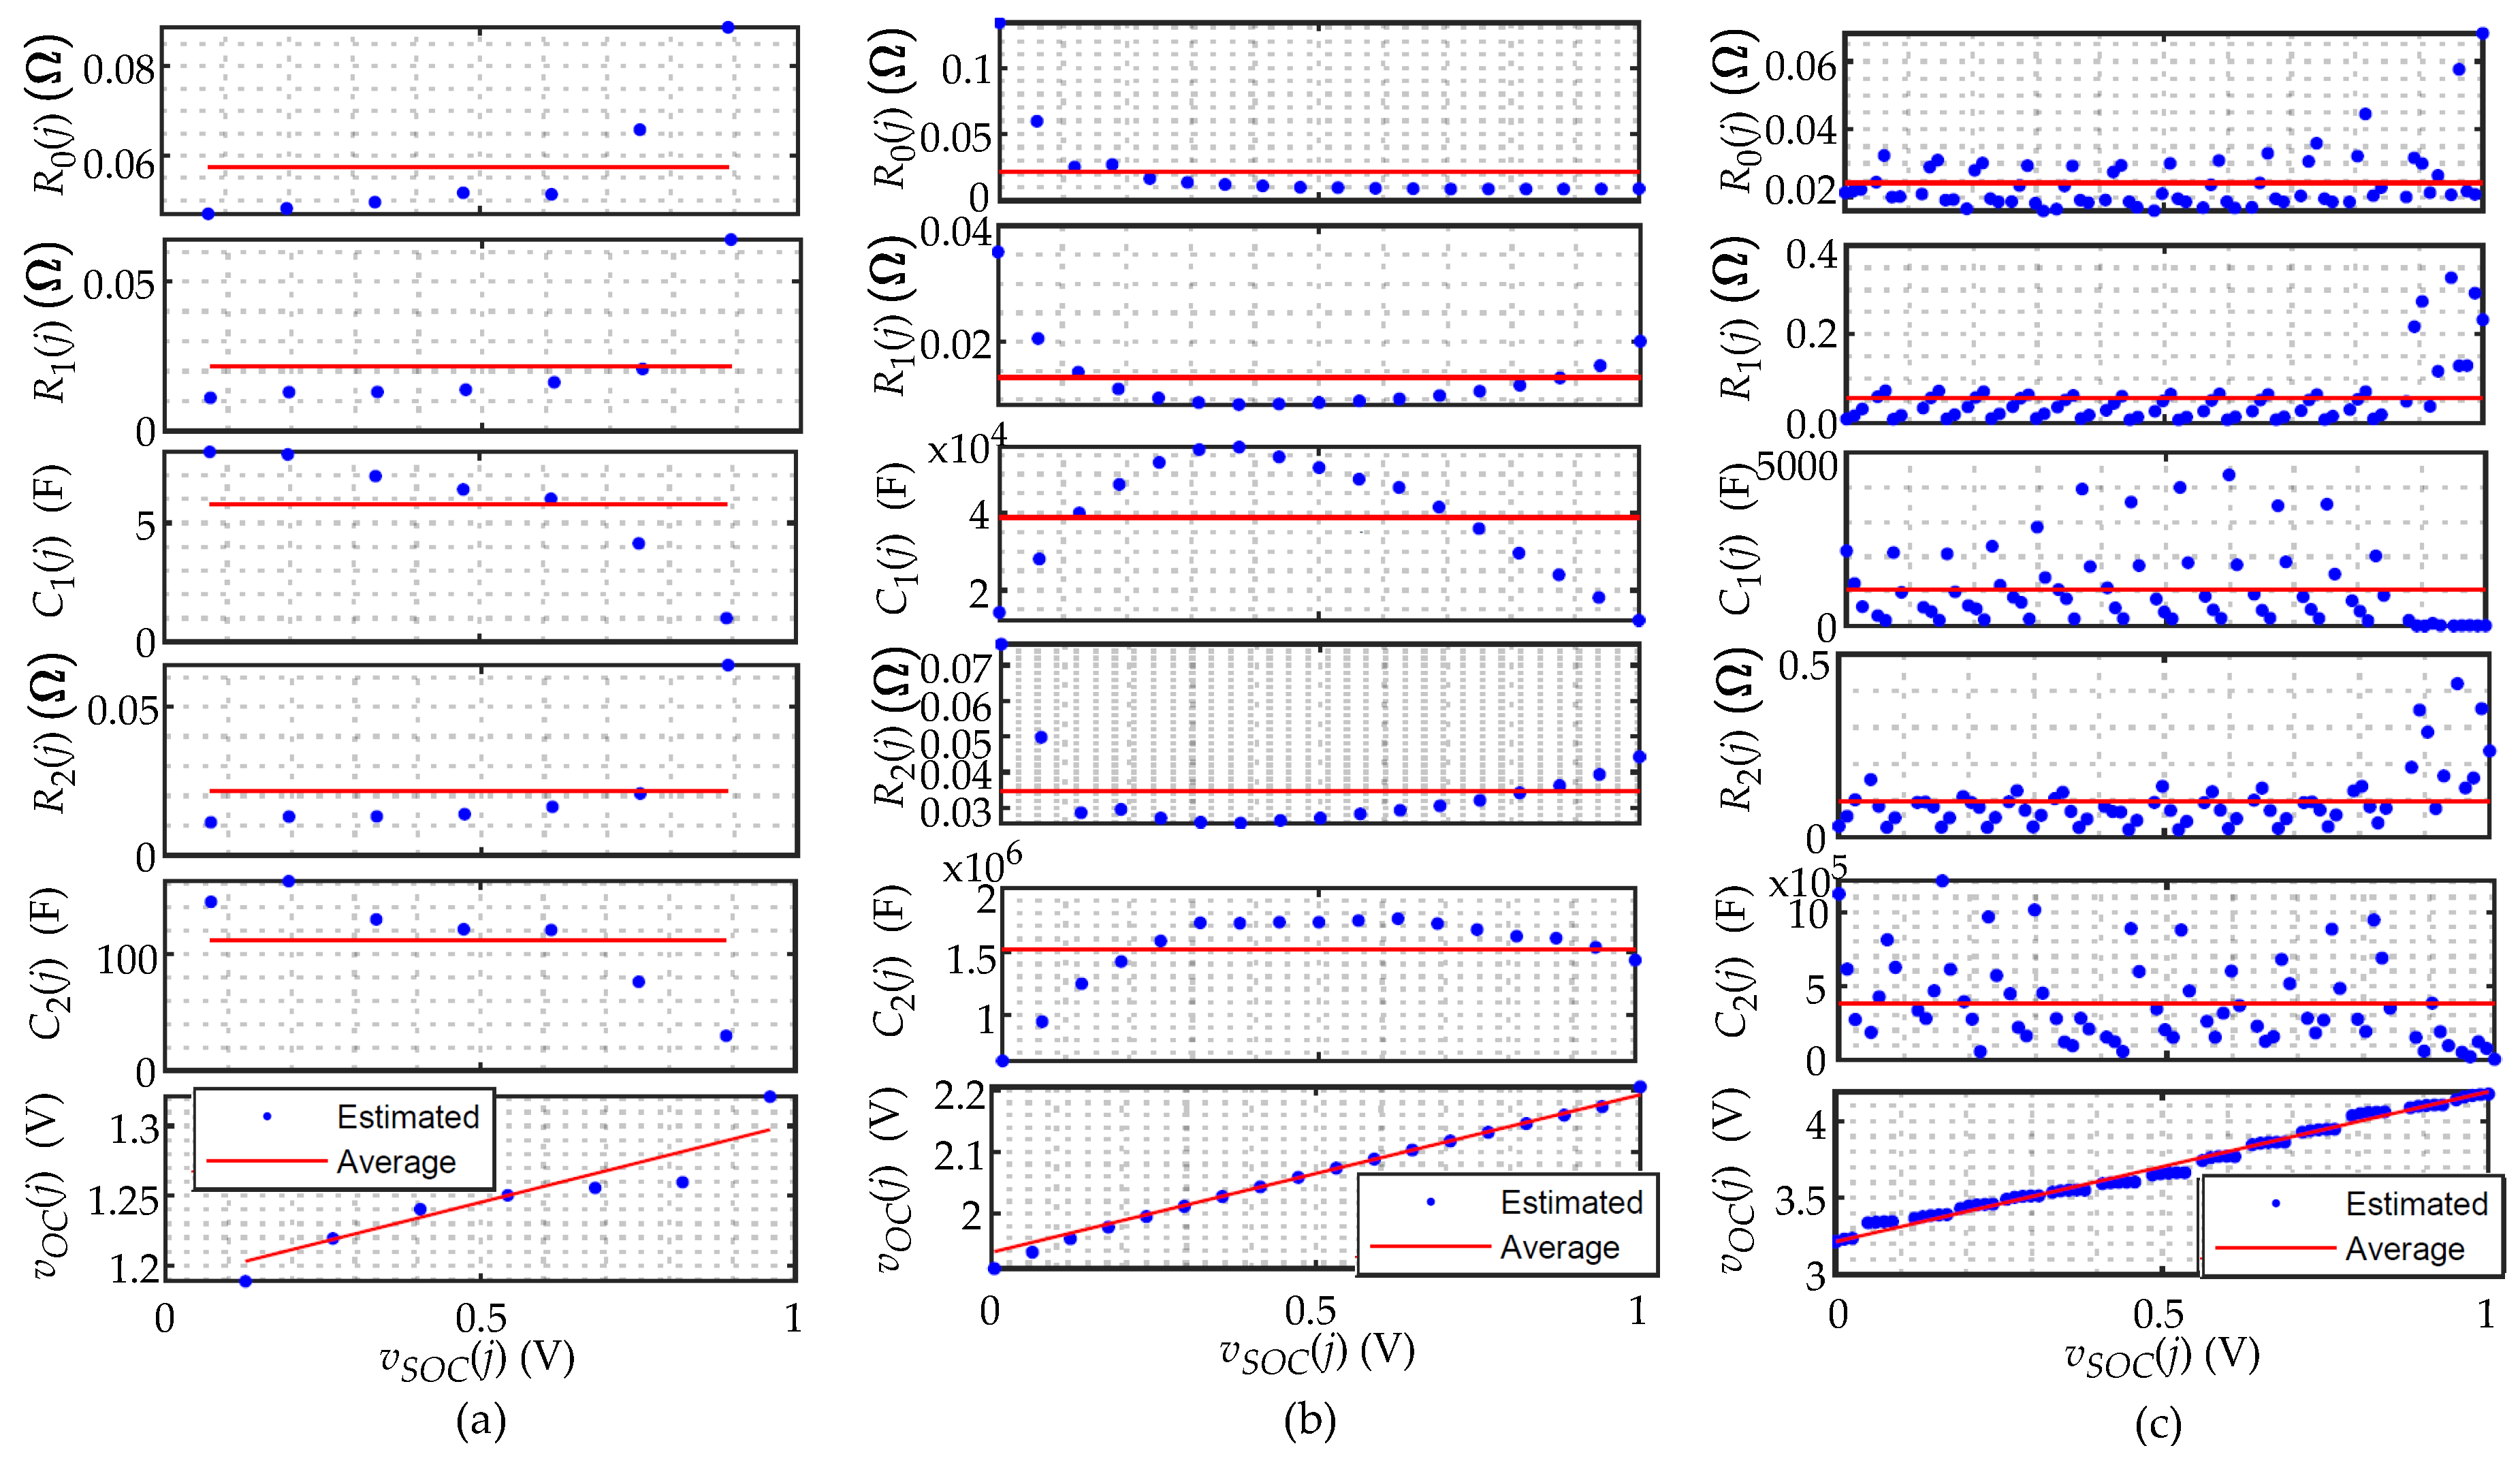
Figure 4.
Discharge characteristics with estimation of (a) NiMH [30], (b) Pb-acid [31], and (c) Li-ion [32] batteries (at T=25 °C).
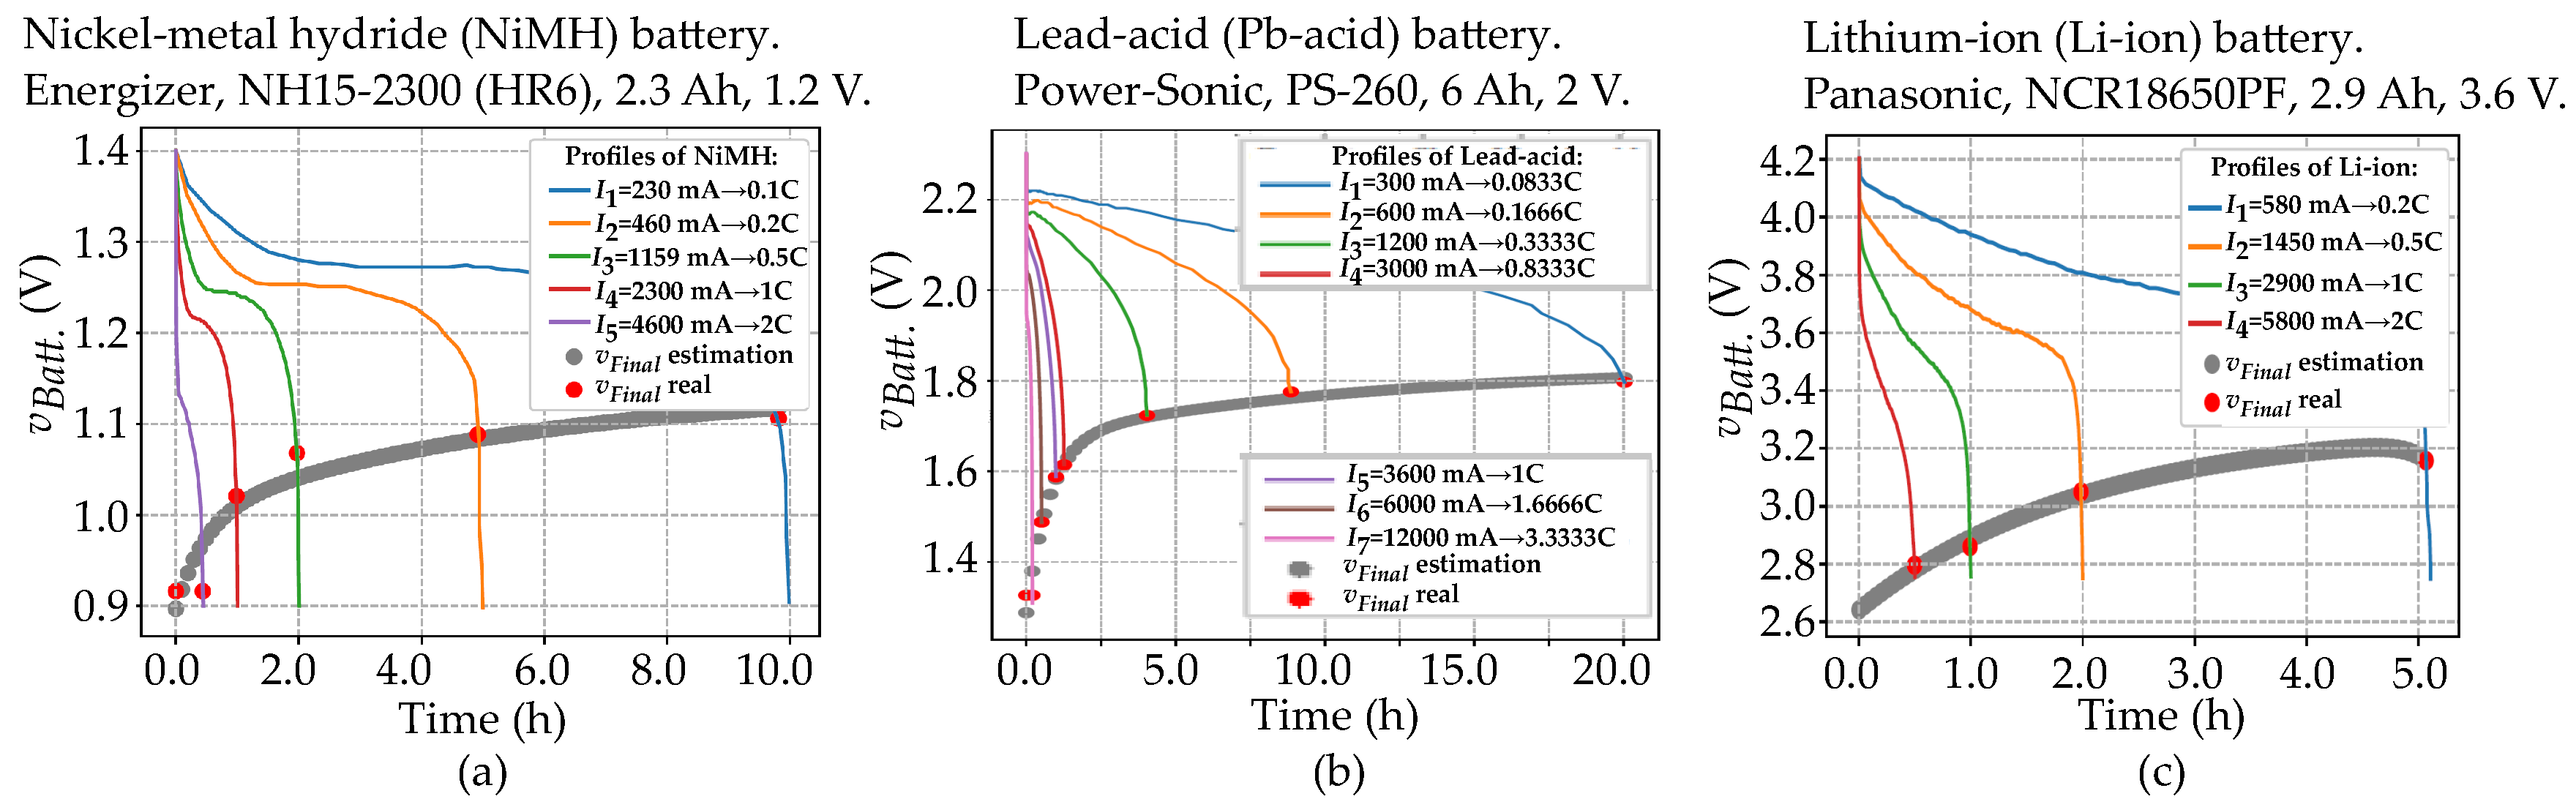
Figure 5.
The function for (a) NiMH, (b) Lead-acid, and (c) Li-ion batteries (at T=25 °C).
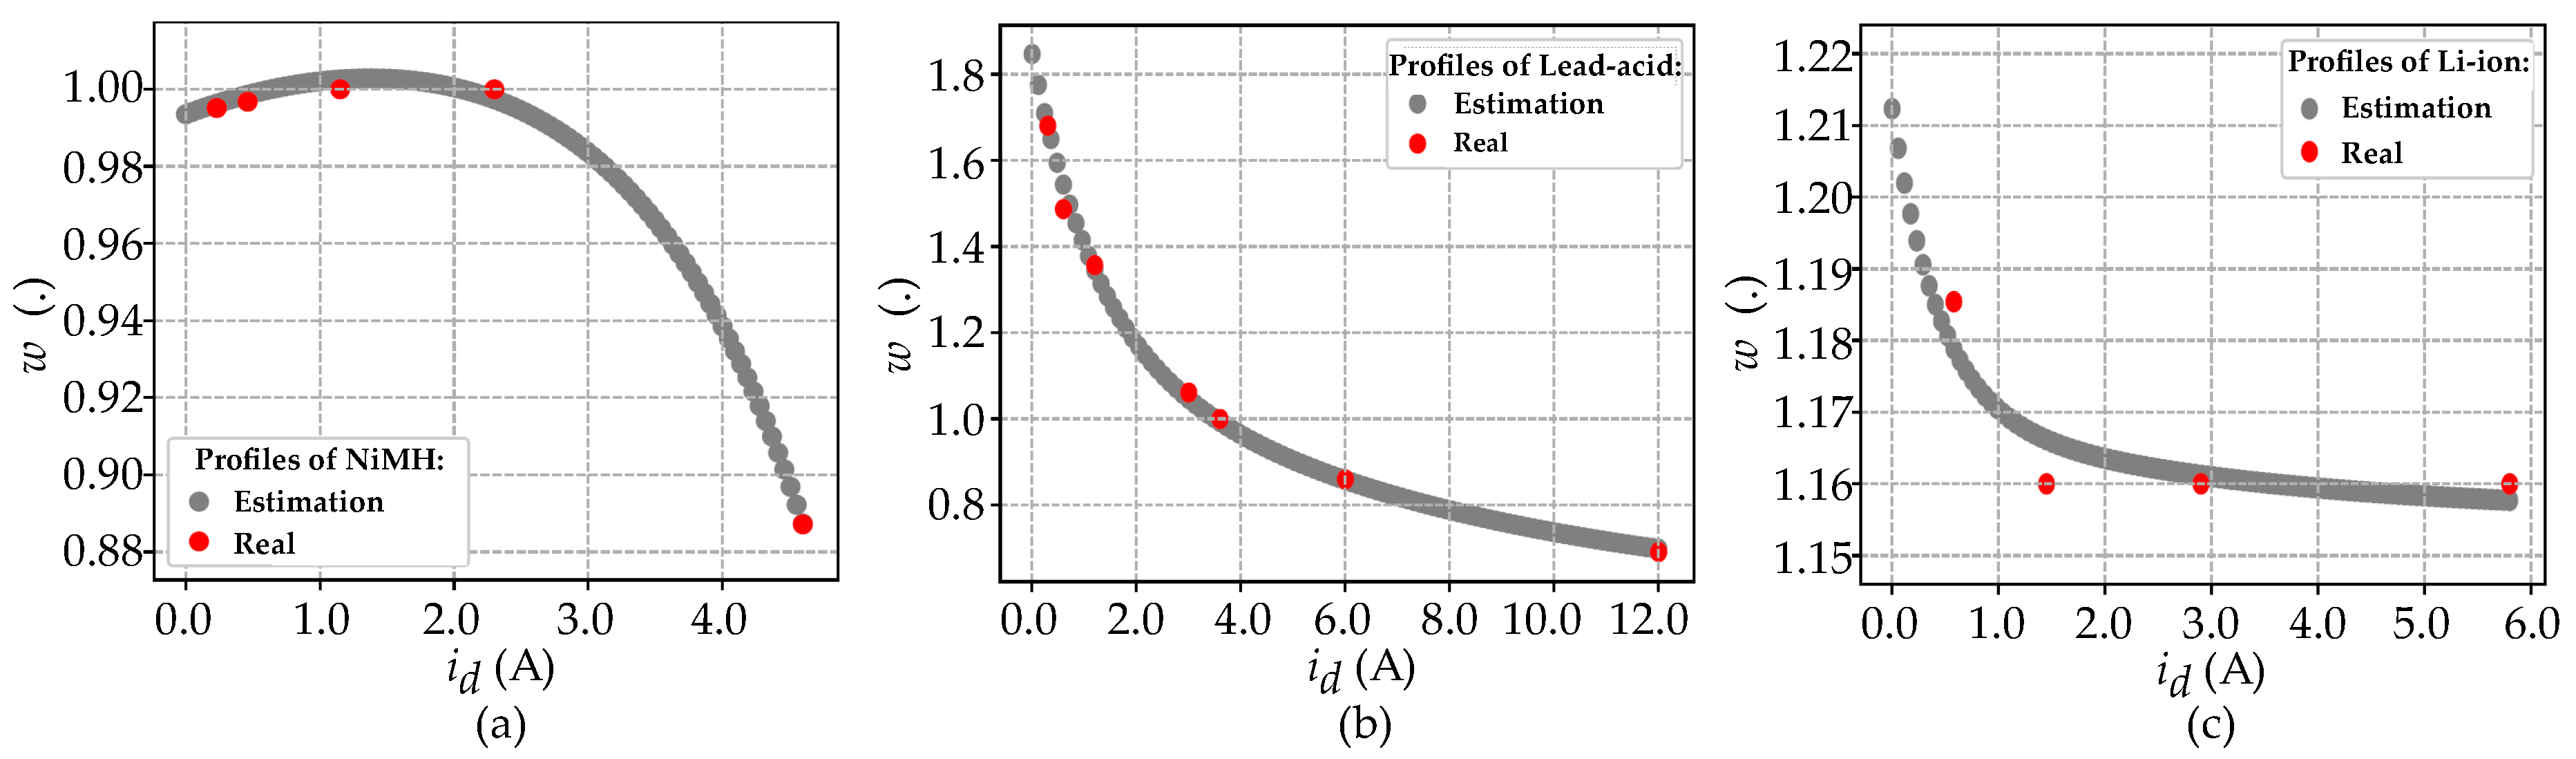
Figure 6.
Algorithm for real-time SOH estimation by the proposed partial discharge method.
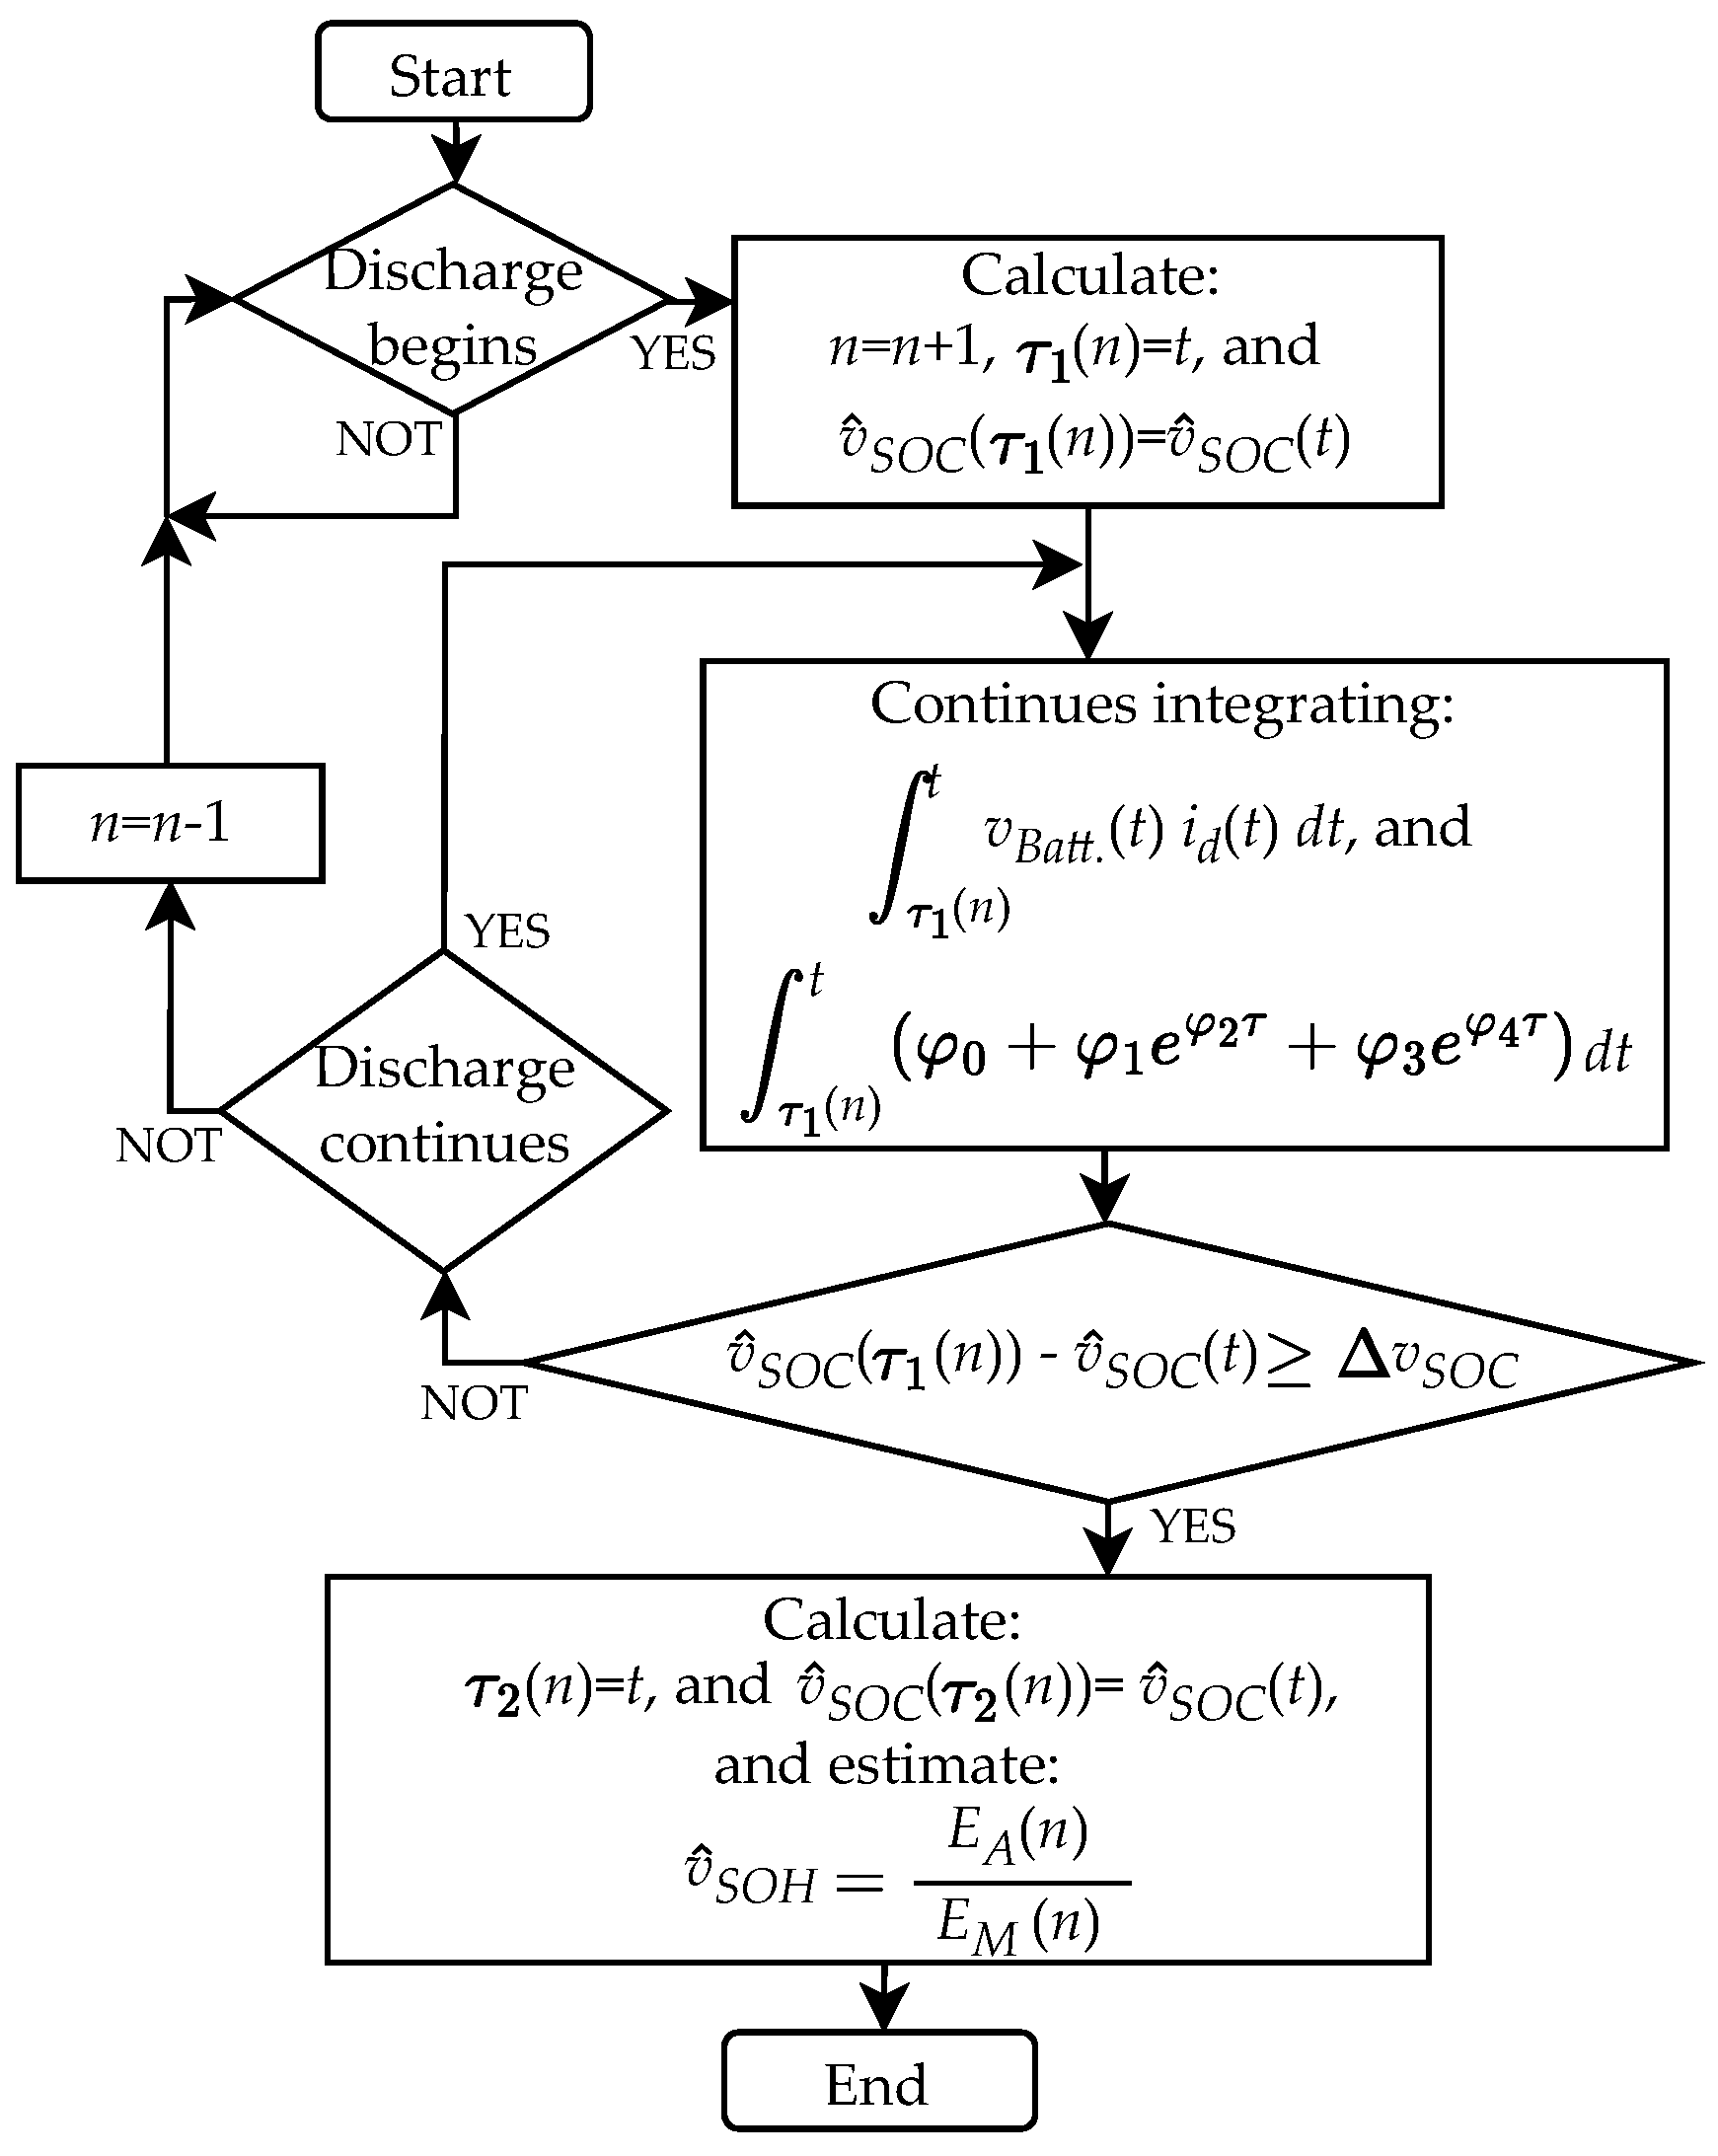
Figure 7.
Results of conducted Simulink-MATLAB simulations to validate the proposed SOH estimator and linear SOC observer, using full-discharge test data of: (a) NiMH, (b) Pb-acid, and (c) Li-ion batteries (at 25 °C).
Figure 7.
Results of conducted Simulink-MATLAB simulations to validate the proposed SOH estimator and linear SOC observer, using full-discharge test data of: (a) NiMH, (b) Pb-acid, and (c) Li-ion batteries (at 25 °C).
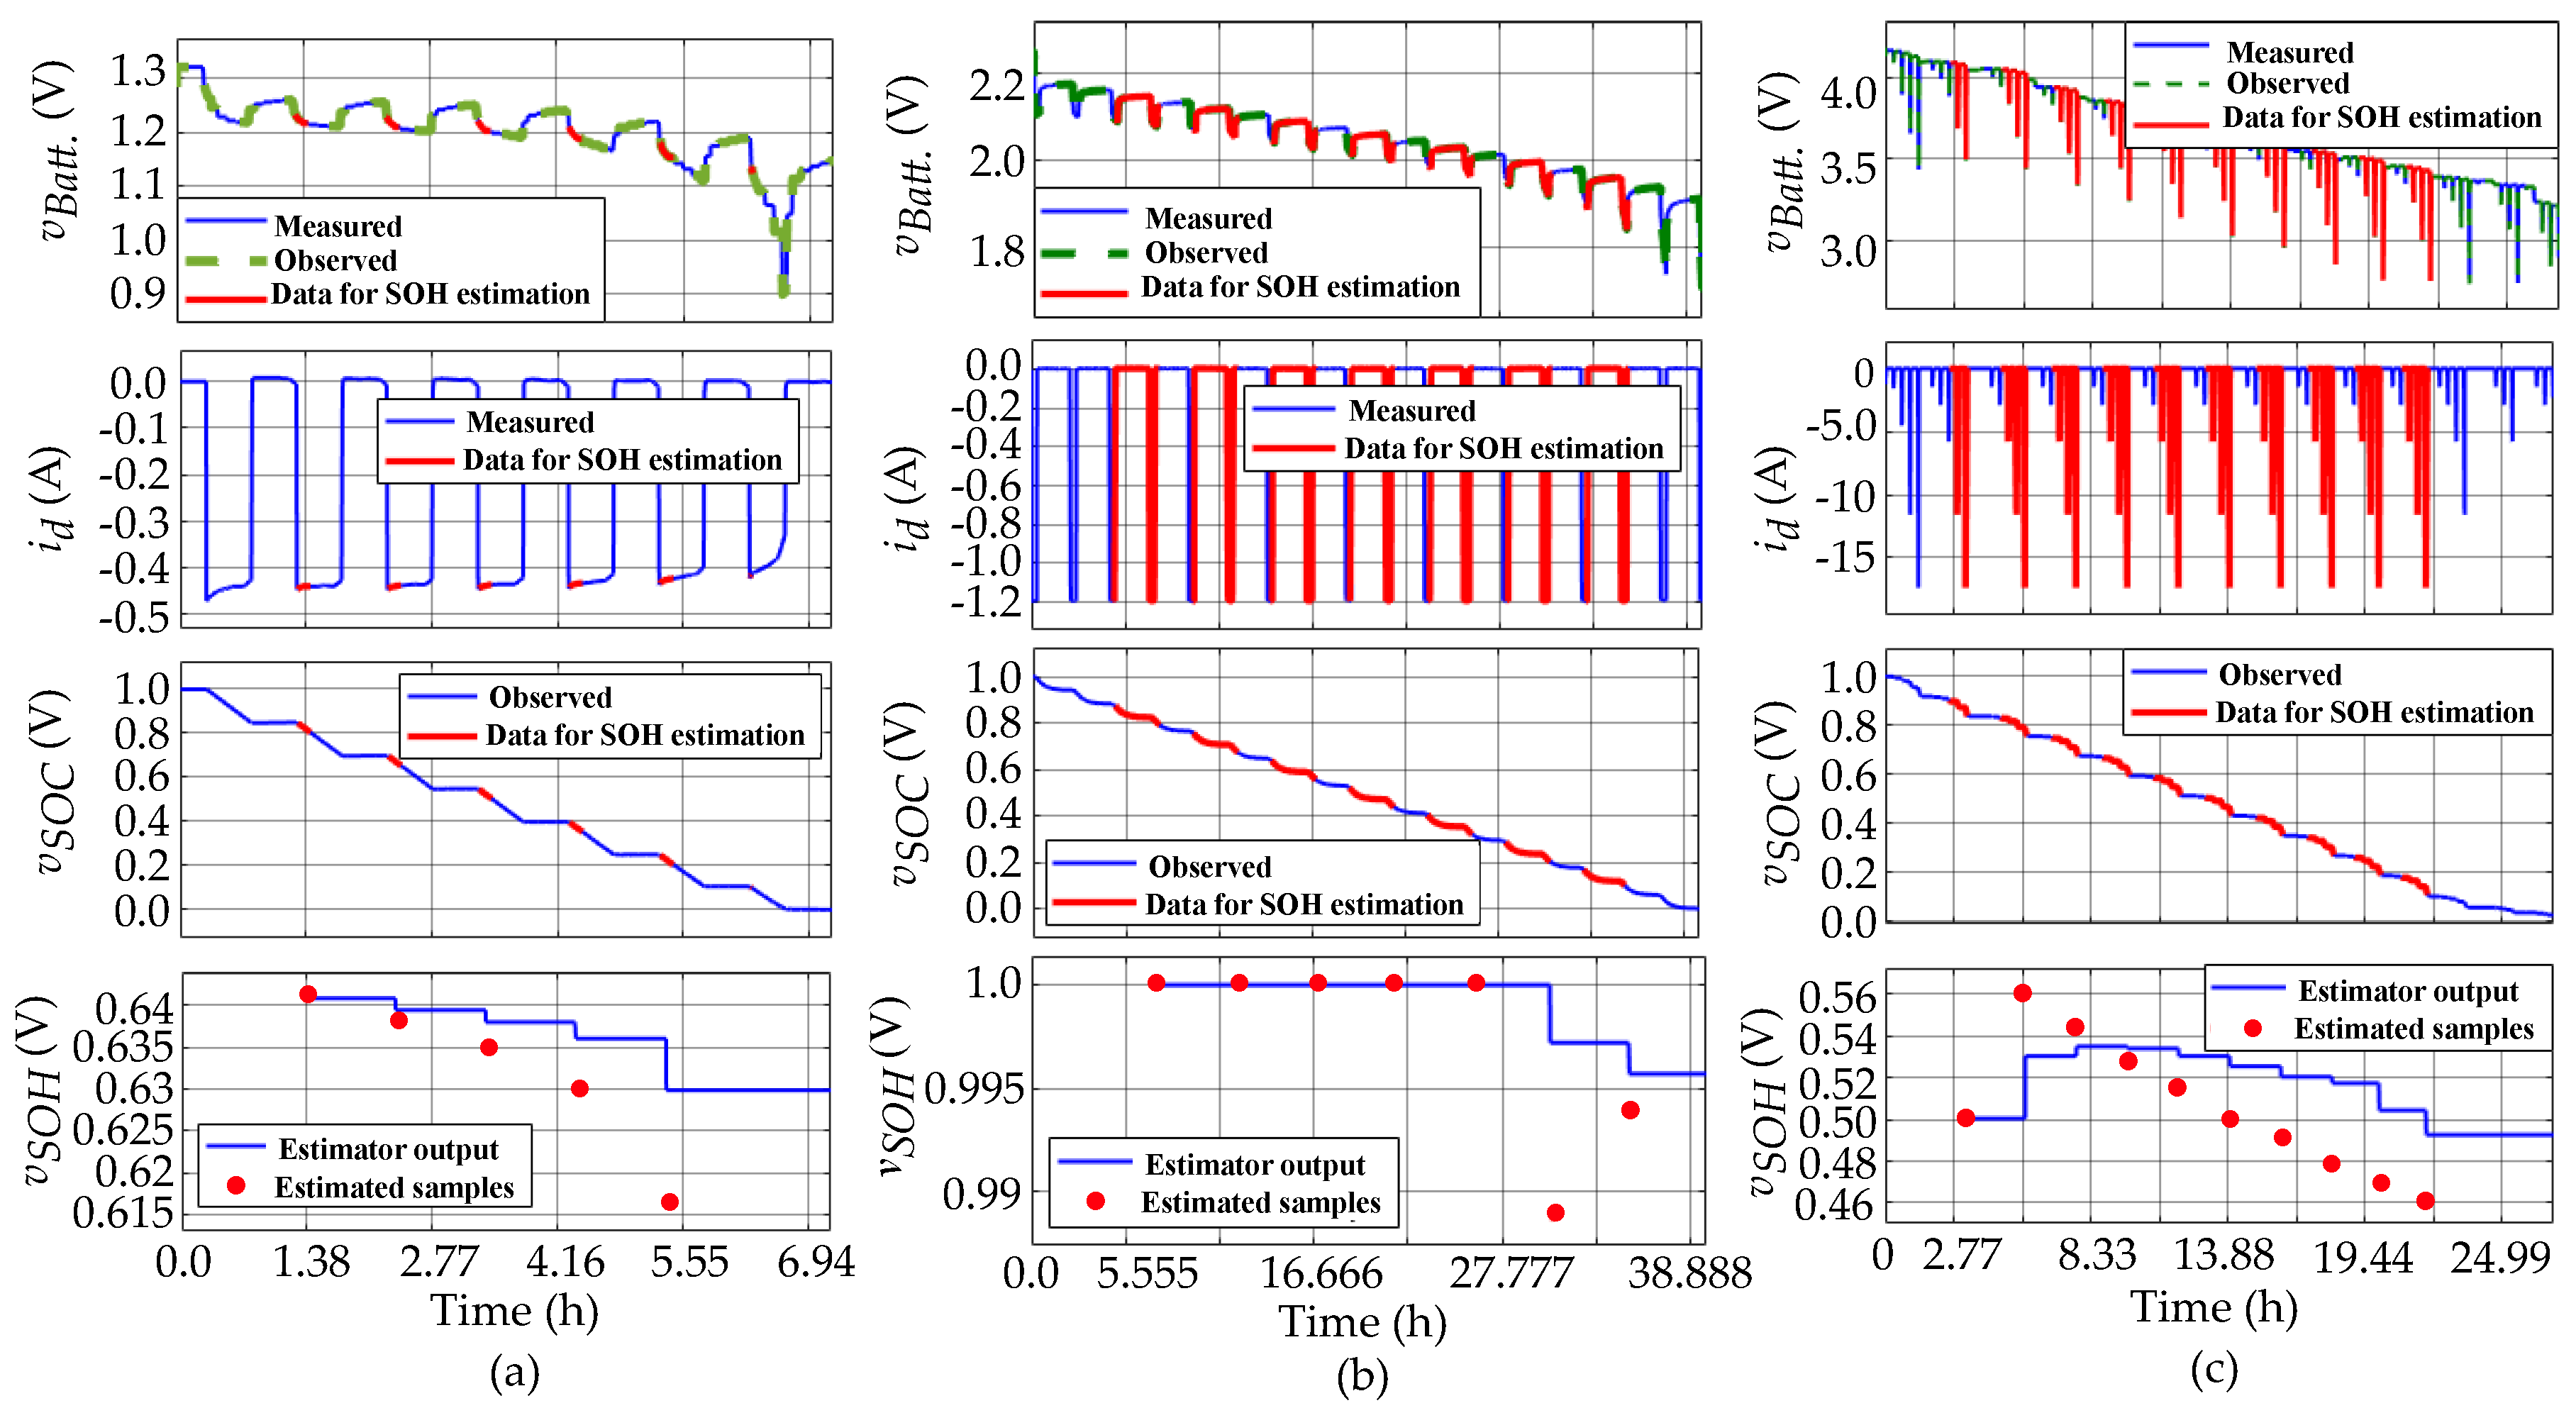
Figure 8.
MIL simulation environment on the OPAL-RT platform (model OP4510) to validate the proposed SOH estimation scheme. (a) Simulation scheme and battery pack configuration, and (b) Simulation results (at 25 °C).
Figure 8.
MIL simulation environment on the OPAL-RT platform (model OP4510) to validate the proposed SOH estimation scheme. (a) Simulation scheme and battery pack configuration, and (b) Simulation results (at 25 °C).
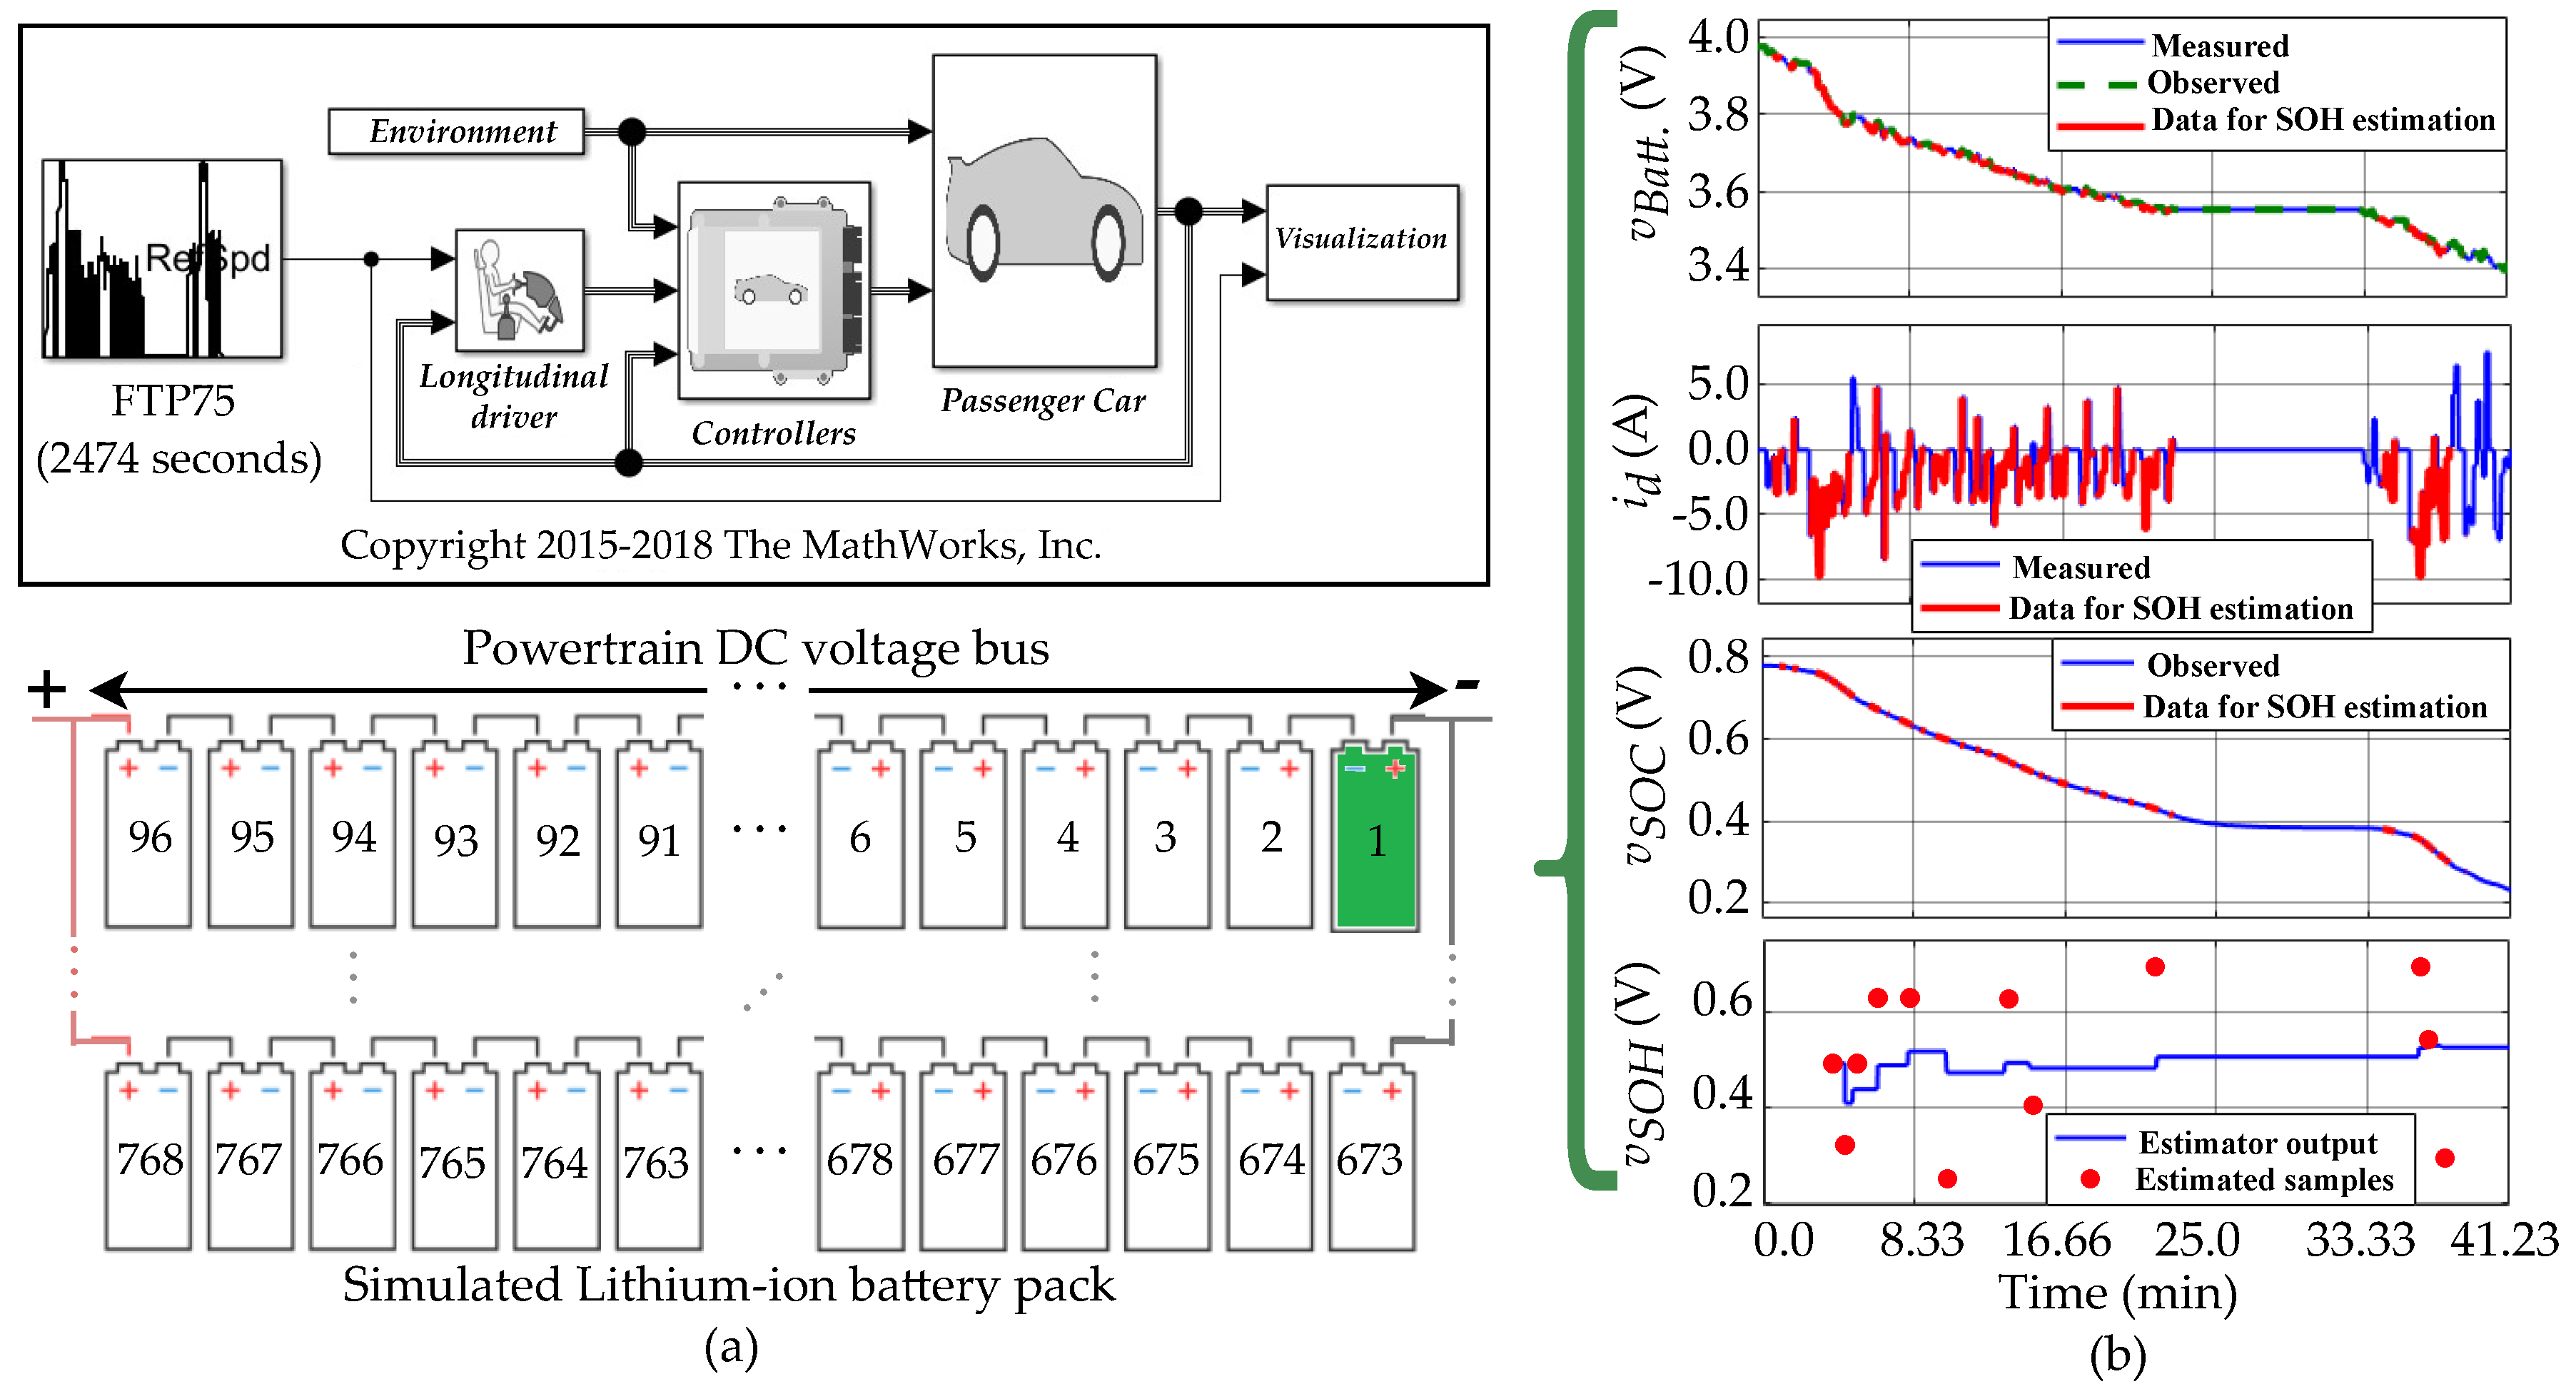
Figure 9.
Computational consumption results on OPAL-RT monitoring window.
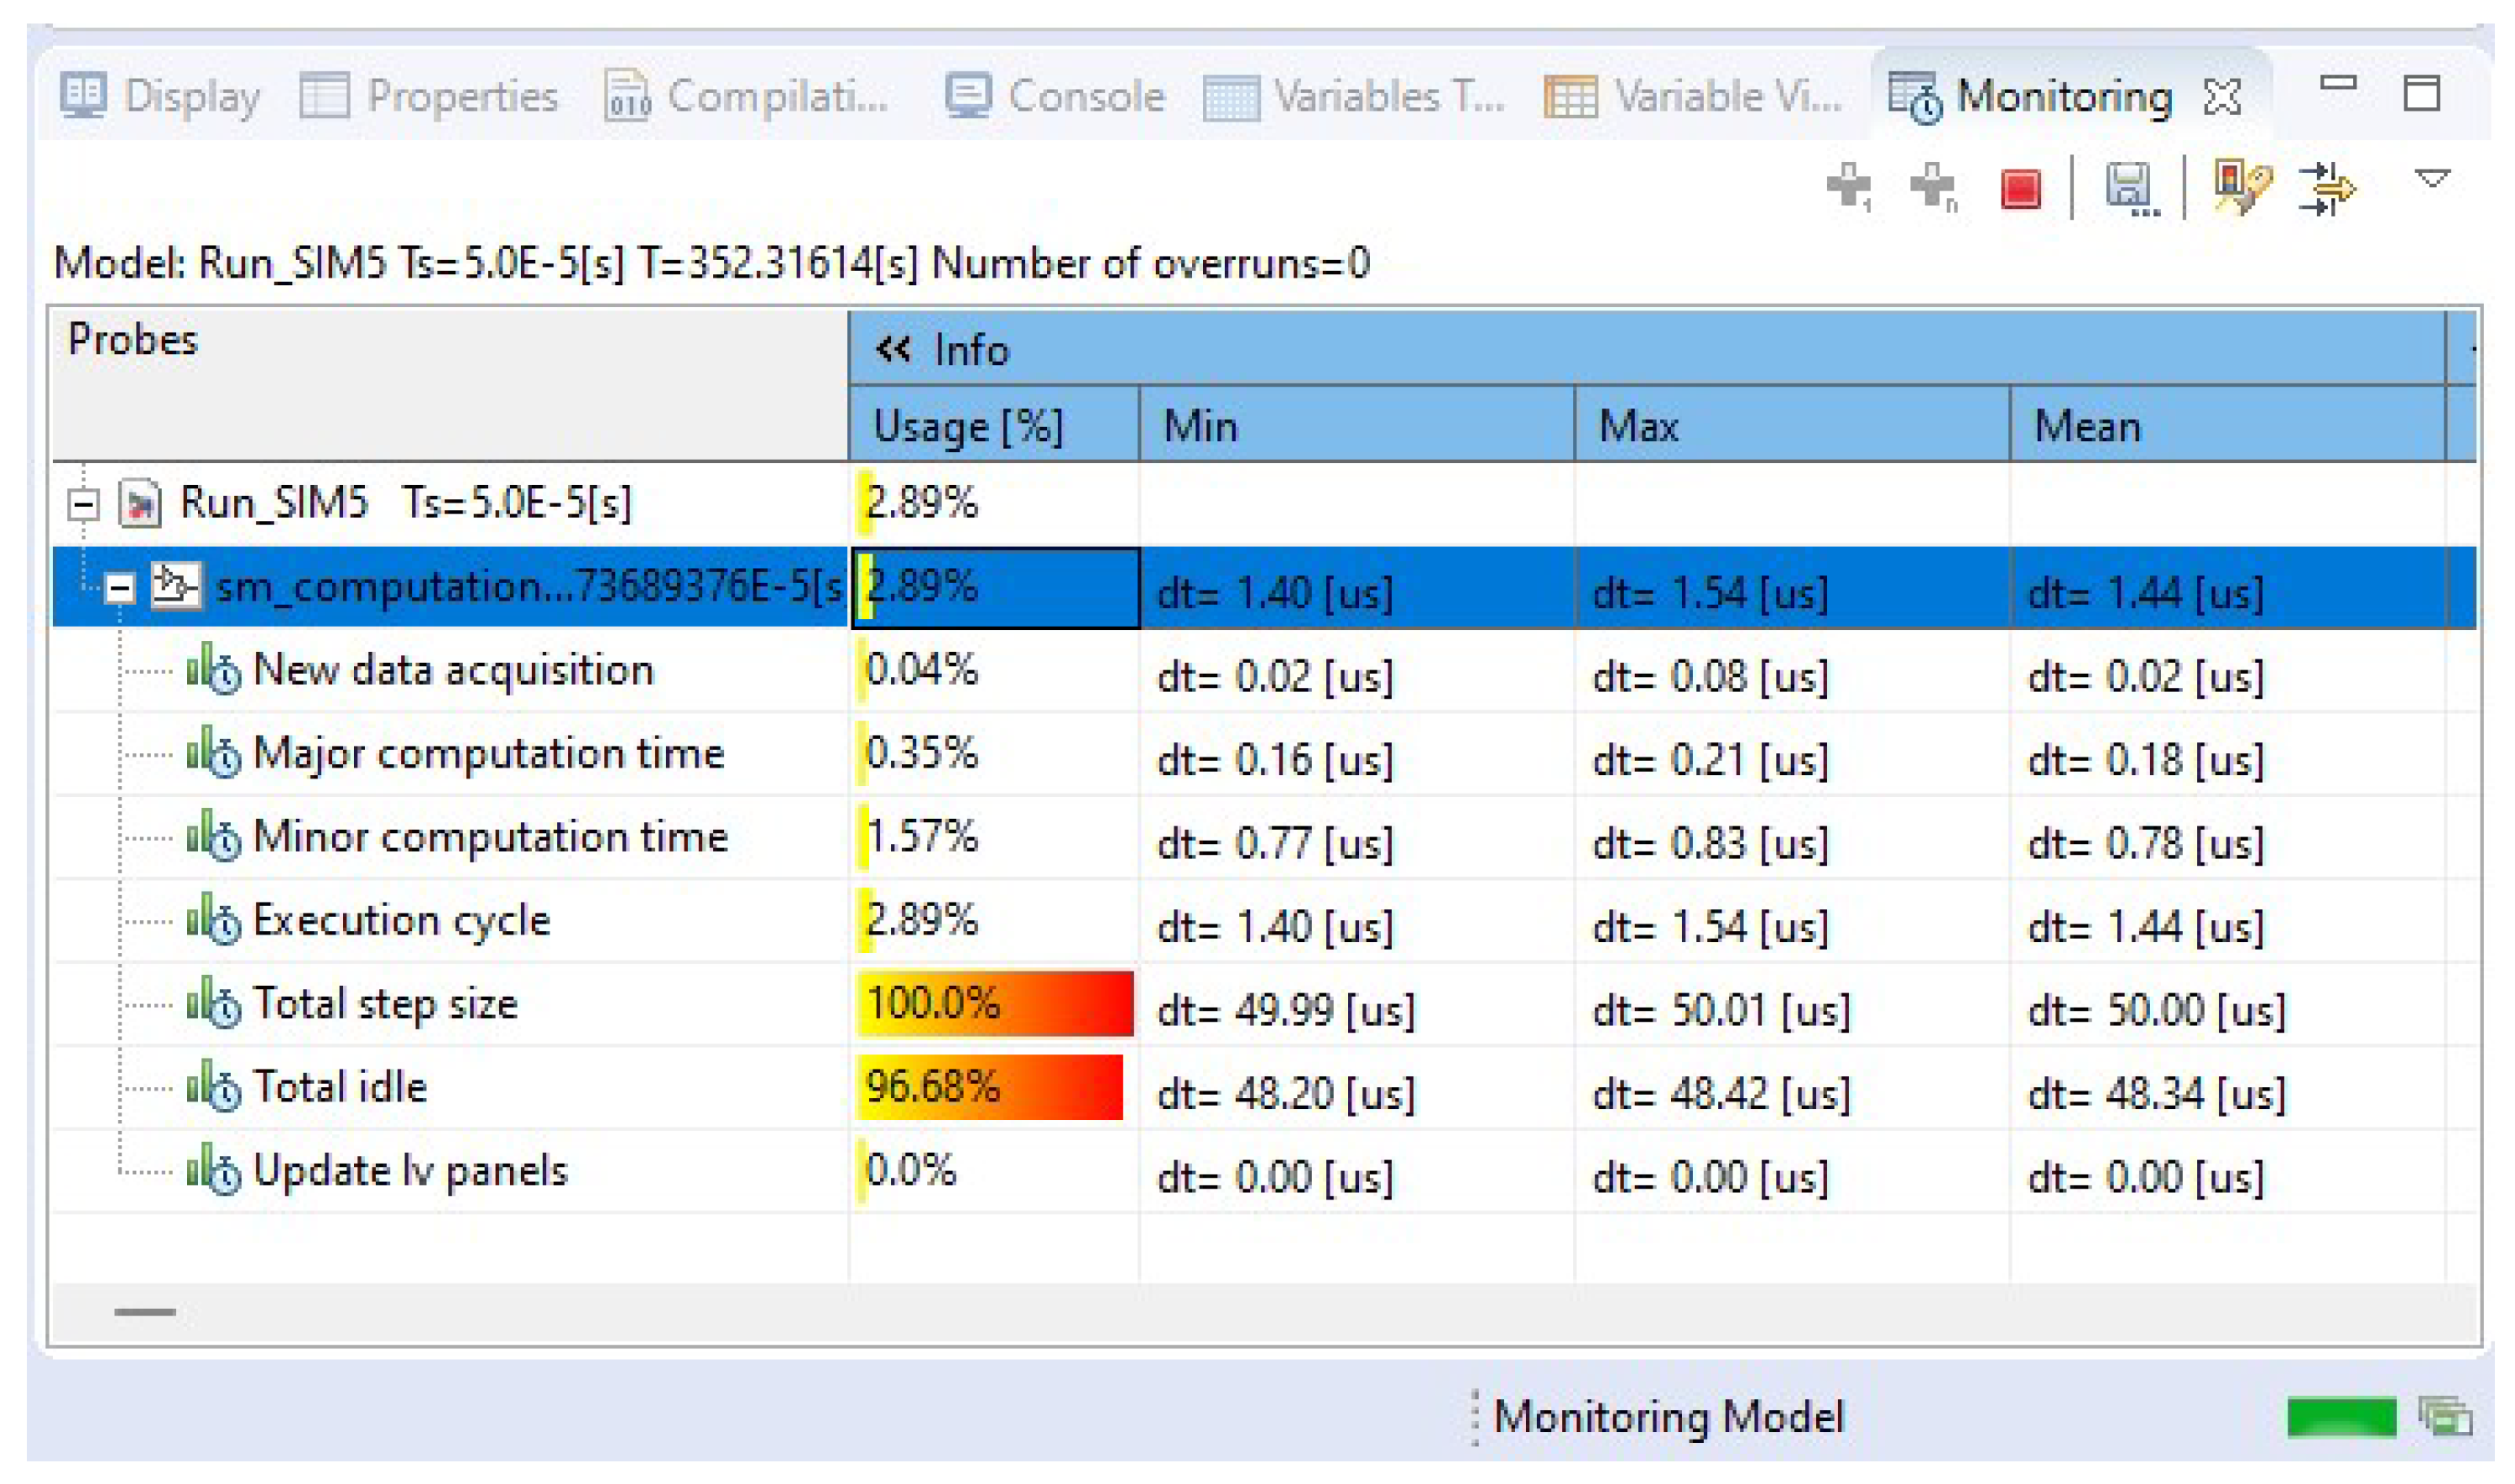

Table 1.
Attributes of battery SOH estimation methods.
| Attributes / Methods | Desired | CCM | ICA, DVA |
PE, SM |
KF | OM | DDM | UM | EIS | OCV | IRM |
|---|---|---|---|---|---|---|---|---|---|---|---|
| Online/Off-line | On | On | On | On | On | On | On | On | On | Off | Off |
| For embedded systems | Easy | Easy | Mod | Lim | Mod | Mod | Com | Com | Com | Easy | Easy |
| Computational resources/burden | Low | Low | Med | Low | High | Med | High | High | High | Low | Low |
| Calibration for start-up | Easy | Easy | Easy | Easy | Mod | Mod | Com | Com | Com | Easy | Mod |
| Charge/discharge description | ✔ | ✔ | ✔ | ✔ | ✔ | ✔ | ✔ | ✔ | |||
| For fault detection/diagnosis | ✔ | ✔ | ✔ | ✔ | ✔ | ✔ | ✔ | ||||
| Design and implementation cost | Low | Low | Med | Low | Med | Low | High | High | High | Low | Low |
| Used in reliable engineering | ✔ | ✔ | ✔ | ✔ | ✔ | ✔ | ✔ | ✔ | ✔ | ||
| Used in research & development | ✔ | ✔ | ✔ | ✔ | ✔ | ✔ | ✔ | ✔ | |||
| For management & optimization | ✔ | ✔ | ✔ | ✔ | ✔ | ✔ | |||||
| Estimation with interval data | ✔ | ✔ |
Abbreviations: Online (On), Off-line (Off), Medium (Med), Moderately (Mod), Limited (Lim), Complex (Com), Applicable (✔), Not applicable ( )
Table 2.
Methods to obtain the Equivalent Circuit Model (ECM) parameters.
| Parameters and equations | Method and description |
|---|---|
|
Available capacitance: . |
Integral of the battery current method (in a full-discharge test): is in Farads [29], and are cycle number and temperature-dependent correction factors (dimension-less), respectively (they are ideally “1” because and temperature are considered constants each cycle), and is a constant equal to 3600 seconds per volt-hours. |
|
Internal resistance: . |
Current and voltage step (at in Figure 2): is in Ohms [18]. j represents the rest period number. is estimated by averaging the J resistance values obtained by the ratio between and (at the transition of to 0 A), at the begin of each j-th . |
|
Open-circuit voltage: . |
Linear function of the open-circuit voltage versus SOC voltage: (in Volts) is estimated by linear regression of J values of OCV obtained at the end of each j-th (at ). M and K are constants. |
|
RC parameters: . |
Linearized exponential regression (every and after a pulse): and are in Ohms, and are in Faradas [18]. The measured voltage data of each (between and ) is conditioned as a two-term exponential function. is the voltage value at the end of every (at ). The value of is obtained by the integral of the current at the j-th discharge segment. Coefficients a, b, c, and d are calculated by the Curve Fitting Toolbox in MATLAB [18]. RC parameters are estimated by the average of the J values of the j-th coefficients a, b, c, and d obtained at every j-th . |
Table 3.
Estimated ECM parameters and battery characteristics of the three battery technologies (at T=25 °C).
Table 3.
Estimated ECM parameters and battery characteristics of the three battery technologies (at T=25 °C).
| Battery data (math. symbol, and unit) | NiMH | Pb-acid | Li-ion |
|---|---|---|---|
| Nominal Voltage (, V) | 1.2 a | 2.0 b | 3.6 c |
| Float voltage (, V) | 1.4 a | 2.35 b | 4.2 c |
| Nominal Capacity (, Ah) | 2.3 a | 6.0 b | 2.7 c |
| Available Capacity (, Ah) | 1.448 | 6.592 | 1.339 |
| Equivalent available capacitance (, F) | 5212.8 | 23731.2 | 4820.4 |
| Internal resistance (, ) | 0.05744 | 0.02165 | 0.02430 |
| Transient resistance one (, ) | 0.02173 | 0.01380 | 0.05577 |
| Transient resistance two (, ) | 0.02175 | 0.03470 | 0.09786 |
| Transient capacitance one (, F) | 5.7635 | 38734.5258 | 1045.6885 |
| Transient capacitance two (, F) | 112.2328 | 1519282.831 | 379918.1737 |
| Slope of the linear OCV function (M, dimensionless) | 0.1133 | 0.2555 | 0.9755 |
| Constant of the linear OCV function (K, V) | 1.1886 | 1.9372 | 3.215 |
Table 4.
Coefficients of for each battery technology.
| Coefficient | NiMH | Pb-acid | Li-ion |
|---|---|---|---|
| 41.9330 | 1.8965 | 2.6896 | |
| -39.5367 | 3.5968 | 7.2341 | |
| -93.7191 | 1.8965 | 2.6896 | |
| -3.0812 | 1.1941 | 1.0664 |
Table 5.
Coefficients of function (at T=25 °C).
| Coefficients | NiMH | Pb-acid | Li-ion |
|---|---|---|---|
| (V) | 1.14 | 1.83 | 3.27 |
| (V) | -0.142 | -0.161 | -1.79 |
| (1/s) | -0.183 | -0.0914 | 5.25 |
| (V) | -0.102 | -0.384 | -0.630 |
| (1/s) | -2.07 | -1.31 | -0.500 |
Table 6.
Coefficients of function (at T=25 °C).
| Coefficients | NiMH | Pb-acid | Li-ion |
|---|---|---|---|
| (·) | 1.04 | 1.14 | 1.16 |
| (·) | -0.00471 | -0.142 | 0.0148 |
| (1/A) | 0.748 | -0.183 | -0.345 |
| (·) | -0.0440 | -0.102 | 0.0418 |
| (1/A) | -0.376 | -2.07 | -2.30 |
| (A) | 2.30 | 3.60 | 2.7 |
| (h) | 1 | 1 | 1 |
Table 7.
Data of Simulation 1, for validating SOH proposal.
| Data description | NiMH | Pb-acid | Li-ion |
|---|---|---|---|
| Observed battery voltage’s RMSE | 0.037747 | 0.01621 | 0.007452 |
| Expected SOH voltage (given by: ) | 0.629 (∼62.9 %) | 1.000 (∼100 %) | 0.495 (∼49.5 %) |
| used to estimate | 0.02 (∼2 %) | 0.07 (∼7 %) | 0.05 (∼5 %) |
Table 8.
Data of Simulation 2, for validating SOH proposal in real-time MIL environment.
| Data description | Li-ion |
|---|---|
| Observed battery voltage’s RMSE | 0.001671 |
| Expected SOH voltage (by: ) | 0.495 (∼49.5 %) |
| used to estimate | 0.01 (∼1 %) |
Disclaimer/Publisher’s Note: The statements, opinions and data contained in all publications are solely those of the individual author(s) and contributor(s) and not of MDPI and/or the editor(s). MDPI and/or the editor(s) disclaim responsibility for any injury to people or property resulting from any ideas, methods, instructions or products referred to in the content. |
© 2024 by the authors. Licensee MDPI, Basel, Switzerland. This article is an open access article distributed under the terms and conditions of the Creative Commons Attribution (CC BY) license (http://creativecommons.org/licenses/by/4.0/).
Copyright: This open access article is published under a Creative Commons CC BY 4.0 license, which permit the free download, distribution, and reuse, provided that the author and preprint are cited in any reuse.


