Submitted:
16 October 2024
Posted:
17 October 2024
You are already at the latest version
Abstract
The number of bibliometric studies published in the scientific literature has been increasing in recent years. Some authors publish more bibliometric studies than others do. To identify authors who focus on bibliometric studies and their publication strategy is based on these studies. To determine whether the focus on bibliometric studies can be considered a successful publication strategy. A bibliometric analysis, including a citation analysis, was used to determine the results. The Scopus database was chosen as the source of bibliometric data. In total, 100 authors who frequently publish bibliometric studies were identified. For almost half of them, bibliometric studies can be considered the main or important part of their publication portfolio. A relatively small group of authors widely publishes bibliometric studies. The bibliometric indicators of these authors indicate that this specialization in bibliometric studies is quite successful.
Keywords:
bibliometric study
; publication strategy
; h-index
; citation
1. Introduction
A recent article by Christine Musselin [1] about her publication strategy and her view of the magazine’s editorial board connected in my mind to a discussion I recently had with a colleague from the editorial board of the Czech magazine Paliva (ISSN 1804-2058). I am a member of the editorial board of several scientific journals. In the case of the journal VTEI (ISSN 1805-6555), I am not only a member of the editorial board, but also a member of the management of the research institution that publishes this journal. And since I am a user of scientometrics and bibliometrics (after all, it is somehow part of the work of a scientific manager), I have been regularly evaluating the bibliometric indicators of the VTEI journal for several years now [2,3]. Our discussion was about the “acceptability” of publishing citation analysis studies in a journal that is not specialized in bibliometrics.
One of the ideas that came up in our discussion was that if the article did not only contain citation indicators but also charted the development of topics published in the journal, then it could be acceptable to the editorial board for publication. The bibliometrics is very well suited to such an analysis, due to examining multiple parameters and trends over time.
Like almost any scientist, I searched the available literature for answers to my questions. Therefore, after the mentioned discussion, I started looking for bibliometric studies of individual journals. Bibliometric studies of individual journals provide detailed insights into various aspects of a journal’s publication history. Bibliometric indicators like the impact factor [4], H-index [5], and other metrics (e.g., Eigenfactor [6], CiteScore [7], SJR [8]) help in understanding the journal’s evolution and standing in the academic community and its role in scientific communication [9,10]. Many of bibliometric indicators used for individual journals studies were describe by Anyi et al. [11]. By analyzing the most cited papers [12,13] and frequently covered topics [14,15], bibliometric studies can identify emerging research trends [16,17] and core themes [18,19] within a journal. Bibliometric studies reveal patterns in publication and citation, such as the prevalence of multi-authored articles and the types of sources most frequently cited. This information can indicate the collaborative nature of research and the timeliness of the cited literature [14,20]. Analyzing a journal’s content over time provides insights into the development and visibility of specific research fields [21,22]. It can helps researchers to identify target journals for their manuscripts [23].
To my surprise, I found more than three hundred bibliometric studies focused on the analysis of a single journal in the Scopus database for the years 2021 to 2024 alone. I did not continue my search any further into the past. At the same time, I noticed that some authors’ names were repeated. It can therefore be assumed that some authors use bibliometric analysis as one of the main scientific methods of their research.
Another possible explanation for repeated names in bibliometric studies is that it is a certain publication strategy. The publication strategy of researchers is a multifaceted approach that varies significantly across disciplines and career stages. Research on publication strategies has focused, for example, on the diversity of journals of young researchers [24], the criteria for selecting journal for submission [25], the influence of bibliometric indicators of the journal on the interest of authors to publish in them [26], etc.
As a user of bibliometrics and scientometrics, I soon realized that the bibliometric study of one particular journal is a relatively simple study, which today has more the character of a routine task than a scientific work. This statement may seem controversial to some, and in part, it may be. After all, publishing controversial topics is also one of the publishing strategies [27].
However, my assertion is not meant to be controversial but is based on three basic assumptions: 1. the availability of quality guidelines for bibliometric analysis; 2. the availability of quality bibliometric data; 3. the availability of tools for automated or semi-automated bibliometric analysis. All of these assumptions are currently met. Researchers can use many methodological resources that will help them with the selection of topics for bibliometric analysis [28], the implementation of bibliometric analysis [29,30] and its reporting [31]. Bibliometric data over a sufficiently long period can be obtained from databases such as Scopus [32], Web of Science [33], Dimensions.AI [34], OpenAlex [35] or Crossref [36]. Likewise, several software tools are available for performing bibliometric analyses [37], such as Publish or Perish [38], VOSviewer [39], ScientoPy [40], bibliometrix [41] and others.
From my perspective, a bibliometric study of one particular journal does not meet two of the criteria defining research [42]. This is a requirement of “creativity” and “research uncertainty”. Uncertainty is low because bibliometric databases provide data needed to perform bibliometric analyses. The creative input of the scientist then consists in the application of the right search queries that cover the entire breadth of the researched topic and the choice of the right methods. In the case of a bibliometric analysis of one particular journal, the scope of the topic, which is the journal under investigation, is clearly defined. In the case of a journal indexed in the selected bibliometric database, the uncertainty in defining the query also practically disappears.
A scientist can choose research questions creatively. However, due to the number of already published bibliometric studies, hardly any scientist will find a new research question that could be applied to the bibliometric mapping of one particular journal. The last area in which the scientist shows a creative approach is the choice of methods for answering research questions. And even here there is currently not much space for creativity, because the methods are determined by the selected bibliometric software. Thus, a bibliometric study of one particular journal can currently be carried out as a routine task, and it is only necessary to be able to use the available resources and tools correctly. This is the reason why I consider the bibliometric analysis of one particular journal to be a simple routine task. This is great news for researchers in the field of bibliometrics, as it proves that bibliometrics is a tool of everyday life and no specific skills are needed.
The fact that bibliometrics has become a commonly used method is evidenced by the number of articles published in scientific literature. As of July 2024, more than 23,000 documents are indexed in the Scopus database that have the terms “bibliometric study”, “bibliometric analysis”, “scientometric study” or “scientometric analysis” in the title or keywords. Of these, 77% of publications were published after 2019 (Figure 1).
This study aims to analyze the structure of authors publishing bibliometric studies and to find out whether some of these authors have included bibliometric studies in their publication strategy and whether this strategy is successful.
2. Materials and Methods
The Scopus database was chosen for data collection. Because the terms “scientometrics” and “bibliometrics” and also the terms “analysis” and “study” are often confused, a combination of these terms was chosen. The search was set to the fields “Title” and “author keywords”. The resulting applied query had the form:
TITLE(“scientometric stud*” OR “scientometric anal*”) OR AUTHKEY(“scientometric stud*” OR “scientometric anal*”) OR TITLE(“bibliometric stud*” OR “bibliometric anal*”) OR AUTHKEY(“bibliometric stud*” OR “bibliometric anal*”)
The query was applied on 17th July 2024 with a result of 23,055 publications. Data on these publications were exported in csv format. Using the Scopus web interface, authors with at least 15 contributions were identified. For each author, the number of contributions according to the above query and the total number of their publications (TP) indexed in the Scopus database were determined. Authors who (probably) included bibliometric studies in their publication strategy were designated as authors whose share of publications according to the query mentioned above was 25 per cent or more of the total number of publications. For these authors, bibliometric study information was exported to csv format to perform bibliometric mapping. Furthermore, basic scientometric indicators such as the number of citations (TC), the number of citations per article (TC/TP), H-index (H), the number of citations per h-index (TC/H) and the number of publications per H-index (TP/H) were determined. These data were found both for all their publications and separately for the publications according to the query above. At the same time, the period in which they published their bibliometric studies was determined, which allowed the scientometric indicators for bibliometric studies to be normalized by the number of years.
To assess the success of the inclusion of bibliometric studies in the publication strategy, the proportion of uncited (uncitedness) of authors’ bibliometric studies was evaluated.
Bibliometric mapping was performed using the program VOSViewer in version 1.6.20, which uses the VOS method [43]. To find out how these authors cooperate with each other, co-authorship analysis was used at the level of authors and countries.
3. Results
Based on the query mentioned above, a total of 100 different authors were identified who published more than 15 bibliometric studies (Table 1). Of these, for 49 authors, bibliometric studies made up more than 25% of their publications, and for 14 authors even more than half of their publications. These 49 authors published a total of 1135 publications and received 30,973 citations, i.e., the average number of citations was 27.3 citations per publication. Bibliometric indicators for 14 authors with more than half of their publications is shown in Table 2 and Table 3.
As of the date of this analysis, 197 articles were uncited, i.e., uncitedness was 17.4%. One uncited article was from 2014, one uncited article from 2015, four uncited articles from 2019, four uncited articles from 2020, 7 uncited articles from 2021, 16 uncited articles from 2022, 84 uncited articles from 2023, and 80 uncited articles from 2024.
Kolesnikov et al. [44] argued that the publication strategy focused on increasing publishing productivity can lead to a decline in publication impact despite the growth of productivity. It seems that it is not a case of publication strategy focused on the bibliometric studies as is shown in Figure 2 and Figure 3.
Scientists from a total of 81 countries participated in the articles of 49 authors who probably included bibliometric studies in their publication strategy. Most often, these were scientists from China, India and Taiwan. Scientists from 22 countries (Table 4) published more than 15 publications.
Figure 2 shows networks of co-authorship collaboration between authors who (probably) included bibliometric studies in their publication strategy. Only results for authors with 15 bibliometric studies are shown in Figure 4. On the contrary, Figure 3 shows the cooperation within individual countries, and Figure 5 shows all the countries involved in the publications of authors who (probably) included bibliometric studies in their publication strategy.
4. Discussion
4.1. Networks of Cooperation
Authors who are likely to include bibliometric studies in their publication strategy and have published more than 15 bibliometric studies in most cases collaborate with each other (groups of the same color connected by lines in Figure 2). In addition, these author clusters are often interconnected by the co-authorship of members of different clusters. In total, it is possible to identify 15 individual authors or groups of authors who are not connected to each other in the form of collaboration on articles.
At the same time, it is evident from Figure 3 that cooperation on bibliometric studies is truly international. An interesting fact is that the most active authors are from Asian countries, specifically from China, India, Taiwan, Malaysia and Pakistan. Up to 6th place is a country outside of Asia, which is Spain. The high number of publications by Palestinian and Saudi-Arab authors is also interesting. Bibliometric studies seem to be very popular in countries that are not among the most active in other fields of research. At present, it is impossible to say unequivocally what is the cause of this. However, as this study suggests, it may be the focus of certain groups of researchers from these countries on bibliometric studies as their publication strategy.
4.2. The Success of a Publication Strategy Based on Bibliometric Studies
However, this analysis suggests that bibliometric studies are a relatively effective publication strategy. For the 49 authors who included bibliometric studies in their publication strategy, the number of publications needed to obtain 1 point of the H-index ranged from 1.2 to 11.3 with a mean of 3.9 and a median of 3.0 publications.
The rate of uncitedness is also relatively low, but this may be due to the fact that this field is undoubtedly experiencing its heyday, as evidenced by the number of published bibliometric studies.
5. Conclusions
The number of authors who have published 15 or more bibliometric studies as well as the number of studies they publish in one year shows that there is a group of authors who specialize in bibliometric studies. This group is extremely small and contributes only 0.2% to the production of bibliometric studies. This study also showed that this can be a successful publication strategy that leads to relatively rapid acquisition of citations.
Author Contributions
Conceptualization, L.A.; methodology, L.A.; formal analysis, L.A.; investigation, L.A.; writing—original draft preparation, L.A.; writing—review and editing, L.A.; visualization, L.A.
Funding
This research received no external funding.
Institutional Review Board Statement
Not applicable.
Informed Consent Statement
Not applicable.
Data Availability Statement
The data that support the findings of this study are available on request from the corresponding author [L.A.]. The data are not publicly available due to restrictions of Scopus database.
Acknowledgments
In this section, you can acknowledge any support given which is not covered by the author contribution or funding sections. This may include administrative and technical support, or donations in kind (e.g., materials used for experiments).
Conflicts of Interest
The authors declare no conflicts of interest.
References
- Musselin, C. Transformed Publication Strategies. European Review 2024, 1–10. [Google Scholar] [CrossRef]
- Ansorge, L. Citační analýza časopisu VTEI. Vodohospodářské technicko-ekonomické informace 2022, 64, 47–54. [Google Scholar] [CrossRef]
- Ansorge, L. Srovnání citovanosti časopisu VTEI v databázích Web of Science a Scopus. Vodohospodářské technicko-ekonomické informace 2024, 66, 32–37. [Google Scholar]
- Garfield, E. The History and Meaning of the Journal Impact Factor. JAMA 2006, 295, 90–93. [Google Scholar] [CrossRef] [PubMed]
- Hirsch, J.E. An Index to Quantify an Individual’s Scientific Research Output. PNAS 2005, 102, 16569–16572. [Google Scholar] [CrossRef]
- Bergstrom, C. Eigenfactor: Measuring the Value and Prestige of Scholarly Journals. College & Research Libraries News 2007, 68, 314–316. [Google Scholar] [CrossRef]
- Colledge, L.; James, C.; Azoulay, N.; Meester, W.; Plume, A. CiteScore Metrics Are Suitable to Address Different Situations – A Case Study. European Science Editing 2017, 43, 27–31. [Google Scholar] [CrossRef]
- González-Pereira, B.; Guerrero-Bote, V.P.; Moya-Anegón, F. A New Approach to the Metric of Journals’ Scientific Prestige: The SJR Indicator. Journal of Informetrics 2010, 4, 379–391. [Google Scholar] [CrossRef]
- García-Villar, C.; García-Santos, J.M. Indicadores Bibliométricos Para Evaluar La Actividad Científica. Radiología 2021, 63, 228–235. [Google Scholar] [CrossRef]
- Joshi, M.A. Bibliometric Indicators for Evaluating the Quality of Scientific Publications. The Journal of Contemporary Dental Practice 2014, 15, 258–262. [Google Scholar] [CrossRef]
- Anyi, K.W.U.; Zainab, A.N.; Anuar, N.B. Bibliometric Studies on Single Journals: A Review. Malaysian Journal of Library and Information Science 2009, 14, 17–55. [Google Scholar]
- Vishwanathan, K.; Kambhampati, S.B.S.; Patralekh, M.K.; Vaish, A.; Vaishya, R. Bibliometric Analysis of the Top 50 Most Cited Publications of the Journal of Clinical Orthopaedics and Trauma. Journal of Clinical Orthopaedics & Trauma 2021, 22. [Google Scholar] [CrossRef]
- Yang, L.-C.; Liu, F.-H.; Liu, C.-M.; Yu, C.-H.; Chang, Y.-C. Bibliometric Analysis of Top-Cited Articles in Journal of Dental Sciences. Journal of Dental Sciences 2023, 18, 338–344. [Google Scholar] [CrossRef] [PubMed]
- Wilson, M.L. Topics, Author Profiles, and Collaboration Networks in the Journal of Research on Technology in Education: A Bibliometric Analysis of 20 Years of Research. Journal of Research on Technology in Education 2024, 56, 291–313. [Google Scholar] [CrossRef]
- Ellili, N.O.D. Bibliometric Analysis on Corporate Governance Topics Published in the Journal of Corporate Governance: The International Journal of Business in Society. Corporate Governance: The International Journal of Business in Society 2022, 23, 262–286. [Google Scholar] [CrossRef]
- Aristizabal, D.; Lara, A.; Payares, V.; Alzate, A. Bibliometric Analysis And Research Trends Of A Journal: Magazine Of Civil Engineering. Library Philosophy and Practice (e-journal), 2021. [Google Scholar]
- Parab, S.Y.; Thakkar, V. Trends in Research in Indian Journal of Anaesthesia – A Bibliometric Analysis. Indian Journal of Anaesthesia 2023, 67, 1130. [Google Scholar] [CrossRef]
- Donthu, N.; Lim, W.M.; Kumar, S.; Pattnaik, D. A Scientometric Study Of the Journal of Advertising Research: Prominent Contributors and Research Themes From 1996 to 2019. Journal of Advertising Research 2022, 62, 105–117. [Google Scholar] [CrossRef]
- Donthu, N.; Kumar, S.; Ranaweera, C.; Pattnaik, D.; Gustafsson, A. Mapping of Journal of Services Marketing Themes: A Retrospective Overview Using Bibliometric Analysis. Journal of Services Marketing 2021, 36, 340–363. [Google Scholar] [CrossRef]
- Baker, H.K.; Kumar, S.; Pattnaik, D. Research Constituents, Intellectual Structure, and Collaboration Pattern in the Journal of Forecasting: A Bibliometric Analysis. Journal of Forecasting 2021, 40, 577–602. [Google Scholar] [CrossRef]
- Yihua, W.; Meng, F.; Farrukh, M.; Raza, A.; Alam, I. Twelve Years of Research in The International Journal of Islamic and Middle Eastern Finance and Management: A Bibliometric Analysis. International Journal of Islamic and Middle Eastern Finance and Management 2022, 16, 154–174. [Google Scholar] [CrossRef]
- Carey, L.B.; Kumar, S.; Goyal, K.; Ali, F. A Bibliometric Analysis of the Journal of Religion and Health: Sixty Years of Publication (1961–2021). J Relig Health 2023, 62, 8–38. [Google Scholar] [CrossRef] [PubMed]
- Gureyev, V.N.; Mazov, N.A. Detection of Information Requirements of Researchers Using Bibliometric Analyses to Identify Target Journals. Information Technology and Libraries 2013, 32, 66–77. [Google Scholar] [CrossRef]
- Zhang, Y.; Yu, Q. What Is the Best Article Publishing Strategy for Early Career Scientists? Scientometrics 2020, 122, 397–408. [Google Scholar] [CrossRef]
- Nicholas, D.; Rodríguez-Bravo, B.; Watkinson, A.; Boukacem-Zeghmouri, C.; Herman, E.; Xu, J.; Abrizah, A.; Świgoń, M. Early Career Researchers and Their Publishing and Authorship Practices. Learned Publishing 2017, 30, 205–217. [Google Scholar] [CrossRef]
- Śpiewanowski, P.; Talavera, O. Journal Rankings and Publication Strategy. Scientometrics 2021, 126, 3227–3242. [Google Scholar] [CrossRef]
- Coronel, R. On Publication Strategies. Another Advice to a Beginning Scientist. Front. Physiol. 2020, 11. [Google Scholar] [CrossRef]
- Lund, B. How to Select Better Topics and Design Better Bibliometrics and Scientometrics Studies: A Perspective. Journal of Scientometric Research 2021, 10, 348–351. [Google Scholar] [CrossRef]
- Donthu, N.; Kumar, S.; Mukherjee, D.; Pandey, N.; Lim, W.M. How to Conduct a Bibliometric Analysis: An Overview and Guidelines. Journal of Business Research 2021, 133, 285–296. [Google Scholar] [CrossRef]
- Öztürk, O.; Kocaman, R.; Kanbach, D.K. How to Design Bibliometric Research: An Overview and a Framework Proposal. Rev Manag Sci 2024. [Google Scholar] [CrossRef]
- Montazeri, A.; Mohammadi, S.; M. Hesari, P.; Ghaemi, M.; Riazi, H.; Sheikhi-Mobarakeh, Z. Preliminary Guideline for Reporting Bibliometric Reviews of the Biomedical Literature (BIBLIO): A Minimum Requirements. Systematic Reviews 2023, 12, 239. [Google Scholar] [CrossRef]
- Baas, J.; Schotten, M.; Plume, A.; Côté, G.; Karimi, R. Scopus as a Curated, High-Quality Bibliometric Data Source for Academic Research in Quantitative Science Studies. Quantitative Science Studies 2020, 1, 377–386. [Google Scholar] [CrossRef]
- Birkle, C.; Pendlebury, D.A.; Schnell, J.; Adams, J. Web of Science as a Data Source for Research on Scientific and Scholarly Activity. Quantitative Science Studies 2020, 1, 363–376. [Google Scholar] [CrossRef]
- Thelwall, M. Dimensions: A Competitor to Scopus and the Web of Science? Journal of Informetrics 2018, 12, 430–435. [Google Scholar] [CrossRef]
- Priem, J.; Piwowar, H.; Orr, R. OpenAlex: A Fully-Open Index of Scholarly Works, Authors, Venues, Institutions, and Concepts. In Proceedings of the Proceedings of the 26th International Conference on Science and Technology Indicators; Faculty of Communication and Documentation, University of Granada: Granada, Spain, September 7 2022; p. sti22193. [Google Scholar]
- Hendricks, G.; Tkaczyk, D.; Lin, J.; Feeney, P. Crossref: The Sustainable Source of Community-Owned Scholarly Metadata. Quantitative Science Studies 2020, 1, 414–427. [Google Scholar] [CrossRef]
- Moral-Muñoz, J.A.; Herrera-Viedma, E.; Santisteban-Espejo, A.; Cobo, M.J. Software Tools for Conducting Bibliometric Analysis in Science: An up-to-Date Review. Profesional de la Información 2020, 29. [Google Scholar] [CrossRef]
- Harzing, A.-W. Publish or Perish 2007.
- van Eck, N.J.; Waltman, L. Software Survey: VOSviewer, a Computer Program for Bibliometric Mapping. Scientometrics 2010, 84, 523–538. [Google Scholar] [CrossRef]
- Ruiz-Rosero, J.; Ramirez-Gonzalez, G.; Viveros-Delgado, J. Software Survey: ScientoPy, a Scientometric Tool for Topics Trend Analysis in Scientific Publications. Scientometrics 2019, 121, 1165–1188. [Google Scholar] [CrossRef]
- Aria, M.; Cuccurullo, C. Bibliometrix: An R-Tool for Comprehensive Science Mapping Analysis. Journal of Informetrics 2017, 11, 959–975. [Google Scholar] [CrossRef]
- OECD Frascati Manual 2015: Guidelines for Collecting and Reporting Data on Research and Experimental Development; Organisation for Economic Co-operation and Development: Paris, 2015.
- van Eck, N.J.; Waltman, L. VOS: A New Method for Visualizing Similarities between Objects. In Proceedings of the Advances in Data Analysis; Decker, R., Lenz, H.-J., Eds.; Springer: Berlin, Heidelberg, 2007; pp. 299–306. [Google Scholar]
- Kolesnikov, S.; Fukumoto, E.; Bozeman, B. Researchers’ Risk-Smoothing Publication Strategies: Is Productivity the Enemy of Impact? Scientometrics 2018, 116, 1995–2017. [Google Scholar] [CrossRef]
Figure 1.
Number of bibliometric/scientometric studies/analysis (source: Scopus 18-07-2024).
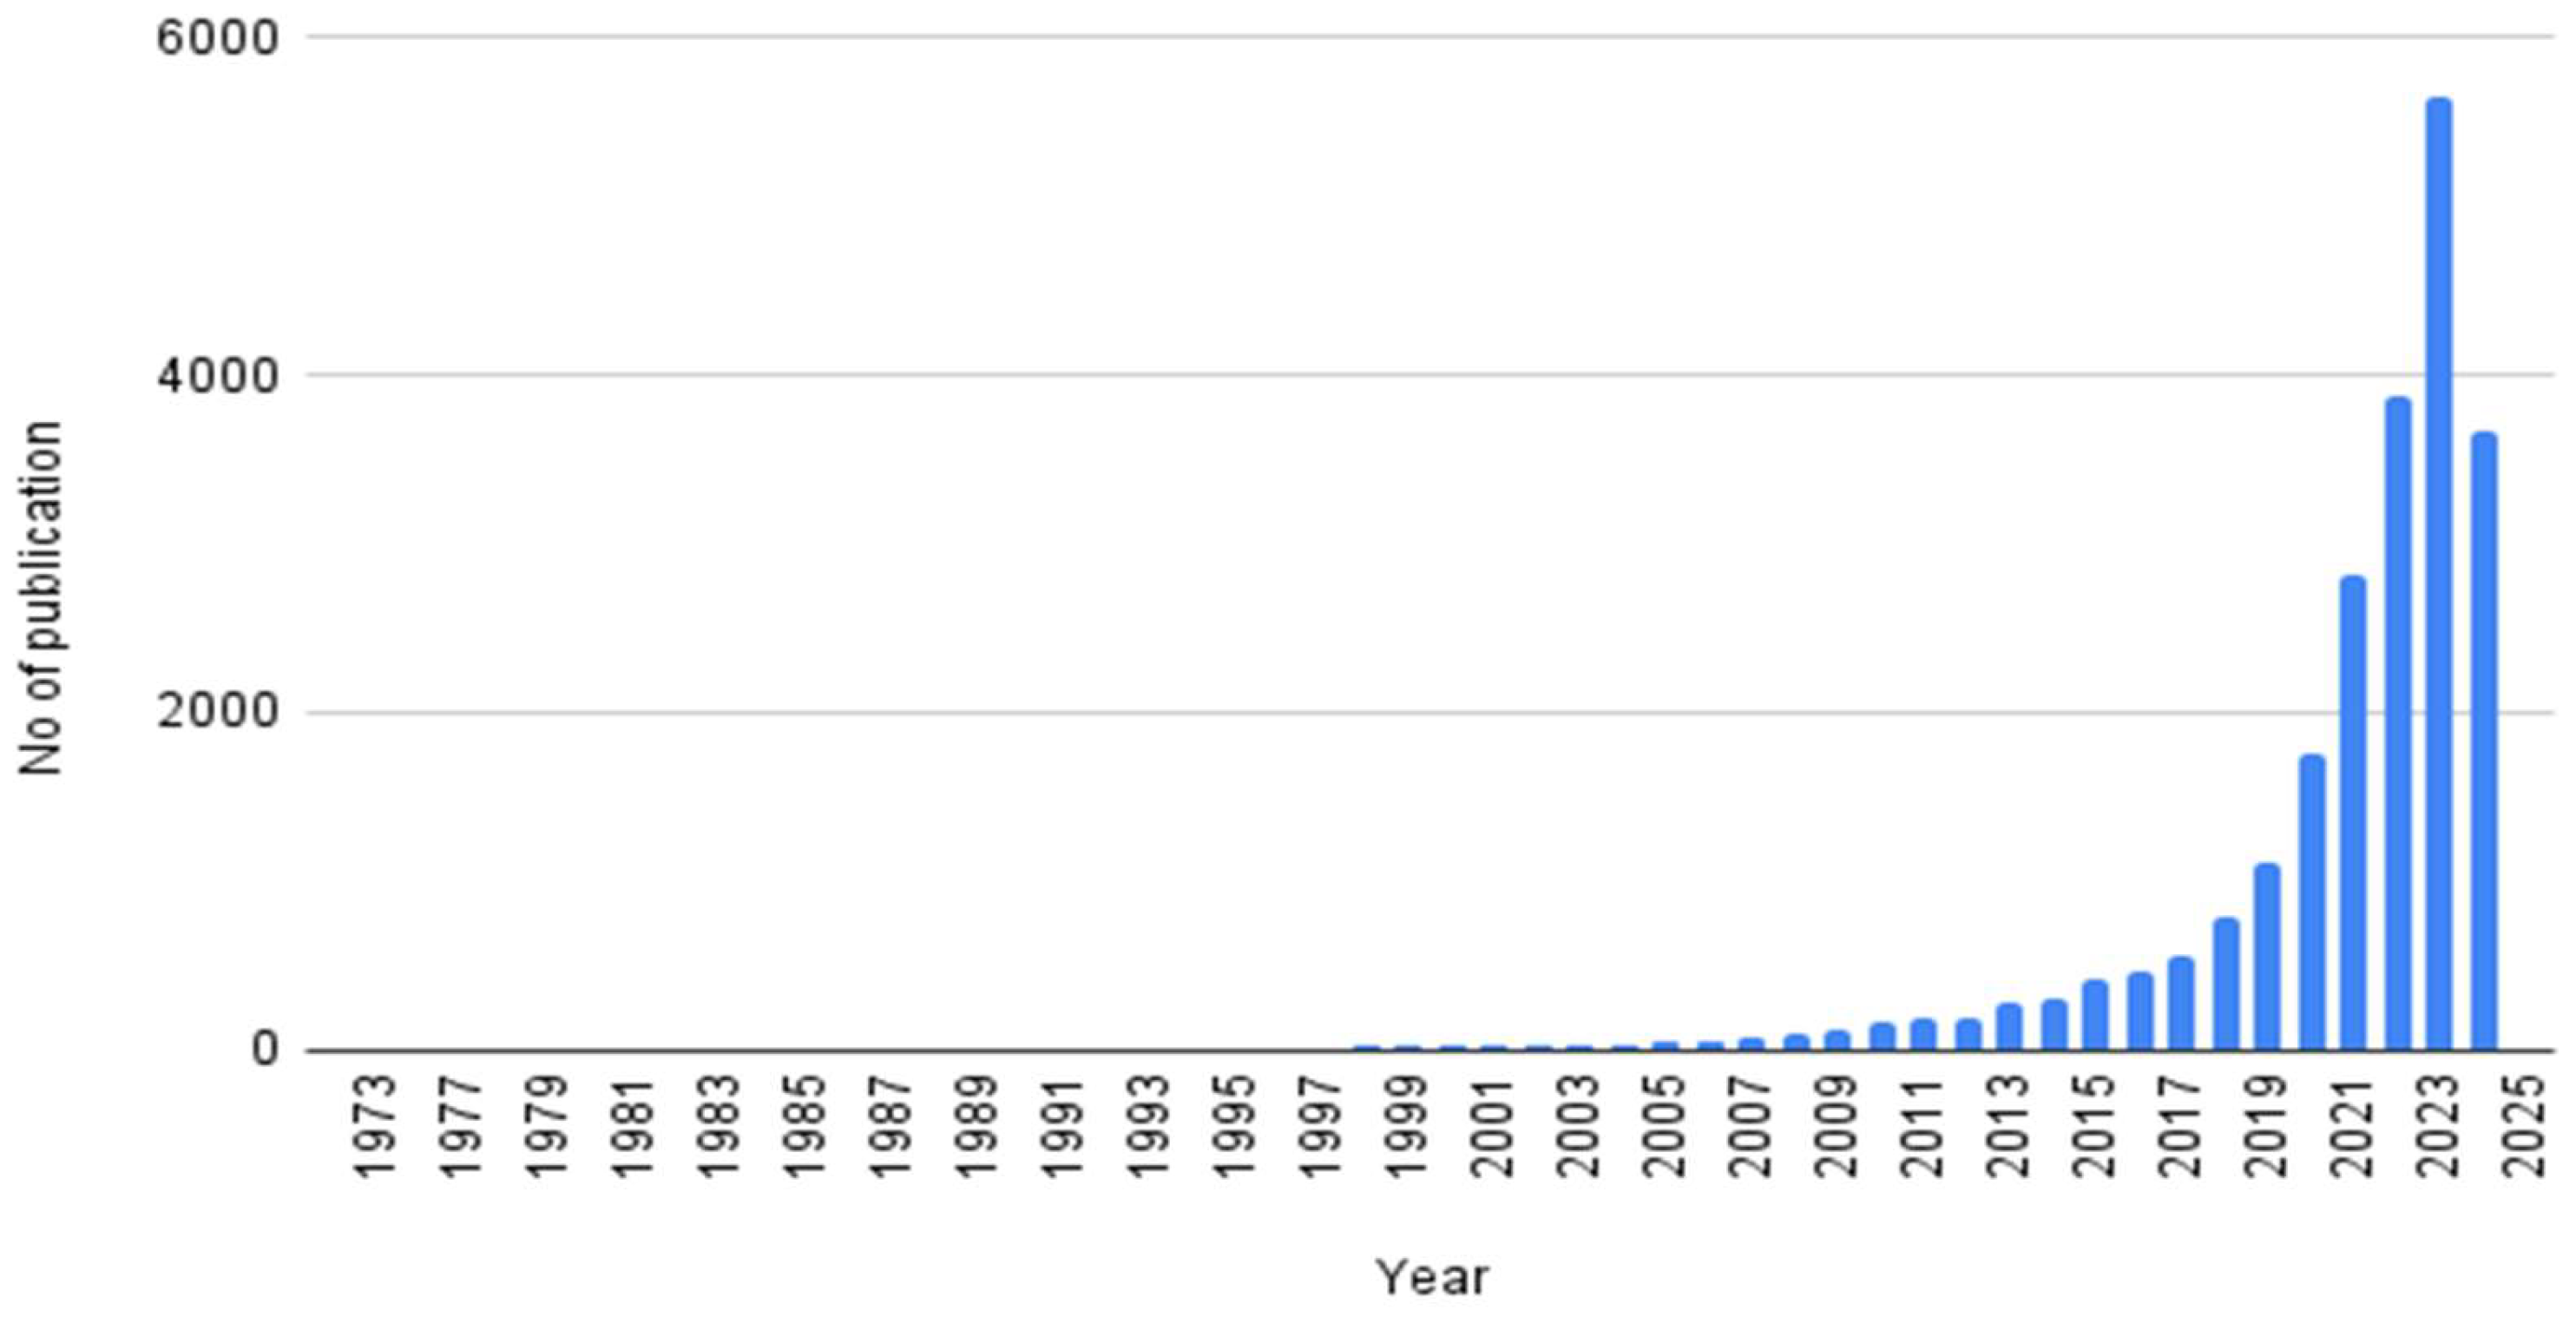
Figure 2.
Scatter plots of total citations and citations per year of bibliometric studies versus total publications of bibliometric studies of 49 authors. Solid curves are best-fitted regression models for scatter plot data.
Figure 2.
Scatter plots of total citations and citations per year of bibliometric studies versus total publications of bibliometric studies of 49 authors. Solid curves are best-fitted regression models for scatter plot data.
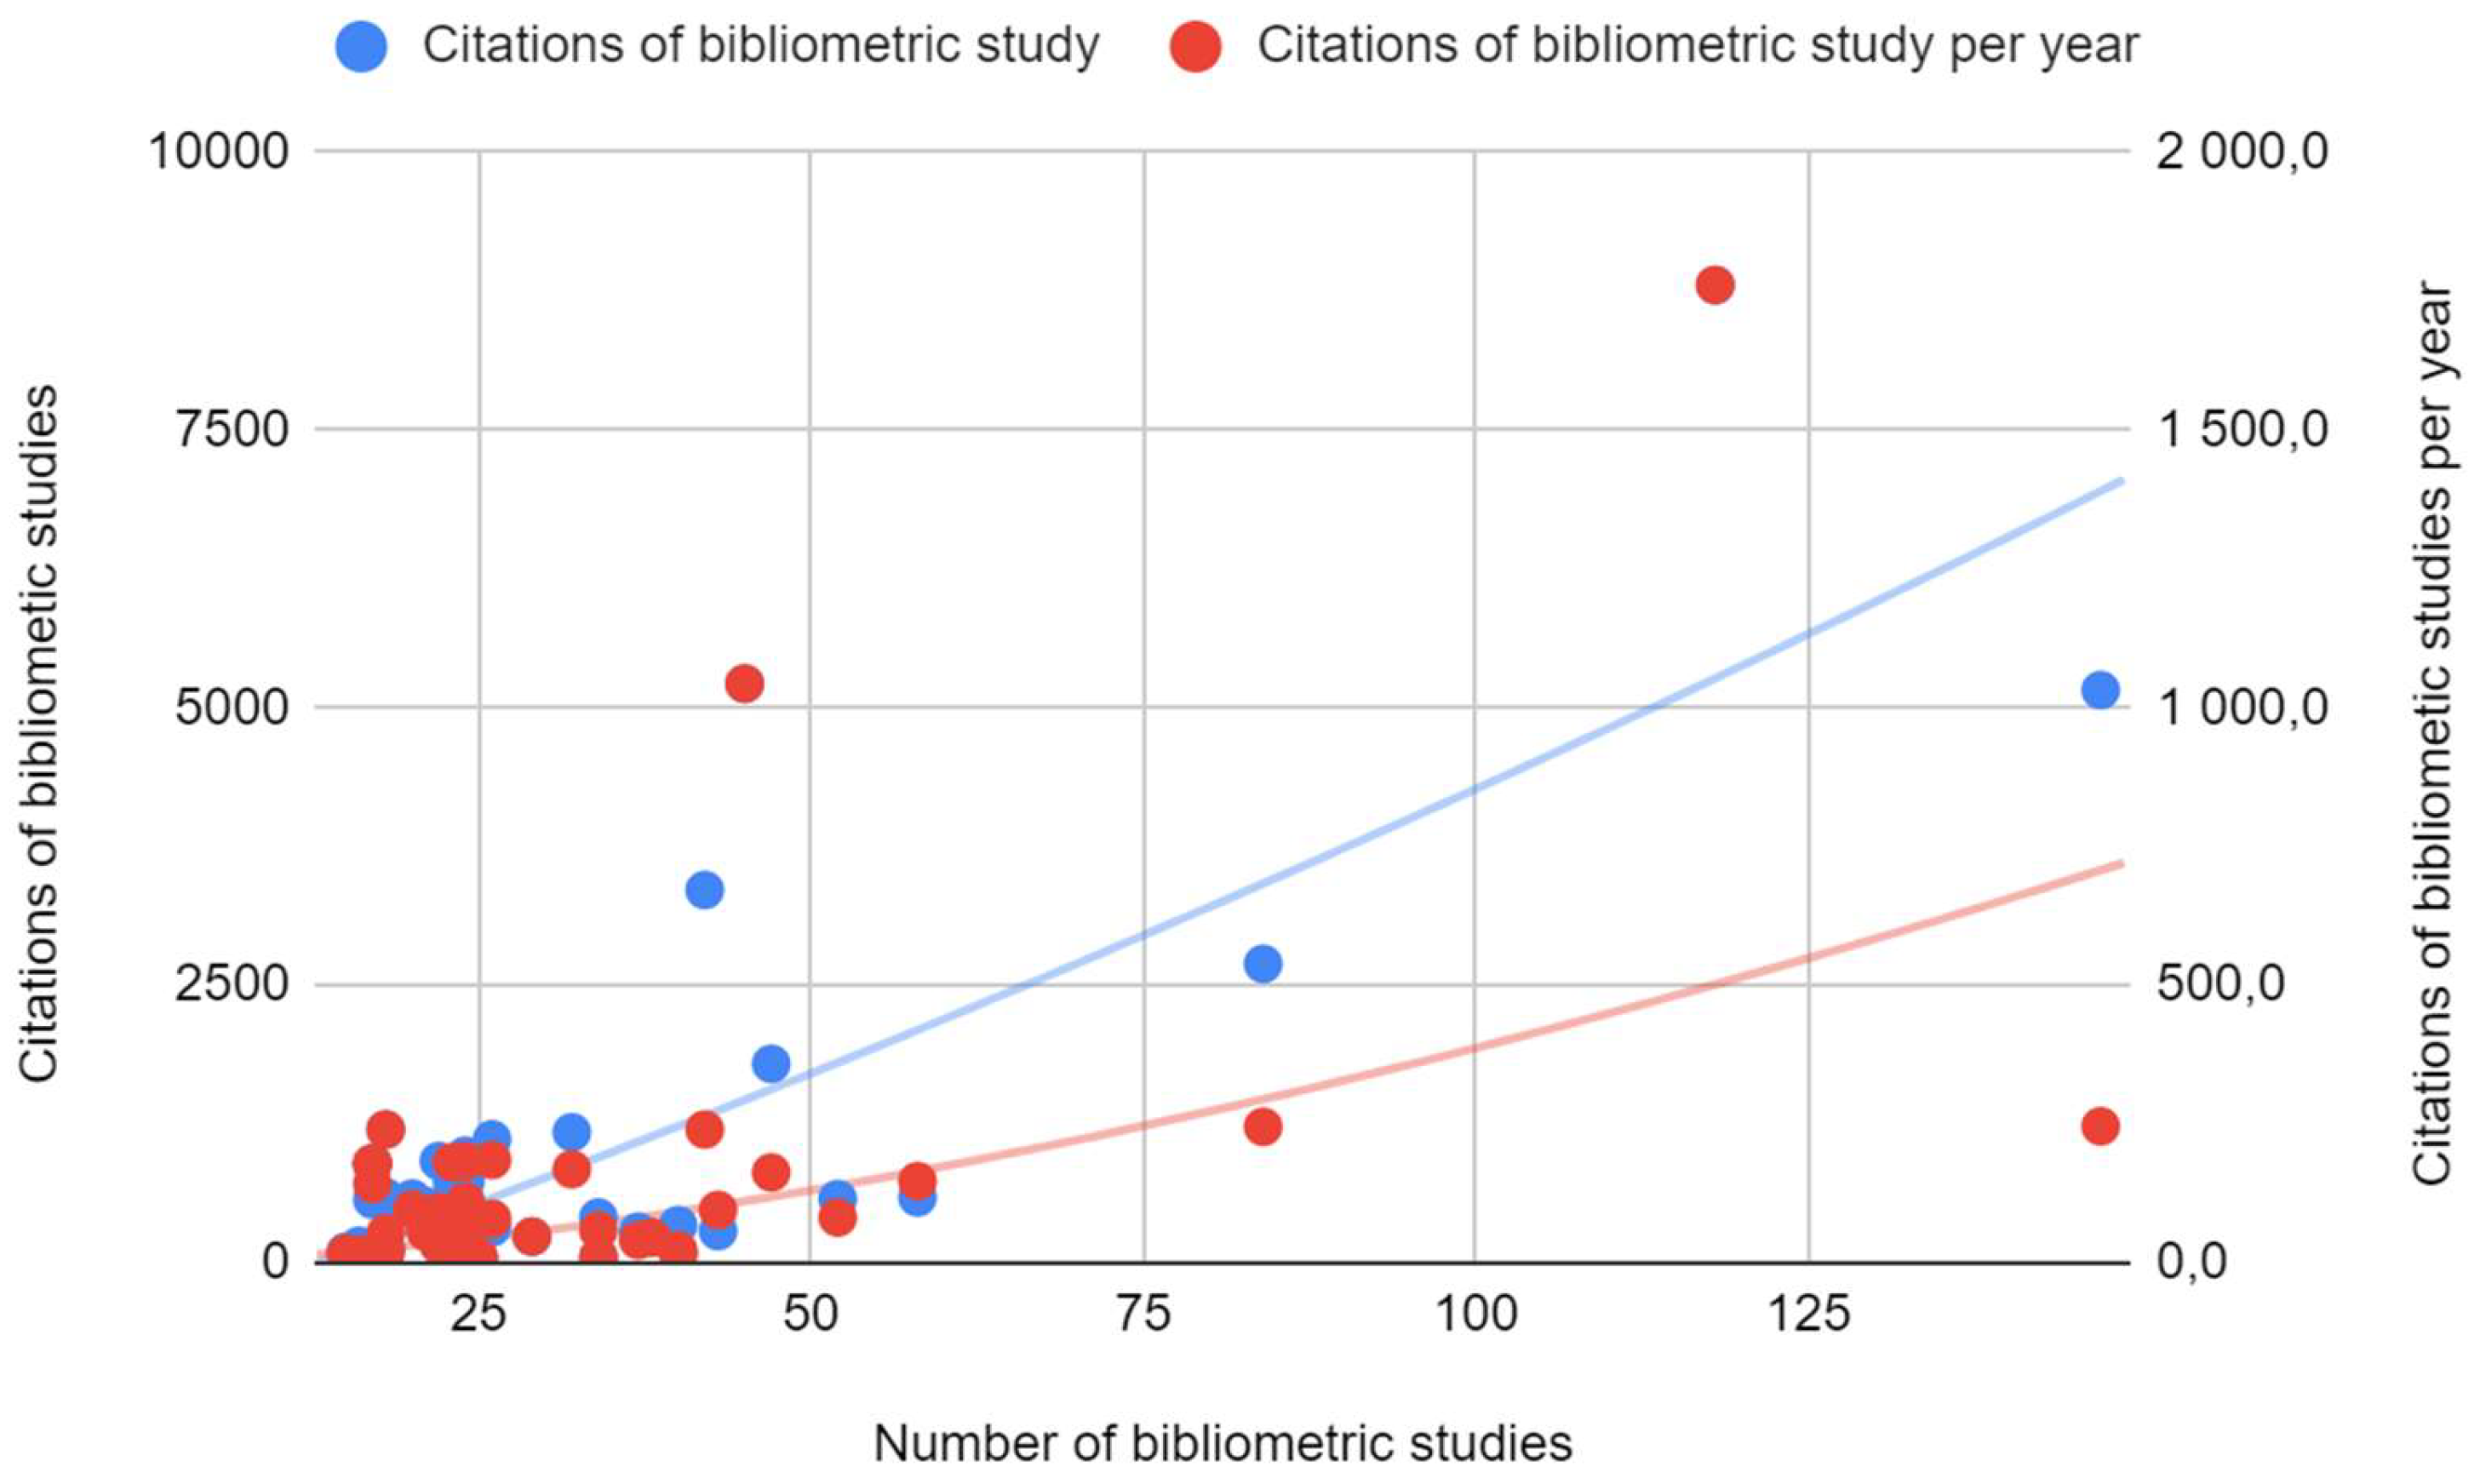
Figure 3.
Scatter plots of citations per bibliometric study and H-index versus total publications of bibliometric studies of 49 authors. Solid curves are best-fitted regression models for scatter plot data.
Figure 3.
Scatter plots of citations per bibliometric study and H-index versus total publications of bibliometric studies of 49 authors. Solid curves are best-fitted regression models for scatter plot data.
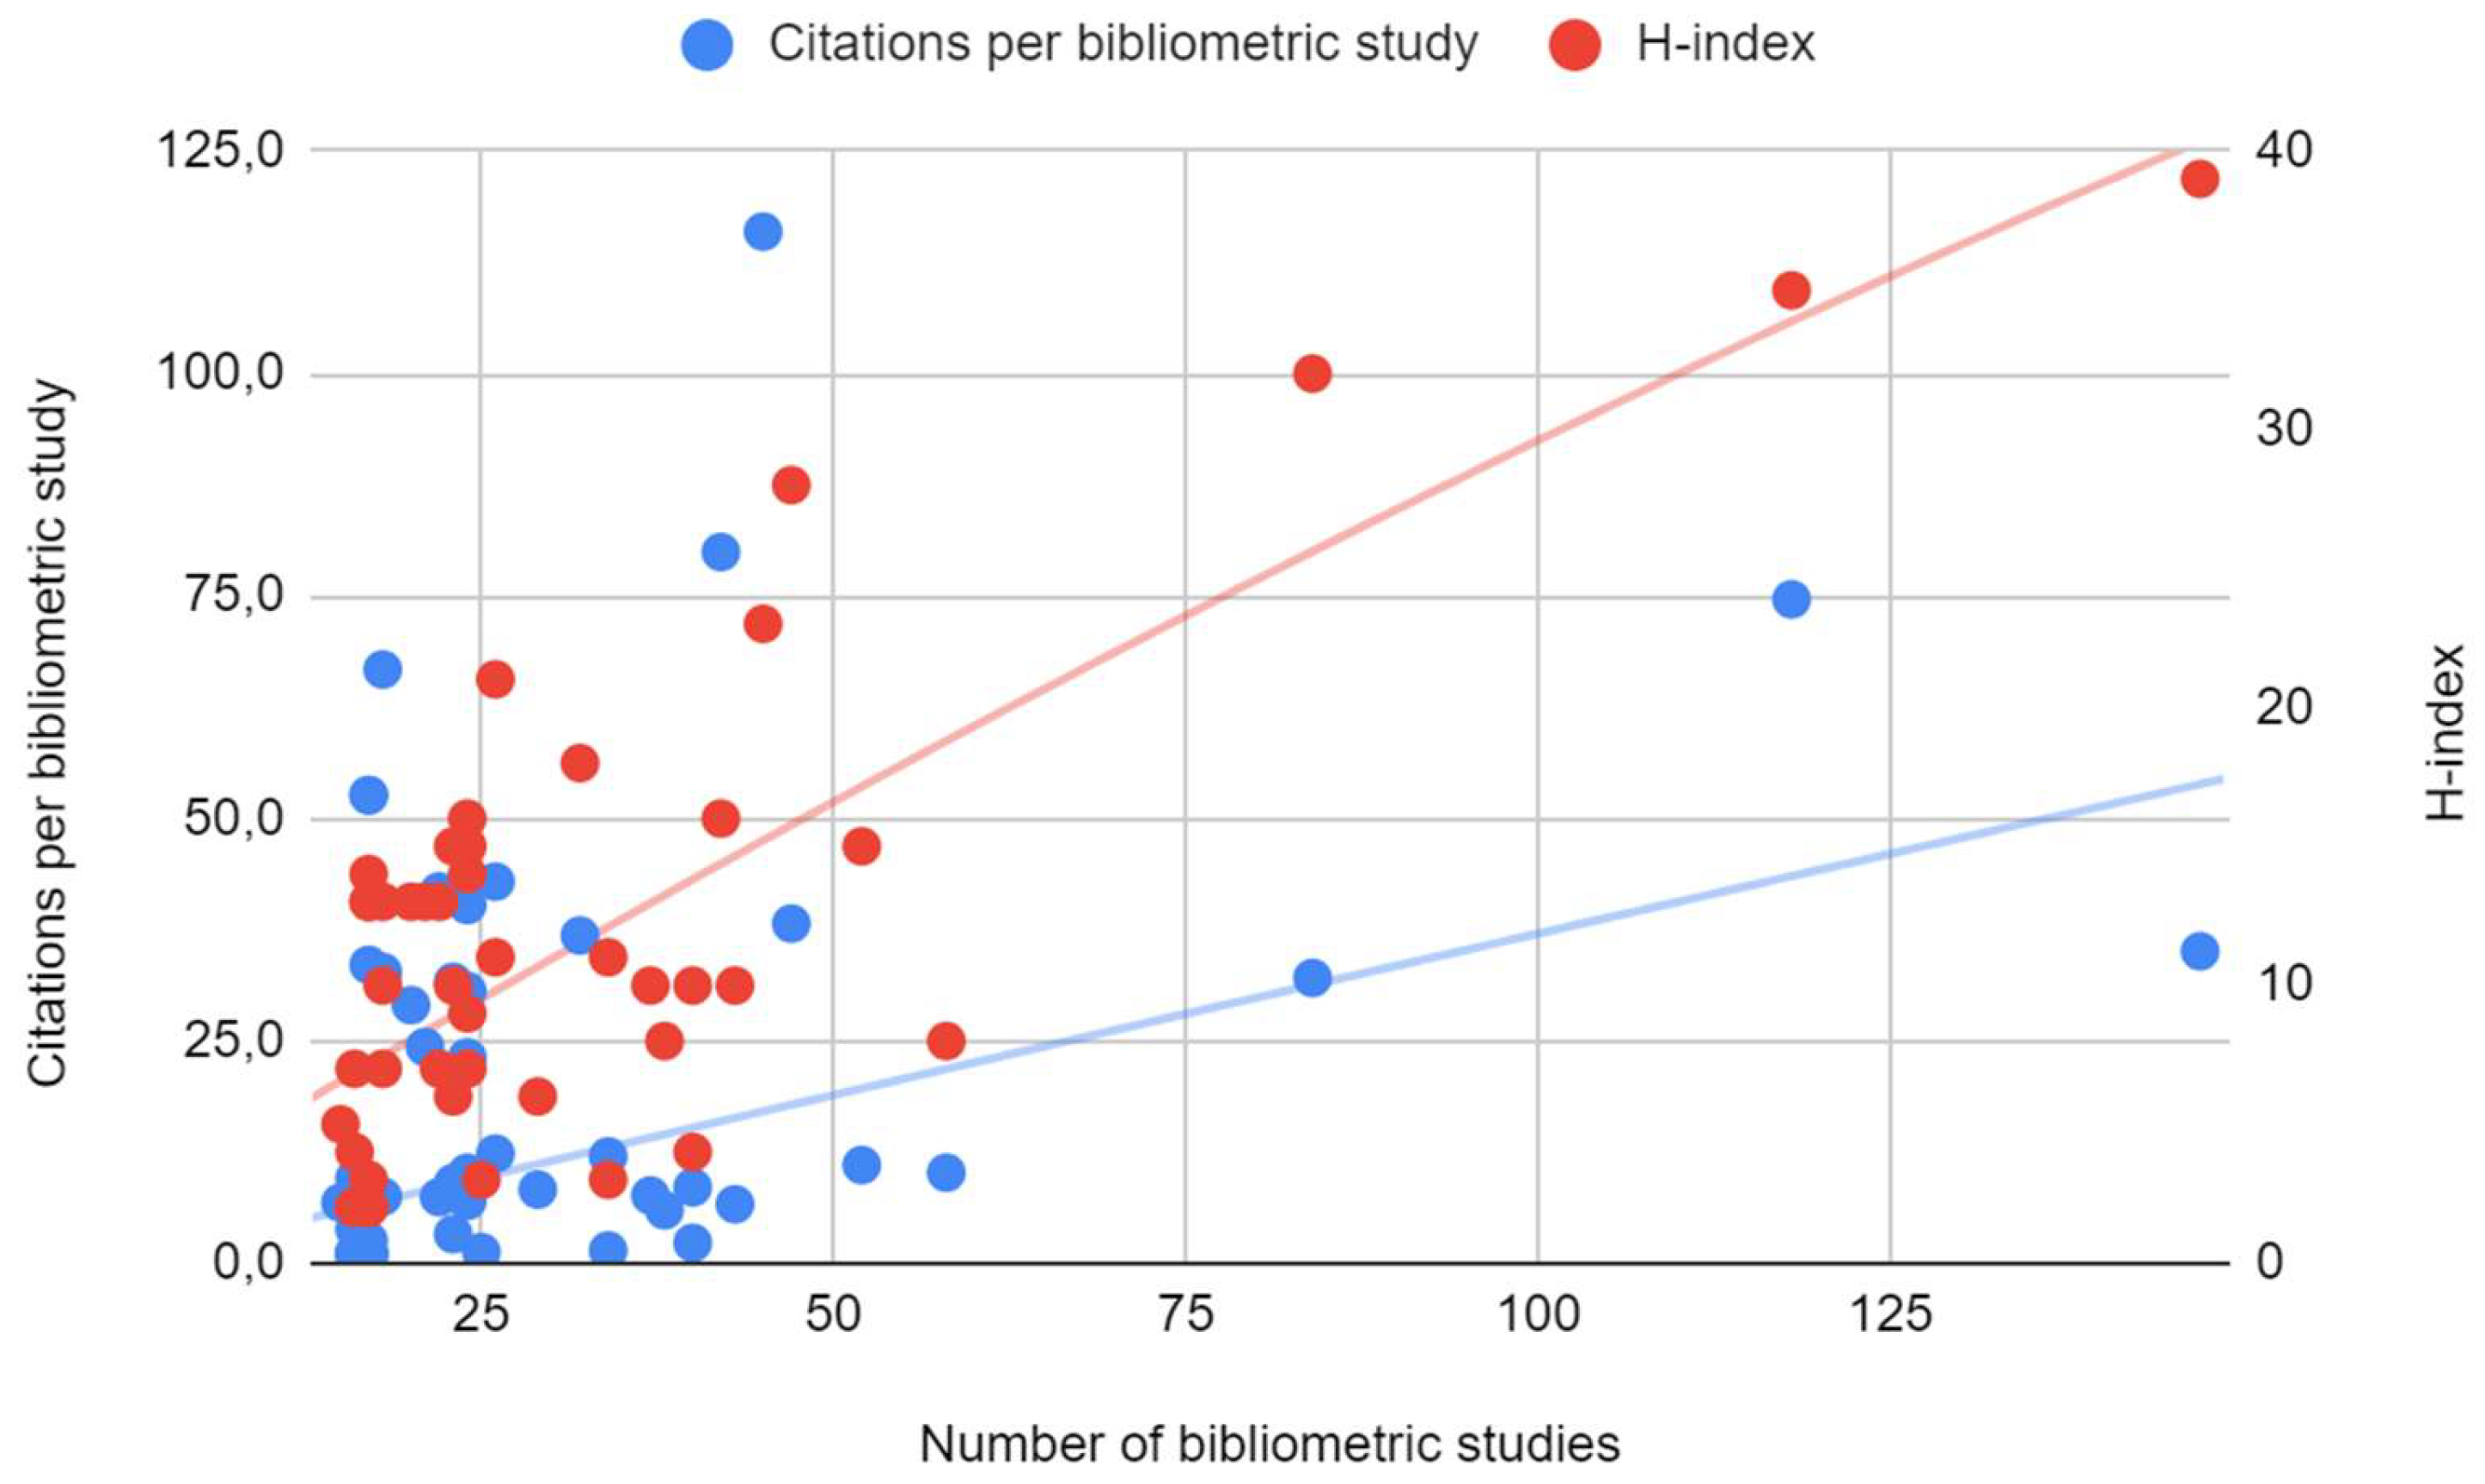
Figure 4.
Collaborative networks of authors who have published at least 15 bibliometric studies and (probably) included bibliometric studies in their publication strategy.
Figure 4.
Collaborative networks of authors who have published at least 15 bibliometric studies and (probably) included bibliometric studies in their publication strategy.
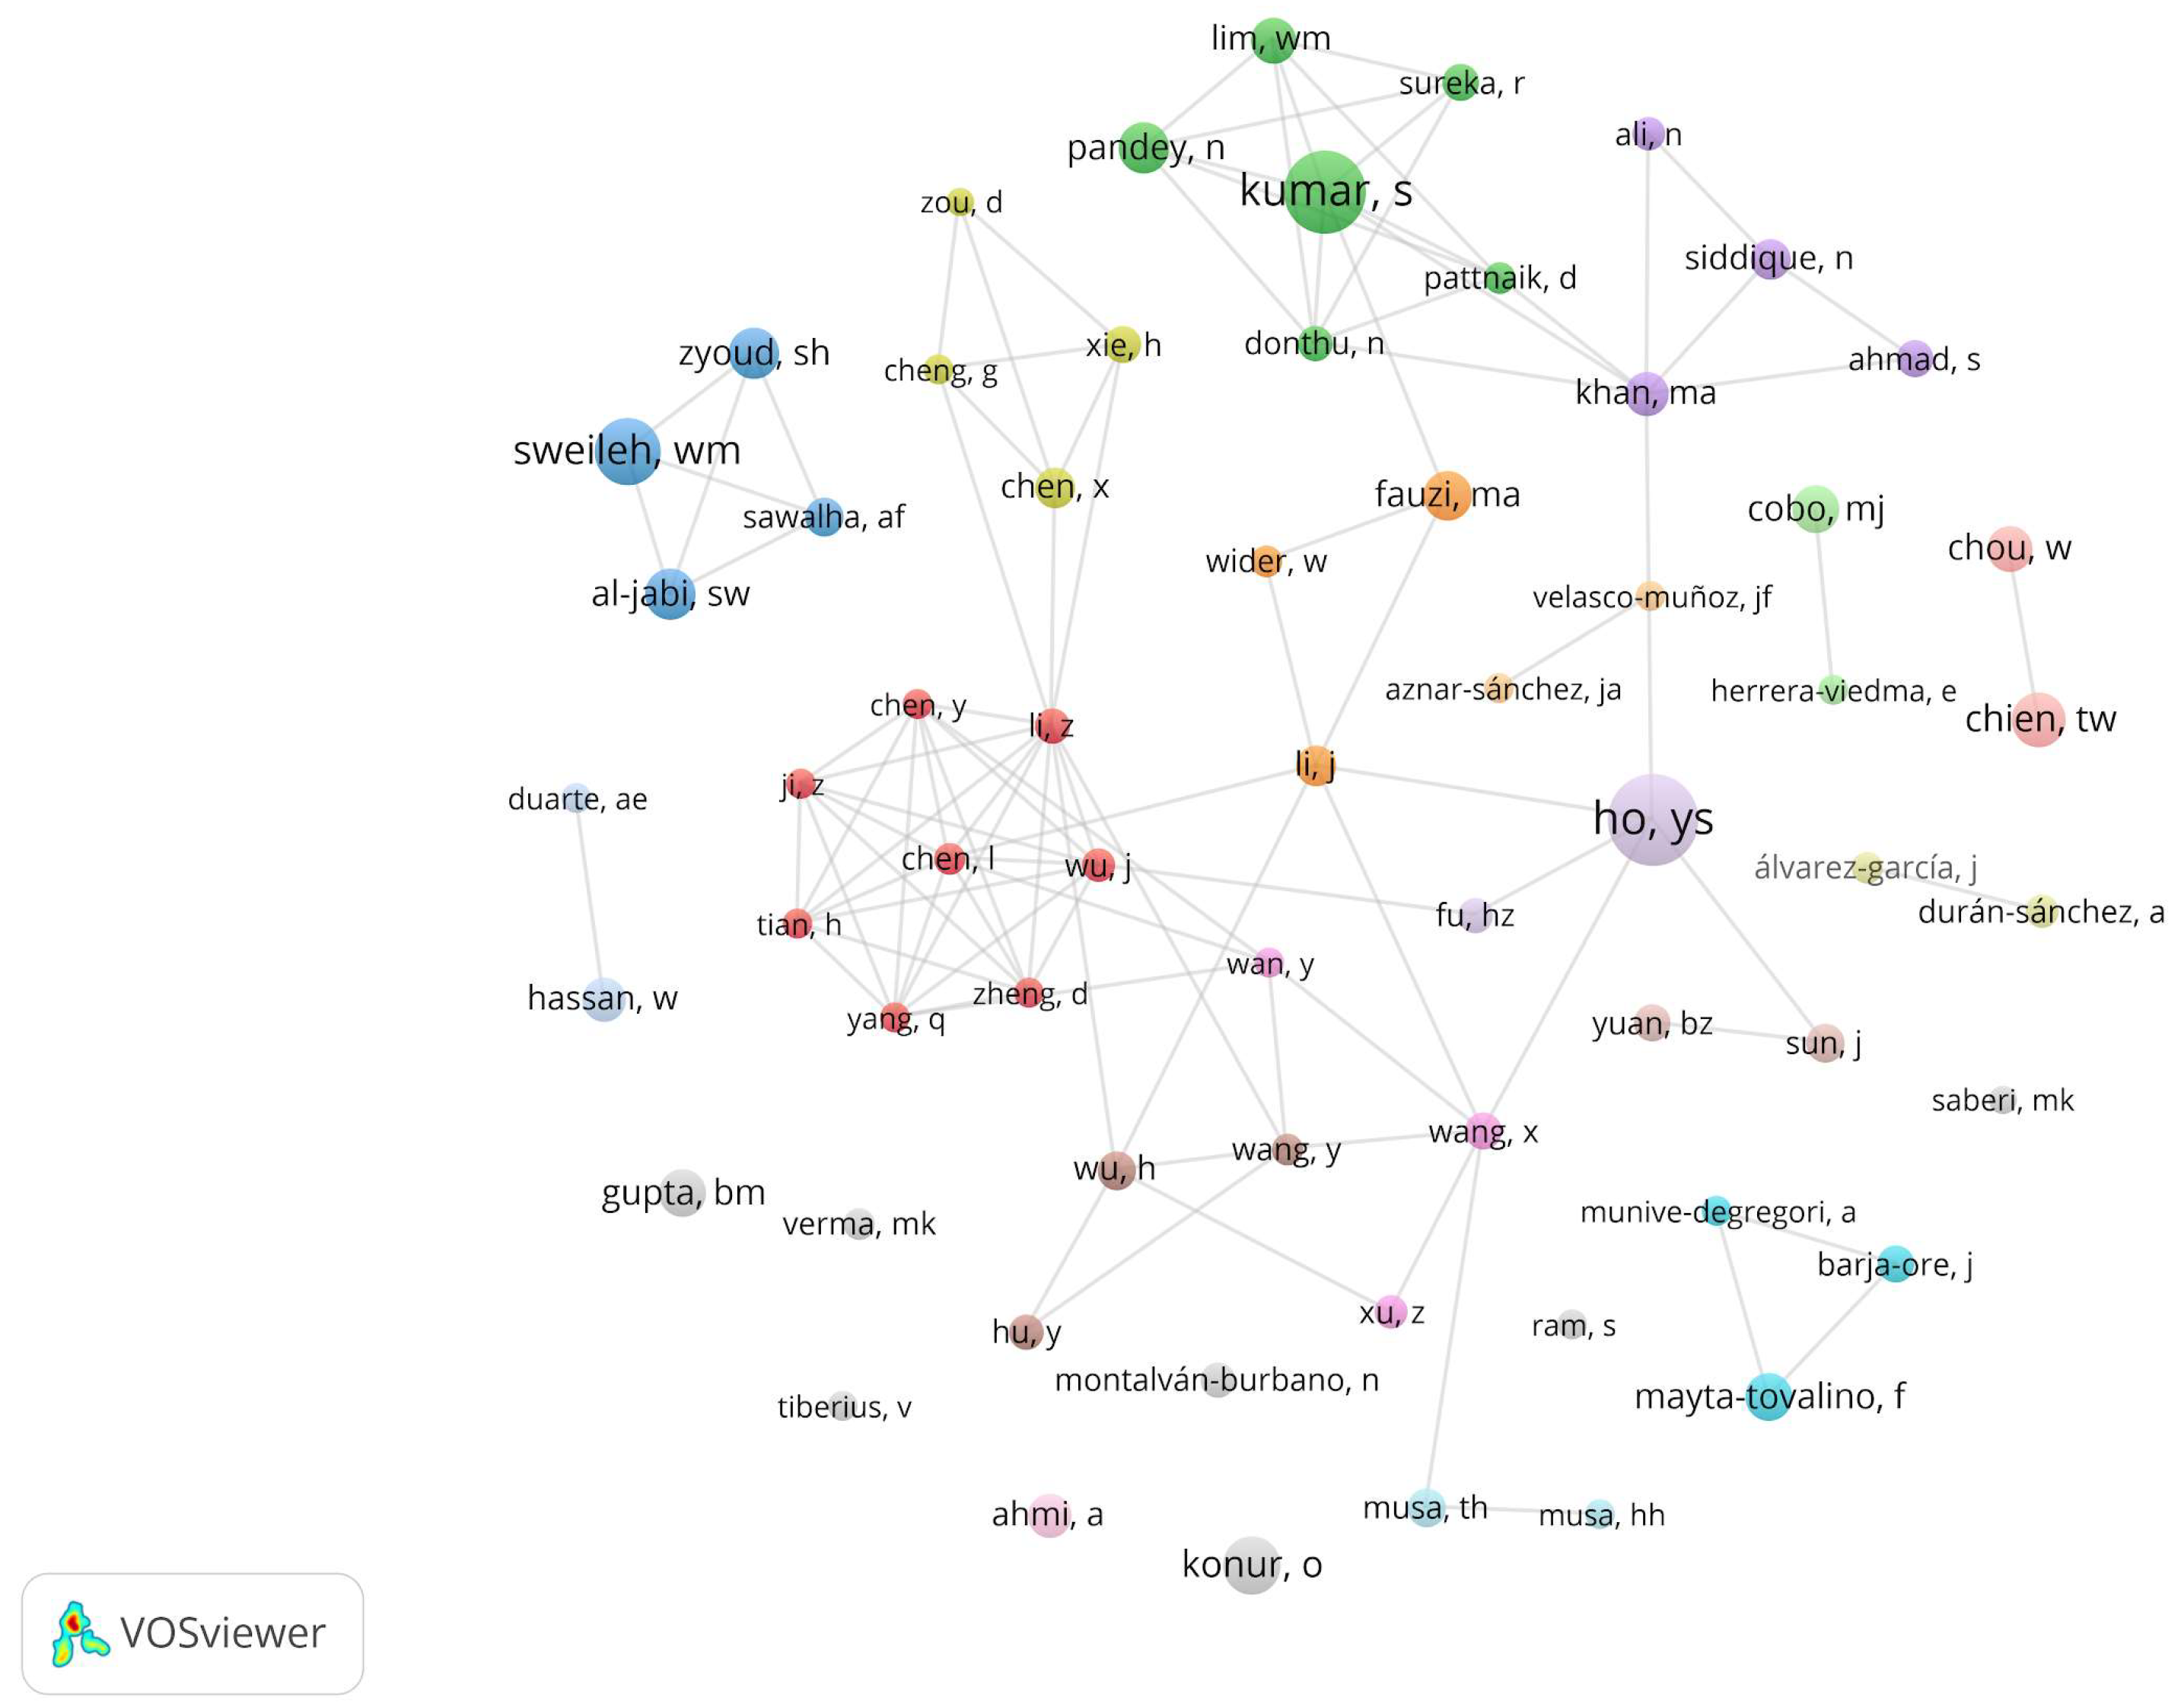
Figure 5.
Collaborative networks of countries from which authors come who (probably) included bibliometric studies in their publication strategy.
Figure 5.
Collaborative networks of countries from which authors come who (probably) included bibliometric studies in their publication strategy.
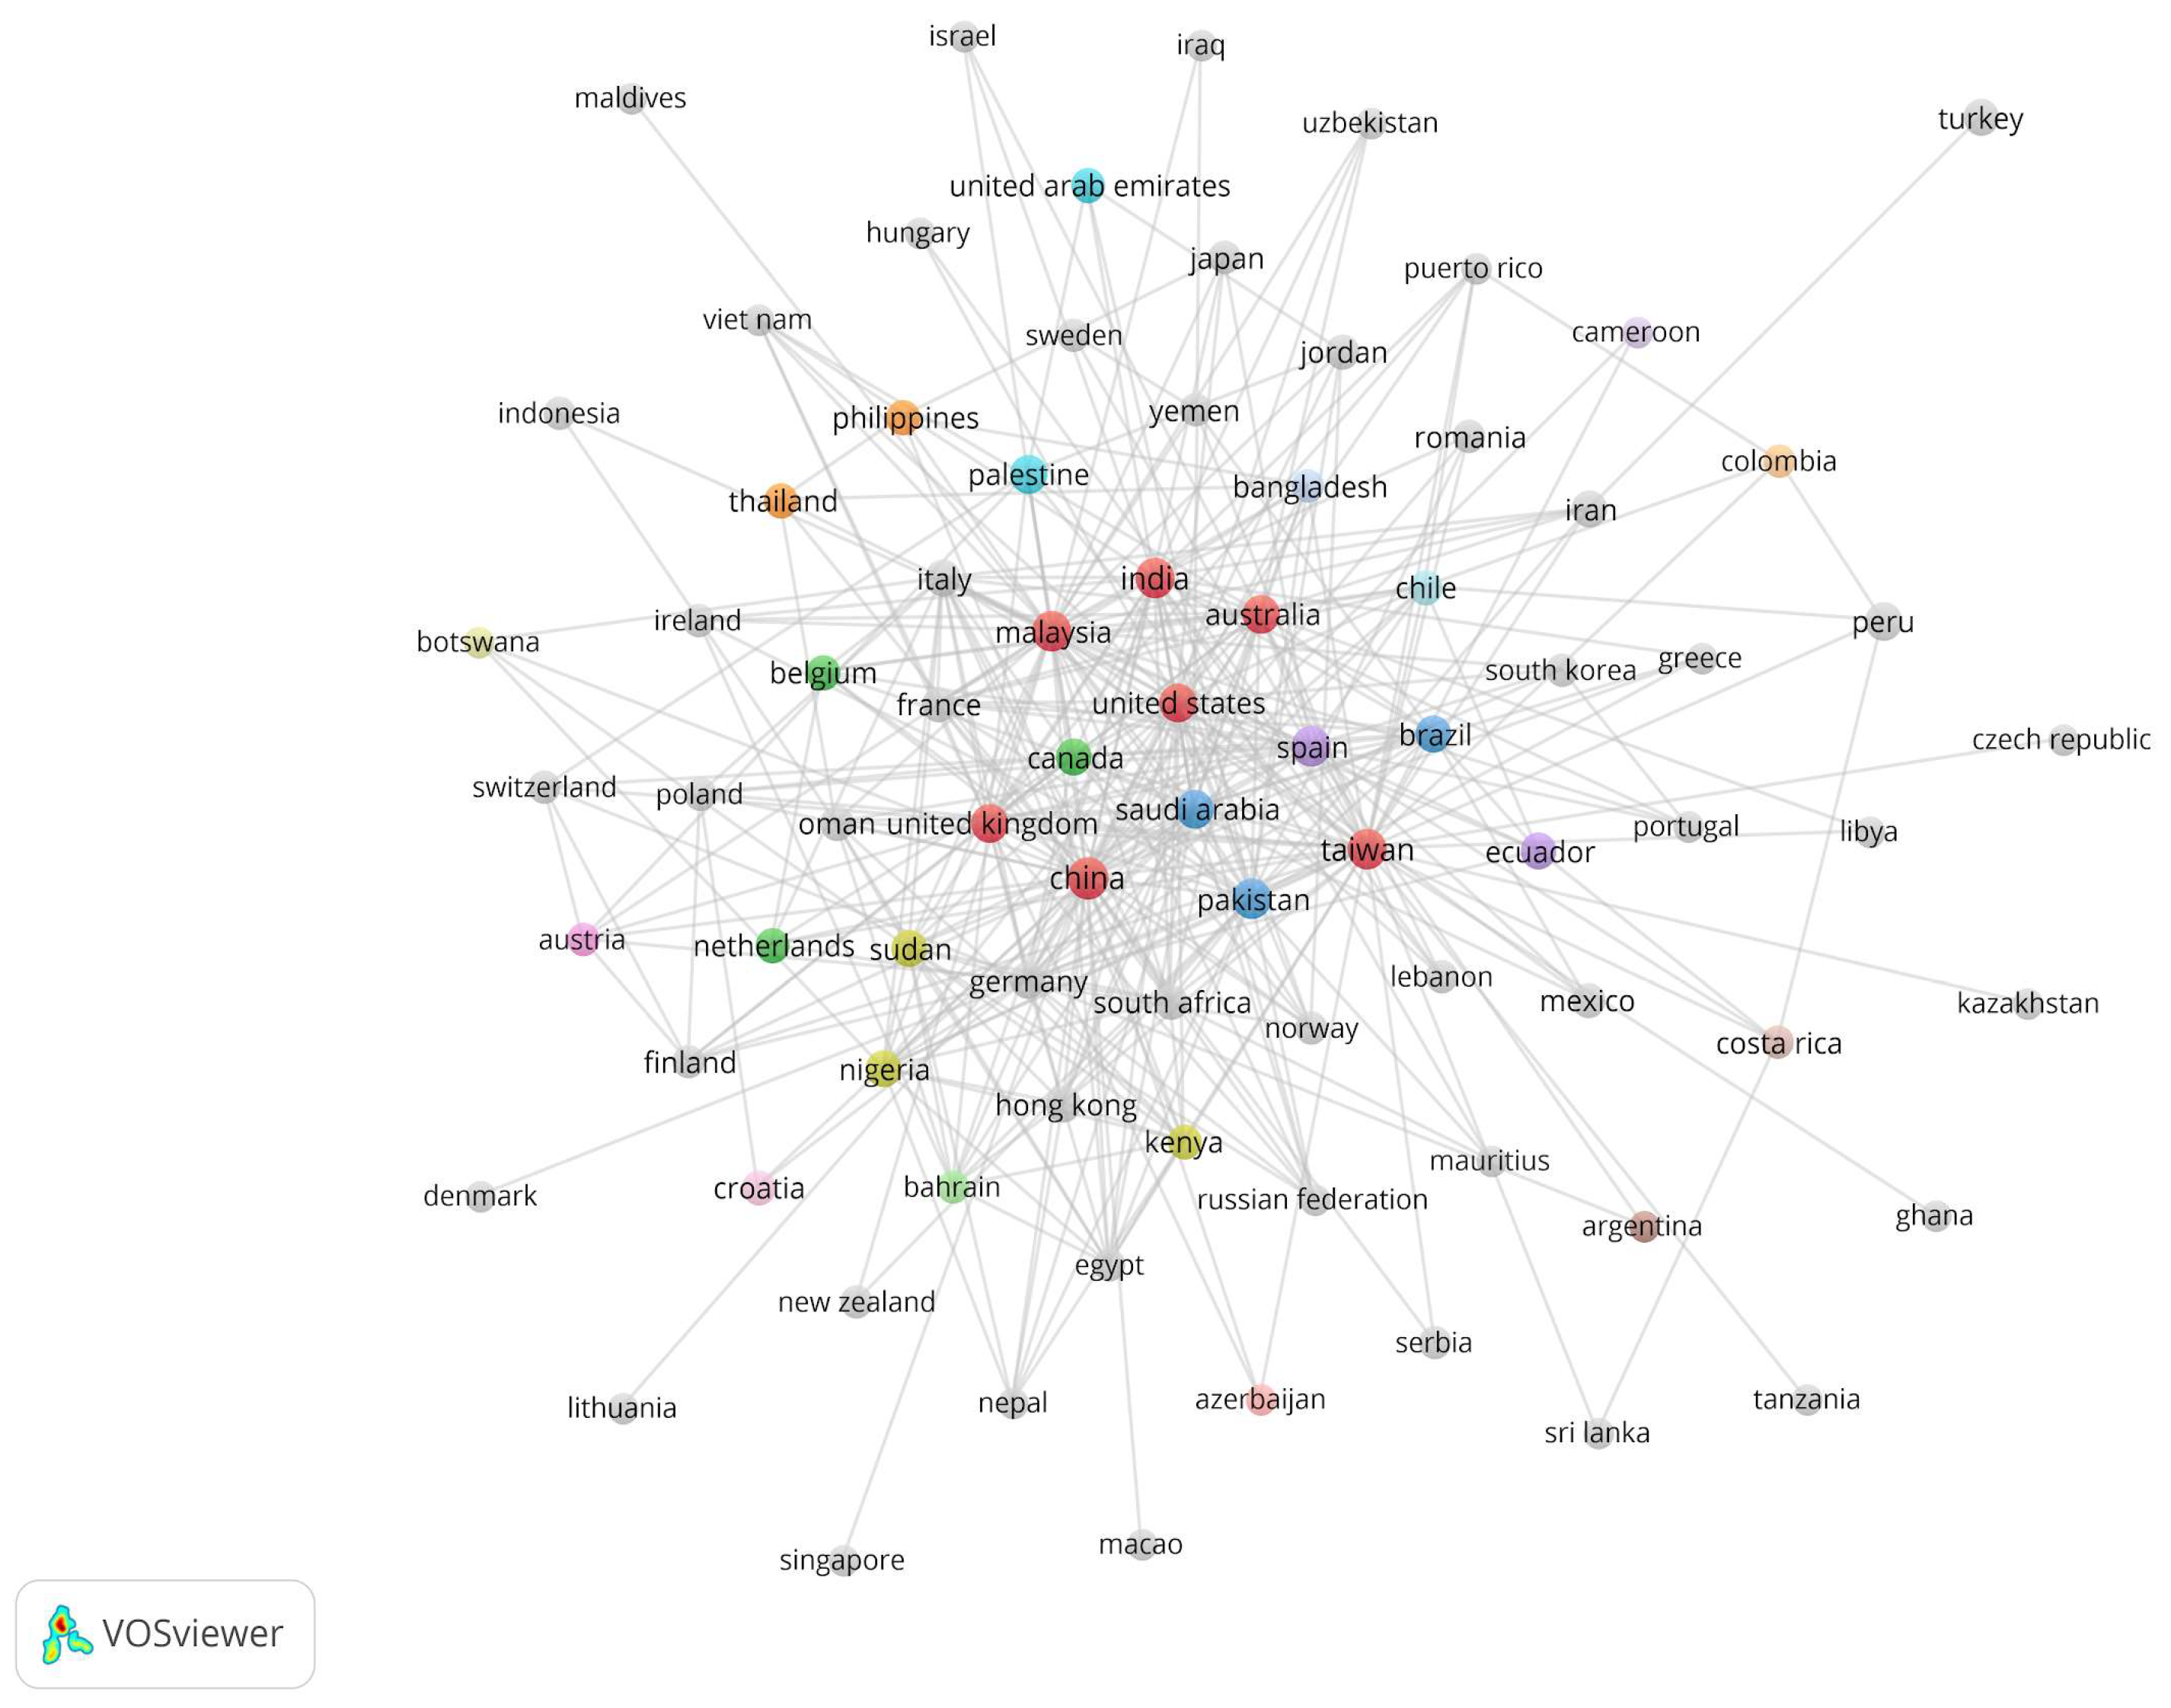

Table 1.
Number of authors according to the share of bibliometric studies in their publications.
| Share of bibliometric studies | 0.1-24.9% | 25.0-49.9 % | 50.0-74.9% | 75.0-100.0 % |
|---|---|---|---|---|
| Number of authors | 51 | 35 | 8 | 6 |
Table 2.
Number of publications and citations of the author from all his publications (T) and from bibliometric studies (B) for authors for whom bibliometric studies make up the majority of their publications.
Table 2.
Number of publications and citations of the author from all his publications (T) and from bibliometric studies (B) for authors for whom bibliometric studies make up the majority of their publications.
| Author | AU-ID | TP(T) | TP(B) | TP(B)/TP(T) | TC(T) | TC(B) | TC(B)/TC(T) |
|---|---|---|---|---|---|---|---|
| Pandey, N. | 57211577722 | 54 | 45 | 83.33% | 5,630 | 5,218 | 92.68% |
| Khan, M.A. | 58159005100 | 46 | 38 | 82.61% | 245 | 227 | 92.65% |
| Ali, N. | 57215970226 | 28 | 23 | 82.14% | 99 | 75 | 75.76% |
| Sun, J. | 55716207000 | 27 | 22 | 81.48% | 229 | 163 | 71.18% |
| Yang, Q. | 57819576200 | 21 | 16 | 76.19% | 46 | 15 | 32.61% |
| Sureka, R. | 57211688395 | 32 | 24 | 75.00% | 742 | 556 | 74.93% |
| Tian, H. | 57820440500 | 23 | 17 | 73.91% | 51 | 15 | 29.41% |
| Zheng, D. | 57789410300 | 23 | 17 | 73.91% | 33 | 19 | 57.58% |
| Wu, J. | 57789839000 | 25 | 17 | 68.00% | 37 | 19 | 51.35% |
| Chen, L. | 57788554900 | 25 | 16 | 64.00% | 38 | 19 | 50.00% |
| She, Z. | 57789623900 | 26 | 16 | 61.54% | 38 | 19 | 50.00% |
| Montalván-Burbano, N. | 57210814655 | 39 | 23 | 58.97% | 941 | 728 | 77.36% |
| Siddique, N. | 24173820100 | 51 | 29 | 56.86% | 408 | 240 | 58.82% |
| Chen, X. | 57031196900 | 64 | 32 | 50.00% | 2,309 | 1,179 | 51.06% |
AU-ID - author Scopus ID; TP(T) - total number of publications of the author; TP(B) - total number of author’s bibliometric studies; TC(T) - total number of author’s citations; TC(B) - total number of citations of author’s bibliometric studies.
Table 3.
Number of publications and citations of the author from all his publications (T) and from bibliometric studies (B) for authors for whom bibliometric studies make up the majority of their publications.
Table 3.
Number of publications and citations of the author from all his publications (T) and from bibliometric studies (B) for authors for whom bibliometric studies make up the majority of their publications.
| Author | AU-ID | H(T) | H(B) | TP(B)/H(B) | TC(B)/H(B) | TP(B)/years |
|---|---|---|---|---|---|---|
| Pandey, N. | 57211577722 | 26 | 26 | 26 | 26 | 26 |
| Khan, M.A. | 58159005100 | 23 | 23 | 23 | 23 | 23 |
| Ali, N. | 57215970226 | 2.0 | 2.0 | 2.0 | 2.0 | 2.0 |
| Sun, J. | 55716207000 | 226.9 | 226.9 | 226.9 | 226.9 | 226.9 |
| Yang, Q. | 57819576200 | 9.0 | 9.0 | 9.0 | 9.0 | 9.0 |
| Sureka, R. | 57211688395 | 9 | 9 | 9 | 9 | 9 |
| Tian, H. | 57820440500 | 8 | 8 | 8 | 8 | 8 |
| Zheng, D. | 57789410300 | 4.1 | 4.1 | 4.1 | 4.1 | 4.1 |
| Wu, J. | 57789839000 | 28.4 | 28.4 | 28.4 | 28.4 | 28.4 |
| Chen, L. | 57788554900 | 7.6 | 7.6 | 7.6 | 7.6 | 7.6 |
| She, Z. | 57789623900 | 6 | 6 | 6 | 6 | 6 |
| Montalván-Burbano, N. | 57210814655 | 6 | 6 | 6 | 6 | 6 |
| Siddique, N. | 24173820100 | 3.3 | 3.3 | 3.3 | 3.3 | 3.3 |
| Chen, X. | 57031196900 | 12.5 | 12.5 | 12.5 | 12.5 | 12.5 |
H(T) - H-index of the author from all his publications; H(B) - H-index of the author from bibliometric studies; TP(B)/H(B) - number of publications per 1 H-index point; TC(B)/H(B) - number of citations per 1 H-index point; TP(B)/years - average number of bibliometric studies published per year.
Table 4.
Countries with more than 15 bibliometric studies.
| Country | TP(B) | TC(B) | TC(B)/TP(B) | Country | TP(B) | TC(B) | TC(B)/TP(B) |
|---|---|---|---|---|---|---|---|
| China | 268 | 7520 | 28.1 | Peru | 49 | 106 | 2.2 |
| India | 207 | 9689 | 46.8 | Turkey | 37 | 533 | 14.4 |
| Taiwan | 199 | 5677 | 28.4 | Germany | 35 | 862 | 24.6 |
| Malaysia | 150 | 7506 | 50.0 | Hong Kong | 34 | 824 | 24.2 |
| Pakistan | 109 | 609 | 5.6 | Ecuador | 29 | 930 | 32.1 |
| Spain | 107 | 5704 | 53.3 | Brazil | 28 | 213 | 7.6 |
| United States | 94 | 7090 | 75.4 | Canada | 27 | 770 | 28.5 |
| Palestine | 92 | 2877 | 31.3 | Sudan | 26 | 296 | 11.4 |
| Saudi Arabia | 72 | 625 | 8.7 | Iran | 22 | 145 | 6.6 |
| Australia | 64 | 5806 | 90.7 | Italy | 18 | 191 | 10.6 |
| United kingdom | 51 | 1308 | 25.6 | Nigeria | 18 | 568 | 31.6 |
Disclaimer/Publisher’s Note: The statements, opinions and data contained in all publications are solely those of the individual author(s) and contributor(s) and not of MDPI and/or the editor(s). MDPI and/or the editor(s) disclaim responsibility for any injury to people or property resulting from any ideas, methods, instructions or products referred to in the content. |
© 2024 by the authors. Licensee MDPI, Basel, Switzerland. This article is an open access article distributed under the terms and conditions of the Creative Commons Attribution (CC BY) license (http://creativecommons.org/licenses/by/4.0/).
Copyright: This open access article is published under a Creative Commons CC BY 4.0 license, which permit the free download, distribution, and reuse, provided that the author and preprint are cited in any reuse.


