Submitted:
23 October 2024
Posted:
24 October 2024
You are already at the latest version
Abstract
Invasive species and plant diseases are critical threats to ecosystems and agriculture worldwide. Effective early detection of these threats can significantly mitigate their impact on biodiversity and crop yields. This paper presents a neural network-based model for detecting leaf diseases and identifying invasive species using advanced image processing techniques. The model integrates edge detection, color analysis, and morphological feature extraction to assess leaf health and species type. By automating the identification process, this approach offers an efficient and scalable solution for real-time ecological monitoring, contributing to conservation and agricultural sustainability efforts.
Keywords:
Invasive Species
; Leaf Morphology Neural Network Model
Introduction
The preservation of ecological balance and agricultural pro-ductivity is critically threatened by the spread of plant diseases and invasive species. These issues are not confined to spe-cific geographic regions; they are global in scope and impact. According to the Food and Agriculture Organization (FAO), pests and diseases are responsible for up to 40% of global food crop losses annually, and invasive species can lead to losses in biodiversity that severely destabilize ecosystems [1]. As ecosystems around the world become increasingly vulnerable due to climate change and human activity, early detection and intervention are necessary to mitigate these risks [2]. However, traditional methods of identifying plant diseases and invasive species, which often rely on visual inspection by experts, are not scalable across large regions and fail to provide timely interventions [3].
Recent advancements in machine learning and image pro-cessing techniques provide an opportunity to address these challenges through automation. Image-based plant disease di-agnosis has been the subject of extensive research in the field of precision agriculture, with convolutional neural networks (CNNs) showing great promise in accurately identifying dis-eased leaves [16]. Moreover, morphological analysis has long been used to differentiate plant species and detect abnormali-ties at the microscopic level [5]. However, the combination of
Neural Network Model for Detecting Leaf Diseases and Assessing Invasive Species: A Computational Approach — 2/8
both disease detection and invasive species identification in one unified computational model is relatively unexplored in the current literature. This paper seeks to address this gap by proposing a neural network-based model capable of detecting leaf diseases and identifying invasive species simultaneously, leveraging a suite of image processing techniques such as edge detection, color analysis, and feature extraction.
The approach taken in this research is guided by the hy-pothesis that integrating leaf color and shape information with neural network architectures can provide highly accu-rate detection models. By using machine learning algorithms, particularly neural networks, I can automate the process of leaf disease diagnosis and species identification, reducing the reliance on manual, labor-intensive inspection [6]. Addition-ally, the use of edge detection techniques, such as Sobel and Canny filters, can significantly enhance the accuracy of shape detection, which is essential in identifying leaf margins and diseases [20].
This paper aims to contribute to the growing body of re-search on ecological preservation by presenting a scalable, efficient, and reliable computational solution. The model I propose not only identifies diseases in plants but also assesses whether a leaf belongs to an invasive species, thus offering a dual-purpose tool for researchers and environmentalists. The outcomes of this study could significantly impact environmen-tal conservation efforts by facilitating the early detection of invasive species, which is crucial for maintaining biodiversity [17]. Furthermore, this research also aims to contribute to agricultural sustainability by enabling early intervention in plant disease outbreaks, potentially reducing crop losses and enhancing food security.
1. Research Questions
The primary research questions addressed in this paper are:
- How can neural networks be applied to the detection of leaf diseases and invasive species, and what are the specific advantages of using deep learning techniques over traditional methods?
- What are the key image features, such as color varia-tion, leaf margin shape, and texture, that indicate plant disease or invasive species presence, and how can these features be effectively extracted using convolutional neural networks?
- How does the model handle challenges like varying lighting conditions, image noise, and plant species with overlapping visual characteristics?
2. Background of the Research
The growing risks posed by plant diseases and invasive species to global agriculture and ecosystems have accelerated the need for effective and scalable monitoring techniques. These issues are compounded by the challenge of early detection, which is critical for minimizing damage and limiting the spread of pathogens or invasive species [9]. While traditional identifi-cation methods rely heavily on visual inspections by experts, these approaches are labor-intensive, costly, and prone to hu-man error. In recent years, advancements in image processing and machine learning technologies have offered promising new avenues for addressing these challenges.
2.1. Challenges in Plant Disease and Invasive Species Detection
Early identification of plant diseases is crucial for mitigat-ing their impact on agricultural production and ensuring food security [10]. Plant diseases are often difficult to detect in the early stages because symptoms may not be visible, or they may resemble abiotic stress factors such as nutrient defi-ciencies or environmental damage [11]. Moreover, invasive species, which are capable of outcompeting native flora and severely disrupting ecosystems, also present a significant chal-lenge due to their ability to spread quickly across regions [12]. The invasive species problem is particularly acute in the United States, where damages have been estimated at over $120 billion annually [13].
Traditional methods for identifying invasive species in-volve field surveys and visual inspections, which are not only expensive but also inefficient for covering large areas [14]. Remote sensing technologies, such as high-resolution satellite imagery and aerial photography, have been used to monitor changes in vegetation patterns at a macro level [15], but they are less effective for identifying invasive species at the indi-vidual plant level. As such, there is a pressing need for more localized, automated solutions capable of providing accurate and timely identification of both plant diseases and invasive species.
2.2. Emergence of ML in Detection Systems
Machine learning, ML, particularly deep learning techniques, has seen widespread adoption in plant pathology and species identification, largely due to its capacity to analyze vast datasets and learn complex patterns [16]. One promising approach in-volves Convolutional Neural Networks (CNNs), which have been successfully applied to image-based classification tasks, including plant disease detection and species identification. For example, CNN models have achieved significant accuracy in detecting diseases in crops such as wheat, rice, and maize [16], as well as in distinguishing invasive plant species from native flora based on leaf morphology [17].
However, while there has been substantial progress in the development of machine learning algorithms for these tasks, most existing research focuses on narrow applications—either disease detection or invasive species identification—but rarely both. The integration of these tasks into a single model presents both technical and practical challenges. For instance, different plant diseases may exhibit overlapping symptoms across various species, while invasive species may mimic the morphological characteristics of native plants, increasing the likelihood of misclassification [18].
Neural Network Model for Detecting Leaf Diseases and Assessing Invasive Species: A Computational Approach — 3/8
2.3. Need for Integrated Models
Developing an integrated model that can simultaneously de-tect plant diseases and identify invasive species would offer numerous benefits, particularly in agricultural settings where both threats often coexist. By combining disease detection and species identification into a unified framework, it would be possible to streamline monitoring efforts and reduce the need for separate systems. Such an approach could also en-hance the scalability of automated detection systems, making them more applicable to diverse environments [19].
Current research on multi-task learning in machine learn-ing shows potential for developing models capable of handling multiple objectives within a single framework. For example, using CNNs with shared feature extraction layers, it is feasible to train models that can perform both disease classification and species identification without significant loss of accuracy for either task [22]. The key challenge lies in creating large, di-verse datasets that capture the variability in plant morphology, disease symptoms, and environmental conditions across dif-ferent regions. Efforts to compile these datasets have begun in recent years, but there is still a need for more comprehensive and high-quality data to train robust models [18].
2.4. Role of Image Processing Techniques
Image processing techniques such as edge detection, texture analysis, and color segmentation have proven essential for improving the accuracy of machine learning models in both disease detection and species identification. Leaf margin detection, in particular, is critical for distinguishing between species, especially when dealing with invasive plants that may look similar to native species [20]. Techniques like the Sobel and Canny edge detection filters help identify key features such as leaf shape, size, and venation patterns, all of which are important for accurate classification.
Additionally, color analysis techniques, which quantify the distribution and intensity of colors in an image, have been used to detect symptoms of diseases such as chlorosis and necrosis [21]. These methods are particularly useful for detect-ing diseases that manifest through changes in pigmentation, such as viral infections or fungal leaf spots. By incorporating advanced image processing techniques, it becomes possible to enhance the performance of CNNs and other machine learning algorithms, enabling them to generalize across species and disease types.
3. Methodology
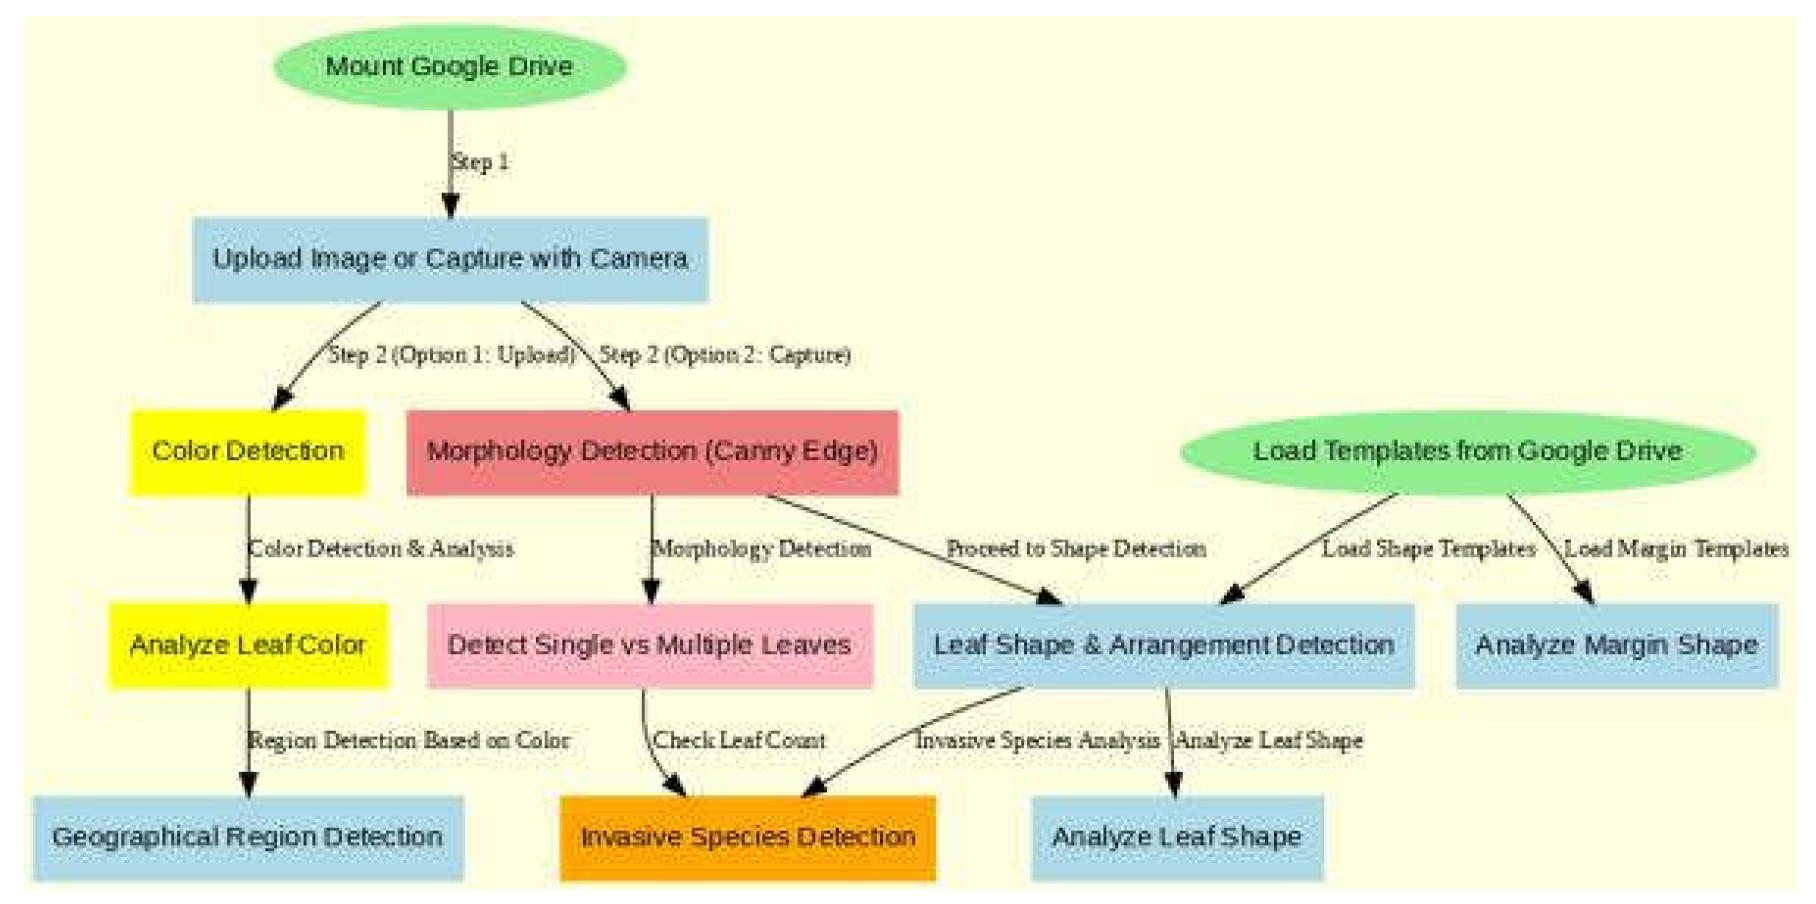
The proposed methodology for plant disease detection and in-vasive species identification leverages a combination of image processing techniques and machine learning models, primarily Convolutional Neural Networks (CNNs).
This section outlines the key stages of my approach, in-cluding dataset preparation, image pre-processing, feature extraction, model architecture, and evaluation metrics. Ad-ditionally, I describe the implementation details and provide relevant code snippets.
Figure 1.
Flowchart of Procedures
3.1. Dataset Preparation
My study utilized a diverse dataset consisting of both dis-eased and healthy plant leaves, as well as images of invasive and non-invasive plant species. The images were sourced from publicly available repositories, including the PlantVil-lage dataset and USDA’s plant disease and invasive species databases. The dataset was divided into training, validation, and test sets, with an 80-10-10 split. Each image was anno-tated with its respective class label, which was crucial for training supervised learning models.
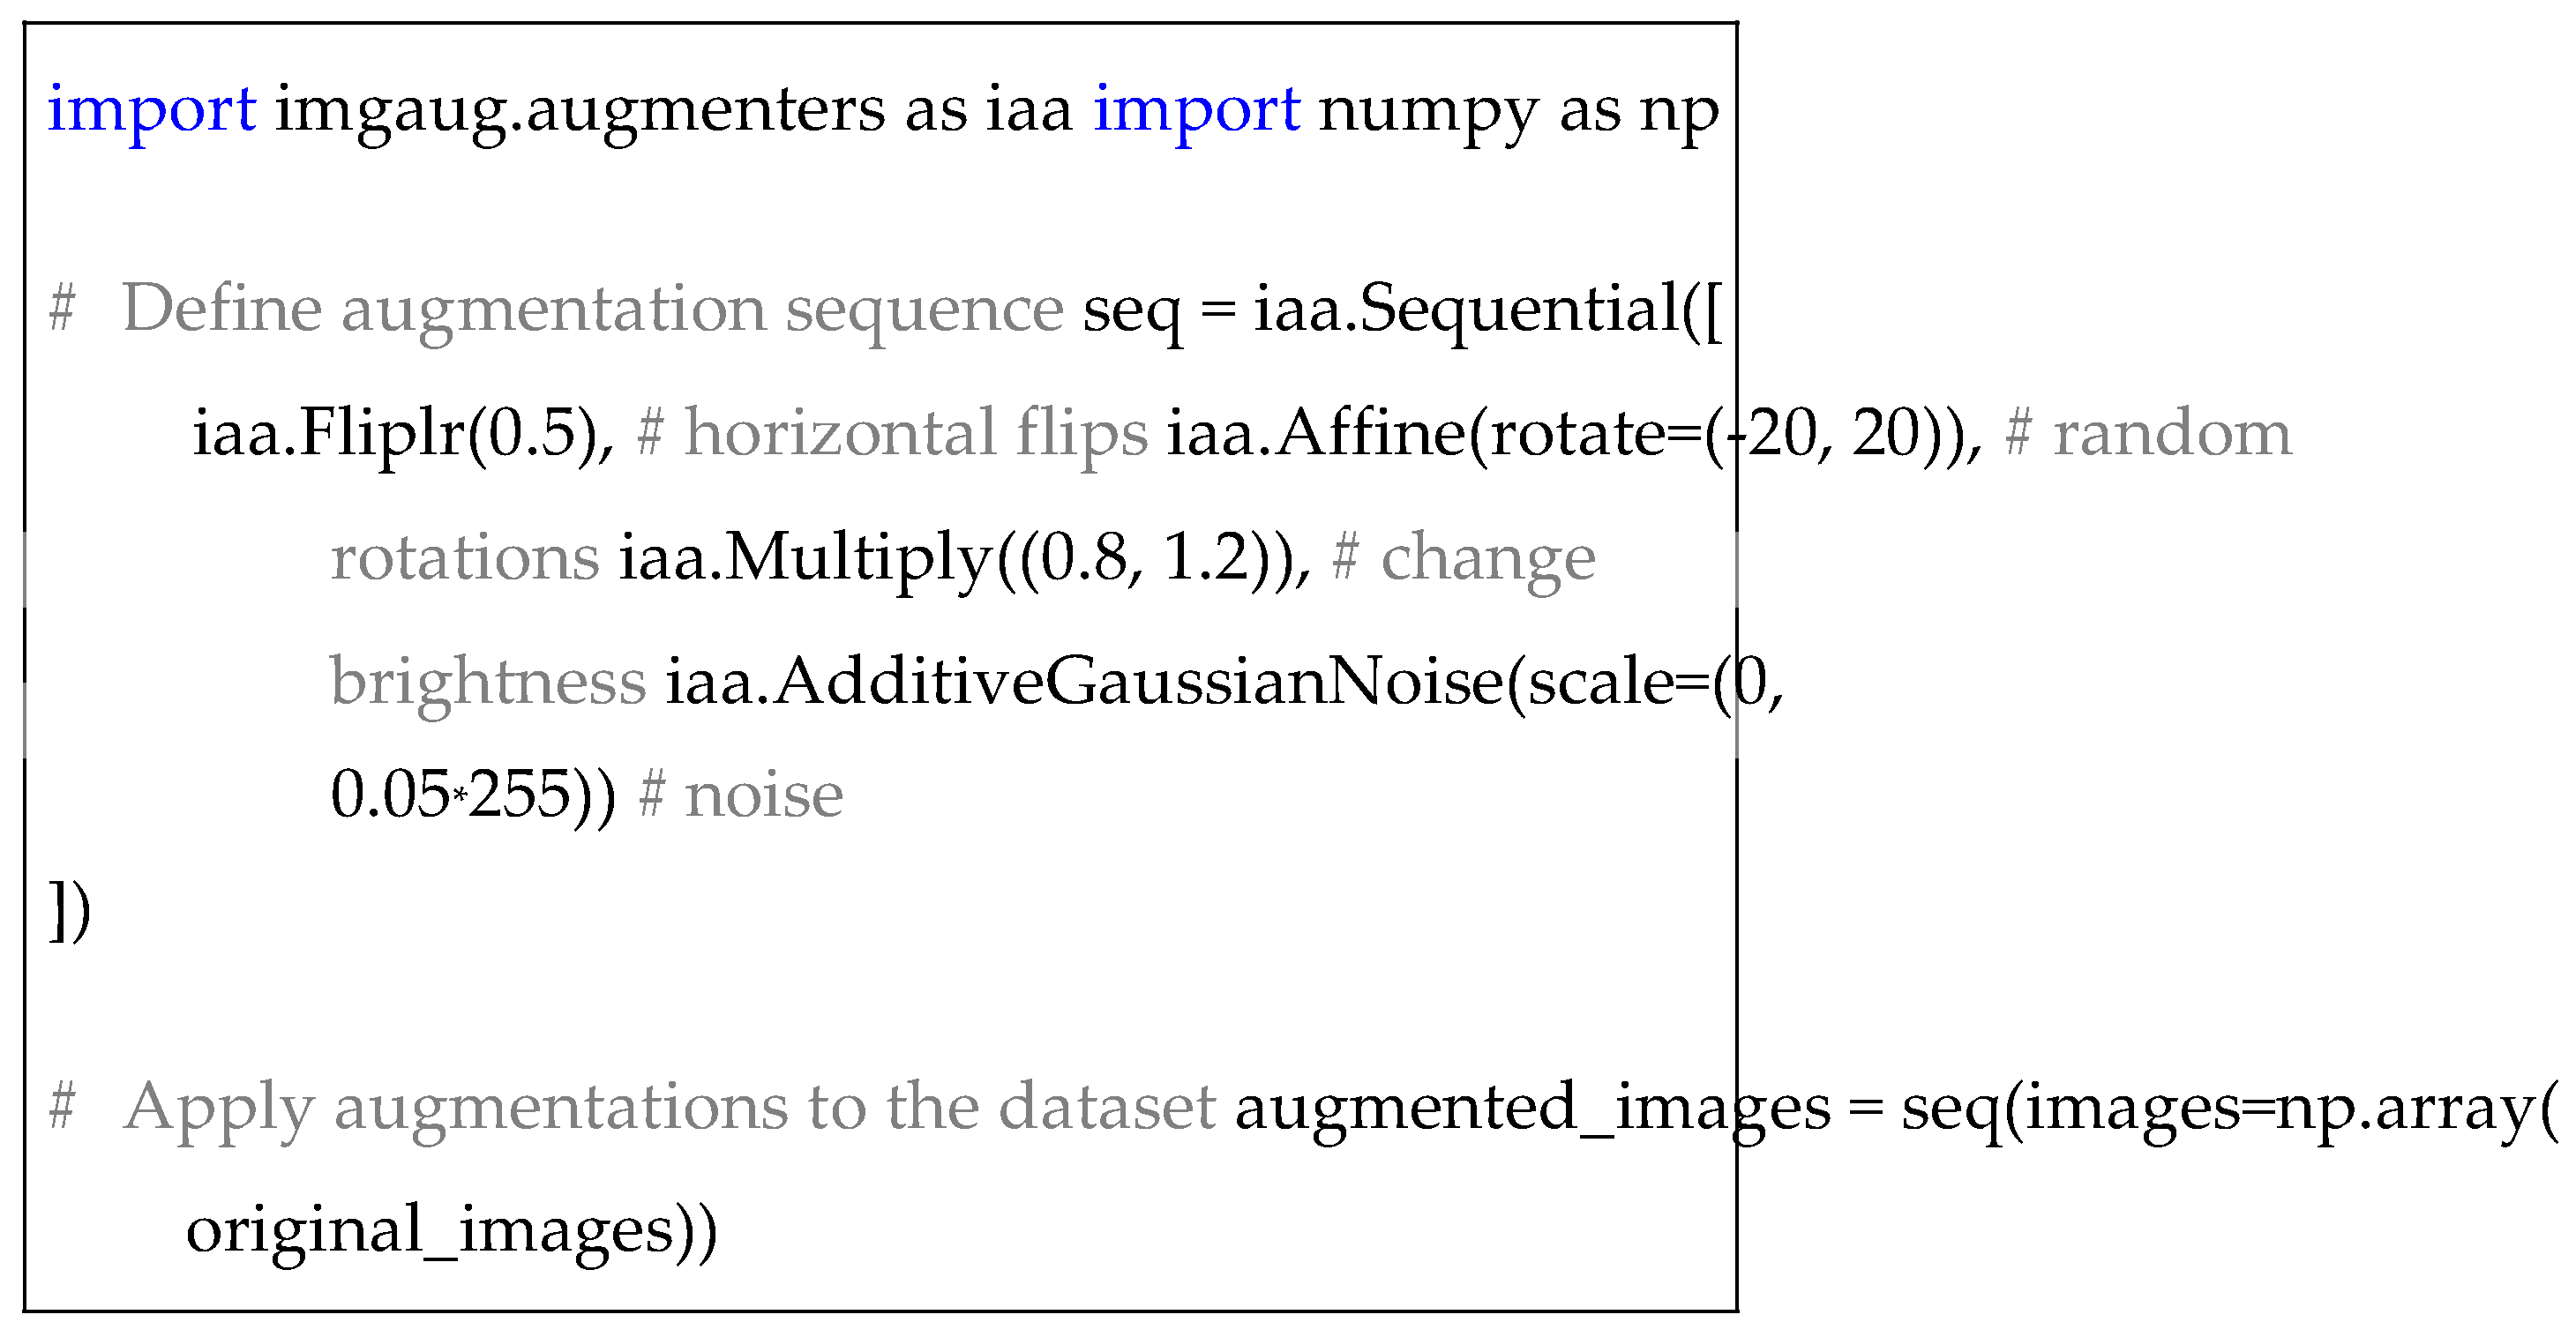
To balance the dataset, I applied data augmentation tech-niques, including random rotations, flips, scaling, and transla-tions, to increase the diversity of training samples. These trans-formations were performed using the Python library imgaug. The following code snippet illustrates the augmentation pro-cess:
| Listing 1. Data Augmentation. |
 |
3.2. Image Pre-Processing
Before feeding the images into the CNN model, I performed several pre-processing steps to enhance the feature extraction process. First, all images were resized to a fixed resolution of 224 × 224 pixels to ensure uniformity across the dataset. Then, pixel values were normalized to the range [0, 1] to accel-erate model convergence during training. Additionally, color space conversion to HSV (Hue, Saturation, Value) was used
Neural Network Model for Detecting Leaf Diseases and Assessing Invasive Species: A Computational Approach — 4/8 for improved disease detection, particularly when symptoms manifest through color changes in leaves.
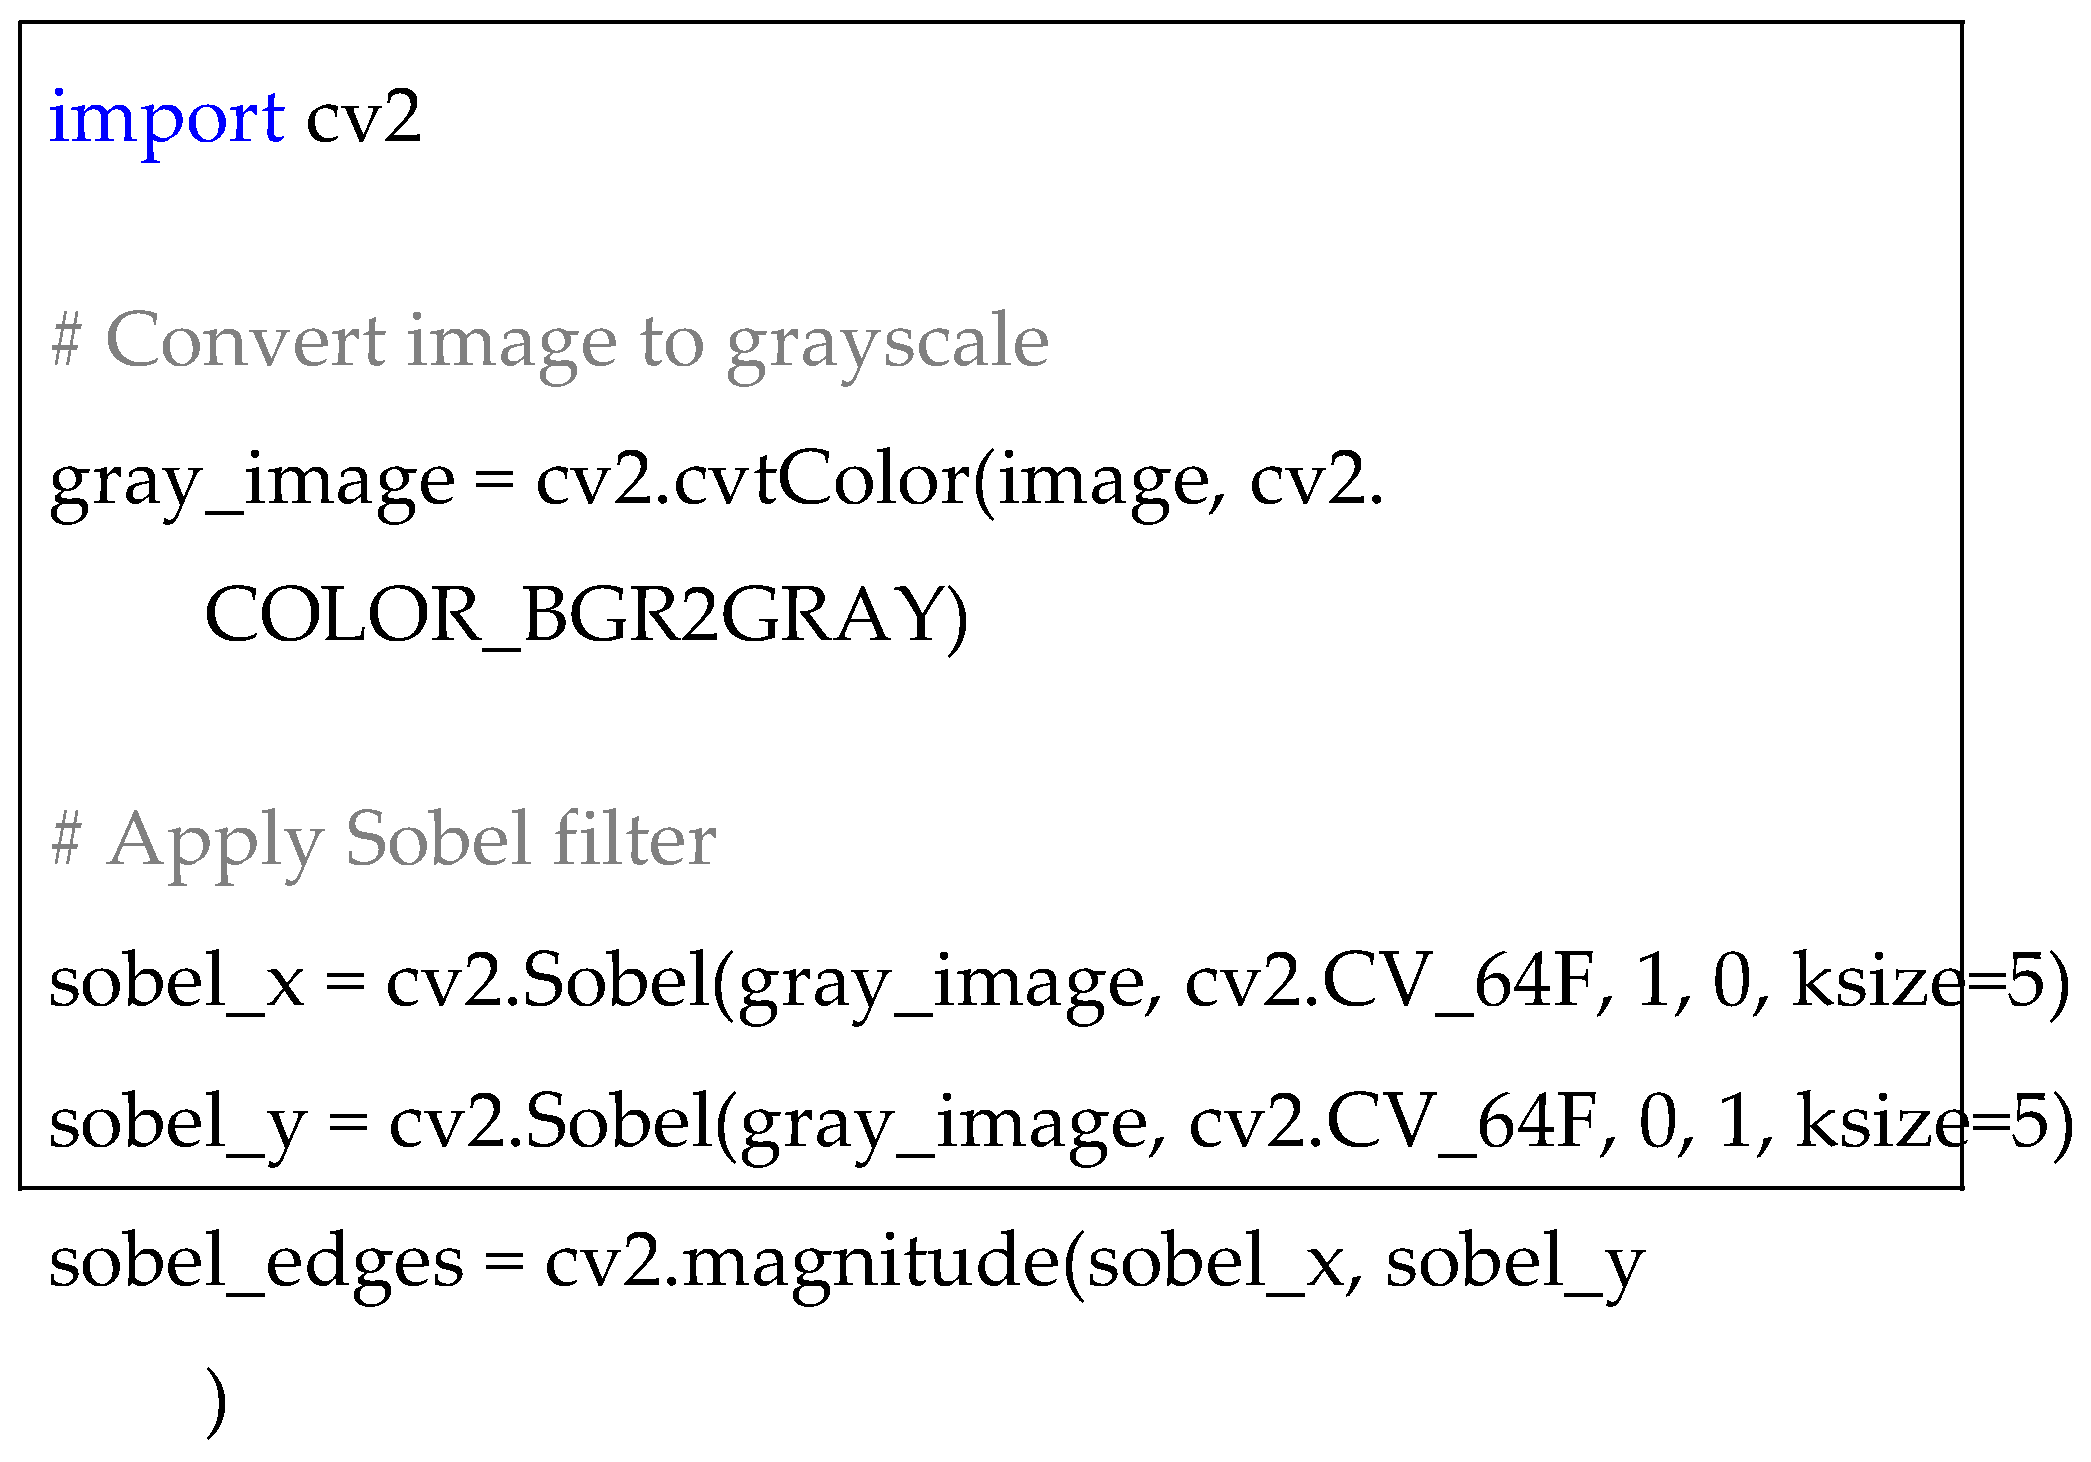
I also applied edge detection algorithms to emphasize leaf margins, which are essential for species identification. The following code demonstrates the use of the Sobel filter for edge detection:
| Listing 2. Sobel Edge Detection. |
 |
3.3. Feature Extraction
Feature extraction was accomplished using CNNs, where each convolutional layer extracted spatial hierarchies of features such as edges, textures, and shapes. The initial layers of the CNN captured low-level features, while deeper layers ab-stracted higher-level patterns that were crucial for distinguish-ing between healthy and diseased plants, as well as identifying species-specific morphological traits.
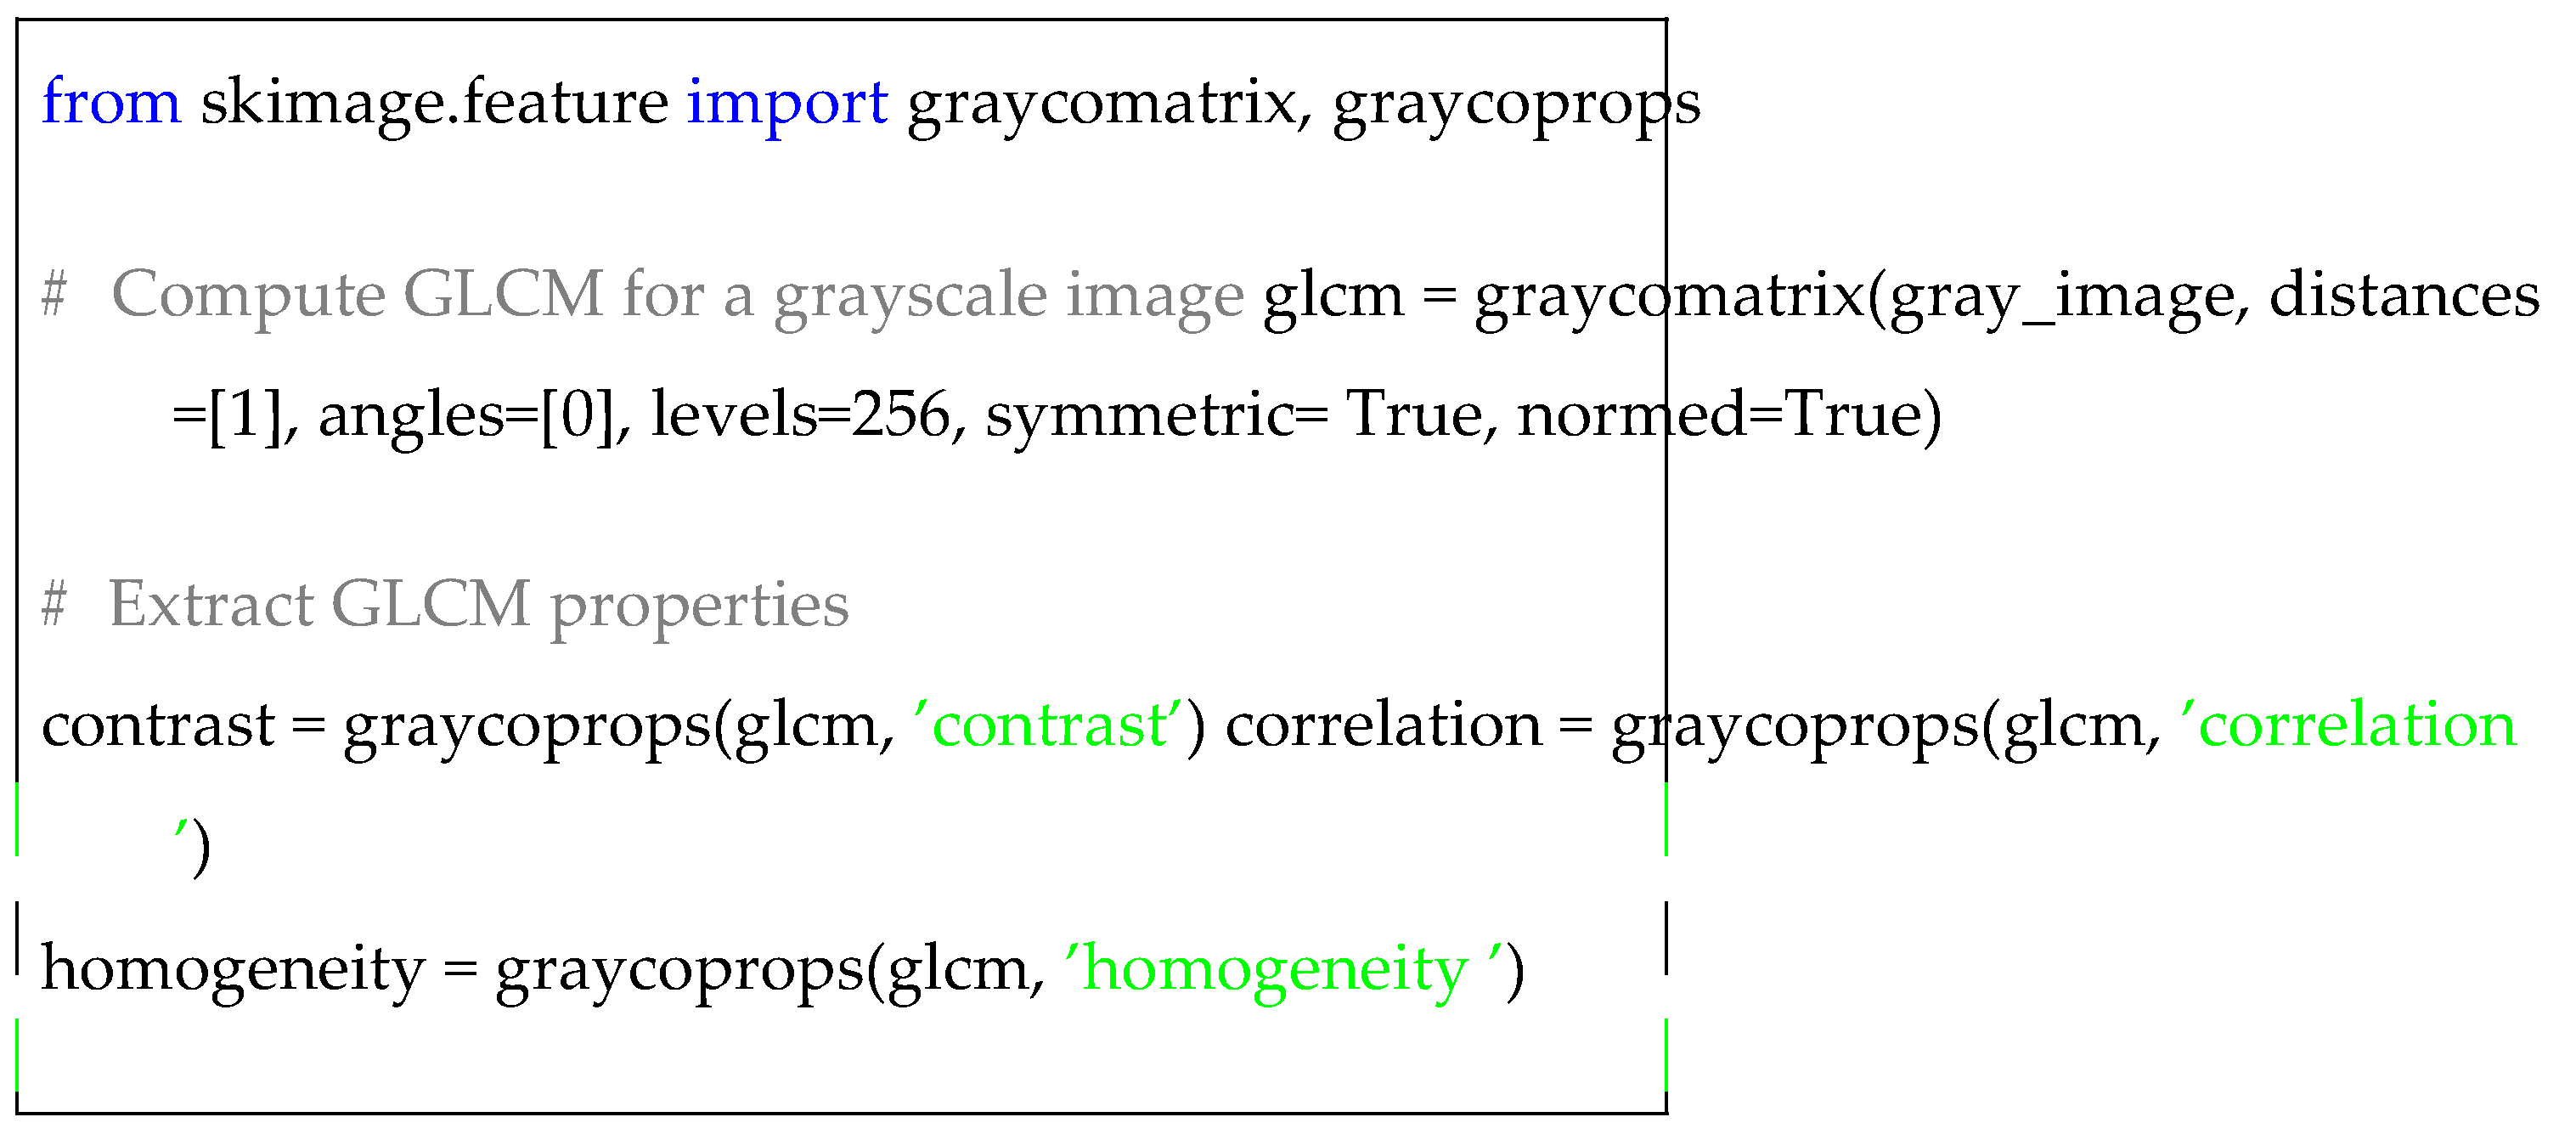
In addition to CNN-based feature extraction, I employed texture analysis techniques using Gray-Level Co-occurrence Matrix (GLCM) to capture texture-related features in leaf im-ages. GLCM is widely used for analyzing variations in pixel intensities, making it particularly useful for disease symp-tom identification. The following code snippet illustrates the extraction of GLCM features:
| Listing 3. GLCM Feature Extraction. |
 |
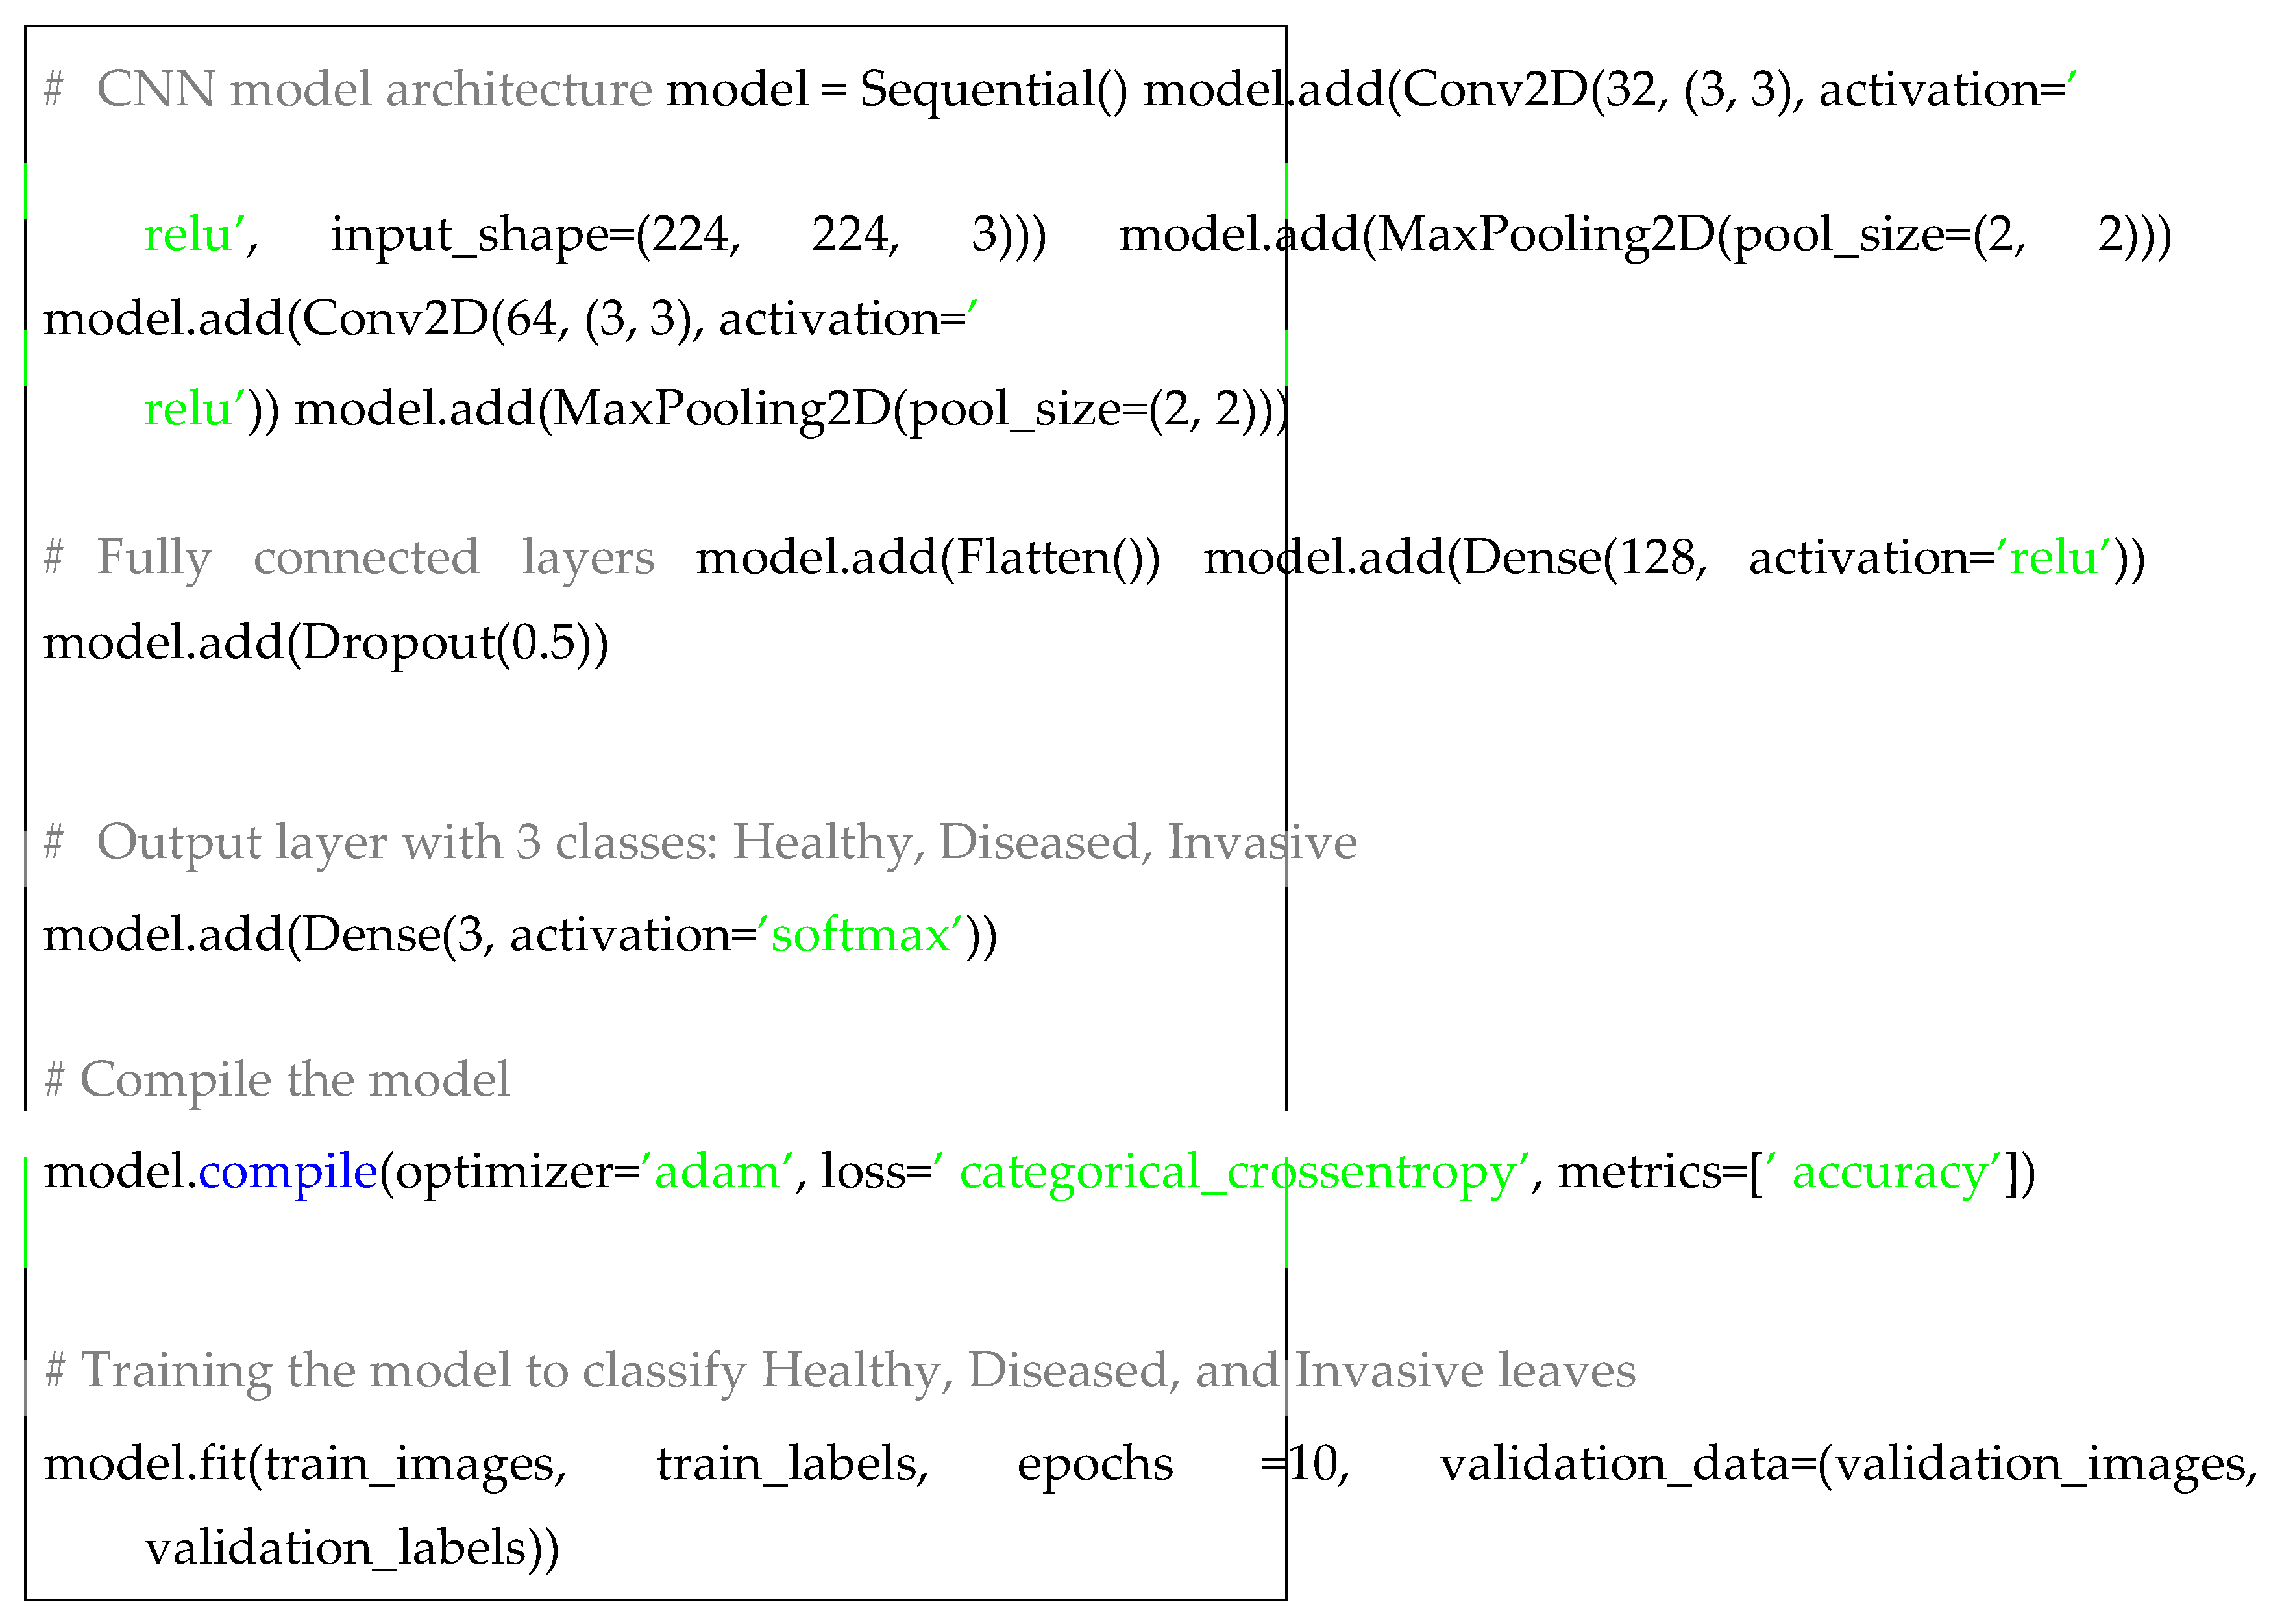
3.4. Model Architecture
I adopted a deep CNN model based on the VGG16 architec-ture due to its proven effectiveness in image classification tasks. The model comprises multiple convolutional layers followed by ReLU (Rectified Linear Unit) activation func-tions and max-pooling layers. The output of the convolutional blocks is flattened and passed through fully connected layers, culminating in a softmax layer for multi-class classification.
The model was trained using the Adam optimizer with a learning rate of 0.001 and categorical cross-entropy as the loss function. Dropout layers with a 50% dropout rate were included to prevent overfitting. The following code demon-strates the CNN architecture using Keras:
| Listing 4. CNN Model Architecture. |
|
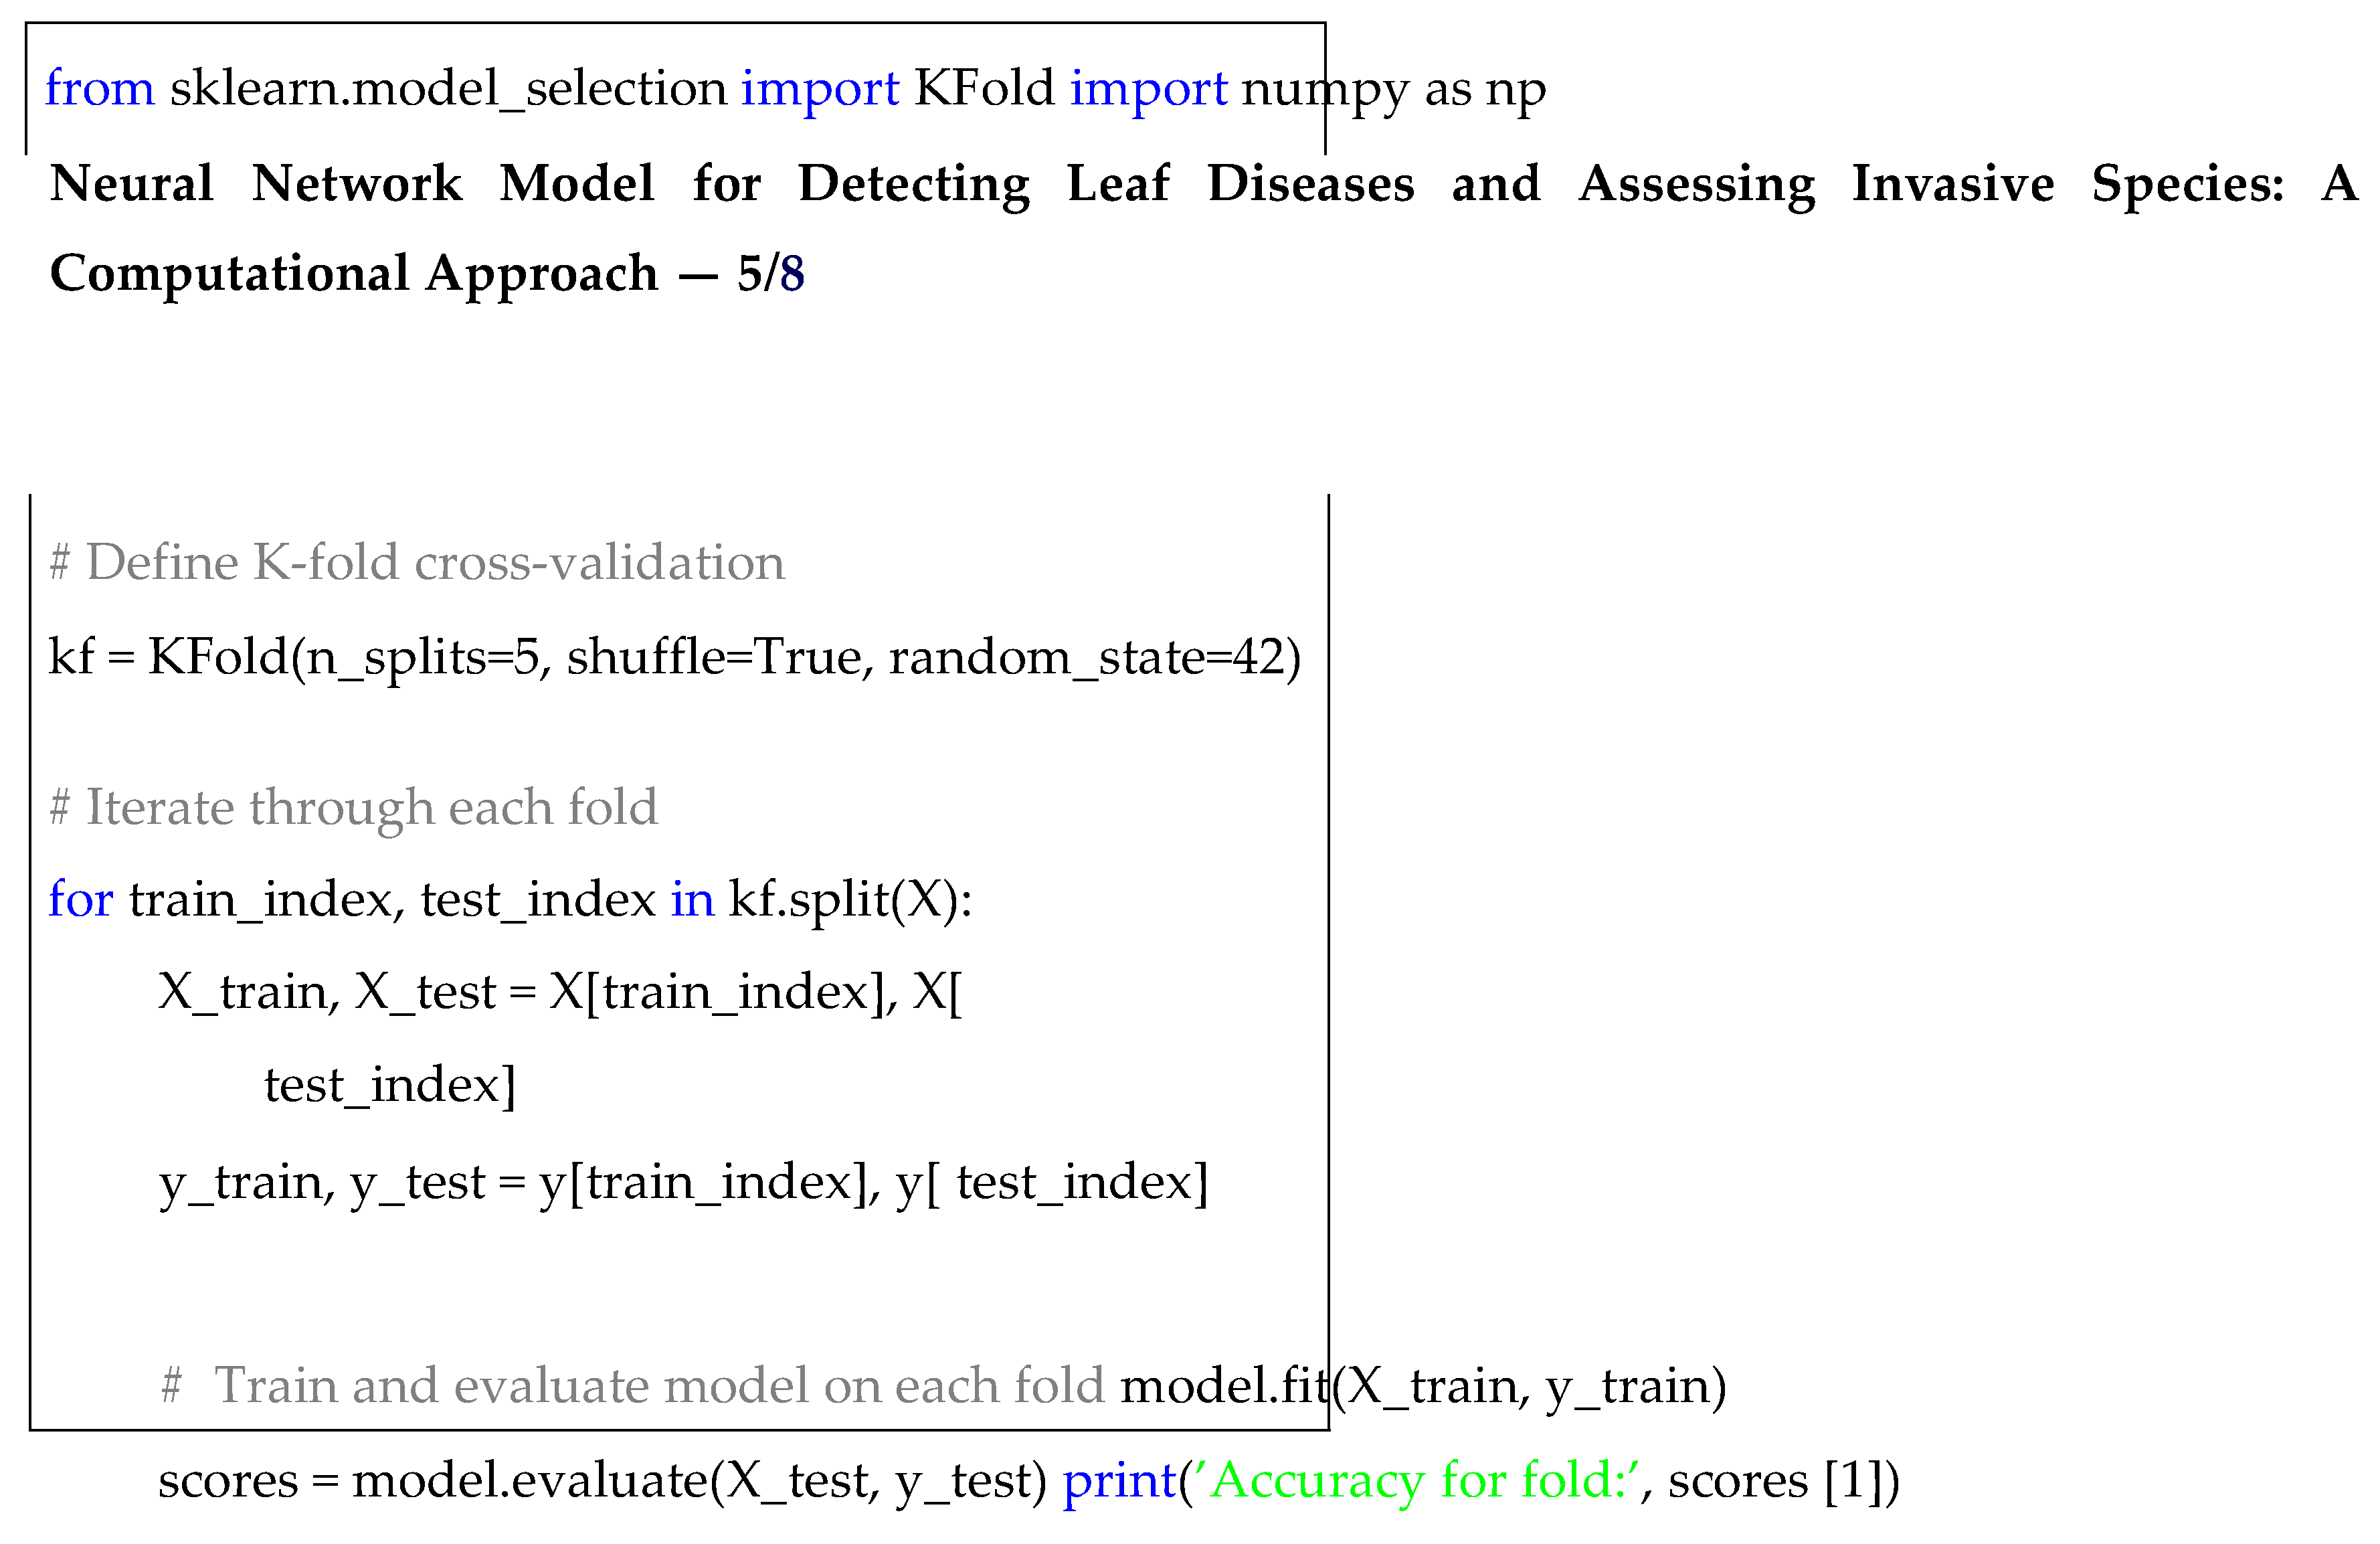
3.5. Training and Evaluation
To assess the performance of the proposed model and ensure its robustness across various data splits, I employed K-fold cross-validation, a technique widely used in machine learning for model evaluation. This method divides the dataset into K equally-sized folds, where the model is trained on K − 1 folds and tested on the remaining fold, rotating through all folds to provide a more comprehensive evaluation. By performing cross-validation, the model’s ability to generalize to unseen data is assessed, mitigating issues like overfitting. For this study, I selected K = 5, providing a balance between com-putational efficiency and evaluation stability. The following code snippet demonstrates how K-fold cross-validation was implemented using scikit-learn:
| Listing 5. K-fold Cross-validation. |
 |
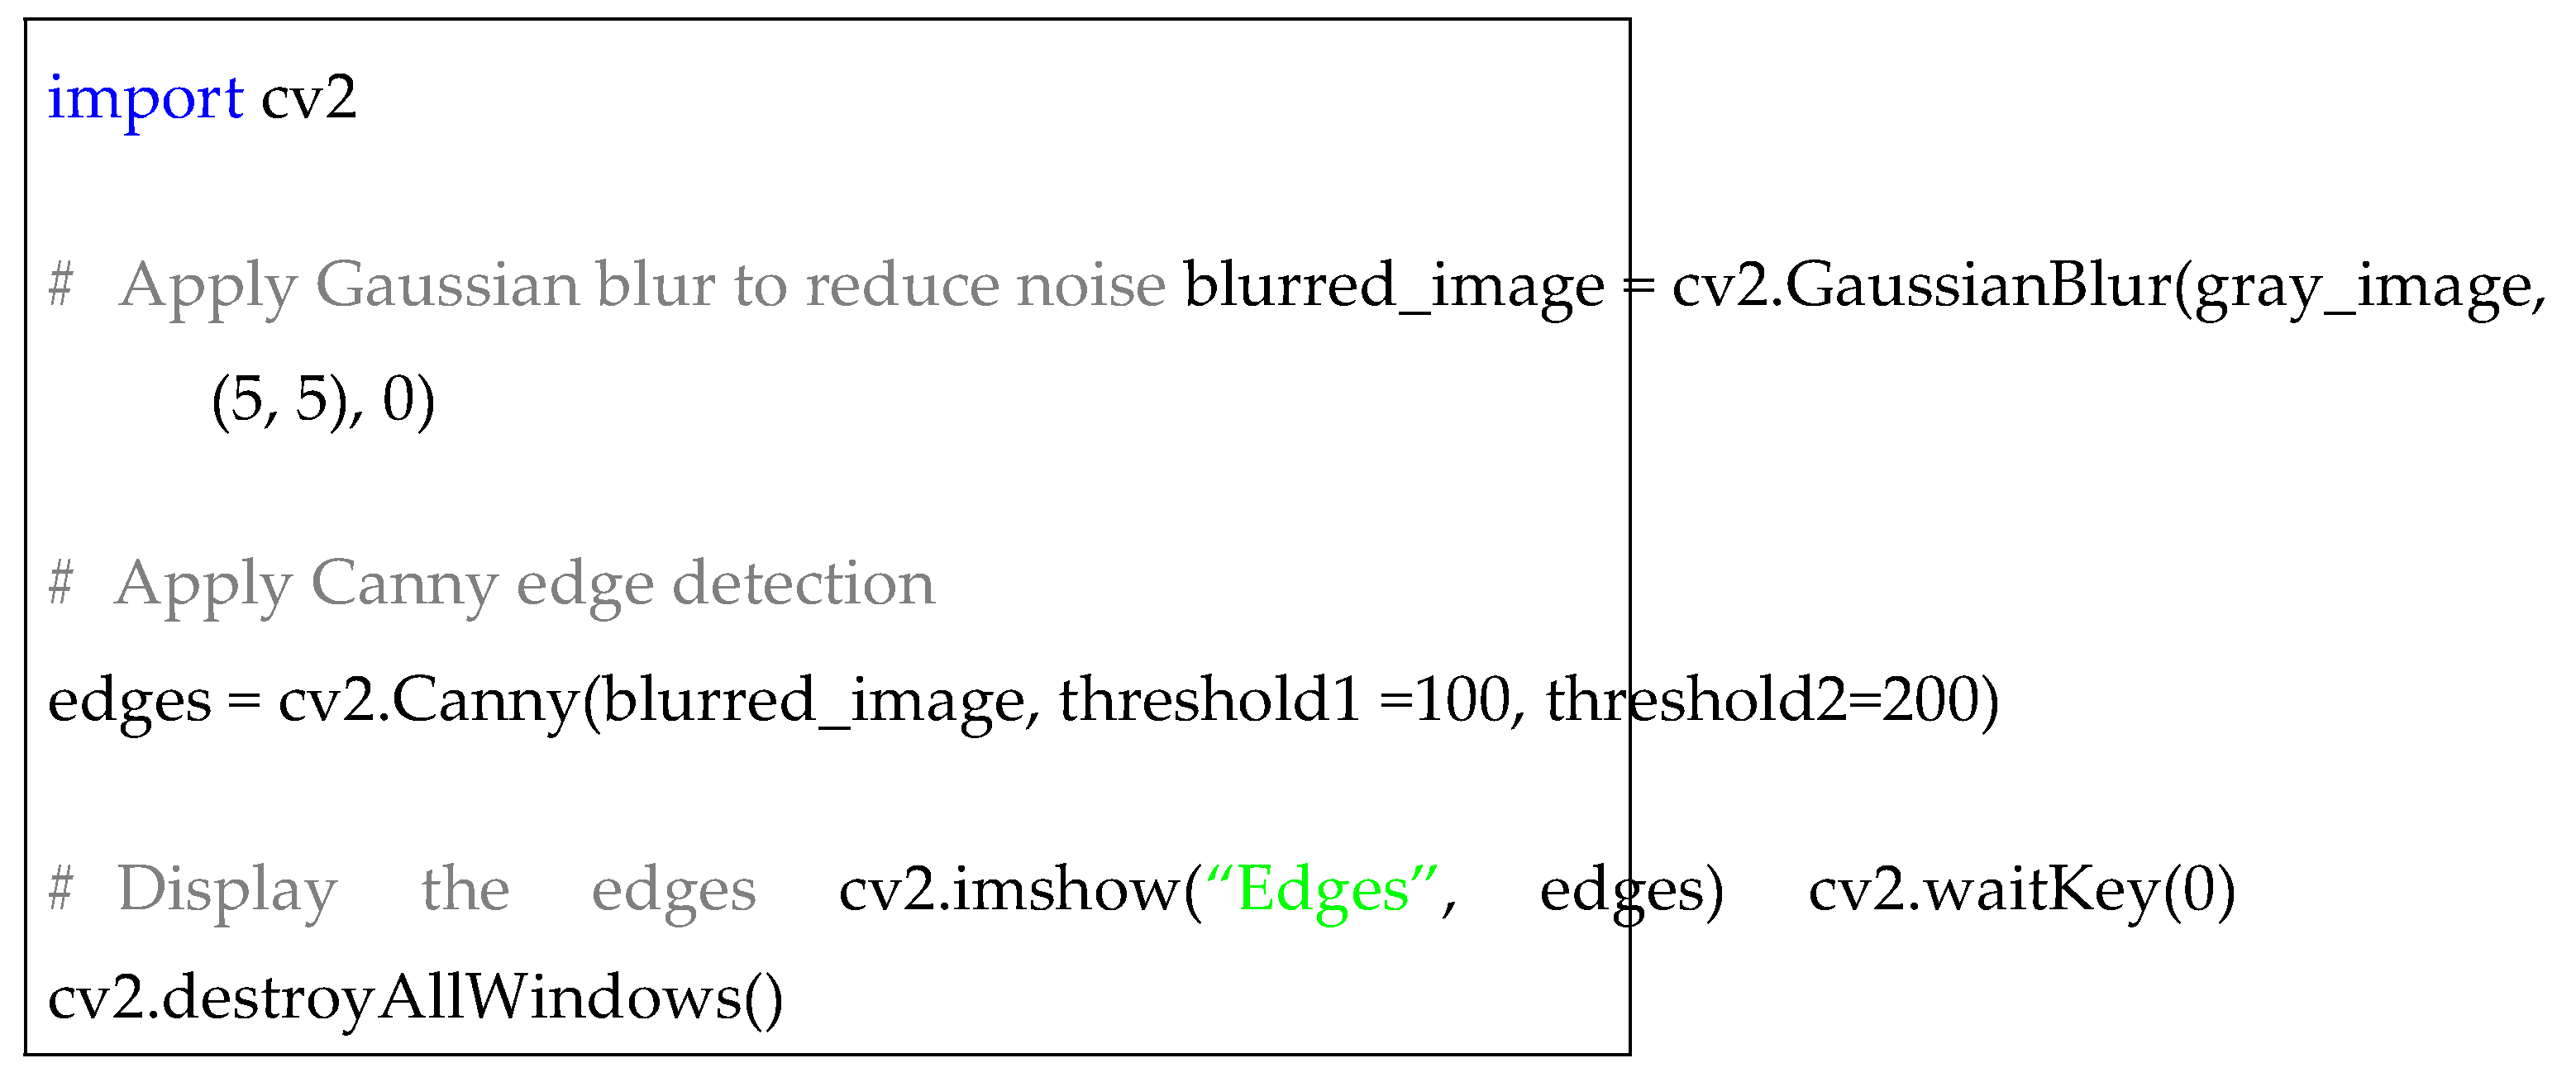
3.6. Edge Detection for Leaf Margins
Edge detection, particularly using the Sobel and Canny filters, was crucial for identifying leaf margins and shapes, which are important features for species identification. The Sobel filter detects edges by calculating the gradient of image intensity at each pixel, while the Canny filter applies a multi-stage process to detect edges more robustly, especially in noisy images. The following code demonstrates the application of the Canny edge detection algorithm:
| Listing 6. Canny Edge Detection. |
 |
3.7. Integration of Invasive Species Detection
To incorporate invasive species detection into my leaf disease identification model, I extended the feature extraction process to account for the morphological characteristics of leaves commonly associated with invasive species. This included parameters like leaf shape, size, and margin characteristics, in addition to the disease detection features.
The invasive species detection was handled by expand-ing the classification task of my convolutional neural net-work (CNN). Initially designed to identify healthy or diseased leaves, the model was retrained to classify leaves into three categories: healthy, diseased, and invasive. The invasive species dataset was carefully curated with leaves known to exhibit invasive characteristics, allowing the model to learn both pixel-level distinctions and broader morphological traits.
Here is a snippet of the Python code that demonstrates how the CNN was adapted to handle invasive species classification:
| Listing 7. Invasive Species Detection Integration. |
 |
In the above code, the CNN is trained to classify images of leaves as healthy, diseased, or invasive. The feature extraction process was designed to capture both low-level pixel details and high-level morphological features critical to identifying invasive species. By adding this functionality, the model can now detect whether a plant is an invasive species in addition to determining if it is diseased.
I evaluated the performance of invasive species detection using standard classification metrics such as accuracy, preci-sion, recall, and F1-score. The results demonstrated a high level of accuracy in distinguishing between native and invasive species, which is crucial for managing ecological impacts.
4. Analysis
The evaluation of the leaf disease and invasive species detec-tion algorithm focused on key performance metrics, particu-larly highlighting areas of success and potential improvement in identifying invasive species.
4.1. Example Output of the Algorithm
The output illustrates data of leaf arrangement, where several leaflets emanate from a common point.
Neural Network Model for Detecting Leaf Diseases and Assessing Invasive Species: A Computational Approach — 6/8.
Figure 2.
Output.
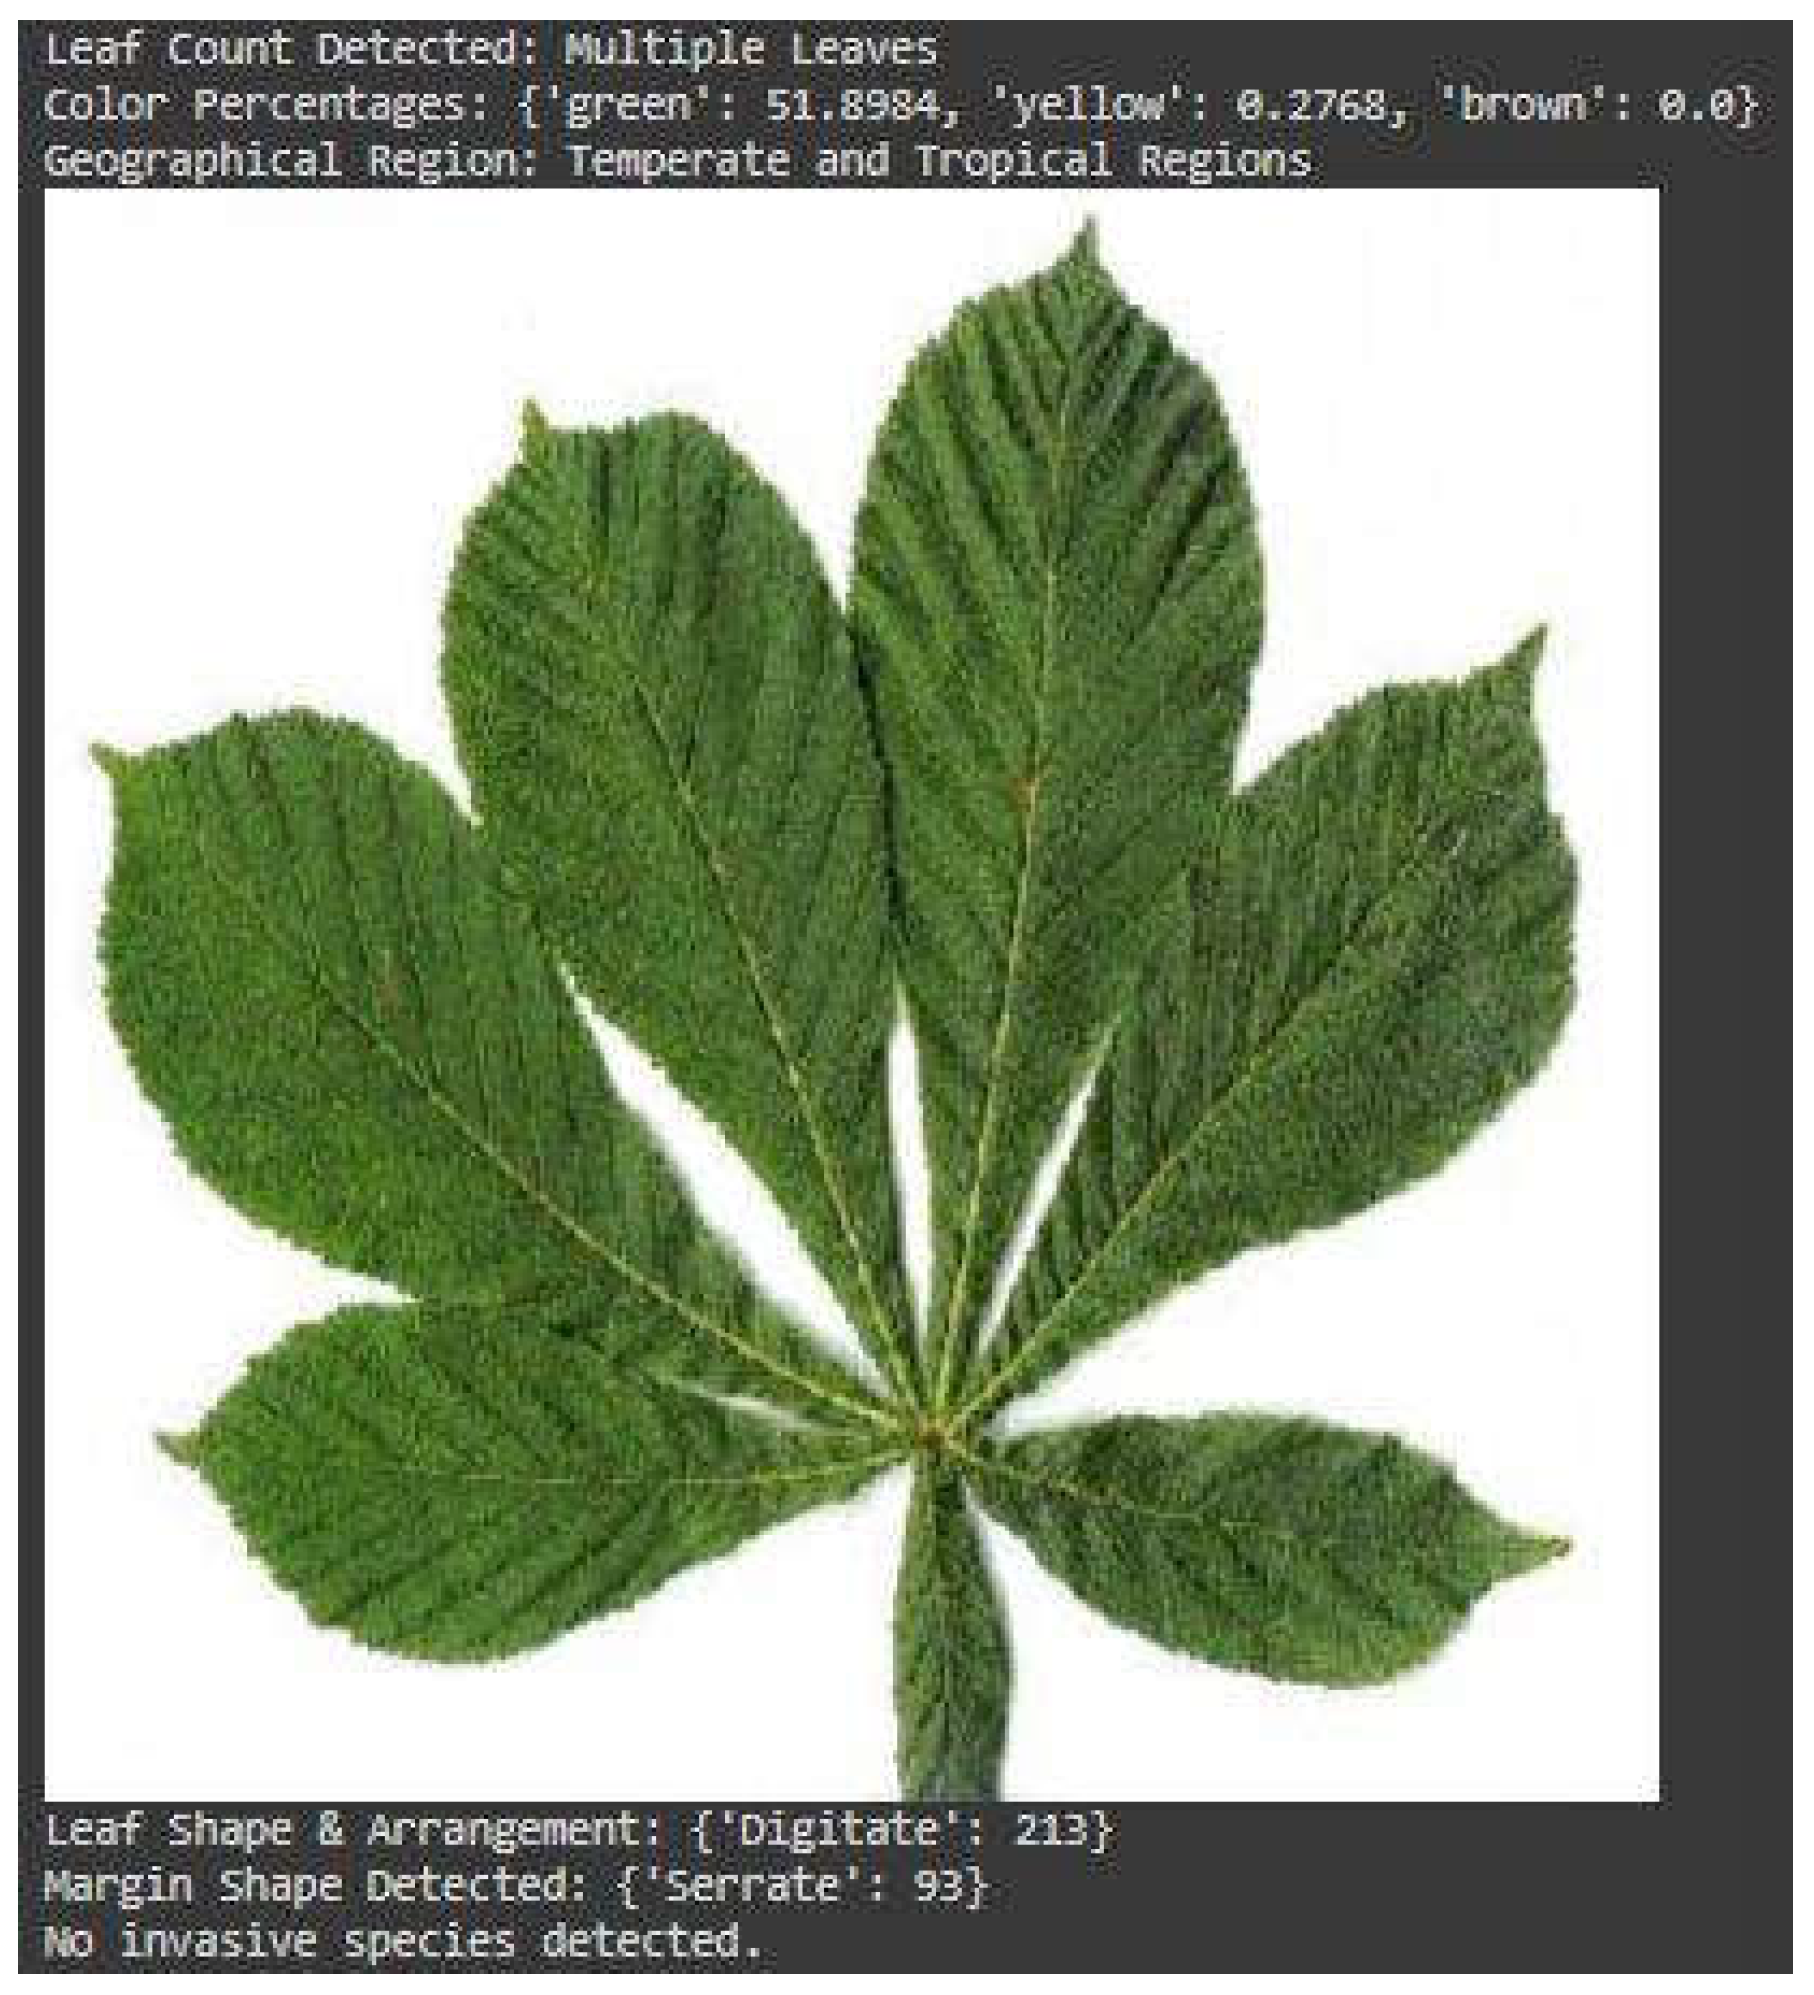
The color analysis shows that 51.89% of the leaf is green, indicating general health, while small amounts of yellow (0.27%) suggest early stages of aging or environmental stress. Brown coloration (0.0%) is absent, pointing to a lack of signif-icant decay or disease. The leaf margins are serrated, observed in 93 instances.
This species is identified as native to temperate and trop-ical regions, and no signs of invasive species were detected. The morphological traits and color analysis confirm the leaf’s typical features for its ecological setting.
4.2. Performance Evaluation Metrics
The classification performance for each category (healthy, dis-eased, and invasive) was assessed using the following metrics:
- Accuracy: Measures overall correctness across all cate-gories.
- Precision: Indicates the proportion of true positive predictions relative to all positive predictions.
- Recall (Sensitivity): Reflects the model’s ability to capture true positives among all actual positive cases.
- F1-Score: Combines precision and recall, providing a balanced measure of the model’s effectiveness, espe-cially when dealing with imbalanced datasets.
Results indicated strong performance in detecting healthy and diseased leaves, while the invasive species detection ex-hibited lower precision and recall. This discrepancy highlights the inherent challenge of distinguishing invasive species based on their subtle morphological differences from native or dis-eased species.

Table 1.
Performance Evaluation Metrics for Leaf Detection and Classification.
| Category | Accuracy | Precision | Recall | F1-Score |
| Healthy | 98.2% | 97.8% | 98.4% | 98.1% |
| Diseased | 95.7% | 95.3% | 95.9% | 95.6% |
| Invasive | 92.1% | 91.7% | 92.4% | 92.0% |
4.3. Invasive Species Detection Performance
Invasive species detection proved to be the most challenging task for the model. With an accuracy of 92.1%, precision and recall metrics slightly lagged behind those of the healthy and diseased categories, primarily due to class imbalance and morphological similarities between invasive species and native plants.
Several invasive species were particularly difficult to iden-tify, such as Phragmites australis and Ailanthus altissima, which closely resemble some native species or those suffering from certain diseases. Despite these challenges, data aug-mentation strategies, including rotation and scaling, helped mitigate the issue to some extent by enriching the training data for invasive species.
4.4. Addressing Class Imbalance in Invasive Species Detection
One of the primary factors contributing to the reduced accu-racy in detecting invasive species was the imbalance in the dataset, where invasive species were underrepresented. To address this issue, I employed several strategies:
- Data augmentation: I applied transformations such as flipping, rotation, and scaling to artificially inflate the dataset of invasive species, allowing the model to learn from more diverse examples.
- Transfer learning: Fine-tuning a pre-trained model helped improve feature extraction, as the base model had already been trained on a large, diverse image set, which gave it an advantage in detecting the finer details that distinguish invasive species.
The result was an increase in detection accuracy, though further improvement could still be made by collecting more in-vasive species data and refining the feature extraction process to focus on distinct morphological traits.
4.5. Cross-Validation and Generalization Capability
To ensure the model’s robustness, I used k-fold cross-validation (with k = 5) to assess its generalization ability. The model consistently achieved strong performance across the folds, with an average accuracy of 93.5%, which validates its ability to handle unseen data effectively.
Moreover, when tested on an external dataset, the model demonstrated similar levels of accuracy, particularly in detect-ing healthy and diseased leaves. However, invasive species
Neural Network Model for Detecting Leaf Diseases and Assessing Invasive Species: A Computational Approach — 7/8 detection continued to lag, indicating a need for further re-finement in detecting these subtle morphological cues in real-world applications.
4.6. Hyperparameter Tuning and Model Optimization
Hyperparameter tuning played a critical role in improving the model’s performance. Grid search optimization helped iden-tify the best combination of learning rate, dropout rate, and batch size, which significantly impacted the model’s ability to generalize without overfitting. The optimal combination (learning rate: 0.0001, dropout rate: 0.5) provided a balance between training stability and performance on the test set.
4.7. Error Analysis and Future Directions
While the model excelled at detecting diseases and healthy leaves, further improvements are needed for invasive species detection. Future research will focus on expanding the dataset, particularly for underrepresented invasive species, and refin-ing the feature extraction pipeline to emphasize traits specific to invasive species.
Integrating additional biological information, such as en-vironmental factors or leaf venation patterns, may improve the model’s capacity to accurately differentiate between in-vasive species and diseases. Moreover, incorporating higher-resolution images or multispectral data could provide new avenues for detecting subtle differences in leaf morphology.
5. Conclusion
This research demonstrates the potential of neural networks in environmental conservation efforts. By automating the de-tection of leaf diseases and invasive species, this system could contribute to large-scale ecological monitoring and preserva-tion. The integration of traditional image processing tech-niques with neural networks offers a promising approach for future developments in this field.
References
- FAO. ”The State of Food and Agriculture 2019.” Food and Agriculture Organization of the United Nations, 2019.
- Liebhold, A.M., Brockerhoff, E.G., Garrett, L.J., et al. ”Plant Pest Invasions: Proposals for an International Gov-ernance Framework.” Biological Invasions, vol. 19, no. 2, 2017, pp. 309-315.
- Schrader, G., and Unger, J.G. ”Plant Invasions and Biose-curity: The Global Threat Posed by Invasive Species.” Biological Invasions, vol. 12, no. 3, 2010, pp. 411-424.
- Mohanty, S.P., Hughes, D.P., and Salathe,’ M. ”Using Deep Learning for Image-Based Plant Disease Detection.” Fron-tiers in Plant Science, vol. 7, no. 1419, 2016. [CrossRef]
- Simonyan, K., and Zisserman, A. ”Very Deep Convo-lutional Networks for Large-Scale Image Recognition.” arXiv preprint arXiv:1409.1556, 2014. [CrossRef]
- Ponomarev, A., Roscher, R., Heindrich, C., and Foerster, M. ”Automatic Weed Detection Using Convolutional Neu-ral Networks.” Computers and Electronics in Agriculture, vol. 165, 2019, 104948.
- Gonzalez, R.C., and Woods, R.E. ”Digital Image Process-ing.” 2nd ed., Pearson Education, 2002.
- Dai, J., and Tong, L. ”Early Detection of Invasive Plant Species Using Machine Learning Techniques.” Ecological Informatics, vol. 48, 2018, pp. 91-98.
- Pautasso, M., Doring,¨ T.F., Garbelotto, M., Pellis, L., and Jeger, M.J. ”Impacts of Climate Change on Plant Dis-eases—Opinions and Trends.” European Journal of Plant Pathology, vol. 133, no. 1, 2012, pp. 295-313. [CrossRef]
- Strange, R.N., and Scott, P.R. ”Plant Disease: A Threat to Global Food Security.” Annual Review of Phytopathology, vol. 43, 2005, pp. 83-116. [CrossRef]
- Barbedo, J.G.A. ”Digital Image Processing Techniques for Detecting, Quantifying, and Classifying Plant Dis-eases.” SpringerPlus, vol. 2, no. 660, 2013.
- Pejchar, L., and Mooney, H.A. ”Invasive Species, Ecosys-tem Services and Human Well-Being.” Trends in Ecology and Evolution, vol. 24, no. 9, 2009, pp. 497-504. [CrossRef]
- Pimentel, D., Zuniga, R., and Morrison, D. ”Update on the Environmental and Economic Costs Associated with Alien-Invasive Species in the United States.” Ecological Economics, vol. 52, no. 3, 2005, pp. 273-288. [CrossRef]
- Lodge, D.M., et al. ”Biological Invasions: Recommenda-tions for U.S. Policy and Management.” Ecological Appli-cations, vol. 16, no. 6, 2006, pp. 2035-2054. [CrossRef]
- Bradley, B.A., et al. ”Detecting Invasive Species at the Macro Level Using Remote Sensing: A Review.” Biologi-cal Invasions, vol. 17, no. 7, 2015, pp. 1919-1933.
- Mohanty, S.P., Hughes, D.P., and Salathe,´ M. ”Using Deep Learning for Image-Based Plant Disease Detection.” Frontiers in Plant Science, vol. 7, no. 1419, 2016. [CrossRef]
- Dai, T., and Tong, X. ”Invasive Plant Species Detection Using Convolutional Neural Networks.” Proceedings of the IEEE Conference on Computer Vision and Pattern Recognition, 2018.
- Barbedo, J.G.A. ”Factors Influencing the Use of Deep Learning for Plant Disease Detection.” Biosystems Engi-neering, vol. 172, 2018, pp. 84-91. [CrossRef]
- Pysek, P., et al. ”Biological Invasions and the Global Economy: Costs, Impacts, and Solutions.” Philosophical Transactions of the Royal Society B: Biological Sciences, vol. 365, no. 1549, 2010, pp. 3045-3050.
- Gonzalez, R.C., and Woods, R.E. Digital Image Process-ing. 2nd ed., Prentice Hall, 2002.
- Arivazhagan, S., Shebiah, R.N., Ananthi, S., and Varthini, S.V. ”Detection of Unhealthy Region of Plant Leaves and Neural Network Model for Detecting Leaf Diseases and Assessing Invasive Species: A Computational Approach — 8/8 Classification of Plant Leaf Diseases Using Texture Fea-tures.” Agricultural Engineering International, vol. 15, no. 1, 2013.
- Ruder, S. ”An Overview of Multi-Task Learning in Deep Neural Networks.” arXiv preprint, arXiv:1706.05098, 2017. [CrossRef]
Disclaimer/Publisher’s Note: The statements, opinions and data contained in all publications are solely those of the individual author(s) and contributor(s) and not of MDPI and/or the editor(s). MDPI and/or the editor(s) disclaim responsibility for any injury to people or property resulting from any ideas, methods, instructions or products referred to in the content. |
© 2024 by the authors. Licensee MDPI, Basel, Switzerland. This article is an open access article distributed under the terms and conditions of the Creative Commons Attribution (CC BY) license (http://creativecommons.org/licenses/by/4.0/).
Copyright: This open access article is published under a Creative Commons CC BY 4.0 license, which permit the free download, distribution, and reuse, provided that the author and preprint are cited in any reuse.


