
Submitted:
13 October 2024
Posted:
16 October 2024
You are already at the latest version
Abstract
The State of Zacatecas (Mexico) is one of the places most affected by pollution from the mining industry. 21 samples from two areas have been collected (6 samples from zone A and 15 samples from zone B) to evaluate the level of radioactivity and the degree of contamination by heavy metals. The activity concentration for 238U and 232Th is within typical values, but 226Ra exceeds the value of 60 Bq kg-1 in both areas. In some places, the concentration of 40K is higher than the world average, according to UNSCEAR. The radium equivalent activity Raeq and outdoor gamma exposure dose (D) indicate that some sites present a radiological risk for the population. Excess lifetime cancer risk (ELCR) presents a higher risk than the world average in both sampled areas. Other parameters, such as the radiation index Ri, the external risk index Hex, and the internal risk index Hin, also indicate that there is a greater risk due to radiation exposure in these areas. In the case of heavy metals, some parameters, such as the enrichment factor (EF), the geoaccumulation index (Igeo), and the contamination factor (CF), show that some places in zone A and zone B are contaminated with As and Pb. However, the concentration of selenium obtained by ICP-MS in the sampled soil is higher than the average in the Earth's crust, both in mine waste dumps and in unaltered soil, which indicates that the background concentration for selenium in these places is higher than the world average.
Keywords:
Soil contamination
; Zacatecas
; Mexico
; Level of radioactivity
; Heavy metals
1. Introduction
Radioactivity and heavy metal content in soil have been investigated by many authors because it is known the health effects of some local populations induced by exposure at these chemicals [1]. So, in soils, simultaneously with the study of radioactivity, the issue of high levels of bioavailable heavy metals (HMs), should be addressed, as recommended by the International Atomic Energy Agency technical report 419 [2], since they can have both technological and regulatory implications. One of the sites where these issues are of high interest are mining areas. In this context, the present paper refers the data of radioactivity and total metal content of silver mines located in Zacatecas (México). This study is the basis on which measures can be taken to alleviate pollution due to mining activities in the area.
Human exposure to radiation comes primarily from natural sources: cosmic radiation and terrestrial radionuclides present in the environment since the formation of the Earth [1,3]. The natural radioactivity of the soil is mainly due to the presence of the parent series 238U, 232Th and 40K [4,5]. Specific terrestrial radiation levels depend on geological and geographic conditions. On the other hand, the most important artificial radionuclide is 137Cs, which is found in the soil because of anthropogenic activities, that is, tests and accidents with nuclear weapons in the atmosphere and represents a persistent environmental pollutant due to its long half-life. (T1/2 =30.1 years) and its strong affinity for binding to the soil [1]. Soil radioactivity studies can provide baseline data to assess the exposure of local populations due to external irradiation by gamma rays and internal irradiation caused by transfer of radionuclides from soil to plants used in the human diet [6]. In addition, the concentrations of 226Ra and 232Th in the soil directly influence the concentrations of the gases 222Rn and 220Rn that are alpha emitters in the air. These radioactive gases and their short-lived decay products can cause serious deleterious effects on human lung tissues and represent the main source of internal radiation exposure [7].
Heavy metals are present in the environment in natural concentration. The main natural sources of HMs in soils are volcanic eruptions and the weathering of metal-rich rocks [8]. However, the levels of HMs present in the environment have increased considerably during the last decades mainly due to human activity [9]. Among the anthropogenic activities that are considered as sources of toxic metals in the environment are industry in general, atmospheric deposition, agriculture (fertilizers, pesticides, and amendments), waste and landfills and mining activities. Contamination from the mining industry represents an important problem in many countries since it induces serious harmful impacts on the health of the local environment due to the release of HMs, which are the most dangerous anthropogenic contaminants due to their toxicity and persistence in nature [10]. When we talk about toxicity, we must emphasize that more than the total concentration of the element, we must consider its bioavailability, that is, that amount that is available for living organisms. The prolonged exposure to heavy metals is associated with chronic health problems. One of the main environmental pathways leading to human ingestion of radionuclides and heavy metals is the soil-plant-human pathway [11].
There are several processes that govern metallic behavior in the soil and that interact dynamically, making the predictability of the fate and effects of metals in the environment a complex task. Processes such as adsorption, absorption, redox reactions, parent rock alteration and the acidification buffering capacity, is influenced by biogeochemical factors such as the pH value, the cation exchange capacity -CEC-, the redox potential, the element in question and its chemical speciation – those elements that can be in various oxidation states or chemical compounds [12].
As previously stated, mining is considered one of the most important sources of heavy metals. During the last decades, most of the attention has focused on pollution from large-scale mining. However, environmental pollution related to artisanal and small-scale mining has been neglected. Most established companies have substantially improved their production techniques and taken responsibility for remediation of contaminated land to meet increasingly stringent regulatory requirements and public pressure [13]. Mining activities are prone to release toxic elements into soils through tailings, worthless ores, and subsequent smelting operations, which have caused unfavorable consequences to human health and aquatic environments [14]. The residues of old mines have a high impact and pose a threat to the environment and health, because of the rustic extraction method and its high content of heavy metals such as As, Pb, Cd, Hg, Cu, Zn and Fe, which can cause a significant damage to aquatic biota and human health [15].
The soil acts as a physical, chemical, and biological filter against contamination and is a purifying agent by acting as a sink for contaminants. The soil, then, plays a cleaning role in the environment of surface and underground waters as well as our crops and ultimately our food and that of all living organisms. As an important part of the terrestrial ecosystem, soil is the most basic natural resource for the human being living in it, which could be constantly regenerated and recycled. The rational utilization of soil resources and the protection of the soil environment are worldwide concerns [16]. In this sense, the objective of this work is to present the results of radioactivity and heavy metal content in soil samples collected in mining areas of the State of Zacatecas, Mexico, as an example of artisanal and small-scale mining and its impact in the environment.
2. Materials and Methods
2.1. Study Area
Mexico is one of the countries most affected by soil contamination by heavy metals, especially the state of Zacatecas, which is also the most important silver producer in the country [17]. With 77,684 km2, Zacatecas is the eighth largest state of the 32 states that make up the Mexican Republic. Three quarters of the territory of the State of Zacatecas correspond to arid and semi-arid zones. Among these, 14% offer beneficial conditions for agriculture, 79% for livestock, and 7% are covered by timber and non-timber forests. In the central part of the state there are chestnut soils, abundant in semi-arid zones and characterized by having a layer of caliche or loose lime. This type of soil is promising for the development of agriculture and livestock. Towards the northeast of Zacatecas there are soils characteristic of the arid and semi-arid zones of central and northern Mexico [18].
Figure 1.
Locations of the sampling places in zone A near the city of Zacatecas (Google Earth Pro).
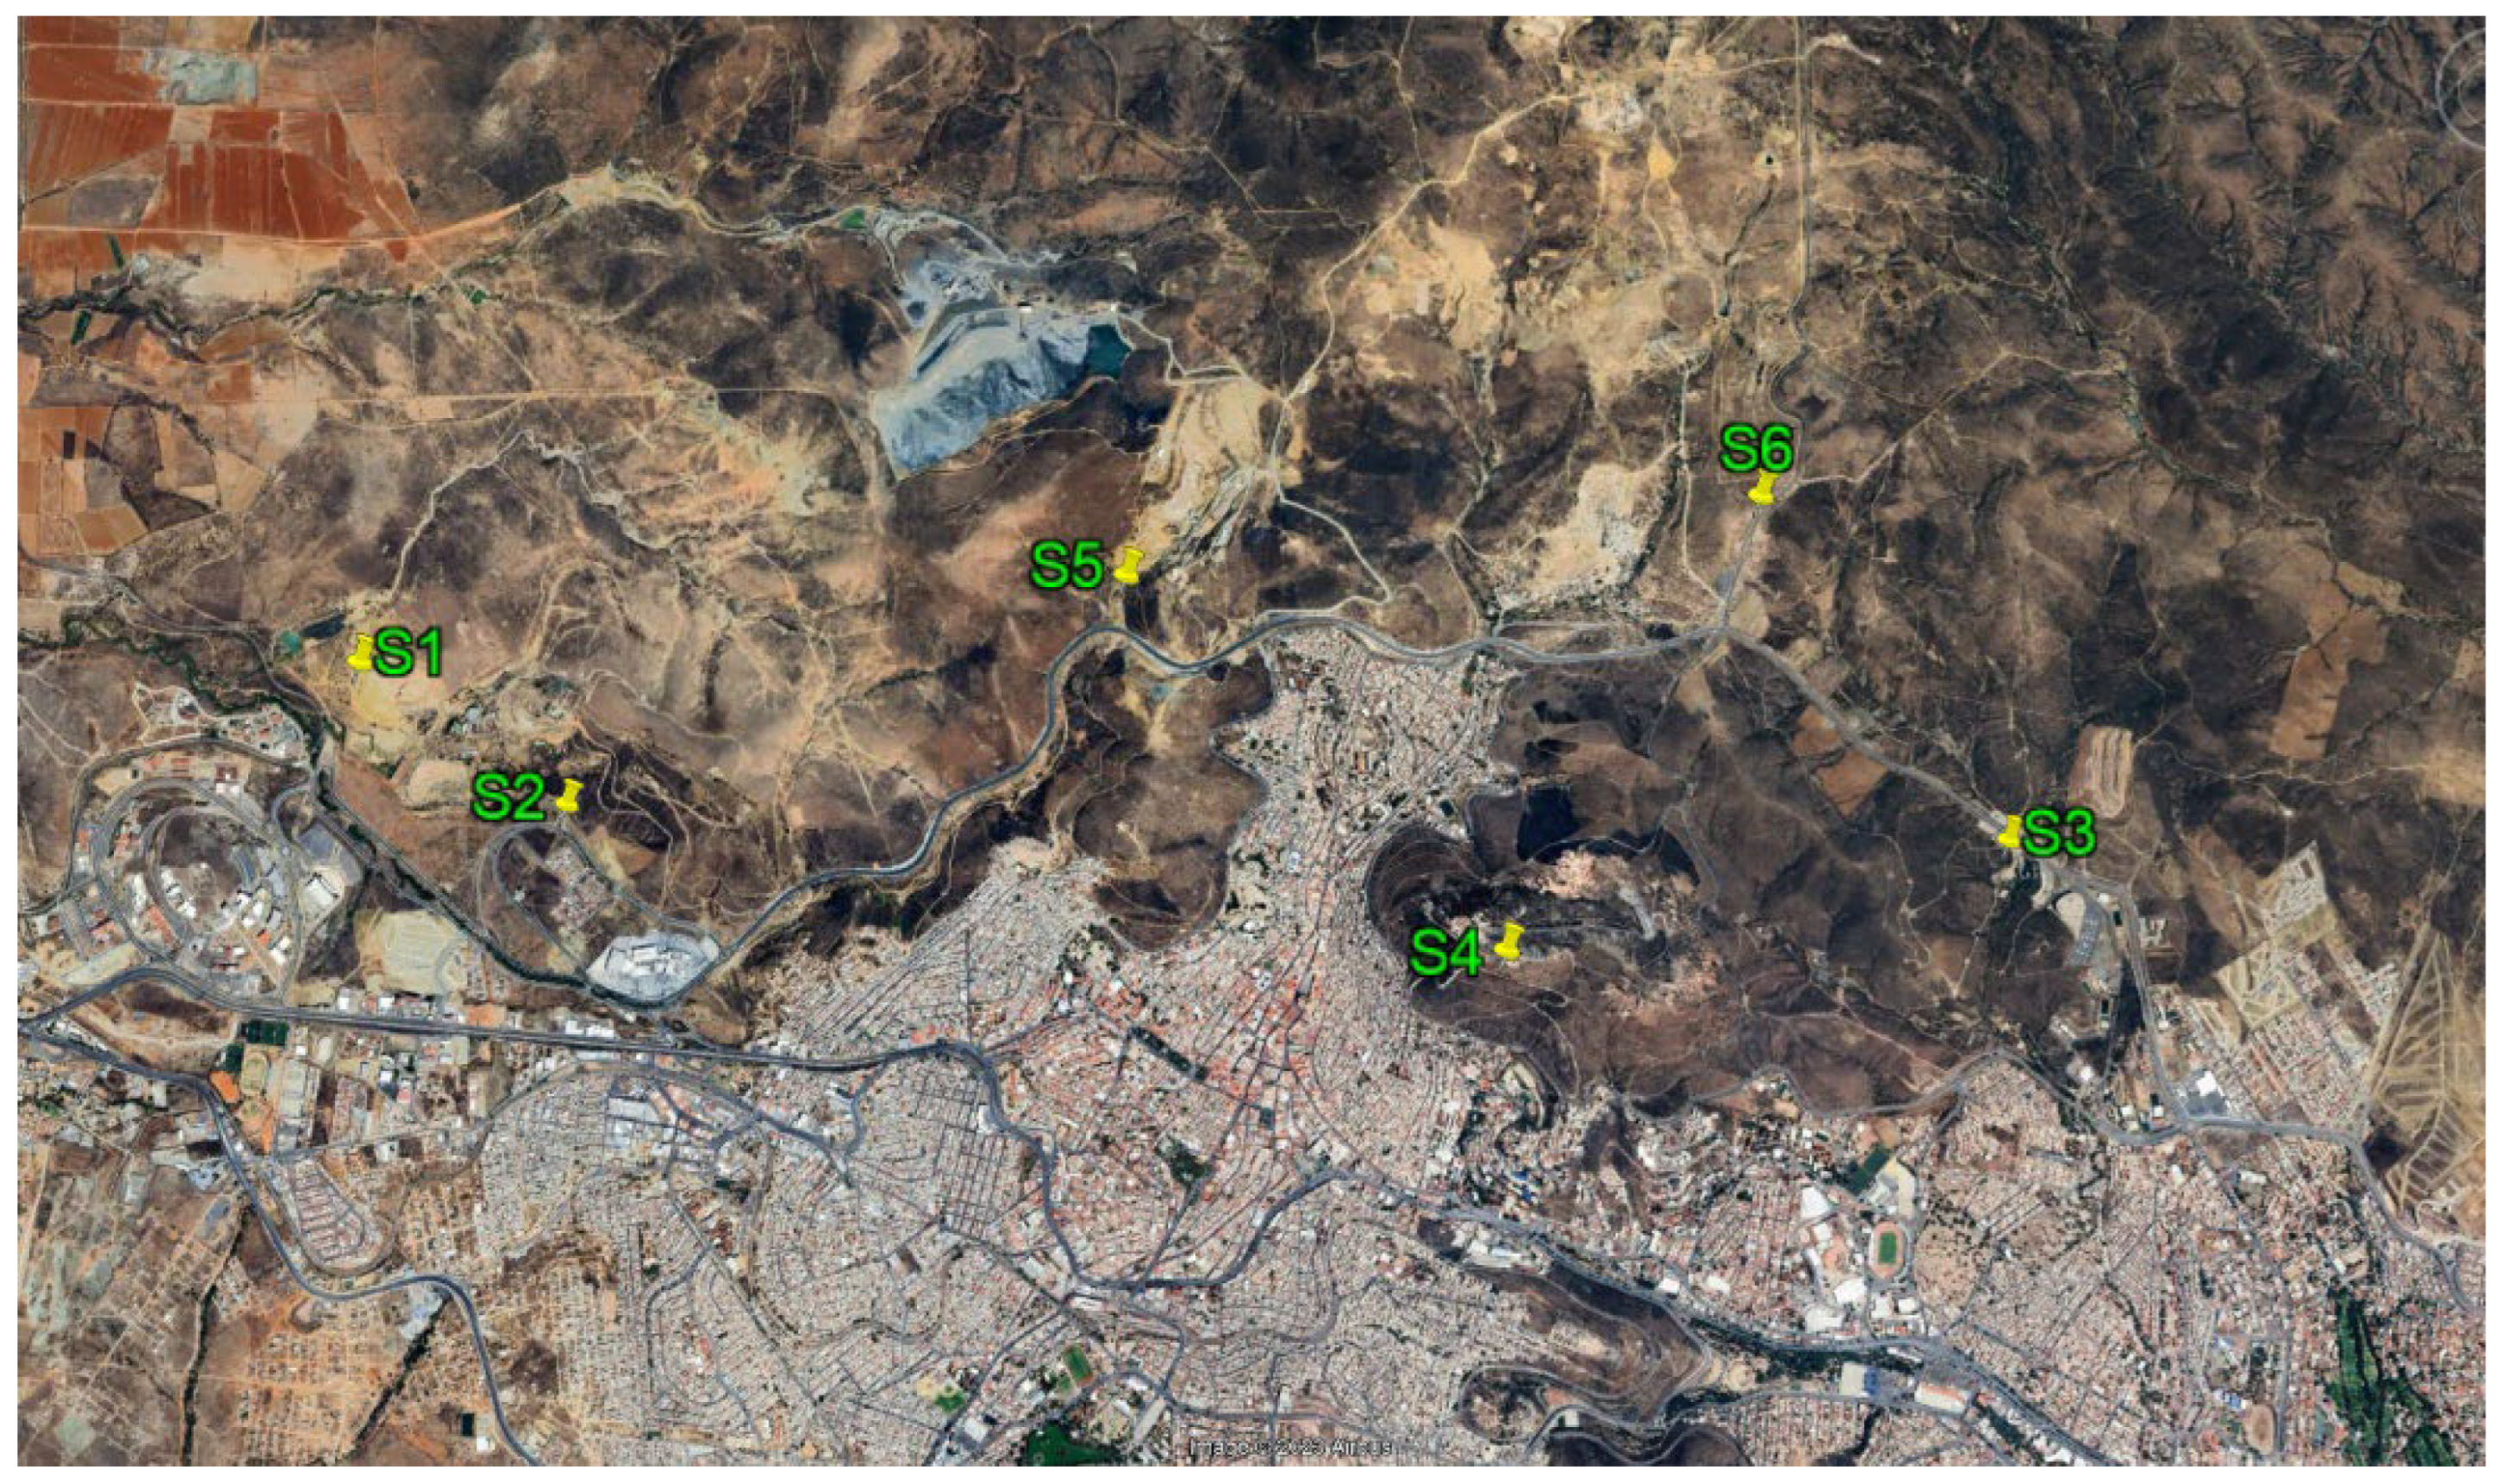
For this work, two mining areas of the state of Zacatecas were sampled. zone A (Error! Reference source not found.) is located on the outskirts of Zacatecas City, the state capital. zone B (Error! Reference source not found.) is located 260 km northeast of the capital in the municipality of Concepción del Oro. Both areas have a mining tradition of at least 200 years. In each area, two kinds of samples were collected: a) mine tailing soils and b) undisturbed soils. In total, 21 samples were collected during July and August 2021, transferred to the laboratory, and dried at 50 °C for five days. 2 kg of sample was collected from each site for the various analyses. All samples were homogenized and sieved at 2 microns. The official Mexican standard NOM-141-SEMARNAT-2003 [19] defines tailings as: solid waste generated in primary mineral separation and concentration operations.
Figure 2.
Locations of the sampling places in zone B near the city of Concepcion del Oro (Google Earth Pro).
Figure 2.
Locations of the sampling places in zone B near the city of Concepcion del Oro (Google Earth Pro).
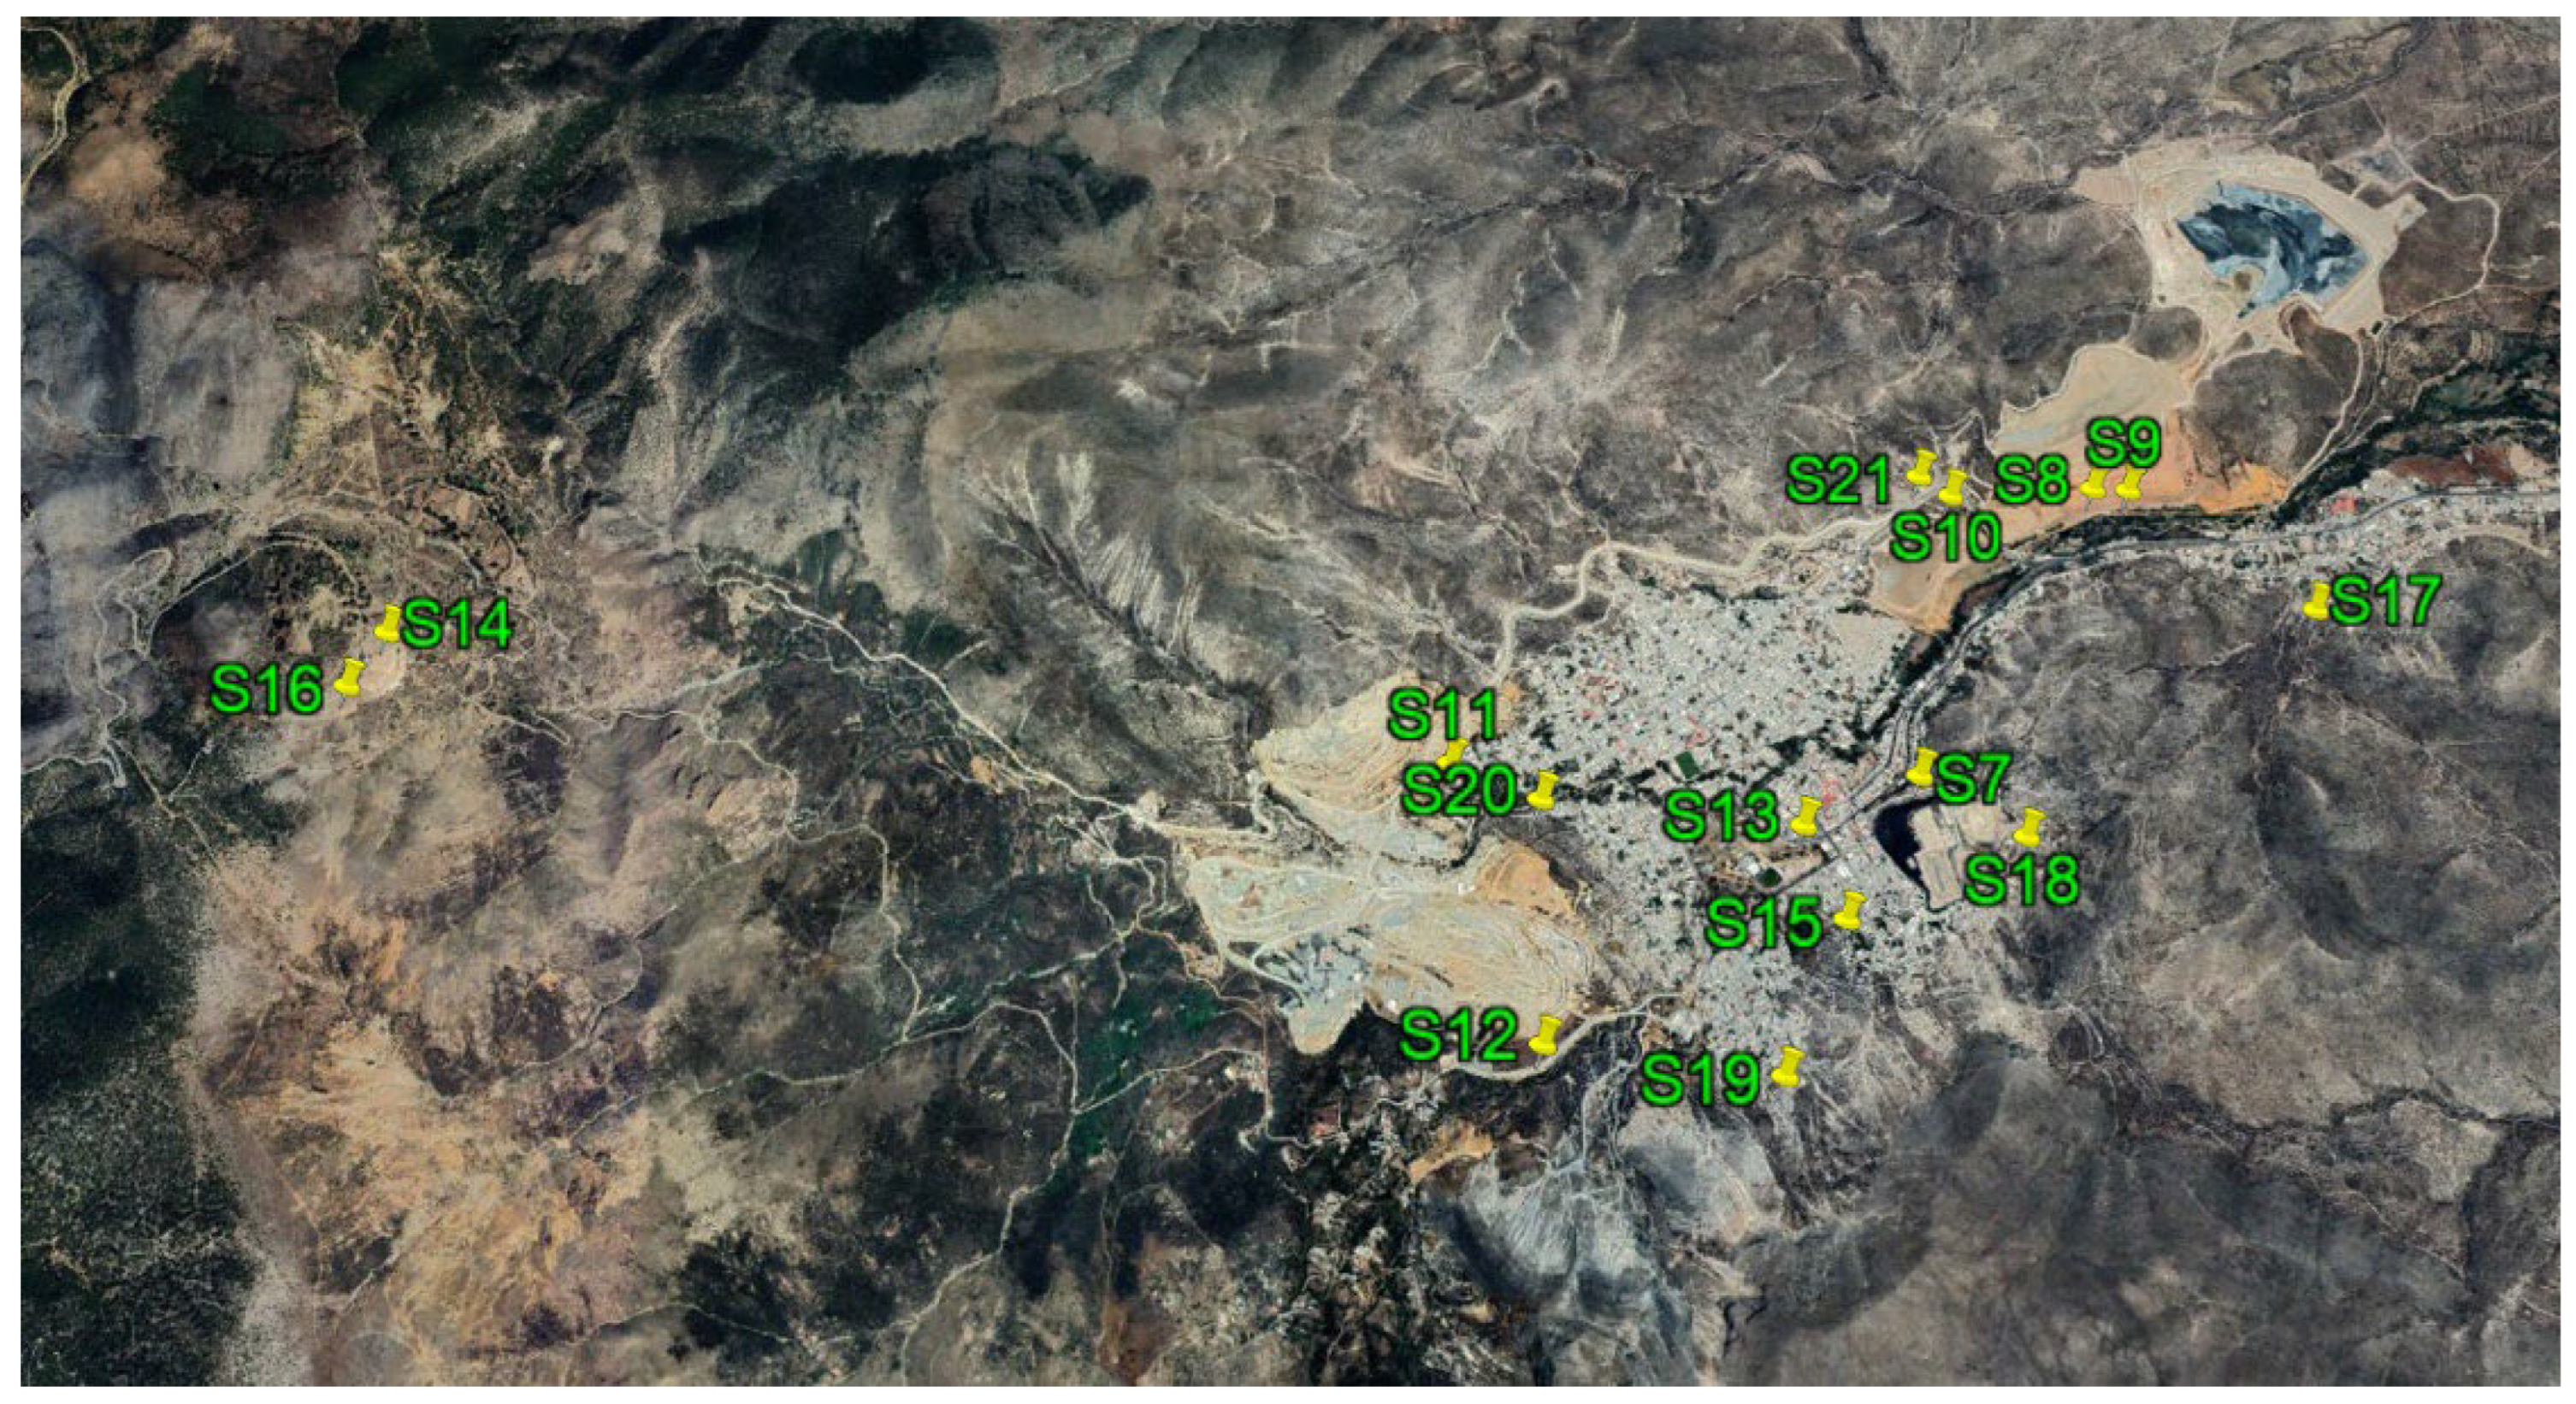

Table 1.
Location of zone A and B samples.
| Sample | Type of sample | Location | |
|---|---|---|---|
| Zone A | S1 | Mine tailings | 22º47'15"N 102°36.36"W |
| S2 | Mine tailings | 24°36'48"N 101°24'51"W | |
| S3 | Undisturbed soil | 22°46'52"N 102°32'42"W | |
| S4 | Undisturbed soil | 22°46'36"N 102°33'52"W | |
| S5 | Mine dump | 22°47'25"N 102°34'46"W | |
| S6 | Undisturbed soil | 22°79'31"N 102°55'53"W | |
| Zone B | S7 | Mine tailings | 24°37'12"N 101°24'40"W |
| S8 | Mine tailings | 24°37'16"N 101°24'30"W | |
| S9 | Mine tailings | 24°37'16"N 101°24'27"W | |
| S10 | Mine tailings | 24°37'15"N 101°24'45"W | |
| S11 | Undisturbed soil | 24°36'20"N 101°25'60"W | |
| S12 | Mine tailings | 24°36'49"N 101°25'37"W | |
| S13 | Mine tailings | 24°36'23"N 101°25'28"W | |
| S14 | Mine tailings | 24°36'43"N 101°25'20"W | |
| S15 | Mine tailings | 24°36'57"N 101°27'26"W | |
| S16 | Undisturbed soil | 24°37'17"N 101°24'48"W | |
| S17 | Undisturbed soil | 24°36'42"N 101°24'41"W | |
| S18 | Undisturbed soil | 24°36'46"N 101°25'28"W | |
| S19 | Undisturbed soil | 24°37'30"N 101°24'90"W | |
| S20 | Undisturbed soil | 22°46'54"N 102°36'50"W | |
| S21 | Mine tailings | 24°37'20"N 101°27'23"W |
Error! Reference source not found. show the sampling location, type of sample, as well as the pH value of the collected samples for both zone A and zone B.
2.2. Radioactivity Analysis.
Radioactivity was measured in the laboratory of the Unidad Académica de Estudios Nucleares de la Universidad Autónoma de Zacatecas, México. For radioactivity determination, ~500 g was weighed and allowed to sit for 30 days in a sealed Marinelli container to allow 226Ra and its progeny to reach equilibrium.
The activity concentrations in the samples were measured using a high-purity germanium (HPGe) detector with a relative efficiency of 38%. The energy resolution of the HPGe detector is 1.8 keV at 1.33 MeV 60Co gamma line. A 16K multichannel analyzer was used to obtain the spectrum, and the analysis was performed using the GENIE-2k software (Canberra Industry). The samples were measured for 80 000 s with an operating voltage of 3900 volts. The system was previously calibrated for energy and efficiency using calibrated sources.
Considering the complexity of the samples, the gamma radiation-emitting radionuclides analyzed in this work were conveniently grouped. The grouping of radionuclides proposed by Murray et al. [20] and Gil-Pacheco et al. [21] was considered; the classification of radionuclides used for this work is shown in Error! Reference source not found..
Table 2.
Groups of gamma-emitting radionuclides used in this work, based on the classification of Murray et al., [20] and Gil-Pacheco et al. [21]. The shaded groups have not been considered in this work.
| Group | Radionuclide Long half-life | Gamma emitting nuclide | Gamma-ray energy (keV) | Gamma-emitting nuclides included |
|---|---|---|---|---|
| A | 238U |
234Th 234mPa |
63.30 ± 0.02 1001.30 ± 0.02 |
238U, 234Th 234Pa, 234mPa |
| B | 230Th | 230Th | 67.67 ± 0.01 |
230Th |
| C |
226Ra 222Rn |
226Ra 214Pb 214Bi |
186.21 ± 0.01 351.932 ± 0.002 609.312 ± 0.007 1120.29 ± 0.01 1764.49 ± 0.01 |
226Ra, 222Rn 214Pb, 214Bi 210Tl |
| D | 210Pb | 210Pb | 46.539 ± 0.001 |
210Pb |
| E | 235U | 235U | 143.767 ± 0.003 163.356 ± 0.003 205.316 ± 0.004 |
235U series |
| F |
232Th 228Ra |
(-) 228Ac |
(-) 911.196 ± 0.002 |
232Th, 228Ra 228Ac |
| G |
228Th 220Rn |
224Ra 212Pb 208Tl |
(-) 238.632 ± 0.002 583.187 ± 0.002 |
228Th, 224Ra 220Rn, 212Pb 212Bi, 208Tl |
In group A only 238U has been considered, and the gamma-emitting radionuclides selected were 234Th and 234mPa. 230Th belonging to group B was not considered for this work due to its low concentration. Group C includes 226Ra and 222Rn and their progeny; the activity concentration of 226Ra was determined from the γ peak at 186 keV by suppressing the gamma interference of the 235U peak at 185.7 keV. The activity concentration of 214Pb and 214Bi was determined by measuring the γ energies at 351 and 609 keV, and 1120 keV and 1764.5 keV respectively. 210Pb belonging to group D and 235U from group E were not used for this work either due to their low concentration in nature, or to the fact that some photopics of these radionuclides are interfered with by others of greater importance. The critical element of group F is 228Ac, and the γ peak at 911 keV was selected to determine the activity concentration. The 232Th activity concentration of group G was averaged with the γ-rays at 238.6 keV and 583.2 keV emitted by 212Pb and 208Tl, respectively.
In addition to the natural gamma-emitting radionuclides of the 238U, 235U, and 232Th series, other natural and artificial gamma emitters were analyzed, such as 40K and 137Cs, which were measured using the photopics at 1460.83 and 661 keV, respectively.
Different parameters and radiological hazard indices were calculated from the data obtained from the radiation measurements of the samples: Radio Equivalent Activity (Raeq) [11], Absorbed Dose () [21,22], Effective Dose (E) [21], Excess Lifetime Cancer Risk due to gamma-ray radiation (ELCR) [1], External Risk Index (Hex) [11], Internal Risk Index (Hin) [11] and finally, the Radioactivity Index (Ri) [21].
The Radio equivalent activity () describes the gamma emission of different naturally occurring radionuclides in a material and was calculated using the following formula:
where , , and are specific activities of 226Ra, 232Th, and 40K, respectively. The recommended limit of Raeq, given by UNSCEAR 2000, is 370 kg−1 [4].
The absorbed dose () by gamma radiation at 1 m above the ground surface is determined using the following formula:
where , , and are, respectively, the activity mass concentrations (in Bq kg-1) of 40K, 226Ra and 232Th in nGy h-1.
The absorbed dose rate in the air due to the measured activity concentration values of the different groups (DP˙, nGy h-1) in the samples under study was converted into the effective dose rate (), in units of mSv y-1 using the following expression:
where (equal to 0.2) is the outdoor occupancy factor, (equal to 0.7 Sv Gy-1) is the conversion factor from the dose absorbed in the air to the effective dose received by an adult person.
The excess lifetime cancer risk (ELCR) [27] due to gamma-ray radiation per 100 000 people is estimated using the following expression:
where is the annual effective dose in mSv, is the lifespan (equal to 70 years), and is the risk of fatal cancer per Sv (equal to 0.057 Sv-1). The ELCR is used to characterize the elevated risk of cancer due to chronic exposure to gamma rays.
The external risk index () provides an assessment of the health risk associated with the emission of gamma radiation by various natural radionuclides, while the internal risk index () estimates the internal exposure of living cells to radon and its progeny [11].
and were calculated as follows:
where , , and are specific activities of 226Ra, 232Th, and 40K, respectively. The limit of these indexes should be less or equal to unity, as reported by UNSCEAR and ICRP [23,24].
The radioactivity index (Ri) proposed by Gil-Pacheco et al. [21] has been calculated using the following formula:
Which CGX is the activity concentration of group X, and CK and CCs are the activity concentrations of K and Cs, respectively.
2.3. Chemical and Structural Characterization
Fifty grams of each sample were transported to the Centro de Investigaciones Energéticas, Medioambientales y Tecnológicas (CIEMAT), Spain, for chemical and structural characterization.
Major elements were determined by Wavelength Dispersive X-ray Fluorescence (WDXRF) with an AXIOS Spectrometer (Malvern-PANalytical), in pressed powder pellets previously prepared in an automatic press HTP-40 (Herzog). The pellets were analyzed with a semi-quantitative method developed by Malvern-PANalytical.
A previous acid digestion of the samples in a temperature control microwave oven was required by using a Milestone Ethos 1 device to put the sample into solution for the following determinations:
Sodium and potassium were determined by Flame Atomic Emission Spectroscopy (FAES) in a Perkin-Elmer 2280 equipment. Minor and trace elements were determined by Inductively Coupled Plasma Optical Emission Spectroscopy (ICP-OES) and Inductively Coupled Plasma Mass Spectrometry (ICP-MS) as a function of the element concentrations: ICP-OES was used for concentrations higher than 0.05 mg/L and ICP-MS for lower concentrations.
ICP-OES measurements were performed by using a benchtop dual view ICP-OES with a vertical torch, Agilent 5110 model (Agilent Technologies Spain, S.L., Spain). Two or three different wavelengths were used for each element quantification and the averages of each element lines were considered in the cases of non-interferences.
ICP-MS analyses were made with a Thermo iCAP-RQ (Thermo Scientific, Darmstadt, Germany) spectrometer equipped with a quadrupole mass analyzer and an electron multiplier detector. A Meinhard nebulizer (Meinhard, Colorado, USA) with a baffled cyclonic spray chamber and a peristaltic pump were used for sample introduction.
The crystalline phases identification was made by X-ray diffraction (XRD) in an X’Pert Pro diffractometer (Malvern-PANalytical) with Cu Kradiation (λ = 1.54 Å) operating at 45 kV and 40 mA. XRD data were collected in θ-θ configuration in the angular range of 5 < 2θ < 80 with a 0.017 step size.
2.4. pH in water and CaCl2
The pH determination was carried out according to Technical Norm ASTM-D4972-13 [25]. The pH measurements were carried out in water and a calcium chloride solution (CaCl2 0.01 M) because calcium displaces part of the exchangeable aluminum. The low ionic strength counteracts the dilution effect on the exchange equilibrium by setting the salt concentration of the solution closer to that expected in the soil solution. The pH values obtained in the calcium chloride solution are slightly lower than those measured in water due to the release of more aluminum ions, which are then hydrolyzed. Therefore, both measurements are required to define soil pH character entirely. The measurement was made with an Orion model 550 pHmeter, using an Orion 8102BN electrode. The pHmeter was calibrated at 3 points (4, 7 and 10) using certified buffer solutions from Mettler-Toledo. Soil samples were dried and sieved to 2 μm. Two solutions were prepared in a 1:1 liquid to solid ratio:10 ml of water/10 g of soil and 10 ml of 0.01 M CaCl2/10 g of soil. Both solutions were left stirring for 2 hours and allowed to rest for one hour; then, the pH of each of the solutions was measured to obtain the soil pH value. Each solution was measured twice.
2.5. Impact Parameters for Heavy Metals
To measure the degree of impact of heavy metals in the sampled soils, three parameters were determined:
Enrichment factors (EFs): EFs are used to evaluate the degree of heavy metal contamination. EF is estimated by using the following equation:
where is the concentration of the target element, and is the concentration of the reference element [26]. Iron was chosen as the reference element due to its low coefficient of variation (CV) in these samples.
The baseline metal concentrations from standard pre-industrial reference level (in mg kg-1) [26] considered in this work are: 15 for As, 1.0 for Cd, 90 for Cr, 68 for Ni, 70 for Pb, 0.6 for Se, 0.9 for Tl, 2.7 for U and 10.5 for Th. EF classification is as follows: EF<1 indicates no enrichment, EF<3 is minor enrichment, EF=3-5 is moderate enrichment, EF=5-10 is moderately severe enrichment, EF=10-25 is severe enrichment, EF=25-50 is a very severe enrichment and EF>50 is an extremely severe enrichment [26].
The geoaccumulation index () [26]: Igeo is applied to quantify metal contamination in soils and is calculated using the following equation:
where is the metal concentration measured in soil samples in the study area, is the background value of the corresponding metal (the values mentioned in the previous parameter), and 1.5 is the background matrix correction due to lithological effects. Igeo determines seven degrees or classes of contamination: i) > 5 = extremely contaminated, (ii) = 4–5 = heavily to extremely contaminated, (iii) = 3–4 = heavily contaminated, (iv) = 2–3 = moderately to heavily contaminated, (v) = 1–2 = +moderately contaminated, (vi) = 0–1= not contaminated to moderately contaminated, and (vii) < 0 = not contaminated [26].
The Contamination Factor (CF): CF is the relationship obtained by dividing the concentration of each metal in the soil (by the base or background value (concentration in uncontaminated soil () [26]:
Pollution levels can be classified according to their intensities on a scale ranging from 1 to 6 (0 = none, 1 = none to medium, 2 = moderate, 3 = moderately to strongly contaminated, 4 = heavily contaminated, 5 = strongly to very strong, 6 = very strong) [26].
3. Results and Discussion
3.1. Radioactivity Levels and Their Impact
Activity concentrations of natural and man-made radionuclides in mine tailings and undisturbed soils were evaluated. The radioactivity evaluation was carried out in order to estimate various parameters, such as the absorbed dose and the probability of cancer risk due to continuous exposure to ionizing radiation as a result of the ingestion and inhalation of radionuclides from the soil matrix collected in the study area.
The results obtained in the gamma spectrometry system of zone A and B samples are shown in Error! Reference source not found..
Table 3.
Results of the specific activity concentration (Bq kg-1) of zones A and B samples and world average radionuclide content in soil in Bq kg-1, UNSCEAR 2000 [4.].
Table 3.
Results of the specific activity concentration (Bq kg-1) of zones A and B samples and world average radionuclide content in soil in Bq kg-1, UNSCEAR 2000 [4.].
| Sample | Group A 238U |
Group C 226Ra |
Group F 232Th |
Group G 228Th |
40K | 137Cs | |
|---|---|---|---|---|---|---|---|
| Zone A | S1 | 62.81 ± 1.44 | 165.48 ± 0.98 | 24.35 ± 0.55 | 23.94 ± 0.61 | 967.58 ± 13.11 | 0.68 ± 0.02 |
| S2 | 52.26 ± 1.48 | 259.98 ± 1.64 | 40.77 ± 0.92 | 48.22 ± 1.24 | 1356.02 ± 18.37 | 0.63 ± 0.02 | |
| S3 | 51.22 ± 1.18 | 171.46 ± 1.05 | 25.92 ± 0.58 | 27.49 ± 0.7 | 1123.12 ± 15.21 | 0.07 ± 0.01 | |
| S4 | 80.71 ± 1.49 | 303.45 ± 1.9 | 58.93 ± 1.32 | 69.26 ± 1.79 | 1348.26 ± 18.26 | 2.87 ± 0.08 | |
| S5 | 115.92 ± 2.33 | 124.26 ± 1.09 | 15.18 ± 0.49 | 14.92 ± 0.54 | 845.92 ± 16.56 | 0.16 ± 0.01 | |
| S6 | 86.79 ± 1.92 | 177.86 ± 1.1 | 24.92 ± 0.56 | 29.14 ± 0.75 | 812.99 ± 11.01 | 1.89 ± 0.05 | |
| Range | 51.22-115.92 | 124.26-303.45 | 15.18-58.93 | 14.92-69.26 | 812.99-1356.02 | 0.07-2.87 | |
| Mean | 74.95 | 200.42 | 31.68 | 35.5 | 1075.65 | 1.05 | |
| Zone B | S7 | 103.11 ± 2.10 | 259.98 ± 2.31 | 12.44 ± 0.28 | 9.64 ± 0.24 | 401.35 ± 5.44 | 0.58 ± 0.02 |
| S8 | 97.91 ± 1.98 | 259.98 ± 2.13 | 27.41 ± 0.62 | 26.69 ± 0.68 | 949.28 ± 12.86 | 2.10 ± 0.06 | |
| S9 | 59.41 ± 1.80 | 105.76 ± 0.62 | 9.66 ± 0.22 | 6.70 ± 0.16 | 324.17 ± 4.13 | 2.00 ± 0.06 | |
| S10 | 60.13 ± 1.54 | 242.20 ± 1.50 | 18.22 ± 0.41 | 13.49 ± 0.33 | 597.77 ± 8.10 | 1.07 ± 0.03 | |
| S11 | 87.11 ± 1.81 | 315.91 ± 2.05 | 37.02 ± 0.86 | 42.80 ± 1.14 | 1121.25 ± 15.69 | 0.69 ± 0.02 | |
| S12 | 120.25 ± 3.72 | 276.49 ± 1.72 | 23.97 ± 0.54 | 22.39 ± 0.57 | 732.21 ± 9.92 | 2.09 ± 0.06 | |
| S13 | 160.18 ± 2.99 | 292.74 ± 1.82 | 24.95 ± 0.56 | 22.94 ± 0.58 | 851.84 ± 11.54 | 0.57 ± 0.02 | |
| S14 | 152.28 ± 1.98 | 596.26 ± 3.86 | 15.72 ± 0.35 | 14.23 ± 0.36 | 354.92 ± 4.81 | 1.10 ± 0.03 | |
| S15 | 106.03 ± 2.09 | 308.47 ± 1.89 | 26.24 ± 0.57 | 27.11 ± 0.67 | 824.09 ± 10.73 | 2.12 ± 0.06 | |
| S16 | 112.86 ± 2.44 | 324.65 ± 1.63 | 30.14 ± 0.54 | 32.92 ± 0.67 | 1237.67 ± 13.28 | 0.41 ± 0.01 | |
| S17 | 95.43 ± 2.05 | 281.92 ± 2.01 | 23.19 ± 0.58 | 22.84 ± 0.65 | 658.66 ± 10.01 | 6.35 ± 0.21 | |
| S18 | 151.63 ± 2.52 | 503.49 ± 2.61 | 48.32 ± 0.88 | 57.07 ± 1.19 | 929.78 ± 10.20 | 0.39 ± 0.01 | |
| S19 | 99.94 ± 1.64 | 251.54 ± 1.07 | 43.49 ± 0.67 | 50.98 ± 0.90 | 1309.66 ± 12.11 | 0.14 ± 0.01 | |
| S20 | 120.99 ± 1.54 | 190.07 ± 0.79 | 31.63 ± 0.48 | 32.23 ± 0.56 | 1086.02 ± 10.04 | 2.10 ± 0.04 | |
| S21 | 82.55 ± 1.18 | 390.56 ± 2.52 | 44.97 ± 1.01 | 53.31 ± 1.37 | 1347.95 ± 18.26 | 0.59 ± 0.02 | |
| Range | 59.41-160.18 | 105.76-596.26 | 9.66-48.32 | 6.70-57.07 | 324.17-1347.95 | 0.14-6.35 | |
| Mean | 107.32 | 306.67 | 27.82 | 29.02 | 883.69 | 1.48 | |
|
World average |
Range | 16-110 | 17-60 | 11-64 | 140-850 | ||
| Mean | 35 | 35 | 30 | 400 |
The specific activity of 238U varied from 51.22 to 160.18 Bq kg-1 in the 21 samples collected in the two studied areas. For 226Ra a range between 105.76 and 596.26 Bq kg-1 was found, 232Th varied from 9.66 to 58.93 Bq kg-1and the specific activity concentration for 228Th ranged between 6.70 and 69.26 Bq kg-1. The 40K showed a range from 324.17 to 1356.02 Bq kg-1. The anthropogenic radioisotope of 137Cs presents a range between 0.07 and 6.35 Bq kg-1.
Error! Reference source not found. also resents the range and mean of global activity concentrations of 40K, 238U, 226Ra, and 232Th according to UNSCEAR 2000 [4]. Comparing these values with those showed in zones A and B, it is observed that there is a high concentration of 40K activity in zone A. Unlike zone B, some sampled zones present low concentrations of 40K, and others have high concentrations.
In the case of 238U (group A), almost all the activity concentrations are found above the UNSCEAR global range, as did 226Ra (group C). However, 232Th (group F) is in the world range reported by UNSCEAR.
More recent specific activity data is shown in the UNSCEAR 2008 report Annex B, page 233, paragraph 77 [27]. Current global average values are 33 Bq kg-1 for 238U, 32 Bq kg-1 for 226Ra, and 45 Bq kg-1 for 232Th. The mean value for 40K, 412 Bq kg-1, is also close to the previous value (400 Bq kg-1). Although average concentrations of natural radionuclides in soils are low, there is wide variation, with reported levels of up to 1000 Bq kg-1 for 238U, 360 Bq kg-1 for 232Th, and 3200 Bq kg-1 for 40K [27].
The activity concentration of 40K is widely distributed across the study area. The highest activity concentration of natural radionuclides in soil was obtained from sample S6 in zone A, this area is characterized by limestone. The study revealed a non-uniform distribution of these radionuclides which is due to the geological variability of the area.
Error! Reference source not found. shows the average specific activity concentrations in various places worldwide. It can be concluded that the four main natural radionuclides have very variable activity concentrations from one place to another. In our samples, 238U, 226Ra, and 40K are found in high concentrations concerning the average shown in this table, but 232Th is within the average of this same table.
Table 4.
Average specific activity concentration of the radionuclides studied in this work and other parts of the world [3].
Table 4.
Average specific activity concentration of the radionuclides studied in this work and other parts of the world [3].
| 238U (Bq kg-1) | 226Ra (Bq kg-1) | 232Th (Bq kg-1) | 40K (Bq kg-1) | |
|---|---|---|---|---|
| This work zone A | 75 | 200 | 35 | 1076 |
| This work zone B | 107 | 307 | 28 | 884 |
| Algeria | 30 | 50 | 25 | 370 |
| Egypt | 37 | 17 | 18 | 320 |
| Costa Rica | 46 | 46 | 11 | 140 |
| United states | 35 | 40 | 35 | 370 |
| China | 33 | 32 | 41 | 440 |
| Hong Kong | 84 | 59 | 95 | 530 |
| India | 29 | 29 | 64 | 400 |
| Japan | 29 | 33 | 28 | 310 |
| Kazakstan | 37 | 35 | 60 | 300 |
| Malaysia | 66 | 67 | 82 | 310 |
| Thailand | 114 | 48 | 51 | 230 |
| Armenia | 46 | 51 | 30 | 360 |
| Syrian Arab Republic | 23 | 20 | 20 | 270 |
| Norway | 50 | 50 | 45 | 850 |
| Ireland | 37 | 60 | 26 | 350 |
| Switzerland | 40 | 40 | 25 | 370 |
| Bulgaria | 40 | 45 | 30 | 400 |
| Hungary | 29 | 33 | 28 | 370 |
| Poland | 26 | 26 | 21 | 410 |
| Romania | 32 | 32 | 38 | 490 |
| Russian Federation | 19 | 27 | 30 | 520 |
| Slovakia | 32 | 32 | 38 | 520 |
| Croatia | 110 | 54 | 45 | 490 |
| Greece | 25 | 25 | 21 | 360 |
| Portugal | 49 | 44 | 51 | 840 |
| World average | 40 | 37 | 36 | 369 |
3.2. Contamination Assessment by Radionuclides
The activity concentration of 226Ra, 232Th, and 40K in soil samples varies significantly. The radius equivalent (Raeq) is used to address this issue. The Raeq represents the activity of a sample in terms of an equivalent amount of 226Ra [28]. This assumes that all radiation from other radionuclides in the sample can be attributed to the presence of 226Ra. The formula for Raeq considers the specific activities of 226Ra, 232Th, and 40K in the soil sample. Raeq provides a more straightforward way to compare the radiation levels of different soil samples despite their non-uniform distribution of radionuclides [29].
The average Raeq value of soil samples in Error! Reference source not found. was in many samples above the internationally recommended limit of 370 Bq [29], and there are sites that double this value. Thus, we conclude that there is a risk for the population in some places.
Table 5.
Parameters obtained from the activity concentration of the samples from zones A and B.
| Sample |
Raeq Bq kg-1 |
) nGy h-1 |
E mSv y-1 |
ELCR mSv |
Hex mSv y-1 |
Hin mSv y-1 |
Ri nGy h-1 |
|
|---|---|---|---|---|---|---|---|---|
| Zone A | S1 | 275.23 | 134.69 | 0.16 | 0.00065 | 0.744 | 1.191 | 0.76 |
| S2 | 422.70 | 201.28 | 0.25 | 0.00100 | 1.142 | 1.845 | 1.18 | |
| S3 | 295.01 | 141.70 | 0.17 | 0.00070 | 0.797 | 1.260 | 0.82 | |
| S4 | 491.53 | 232.01 | 0.28 | 0.00115 | 1.328 | 2.148 | 1.37 | |
| S5 | 211.11 | 101.85 | 0.12 | 0.00050 | 0.570 | 0.906 | 0.59 | |
| S6 | 276.10 | 131.13 | 0.16 | 0.00065 | 0.113 | 0.113 | 0.77 | |
| Range | 211.11-491.53 | 101.85-232.01 | 0.12-0.28 | 0.0005-0.0012 | 0.11-1.33 | 0.11-2.15 | 0.59-1.37 | |
| Mean | 328.61 | 157.11 | 0.19 | 0.0008 | 0.78 | 1.24 | 0.92 | |
| Zone B | S7 | 409.54 | 190.96 | 0.23 | 0.00095 | 1.107 | 2.082 | 1.10 |
| S8 | 443.37 | 209.10 | 0.26 | 0.00104 | 1.198 | 2.093 | 1.21 | |
| S9 | 144.54 | 68.22 | 0.08 | 0.00034 | 0.391 | 0.676 | 0.39 | |
| S10 | 314.28 | 147.83 | 0.18 | 0.00073 | 0.849 | 1.504 | 0.85 | |
| S11 | 455.18 | 215.07 | 0.26 | 0.00107 | 1.230 | 2.084 | 1.26 | |
| S12 | 367.14 | 172.75 | 0.21 | 0.00086 | 0.992 | 1.739 | 1.00 | |
| S13 | 393.86 | 185.77 | 0.23 | 0.00092 | 1.064 | 1.855 | 1.07 | |
| S14 | 646.07 | 299.77 | 0.37 | 0.00149 | 1.746 | 3.358 | 1.73 | |
| S15 | 409.45 | 192.73 | 0.24 | 0.00096 | 1.106 | 1.940 | 1.12 | |
| S16 | 463.06 | 219.81 | 0.27 | 0.00109 | 1.251 | 2.129 | 1.28 | |
| S17 | 365.80 | 171.72 | 0.21 | 0.00085 | 0.988 | 1.750 | 1.00 | |
| S18 | 644.18 | 300.57 | 0.37 | 0.00147 | 1.741 | 3.101 | 1.76 | |
| S19 | 414.57 | 197.09 | 0.24 | 0.00098 | 1.120 | 1.800 | 1.16 | |
| S20 | 318.92 | 152.20 | 0.19 | 0.00076 | 0.862 | 1.375 | 0.88 | |
| S21 | 558.67 | 263.81 | 0.32 | 0.00131 | 1.509 | 2.565 | 1.55 | |
| Range | 144.54-646.07 | 68.22-300.57 | 0.08-0.37 | 0.0003-0.0015 | 0.39-1.75 | 0.68-3.36 | 0.39-1.76 | |
| Mean | 423.24 | 199.16 | 0.24 | 0.001 | 1.14 | 2.00 | 1.16 |
Most samples from zone A and B have an outdoor gamma exposure dose value (D) above 100 nGy h-1. According to UNSCEAR, the average outdoor gamma exposure dose is calculated at 54 nGy h-1 [27].
All samples from both areas present an effective dose ratio (E) below or within the normal range according to UNSCEAR [27] from 0.3 to 1.0 mSv y-1. Average worldwide exposure to natural radiation sources is 2.4, ranging from 1 to 10 mSv y-1 (UNSCEAR 2000) [4]. According to the values obtained from the annual effective dose from natural radionuclides shown in Table 5, it is low for the population.
Long-term exposure to radiation could have some risks of causing cancer. This implies that every individual has a risk of getting cancer at a time in his lifetime. The world’s average ELCR per 100 000 people is 2.9 ×10⁻⁴ [11] and in Error! Reference source not found. ELCR values are above this value in all the studied samples.
Figure 3.
The values of the parameters obtained from zones A and B are shown. The units for the graphed parameters are radius equivalent Bq kg-1, absorbed dose nGy h-1, effective dose ratio mSv y-1, lifetime excess cancer risk mSv, external risk mSv y-1, internal risk mSv y-1, radioactivity index nGy h-1. Graphs a) and b) correspond to the data obtained from the six samples of zone A. Graphs c) and d) are the results of the 14 samples of zone B .
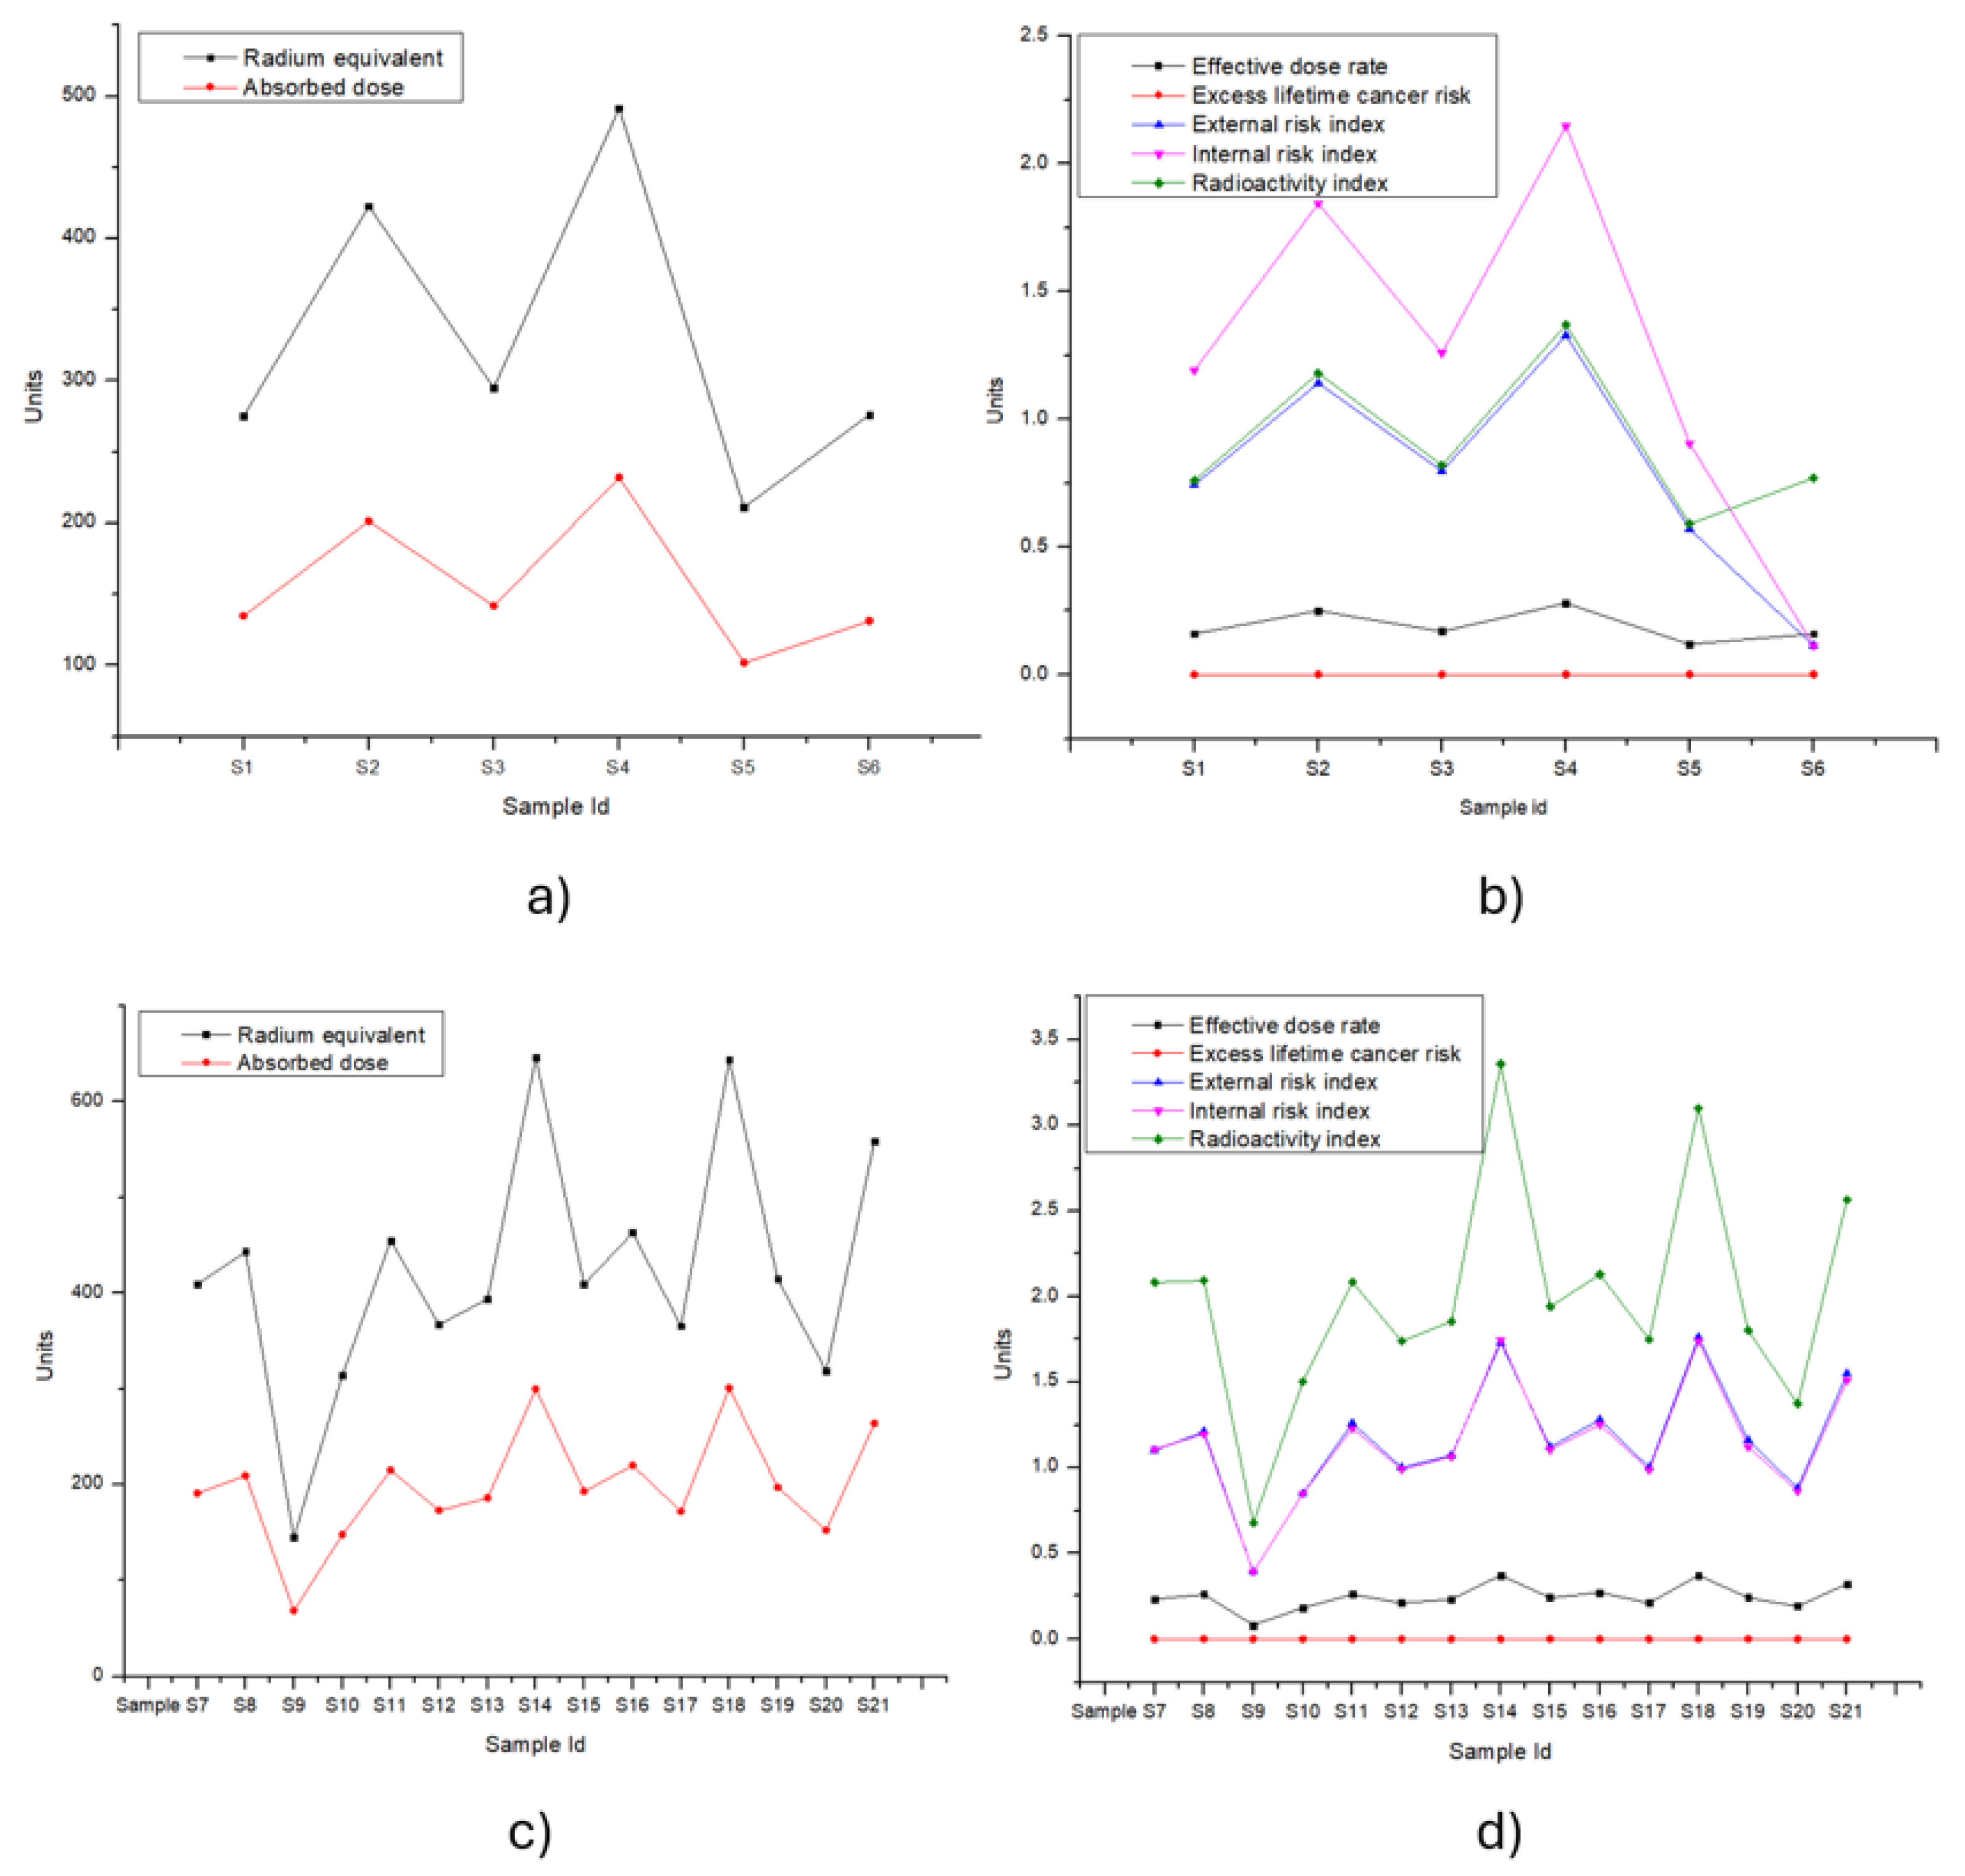
The radiation index Ri was close to 1 in all samples from zone A, but in zone B the value was slightly higher than 1, which implies that there is a little more risk of irradiation in zone B.
The average of the external risk index Hex in zone A is less than 1, but there are 2 samples that exceed 1, and the average of Hex in zone B exceeds the value of 1. The average of the internal risk index Hin exceeds the value of 1 in zone A, while the average of Hin in zone B is equal to 2.
3.3. Chemical and Structural Characterization
The results of the chemical analysis of the major elements by XRF are shown in Error! Reference source not found.. In sampling points located in zone A (Error! Reference source not found.), the major elements are Si, Fe, Al, and Ca, which are elements normally found in soils with average values corresponding to 20 %, 6.5 %, 6.2 % and 3.8 %, respectively. K and S are also found in high concentrations with average values of 1.6 % and 1.5 %, respectively. These elements are not normally found in such high concentration in soils.
Table 6.
pH and concentration of major elements (%) obtained by XRF belonging to zones A and B.
| Sample Id | pH Water | pH CaCl2 | Si | S | Fe | Ca | Al | Mg | Na | K | Ti | P | |
|---|---|---|---|---|---|---|---|---|---|---|---|---|---|
| Zone A | S1 | 3.4 | 3.4 | 23 | 4.3 | 3.7 | 2.6 | 2.1 | 0.73 | - | 0.64 | 0.06 | 0.02 |
| S2 | 8.3 | 7.9 | 19 | 0.32 | 8.1 | 0.9 | 8.6 | 1.1 | 0.39 | 2.2 | 0.71 | 0.07 | |
| S3 | 7.5 | 5.1 | 21 | 0.15 | 3.1 | 6.3 | 6.2 | 0.49 | 0.70 | 2.2 | 0.34 | 0.29 | |
| S4 | 9.6 | 9.2 | 22 | 0.057 | 4.6 | 0.5 | 9.1 | 0.95 | 0.54 | 2.4 | 0.46 | 0.11 | |
| S5 | 4.8 | 4.5 | 25 | 1.3 | 2.3 | 1.5 | 8.0 | 0.67 | 0.25 | 1.5 | 0.14 | 0.27 | |
| S6 | 8.3 | 7.7 | 11 | 2.8 | 17 | 11 | 2.9 | 0.40 | 0.42 | 0.52 | 0.12 | - | |
| Mean | 7 | 6.3 | 20.16 | 1.48 | 6.46 | 3.8 | 6.15 | 0.72 | 0.46 | 1.57 | 0.3 | 0.15 | |
| Zone B | S7 | 7.2 | 6.9 | 6.6 | 7.4 | 19 | 15 | 1.0 | 0.20 | 0.10 | 0.27 | 0.05 | 0.04 |
| S8 | 7.8 | 7.4 | 9.3 | 3.1 | 15 | 20 | 0.7 | 0.38 | 0.07 | 0.12 | 0.04 | 0.03 | |
| S9 | 7.8 | 7.4 | 8.7 | 3.1 | 15 | 19 | 0.7 | 0.29 | - | 0.10 | 0.04 | 0.02 | |
| S10 | 7.3 | 7.2 | 7.6 | 5.9 | 21 | 14 | 1.1 | 0.24 | - | 0.23 | 0.06 | 0.05 | |
| S11 | 8.3 | 7.6 | 16 | 4.0 | 8.0 | 6.7 | 5.4 | 0.7 | 0.68 | 1.8 | 0.27 | 0.18 | |
| S12 | 6.9 | 6.7 | 16 | 1.7 | 12 | 5.2 | 5.9 | 0.39 | 0.27 | 0.70 | 0.30 | 0.22 | |
| S13 | 7.5 | 7.7 | 11 | 1.9 | 14 | 18 | 1.4 | 0.45 | 0.23 | 0.33 | 0.05 | - | |
| S14 | 7.6 | 7.3 | 9.3 | 0.46 | 7.8 | 27 | 0.4 | 0.55 | - | 0.48 | 0.02 | 0.01 | |
| S15 | 7.9 | 7.2 | 10 | 0.46 | 8.6 | 24 | 0.6 | 0.47 | - | 0.13 | 0.03 | 0.01 | |
| S16 | 8.4 | 8.0 | 10 | 0.083 | 3.4 | 25 | 3.5 | 0.45 | 0.14 | 1.6 | 0.26 | - | |
| S17 | 8.3 | 7.7 | 3.2 | 0.036 | 1.0 | 40 | 1.1 | 0.75 | 0.11 | 0.14 | 0.08 | 0.04 | |
| S18 | 8.2 | 7.8 | 4.4 | 0.11 | 3.0 | 35 | 1.3 | 0.35 | 0.09 | 0.39 | - | 0.08 | |
| S19 | 8.1 | 7.7 | 8.8 | 0.11 | 3.3 | 27 | 2.8 | 0.55 | 0.13 | 0.86 | 0.21 | 0.09 | |
| S20 | 8.1 | 7.6 | 8.8 | 0.12 | 3.1 | 26 | 2.6 | 0.43 | 0.18 | 1.0 | 0.21 | 0.10 | |
| S21 | 8.3 | 7.7 | 22 | 0.25 | 5.1 | 1.0 | 9.2 | 1.9 | 0.22 | 2.8 | 0.54 | 0.08 | |
| Mean | 7.84 | 7.46 | 10.11 | 1.91 | 9.28 | 20.19 | 2.51 | 0.54 | 0.2 | 0.73 | 0.15 | 0.07 |
The results for zone B (Error! Reference source not found.) also show Si, Fe, Ca and Al concentrations associated with major elements found in common soils. However, in this case, Ca concentration is higher than Si concentration, which is normally the major element in natural soils. Calcareous soils often contain more than 15% CaCO3 in the soil, which can occur in different forms (powdery, nodules, crusts etc.). Soils with a high CaCO3 content belong to the WRB group of Calcisols and related calcareous subgroups. They are found in arid areas of the earth, such as a part of the territory of the State of Zacatecas. Calcareous soils often suffer from micronutrient deficiencies, especially zinc and iron. It can be seen from Error! Reference source not found.: as Ca content increases, Fe content decreases. In this case, high concentrations of the elements S and K are also found.
Error! Reference source not found. show the results obtained by the ICP-OES and ICP-MS techniques in mg kg-1 for heavy metals present in the collected samples.
Table 7.
Concentration of heavy metals obtained by ICP-MS belonging to zones A and B (mg kg-1) and total reference concentrations by soil type [30].
Table 7.
Concentration of heavy metals obtained by ICP-MS belonging to zones A and B (mg kg-1) and total reference concentrations by soil type [30].
| Sample Id | As | Cd | Cr | Ni | Pb | Se | Tl | U | Th | |
|---|---|---|---|---|---|---|---|---|---|---|
| Zone A | S1 | 180.08 ± 0.55 | 5.20 ± 0.65 | 24.44 ± 0.21 | 18.22 ± 0.14 | 533.74 ± 3.00 | 2.65 ± 0.06 | 1.20 ± 0.15 | 0.72 ± 0.10 | 0.80 ± 0.12 |
| S2 | 169.78 ± 0.43 | 0.54 ± 0.39 | 111.61 ± 0.28 | 41.23 ± 0.08 | 1465.76 ± 3.20 | 1.98 ± 0.03 | 3.20 ± 0.21 | 1.10 ± 0.07 | 0.23 ± 0.02 | |
| S3 | 58.39 ± 0.16 | 0.15 ± 0.22 | 43.51 ± 0.07 | 14.13 ± 0.03 | 162.92 ± 0.32 | 2.46 ± 0.02 | 1.14 ± 0.12 | 1.39 ± 0.18 | 1.85 ± 0.20 | |
| S4 | 60.31 ± 0.28 | 0.08 ± 0.11 | 60.31 ± 0.28 | 24.57 ± 0.05 | 124.08 ± 0.36 | 0.55 ± 0.01 | 0.85 ± 0.10 | 0.80 ± 0.10 | 0.17 ± 0.01 | |
| S5 | 82.27 ± 0.29 | 0.17 ± 0.24 | 28.61 ± 0.20 | 11.71 ± 0.10 | 101.26 ± 0.74 | 1.21 ± 0.04 | 1.40 ± 0.13 | 1.92 ± 0.25 | 1.10 ± 0.14 | |
| S6 | 23.01 ± 0.11 | 2.58 ± 0.14 | 149.41 ± 1.3 | 58.53 ± 0.45 | 0.23 ± 0.15 | 1.41 ± 0.02 | 1.50 ± 0.07 | 1.46 ± 0.07 | 1.21 ± 0.007 | |
| Range | 23.01-180.08 | 0.08-5.20 | 24.44-149.41 | 11.71-58.53 | 0.23-1465 | 0.55-2.65 | 0.85-3.20 | 0.72-1.92 | 0.17-1.85 | |
| Mean | 90.22 | 1.45 | 69.65 | 28.06 | 398 | 1.71 | 1.55 | 1.23 | 0.89 | |
| Zone B | S7 | 517.05 ± 1.8 | 1.39 ± 1.8 | 14.12 ± 0.04 | 21.51 ± 0.03 | 768.40 ± 2.60 | 14.58 ± 0.15 | 0.98 ± 0.12 | 6.68 ± 1.05 | 0.28 ± 0.03 |
| S8 | 200.37 ± 1.1 | 0.29 ± 0.17 | 7.89 ± 0.05 | 20.97 ± 0.11 | 87.54 ± 0.71 | 7.65 ± 0.15 | 0.29 ± 0.03 | 5.37 ± 0.71 | 0.03 ± 0.005 | |
| S9 | 476.47 ± 2.0 | 0.35 ± 0.13 | 7.28 ± 0.03 | 12.45 ± 0.11 | 103.14 ± 0.24 | 5.43 ± 0.11 | 0.23 ± 0.01 | 4.31 ± 0.19 | 0.01 ± 0.002 | |
| S10 | 457.19 ± 2.0 | 0.30 ± 0.13 | 5.98 ± 0.03 | 13.27 ± 0.05 | 98.42 ± 0.39 | 5.64 ± 0.08 | 0.20 ± 0.01 | 4.55 ± 0.31 | 0.003 ± 0.001 | |
| S11 | 219.73 ± 0.3 | 0.29 ± 0.16 | 8.13 ± 0.05 | 27.27 ± 0.10 | 123.90 ± 0.51 | 9.91 ± 0.19 | 0.36 ± 0.02 | 5.23 ± 0.45 | 0.02 ± 0.002 | |
| S12 | 183.21 ± 0.6 | 0.18 ± 0.24 | 14.50 ± 0.06 | 8.88 ± 0.04 | 59.44 ± 0.19 | 5.10 ± 0.06 | 0.95 ± 0.17 | 3.62 ± 0.60 | 3.34 ± 0.67 | |
| S13 | 135.41 ± 0.7 | 0.09 ± 0.04 | 13.12 ± 0.06 | 9.91 ± 0.06 | 22.52 ± 0.15 | 3.36 ± 0.07 | 0.35 ± 0.01 | 2.95 ± 0.21 | 3.50 ± 0.29 | |
| S14 | 199.33 ± 1.4 | 0.09 ± 0.04 | 6.17 ± 0.05 | 10.98 ± 0.07 | 50.93 ± 0.46 | 4.05 ± 0.11 | 0.26 ± 0.01 | 3.71 ± 0.30 | 0.01 ± 0.002 | |
| S15 | 44.25 ± 0.1 | 0.39 ± 0.11 | 1.78 ± 0.01 | 2.11 ± 0.01 | 224.19 ± 1.01 | 1.12 ± 0.04 | 0.14 ± 0.01 | 2.43 ± 0.08 | 0.003 ± 0.001 | |
| S16 | 340.74 ± 3.7 | 0.63 ± 0.24 | 2.77 ± 0.03 | 1.93 ± 0.02 | 345.83 ± 4.08 | 7.22 ± 0.06 | 0.17 ± 0.01 | 3.03 ± 0.15 | 0.003 ± 0.001 | |
| S17 | 217.77 ± 1.6 | 6.12 ± 0.42 | 21.92 ± 0.18 | 16.37 ± 0.11 | 4.35 ± 3.58 | 3.32 ± 0.04 | 4.85 ± 0.33 | 3.04 ± 0.23 | 1.050 ± 0.008 | |
| S18 | 51.98 ± 0.28 | 2.37 ± 0.08 | 7.62 ± 0.03 | 5.28 ± 0.02 | 0.83 ± 0.60 | 1.53 ± 0.03 | 0.25 ± 0.01 | 1.05 ± 0.05 | 0.170 ± 0.001 | |
| S19 | 182.49 ± 1.3 | 5.57 ± 0.41 | 13.09 ± 0.13 | 13.78 ± 0.14 | 2.58 ± 2.64 | 2.70 ± 0.06 | 0.59 ± 0.04 | 2.26 ± 0.16 | 0.390 ± 0.003 | |
| S20 | 141.25 ± 0.5 | 4.09 ± 0.29 | 13.95 ± 0.07 | 12.36 ± 0.06 | 1.88 ± 0.84 | 2.64 ± 0.04 | 1.26 ± 0.07 | 1.85 ± 0.13 | 0.970 ± 0.004 | |
| S21 | 153.87 ± 1.0 | 5.36 ± 0.29 | 13.94 ± 0.08 | 13.15 ± 0.07 | 3.23 ± 2.32 | 2.70 ± 0.03 | 3.57 ± 0.15 | 1.85 ± 0.11 | 0.620 ± 0.004 | |
| Range | 44.3-517.7 | 0.1-6.1 | 1.7-21.9 | 1.9-27.3 | 0.8-768 | 1.1-14.6 | 0.1-4.8 | 1.1-6.7 | 0.003-3.50 | |
| Mean | 234.7 | 1.8 | 10.2 | 12.7 | 126 | 5.1 | 0.96 | 3.5 | 0.70 | |
| Agricultural/residential/commercial use | Mean | 22 | 37 | 280 | 1600 | 400 | 390 | 5.2 | ||
| Industrial use | Mean | 260 | 450 | 510 | 20000 | 800 | 5100 | 67 |
According to the official Mexican standard NOM-147-SEMARNAT/SSA-2004 [30] Error! Reference source not found., there would be an average concentration of As higher than that permitted for soil for residential use, but for soil for industrial use, the average concentration of As is within the allowed values. According to this official standard, the average concentrations of Cd, Cr, Ni, Pb, Se and Tl are within the values permitted for residential use.
Error! Reference source not found. show the crystalline phases identified in zone A. The compound common to all of them is SiO2 (mostly quartz). In some of the samples Fe2O3 and CaCO3 are also present. The silicates present are those normally found in association with quartz, i.e. albite, muscovite, and orthoclase. Other compounds found are CaF2 in S1 sample and CaSO4 in S6 sample.
Table 8.
Crystalline characterization of zones A and B samples.
| Sample Id | Oxides | Carbonates | Silicates | Hydroxides | Other compounds | |
|---|---|---|---|---|---|---|
| Zone A | S1 | SiO2, Fe2O3 | CaCO3 | LiAlSiO4 | CaF2 | |
| S2 | SiO2, Fe2O3 | KAlSi3O8Na(AlSi3O8)Na0.3(Al,Mg)2Si4O10(OH)2.H2OCaAl2Si2O84H2O | ||||
| S3 | SiO2 | CaCO3 | K(Al,Fe)Si2O8Ca0.88S0.12Al1.77Si2.23O8KAlSi3O8Na0.3(Al,Mg)2Si4O10(OH)2.H2O | |||
| S4 | SiO2 | (Na0.98Ca0.02)(Al1.02Si2.98O8)K(Al4Si2O9(OH)3)K4Al4Si12O32 | ||||
| S5 | SiO2, Fe2O3 | CaCO3 | KAlSi3O8KAl2Si3AlO10(OH)2 | |||
| S6 | SiO2, Fe2O3 | CaCO3 | Ca3Fe1.88(SiO4)3KAlSi3O8Ca0.88S0.12Al1.77Si2.23O8 | CaSO4 | ||
| Zone B | S7 | SiO2, Fe2O3 | CaCO3 | Ca3Fe1.88(SiO4)3K(Al Fe)Si2O8 | CaSO4 | |
| S8 | SiO2, Fe2O3 | CaCO3 | Ca3Fe1.88(SiO4)3 | CaSO4 | ||
| S9 | SiO2, Fe2O3 | CaCO3 | Ca3Fe1.88(SiO4)3 | CaSO4 | ||
| S10 | SiO2, Fe2O3 | CaCO3 | Ca3Fe1.88(SiO4)3 | CaSO4 | ||
| S11 | SiO2, Fe2O3 | CaCO3 | K(Al Fe)Si2O8Ca3Fe1.88(SiO4)3(Na,Ca)Al(Si,Al)3O8 | CaSO4 | ||
| S12 | SiO2, Fe2O3 | CaCO3 | K(Al Fe)Si2O8Ca3(Al1. 3325Fe0. 6675)Si3O12 | CaSO4 | ||
| S13 | SiO2, Fe2O3 | CaCO3 | Ca3Fe1.88(SiO4)3Ca0.88S0.12Al1.77Si2.23O8 | CaSO4 | ||
| S14 | SiO2, Fe2O3 | CaCO3 | Ca3Fe1.88(SiO4)3 | |||
| S15 | SiO2, Fe2O3 | CaCO3 | Ca3Fe1.88(SiO4)3 | |||
| S16 | SiO2 | CaCO3 | K(Al Fe)Si2O8KAl2Si3AlO10(OH)2 (Mg Al)5(Si Al)8O20(OH)28H2OCa0.88S0.12Al1.77Si2.23O8K(AlSi3O8)Ca3Al2(SiO4)2(OH)4 | |||
| S17 | SiO2 | CaCO3 | Ca3Al2SiO6CaMg3(SiO4)3 | |||
| S18 | SiO2 | CaCO3 | Ca3Al2(SiO4)2(OH)4CaAl2Si2O8K(AlSi3O8) | Fe(OH)3 | ||
| S19 | SiO2 | CaCO3 | Ca2.964(Al1.026Fe0.974)Si2.979O11.844(OH)0.156KAl4(Si Al)8O10(OH)4H2OCa0.88S0.12Al1.77 Si2.23O8 | |||
| S20 | SiO2 | CaCO3 | Ca0.88S0.12Al1.77Si2.23O8KAl4(Si Al)8O10(OH)4H2OCa2.964(Al1.026Fe0.974)Si2.979O11.844(OH)0.156Ca2Al2SiO6(OH)2 | |||
| S21 | SiO2 | KAl2Si3AlO10(OH)2Al2Si2O5(OH)4CaAl2Si7O18.7.5H2O(Mg Fe Al)6(Si Al)4O10(OH)8KAlSi3O8 |
The crystalline phases identified in zone B are also shown in Error! Reference source not found.. In this case, in most of the samples CaCO3 is present, corroborating XRF results. This phase is representative of arid soils as those found in this sampling zone. SiO2 and Fe2O3 phases are typically found in soil samples. Some of the samples present CaSO4 (anhydrite) that could be natural or added to the soil (as gypsum). CaSO4 addition is considered as a good initial procedure to prepare a non-arable soil, as it allows the permeability of the soil to last for several years, helping fertilizers applied on the surface to penetrate more. The silicate phases present are those normally found in association with quartz, i.e. albite, muscovite, and orthoclase as in zone A.
3.4. Contamination Assessment by Heavy Metal
Enrichment factors (EF) are summarized in Error! Reference source not found.. Only samples S1 and S16 to S21 have severe As enrichment (EF=10-25) and S2 for Pb. A large number of samples (S2, S5, S7, S9, S10 and S12) reflect a moderately severe As enrichment (EF=5-10). Other elements also present moderately severe enrichment: S1, S17-S19, S21 for Cd; S1 for Pb; S3, S7, S16-S21 for Se; S17 and S21 for Tl. It is also worth noting those samples with moderate enrichment (EF=3-5): S3 and S14 for As; S20 for Cd; S1, S5, S11 and S12 for Se.
Table 9.
Enrichment factor (EF) of zones A and B.
| Sample Id | As | Cd | Cr | Ni | Pb | Se | Tl | U | Th | |
|---|---|---|---|---|---|---|---|---|---|---|
| Zone A | S1 | 12.71 | 5.51 | 0.29 | 0.28 | 8.07 | 4.68 | 1.41 | 0.28 | 0.08 |
| S2 | 5.47 | 0.26 | 0.60 | 0.29 | 10.13 | 1.60 | 1.72 | 0.20 | 0.01 | |
| S3 | 4.92 | 0.19 | 0.61 | 0.26 | 2.94 | 5.18 | 1.6 | 0.65 | 0.22 | |
| S4 | 1.58 | 0.07 | 0.57 | 0.31 | 1.51 | 0.78 | 0.8 | 0.25 | 0.01 | |
| S5 | 9.34 | 0.29 | 0.54 | 0.29 | 2.46 | 3.42 | 2.66 | 1.21 | 0.18 | |
| S6 | 1.18 | 1.98 | 1.28 | 0.66 | 0.00 | 1.81 | 1.28 | 0.41 | 0.09 | |
| Zone B | S7 | 7.94 | 0.32 | 0.04 | 0.07 | 2.53 | 5.60 | 0.25 | 0.57 | 0.01 |
| S8 | 2.75 | 0.06 | 0.02 | 0.06 | 0.26 | 2.63 | 0.07 | 0.41 | <0.01 | |
| S9 | 8.3 | 0.09 | 0.02 | 0.05 | 0.38 | 2.37 | 0.07 | 0.42 | <0.01 | |
| S10 | 7.96 | 0.08 | 0.02 | 0.05 | 0.37 | 2.45 | 0.06 | 0.44 | <0.01 | |
| S11 | 2.73 | 0.05 | 0.02 | 0.07 | 0.33 | 3.08 | 0.08 | 0.36 | <0.01 | |
| S12 | 5.98 | 0.09 | 0.08 | 0.06 | 0.42 | 4.16 | 0.52 | 0.66 | 0.16 | |
| S13 | 2.95 | 0.03 | 0.05 | 0.05 | 0.11 | 1.83 | 0.13 | 0.36 | 0.11 | |
| S14 | 3.72 | 0.03 | 0.02 | 0.05 | 0.20 | 1.89 | 0.08 | 0.38 | <0.01 | |
| S15 | 1.48 | 0.20 | 0.01 | 0.02 | 1.61 | 0.94 | 0.08 | 0.45 | <0.01 | |
| S16 | 10.35 | 0.29 | 0.01 | 0.01 | 2.25 | 5.48 | 0.09 | 0.51 | <0.01 | |
| S17 | 16.73 | 7.05 | 0.28 | 0.28 | 0.07 | 6.38 | 6.21 | 1.30 | 0.12 | |
| S18 | 13.58 | 9.29 | 0.33 | 0.30 | 0.05 | 9.97 | 1.08 | 1.53 | 0.06 | |
| S19 | 15.89 | 7.27 | 0.19 | 0.26 | 0.05 | 5.88 | 0.85 | 1.09 | 0.05 | |
| S20 | 11.18 | 4.86 | 0.18 | 0.22 | 0.03 | 5.22 | 1.66 | 0.81 | 0.11 | |
| S21 | 12.96 | 6.78 | 0.20 | 0.24 | 0.06 | 5.68 | 5.01 | 0.87 | 0.08 |
The most critical element is As. EFs for As indicate that all samples are enriched in As, from minor to severe enrichment (S1 in zone A and S16-S21 in zone B). It is clear that this element has high natural concentration, and given this is easy to mobilize, it is enriched in many areas due to the antropogenic activity. Only sample S1 from zone A presents a moderate to severe EF for Cd, however in zone B, samples S17-S21 also present a moderate to severe EF for Cd. These last samples are from undisturbed soil, except for sample 21, which is mine waste. This fact indicates that Cd is present in high natural concentrations in zone B. Cr is minor enriched in sample S6, belonging to zone A, but it does not represent a risk. Ni, U, and Th show a lower EF, so it is concluded that there is no enrichment of these elements in both areas. In the case of Pb, samples S1 and S2 from zone A present from moderate to severe EF, both samples being mine waste. However, in zone B all the samples indicate no enrichment or minor enrichment of Pb. With respect to Se, only EFs for S4 and S15 indicate no enrichment, the rest have EF that state from minor to moderately severe enrichment in both zones. It can be concluded that, as in the case of As, the area has high concentrations of Se. In fact, sample S3, which is the most enriched sample in zone A, is an undisturbed soil. In zone B among the samples with moderately severe enrichment are S16 to 20 which are undisturbed soils and S7 and S21 which are from mine tailings. Finally, there are only two samples, S17 and S21 from zone B, that contain a moderate to severe EF of Tl.
The results of the Geoaccumulation Index (Igeo) obtained are shown in Error! Reference source not found.. Samples S1, S2, S3 and S5 from zone A and almost all samples from zone B are from moderately to heavily As contaminated. No samples from both areas present a significant level of geoaccumulation of Cd, Ni, Tl, U, and Th. In addition, in Error! Reference source not found. it is observed that Pb has a moderate to heavy contamination in samples S1 and S2 from zone A, and in S7 from zone B, and in a moderately contaminated in S15 and S16. In addition, almost all samples from zone A and B show a moderate to heavy Se contamination.
Table 10.
Geoaccumulation index (Igeo) of zones A and B.
| Sample Id | As | Cd | Cr | Ni | Pb | Se | Tl | U | Th | |
|---|---|---|---|---|---|---|---|---|---|---|
| Zone A | S1 | 3.00 | 1.79 | -2.47 | -2.49 | 2.35 | 1.56 | -0.17 | -2.49 | -4.30 |
| S2 | 2.92 | -1.48 | -0.27 | -1.31 | 3.80 | 1.14 | 1.24 | -1.89 | -6.08 | |
| S3 | 1.38 | -3.32 | -1.63 | -2.85 | 0.63 | 1.45 | -0.24 | -1.55 | -3.09 | |
| S4 | 0.31 | -4.17 | -1.16 | -2.05 | 0.24 | -0.72 | -0.67 | -2.34 | -6.55 | |
| S5 | 1.87 | -3.13 | -2.24 | -3.12 | -0.05 | 0.42 | 0.06 | -1.08 | -3.84 | |
| S6 | 0.03 | 0.78 | 0.15 | -0.80 | -8.81 | 0.65 | 0.15 | -1.47 | -3.70 | |
| Zone B | S7 | 4.52 | -0.11 | -3.26 | -2.25 | 2.87 | 4.02 | -0.46 | 0.72 | -5.84 |
| S8 | 3.15 | -2.35 | -4.10 | -2.28 | -0.26 | 3.09 | -2.20 | 0.41 | -9.01 | |
| S9 | 4.40 | -2.10 | -4.21 | -3.03 | -0.03 | 2.59 | -2.55 | 0.09 | -10.61 | |
| S10 | 4.34 | -2.34 | -4.50 | -2.94 | -0.09 | 2.65 | -2.78 | 0.17 | -12.42 | |
| S11 | 3.29 | -2.38 | -4.05 | -1.90 | 0.24 | 3.46 | -1.89 | 0.37 | -9.34 | |
| S12 | 3.03 | -3.04 | -3.22 | -3.52 | -0.82 | 2.50 | -0.51 | -0.16 | -2.24 | |
| S13 | 2.59 | -4.09 | -3.36 | -3.36 | -2.22 | 1.90 | -1.95 | -0.46 | -2.17 | |
| S14 | 3.15 | -3.99 | -4.45 | -3.22 | -1.04 | 2.17 | -2.38 | -0.12 | -10.15 | |
| S15 | 0.98 | -1.93 | -6.24 | -5.60 | 1.09 | 0.31 | -3.31 | -0.74 | -13.94 | |
| S16 | 3.92 | -1.26 | -5.60 | -5.72 | 1.72 | 3.00 | -2.98 | -0.42 | -12.59 | |
| S17 | 3.27 | 2.03 | -2.62 | -2.64 | -4.59 | 1.88 | 1.84 | -0.42 | -3.91 | |
| S18 | 1.21 | 0.66 | -4.15 | -4.27 | -6.99 | 0.76 | -2.44 | -1.95 | -6.51 | |
| S19 | 3.02 | 1.89 | -3.37 | -2.89 | -5.34 | 1.59 | -1.20 | -0.84 | -5.34 | |
| S20 | 2.65 | 1.45 | -3.27 | -3.05 | -5.80 | 1.55 | -0.10 | -1.13 | -4.02 | |
| S21 | 2.77 | 1.84 | -3.27 | -2.96 | -5.02 | 1.58 | 1.40 | -1.13 | -4.66 |
The results of the contamination factor (CF) are presented in Error! Reference source not found.. Considering this parameter, it is observed that there is a great As contamination in both areas. Only some samples present a CF less than 3, which would mean a moderate to none contamination level. The Cd contamination is limited. Only some samples, such as S1 from zone A and S17 to S21 from zone B, present substantial Cd contamination. Samples S1 and S2 from zone A and samples S7, S15, and S16 show from extreme to strong Pb contamination. Most samples from zones A and B have very strong Se contamination; only sample S4 from zone A does not present Se contamination. Sample S2 from zone A and samples S17 and S21 from zone B present moderately strong to extremely strong Tl contamination. In zone A, no U contamination is found, but in zone B, we have sample S7 that has moderate. The rest of the heavy metals analyzed do not present significant contamination.
Table 11.
Contamination factor (CF) of zones A and B.
| Sample Id | As | Cd | Cr | Ni | Pb | Se | Tl | U | Th | |
|---|---|---|---|---|---|---|---|---|---|---|
| Zone A | S1 | 12.01 | 5.2 | 0.27 | 0.27 | 7.62 | 4.42 | 1.33 | 0.27 | 0.08 |
| S2 | 11.32 | 0.54 | 1.24 | 0.61 | 20.94 | 3.30 | 3.55 | 0.41 | 0.02 | |
| S3 | 3.89 | 0.15 | 0.48 | 0.21 | 2.33 | 4.10 | 1.27 | 0.51 | 0.18 | |
| S4 | 1.85 | 0.08 | 0.67 | 0.36 | 1.77 | 0.91 | 0.94 | 0.30 | 0.02 | |
| S5 | 5.48 | 0.17 | 0.32 | 0.17 | 1.45 | 2.01 | 1.56 | 0.71 | 0.10 | |
| S6 | 1.53 | 2.58 | 1.66 | 0.86 | <0 | 2.35 | 1.67 | 0.54 | 0.12 | |
| Zone B | S7 | 34.47 | 1.39 | 0.16 | 0.32 | 10.98 | 24.30 | 1.09 | 2.48 | 0.03 |
| S8 | 13.36 | 0.29 | 0.09 | 0.31 | 1.25 | 12.74 | 0.33 | 1.99 | <0 | |
| S9 | 31.76 | 0.35 | 0.08 | 0.18 | 1.47 | 9.06 | 0.26 | 1.60 | <0 | |
| S10 | 30.48 | 0.30 | 0.07 | 0.20 | 1.41 | 9.40 | 0.22 | 1.68 | <0 | |
| S11 | 14.65 | 0.29 | 0.09 | 0.40 | 1.77 | 16.52 | 0.40 | 1.94 | <0 | |
| S12 | 12.21 | 0.18 | 0.16 | 0.13 | 0.85 | 8.50 | 1.06 | 1.34 | 0.32 | |
| S13 | 9.03 | 0.09 | 0.15 | 0.15 | 0.32 | 5.60 | 0.39 | 1.09 | 0.33 | |
| S14 | 13.29 | 0.09 | 0.07 | 0.16 | 0.73 | 6.75 | 0.29 | 1.38 | <0 | |
| S15 | 2.95 | 0.39 | 0.02 | 0.03 | 3.20 | 1.87 | 0.15 | 0.90 | <0 | |
| S16 | 22.72 | 0.63 | 0.03 | 0.03 | 4.94 | 12.03 | 0.19 | 1.12 | <0 | |
| S17 | 14.52 | 6.12 | 0.24 | 0.24 | 0.06 | 5.54 | 5.39 | 1.12 | 0.10 | |
| S18 | 3.47 | 2.37 | 0.08 | 0.08 | 0.01 | 2.54 | 0.28 | 0.39 | 0.02 | |
| S19 | 12.17 | 5.57 | 0.15 | 0.2 | 0.04 | 4.51 | 0.65 | 0.84 | 0.04 | |
| S20 | 9.42 | 4.09 | 0.15 | 0.18 | 0.03 | 4.40 | 1.40 | 0.69 | 0.09 | |
| S21 | 10.26 | 5.36 | 0.15 | 0.19 | 0.05 | 4.49 | 3.97 | 0.68 | 0.06 |
4. Conclusions
The concentrations of radionuclides and heavy metals were measured in soils from two mining areas in Zacatecas, Mexico. The specific activity concentrations for 238U in zones A (near the city of Zacatecas) and B (near the city of Concepcion del Oro) was within the world range proposed by UNSCEAR but is much higher than the world average. The concentration of 226Ra activity is very high in both areas, exceeding the maximum value (60 Bq kg-1) recommended by UNSCEAR [4]. Several samples from both areas show a concentration above the maximum limit for 40K, and the total average is also high. The activity concentration of 232Th is within the UNSCEAR range from 11 to 64 Bq kg-1.
The recommended limit for radium equivalent activity Raeq is 370 Bq; sites that exceed that value were found, indicating a risk for the population in some places. The absorbed dose () value of 54 nGy h-1 is exceeded in almost all samples. The effective dose rate () is within the normal range, according to UNSCEAR [27]. The excess lifetime cancer risk (ELCR) presents a higher risk than the world average in both sampled areas. The average radioactivity index Ri, the average external risk index Hex, and the average internal risk index Hin exceed the value of 1, presenting a greater risk to health by radiation.
Major components found in all samples comprises Si, Fe, Al, and Ca, but in zone B, the concentration of Ca, which is normally the major element in natural soils, is higher than that of Si. This fact is characteristics of calcareous soils present in arid areas, such as part of the territory of Zacatecas.
According to the official Mexican standard NOM-147-SEMARNAT/SSA-2004, the average concentration of As in soils for residential use is higher than allowed, and the average concentration of Pb is within the permitted, in both zones.
Some areas have a severe Enrichment Factor for As and Pb. Some sites show anthropogenic As enrichment. Se is found in high concentrations in both undisturbed soil and mine tailings in both areas. Cd is also present in some samples from both zones, but especially in zone B, which indicates that Cd is found in high natural concentrations. Cr, Ni, U, and Th have a low enrichment factor.
The Geoaccumulation Index indicates that some samples from zone A and almost all samples from zone B have moderate to heavy contamination of As. Pb is only in strong geoaccumulation in two samples from zone A and one sample from zone B. This index for Se is moderately to heavily contaminated in almost all samples from both areas. Important contaminations by Cd, Ni, Tl, U, and Th were not found in any sample.
Considering the Contamination Factor, it is observed that both areas are highly contaminated by As. Most samples from zones A and B have very strong Se contamination (high EF, Igeo, and CF values); this agrees with the fact that Se is found in high natural concentrations in this region of Mexico. Some samples from both areas present strong contamination by Pb. The other analyzed elements do not present excessive contamination.
This study seeks to evaluate the concentrations of radionuclides and heavy metals to propose future solutions for mitigate their effects, which will benefit the population and their ecosystems.
Acknowledgments
We thank Minerva, Amina, and Gonzalo Escareño for helping us collect the samples. We also thank all the people who collaborated in the completion of this work, both from the Universidad Autónoma de Zacatecas (UAZ) and from the Centro de Investigaciones Energéticas, Medioambientales y Tecnológicas (CIEMAT). This work was carried out within the framework of the institutional collaboration agreement between UAZ and CIEMAT.
Compliance with ethical statement
Conflict of interest. The authors certify that they have no affiliations with or involvement in any organization or entity with any financial interest (such as honoraria; educational grants; participation in speakers’ bureaus; membership, employment, consultancies, stock ownership, or other equity interest; and expert testimony or patent-licensing arrangements), or non-financial interest (such as personal or professional relationships, affiliations, knowledge or beliefs) in the subject matter or materials discussed in this manuscript.
Declaration of competing interest
The authors declare that they have no known competing financial interests or personal relationships that could have appeared to influence the work reported in this paper.
References
- Milenkovic, B.; Stajic, J.M.; Gulan, L.; Zeremski, T.; Nikezic, D. Radioactivity levels and heavy metals in the urban soil of Central Serbia. Environmental Science and Pollution Research 2015, 22, 16732–16741. [Google Scholar] [CrossRef]
- IAEA. Extent of Environmental Contamination by Naturally Occurring Radioactive Material (NORM) and Technological Options for Mitigation; Viena, 2003. [Google Scholar]
- Mitwally, E.M.A.; Yu, B.S. Assessment of radiological hazard indices caused by 238U, 232Th, 226Ra and 40K radionuclides of heavy minerals on Taiwanese beach sands, stream sediments, and surrounding rocks: implications for radiometric fingerprinting of the environmental impact. J Radioanal Nucl Chem 2023, 332, 4847–4875. [Google Scholar] [CrossRef]
- UNSCEAR. Sources and effects of ionizing radiation, United Nations Scientific Committee on the Effects of Atomic Radiation; New York, 2000. [Google Scholar]
- Izgagin, V.S.; Zhukovsky, M.V.; Onishchenko, A.D.; Yarmoshenko, I.V.; Pyshkina, M.D. Gamma-radiation exposure by natural radionuclides in residential building materials on example of nine Russian cities. J Radioanal Nucl Chem 2023. [CrossRef]
- Karunakara, N.; Rao, C.; Ujwal, P.; Yashodhara, I.; Kumara, S.; Ravi, P.M. Soil to rice transfer factors for 226Ra, 228Ra, 210Pb, 40K and 137Cs: A study on rice grown in India. J Environ Radioact 2013, 118, 80–92. [Google Scholar] [CrossRef] [PubMed]
- ICRP, Protection Against Radon-222 at Home and at Work, 1994. https://www.icrp.org.
- Song, P.; Xu, D.; Yue, J.; Ma, Y.; Dong, S.; Feng, J. Recent advances in soil remediation technology for heavy metal contaminated sites: A critical review. Science of the Total Environment 2022, 838, 156417. [Google Scholar] [CrossRef]
- Petit, M.D.; Rucandio, M.I. Sequential extractions for determination of cadmium distribution in coal fly ash, soil and sediment samples. Anal Chim Acta 1999, 401, 283–291. [Google Scholar] [CrossRef]
- Nyarko, B.J.B.; Adomako, D.; Serfor-Armah, Y.; Dampare, S.B.; Adotey, D.; Akaho, E.H.K. Biomonitoring of atmospheric trace element deposition around an industrial town in Ghana. Radiation Physics and Chemistry 2006, 75, 954–958. [Google Scholar] [CrossRef]
- Ibikunle, S.B.; Arogunjo, A.M.; Ajayi, O.S. Characterization of radiation dose and soil-to-plant transfer factor of natural radionuclides in some cities from south-western Nigeria and its effect on man. Sci Afr 2019, 3, e00062. [Google Scholar] [CrossRef]
- Adriano, D.C. Trace Elements in Terrestrial Environments. 2001. [Google Scholar] [CrossRef]
- Xiao, R.; Wang, S.; Li, R.; Wang, J.J.; Zhang, Z. Soil heavy metal contamination and health risks associated with artisanal gold mining in Tongguan, Shaanxi, China. Ecotoxicol Environ Saf 2017, 141, 17–24. [Google Scholar] [CrossRef] [PubMed]
- Okonkwo, S.I.; Idakwo, S.O.; Ameh, E.G. Heavy metal contamination and ecological risk assessment of soils around the pegmatite mining sites at Olode area, Ibadan southwestern Nigeria. Environ Nanotechnol Monit Manag 2021. [CrossRef]
- Olivarez, M.B.; Tovar, M.A.M.; Sánchez, J.V.; Betancourt, M.L.G.; Romero, F.M.; Arteaga, A.M.R.; Chávez, G.E.M.; Noreña, H.A.S.; Olivarez, M.B.; Tovar, M.A.M.; Sánchez, J.V.; Betancourt, M.L.G.; Romero, F.M.; Arteaga, A.M.R.; Chávez, G.E.M.; Noreña, H.A.S. Mobility of Heavy Metals in Aquatic Environments Impacted by Ancient Mining-Waste. Water Quality - Factors and Impacts. 2021. [Google Scholar] [CrossRef]
- Wu, Y.; Li, X.; Yu, L.; Wang, T.; Wang, J.; Liu, T. Review of soil heavy metal pollution in China: Spatial distribution, primary sources, and remediation alternatives. Resour Conserv Recycl 2022, 181, 106261. [Google Scholar] [CrossRef]
- Covarrubias, S.A.; De La Torre, J.A.F.; Vega, M.M.; González, F.J.A.; Cabriales, J.J.P.; Soils, S.V.O.H.M.I. Sediments of “la Zacatecana” Lagoon, Mexico. Appl Environ Soil Sci 2018 2018. [CrossRef]
- Escareño-Juarez, E.; Jiménez-Barredo, F.; Gascó-Leonarte, C.; Barrado-Olmedo, A.I.; Vega, M. Baseline thorium concentration and isotope ratios in topsoil of Zacatecas State, Mexico. Chemosphere 2021, 268. [Google Scholar] [CrossRef] [PubMed]
- Secretaria del Medio Ambiente y Recursos Naturales, NOM-141-SEMARNAT-2003, Ciudad de Mexico, 2007.
- Murray, A.S.; Marten, R.; Johnston, A.; Martin, P. Analysis for naturally occuring radionuclides at environmental concentrations by gamma spectrometry. Journal of Radioanalytical and Nuclear Chemistry Articles 1987, 115, 263–288. [Google Scholar] [CrossRef]
- Gil-Pacheco, E.; Suárez-Navarro, J.A.; Sánchez-González, S.M.; Suarez-Navarro, M.J.; Hernáiz, G.; García-Sánchez, A. A radiological index for evaluating the impact of an abandoned uranium mining area in Salamanca, Western Spain. Environmental Pollution 2020, 258. [Google Scholar] [CrossRef] [PubMed]
- Sabiha-Javied; Tufail, M.; Asghar, M. Hazard of NORM from phosphorite of Pakistan. J Hazard Mater 2010, 176, 426–433. [Google Scholar] [CrossRef] [PubMed]
- UNSCEAR 2016 - Sources, Effects and Risks of Ionizing Radiation, New York, 2017.
- Eckerman, K.; Harrison, J.; Menzel, H.-G.; Clement, C.H. The 2007 Recommendations of the International Commission on Radiological Protection. ICRP publication 2007, 103. [Google Scholar] [CrossRef]
- ASTM D4972; Standard Test Methods for pH of Soils. West Conshohocken, PA, 2013. [CrossRef]
- Rahman, M.S.; Ahmed, Z.; Seefat, S.M.; Alam, R.; Islam, A.R.M.T.; Choudhury, T.R.; Begum, B.A.; Idris, A.M. Assessment of heavy metal contamination in sediment at the newly established tannery industrial Estate in Bangladesh: A case study. Environmental Chemistry and Ecotoxicology 2022, 4, 1–12. [Google Scholar] [CrossRef]
- UNSCEAR. SOURCES AND EFFECTS OF IONIZING RADIATION; 2008; New York, 2010. [Google Scholar]
- Agbalagba, E.O.; Avwiri, G.O.; Chad-Umoreh, Y.E. γ-Spectroscopy measurement of natural radioactivity and assessment of radiation hazard indices in soil samples from oil fields environment of Delta State, Nigeria. J Environ Radioact 2012, 109, 64–70. [Google Scholar] [CrossRef]
- Azeem, U.; Younis, H.; Ullah, N.; Mehboob, K.; Ajaz, M.; Ali, M.; Hidayat, A.; Muhammad, W. Radionuclide concentrations in agricultural soil and lifetime cancer risk due to gamma radioactivity in district Swabi, KPK, Pakistan. Nuclear Engineering and Technology 2023. [CrossRef]
- Secretaria del Medio Ambiente y Recursos Naturales, NOM-147-SEMARNAT/SSA-2004, Ciudad de Mexico, 2007.
Disclaimer/Publisher’s Note: The statements, opinions and data contained in all publications are solely those of the individual author(s) and contributor(s) and not of MDPI and/or the editor(s). MDPI and/or the editor(s) disclaim responsibility for any injury to people or property resulting from any ideas, methods, instructions or products referred to in the content. |
© 2024 by the authors. Licensee MDPI, Basel, Switzerland. This article is an open access article distributed under the terms and conditions of the Creative Commons Attribution (CC BY) license (http://creativecommons.org/licenses/by/4.0/).
Copyright: This open access article is published under a Creative Commons CC BY 4.0 license, which permit the free download, distribution, and reuse, provided that the author and preprint are cited in any reuse.


