Submitted:
15 October 2024
Posted:
16 October 2024
You are already at the latest version
Abstract
We assess simultaneous adoption and impacts of multiple improved technologies promoted as a bundle and recommended for legumes intensification systems for smallholder farmers in Ethiopia. We use DNA fingerprinting data to precisely identify our key treatment - “adoption to improved bean varieties” in the study. The results show significant positive impacts of adopting bundled interventions on, agricultural incomes and household food security but vulnerability to food insecurity persists. We find that growing improved varieties with fertilizers increased household agricultural revenue, allowing for more legume consumption and enhancing their likelihood of achieving adequate food consumption and food security outcomes. However, the vulnerability to food insecurity of the adopters remains high due to pre-existing resource degradation issues. Given similarity in production contexts in Sub Saharan Africa, our results provide perspective for similar development interventions. We use the results of our analysis to discuss potential policy implications and programmes to support technology intensification among small holder farmers.
Keywords:
1. Introduction
2. The Data Source and Variable Definition
2.1. Data Sources
2.2. Definition and Measurement of Treatment and Outcome Variables
2.2.1. Treatment Variables
Variety and Management Practice Adoption
2.2.2. Food Security Outcome Variables
3. Conceptual Framework and ESTIMATION STRATEGY
3.1. Conceptual Framework
3.2. The Identification Strategy, Model Specification, Estimation.
3.3. Multinomial Endogenous Treatment Effect (METE) Model specification
4. Empirical Result and Discussion
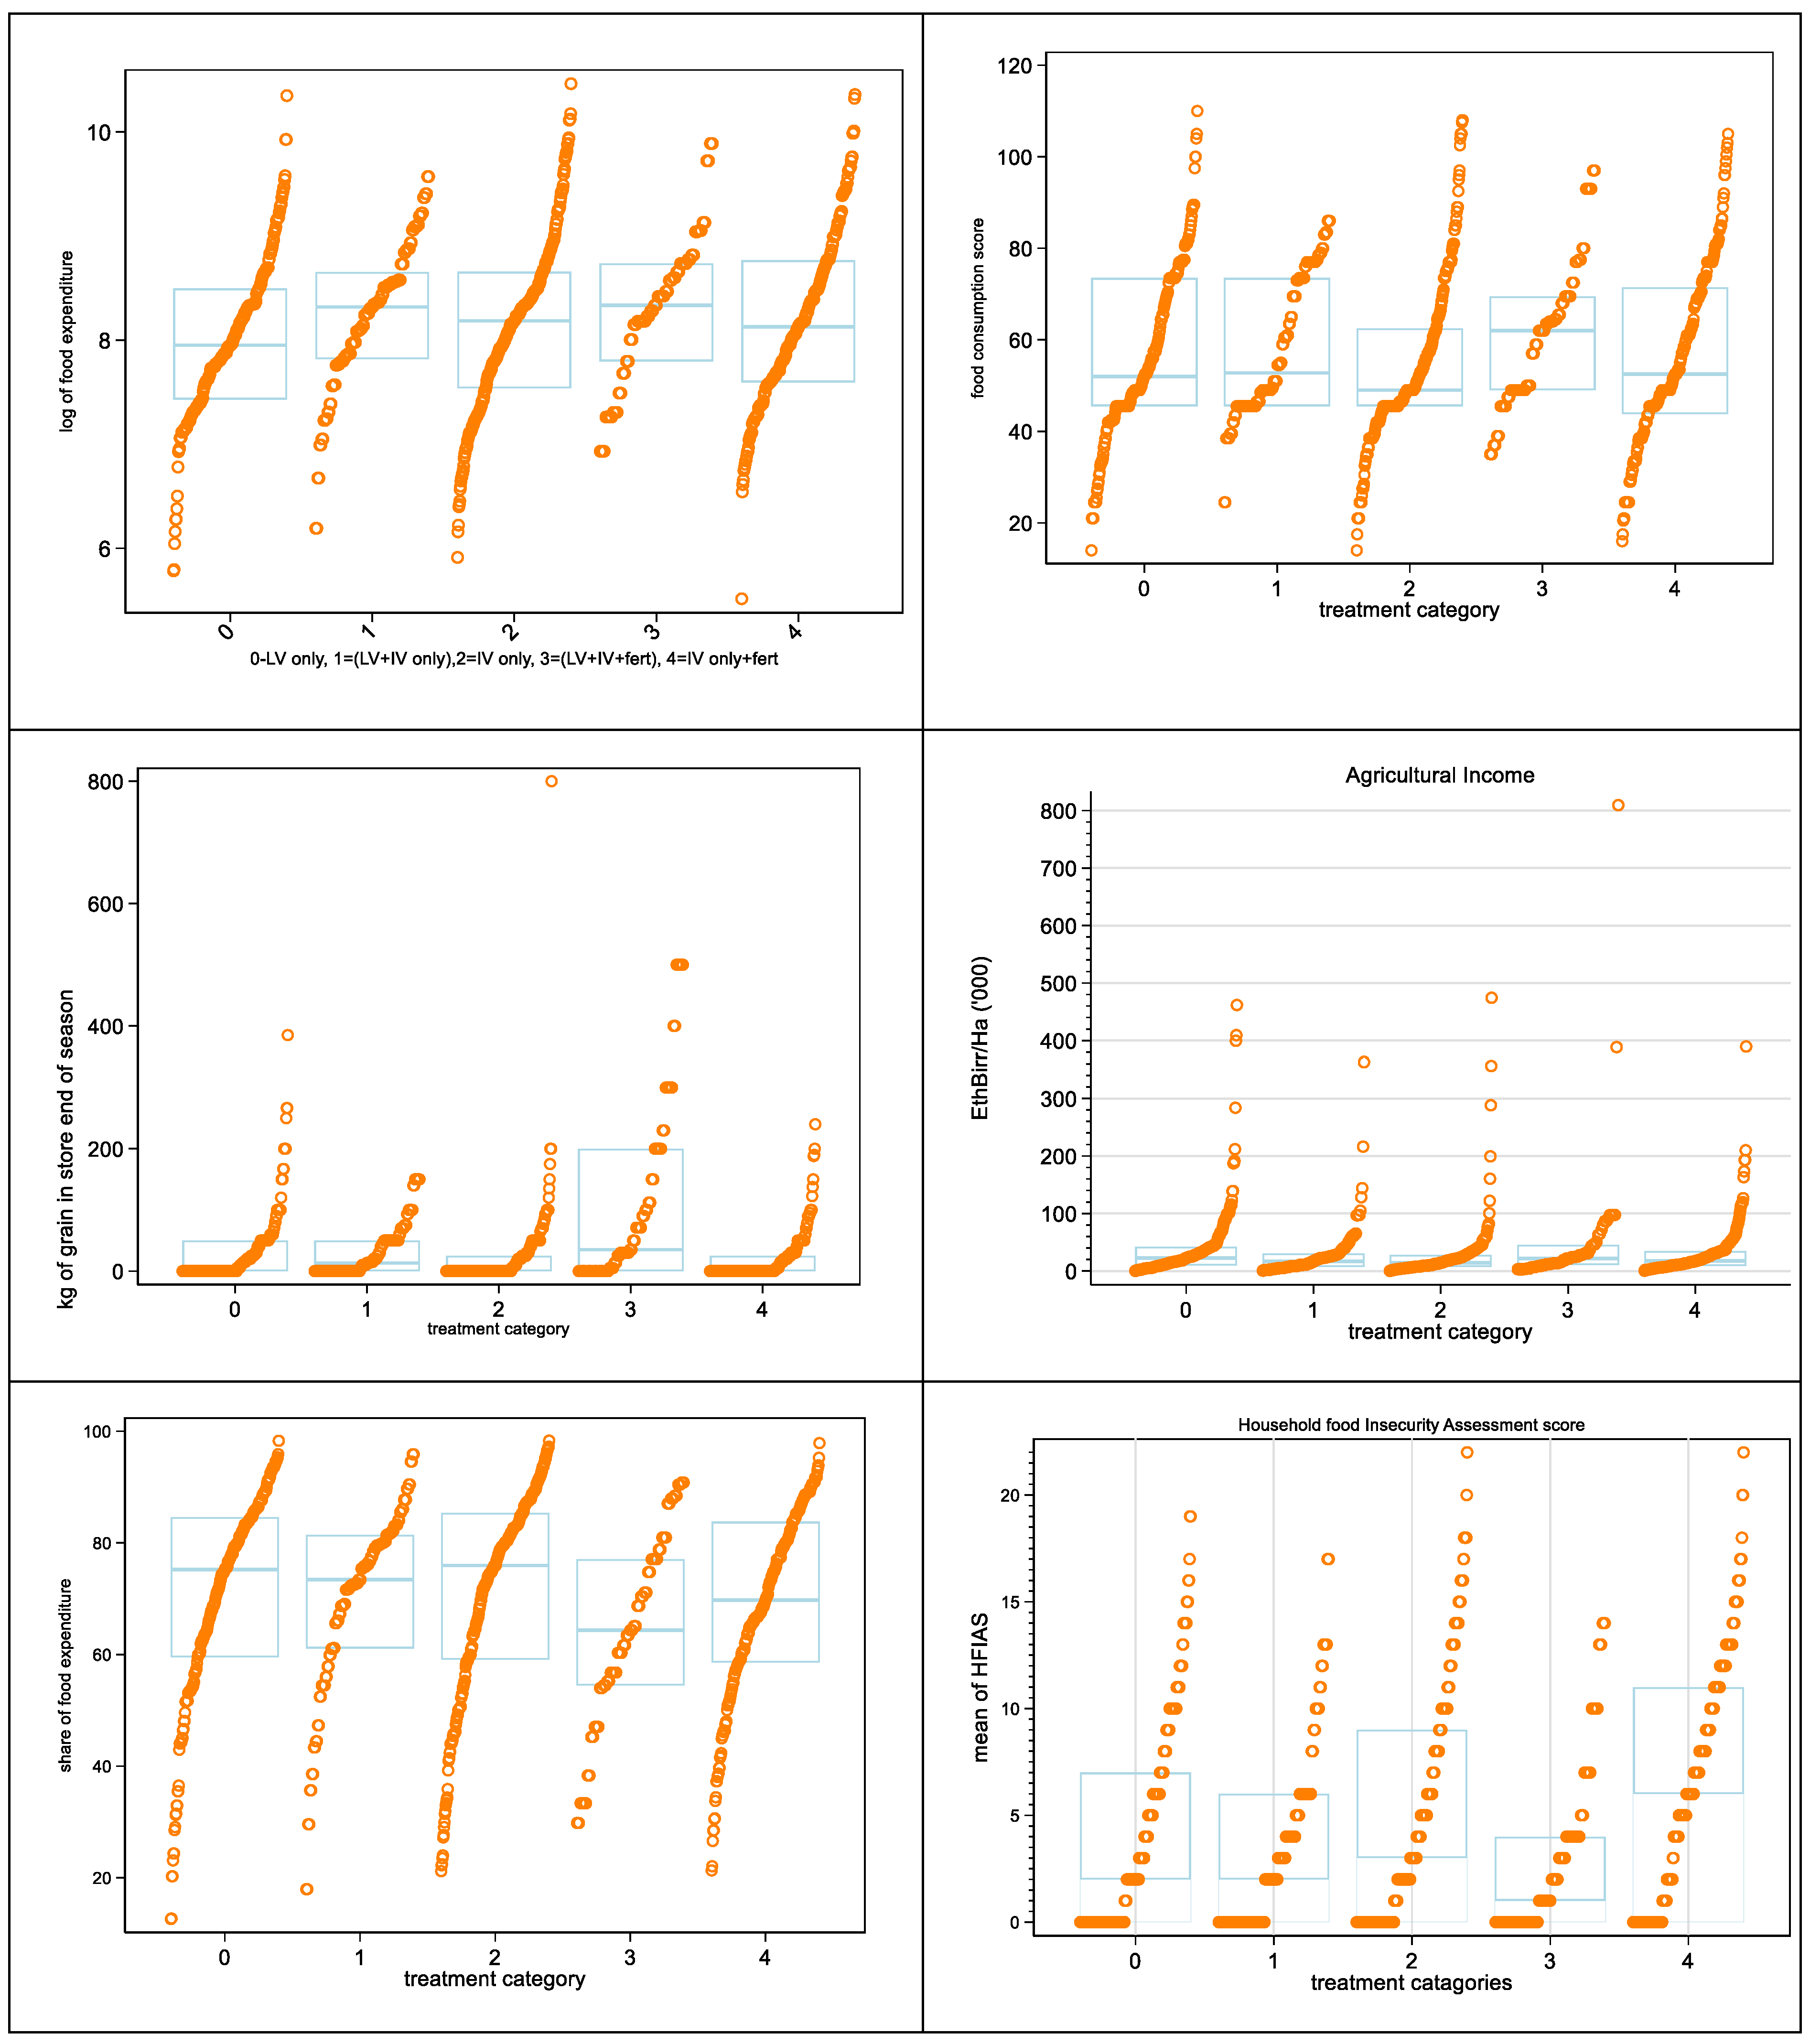
Descriptive Analysis
5. Econometric Results
5.1. Multinomial Logit Estimates of the Determinants of Technology Adoption.
5.2. METE Results on the Effect of Technology Adoption on Food Security Indicators
5.2.1. Average Effect of Adoption on Food Availability
5.2.2. Average Effect of Adoption on Food Access and Utilization
5.2.3. Average Effects on Household Vulnerability to Food Insecurity
6. Conclusions and Implications
Author Contributions
Acknowledgments
Appendix A
Appendix A.1. Tobit Estimates of Variety and Fertilizer Adoption: Testing for Simultaneity of Variety and Fertilizer Adoption
| Fertilizer application rate | Improved variety adoption | |||
| Coefficient | Std. err. | Coefficient | Std. err. | |
| Qty of improved variety seed per hectare | 3.76 | 7.47 | ||
| quantity of fertilizer per hectare | -0.09 | 0.09 | ||
| HH head education (base category=none) | ||||
| primary education only | 8.54 | 47.24 | -3.29 | 2.70 |
| above primary education | -44.65 | 31.54 | 1.34 | 4.11 |
| Household size | 1.20 | 6.73 | -0.34 | 0.60 |
| HH Age (Years) | -1.24 | 0.94 | -0.11 | 0.12 |
| HH gender (1=male) | 67.70 | 87.46 | -2.46 | 4.58 |
| HH asset index | 10.07 | 22.79 | 2.77*** | 1.04 |
| Agricultural index | -2.26 | 5.02 | -0.08 | 0.61 |
| Total Livestock Units | -0.51 | 3.97 | -0.66 | 0.42 |
| log total landholding (Ha) | 18.62 | 22.70 | -0.33 | 1.64 |
| climbing bean | 5.07 | 32.47 | -1.11 | 2.50 |
| village number of input groups | 15.36 | 20.12 | 1.08 | 2.66 |
| Credit in cash (1=yes) | 77.83** | 39.44 | 0.18 | 3.89 |
| Credit in kind (1=yes) | 41.10* | 23.28 | 1.83 | 3.56 |
| log distance to town (km)*** | -30.38 | 24.48 | 3.27** | 1.55 |
| Located <10km tarmac road | -41.78 | 33.71 | -1.09 | 4.11 |
| Located >10km tarmac road | -76.84* | 42.40 | -0.25 | 5.24 |
| Regions *** (Base=Amhara) | ||||
| Benshangul_Gumuz | -131.96 | 196.94 | 19.98** | 8.89 |
| Oromya | 102.13** | 43.19 | -12.18** | 5.66 |
| SNNPR | 214.36 | 165.04 | -30.73*** | 5.63 |
| agroecological zones (base=1) | ||||
| aez_id3 | 9.28 | 134.87 | 7.29 | 4.90 |
| aez_id4 | 53.37 | 132.46 | -11.10 | 9.80 |
| aez_id5 | 13.26 | 101.38 | 9.03* | 5.14 |
| aez_id6 | -62.47 | 55.54 | -1.05 | 5.86 |
| aez_id8 | 34.76 | 67.13 | -19.90*** | 6.85 |
| Soil fertility (base-good) | ||||
| mean soil fertility medium | -3.29 | 55.63 | 1.01 | 3.21 |
| mean soil fertility poor | -3.71 | 66.21 | 1.81 | 4.99 |
| Means village extension | 1.82** | 0.86 | 0.03 | 0.12 |
| village level social network | 1.02 | 3.57 | -0.32 | 0.33 |
| average distance to most plots | -1.10* | 0.60 | 0.01 | 0.06 |
| was rainfal amount poor (1=yes) | -38.90 | 76.57 | ||
| was rainfal benging poor (1=yes | -24.83 | 30.23 | ||
| drough_seed | -4.77 | 3.81 | ||
| village level dummy for seed distribution | 0.31 | 87.25 | 9.88*** | 3.70 |
| constant | -179.40 | 134.17 | 0.89 | 10.31 |
| Number | 655 | 774 | ||
| Wald chi2(33) | 95.63 | 140.14 | ||
| Prob | 0 | 0 | ||
| exogeneity: chi (1) | 0.45 | 1.52 | ||
| Prob chi2 | >.5029 | 0.2174 | ||
Appendix A.2. Falsification Test for Instrumental Variables Used in METE Results
| _Ag_income | FCSET | Food expenditure | cropstore2 (kg) | HFIA_SCORE | _foodexp share (%) | per_ad_nonfood_exp~ | ||||||||
| Coef | Std. err. | Coef | Std. err. | Coef | Std. err. | Coef | Std. err. | Coef | Std. err. | Coef | Std. err. | Coef | Std. err. | |
| d_educHH | 0.24 | 0.16 | -0.10 | 2.76 | -0.7**9 | 0.09 | -17.55 | 17.40 | 0.27 | 1.18 | 0.83 | 3.30 | 0.223 | 0.144 |
| d_educHH2 | 0.15 | 0.23 | 3.85 | 4.09 | -17.29 | 24.84 | 0.04 | 1.79 | -8.16^ | 4.86 | 0.662** | 0.211 | ||
| hhsize_innumbr | 0.01 | 0.03 | -0.78 | 0.56 | 0.01 | 0.01 | 4.52 | 3.64 | 0.02 | 0.25 | 0.51 | 0.70 | -0.08** | 0.031 |
| hh_age | -0.01 | 0.01 | -0.14 | 0.11 | -0.01** | 0.00 | -1.24^ | 0.73 | 0.04 | 0.05 | 0.01 | 0.13 | -0.009 | 0.006 |
| Gender | 0.07 | 0.28 | -3.98 | 4.83 | 0.14 | 0.13 | 5.43 | 31.37 | -0.74 | 2.06 | 0.36 | 5.67 | 0.219 | 0.243 |
| HH_assetindex | 0.26** | 0.06 | 2.59* | 1.12 | 0.09** | 0.03 | 10.83 | 6.81 | -1.61 | 0.57 | -3.02* | 1.41 | 0.138* | 0.061 |
| agric_equiindex | 0.07* | 0.03 | 0.17 | 0.57 | 0.02 | 0.02 | -0.48 | 3.56 | -0.40** | 0.25 | 0.33 | 0.68 | 0.021 | 0.029 |
| l_land_cult_ha | 0.39* | 0.08 | 3.20* | 1.44 | -0.04 | 0.04 | 24.37* | 10.06 | -1.60 | 0.68 | -0.65 | 1.92 | 0.101 | 0.085 |
| d_offINC | 0.16 | 0.14 | -2.21 | 2.47 | 0.02 | 0.07 | -1.28 | 2.92 | 0.110 | 0.126 | ||||
| credit_d1 | -0.26 | 0.19 | -0.86 | 3.24 | 0.21** | 0.09 | 18.02^ | 19.48 | 3.56* | 1.37 | 3.81 | 3.77 | -0.356* | 0.163 |
| credit_d2 | 0.17 | 0.16 | -9.56** | 2.76 | 0.06 | 0.07 | 31.70** | 17.48 | 4.97** | 1.17 | -5.93^ | 3.26 | 0.028 | 0.142 |
| irrg | -0.03 | 0.15 | -5.16* | 2.59 | 0.05 | 0.07 | 47.67 | 17.12 | 3.04** | 1.10 | 4.68 | 3.04 | -0.220 | 0.135 |
| ddist_km10 | -0.17 | 0.22 | 3.06 | 3.82 | 0.26** | 0.10 | 20.90 | 24.86 | 2.66 | 1.64 | -4.12 | 4.57 | 0.221 | 0.205 |
| ddist_kmhigh10 | -0.09 | 0.27 | 11.12* | 4.64 | 0.25* | 0.12 | 1.28 | 29.74 | 4.93* | 2.06 | -8.47 | 5.81 | 0.316 | 0.258 |
| BG | -18.08^ | 10.47 | 0.498 | 0.540 | ||||||||||
| Oromya | -2.98 | 7.64 | 0.071 | 0.375 | ||||||||||
| SNNPR | -5.36 | 7.35 | -0.026 | 0.361 | ||||||||||
| aez_id3 | 0.04 | 0.32 | -10.83* | 5.57 | 0.14 | 0.15 | 22.63 | 37.89 | -3.86 | 2.47 | -5.73 | 6.97 | -0.021 | 0.321 |
| aez_id4 | 0.69** | 0.32 | 14.36** | 5.51 | 0.12 | 0.15 | 21.08 | 35.53 | 3.47 | 2.25 | -3.83 | 6.90 | 0.349 | 0.307 |
| aez_id5 | 0.58^ | 0.34 | -0.59 | 5.86 | 0.04 | 0.16 | -28.5** | 39.23 | 0.78 | 2.46 | -3.69 | 6.91 | -0.420 | 0.306 |
| aez_id6 | 0.95** | 0.23 | 8.15* | 4.09 | 0.08 | 0.11 | 63.00 | 25.40 | -4.78** | 1.79 | 1.13 | 5.15 | -0.513 | 0.228 |
| aez_id8 | 1.36** | 0.29 | 9.20^ | 5.01 | 0.19 | 0.13 | -17.72* | 32.31 | -1.57 | 2.22 | -0.20 | 6.40 | -0.650* | 0.277 |
| subplt_bn_var_climbing | 0.03 | 0.16 | -1.99 | 2.80 | -0.07 | 0.07 | 42.49 | 17.52 | 2.67* | 1.18 | 0.27 | 3.42 | 0.034 | 0.149 |
| mean_soil_fert_p | -0.79** | 0.32 | -0.61 | 5.49 | -0.06 | 0.15 | -56.24 | 38.15 | 5.58* | 2.31 | -0.02 | 6.38 | 0.164 | 0.257 |
| mean_soil_fert_m | -0.19 | 0.18 | 3.73 | 3.13 | 0.00 | 0.08 | -6.41 | 19.48 | 1.86 | 1.35 | 1.13 | 3.69 | ||
| meanVsocionetwork | 0.01 | 0.02 | 0.42 | 0.31 | -0.01 | 0.01 | -0.76 | 1.86 | -0.03 | 0.13 | -0.17 | 0.43 | 0.024 | 0.020 |
| meanext_v2 | 0.00 | 0.01 | 0.19 | 0.14 | 0.00 | 0.00 | 0.84 | 0.85 | -0.02 | 0.06 | 0.22 | 0.17 | -0.005 | 0.007 |
| _cons | 2.66** | 0.49 | 59.46** | 8.58 | 0.49* | 0.23 | -41.89 | 58.42 | -10.68 | 7.85 | 69.50** | 11.58 | 9.701 | 8.692 |
| Number of obs | 207 | 207 | 207 | 204 | 204 | 204 | 204 | |||||||
| F(24, 182)/LR chi2 (25 | 10.79 | 5.09 | 5.15 | 50.06 | 70.56 | 1.26 | 3.26 | |||||||
| Prob > F | 0 | 0 | 0 | 0.0009 | 0 | 0.19 | 0 | |||||||
| R-squared | 0.587 | 0.4015 | 0.3927 | 0.167 | 0.3611 | |||||||||
| Adj R-squared | 0.533 | 0.3226 | 0.3164 | 0.034 | 0.2503 |
| 1 | About 346 million people in Africa are undernourished. In 2021 alone, East Africa faced 7.2 million people at risk of hunger and 26.5 million with acute food insecurity (Verner et al., 2021; Wudil et al., 2022). |
| 2 | Also, is assumed to be independent of . The control group, , has . Also, denote . |
| 3 | The joint distribution of treatment and outcome variables, conditional on the common latent factors is the product of the marginal density of treatment and the conditional density, and is specified as: . |
| 4 | chi2(51) = (b-B)'[(V_b-V_B)^(-1)](b-B)= 13.63: Prob > chi2 = 1.0000. |
| 5 | Wald (126) = 1607.28 for agricultural income, Waldchi2 (122) = 19187.8 for food expenditure, Wald chi2 (122) = 17153.9 for food consumption score, Waldchi2 (111) =20974.1 for non-food expenditure and Wald chi2 (126) =12869.07 for grain in storage respectively. |
References
- Amare, M., Asfaw, S., & Shiferaw, B. (2012). Welfare impacts of maize–pigeonpea intensification in Tanzania. Agricultural Economics, 43(1), 27–43. [CrossRef]
- Arslan, A., Floress, K., Lamanna, C., Lipper, L., Asfaw, S., & Rosenstock, T. (2020). The adoption of improved agricultural technologies A meta-analysis for Africa.
- Assefa, B. T., Reidsma, P., Chamberlin, J., & van Ittersum, M. K. (2021). Farm- and community-level factors underlying the profitability of fertiliser usage for Ethiopian smallholder farmers, 60(4), 460–479. [CrossRef]
- Bezu, S., Kassie, G. T., Shiferaw, B., & Ricker-Gilbert, J. (2014). Impact of Improved Maize Adoption on Welfare of Farm Households in Malawi: A Panel Data Analysis. World Development, 59(C), 120–131. [CrossRef]
- Biru, W. D., Zeller, M., & Loos, T. K. (2020). The Impact of Agricultural Technologies on Poverty and Vulnerability of Smallholders in Ethiopia: A Panel Data Analysis. Social Indicators Research, 147(2), 517–544. [CrossRef]
- Bourguignon, F., Fournier, M., & Gurgand, M. (2007). Selection bias corrections based on the multinomial logit model: Monte Carlo comparisons. Journal of Economic Surveys, 21(1), 174–205. [CrossRef]
- Byerlee, D., Spielman, D. J., Alemu, D., & Gautam, M. (2007). Policies to promote cereal intensification in Ethiopia: A review of evidence and experience. IFPRI Discussion Papers. https://ideas.repec.org/p/fpr/ifprid/707.html.
- Collier, P., & Dercon, S. (2014). African Agriculture in 50Years: Smallholders in a Rapidly Changing World? World Development, 63(C), 92–101. [CrossRef]
- CSA & ICF. (2012). Ethiopia 2011 Demographic and Health Survey. Addis Ababa, Ethiopia and Calverton, Maryland, USA: Central Statistical Agency and ICF International.
- De, A., & Sadoulet, E. (2001). World Poverty and the Role of Agricultural Technology: Direct and Indirect Effects.
- de Janvry, A., Fafchamps, M., & Sadoulet, E. (1991). Peasant Household Behaviour with Missing Markets: Some Paradoxes Explained. The Economic Journal, 101(409), 1400. [CrossRef]
- Deb, P., & Trivedi, P. K. (2006). Maximum simulated likelihood estimation of a negative binomial regression model with multinomial endogenous treatment. The Stata Journal, 6(2), 246–255.
- Demeke, A. B. (2003). Factors Influencing the Adoption of Introduced Soil Conservation Practices in Northwestern Ethiopia. https://www.econbiz.de/Record/factors-influencing-the-adoption-of-introduced-soil-conservation-practices-in-northwestern-ethiopia-abera-birhanu-demeke/10005868873.
- Demelash, B. B. (2018). Common Bean Improvement Status (Phaseolus vulgaris L.) in Ethiopia. Advances in Crop Science and Technology, 6(2), 1–6. [CrossRef]
- Dercon, S., Gilligan, D. O., Hoddinott, J., & Woldehanna, T. (2009). The Impact of Agricultural Extension and Roads on Poverty and Consumption Growth in Fifteen Ethiopian Villages. American Journal of Agricultural Economics, 91(4), 1007–1021. [CrossRef]
- Deresa, S. (2018). Response of common bean (Phaseolus vulgaris L.) varieties to rates of blended NPS fertilizer in Adola district, Southern Ethiopia. African Journal of Plant Science, 12(8), 164–179. [CrossRef]
- Diao, X., Hazell, P., Thurlow, J., Diao, X., Hazell, P., & Thurlow, J. (2010). The Role of Agriculture in African Development. World Development, 38(10), 1375–1383. https://econpapers.repec.org/article/eeewdevel/v_3a38_3ay_3a2010_3ai_3a10_3ap_3a1375-1383.htm.
- Donkor, E., Owusu-Sekyere, E., Owusu, V., & Jordaan, H. (2016). Impact of agricultural extension service on adoption of chemical fertilizer: Implications for rice productivity and development in Ghana. NJAS - Wageningen Journal of Life Sciences, 79, 41–49. [CrossRef]
- Dorosh, P. A., & Rashid, S. (2012). Food and agriculture in Ethiopia: Progress and policy challenges. IFPRI Books. https://ideas.repec.org/b/fpr/ifprib/9780812245295.html.
- FAO. (2009). Climate change in Africa: The threat to agriculture Overview The impact of climate change on African agriculture.
- FAO. (2021). FAOSTAT. Crops and livestock products. License: CC BY-NC-SA 3.0 IGO. https://www.fao.org/faostat/en/#data/QCL.
- Feder, G., Just, R. E., & Zilberman, D. (1985). Adoption of agricultural innovations in developing countries: a survey. Economic Development & Cultural Change, 33(2), 255–298. [CrossRef]
- Foster, J., Greer, J., & Thorbecke, E. (1984). A Class of Decomposable Poverty Measures. Econometrica, 52(3), 761. [CrossRef]
- Gebremariam, G. G. (2018). Sustainable Agricultural Practices (SAPs) in Northern Ghana. https://bonndoc.ulb.uni-bonn.de/xmlui/handle/20.500.11811/7370.
- Habte, E., Gebeyehu, S., Tumsa, K., & Negash, K. (2012). Decentralized Common Bean Seed Production and Delivery System.
- Headey, D., Dereje, M., & Taffesse, A. S. (2014). Land constraints and agricultural intensification in Ethiopia: A village-level analysis of high-potential areas. Food Policy, 48, 129–141. [CrossRef]
- IFDC. (2015). Assessment of fertilizer consumption and use by crop in Ethiopia.
- Josephson, A. L. (2013). Purdue e-Pubs How Population Density Influences Agricultural Intensification and Productivity: Evidence from Ethiopia. https://docs.lib.purdue.edu/open_access_theses/31.
- Katungi, E. M., Larochelle, C., Mugabo, J. R., & Buruchara, R. (2018). The effect of climbing bean adoption on the welfare of smallholder common bean growers in Rwanda. Food Security, 10(1), 61–79. [CrossRef]
- Katungi, Enid, Nduwarigira, E., Ntukamazina, N., Niragira, S., Mutua, M., Kalemera, S., Onyango, P., Nchanji, E., Fungo, R., Birachi, E. A., Rubyogo, J.-C., & Buruchara, R. A. (2020). Food security and common bean productivity: Impacts of improved bean technology adoption among smallholder farmers in Burundi. https://cgspace.cgiar.org/handle/10568/109119.
- Kebede, E. (2020). Grain legumes production and productivity in Ethiopian smallholder agricultural system, contribution to livelihoods and the way forward. Http://Www.Editorialmanager.Com/Cogentagri, 6(1). [CrossRef]
- Khonje, M. G., Manda, J., Mkandawire, P., Tufa, A. H., & Alene, A. D. (2018). Adoption and welfare impacts of multiple agricultural technologies: evidence from eastern Zambia. Agricultural Economics, 49(5), 599–609. [CrossRef]
- Legesse, D. ., Kumssa, T., Assefa, M., Taha, J., Gobena, T., Alemaw, A., Abebe, Y., & Terefe, H. (2006). Production and Marketing of White Pea Beans in the Rift Valley, Ethiopia. A Sub-Sector Analysis. National Bean Research Program of the Ethiopian Institute of Agricultural Research. UnPublished Report.
- Letaa, E., Katungi, E., Kabungo, C., Ndunguru, A. A., Letaa, E., Katungi, E., Kabungo, C., & Ndunguru, A. A. (2020). Impact of improved common bean varieties on household food security on adopters in Tanzania. Journal of Development Effectiveness, 12(2), 89–108. [CrossRef]
- Manda, J., Alene, A. D., Mukuma, C., & Chikoye, D. (2017). Ex-ante welfare impacts of adopting maize-soybean rotation in eastern Zambia. Agriculture, Ecosystems and Environment, 249, 22–30. [CrossRef]
- Manda, J., Alene, A. D., Tufa, A. H., Abdoulaye, T., Wossen, T., Chikoye, D., & Manyong, V. (2019). The poverty impacts of improved cowpea varieties in Nigeria: A counterfactual analysis. World Development, 122, 261–271. [CrossRef]
- Maredia, M. K., Reyes, B. A., Manu-Aduening, J., Dankyi, A., Hamazakaza, P., Muimui, K., Rabbi, I., Kulakow, P., Parkes, E., Abdoulaye, T., Katungi, E., & Raatz, B. (2016). Testing Alternative Methods of Varietal Identification Using DNA Fingerprinting: Results of Pilot Studies in Ghana and Zambia. Food Security International Development Working Papers. [CrossRef]
- Matouš, P., Todo, Y., & Mojo, D. (2013). Roles of extension and ethno-religious networks in acceptance of resource-conserving agriculture among Ethiopian farmers. International Journal of Agricultural Sustainability, 11(4), 301–316. [CrossRef]
- Minten, B., Koru, B., & Stifel, D. (2013). The last mile(s) in modern input distribution: Pricing, profitability, and adoption. Agricultural Economics, 44(6), 629–646. [CrossRef]
- MOFED. (2003). Ministry of Finance and Economic Development. Rural development Policy and strategies. Resource document. http://gafspfund.org/sites/ gafspfund.org/files/Documents/Ethiopia_4_of_6_ARD policy.pdf.
- Mundlak, Y. (1978). On the Pooling of Time Series and Cross Section Data. Econometrica, 46(1), 69. [CrossRef]
- PABRA. (2014). Pan African Bean Research Alliance (PABRA Database). https://cgspace.cgiar.org/handle/10568/66451.
- Ragasa, C., Berhane, G., Tadesse, F., & Taffesse, A. S. (2013). Effects of Extension Services on Technology Adoption and Productivity among Female and Male Farmers. www.edri-eth.org.
- Sadoulet, E., & De Janvry, A. (1995). Quantitative development policy analysis. John Hopkins University Press.
- Schmidt, E., & Bekele, F. (2016). Rural youth and employment in Ethiopia.
- Singh, I., Squire, L., & Strauss, J. (1986a). A Survey of Agricultural Household Models: Recent Findings and Policy Implications. In Source: The World Bank Economic Review (Vol. 1, Issue 1).
- Singh, I., Squire, L., & Strauss, J. (1986b). AGRICULTURAL HOUSEHOLD MODELS Extensions, Applications, acnd Policy. In Published for The World Bank. The Johns Hopkins University Press. Baltimore and London.
- Smale, M., Assima, A., Kergna, A., Thériault, V., & Weltzien, E. (2018). Farm family effects of adopting improved and hybrid sorghum seed in the Sudan Savanna of West Africa. Food Policy, 74, 162–171. [CrossRef]
- Taffesse, A. S., Dorosh, P., & Asrat, S. (2012). Crop Production in Ethiopia: Regional Patterns and Trends Summary of ESSP II Working Paper 16, “Crop Production in Ethiopia: Regional Patterns and Trends” Ethiopia Strategy Support Program (ESSP II) Research Note 11. http://www.edri.org.et/.
- Takahashi, K., Muraoka, R., & Otsuka, K. (2019). Technology Adoption, Impact, and Extension in Developing Countries’ Agriculture: A Review of the Recent Literature. Working Papers. [CrossRef]
- Tarekegn, K., & Mogiso, M. (2020). Assessment of improved crop seed utilization status in selected districts of Southwestern Ethiopia. Http://Www.Editorialmanager.Com/Cogentagri, 6(1). [CrossRef]
- Teklewold, H., Kassie, M., & Shiferaw, B. (2013). Adoption of multiple sustainable agricultural practices in rural Ethiopia. Journal of Agricultural Economics, 64(3), 597–623. [CrossRef]
- Tilman, D., Balzer, C., Hill, J., & Befort, B. L. (2011). Global food demand and the sustainable intensification of agriculture. Proceedings of the National Academy of Sciences of the United States of America, 108(50), 20260–20264. [CrossRef]
- Tufa, A. H., Alene, A. D., Manda, J., Akinwale, M. G., Chikoye, D., Feleke, S., Wossen, T., & Manyong, V. (2019). The productivity and income effects of adoption of improved soybean varieties and agronomic practices in Malawi. World Development, 124, 104631. [CrossRef]
- Vaiknoras, K., & Larochelle, C. (2021). The impact of iron-biofortified bean adoption on bean productivity, consumption, purchases and sales. World Development, 139, 105260. [CrossRef]
- Waceke, J. W., & Kimenju, • J W. (2007). Dynamic Soil, Dynamic Plant ©2007 Global Science Books Intensive Subsistence Agriculture: Impacts, Challenges and Possible Interventions.
- Worku, I. (2011). Road Sector Development and Economic Growth in Ethiopia. http://www.edri.org.et/.
- World Bank. (2018). Poverty and Shared Prosperity 2018 : Piecing Together the Poverty Puzzle. World Bank. https://openknowledge.worldbank.org/handle/10986/30418.

| Outcome variable | Full sample | LV only | PIV only | FIV only | PIV+F | FIV+F |
|---|---|---|---|---|---|---|
| (N=865) | (n=207) | (n=120) | (n=266) | (n=69) | (n=204) | |
| Adoption indicator | 23.93 | 13.87 | 30.75 | 7.86 | 23.58 | |
| Outcome variables | ||||||
| Non-food consumption expenditure/Capita (000ETBirr | 1.88(2.11) | 1.65(1.86) | 1.77(1.09) | 1.85(2.35) | 3.1 (3.12( | 2.00(1.78) |
| Food consumption expenditure/Capita (000ETBirr ) | 4.89(5.89) | 4.10(1,86) | 4.69(3.05) | 5.47 (9.02) | 5.21 (4.13) | 5.14(5.06) |
| bean yield ('000/ha)*** | 1.00 (0.824) | 0.962 (0.775) | 0.947(0.628) | 0.865(0.759) | 1.0 (0.671) | 1.15 (0.953) |
| Net bean income (000ETBirr) | 4.24(4.87) | 5.36(4.69) | 4.56(3.98) | 3.93(3.95) | 3.944.46) | 3.19(4.69) |
| Agricultural income (000ETBirr) | 45.38(128.70) | 64.64 (54.19) | 36.00(54.19) | 37.65(88.89) | 75.82(129.56) | 31.90(48. 02) |
| Food consumption groups** | ||||||
| 1 | 1.94 | 2.42 | 2.63 | 2.45 | ||
| 2 | 7.97 | 9.18 | 1.79 | 7.89 | 3.28 | 11.27 |
| 3 | 90.09 | 88.41 | 98.21 | 89.47 | 96.72 | 86.27 |
| Food expenditure share** | 70.12(17.91) | 70.45(18.73) | 70.18(16.38) | 71.25(18.43) | 64.16(17.54) | 68.93(17.08) |
| Kg of grain store at end of meher season | 27.85(63.96) | 31.32(56.90) | 32.20(42.73) | 22.14(59.89) | 115.81(152.33) | 19.36 (38.91) |
| HFIAS *** | 4.84(5.26) | 4.21 (4.89) | 3.46(4.19) | 4.98(5.49) | 3.13(4.01) | 6.29(5.51) |
| Explanatory variables | ||||||
| HH Age (Years) | 42.93(11.90) | 42.67(11.32) | 44.08(14.24) | 43.72(12.62) | 47.26(9.41) | 41.04(11.20) |
| HH head education (base category=none) | ||||||
| primary education only (%)** | 30.25 (45.94) | 50.24 (50.12) | 22.5 (41.92) | 40.23 (0.49) | 39.71 (49.29) | 48.04(11.21) |
| above primary education (%) | 41.4 (49.27) | 14.01 (34.79) | 23.33 (42.47) | 9.02 (28.7) | 22.06(41.77) | 15.2 (35.98) |
| Household size | 6.14(2.18) | 6.26(2.20) | 5.76(1.94) | 6.02(2.14)(2.09) | 6.27(1.68) | 6.11(2.02) |
| HH gender (1=male) | 0.93 (0.26) | 0.93(0.22) | 0.98(0.13) | 0.91(0.29) | 0.85(0.36) | 0.92(0.27) |
| HH asset index | 0.14(1.39) | 0.05 (1.31) | 0.26(1.70) | -0.0776 | 1.07(1.78) | 0.02(1.27) |
| Agricultural index | -1.72(2.34) | -4.0296 | -2.9388 | -1.72(2.46) | 0.003(3.47) | -1.73(2.54) |
| Credit in cash (1=yes) | 0.16(0.37) | 0.17(0.38) | 0.21(0.41) | 0.21(0.41) | 0.25(0.44) | 0.21(0.41) |
| Credit in kind (1=yes) | 0.23(0.42) | 0.30(0.47) | 0.20(0.41) | 0.24(0.43) | 0.29(0.45) | 0.30 (0.46) |
| Off farm income** | 0.33(0.47) | 0.35(0.48) | 0.31(0.46) | 0.28(0.45) | 0.37(0.48) | 0.35(0.47) |
| Farm characteristics | ||||||
| Seed rate (Kg/Ha) | 55.54(45.52) | 52.52(46.02) | 61.32(46.70) | 52.48(42.60) | 59.37(40.09) | 60.50(54.08) |
| Bean area (Ha) all farms | 0.27(0.27) | 0.31(0.30) | 0.24(0.25) | 0.28(0.22) | 0.21(0.18) | 0.26(0.25) |
| Total landholding (Ha) | 2.44 (4.90) | 2.99(3.19) | 2.51(4.40) | 2.58(8.28) | 3.24 | 1.58(1.60) |
| Precipitation (000 mm) | 1.15 (0.31) | 1.26(0.33) | 1.13(0.28) | 1.08 (0.28) | 1.17(0.36) | 1.07(0.25) |
| Soil PH | 6.52 (0.75) | 6.13(0.76) | 6.64(0.71) | 6.70(0.66) | 6.66(0.83) | 6.73(0.69) |
| temperature | 19.56(1.87) | 20.38(1.39) | 18.85(1.72) | 19.26(2.19) | 19.24 (2.07) | 19.43(1.81) |
| Labour/Ha(man days)*** | 586.94 (1891.7) | 393.26(1223.8) | 404.49(947.4) | 425.55(2187.8) | 315.70(475.84) | 958.98(2464.7) |
| Climbing bean (1=Yes)** | 0.33(0.48) | 0.29(0.46) | 0.50(0.50) | 0.32(0.47) | 0.46(0.50) | 0.35(0.50) |
| Irrigation (1=Yes)*** | 0.51(0.50) | 0.570.49) | 0.58(0.50) | 0.48(0.50) | 0.59(0.50) | 0.39(0.46) |
| mean soil fertility poor | 0.12(0.24) | 0.09 (0.22) | 0.10(0.16) | 0.14(0.25) | 0.08 (0.18) | 0.14(0.28) |
| Distance to town (km)*** | 19.03 (12.57) | 22.59(14.94) | 23.74(17.24) | 19.14(13.88) | 18.70(16.71) | 14.18(9.62) |
| Located <10km tarmac road | 0.34(0.47) | 0.52(0.50) | 0.44(0.50) | 0.45 (0.50) | 0.411 (0.50) | 0.53(0.50) |
| Located >10km tarmac road | 0.11 (0.31) | 0.24(0.43) | 0.26(0.44) | 0.16(0.37) | 0.16(0.38) | 0.05(0.23) |
| Means village extension contact freq | 28.79(15.18 | 25.28(11.86) | 32.84(7.62) | 25.49(12.12) | 40.22(23.64) | 28.27(15.38) |
| mean village level social network | 4.92 (6.10) | 2.87(4.62) | 7.62(7.59) | 6.37(6.44) | 6.55(5.03) | 3.67(5.11) |
| Total Livestock Units | 4.10(19.51) | 7.18(52.16) | 3.70(4.32) | 3.15(2.69) | 4.49(4.51)) | 2.63(2.08) |
| Regions *** | ||||||
| Benshangul_Gumuz | 0.04 | 0.03 | 0.05 | 0.06 | 0.07 | 0.005 |
| Oromya | 0.52 | 0.71 | 0.43 | 0.34 | 0.62 | 0.54 |
| SNNPR | 0.22 | 0.18 | 0.07 | 0.13 | 0.15 | 0.37 |
| Amhara | 0.22 | 0.08 | 0.45 | 0.47 | 0.16 | 0.098 |
| aez_id3 | 11.95 | 7.25 | 0.25 | 0.17 | 0.09 | 0.25 |
| aez_id4 | 8.5 | 11.11 | 0.1 | 0.09 | 0.21 | 0.17 |
| aez_id5 | 18.32 | 6.76 | 0.25 | 0.31 | 0.26 | 0.41 |
| aez_id6 | 6.76 | 18.36 | 0.05 | 0.04 | 0.13 | 0.05 |
| aez_id8 | 11.75 | 42.03 | 0.15 | 0.09 | 0.15 | 0.02 |
| PIV only | FIV only | PIV+F | FIV+F | |||||
|---|---|---|---|---|---|---|---|---|
| (n=120) | (n=266) | (n=69) | (n=204) | |||||
| me | Se | me | Se | me | Se | me | Se | |
| Predicted prob | 0.139 *** | .031 | 0.411*** | 0.033 | 0.049*** | 0.0126 | 0.194*** | 0.028 |
| HH Age (Years) | 0.000 | 0.001 | 0.002 | 0.002 | 0.001 | 0.001 | -0.003** | 0.001 |
| HH head education (base category=none) | ||||||||
| primary education only | -0.073** | 0.034 | 0.083** | 0.038 | 0.015 | 0.030 | -0.003 | 0.033 |
| above primary education | 0.017 | 0.026 | 0.037 | 0.030 | -0.023 | 0.021 | 0.010 | 0.025 |
| Household size | -0.007 | 0.010 | -0.003 | 0.009 | 0.007 | 0.006 | 0.003 | 0.007 |
| HH gender (1=male) | 0.194* | 0.109 | -0.103* | 0.064 | -0.057 | 0.043 | -0.009 | 0.057 |
| HH asset index | 0.020* | 0.011 | 0.005 | 0.017 | 0.007 | 0.008 | 0.018 | 0.012 |
| Agricultural index | -0.014* | 0.008 | 0.009 | 0.009 | 0.011*** | 0.004 | 0.005 | 0.008 |
| Credit in cash (1=yes) | -0.010 | 0.037 | -0.071* | 0.041 | 0.027 | 0.028 | 0.035 | 0.036 |
| Credit in kind (1=yes) | -0.001 | 0.035 | -0.071* | 0.039 | 0.012 | 0.029 | 0.059* | 0.034 |
| Off farm income** | -0.004 | 0.035 | -0.042 | 0.036 | -0.002 | 0.028 | -0.021 | 0.032 |
| Farm characteristics | ||||||||
| altitude | 0.161 | 0.225 | -0.220 | 0.222 | -0.035 | 0.178 | 0.192 | 0.167 |
| Total landholding (Ha) | -0.005 | 0.020 | -0.019 | 0.022 | 0.022 | 0.019 | -0.003 | 0.019 |
| temperature | -0.096 | 0.223 | -0.428 | 0.290 | 0.085 | 0.213 | 0.393* | 0.239 |
| Climbing bean (1=Yes)** | 0.028 | 0.029 | -0.103*** | 0.034 | 0.015 | 0.021 | 0.041 | 0.030 |
| Irrigation (1=Yes)*** | -0.002 | 0.045 | 0.000 | 0.040 | 0.014 | 0.029 | -0.079** | 0.033 |
| Soil fertility (base-good) | ||||||||
| mean soil fertility poor | -0.084 | 0.067 | 0.066 | 0.063 | -0.025 | 0.048 | 0.044 | 0.057 |
| mean soil fertility medium | 0.042 | 0.046 | -0.037 | 0.044 | -0.054* | 0.0312 | -0.036 | 0.037 |
| Distance to town (km)*** | 0.030 | 0.020 | 0.030 | 0.024 | -0.026 | 0.020 | -0.049* | 0.028 |
| Located <10km tarmac road | 0.026 | 0.071 | 0.022 | 0.055 | -0.004 | 0.049 | -0.139*** | 0.046 |
| Located >10km tarmac road | 0.083 | 0.073 | 0.043 | 0.071 | 0.058 | 0.058 | -0.292*** | 0.069 |
| Means village extension | 0.004*** | 0.001 | -0.002 | 0.002 | 0.004*** | 0.001 | 0.000 | 0.001 |
| village level social network | -0.002 | 0.004 | -0.007 | 0.005 | 0.000 | 0.003 | 0.010** | 0.005 |
| Total Livestock Units | 0.003 | 0.002 | -0.001 | 0.007 | 0.002 | 0.001 | -0.008 | 0.006 |
| Regions *** (Base=Amhara) | ||||||||
| Benshangul_Gumuz | -0.035 | 0.129 | 0.311* | 0.172 | -0.070 | 0.110 | 0.007 | 0.248 |
| Oromya | -0.110 | 0.091 | -0.332*** | 0.080 | -0.037 | 0.064 | 0.354*** | 0.079 |
| SNNPR | -0.159 | 0.144 | -0.302*** | 0.098 | -0.059 | 0.059 | 0.435*** | 0.080 |
| agroecological zones (base=1/2) | ||||||||
| aez_id3 | 0.056 | 0.104 | -0.103 | 0.078 | 0.011 | 0.068 | 0.142** | 0.059 |
| aez_id4 | 0.170** | 0.085 | -0.151** | 0.071 | 0.096* | 0.053 | -0.020 | 0.063 |
| aez_id5 | 0.053 | 0.117 | -0.044 | 0.076 | 0.035 | 0.056 | 0.199*** | 0.063 |
| aez_id6 | 0.162 | 0.165 | -0.212** | 0.105 | 0.124** | 0.059 | -0.146* | 0.079 |
| aez_id8 | 0.163 | 0.124 | -0.280** | 0.128 | -0.010 | 0.068 | -0.144 | 0.117 |
| PIV only | FIV only | PIV +F | FIV +F | |
|---|---|---|---|---|
| OLS | ||||
| agricultural income | 0.188 | 0.180* | 0.277* | 0.395*** |
| 0.124 | 0.105 | 0.149 | 0.113 | |
| per capita food consumption expenditure | 0.012** | -0.005 | 0.074 | 0.023 |
| 0.077 | 0.066 | 0.093 | 0.071 | |
| Non food expenditure | 0.110 | -0.030 | 0.355*** | 0.247*** |
| 0.098 | 0.083 | 0.118 | 0.090 | |
| Food consumption score | 6.029*** | 3.096* | 1.217 | 6.109*** |
| 2.123 | 1.804 | 2.562 | 1.951 | |
| Food expenditure share | -0.872 | -0.083 | -6.330*** | -4.855*** |
| 2.257 | 1.918 | 2.724 | 2.074 | |
| Food in store | 20.235 | -7.217 | 94.837 | 1.027748** |
| 14.613 | 12.917 | 16.805 | 13.982 | |
| Household food insecurity assessment score | -2.142** | -0.184 | -1.401 | 0.88 |
| 0.889 | 0.714 | 1.073 | 0.785 | |
| METE | ||||
| agricultural income | -0.215 | 0.396*** | 0.502** | 0.211*** |
| 0.199 | 0.15 | 0.529 | 0.175 | |
| per capita food consumption expenditure | 0.384*** | -0.115 | 0.095 | -0.076 |
| 0.109 | 0.111 | 0.116 | 0.115 | |
| Nonfood expenditure | 0.110 | -0.030 | 0.355*** | 0.247*** |
| 0.098 | 0.083 | 0.118 | 0.090 | |
| Food consumption score | -0.054 | 0.084** | 0.134* | 0.083* |
| 0.052 | 0.043 | 0.072 | 0.046 | |
| Food expenditure share | -0.013 | -0.01 | -0.100*** | -0.073*** |
| 0.036 | 0.03 | 0.043 | 0.033 | |
| Food in storage | 0.455* | 0.056 | 1.094*** | 0.249 |
| 0.256 | 0.206 | 0.261 | 0.241 | |
| Household food insecurity assessment score | -0.206 | 0.111 | -0.363 | 0.152 |
| 0.203 | 0.142 | 0.240 | 0.150 |
Disclaimer/Publisher’s Note: The statements, opinions and data contained in all publications are solely those of the individual author(s) and contributor(s) and not of MDPI and/or the editor(s). MDPI and/or the editor(s) disclaim responsibility for any injury to people or property resulting from any ideas, methods, instructions or products referred to in the content. |
© 2024 by the authors. Licensee MDPI, Basel, Switzerland. This article is an open access article distributed under the terms and conditions of the Creative Commons Attribution (CC BY) license (https://creativecommons.org/licenses/by/4.0/).


