Submitted:
15 October 2024
Posted:
15 October 2024
You are already at the latest version
Abstract
Background
Anemia is a prevalent global health issue, affecting individuals across all age groups and leading to significant morbidity. Traditional methods for diagnosing anemia rely on laboratory assessments of hemoglobin concentration, which are invasive and costly. This study investigates the potential of a chest X-ray (CXR)-based deep learning model (DLM) to predict anemia, offering a non-invasive and efficient diagnostic alternative.
Patients and methods
We conducted a retrospective cohort study using data from Tri-Service General Hospital, Taipei, Taiwan, collected between June 2016 and February 2022. A total of 305,793 patients aged 20 years and older who had at least one CXR were included. The dataset was divided into development, tuning, internal validation, and external validation sets. All data originated from Tri-Service General Hospital, except for the external validation set, which was obtained from the Jingjhou branch. A DLM based on a 50-layer SE-ResNeXt architecture was developed to predict anemia from CXR images. The model's performance was compared to predictions made using traditional clinical data to assess its predictive accuracy.
Results
The DLM for predicting anemia showed strong performance, with an AUC of 0.845 in the internal validation set (sensitivity 68.5%, specificity 84.7%) and 0.852 in the external set (sensitivity 71.5%, specificity 83.2%). Subgroup analysis revealed better diagnostic accuracy with computed radiography, posteroanterior (PA) view, and in males aged 55 to 64, while younger females had lower accuracy. The DLM, especially when combined with patient data, outperformed other clinical models.
Conclusion
Our study introduces a deep learning tool for detecting anemia from chest images, offering faster decision-making and interventions in clinical settings. With further refinement, this model aims to align more closely with real-time clinical conditions, enhancing its utility. Ultimately, it has the potential to improve patient care through quicker anemia detection and better clinical outcomes.
Keywords:
artificial intelligence
; deep learning
; anemia
; chest-X-ray
1. Introduction
Anemia is a widespread global health issue, defined by a reduction in the number of red blood cells (RBCs) or a decrease in hemoglobin concentration within the cells, falling below normal levels.[1] According to the World Health Organization (WHO), in 2019, anemia affected 30% (571 million) of women aged 15-49 years, 37% (32 million) of pregnant women, and 40% (269 million) of children aged 6-59 months.[2] Additionally, over 20% of individuals aged 85 years and older suffer from anemia.[3] It is a common condition across different nations and age groups. Anemia can be triggered by various acute and chronic conditions, surgeries, menstrual blood loss, gastrointestinal bleeding, infections, immune-mediated disorders, and inherited diseases, causing fatigue, cognitive impairment, multi-organ dysfunction, irreversible complications, and even life-threatening conditions.[4]
Anemia typically presents with nonspecific symptoms, and a wide range of signs may suggest its presence.[4] As a result, diagnosing anemia based on physical examination alone is challenging. Historically, anemia diagnosis has relied on laboratory assessments of hemoglobin concentration, which are generally conducted through blood tests. While this approach is highly accurate, it is invasive, costly, and dependent on specialized equipment and trained professionals.[5] These resources may not always be accessible, especially in remote or underdeveloped healthcare settings.
Anemia leads to insufficient oxygen delivery due to a lack of adequate hemoglobin, resulting in a series of cardiovascular changes that ultimately cause left ventricular hemodynamic alterations.[6,7] Chest X-ray (CXR) is a commonly used tool in hospitals due to its low cost and the availability of extensive databases. However, because anatomical structures are superimposed along the projection direction, interpreting chest X-rays can be challenging. This effect makes detecting subtle abnormalities at specific locations difficult.[8] For human radiologists, it is nearly impossible to interpret anemia from CXR images alone. However, by evaluating signs like the "aortic ring sign" and the "interventricular septum sign," radiologists can use computed tomography (CT) to assess anemia.[9] Recent studies have explored the use of electrocardiogram (EKG)-based deep learning models (DLM) to predict anemia by analyzing the cardiovascular changes that result in corresponding electrical changes in the heart.[10] Compared to EKG, CXR is theoretically a more intuitive method for observing anemia-related volume and ventricular changes. Additionally, DLM has been widely used in analyzing CXR images for conditions like tuberculosis, lung cancer, COVID-19, and cardiomegaly, although none of these studies have focused on anemia detection.[11] Recent research has also successfully used CXR-based DLM to predict cardiovascular age, further suggesting that DLM can assess cardiovascular status from CXR images.[12] Given the success of EKG-based DLM in predicting anemia and prior studies demonstrating the capability of CXR-based DLM in assessing cardiovascular conditions, we hypothesize that DLM could predict anemia through CXR.
Based on the aforementioned discussion, it is evident that CXR has the potential to capture cardiovascular changes, and its application within DLM has already been demonstrated in various medical conditions. Building on this foundation, we conducted a retrospective cohort study and developed a DLM to predict anemia in order to test this hypothesis. Additionally, we performed an in-depth analysis of subgroups in an effort to identify factors that may affect predictive accuracy and explored the associations between relevant characteristics. Finally, we performed a comparative analysis between the predictive capabilities of the DLM and traditional clinical data. Specifically, we sought to determine whether the DLM, when combined with imaging data from CXR, could outperform predictions made using conventional clinical information alone. Our goal was to assess whether the integration of machine learning with imaging techniques provides an advantage for clinical anemia scenario.
2. Method
2.1 Data source and Population
The database utilized for this research was sourced from Tri-Service General Hospital in Taipei, Taiwan, and the study received ethical approval from the hospital’s institutional review board (IRB No. C202305019). The CXRs were selected according to the following criteria: (1) Data collection occurred between June 2016 and February 2022; (2) Patients younger than 20 years old were excluded; and (3) The CXRs originated from the emergency department (ER), outpatient department (OPD), or inpatient department (IPD). Each patient contributed only one CXR, chosen at a randomized point in time to ensure a representative sample, as previously applied in other studies. This approach was chosen to provide a more representative sample, as opposed to using only the most recent X-ray, and better simulates the scenario where a patient may present at an outpatient clinic at any given time. Additionally, previous studies have confirmed that despite the randomness in selection, the model's performance remains consistent.[13]
The database was divided into four subsets: development, tuning, internal validation, and external validation sets. Their baseline characteristics and image features are presented in Table 1, with the process of data separation illustrated in Figure 1. A total of 305,793 CXRs met the inclusion criteria, and the corresponding demographic details were analyzed. To facilitate the separation process, 47,898 CXRs from the Jingjhou branch were assigned to the external validation set, ensuring that no data from this branch participated in the model training phase, allowing for independent validation, which was also widely used in previous study.[14] For model development, 135,867 CXRs from branches outside Jingjhou were assigned to the development set, 54,405 to the tuning set for parameter optimization, and 67,623 to the internal validation set. The development and tuning sets are both involved in the training process. The development set serves as the primary dataset for training, while the tuning set is used to fine-tune the model and adjust its training trajectory. Since both of them are already part of the training process, it cannot be considered for independent case predictions and, therefore, will not be included in the result presentation.
All the P values of the characteristics were less than 0.001, except anemia. The mean age ranged from 50.9 to 52.2 years.
2.2 Observation Variables
Our main observational variables included both disease-related and basic patient characteristics.
Disease characteristics included heart failure (HF), diabetes mellitus (DM), chronic kidney disease (CKD), coronary artery disease (CAD), hypertension (HTN), Hyperlipidemia (HLP), and Chronic Obstructive Pulmonary Disease (COPD).
Basic patient characteristics included age, sex, acquisition location (e.g., IPD, OPD, or ER), posteroanterior (PA) or anteroposterior (AP) view, and hemoglobin level. Anemia was defined as a hemoglobin concentration of less than 10 g/dL. Hemoglobin values were collected within one day before or after the CXR.
The definitions of the other variables were described in Supplemental material.
2.3 The CXR Report Analysis
To gain a deeper understanding of the relationship between lung structure and anemia, we analyzed radiologist-typed CXR reports. The reports were preprocessed to standardize the content, and key phrases identified by the radiologist were used for keyword extraction and analysis.
2.4. The Implementation of the DLM
The details of the DLM are referred and revised from previous research.[12]
The methods used in this article will be described in the following, which including the data preprocessing, deep learning network structure and related parameters.
The CXR data were recorded in DICOM format with a resolution of more than 3000 × 3000 pixels, with each linking to a digital label about age. To standardize picture size, we scaled down the short side to 256 pixels in proportion and randomly cropped 224×224 pixels with a 50-50 chance for horizontal inversion as input. After that, data were generated to 10 subdata by 10-crop evaluation based on a previous study.[15] The average of these 10 probabilities is the output of our data given by the DLM.
The major feature extraction architecture is based on a 50-layer SE-ResNeXt, which won the ImageNet Large Scale Visual Recognition Challenge (ILSVRC) in 2017.[16] We used transfer learning by ImageNet data and preserved the final layer parameter for our DLM initial parameter. The output data from SE-ResNeXt passed through a subsequent global pooling layer and a fully connected layer with 1 digital output with a softmax function. The final output is the age at which the DLM predicted if patient has anemia.
Each parameter of the CXR-age DLM was updated to minimize the mean-square error loss, while CXR-sex by cross-entropy loss, and the oversampling process was implemented based on the weights computed on the prevalence of that class in the development set. We used 32 batch sizes for training, and all parameters were trained by Adam (adaptive moment estimation), with an initial learning rate of 0.001 and a decay of 10 times when the loss plateaued after an epoch. The loss calculated by the tuning set was recorded for each epoch, and we chose the epoch with minimal loss to avoid DLM overfitting to the development set. The only regularization method for avoiding overfitting was a weight decay of 10-4 in this study. The above details were implemented by the package MXNet (R package version 1.3.0).
2.5. Outcome and Statistical Analysis
The details were described in Supplemental Material.
3. Results
3.1. Baseline Characteristics
Patient characteristics in the development, tuning, internal validation and external validation sets are shown in Table 1. All the P values for the characteristics were less than 0.001, except for the anemia rate. This discrepancy may be attributed to differences in population composition between the internal and external validation sets. The mean age ranged from 50.9 to 52.2 years.
3.2. Performance of the DLM to Predict Anemia
The Receiver Operator Characteristic (ROC) Curve and the related variances, which are presented in Figure 2, are used to calculate the Area Under Curve (AUC) and identify an optimal cutoff point for distinguishing anemia.
In the internal validation set, the AUC curve was 0.845, with a sensitivity of 68.5%, specificity of 84.7%, positive predictive value of 30.0%, and negative predictive value of 96.5%. In the external validation set, the AUC curve was 0.852, with a sensitivity of 71.5%, specificity of 83.2%, positive predictive value of 29.5%, and negative predictive value of 96.7%.
3.3. AUC values for Anemia Detection Across Various Subgroups
We analyzed the AUC values for anemia detection across various subgroups in both internal and external validation datasets, presented in Figure 3. Factors considered included age, gender, diagnostic method (e.g., computed radiography, digital radiography), clinical settings (e.g., ER, IPD, OPD), and underlying clinical conditions. Overall, performance varied across these dimensions, with notable differences between the internal and external validation results.
In the internal validation, computed radiography (AUC 0.869, 95% CI: 0.859−0.878) and PA view (AUC 0.812, 95% CI: 0.805−0.819) showed better diagnostic performance. The inpatient department (AUC 0.851, 95% CI: 0.844−0.857) performed better than the outpatient and emergency departments. Regarding age and gender, males (AUC 0.909, 95% CI: 0.903−0.914) and individuals aged 55 to 64 years (AUC 0.876, 95% CI: 0.863−0.888) demonstrated superior diagnostic ability, although a significant decline was observed in younger females under 55 years. For underlying clinical conditions, patients with hypertension (AUC 0.794, 95% CI: 0.782−0.805), chronic kidney disease (AUC 0.764, 95% CI: 0.748−0.780), and heart failure (AUC 0.767, 95% CI: 0.752−0.782) exhibited lower diagnostic performance compared to those without these conditions.
In the external validation, similar patterns emerged. Computed radiography (AUC 0.867, 95% CI: 0.856−0.877) again showed high performance, but there was no statistical difference between AP and PA views (AUC 0.816, 95% CI: 0.809−0.824). The IPD (AUC 0.855, 95% CI: 0.838−0.872) outperformed the OPD and ER. In terms of demographic factors, males (AUC 0.910, 95% CI: 0.903−0.917) and individuals aged 55 to 64 years (AUC 0.876, 95% CI: 0.863−0.888) showed better performance, but detection ability was reduced in younger females. Additionally, patients with chronic kidney disease (AUC 0.774, 95% CI: 0.757−0.791) and heart failure (AUC 0.775, 95% CI: 0.755−0.795) demonstrated lower diagnostic accuracy compared to those without these conditions.
3.4. Related Important Features With Anemia
In Figure 4A, the subgroup with a history of chronic kidney disease had the highest relative importance in predicting anemia. Other important features included age (64.4% relative importance compared to the chronic kidney disease subgroup), PA or AP view (49.6%), nasogastric tube (38.3%), and costophrenic angle blunting (32.4%).
3.5. Comparison with other Prediction Models
In Figure 4B, the deep learning model was compared with several other models using clinically relevant characteristics. In the internal validation set, the combination of the DLM with patient data showed the highest AUC. Following that, the models combining all information and the deep learning model alone also performed well, demonstrating DLM's advantage in predicting anemia. The external validation set exhibited a similar trend, further supporting the model’s robustness.
4. Discussion
In this retrospective cohort study, we developed a CXR-based DLM to detect anemia. The ROC curve revealed AUC values of 0.845 for internal validation and 0.852 for external validation, with both sets displaying high negative predictive values and moderate sensitivity and specificity in distinguishing anemia. Subgroup analysis showed that in the internal validation, computed radiography and the inpatient setting performed the best, with males and individuals aged 55-64 achieving the highest diagnostic accuracy. In contrast, younger females and patients with hypertension, chronic kidney disease, and heart failure showed lower diagnostic performance, a trend also observed in the external validation set. Further analysis identified several key features associated with anemia prediction, with a history of chronic kidney disease having the highest relative importance. Other notable factors included age, PA or AP view, nasogastric tube placement, and costophrenic angle blunting. Comparisons of various models demonstrated that the DLM combined with patient data had the highest AUC in the internal validation set, while other models, including those using all available information or the DLM alone, also performed well. A similar trend was seen in the external validation, further underscoring the model’s predictive strength.
Our study demonstrated that the CXR-based DLM has excellent ability in distinguishing anemia. According to previous studies and our own findings, anemia can induce noticeable changes in chest imaging.[9,17,18,19] From a physiological standpoint, when hemoglobin (Hb) levels are greater than 10 g/dL, non-hemodynamic mechanisms, such as elevated 2,3-diphosphoglycerate (2,3-DPG), enable a rightward shift in the oxygen dissociation curve, which typically compensates for hemoglobin deficits.[20] However, in non-resting conditions or when hemoglobin falls below 10 g/dL, cardiac output begins compensating for tissue hypoxia.[6] Several mechanisms are responsible for this compensatory response. First, afterload decreases due to reduced systemic vascular resistance, potentially caused by hypoxic vasodilation induced by hypoxia-generated metabolites and flow-mediated vasodilation driven by increased blood flow. This vasodilation effect is mediated by endothelial cells and endothelium-derived relaxing factors.[21] Secondly, preload increases due to enhanced venous return.[6] Finally, and most importantly, anemia increases preload through the Frank-Starling mechanism and augments inotropic response via sympathetic activation, leading to changes in left ventricular hemodynamic performance.[7,22] However, these changes are difficult for human interpretation on CXR alone. Nevertheless, previous research on unenhanced chest CT has shown that the aortic ring sign is sensitive (82.5%) and specific (87%) in detecting anemia, while the interventricular septum sign is less sensitive (32%) but highly specific (99.2%). These results suggest that anemia can be detected using unenhanced chest CT scans.[9] Moreover, Studies using multidetector computed tomography showed that the aortic ring sign had higher sensitivity (84%) and specificity (92%) compared to the interventricular septum sign (sensitivity 72%, specificity 100%).[17] The objective analysis data revealed a strong correlation between blood pool attenuation at different anatomical sites and serum hemoglobin levels.[17] A significant correlation (r = 0.60) was specifically observed between aortic CT attenuation and hemoglobin levels, with 84% sensitivity, 94% specificity, and an AUC of 0.89 for anemia detection.[17] Thus, it can be concluded that anemia indeed causes cardiovascular changes detectable on chest imaging. Several studies also support this conclusion.[18,19] Our study also corroborates this evidence, indicating that anemia produces specific alterations in chest imaging, which can be detected and differentiated by the DLM.
Several factors may influence the accuracy of detecting anemia. In our subanalysis, better image quality was associated with higher AUC values, as seen in the PA view and computed radiography. Additionally, the overall predictive accuracy tends to decrease with age. However, females under 55 years old were an exception, likely due to regular blood loss from menstruation, a common cause of anemia in women.[23] Furthermore, subgroups with CKD and HF showed lower accuracy in detecting anemia. This may be due to several factors, such as hemodynamic instability during dialysis in CKD patients or heart failure-related cardiac remodeling, which affects left ventricular systolic and diastolic function,[24] potentially obscuring the aortic ring and other possible anemia sign on imaging. Nonetheless, the overall AUC remained relatively stable across the different subgroups.
Several key predictive features were identified. According to previous data, anemia is associated with various clinical scenarios such as hemorrhage, gastrointestinal bleeding, infections, and inflammation.[4] In our study, a history of CKD showed the highest predictive importance. Several factors contributed to this outcome. First, although anemia is associated with many factors such as age, underlying disease history, various interventions, and imaging characteristics (e.g., consolidation change, pneumonia, pulmonary edema), patients with a history of CKD (37.4%) had a 6.8-fold higher prevalence of anemia compared to those without CKD (5.5%) [Supplementary table 1]. The prevalence of anemia in CKD reported in the United States—stage 3: 17.4%, stage 4: 50.3%, stage 5: 53.4%—corresponds with our findings.[25] Several mechanisms contribute to anemia in CKD, including reduced erythropoietin (EPO) production, iron deficiency, chronic inflammation, reduced red blood cell lifespan due to uremia, and blood loss from dialysis.[26] The second most important factor is age. It is well-established that anemia can be caused by various physiological factors, with age being a significant contributor.[4] The third key factor is the AP view, which is often associated with patients too weak to complete an PA view. These factors are strongly associated with anemia detection and contribute to the DLM's predictive capabilities.
To the best of our knowledge, this is the first study to use a CXR-based DLM to predict anemia. Previous studies have explored the use of CXR-based models for various clinical predictions, but none have focused on anemia detection.[11] Several DLMs have attempted to detect anemia through the use of EKG, facial images, and images of the palpebral conjunctiva.[10,27,28] However, these methods face several limitations, such as the difficulty of obtaining images compared to CXR, lack of a standardized clinical protocol, the need for additional patient consent, and the absence of a large database and comprehensive external validation. Our results align with studies that demonstrate the efficacy of integrating patient data with imaging techniques to improve diagnostic accuracy. We also analyzed the performance of our DLM, and the results showed that the model outperformed predictions based solely on routine clinical data, especially when combined with patient data. This represents a significant advancement in predictive modeling for anemia compared to traditional methods.
The CXR-based DLM provides an accessible tool for early anemia detection, especially during initial screenings using passive electronic medical records. Because CXR is a routine and preliminary examination that is typically performed in emergency rooms, outpatient clinics, and during hospitalization, the DLM can be effectively utilized across different clinical settings. One of the key advantages of the DLM is its ability to leverage widely available chest X-rays, offering significant utility in resource-limited settings. Even a single portable X-ray can provide sufficient information, making it a valuable tool where advanced laboratory diagnostics are not readily accessible, assisting in the initial screening of individuals with anemia and guiding doctors in further evaluation and lifestyle recommendations. Importantly, the DLM does not require new interventions but rather analyzes existing data from routine examinations, enabling physicians to obtain a general understanding of whether anemia is present without increasing workload.
5. Limitation
Several limitations were found in our work. First, our research is hospital-based and includes only data from the ER, IPD, and OPD, which may limit the applicability of the model to healthy individuals. Secondly, the interpretability of the DLM is limited. It is difficult to determine exactly what features the DLM has analyzed in the CXR images. "Black-box" operations are a common limitation in DLMs,[29] and our study is no exception. Although we hypothesize and summarize certain relationships based on human-observable signs, some correlations remain unconfirmed. Third, establishing causality between image characteristics and anemia remains difficult. Almost all characteristics showed a positive correlation with anemia, but this may be influenced by underlying comorbidities. This suggests that the presence of anemia may not be the only factor driving these correlations. Fourth, the DLM was developed using a binary classification approach for hemoglobin levels, without distinguishing between mild and severe anemia. However, in clinical practice, distinguishing between mild and severe anemia is important. This limitation arises because CXR cannot reflect real-time hemoglobin levels, especially in acute cases like GI bleeding. Blood tests are prioritized for real-time assessment, while CXR is considered only after blood transfusion and stabilization. Timing discrepancies between CXR and blood tests further complicate the model's performance in acute settings. We plan to pursue this direction in future research. Finally, in our study, there were baseline differences between the internal and external validation sets, particularly in the distribution of imaging characteristics [Supplementary table 2]. We hypothesize that this may be related to the hospital characteristics. For example, in the external validation set, most patients were from the OPD, and the inpatient ward only had respiratory care and nursing home patients without a general ward. Thus, our model may not be directly applicable to foreign data or datasets from countries with different disease distributions, and further validation with more diverse databases is required. However, the higher AUC in the external validation suggests that overfitting is not an issue, demonstrating that our DLM maintains a consistent level of accuracy across different datasets with varying distributions.
6. Conclusions
Our study presents a novel clinical tool that leverages deep learning to detect anemia from chest images. This approach can facilitate quicker decision-making and additional interventions in clinical settings. With further research, we aim to refine the model, making it more continuous and closely aligned with real-time clinical conditions, thereby demonstrating its robustness and utility. Ultimately, this model has the potential to enhance patient care by enabling faster anemia detection and supporting better clinical outcomes.
Supplementary Materials
The following supporting information can be downloaded at the website of this paper posted on Preprints.org.
References
- Garcia-Casal, M.N.; et al. Diagnosing anemia: Challenges selecting methods, addressing underlying causes, and implementing actions at the public health level. Ann N Y Acad Sci 2023, 1524, 37–50. [Google Scholar] [CrossRef]
- Organization, W.H. Guideline on haemoglobin cutoffs to define anaemia in individuals and populations. n.d. Available online: https://www.who.int/publications/i/item/9789240088542.
- Patel, K.V. , Epidemiology of anemia in older adults. Semin Hematol 2008, 45, 210–7. [Google Scholar] [CrossRef]
- Turner, J.P.M.; Badireddy, M. Anemia. [Updated 2023 Aug 8]. In: StatPearls [Internet]. Treasure Island (FL): StatPearls Publishing; 2024 Jan-. Available online: https://www.ncbi.nlm.nih.gov/books/NBK499994/.
- Tyburski, E.A.; et al. Disposable platform provides visual and color-based point-of-care anemia self-testing. J Clin Invest 2014, 124, 4387–94. [Google Scholar] [CrossRef] [PubMed]
- Metivier, F.; et al. Pathophysiology of anaemia: focus on the heart and blood vessels. Nephrol Dial Transplant, 2000. 15, 14-8.
- Müller, R.; et al. Changes in the alpha adrenergic system and increase in blood pressure with recombinant human erythropoietin (rHuEpo) therapy for renal anemia. Clin Invest Med 1991, 14, 614–22. [Google Scholar] [PubMed]
- Quekel, L.G.; et al. Detection of lung cancer on the chest radiograph: a study on observer performance. Eur J Radiol 2001, 39, 111–6. [Google Scholar] [CrossRef] [PubMed]
- Abbasi, B.; et al. Evaluating anemia on non-contrast thoracic computed tomography. Sci Rep 2022, 12, 21380. [Google Scholar] [CrossRef]
- Kwon, J.-m.; et al. A deep learning algorithm to detect anaemia with ECGs: a retrospective, multicentre study. The Lancet Digital Health 2020, 2, e358–e367. [Google Scholar] [CrossRef]
- Çallı, E.; et al. Deep learning for chest X-ray analysis: A survey. Medical Image Analysis, 2021. 72: p. 102125.
- Liao, H.C.; et al. The deep learning algorithm estimates chest radiograph-based sex and age as independent risk factors for future cardiovascular outcomes. Digit Health, 2023. 9: p. 20552076231191055.
- Raghunath, S.; et al. Prediction of mortality from 12-lead electrocardiogram voltage data using a deep neural network. Nat Med 2020, 26, 886–891. [Google Scholar] [CrossRef]
- Galloway, C.D.; et al. Development and Validation of a Deep-Learning Model to Screen for Hyperkalemia From the Electrocardiogram. JAMA Cardiol 2019, 4, 428–436. [Google Scholar] [CrossRef]
- Krizhevsky, A. I. Sutskever, and G.E. Hinton, ImageNet classification with deep convolutional neural networks, in Proceedings of the 25th International Conference on Neural Information Processing Systems - Volume 1. 2012, Curran Associates Inc. p. 1097–1105 , numpages = 9.
- Hu, J.; Shen, L.; Sun, G. Squeeze-and-Excitation Networks. 2018, 7132–7141.
- Kamel, E.M.; et al. Radiological profile of anemia on unenhanced MDCT of the thorax. Eur Radiol 2008, 18, 1863-8. [Google Scholar] [CrossRef]
- Zopfs, D.; et al. Evaluating anemia using contrast-enhanced spectral detector CT of the chest in a large cohort of 522 patients. Eur Radiol 2021, 31, 4350–4357. [Google Scholar] [CrossRef]
- Iuga, A.I.; et al. Prediction of anemia on enhanced computed tomography of the thorax using virtual non-contrast reconstructions. Medicine (Baltimore) 2021, 100, e28014. [Google Scholar] [CrossRef]
- Oski, F.A.; et al. The role of the left-shifted or right-shifted oxygen-hemoglobin equilibrium curve. Ann Intern Med 1971, 74, 44–46. [Google Scholar] [CrossRef]
- Anand, I.S.; et al. Endothelium-derived relaxing factor is important in mediating the high output state in chronic severe anemia. J Am Coll Cardiol 1995, 25, 1402-7. [Google Scholar] [CrossRef]
- Beard, J.L.; Tobin, B.W.; Smith, S.M. Effects of iron repletion and correction of anemia on norepinephrine turnover and thyroid metabolism in iron deficiency. Proc Soc Exp Biol Med 1990, 193, 306–12. [Google Scholar] [CrossRef]
- Shah, S.A.; et al. The Prevalence of Anemia in Working Women. Cureus 2023, 15, e44104. [Google Scholar] [CrossRef]
- Azevedo, P.S.; et al. Cardiac Remodeling: Concepts, Clinical Impact, Pathophysiological Mechanisms and Pharmacologic Treatment. Arq Bras Cardiol 2016, 106, 62–69. [Google Scholar] [CrossRef]
- Stauffer, M.E.; Fan, T. Prevalence of anemia in chronic kidney disease in the United States. PLoS One 2014, 9, e84943. [Google Scholar] [CrossRef]
- Executive Summary. American Journal of Kidney Diseases 2006, 47, S11–S15. [CrossRef]
- Zhang, A.; et al. Prediction of anemia using facial images and deep learning technology in the emergency department. Front Public Health 2022, 10, 964385. [Google Scholar] [CrossRef]
- Dimauro, G.; et al. Detecting Clinical Signs of Anaemia From Digital Images of the Palpebral Conjunctiva. IEEE Access 2019, 7, 113488–113498. [Google Scholar] [CrossRef]
- Asare, J.W.; Appiahene, P.; Donkoh, E.T. Detection of anaemia using medical images: A comparative study of machine learning algorithms – A systematic literature review. Informatics in Medicine Unlocked 2023, 40, 101283. [Google Scholar] [CrossRef]
Figure 1.
Development, tuning, internal validation and external validation set generation. This diagram outlines the dataset creation and analysis strategy, designed to ensure a robust and reliable dataset for training, validating, and testing the network. Each patient’s data was assigned to one specific set—development, tuning, or validation—and once assigned, the data remained in that set to prevent any overlap or "cross-contamination." The external validation set was created using data exclusively from patients who visited the Jingzhou branch, while other patients contributed to different datasets. Further details on the flow and specific use of each dataset can be found in the Methods section.
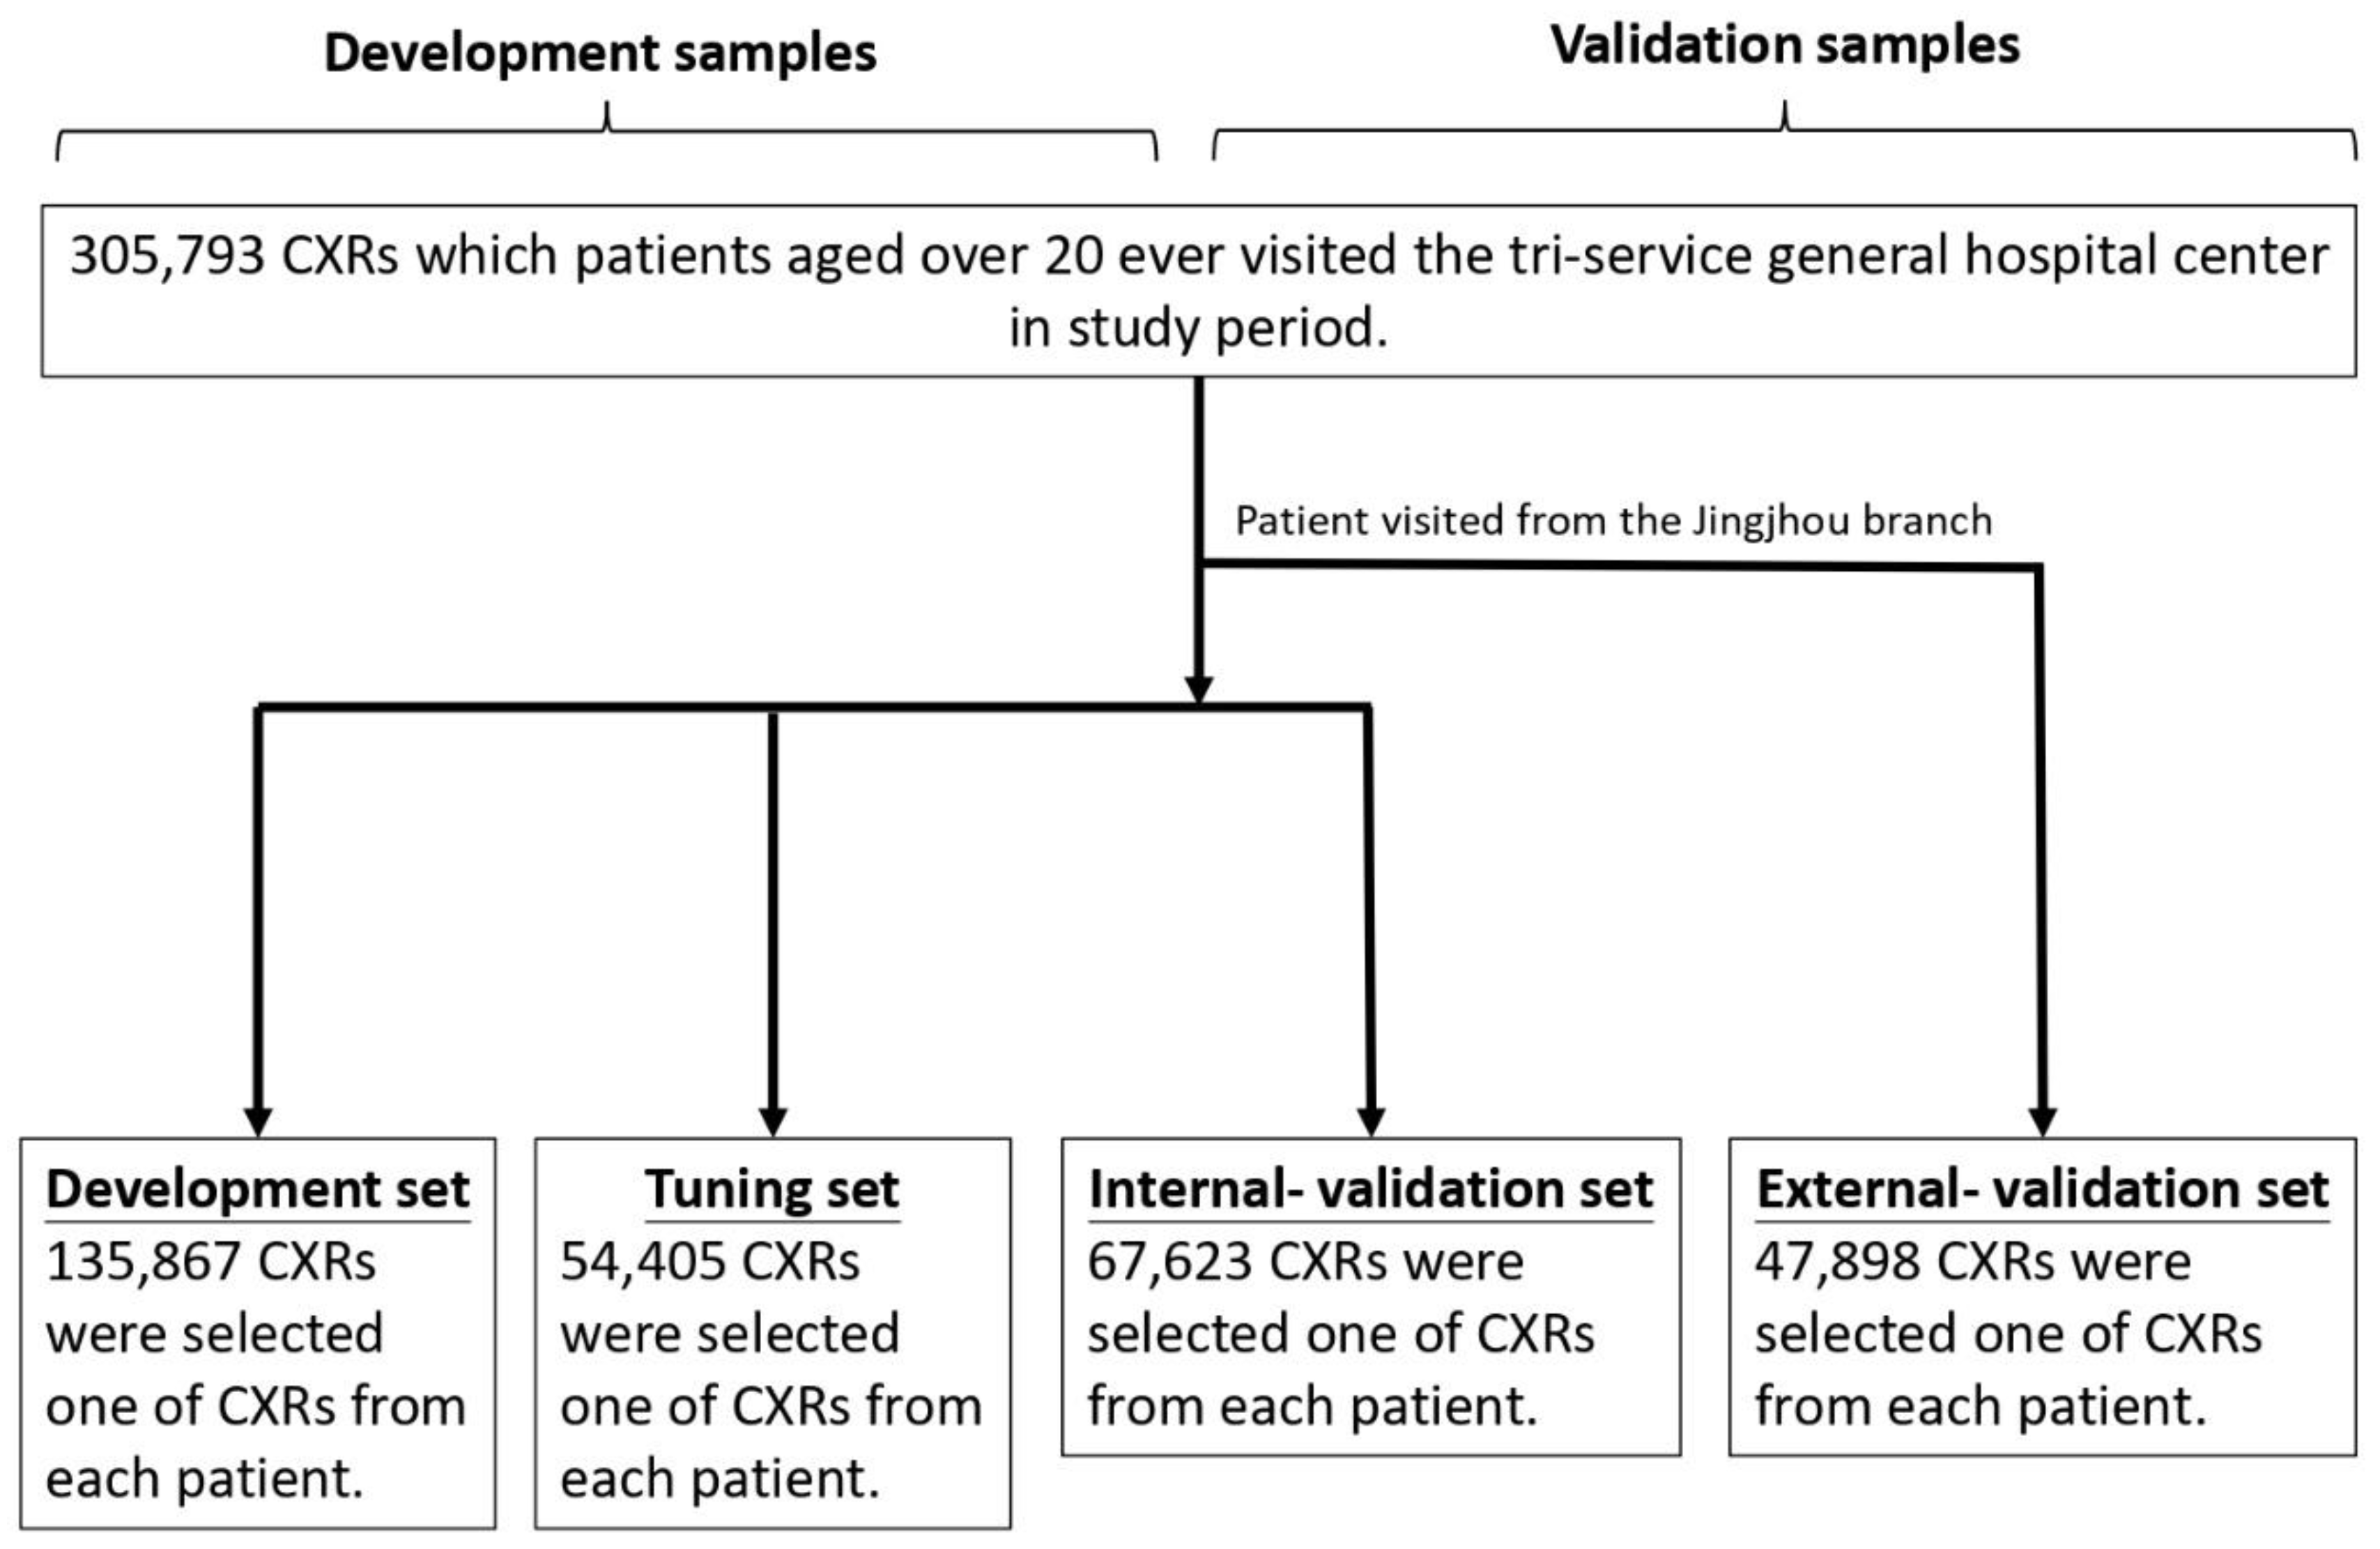
Figure 2.
Receiver Operating Characteristic (ROC) curves for distinguishing anemia. The Area Under the Curve (AUC) values are 0.845 for internal validation and 0.852 for external validation. Sensitivity, specificity, positive predictive value (PPV), and negative predictive value (NPV) are indicated for both sets. The figure illustrates the performance of the model in identifying an optimal cutoff point for anemia diagnosis across internal and external validation datasets.
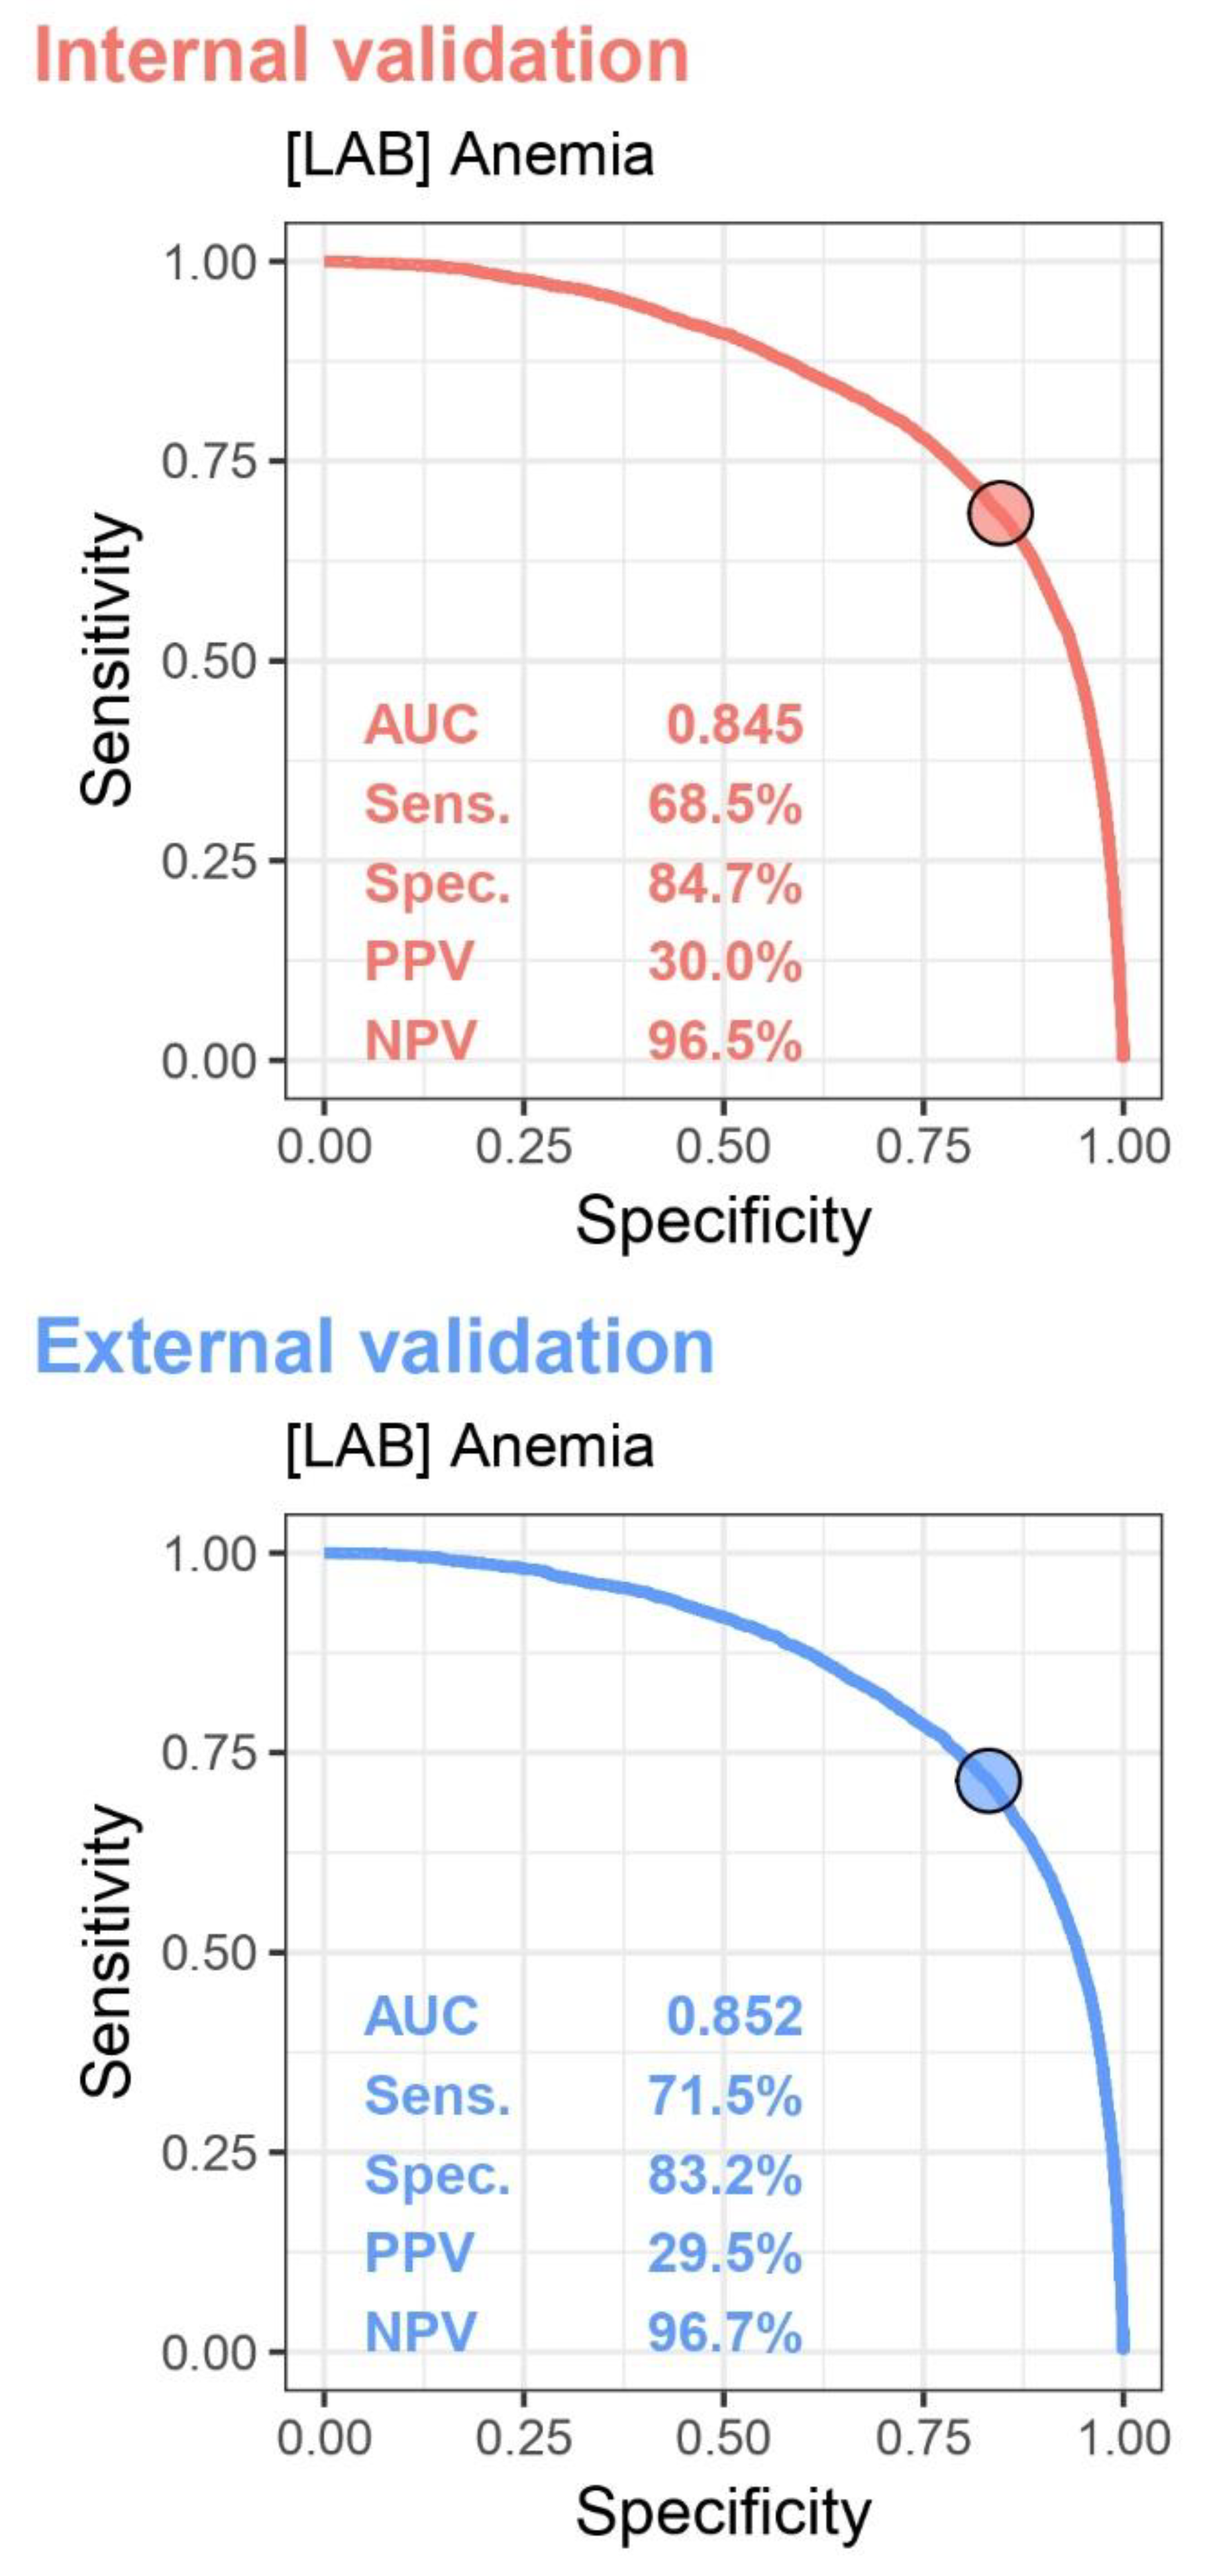
Figure 3.
AUC values for anemia detection across various subgroups in both internal and external validation sets. This figure illustrates the performance of the model in different patient populations, including variations by age, gender, diagnostic method (e.g., computed radiography, digital radiography), clinical settings (e.g., emergency department, inpatient, outpatient), with and without clinical underlying conditions, such as diabetes (DM), hypertension (HTN), hyperlipidemia (HLP), chronic kidney disease (CKD), coronary artery disease (CAD), heart failure (HF), and chronic obstructive pulmonary disease (COPD).
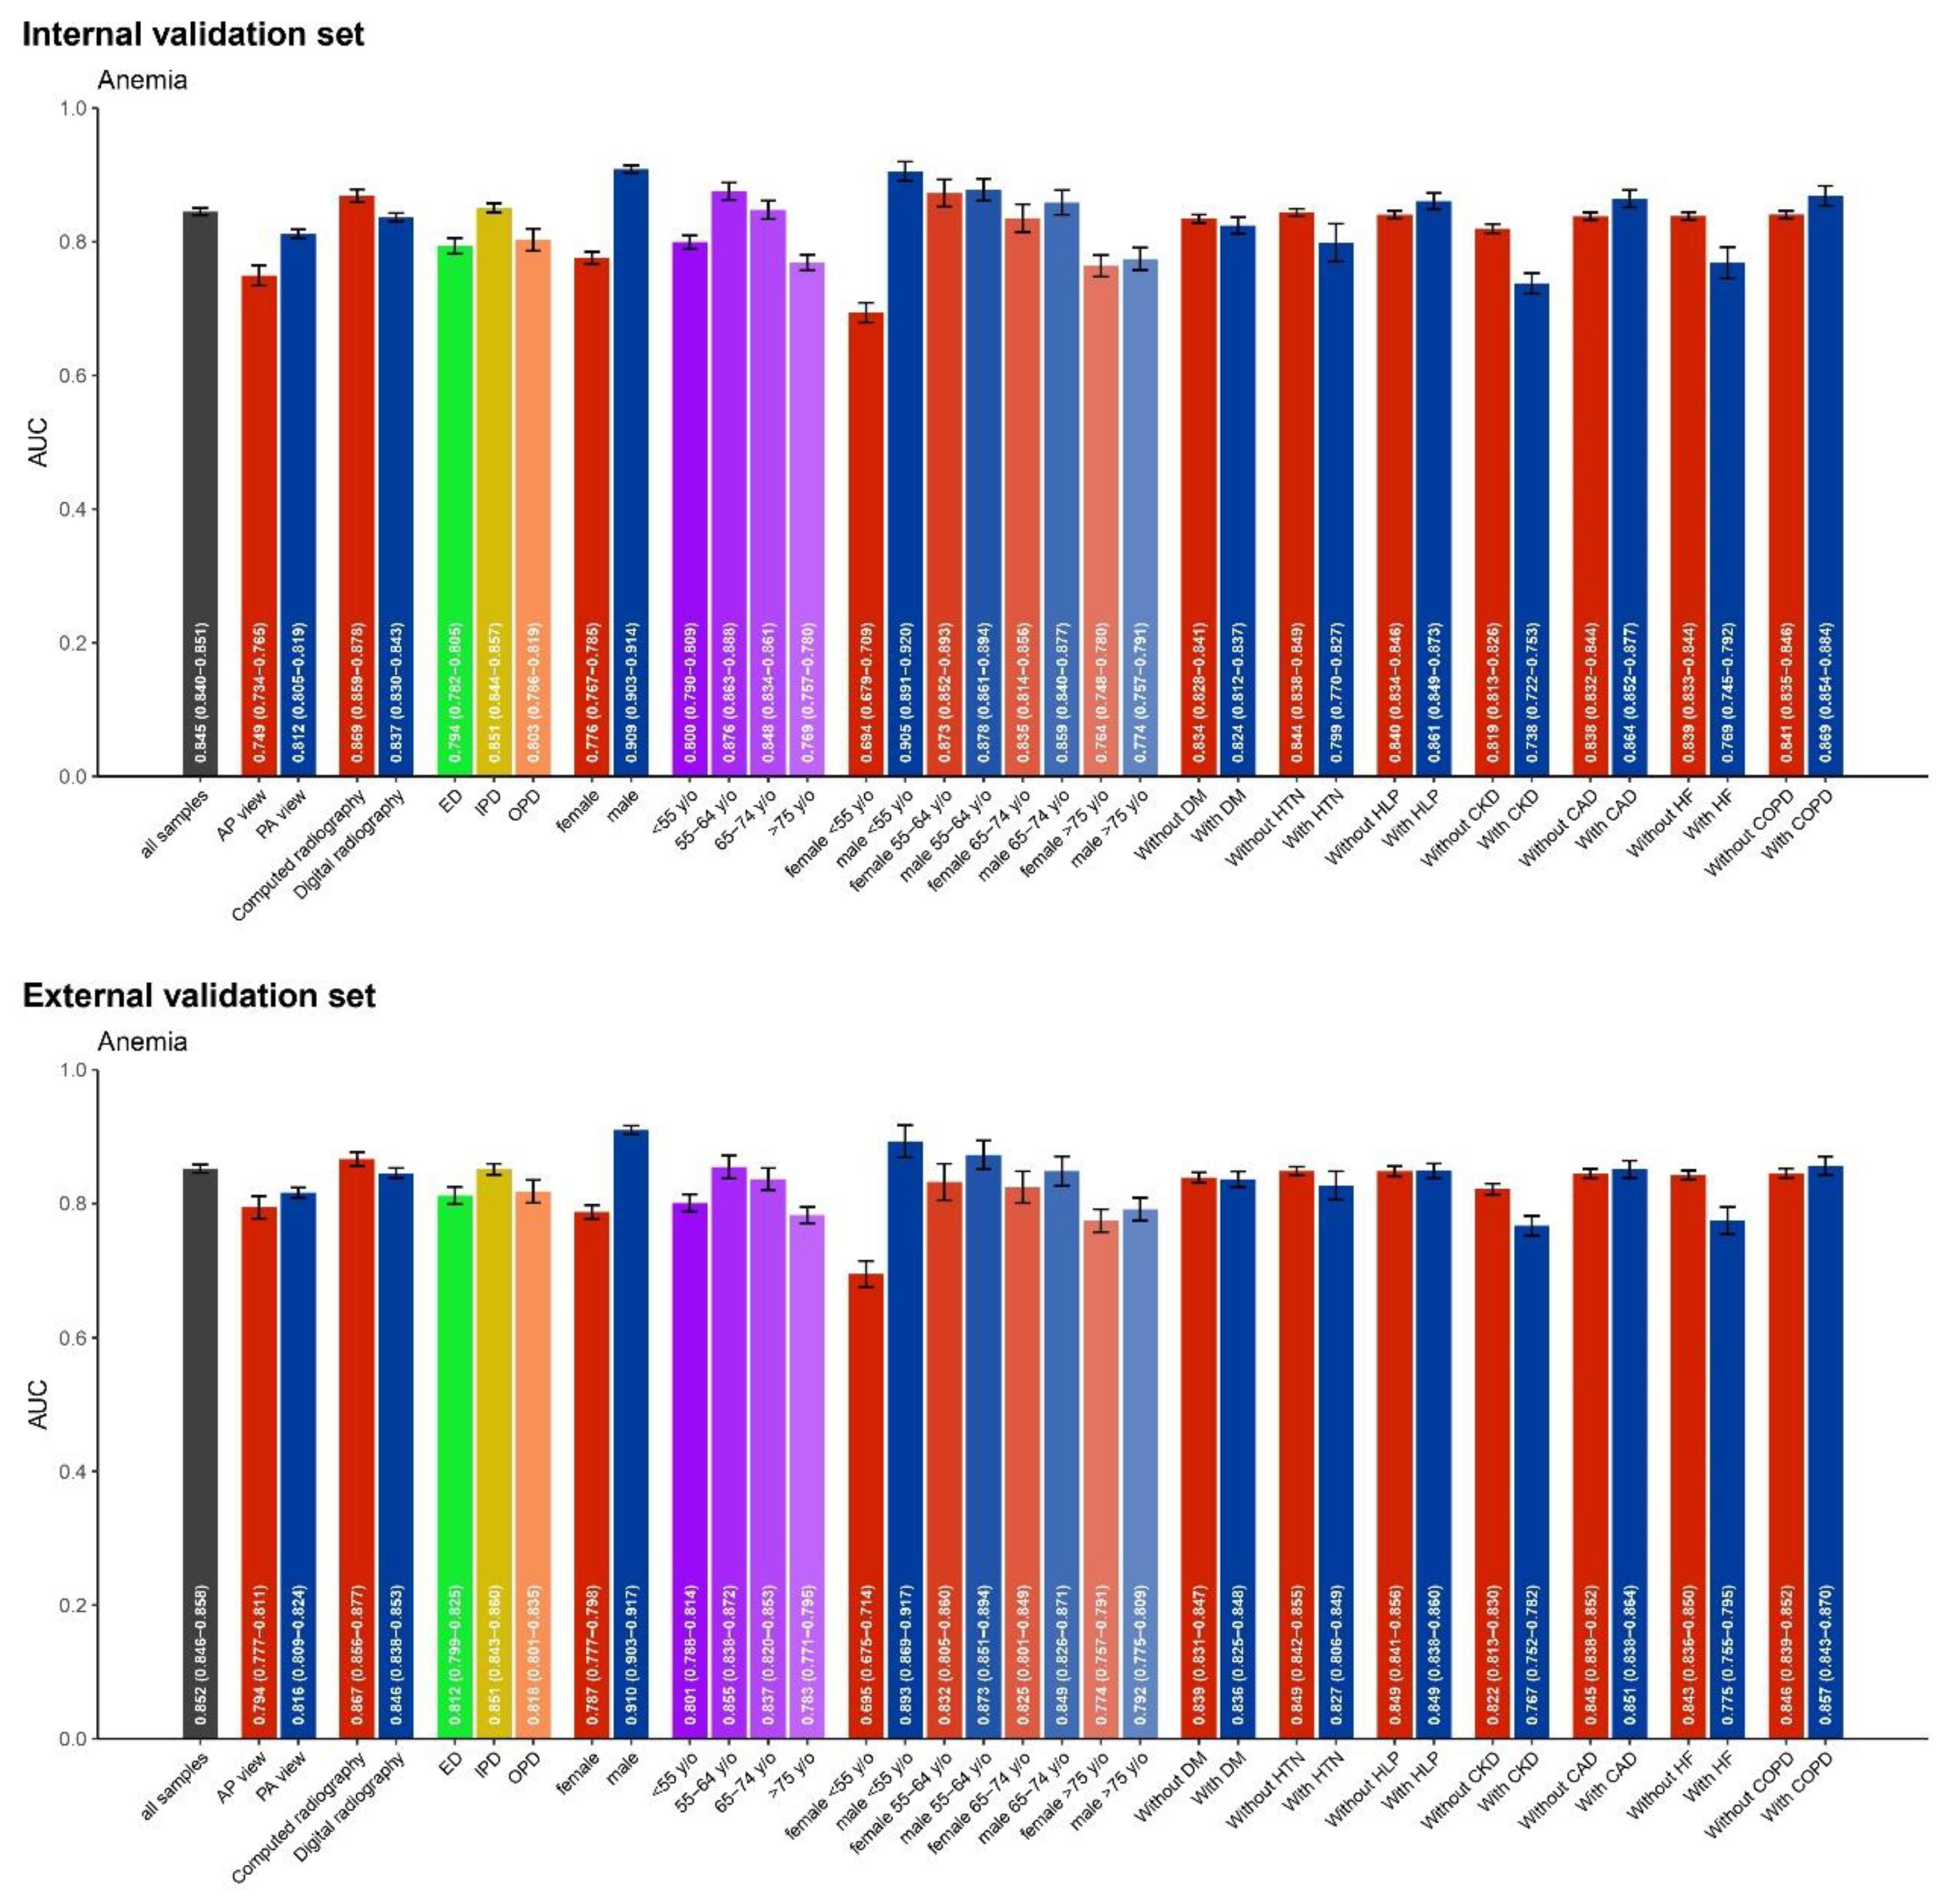
Figure 4.
The related important about patient characteristics and CXR features in predicting anemia, along with AUC comparisons between several models for internal and external validation sets. (A) The relative importance of various patient characteristics (e.g., history of chronic kidney disease, age, history of heart failure) and chest X-ray (CXR) features (e.g., PA or AP view, costophrenic angle blunting, nasogastric tube) are displayed. A combination of these factors was also evaluated for their impact on the prediction model. (B) Area Under the Curve (AUC) values with 95% confidence intervals (CI) are presented for different models in both the internal and external validation sets.
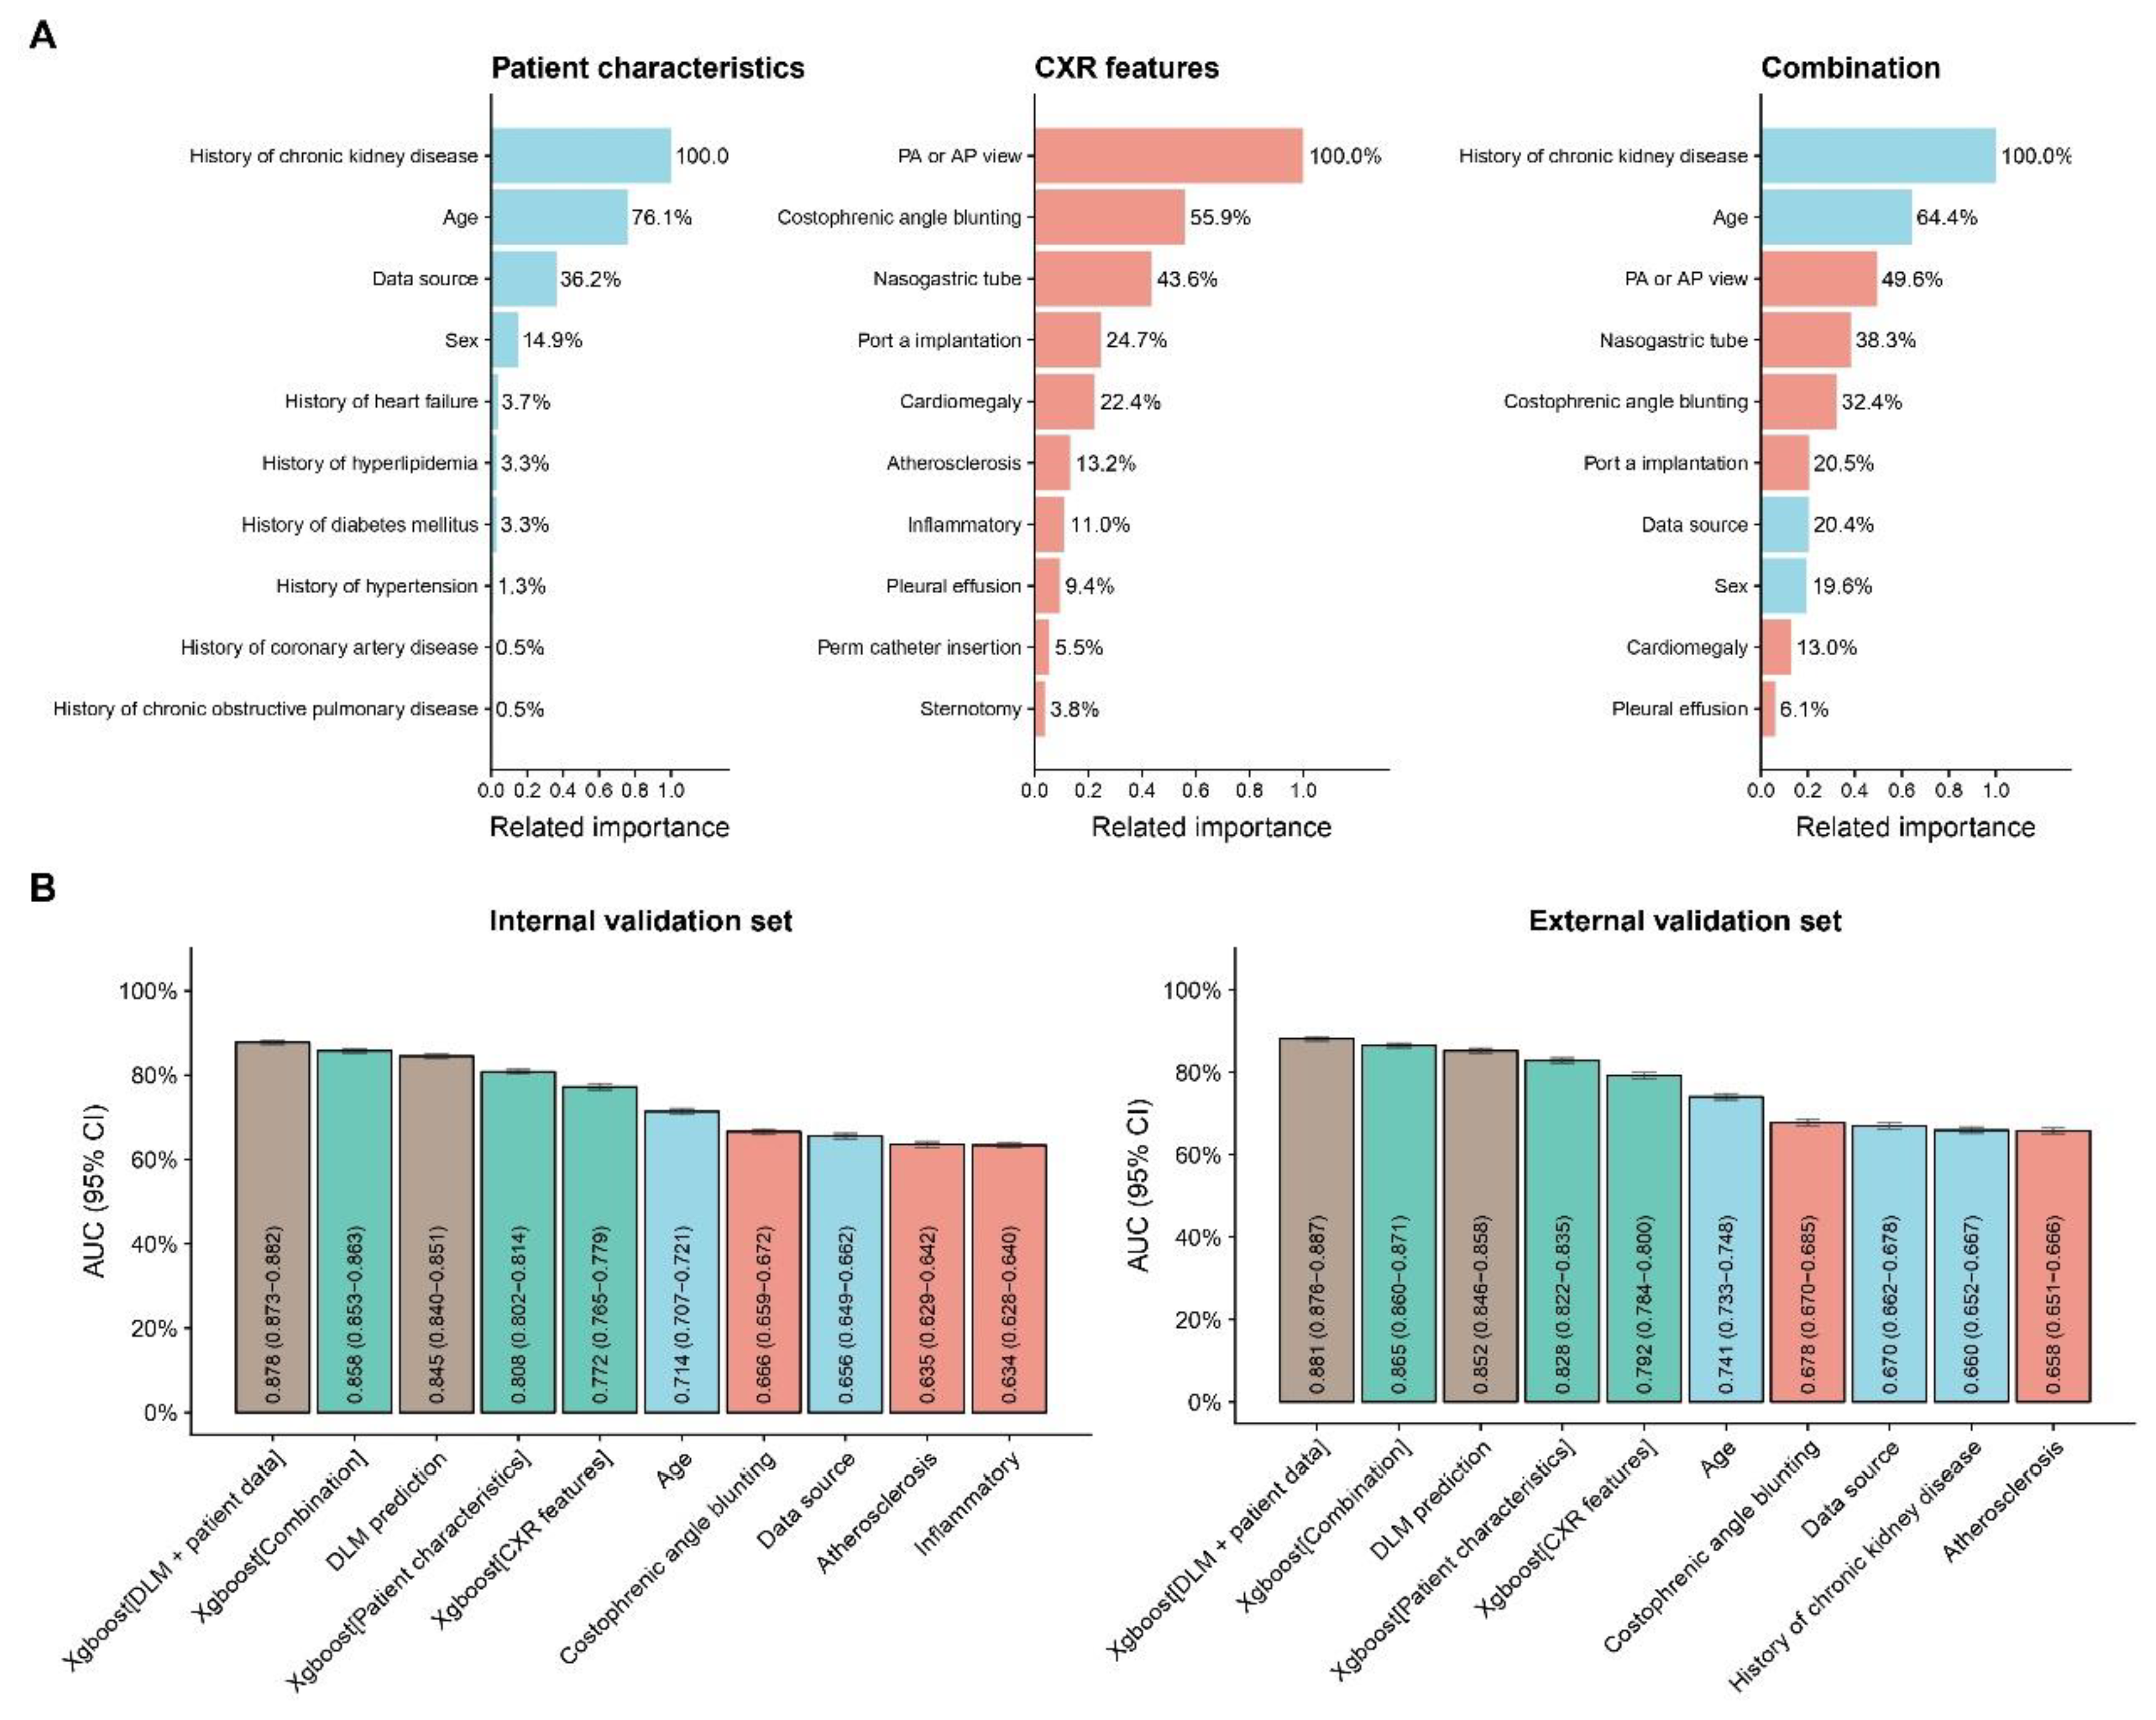

Table 1.
Patient characteristics and laboratory results in the development, tuning, internal validation and external validation sets.
Table 1.
Patient characteristics and laboratory results in the development, tuning, internal validation and external validation sets.
| Variable | Development set (n = 135,867) |
Tuning set (n = 54,405) |
Internal validation set (n = 67,623) |
External validation set (n = 47,898) |
p-value |
|---|---|---|---|---|---|
| Main variable | |||||
| Anemia | 12348(9.1%) | 4954(9.1%) | 5939(8.8%) | 4294(9.0%) | 0.112 |
| Basic Demographics | |||||
| Age | 51.4±19.1 | 51.5±19.1 | 50.9±18.9 | 52.2±20.8 | <0.001 |
| Gender(male) | 71323(52.5%) | 28493(52.4%) | 34806(51.5%) | 24436(51.0%) | <0.001 |
| PA view | 127729(94.0%) | 51195(94.1%) | 63805(94.4%) | 45255(94.5%) | <0.001 |
| Acquisition location | <0.001 | ||||
| Emergency Room | 41238(30.4%) | 16613(30.5%) | 20769(30.7%) | 17583(36.7%) | |
| Inpatient Department | 50797(37.4%) | 20526(37.7%) | 25233(37.3%) | 15173(31.7%) | |
| Outpatient Department | 43832(32.3%) | 17266(31.7%) | 21621(32.0%) | 15123(31.6%) | |
| Disease history | |||||
| Diabetes Mellitus | 13689(10.1%) | 5472(10.1%) | 6177(9.1%) | 7231(15.1%) | <0.001 |
| Hypertension | 2784(2.0%) | 1101(2.0%) | 1248(1.8%) | 1856(3.9%) | <0.001 |
| Hyperlipidemia | 17918(13.2%) | 7204(13.2%) | 7603(11.2%) | 10821(22.6%) | <0.001 |
| Chronic Kidney Disease | 8686(6.4%) | 3511(6.5%) | 4017(5.9%) | 4016(8.4%) | <0.001 |
| Heart failure | 3926(2.9%) | 1585(2.9%) | 1658(2.5%) | 2280(4.8%) | <0.001 |
| Coronary Artery Disease | 11188(8.2%) | 4518(8.3%) | 4980(7.4%) | 5993(12.5%) | <0.001 |
| Chronic Obstructive Pulmonary Disease | 8688(6.4%) | 3477(6.4%) | 3215(4.8%) | 5018(10.5%) | <0.001 |
Disclaimer/Publisher’s Note: The statements, opinions and data contained in all publications are solely those of the individual author(s) and contributor(s) and not of MDPI and/or the editor(s). MDPI and/or the editor(s) disclaim responsibility for any injury to people or property resulting from any ideas, methods, instructions or products referred to in the content. |
© 2024 by the authors. Licensee MDPI, Basel, Switzerland. This article is an open access article distributed under the terms and conditions of the Creative Commons Attribution (CC BY) license (http://creativecommons.org/licenses/by/4.0/).
Copyright: This open access article is published under a Creative Commons CC BY 4.0 license, which permit the free download, distribution, and reuse, provided that the author and preprint are cited in any reuse.


