
Submitted:
14 October 2024
Posted:
15 October 2024
You are already at the latest version
Abstract
Landmines, with more than 600 varieties and an estimated 110 million scattered across various regions worldwide, pose a significant threat globally. Heavily found landmines like TM-62M, MON-100, PDM-1, etc., in the recent Russia-Ukraine war, confirm the continued incorporation of metals in munitions. Traditional handheld metal detectors are still state-of-the-art for technical sub-surface demining procedures but are slow, unsafe, and expensive. Drone-based metal detection techniques can provide promising solutions for the rapid and effective detection of landmines; however, their reliability and accuracy remain a concern, as a single miss can cost a life. In our research, we present the results of a comprehensive comparative analysis of three distinct metal detectors: the EM61 Lite, a highly sensitive air-borne metal detector specially designed for UXO detection; the CTX 3030, a traditional handheld all-metal detector; and the ML 3S, a traditional handheld ferrous-only detector. We tested these detectors in a test field containing various inert landmines similar to those currently found in landmine-affected countries, including Ukraine, the US, Russia, and Afghanistan. Our findings highlight the possible challenges and limitations of employing current airborne systems in practical scenarios. Our results also showcase the need for advanced image processing techniques for analyzing airborne metal detector data.
Keywords:
Landmines
; Unexploded Ordnances (UXOs)
; unmanned aerial vehicle (UAV)
; drones
; metal detectors
; CTX 3030
; ML 3S
; EM61 Lite
1. Introduction
A landmine is any explosive substance positioned in a certain way, either on the ground or underground, that explodes whenever pressure is applied to it [1]. The explosive weapons can also be referred to by different names such as Unexploded Ordnances (UXOs), Explosive Remnants of War (ERW), or Improvised Explosive Devices (IEDs). UXOs or ERWs are any explosive devices such as bombs, shells, cluster munitions, rockets, etc. that were deployed during wars or conflicts, but haven’t exploded yet [2,3]. The term IED refers to unconventional explosives, usually homemade, used by criminals or terrorists [4]. The definition of these terms may vary from different organizations. However, the major purpose of these devices is to cause destruction i.e., they are designed to destroy any targets, such as vehicles, militants, civilians, buildings, etc. and ultimately cause significant loss [5]. UXOs and landmines pose a significant threat to human safety and the environment mostly in the post-conflict regions of the world. More than 110 million landmines are estimated to be scattered around more than 60 countries in the world [6]. These numbers are expected to increase because of ongoing wars between different countries around the globe. Countries like Egypt, Iran, Afghanistan, Angola, Iraq, China, etc., rank among the most affected countries in the world with millions of landmines and UXOs scattered in different regions throughout the country[7]. Around one-third of Ukraine is estimated to be contaminated by mines [8]. According to the Landmine Monitor 2023 report, 4710 casualties were reported in 2022, with 85 percent of civilians being affected by landmine explosions [6,9]. These numbers are increasing globally, every year. Apart from death and injuries, UXOs give rise to the major problem of land use. A land area contaminated with these mines remains unused for a number of years, affecting that area’s economy and infrastructure development. Detecting landmines in today’s world has been challenging because of the material used to enclose the explosives, which includes low metal, ferrous metal, non-ferrous metal, plastics, etc.
Although there are more than 600 different varieties of landmines discovered all around the world [1], metals, either in the form of casings for landmines or fragments mixed with explosives, are still the material choice among attackers to design landmines. TM-62M, MON-100, PDM-1, etc., were among the commonly found metallic landmines in Ukraine, in the recent ongoing Russia-Ukraine war [10]. Often during wars, the location of the buried mine and type of landmine used, are not properly documented or, even if they are, are not disclosed later due to several political or defense reasons. Thus, exact statistics related to the percentage of landmines with metal content scattered around the world since World War II is not exactly known. However, because of the durability of metals in different soil conditions, temperature control in harsh environments, ease of making, and cost of production, they are widely used to manufacture bullets, grenades, rockets, and munitions. Paradoxically, landmines in military cases are often made up of metallic casings, so they can be easily detected later, once the war ends.
Given the abundance of such landmines over the globe, one of the earliest and most reliable methods for demining subsurface mines, is through the use of traditional handheld Electromagnetic Induction (EMI)-based metal detectors. These handheld metal detectors are still considered state-of-the-art amoung most humanitarian demining organizations, for detecting landmines in different countries like Ukraine, Afghanistan, Egypt, etc. Although EMI-based metal detectors might be more susceptible to producing false alarms (i.e., false positives), in critical domains like landmines and explosives where a single miss can cost a life, misses (i.e., false negatives) are more fatal than false alarms. However, advanced signal processing techniques using signature classification [11] and Ground Penetration Radar (GPR)-integrated EMI detectors have proven to reduce false alarms [12], thereby increasing the accuracy of landmine detection. However, according to the United Nations report, with these traditional techniques, it is estimated to take another 1100 years to clear all active landmines in the world if no new landmines are laid [13]. In Vietnam alone, given the current rate of demining, statistics show that it would take another 300 years to clear 5.6 million hectares of Vietnamese land contaminated with over 350,000 tons of live bombs and mines [14,15]. Hence, there is a pressing need for fast and effective landmine detection techniques.
Drone-based landmine detection systems are gaining traction among demining organizations because of their ability to mount multiple sensors in a single drone and their ability to survey a large area in a short time, which is desperately needed. They are often cheaper and safer than traditional methods. Recently, airborne RGB, multispectral, hyperspectral, thermal [16,17,18], LiDAR, etc. systems have proven to be effective in detecting surface mines. However, for sub-surface buried mines, these technologies are ineffective at detecging such mines. In this case, metal detectors or GPRs are the only reliable choice. The new airborne remote sensing solutions are being proposed as silver bullets for landmine detection. However, these current systems have limitations, and their accuracy and reliability are questionable. The lack of standardized testing and evaluation protocols has hindered the improvement of already existing solutions and the practical use of such newly introduced systems [3]. Thus, proper evaluation, testing, and comparison of such systems before commercializing them for demining, is necessary.
One recently proposed airborne technology for landmine detection is the use of drone-based metal detector systems. Few companies manufacture air-borne metal detectors suitable for landmine detection. One such air-borne metal detector is Geonics Limited’s EM61 Lite. In recent surveys, to detect larger buried metal pipes, the EM61 Lite produced favorable results [19,20]. Based on our findings, the EM61 Lite has not been implemented for the detection of real-world UXO’s/landmines, even though the system has been used in other surveys to detect large metal pipes, etc. as mentioned previously. To the best of our knowledge, a comparative analysis of traditional versus air-borne metal detectors for landmine detection purposes has not been conducted.
Hence, we conducted an experiment in a controlled environment test field, seeding different types of landmines and UXOs currently found in real landmine-affected countries like Afghanistan, India, Ukraine, and Russia, for example. These landmines were seeded at different orientations and depths to mimic real-world scenarios. Our research aims to compare the detection capabilities of three distinctive types of metal detectors: a traditional handheld ferrous-only metal detector, a traditional handheld all-metal detector, and an air-borne EMI-based metal detector. We present comparative results for the detection of each buried object in the test field using all the aforementioned detectors. In addition, we present the results of EM61 Lite implementing the usual processing technique for analyzing air-borne metal detector data, underscoring the necessity for more advanced processing methods. Moreover, we discuss in detail, the time required for the detection and landmines/UXO’s and the various procedures employed.
The primary objective of our experiment and research is to figure out whether newly introduced airborne metal detection methods can be an alternative approach to more reliable traditional handheld metal detectors for humanitarian demining. Furthermore, we highlight the advantages, challenges, and limitations of employing such air-borne systems in the real world. Our findings not only contribute to providing valuable insights into the field of demining but also underscore the potential of unmanned aerial vehicle (UAV-based) systems to significantly enhance landmine detection efficiency, speed, and safety. By presenting this research, we aim to advance demining technologies and support efforts to make humanitarian demining safer and faster worldwide.
2. Materials and Methods
In this section, we provide a detailed overview of the organization of landmines at our test site, the sensors used, their working principles, the process of data acquisition, and the software and processing techniques used to analyze the data.
2.1. Data Collection Site
Due to several defense and security concerns, landmine data is not publicly released, creating a significant gap in the ability of the humanitarian demining research community to explore effective detection techniques. The Demining Research Community, a US-based nonprofit humanitarian demining organization, recently partnered with the Global Consortium for Explosive Hazard Mitigation at Oklahoma State University (OSU) to address this issue. In collaboration with OSU’s Center for Fire and Explosives, Forensic Investigation, Training, and Research (CENFEX), they seeded a test field with 143 diverse items, including landmines, submunitions, UXO, and IEDs in 2023. These items include actual inert mines, their casings, and UXOs which are found nowadays in different countries like Russia, Afghanistan, Pakistan, Ukraine, India, the United States, and Britain. The site is near Stillwater, Oklahoma (Latitude: 36°21’11.08"N Longitude: 96°51’25.28"W).
Recently, along with metallic landmines, plastic landmines are also popular in many parts of the world. They can be found on the surface, sub-surface, or sometimes underwater. To create a more realistic scenario at the test site, field items consisted of different types of materials like plastic, low metals, ferrous, and non-ferrous metals. These items were mostly buried ranging from the surface to sub-surface depths of up to 20 centimeters. A detailed description of the types of buried landmines, their sizes, depth of burial, metallic or nonmetallic, country of origin, etc., along with the type of soil they were buried in, and their organization in each survey line is discussed in [21]. Figure 1 illustrates the organization of each object at the site in condensed form. The whole survey area is divided into six survey lines labeled A through F, from north to south, with 25 slots in each survey line. For example, the object located in position A1 is located to the east while while the object in position A25 is is to the west.
A team of researchers from the Rochester Institute of Technology (RIT), with two drone pilots, visited the site and collected the data from June 10-13, 2024. The team collected a comprehensive data set with different modalities, including an air-borne metal detection system, Multispectral, Hyperspectral, SAR, RGB, Thermal, and LiDAR, with the aim to create a benchmark dataset for the wider demining research community. The multi-modal data set can provide new research and possibilities for multi-sensor fusion. The research presented in this paper presents the findings findings related to the data collected using the metal detector designed for drone-based applications. At the same time, traditional hand-held metal detector data (using two types of detectors) was collected by a retired Navy explosive ordnance disposal officer. Thus, findings in this paper are the results of data collected from all three distinctive metal detectors under a combined collaboration of both research teams.
2.2. Instrumentation
As previously mentioned, we used three different types of metal detectors; one air borne metal detector and two traditional reliable handheld metal detectors. Among these, the handheld all-metal detector has been widely used as an industry standard for commercial demining purposes. Thus, in our experiment, results from this device are considered to be the most reliable, as is often the case, in real world applications. In this section, we discuss these instruments and their principle of operation.
2.2.1. EM61 Lite
The EM61Lite is a portable and lightweight Time-Domain Electromagnetic (TDEM) induction system specifically designed for the detection of UXO’s, landmines, geophysical surveys, and archaeological investigations [22]. It is manufactured by Geonics Limited and is an air-borne version of Geonics’ ground-based EM61-MK2 metal detector, which is widely used for geophysical surveys and subsurface investigations. Figure 2 illustrates the EM61 Lite in RIT’s drone lab, showing the system setup with a transmitter/receiver coil enclosed in a plastic casing at the base, a noise compensation coil in parallel just above transmitter/receiver coil, and a plastic-enclosed rectangular electronic console.
The EM61 Lite comprises a coincident transmitter/receiver coil with dimensions of 1 × 0.5 meters, which operates by sending pulses of current at 150 Hz [22]. The transmitter’s primary magnetic field induces eddy currents in metallic targets, creating a secondary magnetic field which, in turn, creates a signal that is detected by the receiver coil. The energized current in the soil decays away much faster than it would in any metal regardless of type/size [23]. Then, appropriate time intervals that are far enough from the primary field which might create any interference to the receiving signal are selected. These time intervals are chosen carefully such that any response from the soil diminishes to zero before reaching the sensor. These secondary field decays are measured across four time gates geometrically spaced in time and centered at 256, 406, 706, and 1306 microseconds [24]. The system records responses from all four available time gates in millivolts. These responses are then stored as channel 1, channel 2, channel 3, and channel 4, respectively, for the 256, 406, 706, and 1306 microseconds time gates.
This multi-gate measurement approach provides a detailed analysis of decay characteristics effectively differentiating metallic targets from soil. The objects located at shallow depths show a rapid decay of eddy currents. Since the initial response of the secondary magnetic field from the targets is captured by channel 1, it is susceptible to locating small surface-level objects. Channel 2 captures the secondary field a little later than channel 1. It is useful in detecting a greater variety of object sizes and depths because it maintains a balance between sensitivity for shallow and relatively deep targets. For deeper and medium to large metallic objects, channel 3 is useful, which captures the decay signal at an intermediate time compared to channels 1 and 2. To detect large and deeply buried metallic objects, channel 4 is the most appropriate one because it records the secondary magnetic field much later than the other channels. Since, the signal from smaller or shallow objects is often decayed to negligible response, channel 4 allows clear identification of large and deep objects. Hence, channels 1 and 2 show stronger response for small and shallow objects, but for large and deep objects, a stronger response is recorded by channels 3 and 4. Comprehensive information from multiple channels increases the probability of accurately identifying the targets and helps to distinguish between their various sizes and depths. For example, a target is likely a small and shallow metallic object if the sensor records a stronger response in channel 1 but weaker response in channel 4.
2.2.2. The ML-3S (Ferrous-only Metal Detector)
The Subsurface ML-3S handheld detector is a lightweight and portable magnetic locator manufactured by Subsurface Instruments, Inc. Figure 3 illustrates the ML-3S used during our field tests. This device contains an inbuilt sensitive magnetometer and works on the principle of magnetic induction [25]. The earth itself functions as a massive magnet and has a magnetic field. Any ferrous metals that are buried underground disturb the earth’s natural magnetic field. The ML-3 magnetic locator, when moved over the ground, can detect these changes [26]. These detected changes are then converted into audible signals to alert the user. The device can detect objects at depths up to 8 feet. The gain settings of the device can be adjusted to increase or decrease the sensitivity of the device which helps to distinguish between large and small metal objects [27]. The polarity and the strength of the detected anomalies can also be visualized in a small display provided (though not used in our case). Because of these features and portable size, these types of detectors are mostly used in the detection of UXOs and landmines that contain ferrous metal objects. Two different versions of ML-3 are available based on the length of the device: ML-3S, a short version with a length of 40 inches while the ML-3L, a long version with a length of 55 inches. For our experiment, we used the ML-3S.
2.2.3. The CTX 3030 (All-Metal Detector)
The CTX 3030 is manufactured by Minelab Electronics Pty Ltd. It is a handheld, high-performance all-metal detector that can detect various types of metallic objects including non-ferrous metals like copper, gold, aluminum, etc. Figure 3 illustrates the CTX 3030 used during our field tests. Like the EM61 Lite, the working principle of the CTX 3030 is also electromagnetic induction. It can identify single or multiple targets simultaneously. Additionally, it uses full-band spectrum technology, which allows simultaneous transmission and reception of multiple frequencies [28]. This feature allows the detector to analyze a large range of frequencies to improve the detection of metals at different depths. This multi-frequency detection technique, and the device’s high sensitivity, enable it to distinguish between ferrous (e.g., iron) and non-ferrous objects (e.g., copper) and make it a better choice for landmine detection in the real world. This is significant since the latest landmines and UXOs come with low metal content and non-ferrous metal components in order to deceive metal detectors.
The advanced target trace discrimination technique used by these detectors helps to locate UXOs and landmines more accurately [28], even in cluttered environments and all ground conditions. The detector, thus, reduces the possibility of false positives (i.e., false alarms) from unwanted metal objects like nails or bottle caps by processing the received signals from different types of metals, which makes it suitable for real-world landmine detection cases. Moreover, their high sensitivity allows the detection of even smaller metal submunitions like PFM-1 mines that contain very little metal with large plastic casings. In general, the results produced by this detector are more precise and reliable than other detectors used in our experiment. Like the ML-3S, it is also lightweight and compact, facilitating ease of use and transportation. These features make this device a better choice for demining purposes in a real-world environment.
2.3. Data Acquisition
The different landmine-seeded lines in the original field were organized in an order from north to south and labeled A, B, C, D, E, and F. The objects in each line were then labeled A1 to A25, with A1 starting in the east and A25 ending in the west. We have used the same names to represent corresponding objects in each line throughout the paper. We also collected the data from each metal detector in the same order starting from A1 to A25, then moving to B, all the way to F. Data from the ML-3S was collected on June 11th, 2024 while data from the CTX 3030 and EM61 Lite were collected on June 12th, 2024. Like traditional techniques for reporting results from handheld metal detectors, the locations where those handheld metal detectors showed a response were noted and marked. Each metal detector was operated separately at different times and dates. After the entire survey area was examined by all three detectors, all the marked locations were excavated, and the results were noted for individual detectors as detected or undetected based on the objects found or not found on those lines. The detected locations were noted as 1 while undetected locations were noted as 0.
In the case of the EM61 Lite, the system was originally designed to be mounted on a drone (e.g., DJI Matrice 600 Pro). Some companies have built their own mounting system for the EM61 console; however, the device was on loan to the RIT team by the Geonics company (the manufacturing company of EM61 Lite) for a couple of days while a proper mounting system was not made available on the date of data collection. Since the device, in its current state, was too heavy for the drone, with the addition of an absent mounting system, our drone pilot could not mount it on our drone. In such a scenario, to collect some useful data, we mimicked the system setup as it would be in a drone-based system. We carried the device above our shoulders, maintaining a constant height of cm above the ground, as shown in Figure 4.
A common practice before initiating the survey is applying the nulling operation to the device. For this, we took the device to a distant place away from the survey field, with no potential interference from metallic objects. Then, nulling was performed to create a baseline offset for the experiment. After that, the device was brought back and swept across each line (i.e., lines A to F) one at a time. To maintain better detection and visualize real-time data, like in a drone-mounted situation, we did not stop while walking and kept the sampling rate at two samples/second. The EM61 Lite was provided with the data logger system: a Mesa3 tablet, which could be operated wired via RS232 mode or wirelessly via Bluetooth mode. The Bluetooth capability of the device is experimentally verified to be about one hundred meters by technical engineers from Geonics. Since we were physically walking the device, we used the RS232 mode to connect the EM61 console with the Mesa3 tablet. The responses recorded from multiple time gates during the survey could be simultaneously visualized in the form of line plots, using the data logging software Em61win pre-installed in the Mesa3 tablet provided by Geonics. Theoretically, any metallic object would produce a response greater than the background (baseline offset) in the form of a peak. The locations of those peaks would represent a target. Different types of objects or targets would produce larger or smaller peaks depending upon the type of metal, size of metal content, and depth of burial of that metal. In our experiment, we had various metallic targets buried at different depth with different metal content ranging from non-ferrous metal, low metal, all the way to high metallic content. We simultaneously marked the regions in the field where peak responses were obtained. Those markings were later verified as objects detected or undetected after excavation. Figure 5 illustrates all the excavated objects (i.e., landmines, munitions, UXO’s, background clutter or confusers, etc) in the test field after the data was collected from all the metal detectors.
2.4. Data Processing
2.4.1. Processing in DAT61MK2
The data from EM61 Lite is collected in the form of responses in millivolts (mV) as scalar values associated with each sample point. During data collection, a metal detector signal exhibits a peak when a metal object is detected. The metallic object causes a sudden rise in signal amplitude when the detector passes over it and reaches a maximum at the point closest to the object. The signal decreases symmetrically when the detector moves away from the object. The recorded responses from the EM61 Lite detector are usually saved in .R61 extension file format. These files cannot be directly used to process the data and need to be converted into .M61 format. The processing software DAT61MK2 provided by Geonics was used to convert .R61 files to .M61 file extensions. The converted .M61 files contained the responses (in mV) from all four channels of the EM61 Lite for each survey line. In the .M61 extension, the information (scalar values in mV) from four different channels corresponding to 256, 406, 706, and 1306 microseconds time gates, as previously mentioned, were stored in four different columns named Ch1, Ch2, Ch3, and Ch4.
2.4.2. Interpolation of GPS Coordinates and UTM Conversion
The above mentioned.M61 files were then read using a Python library (pandas) for further processing. The line plots of all survey lines were drawn to visualize the peak responses. Interactive stretching of those line plots was performed to note the corresponding sample index for the peak responses. Since a Global Positioning System (GPS)-integrated module was not available during the survey, we took the initial measurements without location coordinates. Our data collection was performed in a controlled environment with no chance of false alarms. That is, we knew where the objects were and knew there were no surrounding false alarms, through some of the objects themselves were intended to be non-UXO items. Additionally, the location of all the objects and control points in the field were already noted. The GPS locations of all the objects were also available through other modalities tested in the field on the same day (e.g., a drone-based magnetometer survey performed by another team). Using the GPS information and marked object locations from our survey, we assigned the corresponding sample indices to the GPS coordinates of those objects, correlating them with the peak responses. Then, those GPS locations were interpolated to provide location information to every sample index of each survey line. Finally, to further process the data, i.e., to create a spatial map of the whole survey area, all the GPS values were converted into corresponding Universal Transverse Mercator (UTM) easting and northing values. For converting GPS values into UTM values, we used the time zone of our site: Oklahoma Zone 14N. This process was repeated for all survey lines.
2.4.3. Heat Map of the Survey Area
The collected data from the whole survey area (from the airborne system) is usually processed after the end of the survey and displayed as a 2D heat map of the survey area highlighting targets and background as anomalies. To mimic the way data would be gathered if our drone was used, we concatenated the data processed in Section 2.4.2 from all the survey lines in a single Excel file. The collected sample points were further interpolated to create a spatial map of the whole survey area. For this, we used the kriging interpolation technique, which is widely used to interpret irregularly spaced sample points in data. This technique accounts for spatial correlations to estimate unknown values by considering both the distance and degree of variation between known data points making it suitable for applications like landmine detection. After a 2D spatial map of the scene was created, a histogram of that image was visualized. To distinguish metallic objects from the background, a threshold was put over the histogram obtained from that image. Finally, a suitable false color mapping was applied to produce a heat map locating anomalies or targets from the interpolated spatial map. For spatially interpolating and drawing colorful heat maps, we used the Golden Surfer software.
2.4.4. Logarithmic Scaling and Normalization Technique
Normally, thresholding is the most common method for detecting metallic anomalies; however, for detecting landmines and UXOs with varying metallic content and size, like in our experiment, the threshold technique alone wasn’t sufficient enough to locate the expected number of targets. Different threshold values would produce different numbers of anomalies in the heatmap. The EM61 Lite produced responses as high as 7000-8000 mV in lines A, B, and F and as low as 100-500 mV in line D. So we tried implementing logarithmic scaling to highlight more anomalies with small metallic content but that technique also didn’t help much because even after logarithmic scaling, a threshold was necessary and subjective (i.e., how many misses or false alarms we wanted to consider). So, to showcase more anomalies, we came up with the idea of individually processing each of the survey lines. We tried the normalization technique to have smaller anomalies stand out. For this, we separately normalized sample values of each survey line on a scale of 0 to 1. We then concatenated these normalized sample points from all the survey lines into a single Excel file. Using kriging interpolation and color mapping, we created a 2D spatial map of the survey area. Finally, implementing a threshold on a histogram obtained from that 2D spatial map, a 2D heat map of the scene highlighting anomalies was created.
2.4.5. 3D Analysis of Peaks
Sometimes the smaller anomalies that are difficult to visualize in 2D plots can be located by careful inspections in 3D plots of the data. Given this, we also visualized our data (both original and normalized from channel 1) in 3D plots.
3. Results
The EM61 Lite produced impressive results in detecting the mines in terms of responses (in mV) obtained from the four different channels. The responses for each survey line are separately shown in Figure 6 as line plots. Each of the peaks either smaller or larger, represents a target. Larger and broader peaks resemble bigger metallic objects while smaller and narrow peaks resemble smaller metallic objects. The width and amplitude of these signals also depend on depth of burial and the percentage of metal content present in the targets. The detector proved to be highly sensitive in terms of detecting mines with metallic contents. For instance, we had 12 distinctive mines with different metallic strengths in line A of the field. The device showed 11 unique peak responses corresponding to each object. However, the EM61 Lite could not detect the object located at position A23, a large PVC pipe with a small ferrous handle buried 8 cm below ground. In line D, we mostly had PFM-1 landmines. The casings of these landmines are usually made of plastic, with very low metal content. The EM61 Lite detector was able to detect these landmines as well, producing a good response, although small, as shown in Figure 6. This correlation of peak responses with the corresponding landmines was done to ensure the device was sensitive enough to produce reasonable responses, even for landmines with very low metal content.
Of the 150 positions (i.e., the grid for mine placement) in the seeded test field, 25 positions were left empty or contained a previously dug (and filled) hole, which was left empty. Out of the 125 objects, 119 objects contained metal in some form while 6 were completely non-metal. Among the 119 metallic objects, 94 objects contained ferrous metals while 25 contained non-ferrous metals. Using the handheld metal detectors took a long time, approximately 3 hours each, to survey the entire field (apart from excavation), while using the EM61 Lite only took 17 minutes. The detection accuracy of each of the detectors was calculated based on the number of successfully detected landmines out of the total number of landmines. The statistics related to the time taken and the detection accuracy of each of the detectors are listed in Table 1. Detailed information on each of the objects, either detected or undetected by all three detectors, is provided in detail in Table A1 in Appendix A. The temperature on both days of the data collection was around 92F to 95F, with the humidity 55%. The EM61 showed good results in producing responses from targets, with transmitter/receiver coils 30-100 cm above ground. The results discussed in this paper were obtained by maintaining a constant height of transmitter/receiver coils 30 cm above ground while collecting the data. The air-borne systems provide flexibility in terms of operational altitude, which is important in case of uneven terrain or vegetation in the survey area.
When deploying a drone, in the real world, over a large area, the entire field is surveyed at once, though in a systematic manner. Thus, survey lines are not typically processed separately. Instead, a usual practice is to create a 2D heat map of the entire surveyed area visualizing the landmines as anomalies. Knowing this, we generated a heat map covering the entire survey region. Figure 7 shows the locations of anomalies or targets detected in the form of a heat map (red and yellow spots) of the test site created using the data received from channel 1 of the EM61 Lite metal detector.
Since data from the other three channels of the EM61 Lite gave rise to similar heat maps the other three heat maps are not shown here for brevity. Not surprisingly, many of targets that were detected when the survey lines were processed separately, did not stand out in the 2D heat map. The reason behind this is the huge difference in response for large versus smaller targets. Some of the larger targets even produced smaller responses because of their larger depth of burial. In the real world, there is a high possibility of larger and smaller metallic landmines being found in the same location. In such cases, larger differences in response from larger and smaller landmines can result in missed detection of smaller landmines.
The technique for detection of targets as anomalies in airborne systems usually involves applying a filtering and threshold technique. The threshold is subjective in these cases and depends upon how many misses or false alarms one can allow. If a higher threshold is set for the responses, there is a high probability of targets being missed. Conversely, if a lower threshold is set, the entire field may appear contaminated, creating difficulty in precisely pinpointing the location of targets (i.e., perhaps fewer missed but many more false alarms). The two cases of unreliable heatmaps, resulting from a large and a small threshold, in our dataset, are shown in Figure 8.
Although our data collection was conducted in a controlled environment with an intentionally low probability of false alarms, the threshold technique was not sufficient enough to have all the anomalies stand out because of the large differences in response produced by various landmines. These results indicated the urgent need for alternative image processing image processing and/or machine learning techniques for the effective detection of landmines, which is the subject of our future work.
To have the smaller anomalies stand out more, alternative approaches to processing need to be employed. Since we already had the precise locations of the buried landmines and correlated the responses with the corresponding objects, we tried to make the anomalies more apparent in the heat map experimenting with a variety of methodologies. First, we implemented logarithmic scaling of the collected data to create a heat map. Doing so did not make the anomalies stand out any more than they already were. This was followed by another approach. We normalized the data in each survey line, concatenated it, and then repeated the whole process of interpolation to create the heat map. The results of this approach are shown in Figure 9. This technique presented some significant changes in the heat map accentuating even the anomalies in line D with very low metal content.
Different data interpretation techniques seemed necessary to analyze such airborne data. Another methodology we employed was analyzing 3D plots of the data. This approach can sometimes help locate smaller peaks by careful visual inspection. Figure 10 illustrates 3D plots of data from channel 1 of the EM61 Lite, both original and normalized, which provides a comprehensive analysis of response peaks to point out anomalies. The 3D plot of original data wasn’t very helpful in locating anomalies in line D whereas the 3D plot of normalized data was helpful in locating smaller targets in line D. Locating the GPS coordinates of even smaller domes or peaks in 3D plots can help identify the exact location of smaller anomalies.
4. Discussion
The major objective of this research was to evaluate whether drone-based metal detection approaches could be a reliable method for the detection of landmines and UXOs over traditional methods based on real-world data. Additionally, we explored the technical as well as non-technical difficulties that would arise while implementing such systems in the real world. To maintain unbiased results, we tested all three detectors in the same test field seeded with various landmines at different depths and orientations. Our findings showcased interesting findings and insights.
Some of the mines detected by the CTX handheld detectors remain undetected by the EM61 Lite and vice versa, but overall, both systems detected an equal number of landmines. Although the ferrous-only detector (i.e., ML3S) was able to detect ferrous metals accurately, the test field contained various real inert mines and all indications show that those landmines would not contain ferrous metal only. Therefore, in landmine and UXO detection, all-metal detectors should be preferred over ferrous metal detectors.
Our study emphasizes the need for advanced image processing or machine learning techniques for processing data from airborne systems like the EM61 Lite. Since we recorded the signals from each survey line separately, we were able to figure out the smaller anomalies as small responses in the form of peaks. However, smaller anomalies like PFM-1 mines were hard to visualize in the heat maps. When a large area is surveyed by drone, the data can have a large number of sample points (e.g., more than 100,000 sample points) for which analyzing individual peaks is not easy and is inefficient. Our experiment showcased that the smaller landmines, like the PFM-1, with very low metal content, could be missed when processing the data collected from real-world surveys. A survey using the EM61 Lite to detect larger pipes and metal objects indicated that users should survey in both east-west and north-south directions to detect larger objects with oblique orientations[19]. Techniques like applying filtering and vertical derivatives were proven to help sharpen the anomalies in that study. Nevertheless, our research concludes that airborne metal detection systems, like the EM 61 Lite, which are specially designed for UXO and landmine detection, can achieve similar results to handheld metal detectors (e.g., CTX 3030), which are state-of-the-art metal detectors. In fact, maintaining the same detection accuracy, these systems offer faster detection, thus saving significant time.
From our different experiments at the Rochester Institute of Technology, we discovered the optimal height of transmitter/receiver coils above ground, to produce better responses for various objects, was around 30-100 cm. In our experiment in the test field, we collected the data from the EM61 Lite, with the transmitter coil maintaining a constant height of 30 cm above the ground. However, vegetation present in parts of the test field (lines E and F) created difficulty in data collection. In real-world scenarios, long vegetation can prevent maintaining such a low altitude, necessitating more powerful airborne systems for higher-altitude data collection, or preparing the field by cutting down vegetation first.
We recommend integrating on-board GPS modules in such systems for real-time location updates at each sample point. GPS coordinates are also important when surveying larger areas using drones to create a single ortho-mosaic of the test site. Swinging and swaying of these devices, when mounted on a drone, can also cause problems with effective data collection. Advanced drones, like the DJI Matrice 600 Pro, can only fly around 20 minutes in one run with a payload equivalent to the current weight of the EM61 Lite system. Thus, the weight of the sensor should also be considered while manufacturing.
It is important to note that in our experiment, we assumed all metal targets were landmines, not clutter. In the real world, clutter is often present near the mines. So, in such cases, integrating airborne Ground Penetration Radar (GPR) with airborne Electromagnetic Induction (EMI)- based metal detectors to create an airborne detection system would help reduce false alarms. We also recommend implementing a greater number of time gates in such devices to capture more responses, enhance target identification, and reduce false alarms. Similarly, the threshold technique to determine anomalies from metal detector data is subjective and alone can not be trusted as a reliable method in critical domains like landmine detection. Our results also suggest exploring deep learning techniques to train models for identifying smaller anomalies in heat maps generated from the response curves obtained for various targets. Automatic optimal threshold detection using machine learning, automatic anomaly detection from heat maps using machine learning, multidirectional pulse induction metal detectors to produce 3D images of the target, alternative processing approaches, etc. are the are areas we are now investigating.
In conclusion, while airborne systems like the EM61 Lite show promise in detecting mines, further enhancements in sensor development, survey methodologies, and data processing are necessary to improve the accuracy and efficiency of such systems in real-world landmine detection applications. Our study was to simply show that, for mines and UXOs, one can employ a metal detection system (though in a pseudo drone scenario). This system generated detection results similar to the tried-true tested approach of manual hand-held detection with the added benefit of increased speed (ten times faster). These results should pave the way for manufacturers to continue to construct more powerful drone-based metal detectors. Our next set of experiments will move forward with a complete drone-based system with new, novel methods for image interpretation and detection of target in more difficult terrain.
Author Contributions
The data and information, on either detected or undetected targets, from handheld devices was provided by Tony Brinkley. The EM61 data was collected in the field by Emmett J. Ientilucci and Sagar Lekhak. The funding, review, and supervision of the work was managed by Emmett J. Ientilucci. The concept for the paper, resource collection, data curation, methodologies, analysis, original draft preparation, and writing was contributed by Sagar Lekhak. All authors have read and agreed to the published version of the manuscript.
Funding
No external funding was used to support this research. Funding support (related to travel, data collections, etc.) was provided by co-author Emmett Ientilucci through use of his own discretionary funds.
Data Availability Statement
Data collected during this experiment, and all experiments from this test site, are made publicly available through the Demining Research Community website, de-mine.com.
Acknowledgments
We thank the Demining Research Community, especially Jasper Baur and Gabriel Steinberg, for collaborating with us to collect data from the test site. We would also like to thank Geonics Limited for lending us their EM61 Lite which was used in the data collection as well.
Conflicts of Interest
The authors have no conflict of interest.
Abbreviations
The following abbreviations are used in this manuscript:
| CENFEX | Center for Fire and Explosives, Forensic Investigation, Training, and Research |
| EMI | Electromagnetic Induction |
| ERW | Explosive Remnants of War |
| GPR | Ground Penetration Radar |
| GPS | Global Positioning System |
| IED | Improvised Explosive Device |
| LiDAR | Light Detection and Ranging |
| OSU | Oklahoma State University |
| PVC | Polyvinyl Chloride |
| RGB | Red Green Blue |
| RIT | Rochester Institute of Technology |
| SAR | Synthetic Aperture Radar |
| TDEM | Time-Domain Electromagnetic |
| UAV | Unmanned Aerial Vehicle |
| UTM | Universal Transverse Mercator |
| UXO | Unexploded Ordnance |
Appendix A
Detection results of each of the detectors is shown below.

Table A1.
Detailed detection results by three detectors (CTX 3030, ML3S, EM61 Lite) for each row and column.
Table A1.
Detailed detection results by three detectors (CTX 3030, ML3S, EM61 Lite) for each row and column.
| Target | A | B | C | D | E | F |
|---|---|---|---|---|---|---|
| 1 | (1,1,1) | (1,1,1) | (1,0,1) | (1,1,1) | (1,1,1) | (1,1,1) |
| 2 | (0,0,0) | (1,1,1) | (1,0,1) | (1,1,1) | (1,1,1) | (-,-,-) |
| 3 | (1,1,1) | (1,1,1) | (1,0,1) | (1,1,1) | (1,1,1) | (1,1,1) |
| 4 | (0,0,0) | (1,1,1) | (1,0,1) | (1,1,1) | (1,1,1) | (-,-,-) |
| 5 | (1,1,1) | (1,1,1) | (1,0,1) | (1,1,1) | (1,1,1) | (0,0,0) |
| 6 | (0,0,0) | (1,1,1) | (1,1,1) | (1,1,1) | (1,1,1) | (-,-,-) |
| 7 | (1,1,1) | (1,1,1) | (1,0,1) | (1,1,1) | (1,1,1) | (1,0,1) |
| 8 | (0,0,0) | (1,1,1) | (1,1,1) | (1,1,1) | (1,1,1) | (-,-,-) |
| 9 | (1,1,1) | (1,1,1) | (1,0,1) | (1,1,1) | (1,1,1) | (1,0,1) |
| 10 | (0,0,0) | (1,1,1) | (1,0,1) | (1,1,1) | (1,1,1) | (-,-,-) |
| 11 | (1,1,1) | (1,1,1) | (1,0,1) | (1,1,1) | (1,1,1) | (1,1,1) |
| 12 | (0,0,0) | (1,1,1) | (1,0,1) | (1,1,1) | (1,1,1) | (-,-,-) |
| 13 | (1,1,1) | (1,1,1) | (1,1,1) | (1,1,1) | (1,1,1) | (1,1,1) |
| 14 | (-,-,-) | (1,1,1) | (1,0,1) | (1,1,1) | (1,1,1) | (-,-,-) |
| 15 | (1,1,1) | (1,1,1) | (1,0,1) | (1,1,1) | (1,1,1) | (1,0,1) |
| 16 | (-,-,-) | (0,0,0) | (1,0,1) | (1,0,1) | (1,0,1) | (-,-,-) |
| 17 | (1,1,1) | (1,1,1) | (0,1,1) | (0,0,0) | (1,1,1) | (1,1,1) |
| 18 | (-,-,-) | (1,1,1) | (1,1,1) | (0,0,0) | (1,1,1) | (-,-,-) |
| 19 | (0,1,0) | (1,1,1) | (1,1,1) | (0,0,0) | (1,1,1) | (1,1,1) |
| 20 | (-,-,-) | (1,1,1) | (1,1,1) | (0,0,0) | (1,0,1) | (-,-,-) |
| 21 | (1,1,1) | (1,1,1) | (1,0,1) | (0,0,0) | (1,0,1) | (1,1,1) |
| 22 | (-,-,-) | (1,1,1) | (1,1,1) | (1,1,1) | (1,0,1) | (-,-,-) |
| 23 | (1,1,0) | (1,1,1) | (1,1,1) | (0,0,0) | (1,0,1) | (1,1,1) |
| 24 | (0,0,0) | (1,1,1) | (1,1,1) | (1,1,1) | (1,0,1) | (-,-,-) |
| 25 | (1,1,1) | (1,1,1) | (1,1,1) | (0,0,0) | (1,0,1) | (-,-,-) |
| Legend: | ||||||
| 1 = Detected, 0 = Undetected | ||||||
| (1,1,1) = Detection by three detectors (CTX 3030, ML 3S, and EM61 Lite), respectively. | ||||||
| (-,-,-) = Hole or no object was placed in this position. | ||||||
References
- United Nations Mine Action Service (UNMAS). Handbook. https://unmas.org/sites/default/files/handbook_english.pdf, 2015. Accessed: 2024-07-29.
- U.S. Army Corps of Engineers. UXO Safety Fact Sheet. https://www.poh.usace.army.mil/Portals/10/docs/fuds/UXO%20Safety%20Fact%20Sheet.pdf, n.d. Accessed: 2024-07-29.
- Geneva International Centre for Humanitarian Demining (GICHD). Innovation Conference Report 2023. https://www.gichd.org/fileadmin/uploads/gichd/Photos/Innovation_Conference_2023/GICHD_Innovation_Conference_Report.pdf, 2023. Accessed: 2024-07-29, pp. 48-49.
- Department of Homeland Security, United States. IED Fact Sheet. https://www.dhs.gov/xlibrary/assets/prep_ied_fact_sheet.pdf, n.d. Accessed: 2024-07-29.
- Oxford English Dictionary. Landmine. https://www.oed.com/search/dictionary/?scope=Entries&q=landmine, 2024. Accessed: 2024-07-29.
- International Campaign to Ban Landmines - Cluster Munition Coalition. Landmine Monitor 2023 Annual Report. https://www.the-monitor.org/reports/landmine-monitor-2023, 2023. Accessed: 2024-07-29.
- Atlas, W. Countries With the Highest Number of Mines Deployed in Their Territory. https://www.worldatlas.com/articles/countries-with-the-highest-number-of-mines-deployed-in-their-territory.html, n.d. Accessed: 2024-07-29.
- Vox. Ukraine’s Land Mine Crisis Amid the Ongoing War with Russia. https://www.vox.com/world-politics/2023/11/30/23979758/ukraine-war-russia-land-mines-artillery-humantarian-crisis, 2023. Accessed: 2024-07-29.
- Handicap International. Landmine Monitor 2023: Current Conflicts & Long-Lasting Contamination Cause High Number of Mine Casualties, 2023. Accessed: 2024-07-29.
- Human Rights Watch. Landmine Use in Ukraine, 2023. Accessed: 2024-07-29.
- Krueger, H.; Ewald, H.; Fechner, T.; Bergeler, S. Advanced Signal Processing for Reduction of False Alarm Rate of Metal Detectors for Humanitarian Mine Clearance. 2006 IEEE Instrumentation and Measurement Technology Conference Proceedings, 2006, pp. 1452–1456. [CrossRef]
- Collins, L.M.; Huettel, L.G.; Simpson, W.A.; Tantum, S.L. Sensor fusion of EMI and GPR data for improved land mine detection. Detection and Remediation Technologies for Mines and Minelike Targets VII; Broach, J.T.; Harmon, R.S.; Dobeck, G.J., Eds., 2002, Vol. 4742, Society of Photo-Optical Instrumentation Engineers (SPIE) Conference Series, pp. 872–879. [CrossRef]
- United Nations. New mine action survey reveals Ukraine one of the world’s most contaminated countries. https://news.un.org/en/story/2023/04/1135252, 2023. Accessed: 2024-07-30.
- The New York Times Editorial Board. The Hidden Legacy of Agent Orange. The New York Times 2018. Accessed: 2024-07-29.
- ReliefWeb. Nearly 500,000 Hectares of Land Cleared of UXOs, 2024. Accessed: 2024-07-29.
- Baur, J.; Steinberg, G.; Nikulin, A.; Chiu, K.; de Smet, T.S. Applying Deep Learning to Automate UAV-Based Detection of Scatterable Landmines. Remote Sensing 2020, 12, 859. [Google Scholar] [CrossRef]
- deSmet, T.; Nikulin, A.; Frazer, W.; Baur, J.; Abramowitz, J.; Finan, D.; Denara, S.; Aglietti, N.; Campos, G. Drones and "Butterflies": A Low-Cost UAV System for Rapid Detection and Identification of Unconventional Minefields. The Journal of Conventional Weapons Destruction 2018, 22. [Google Scholar]
- Tuohy, M.; Baur, J.; Steinberg, G.; Pirro, J.; Mitchell, T.; Nikulin, A.; Frucci, J.; de Smet, T.S. Utilizing UAV-based hyperspectral imaging to detect surficial explosive ordnance. The Leading Edge 2023, 42, 98–102. [Google Scholar] [CrossRef]
- Laboratory, P.N.N. An EM61 Lite Survey to Detect and Delineate a Buried Pipeline - RemPlex Summit 2023, 2023. Accessed: 2024-07-29.
- Engineering, S. SPH Engineering Introduces the Drone-Integrated Metal Detection System. https://www.sphengineering.com/news/sph-engineering-introduces-the-drone-integrated-metal-detection-system, 2024. Accessed: 2024-08-07.
- Baur, J.; Steinberg, G.; Frucci, J.; Brinkley, A. An Accessible Seeded Field for Humanitarian Mine Action Research. The Journal of Conventional Weapons Destruction 2023, 27. [Google Scholar]
- Limited, G. EM61-MK2. https://geonics.com/html/em61-mk2.html, n.d. Accessed: 2024-07-29.
- USA, E. Geonics EM61-MK2-A. https://www.exiusa.com/item/electromagnetic/geonics-em-61-mk2-a, n.d. Accessed: 2024-07-29.
- Limited, G. Metal Detectors. https://geonics.com/pdfs/downloads/metaldetectors.pdf, n.d. Accessed: 2024-07-29.
- EngineerSupply. How Does a Magnetic Locator Work?, n.d. EngineerSupply. How Does a Magnetic Locator Work?, n.d. Accessed: 2024-07-29.
- Company, S.I. How Magnetic Locators Work. https://www.schonstedt.com/training/how-magnetic-locators-work/#:~:text=Magnetic%20Locators%20find%20underground%20objects,surrounds%20a%20buried%20metal%20target, n.d. Accessed: 2024-07-29.
- Locators, S. ML-3S-40. https://www.ssilocators.com/product/ml-3s-40/, n.d. Accessed: 2024-07-29.
- Minelab. CTX 3030. https://www.minelab.com/usa/metal-detectors/ctx-3030, n.d. Accessed: 2024-07-29.
Figure 1.
Condensed picture of test field showing different landmines and their arrangement in lines A to F from north to south, with A1 facing east and A25 in the west [21].
Figure 1.
Condensed picture of test field showing different landmines and their arrangement in lines A to F from north to south, with A1 facing east and A25 in the west [21].
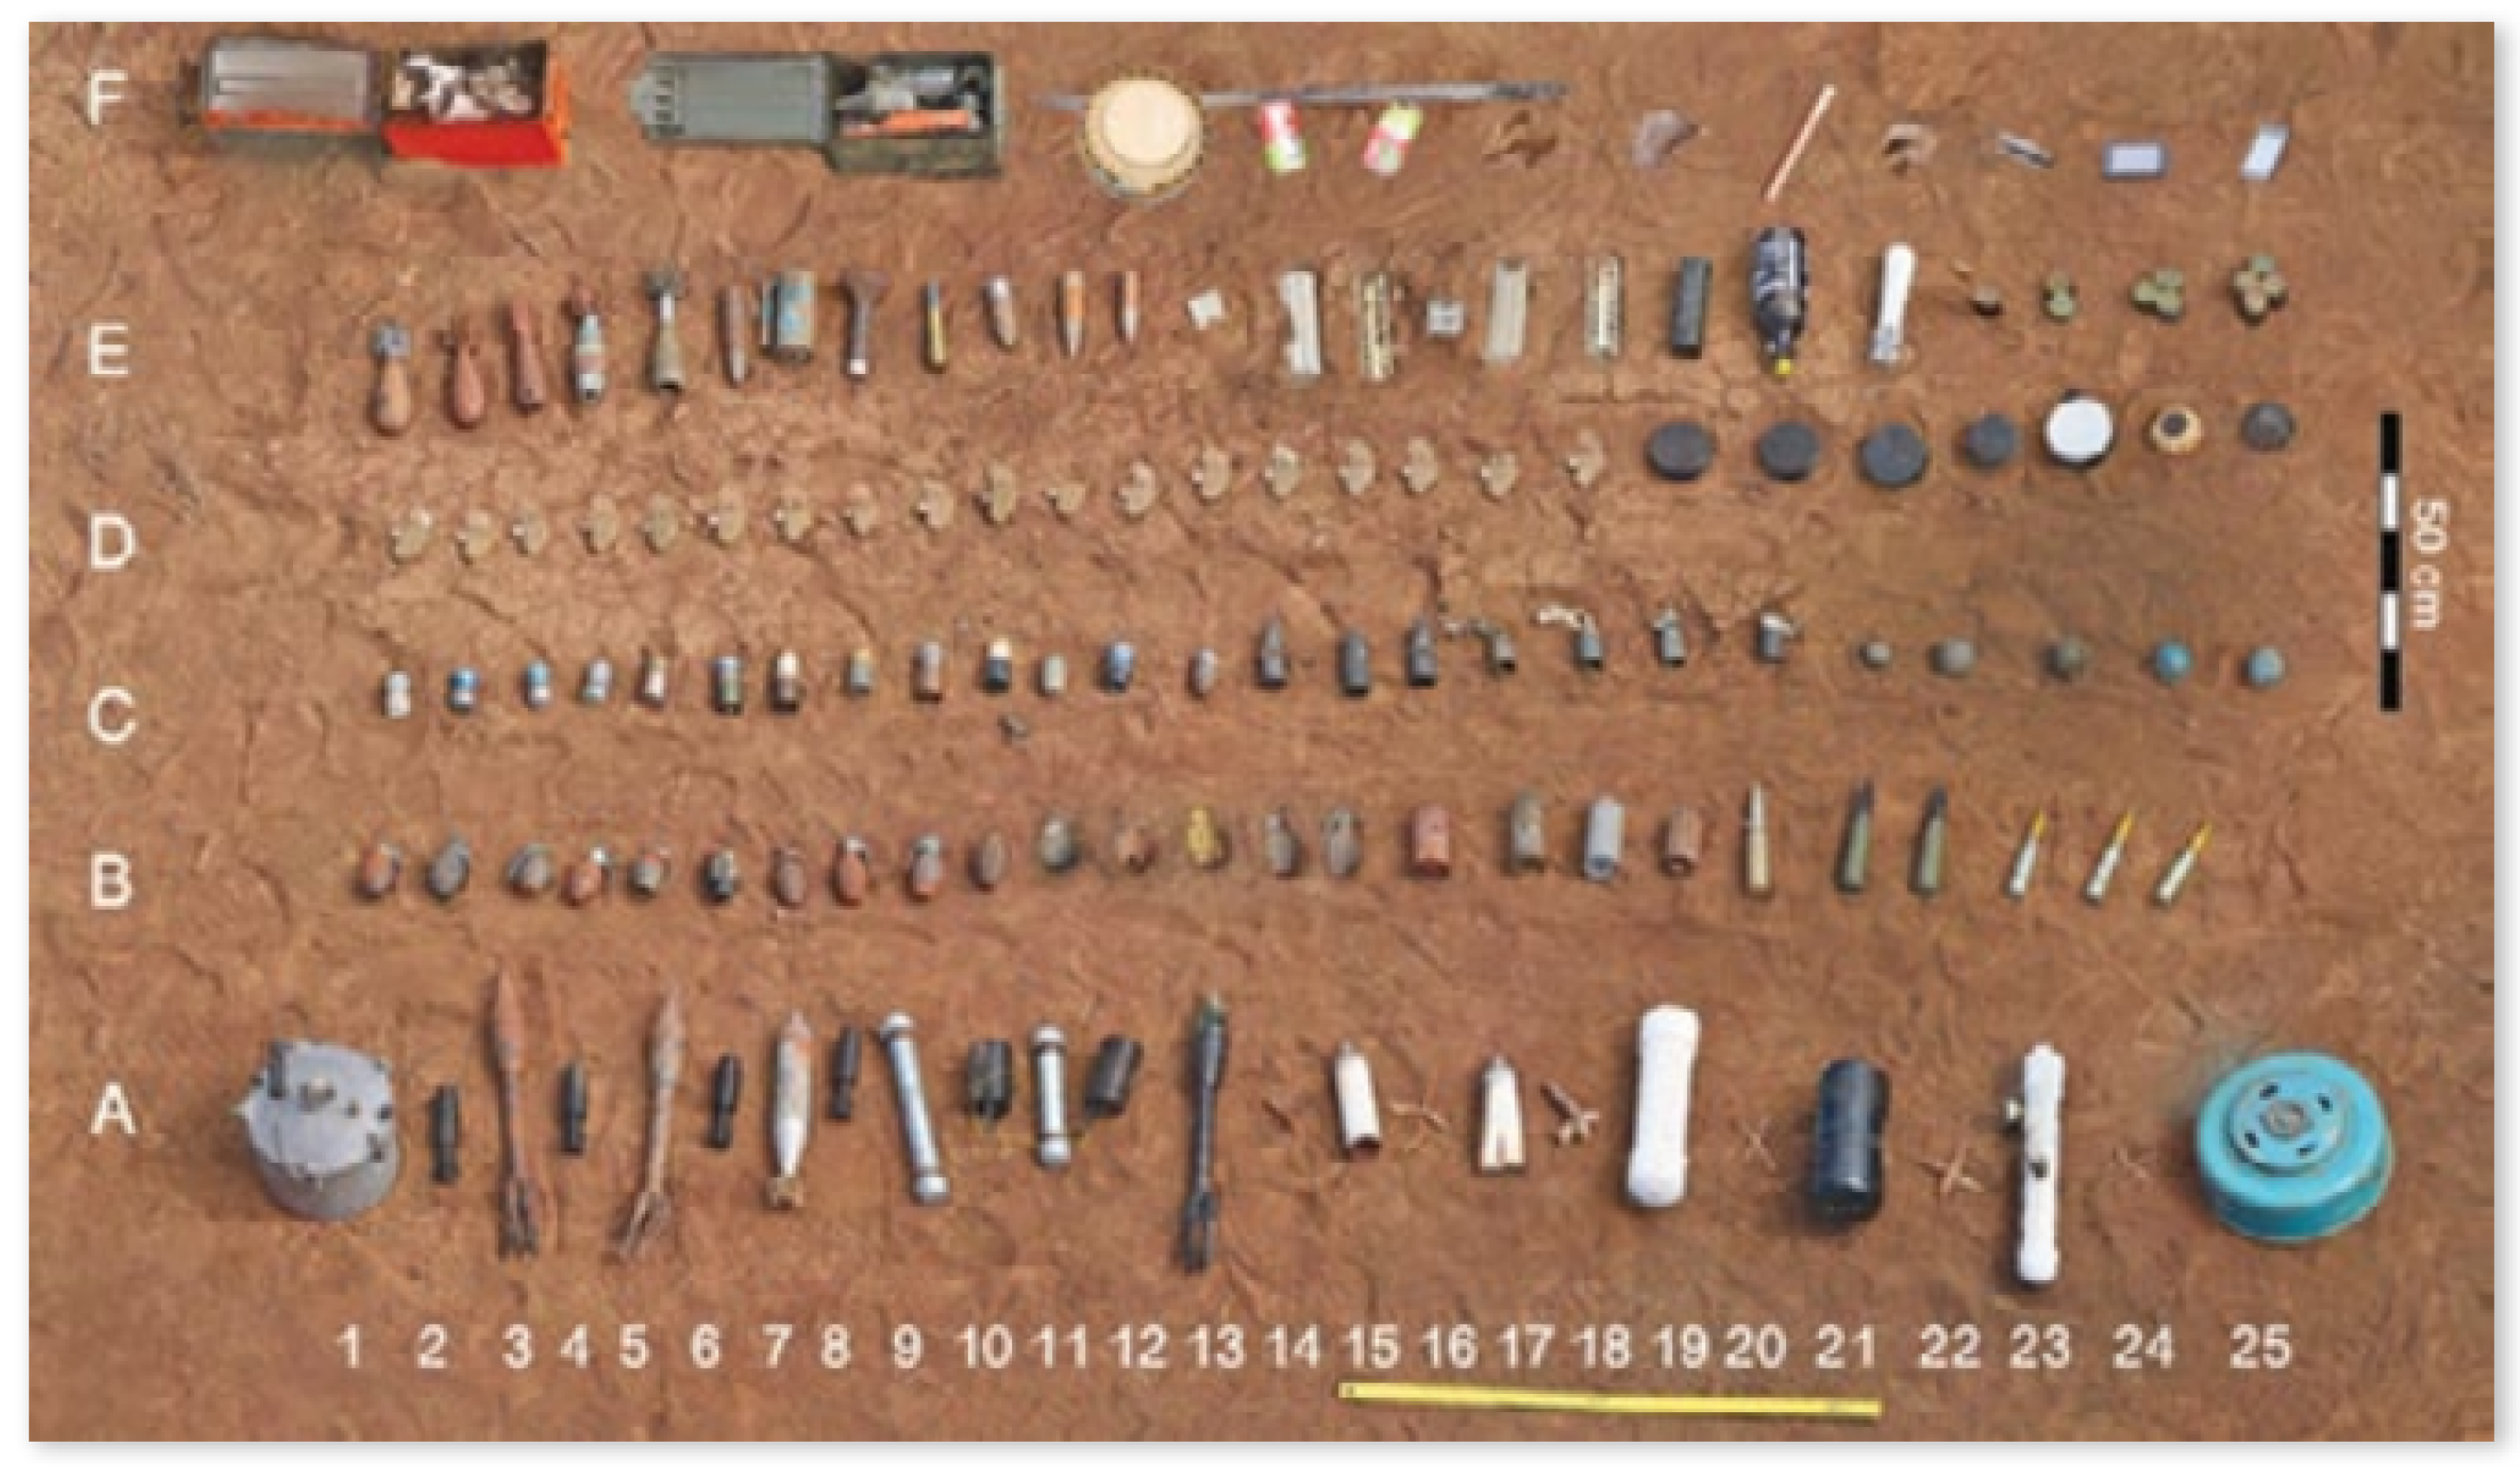
Figure 2.
EM61 Lite being tested at RIT before taking to test site.: (a) Verifying the functionality of EM61 Lite’s console, coils, and electronics in RIT’s drone lab. (b and c) Testing the EM61 Lite with various metal objects with different orientations and buried depths.
Figure 2.
EM61 Lite being tested at RIT before taking to test site.: (a) Verifying the functionality of EM61 Lite’s console, coils, and electronics in RIT’s drone lab. (b and c) Testing the EM61 Lite with various metal objects with different orientations and buried depths.
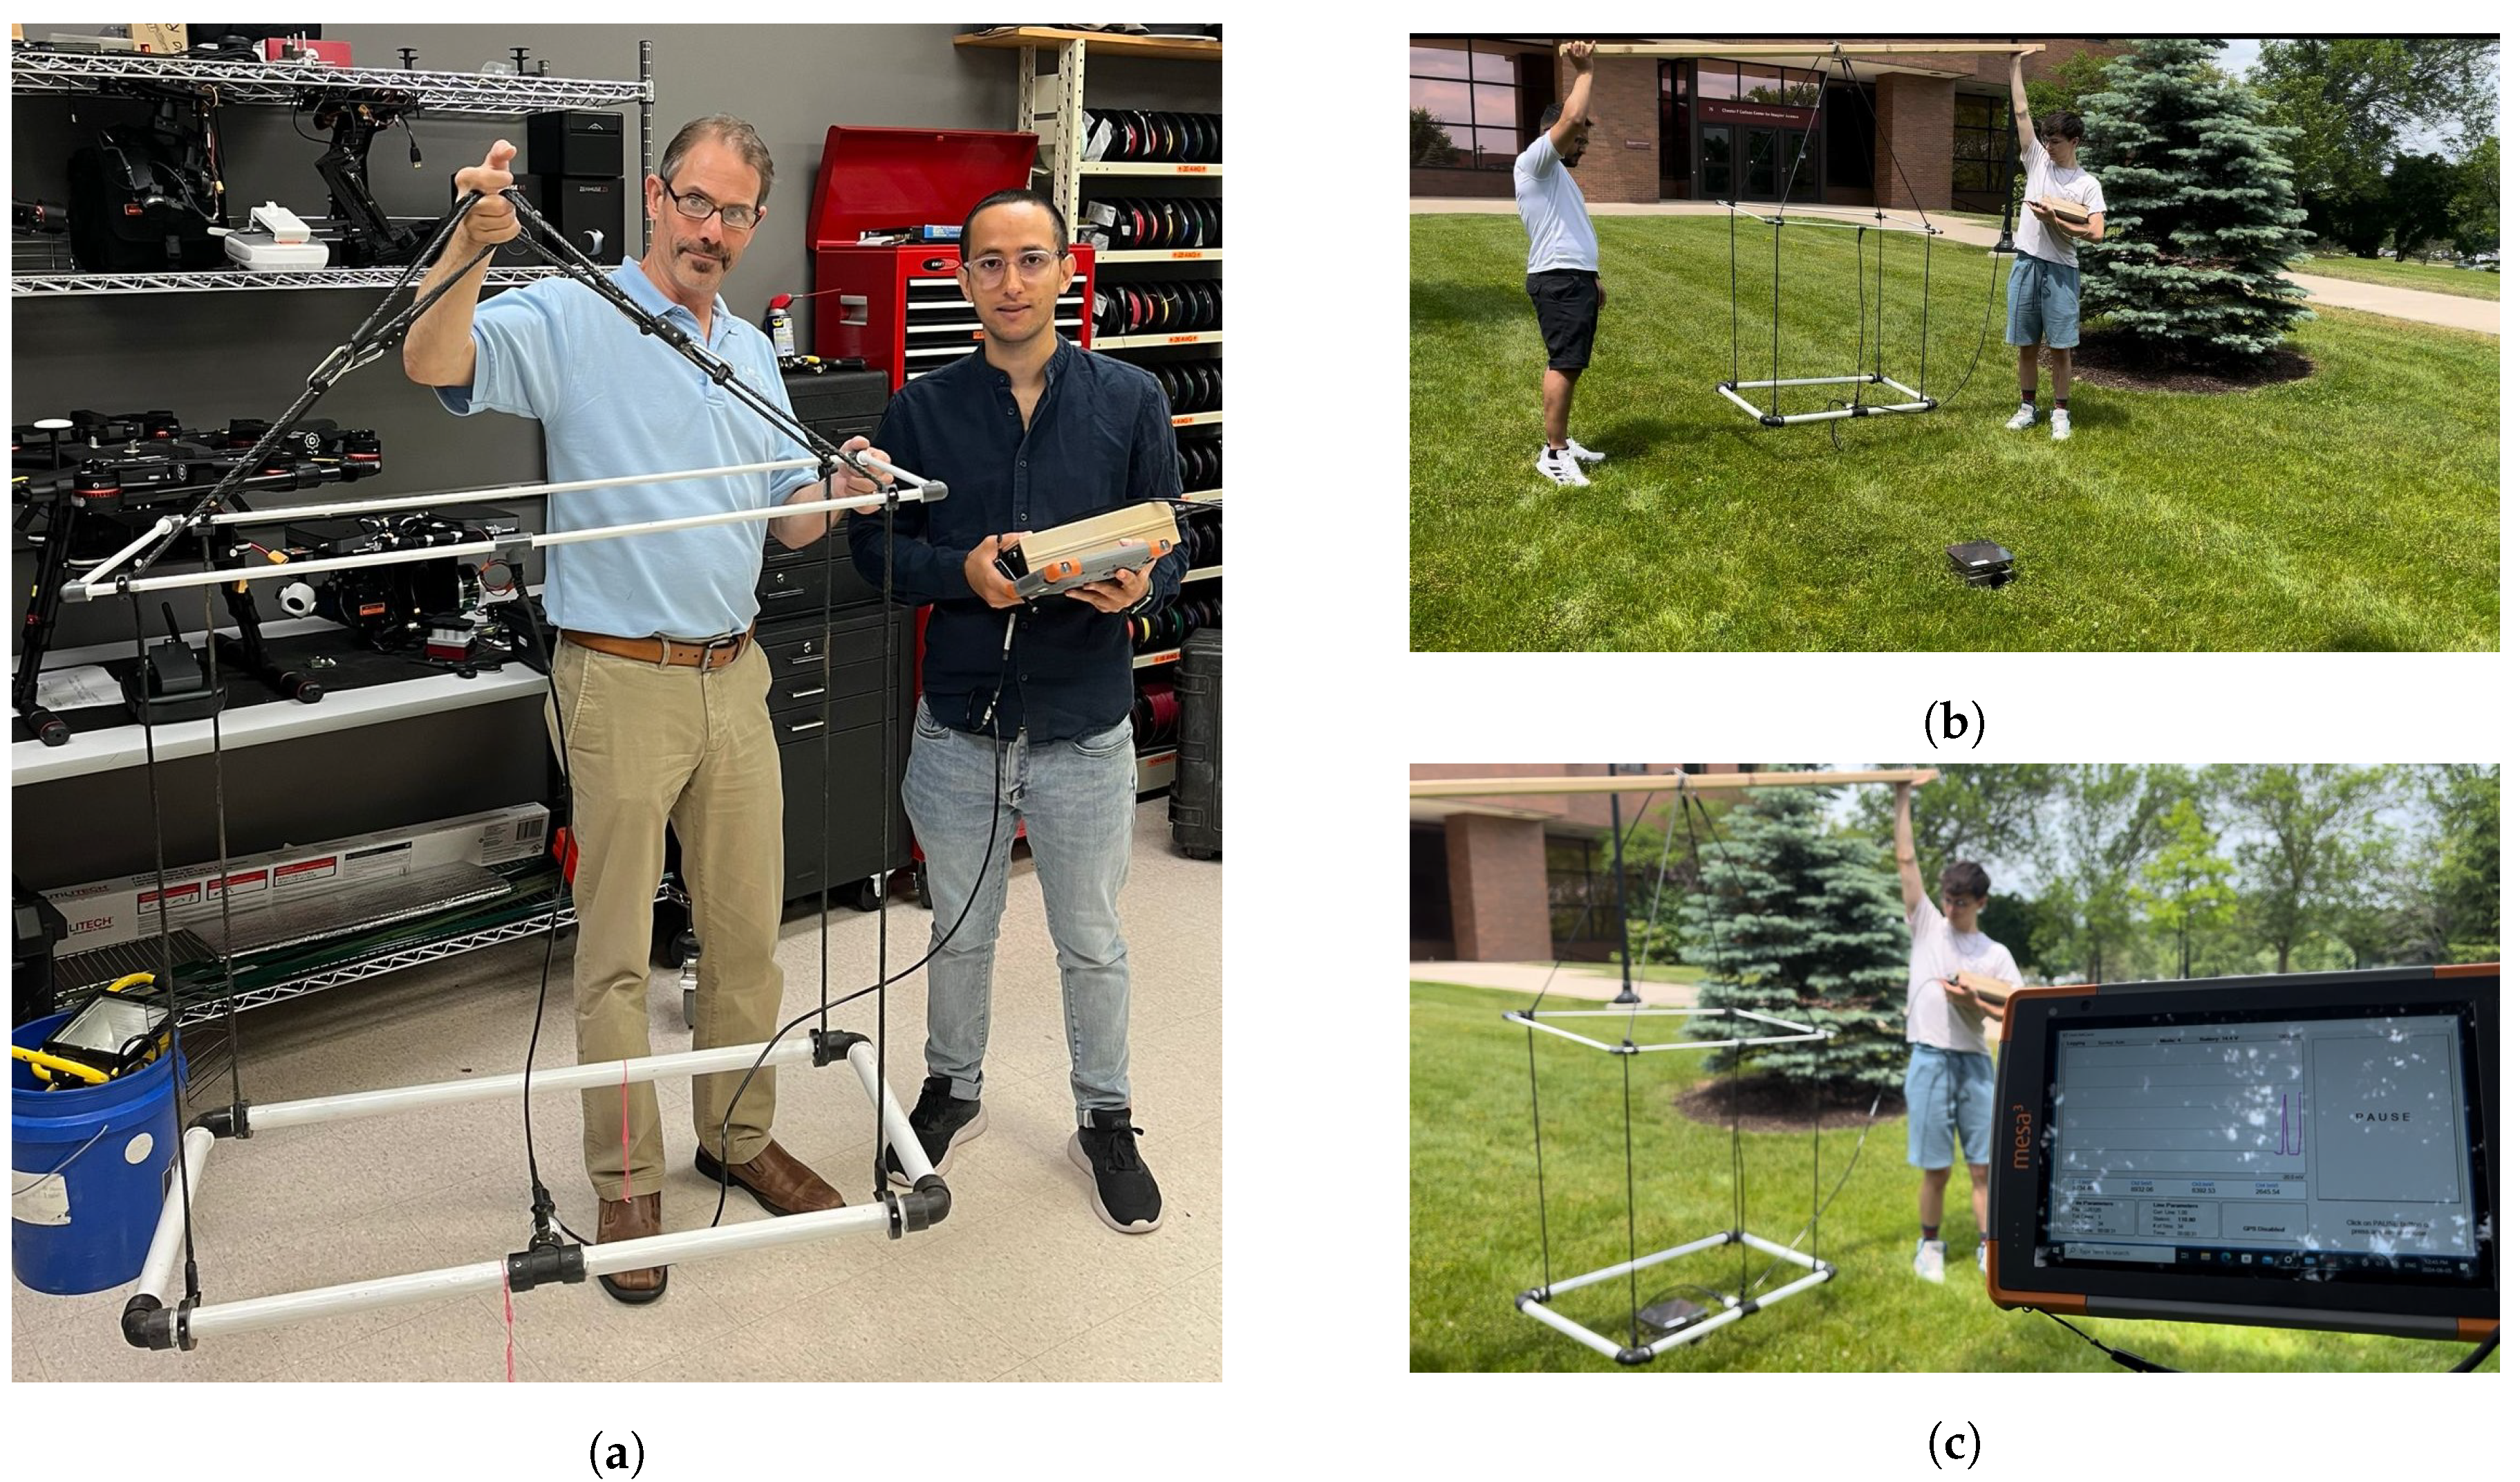
Figure 3.
Handheld metal detectors used to detect landmines and UXOs in our test field. In the photo, CTX 3030 held in right hand and ML-3S held in left hand.
Figure 3.
Handheld metal detectors used to detect landmines and UXOs in our test field. In the photo, CTX 3030 held in right hand and ML-3S held in left hand.
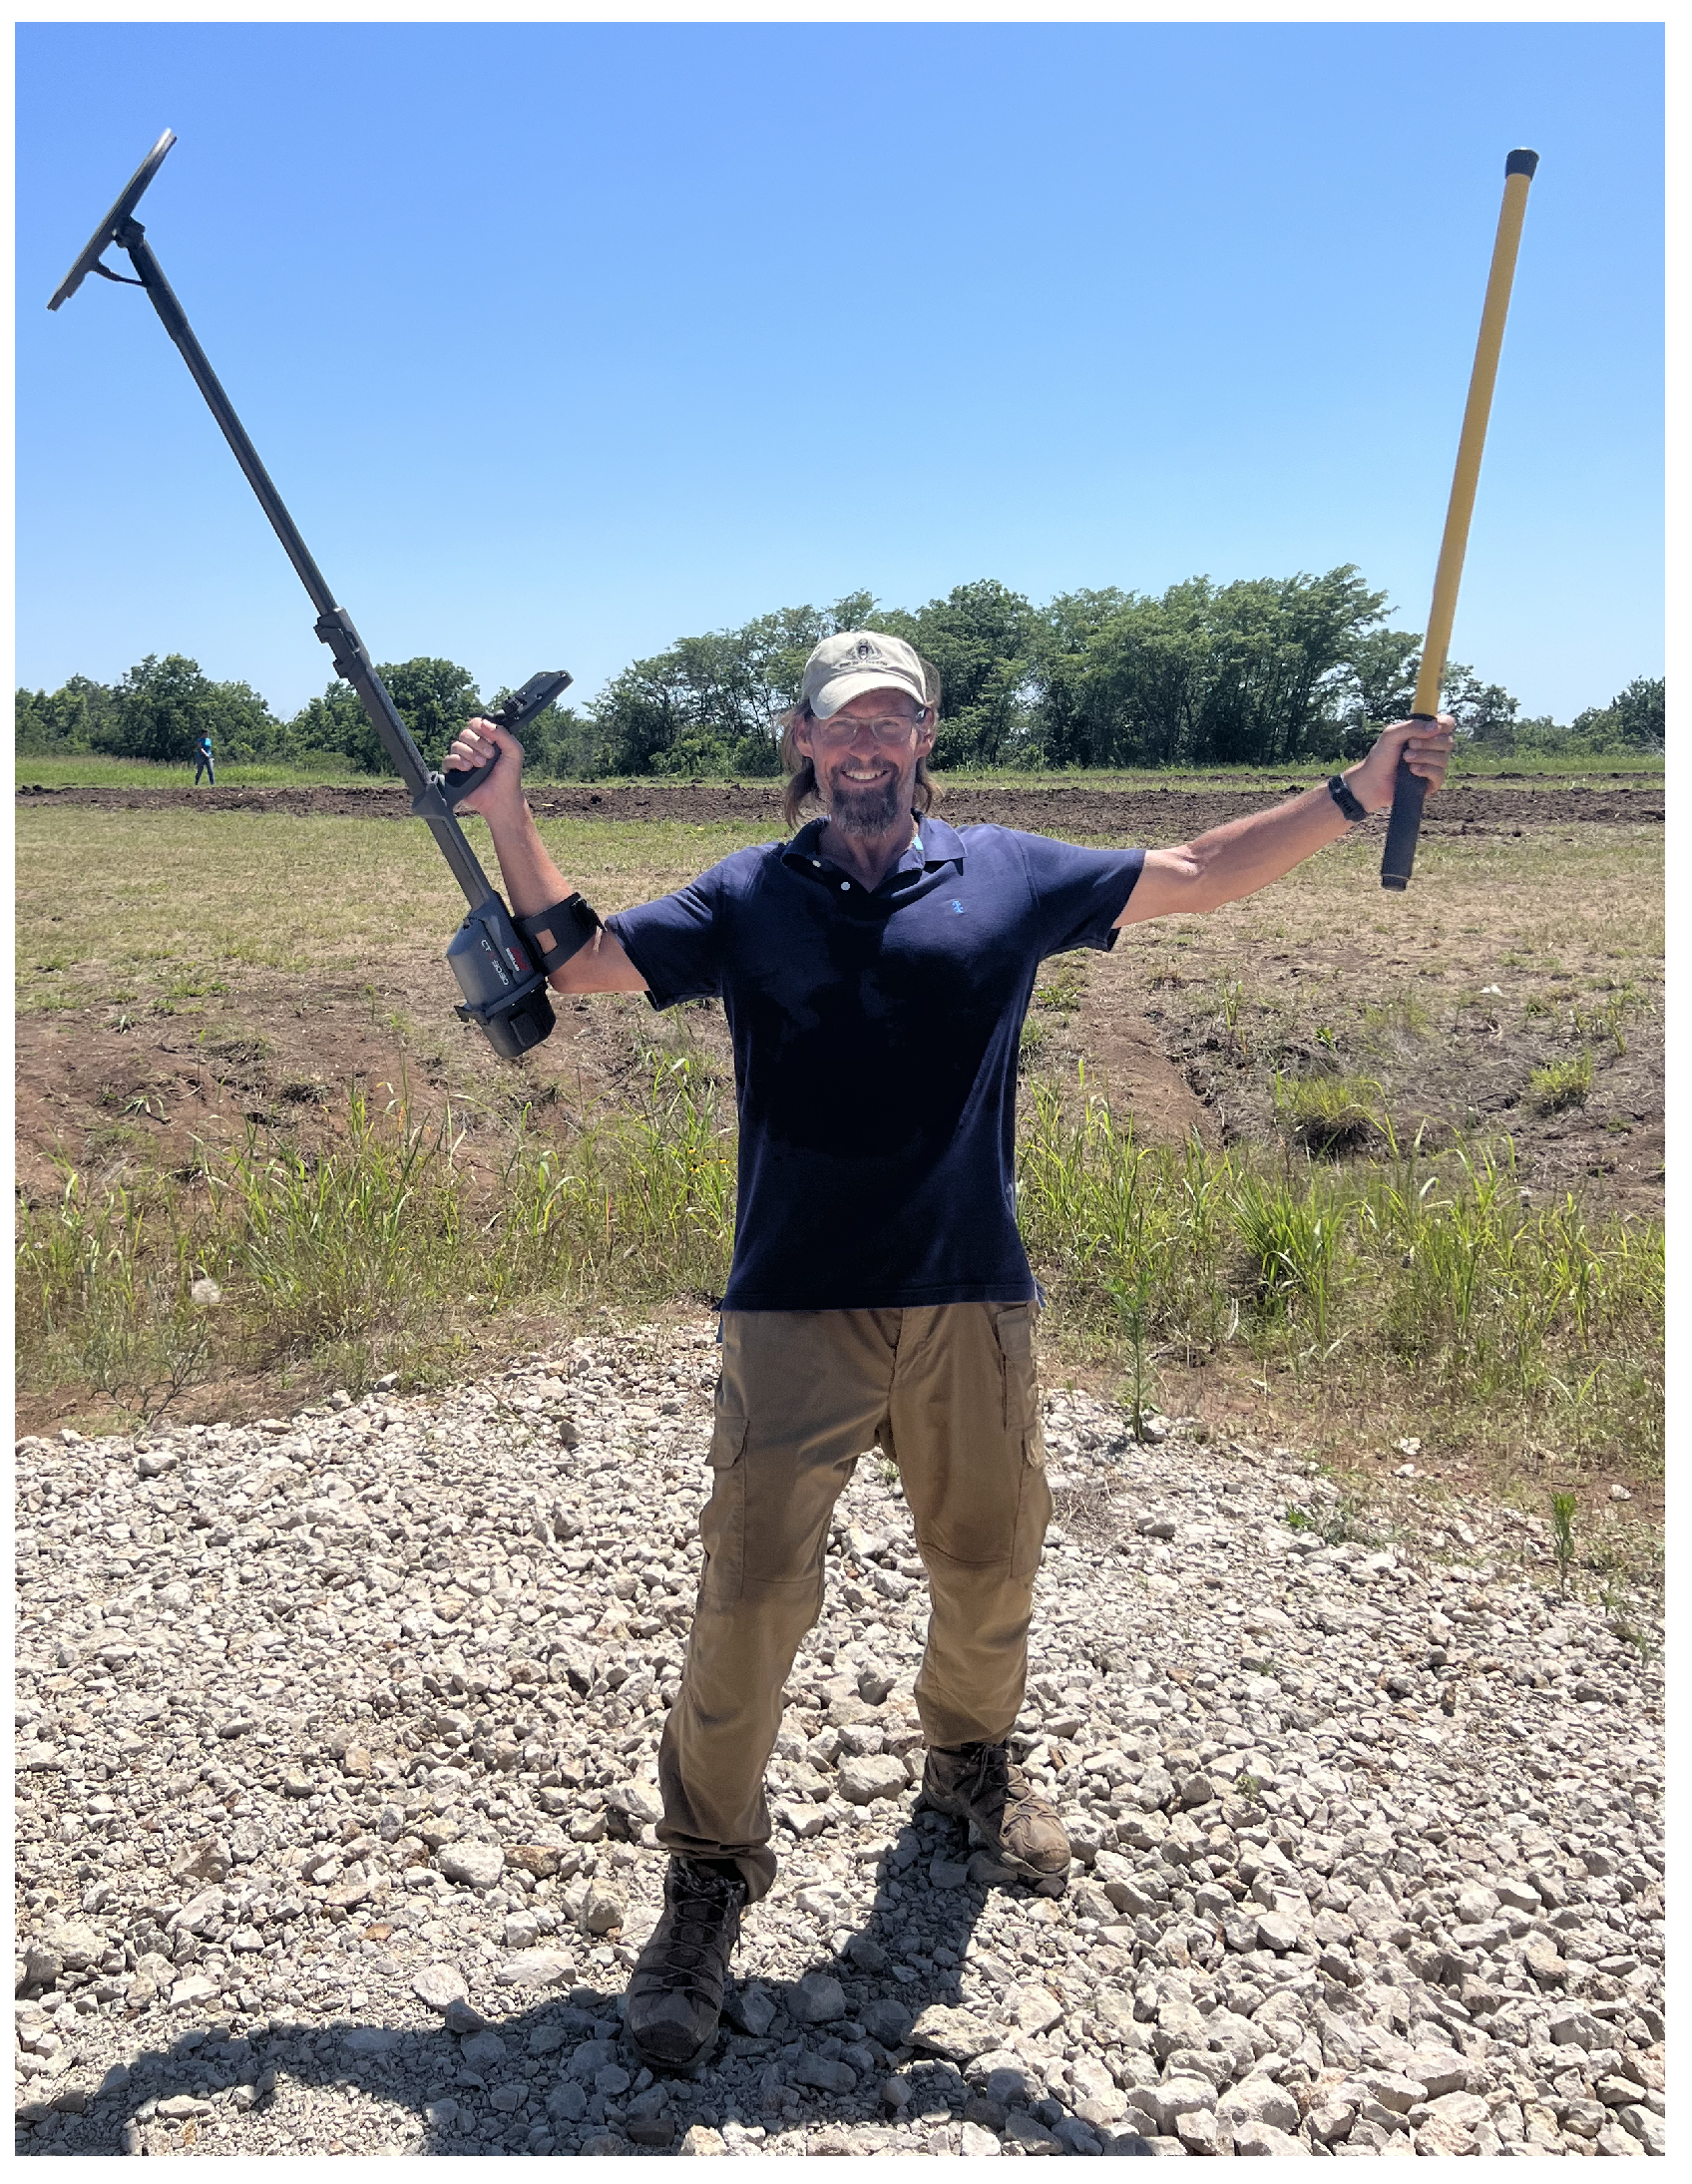
Figure 4.
Test field demonstrating the data collection procedure from the EM61 Lite: being carried by two people with another person simultaneously analyzing peak responses and marking those locations in the test field.
Figure 4.
Test field demonstrating the data collection procedure from the EM61 Lite: being carried by two people with another person simultaneously analyzing peak responses and marking those locations in the test field.
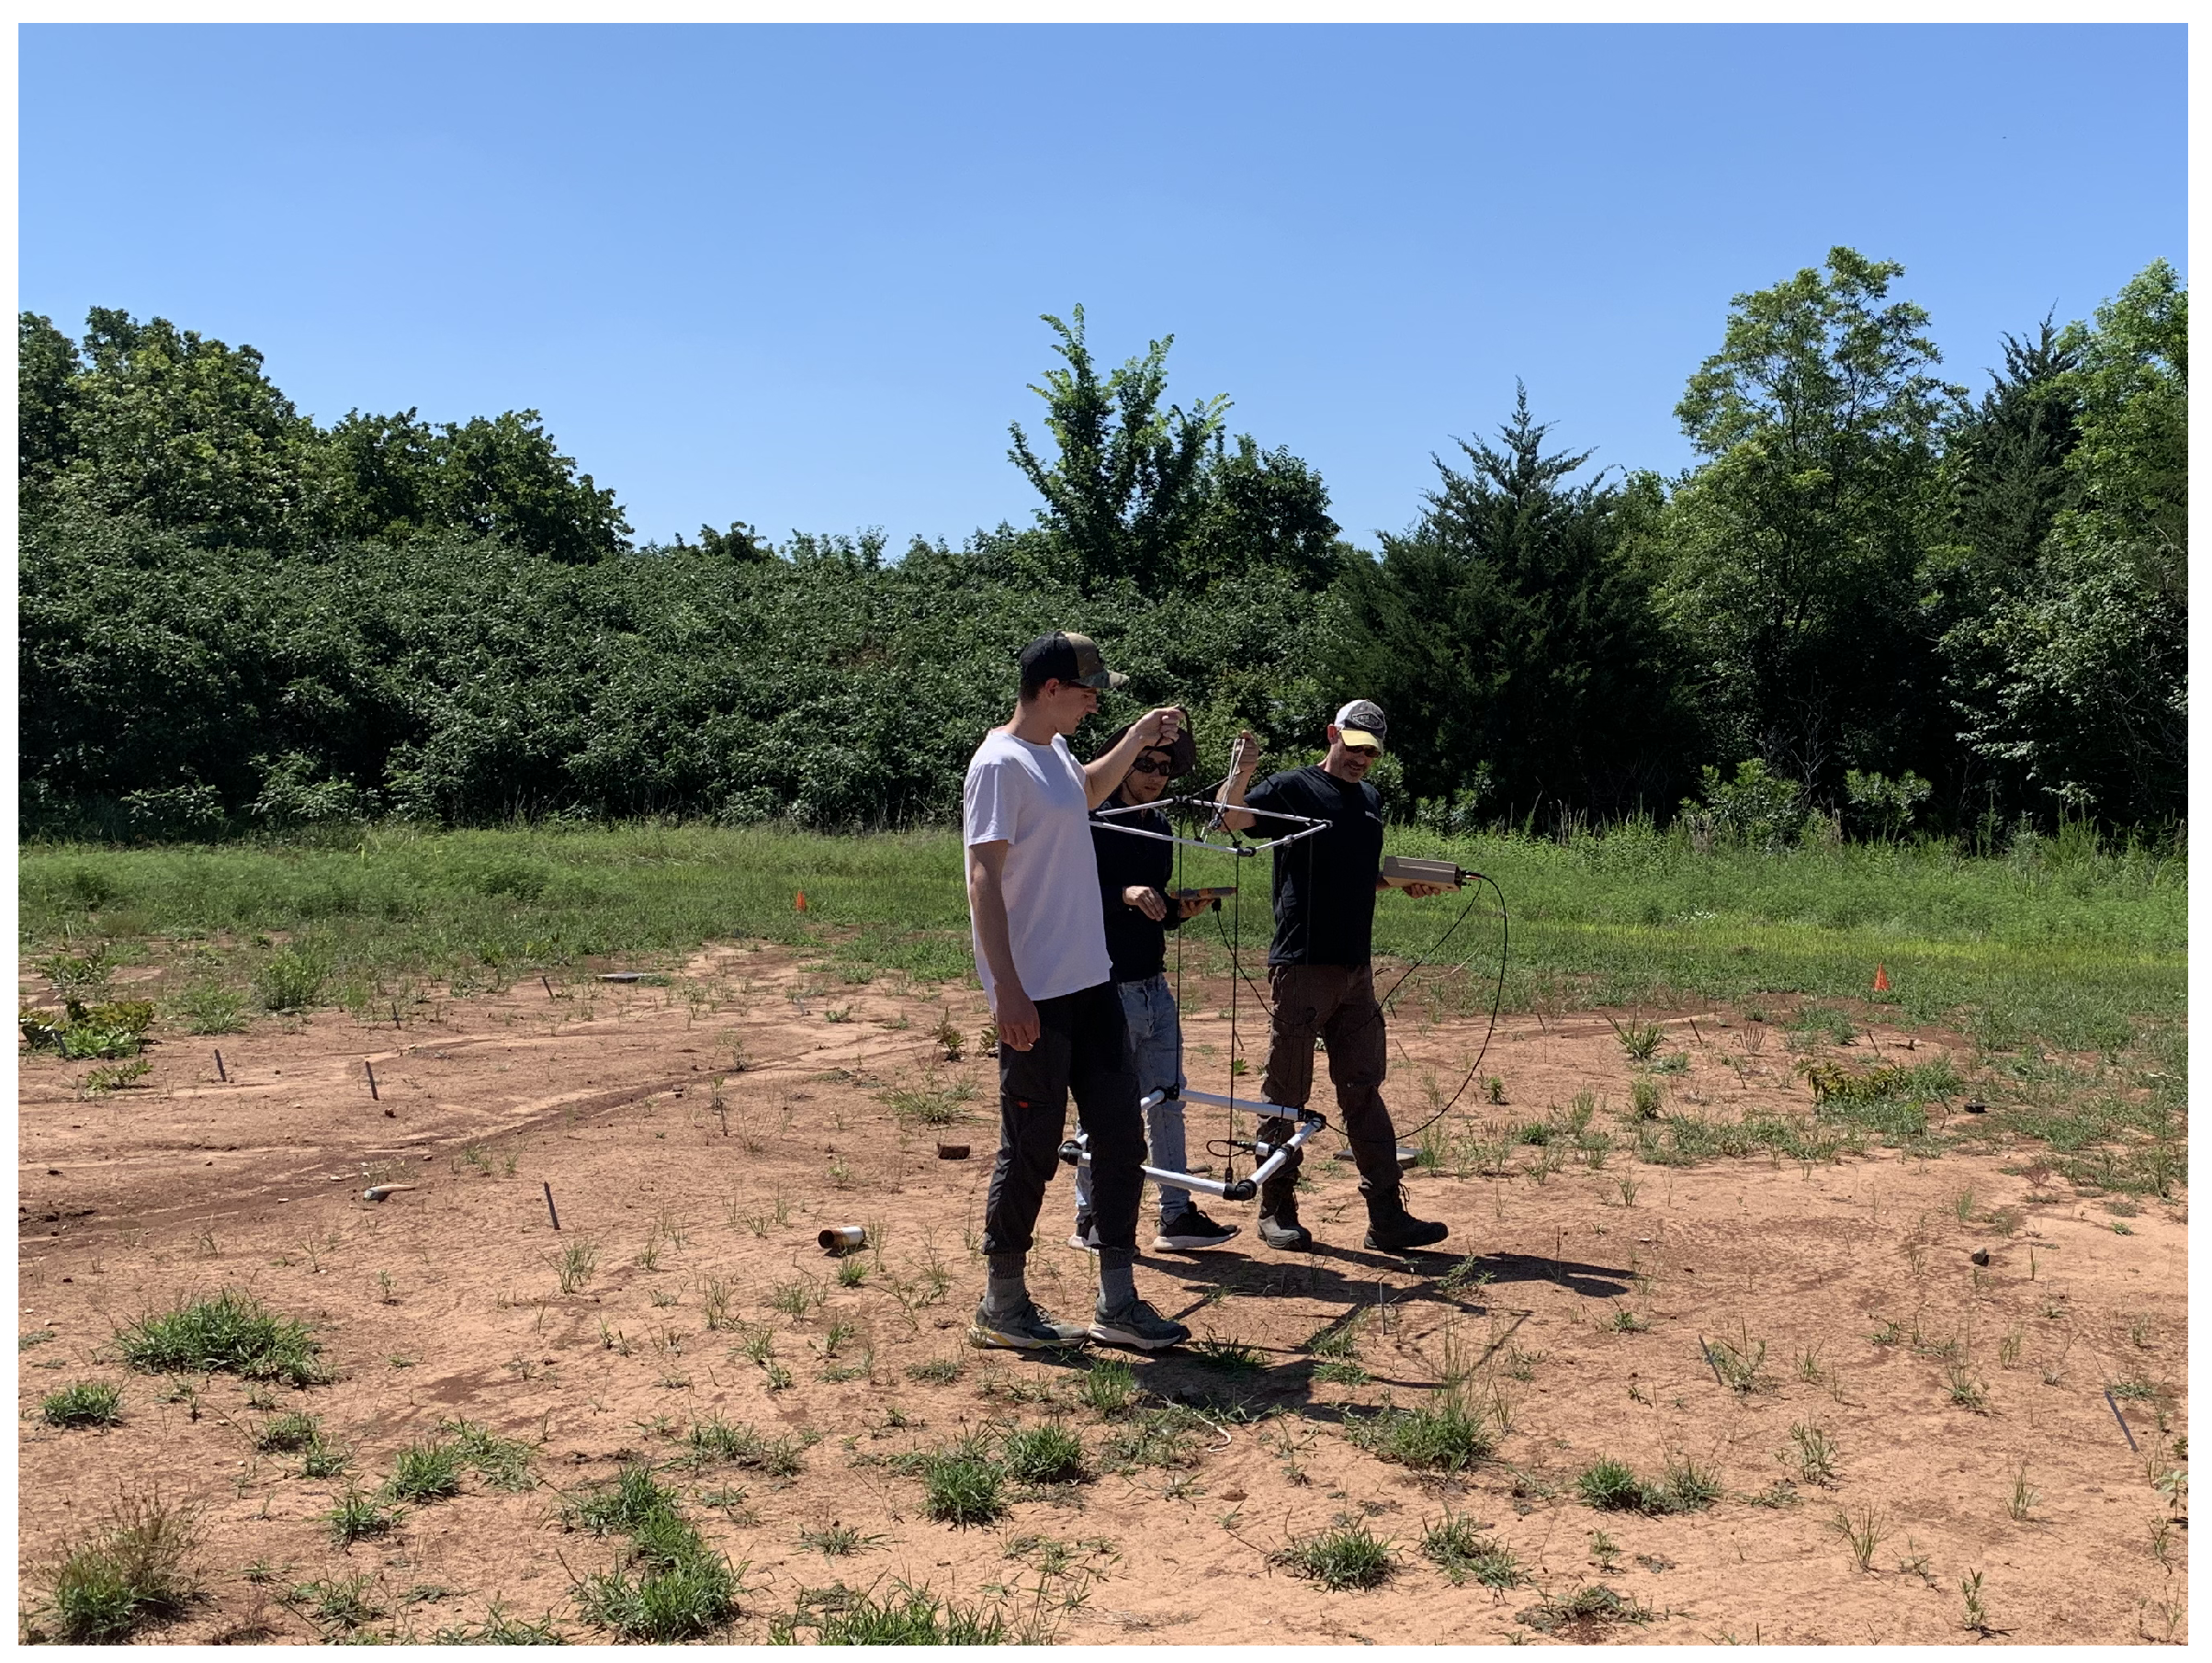
Figure 5.
Excavated objects from the test field being verified after the data was collected from all the metal detectors.
Figure 5.
Excavated objects from the test field being verified after the data was collected from all the metal detectors.
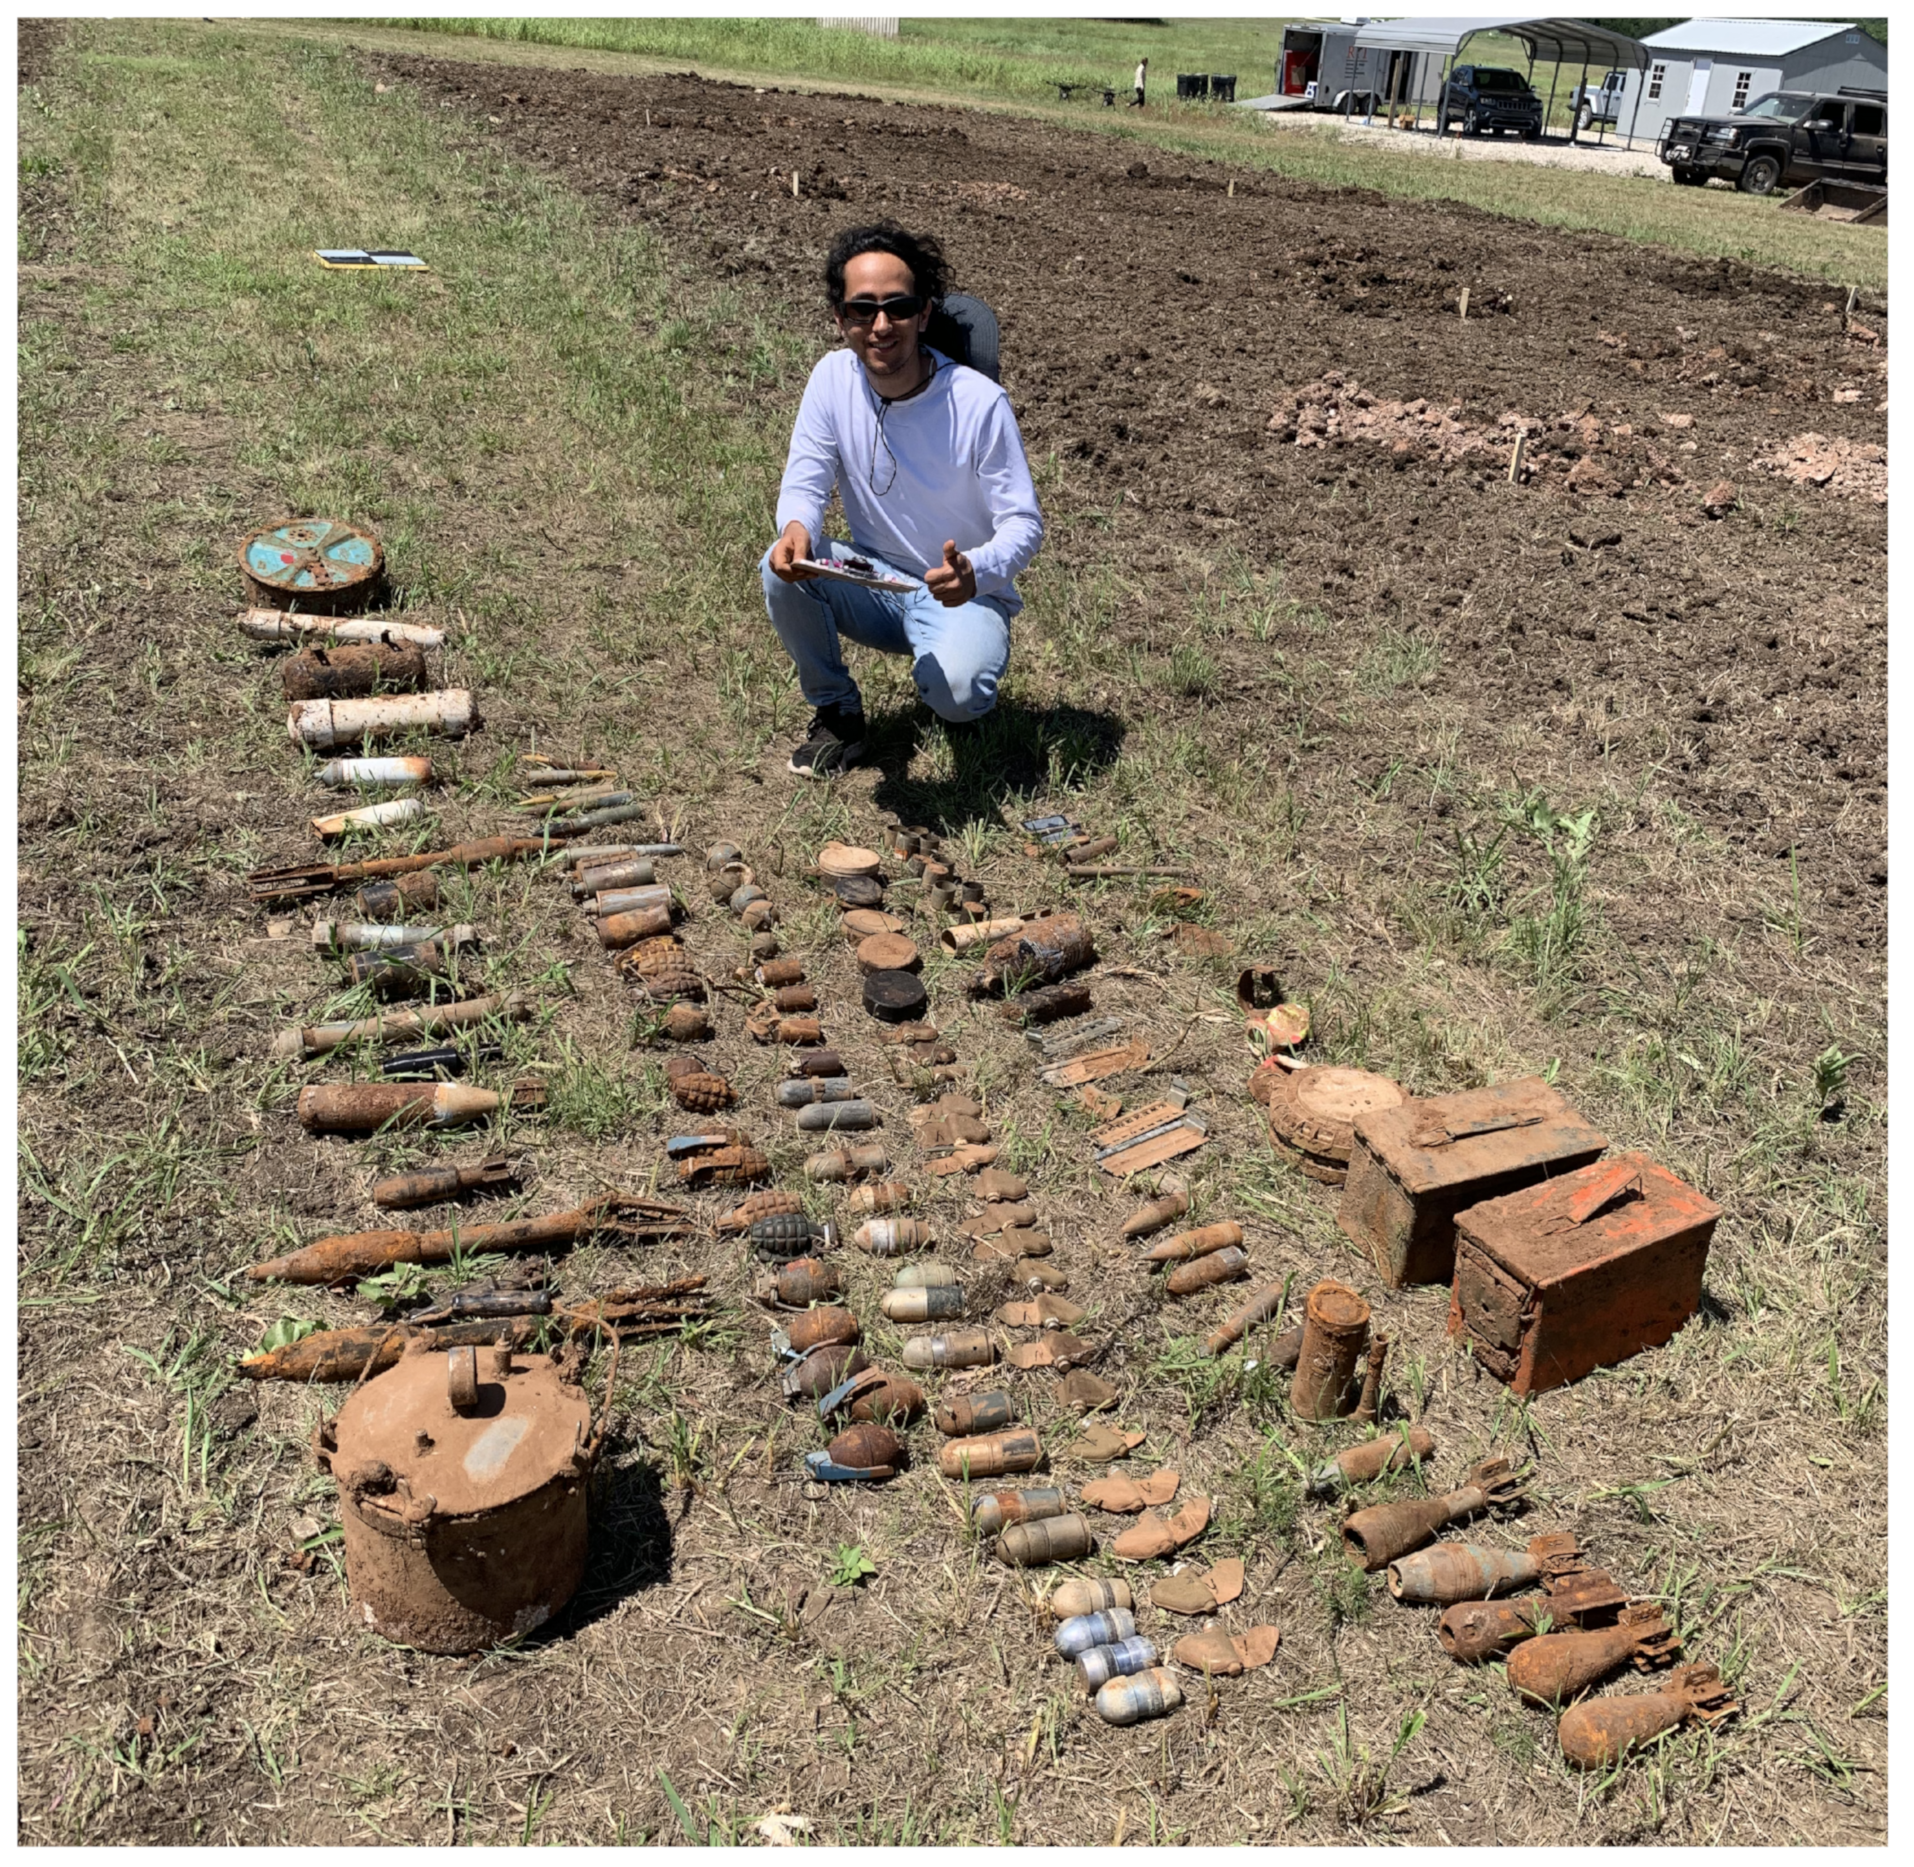
Figure 6.
Line Plots of each survey line demonstrating responses in millivolts (mV) for each channel, with respect to sample indices. (a) Line plot of survey line A. (b) Line plot of survey line B. (c) Line plot of survey line C. (d) Line plot of survey line D. (e) Line plot of survey line E. (f) Line plot of survey line F.
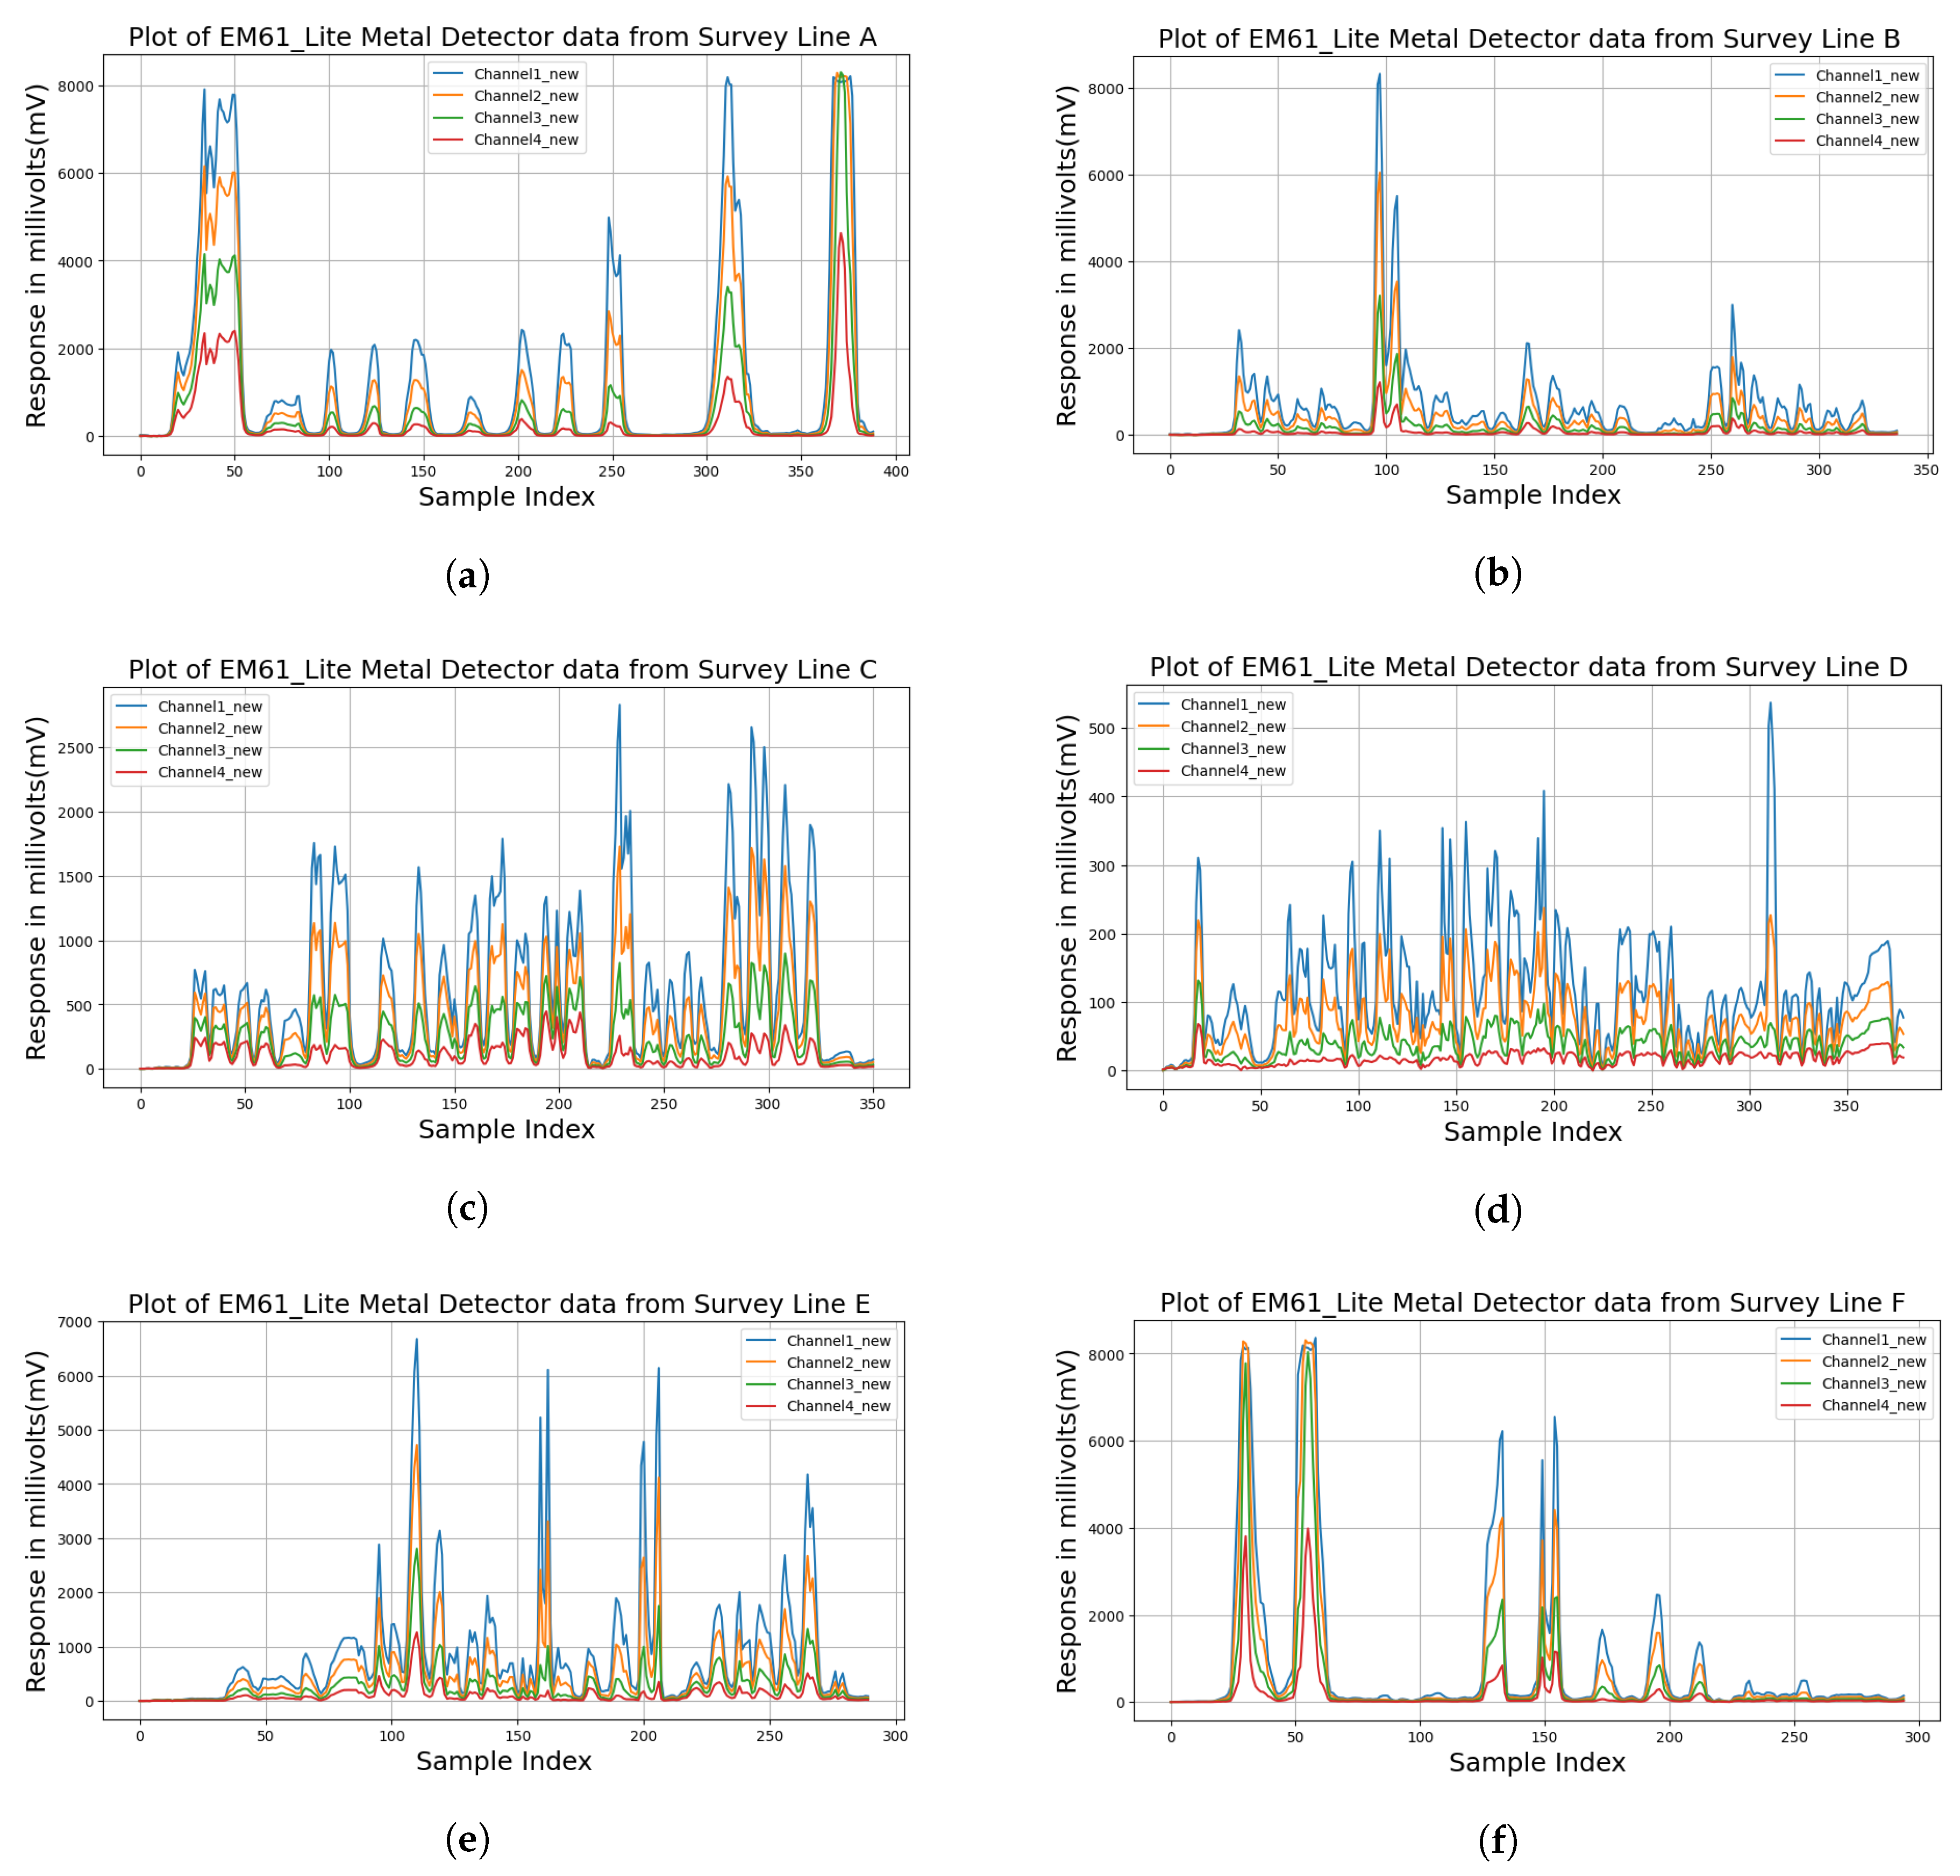
Figure 7.
Detection heat map of the entire test site showing detected anomalies along survey lines A to F (from top to bottom shown as light white stripes). The mine position labeled A1 is in the east direction while that labeled A25 is in the west direction.
Figure 7.
Detection heat map of the entire test site showing detected anomalies along survey lines A to F (from top to bottom shown as light white stripes). The mine position labeled A1 is in the east direction while that labeled A25 is in the west direction.
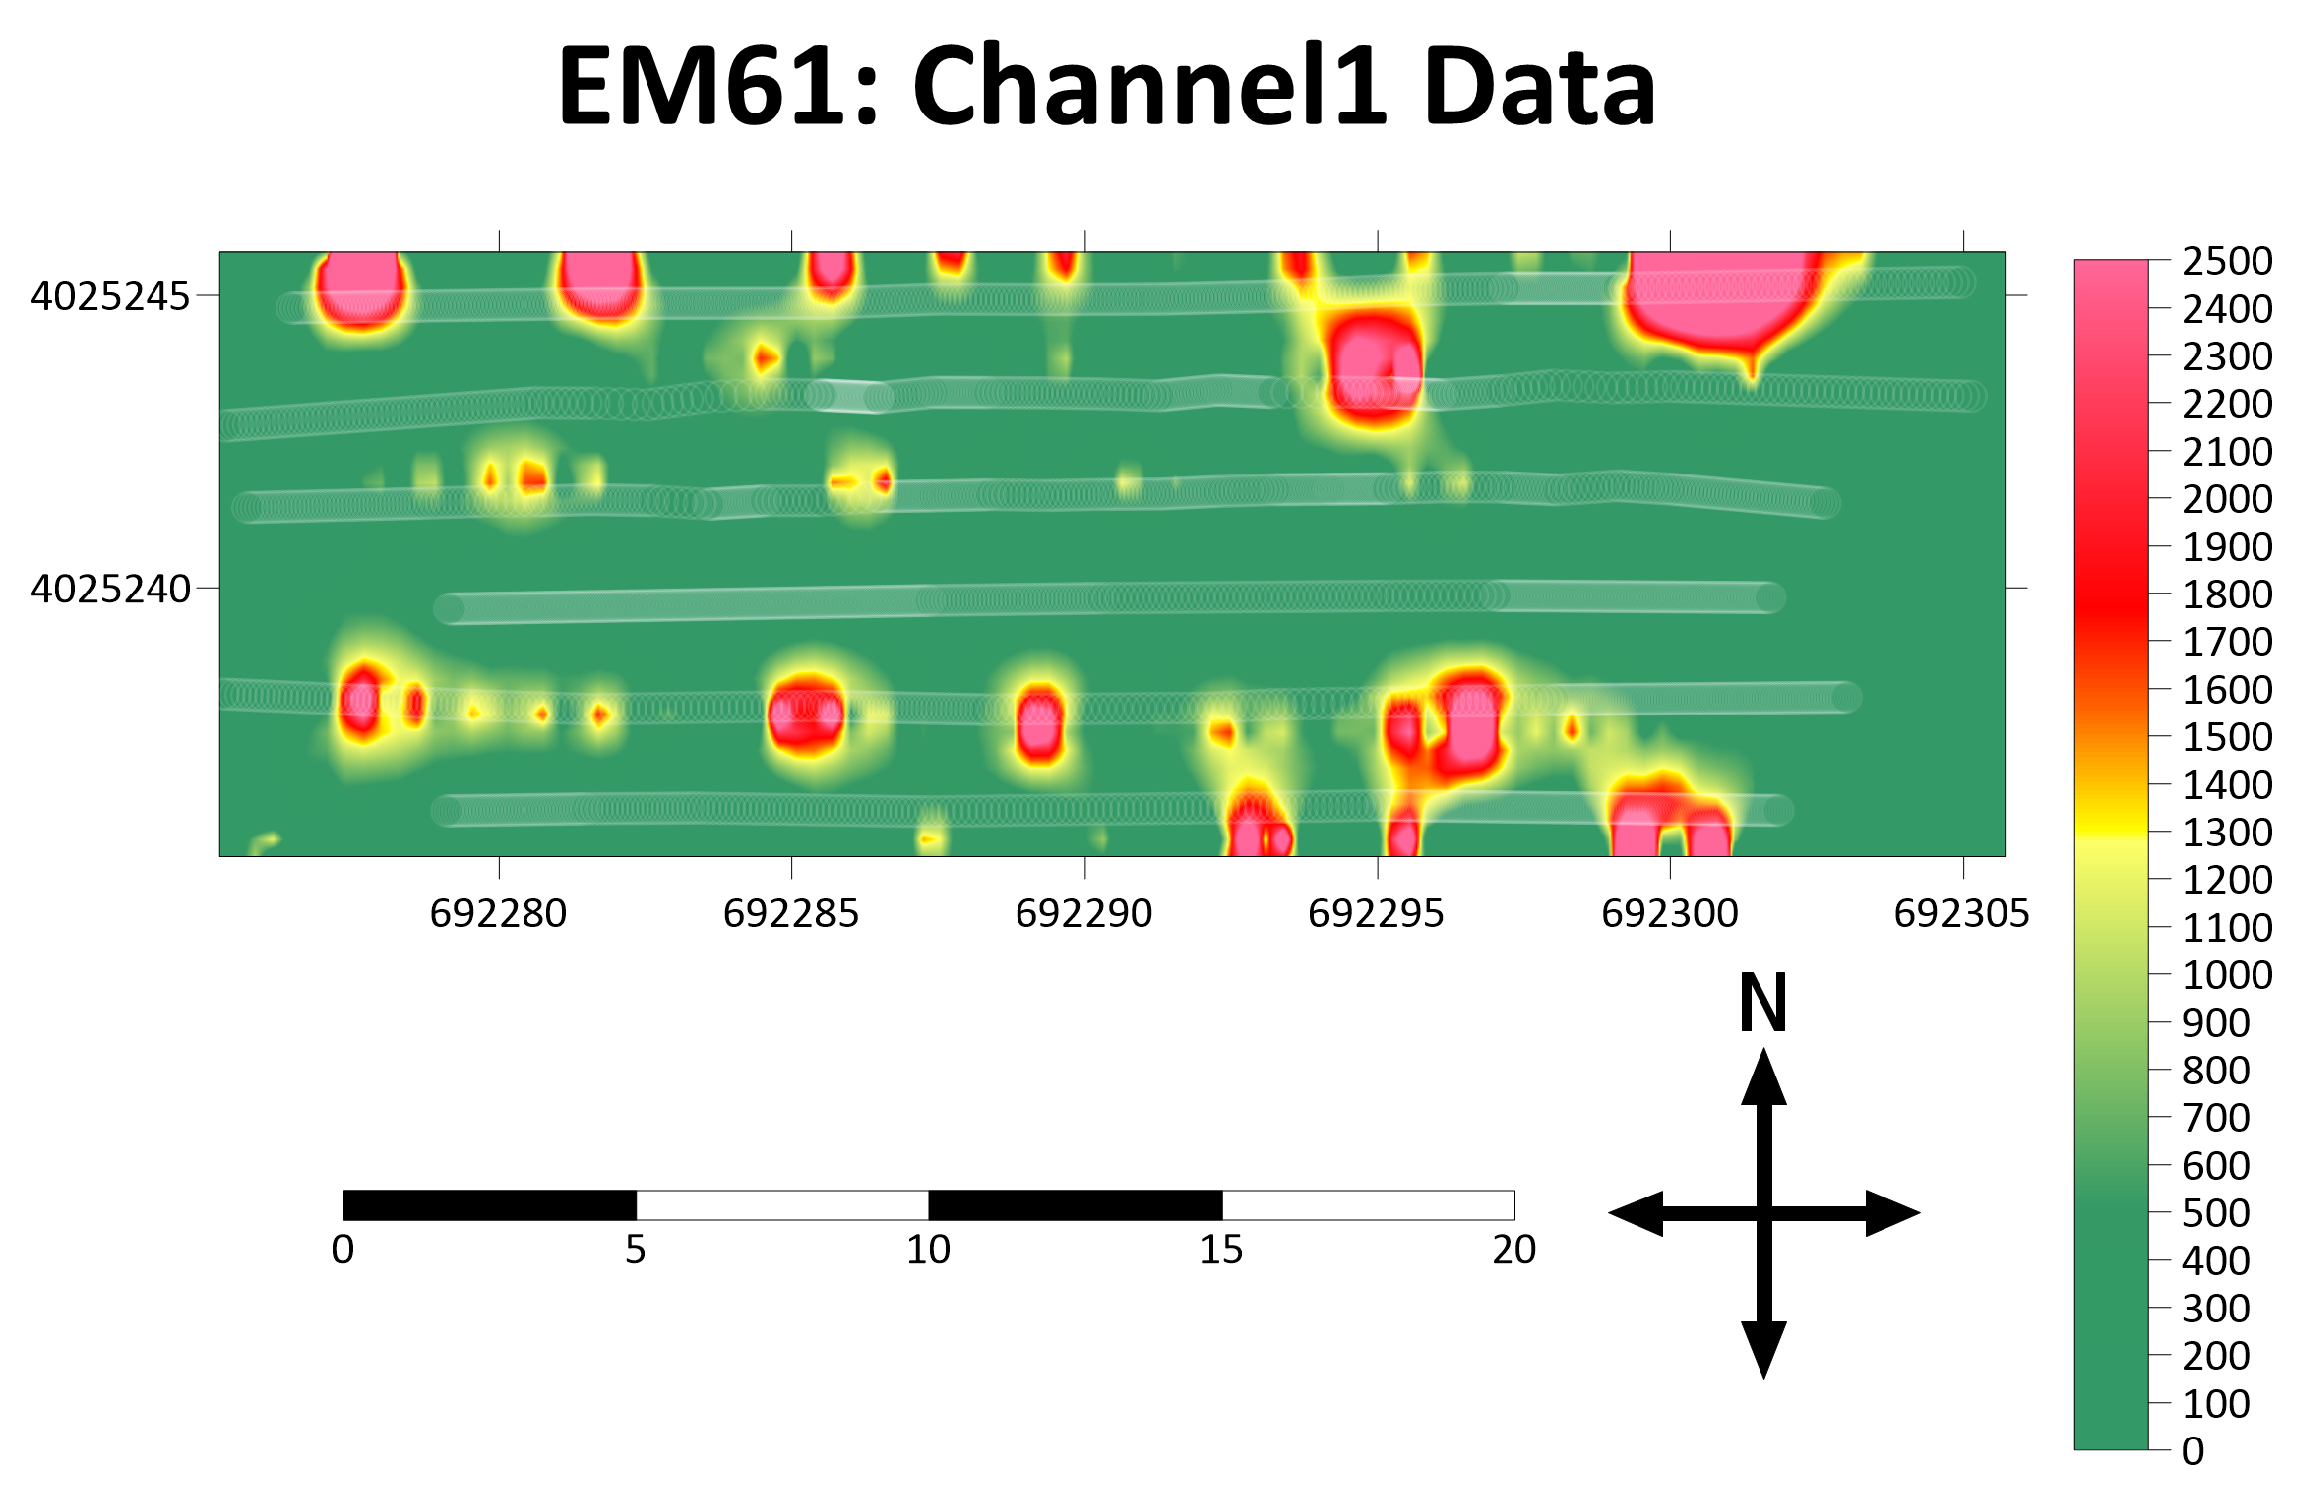
Figure 8.
Heatmap of the channel 1 data with varying thresholds. (a) Heatmap with a higher threshold, missing the significant amount of targets. (b) Heatmap with a lower threshold, showing the whole field as contaminated, causing difficulties in detecting the exact locations of the targets.
Figure 8.
Heatmap of the channel 1 data with varying thresholds. (a) Heatmap with a higher threshold, missing the significant amount of targets. (b) Heatmap with a lower threshold, showing the whole field as contaminated, causing difficulties in detecting the exact locations of the targets.
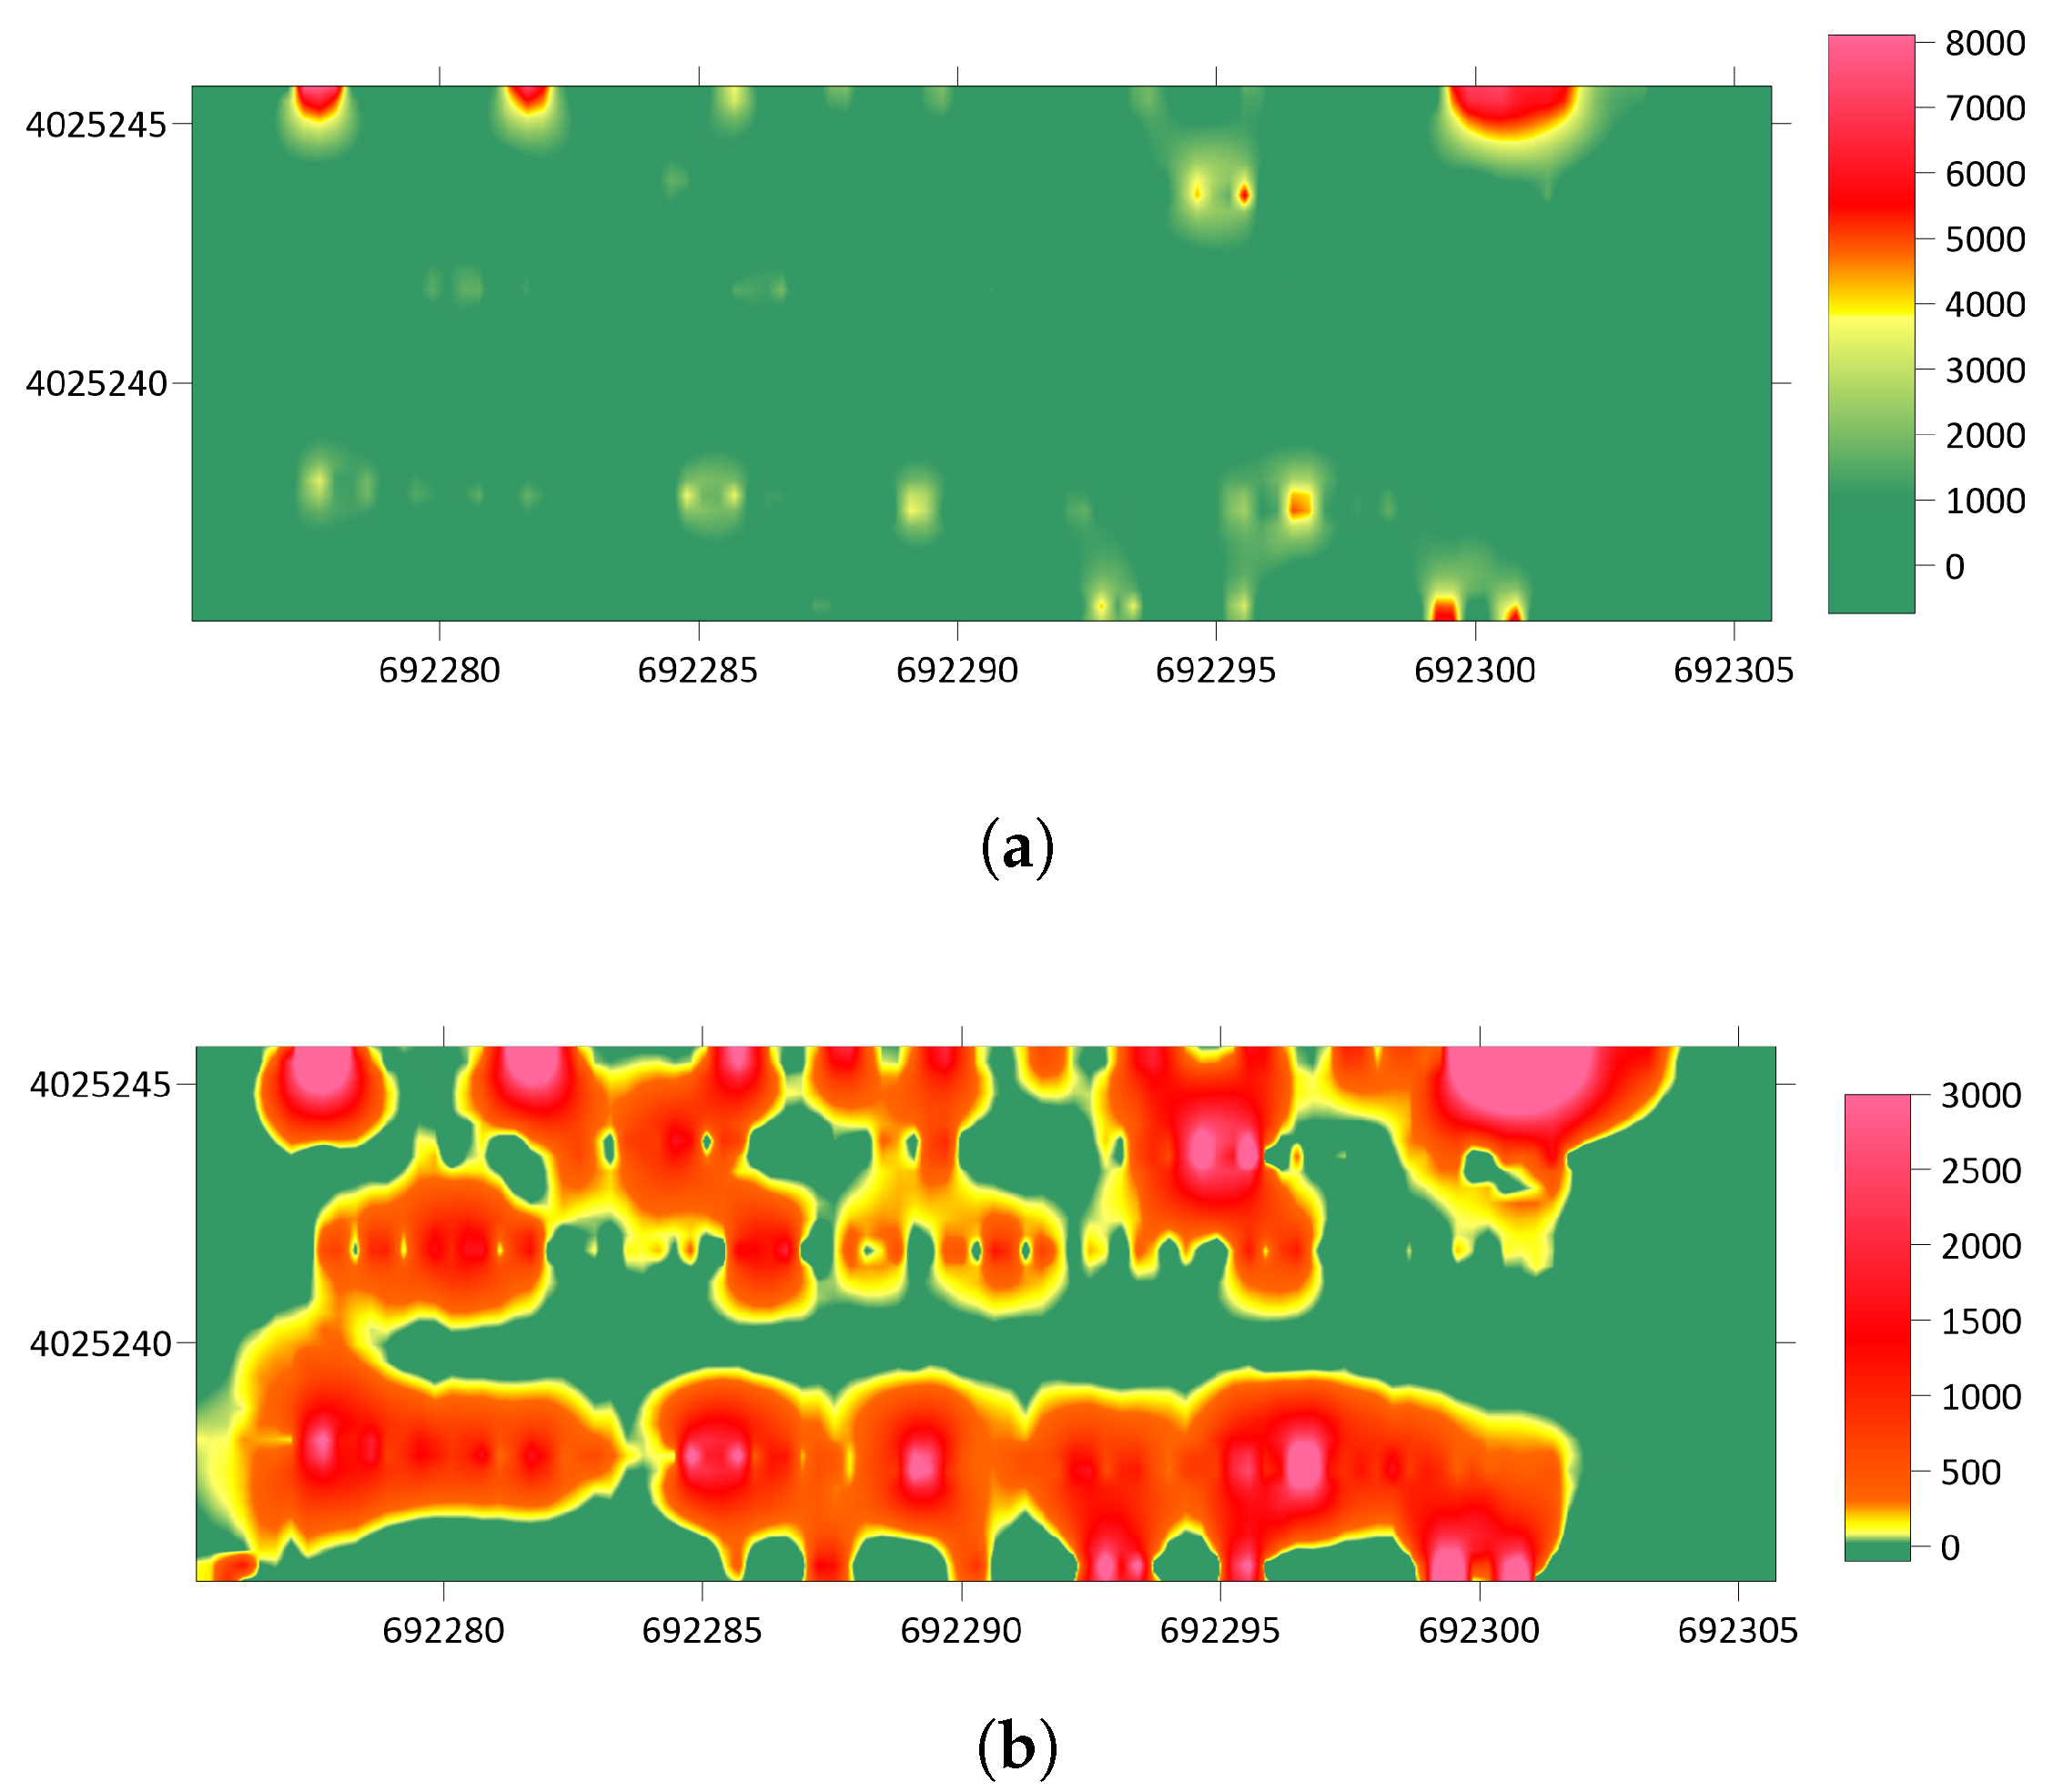
Figure 9.
Heat map of the test site showing detected anomalies and survey lines A to F from top to bottom (shown as white stripes). Landmine location A1 is in the east direction while landmine A25 is in the west direction. Results shown are after normalizing each survey line of the data.
Figure 9.
Heat map of the test site showing detected anomalies and survey lines A to F from top to bottom (shown as white stripes). Landmine location A1 is in the east direction while landmine A25 is in the west direction. Results shown are after normalizing each survey line of the data.
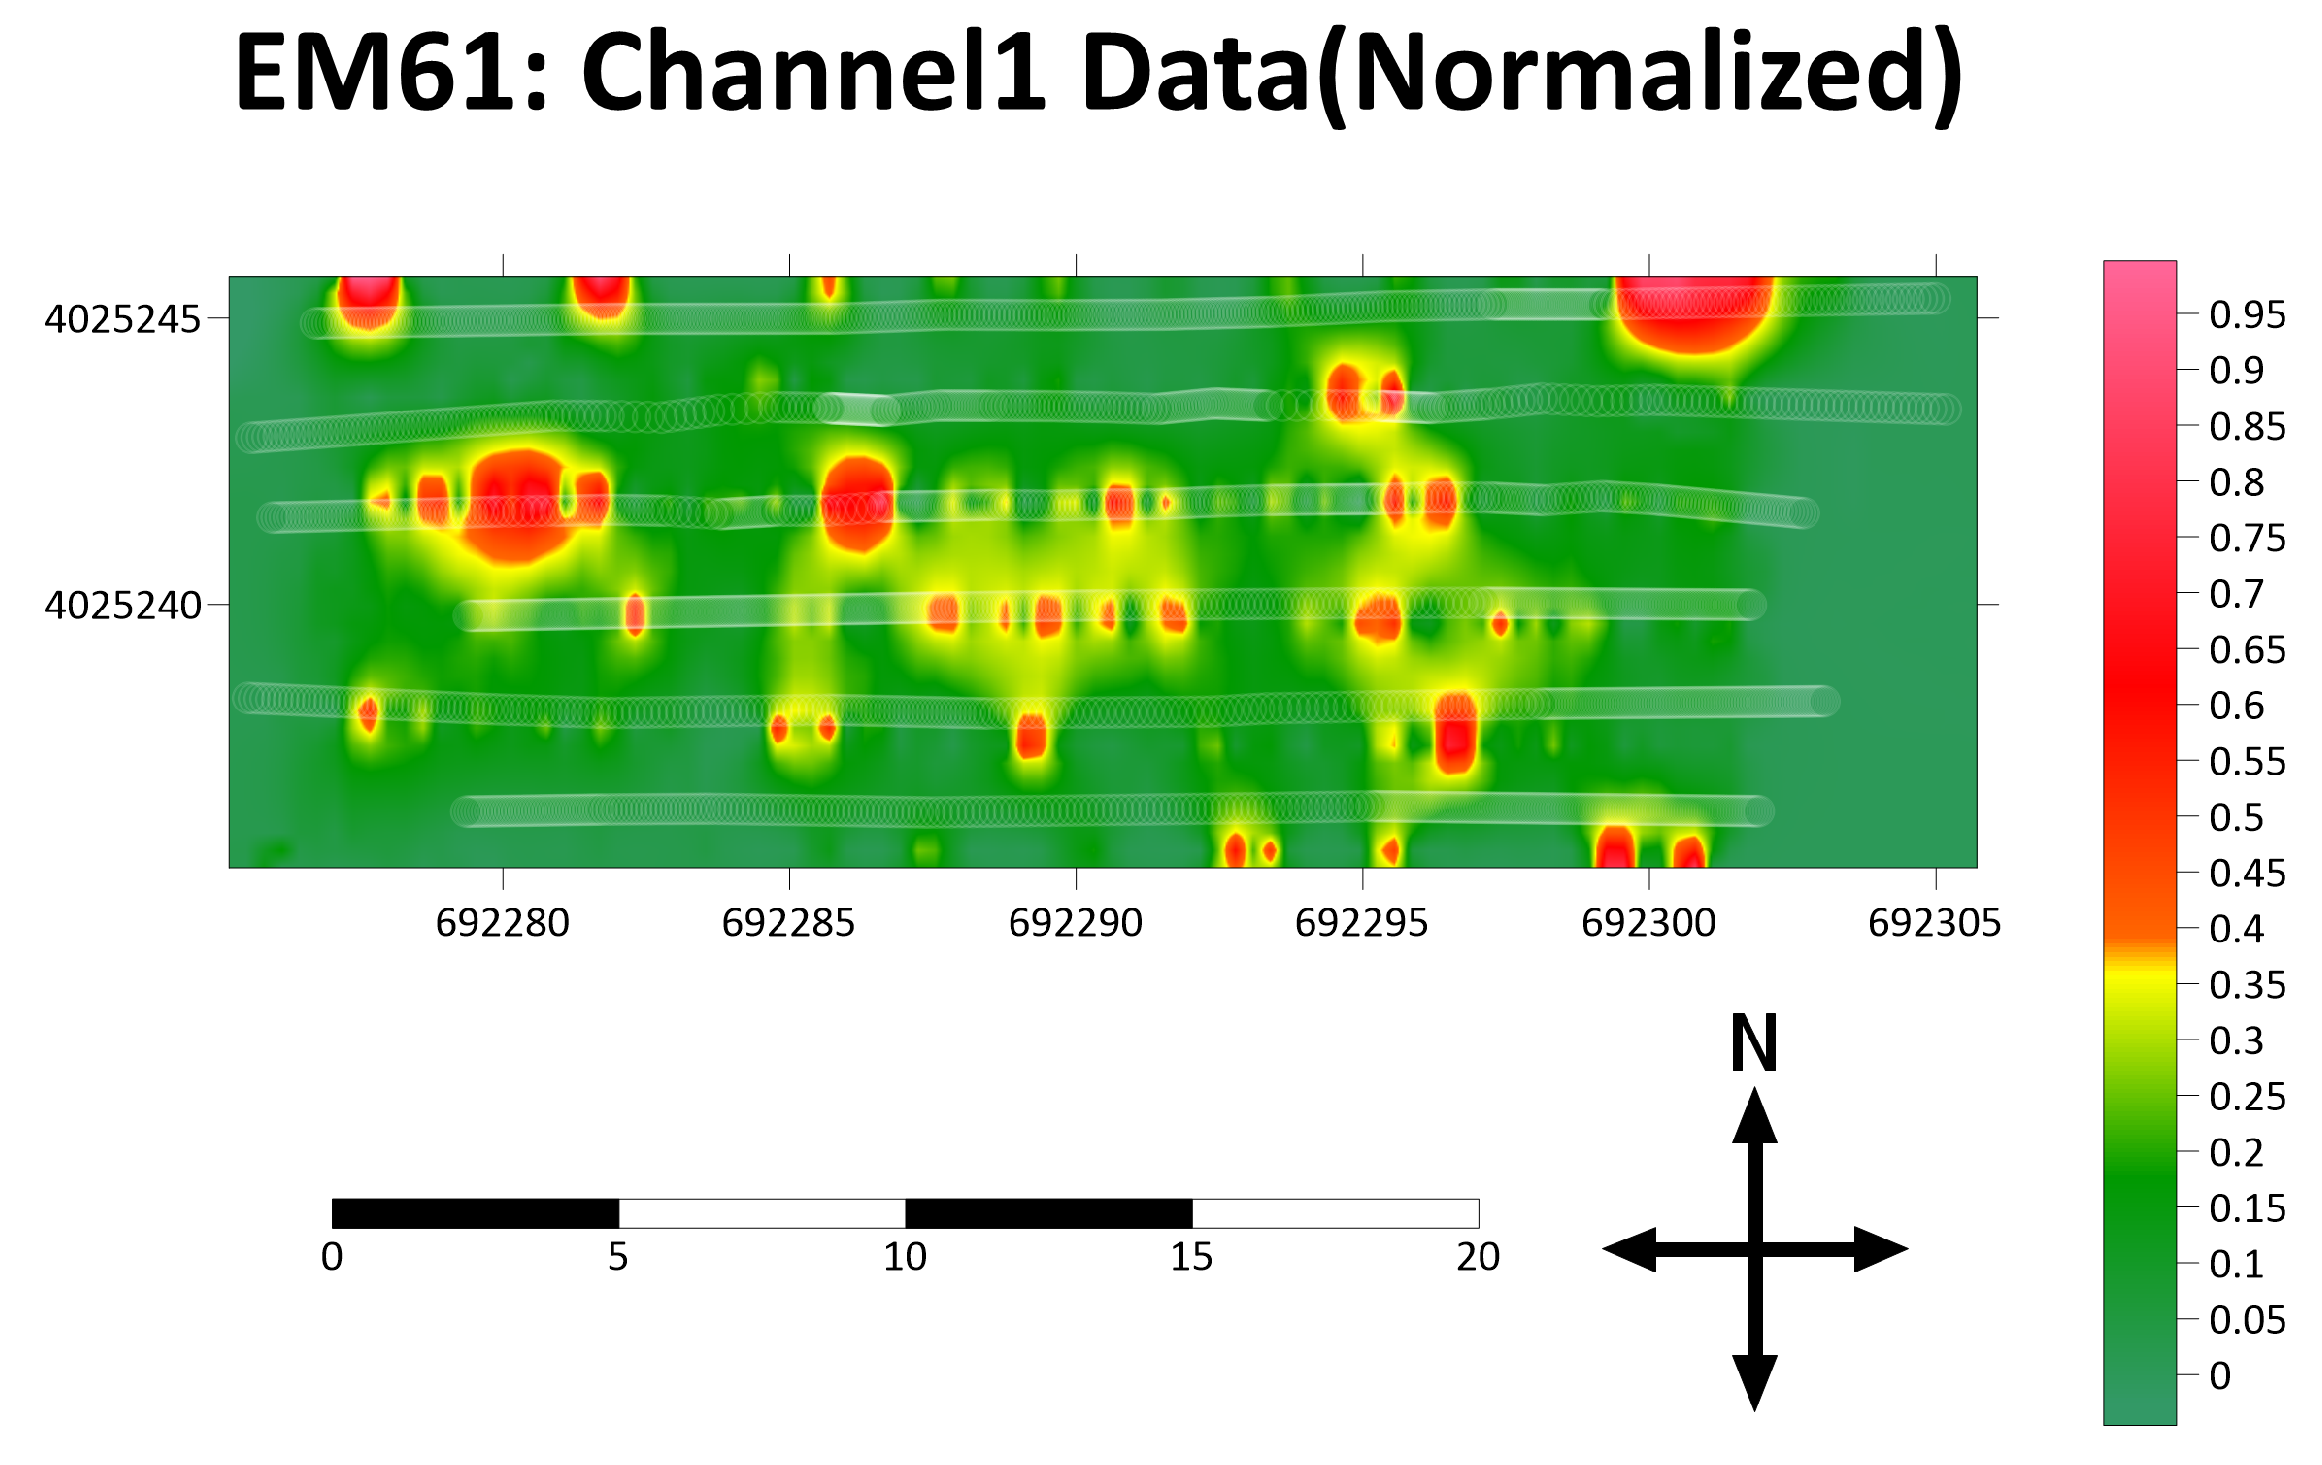
Figure 10.
(a) 3D Plot of the whole survey area obtained from channel 1 data (original) of the EM61 Lite. (b) 3D Plot of the same area using channel 1 data of the EM61 Lite after separately normalizing and concatenating suvey lines.
Figure 10.
(a) 3D Plot of the whole survey area obtained from channel 1 data (original) of the EM61 Lite. (b) 3D Plot of the same area using channel 1 data of the EM61 Lite after separately normalizing and concatenating suvey lines.
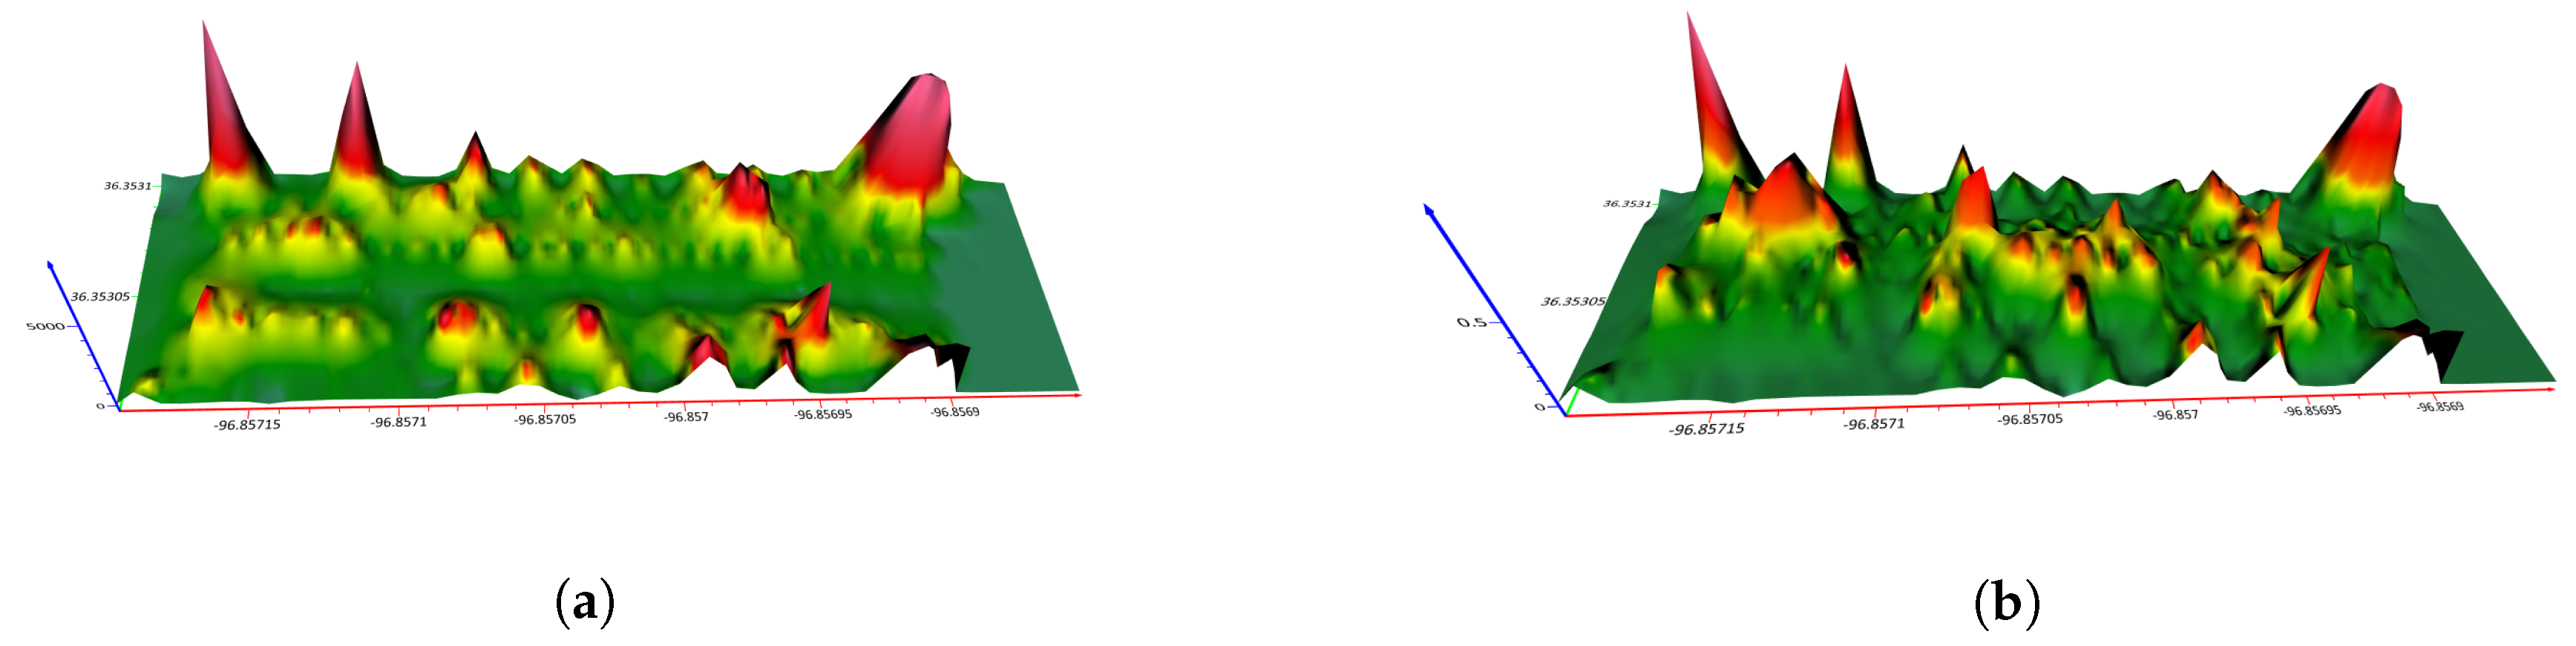
Table 1.
Comparing detection results from three metal detectors in terms of number of target objects detected successfully and time required for detection.
Table 1.
Comparing detection results from three metal detectors in terms of number of target objects detected successfully and time required for detection.
| ML-3S | CTX 3030 | EM61 Lite | |
|---|---|---|---|
| Total Metallic Mines Detected | 91/119 | 114/119 | 114/119 |
| Time Taken to Detect | 179 minutes | 193 minutes | 17 minutes |
| Detection Accuracy | 76.47% | 95.79% | 95.79% |
| Operational Altitude | Direct contact with ground or minimal clearance | Direct contact with ground or minimal clearance | 30-100 cm above ground (suitable for vegetation or uneven terrain) |
Disclaimer/Publisher’s Note: The statements, opinions and data contained in all publications are solely those of the individual author(s) and contributor(s) and not of MDPI and/or the editor(s). MDPI and/or the editor(s) disclaim responsibility for any injury to people or property resulting from any ideas, methods, instructions or products referred to in the content. |
© 2024 by the authors. Licensee MDPI, Basel, Switzerland. This article is an open access article distributed under the terms and conditions of the Creative Commons Attribution (CC BY) license (http://creativecommons.org/licenses/by/4.0/).
Copyright: This open access article is published under a Creative Commons CC BY 4.0 license, which permit the free download, distribution, and reuse, provided that the author and preprint are cited in any reuse.


