Submitted:
14 October 2024
Posted:
15 October 2024
You are already at the latest version
Abstract
Agricultural land in China represents a major source of nitrous oxide emissions, and as population growth and technological advancements drive agricultural intensification, these emissions are projected to increase. A thorough understanding of historical trends and future dynamics of these emissions is critical for formulating effective mitigation strategies and advancing progress toward the Sustainable Development Goals. This study quantifies nitrous oxide emissions across 31 provinces in China from 2000 to 2021, employing the IPCC coefficient method alongside China’s provincial greenhouse gas inventory guidelines. The spatiotemporal evolution of emission intensities is examined, with the STIRPAT model employed to assess the influence of population, technological development, economic growth, and energy structure. The findings confirm that agricultural land remains the primary source of nitrous oxide emissions, with significantly higher levels observed in eastern coastal regions compared to western inland areas. Implementing targeted mitigation strategies, such as enhanced agricultural and manure management practices and region-specific interventions, is imperative to effectively curb the rising emission trends.
Keywords:
Nitrous oxide from agricultural sources
; IPCC coefficient method
; Spatiotemporal evolution
; Scenario forecasting
1. Introduction
Effective management of non-CO2 greenhouse gas emissions from agricultural activities is crucial for China to fulfill its climate commitments [1]. Nitrous oxide (N2O), the third largest greenhouse gas after carbon dioxide (CO2) and methane (CH4), has a global warming potential 265 times that of CO2 and also depletes the ozone layer [2]. N2O has an atmospheric lifetime of 114 years [3], and its concentration has been steadily rising since 1750, directly contributing approximately 0.1°C to global warming [4]. As of 2021, atmospheric N2O concentrations have reached 332 ppb, exceeding the estimates by the Intergovernmental Panel on Climate Change (IPCC) since 2009.
Agricultural activities are the primary source of N2O emissions, with the use of nitrogen fertilizers significantly driving the increase in anthropogenic emissions. The global average nitrogen fertilizer uses per capita rose from approximately 3 kg in 1960 to 15 kg in 2018 [5]. Compared to the pre-industrial era, global soil N2O emissions increased by 59% over the past decade, with agricultural soil accounting for 82% of this increase [6]. In China, the growth in agricultural N2O emissions has been particularly pronounced, rising from 889.6 Gg N2O/year in 1980 to 2295.0 Gg/year in 2020 [7]. While the Chinese government emphasized support for emissions reduction and active participation in global climate governance in the 2024 government work report, current national policies remain focused on CO2 emissions, lacking regulatory measures for non-CO2 greenhouse gases, which may undermine overall mitigation efforts [8]. Given that agricultural N2O emissions are a critical driver of climate change [9], accurately assessing current emissions and future trends in this sector is essential for achieving China’s “carbon peaking” and “carbon neutrality” goals.
Numerous scholars have developed various techniques and methodologies to mitigate non-CO₂ greenhouse gas emissions from agricultural activities, employing approaches such as accounting, reduction strategies, and scenario simulations. Among the current methods for greenhouse gas emission inventories, the approach proposed by the Inter-governmental Panel on Climate Change (IPCC), which is adaptable across diverse regions, has gained widespread international adoption. In comparison, methodologies like Life Cycle Assessment (LCA) [10,11], meta-analysis [12,13], and Computable General Equilibrium (CGE) models [14,15], are less frequently utilized. Moreover, major international organizations and databases, including the World Bank (WB), the World Resources Institute (WRI), and the Emissions Database for Global Atmospheric Research (EDGAR), have also adopted the IPCC emission factor method for compiling inventories of non-CO₂ greenhouse gas emissions from agricultural sources [16,17].
To prevent global warming from exceeding 1.5°C, efforts to reduce non-CO₂ emissions in agriculture must primarily focus on methane (CH₄) and nitrous oxide (N₂O), which collectively contribute approximately 10-12% of total anthropogenic greenhouse gas emissions [18]. This study systematically estimates total emissions and analyzes the key factors influencing them, with a particular emphasis on nitrous oxide (N₂O). By exploring future emission scenarios of nitrous oxide, a critical framework is established for guiding future mitigation strategies. Limiting climate change to 1.5°C necessitates significant reductions in all greenhouse gas emissions, including both CO₂ and non-CO₂ gases. Research suggests that without comprehensive efforts to reduce non-CO₂ emissions, the timeline for achieving net-zero CO₂ emissions would need to be advanced by approximately 20 years. Consequently, climate change mitigation strategies must account for the interactions among different greenhouse gases and implement integrated measures targeting all emission types [19]. Studies suggest that a remaining carbon budget (RCB) aligned with the 1.5°C target would lead to a 22% re-duction in nitrous oxide emissions between 2020 and 2050 [20]. For example, in China, cost-effective mitigation scenarios estimate that by 2030, the reduction potential for methane, fluorinated gases, and nitrous oxide will reach 35%, 30%, and 40%, respectively, compared to 2015 levels. Mitigation measures, such as straw incorporation [21], converting cropland to forests or grasslands [22], and promoting energy crop production [23] have been shown to effectively offset agricultural greenhouse gas emissions, including nitrous oxide. Additionally, implementing a carbon tax could further reduce nitrous oxide emissions; however, its effectiveness shows little variation between high and low tax rates.
Overall, integrated mitigation strategies have proven more effective than single approaches in reducing greenhouse gas emissions. Given the substantial impact of nitrous oxide on global warming and climate change, such comprehensive strategies are essential to effectively address the complexities associated with agricultural nitrous oxide emissions.
This study employs the IPCC inventory method to formulate future development scenarios in accordance with regional characteristics, analyze the variations and influencing factors of agricultural N2O emissions from 2000 to 2021, and simulate future emission scenarios to furnish data support for emission reduction strategies.
2. Methodology and Data
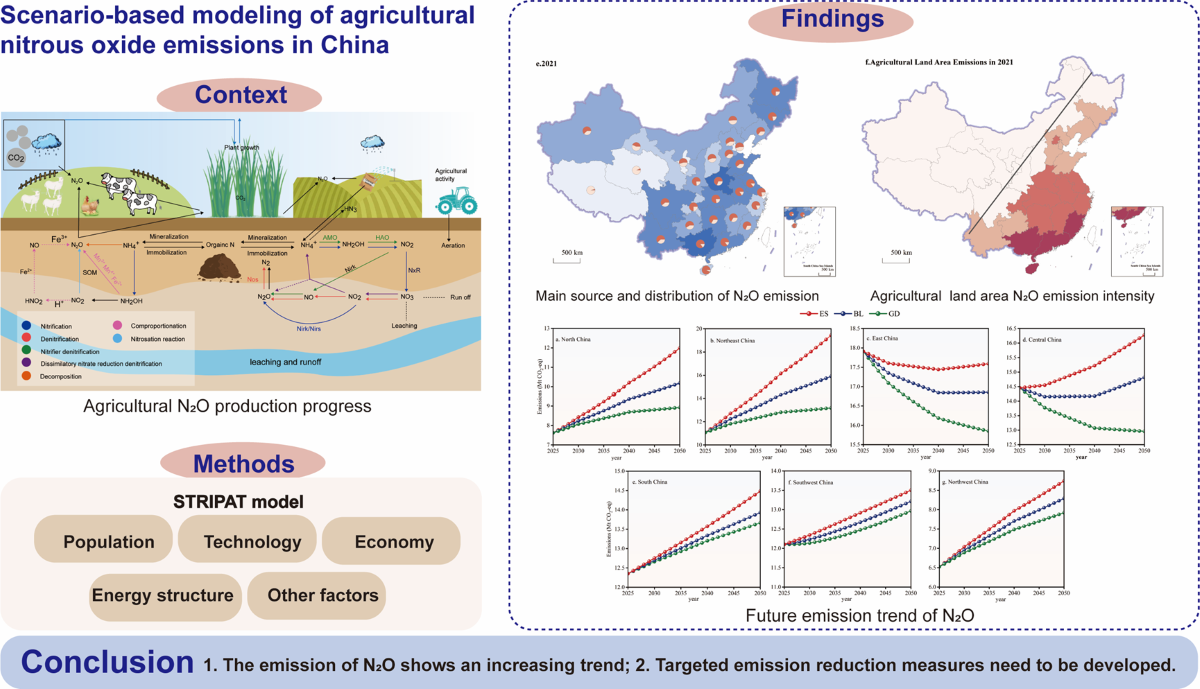
This paper aims to analyze the trend of nitrous oxide emissions from China’s agricultural sector during the period from 2000 to 2021 and calculate the N2O emissions from agricultural land and animal manure management with the boundaries set (Figure 1). The N2O emissions from agricultural land arise from both direct and indirect emissions. Direct emissions encompass three aspects: Firstly, emissions resulting from chemical fertilizers (nitrogen fertilizers, phosphate fertilizers, potash fertilizers, compound fertilizers); sec-ondly, manure discharge; and thirdly, the emission of crop residues. Indirect emissions are mainly attributed to two pathways: nitrogen oxides and ammonia from fertilizers applied to soils and livestock and poultry manure, which generate N2O emissions through the process of nitrogen deposition in the atmosphere; nitrogen in the soil enters the water body via leaching or runoff to form N2O. This process involves nitrogen cycle mechanisms, including ammonia volatilization, nitrogen migration, and conversion, which in turn influence the level of indirect nitrous oxide emissions. In animal manure management, N2O emissions are mainly caused by the storage and treatment of organic matter in manure, and emissions from nitrogen conversion during nitrification or denitrification.
2.1. Methodology
In this study, the emission factor methodology of the International Panel on Climate Change (IPCC) was employed to assess the total nitrous oxide emissions from agricultural activities in each provincial administrative region. The selection of the emission factors was conducted in accordance with the 2019 revised edition of the IPCC 2006 Guidelines for the Preparation of Greenhouse Gas Emission Inventories and the relevant data as provided in the Guidelines for the Preparation of Provincial Greenhouse Gas Emission Inventories (Trial Version) issued by the National Development and Reform Commission. Interventionary studies involving animals or humans, and other studies that require ethical approval, must list the authority that provided approval and the corresponding ethical approval code.
where, represents the total volume of nitrous oxide emissions stemming from agricultural sources; represents direct nitrous oxide emissions from crop farming land; represents indirect emissions of nitrous oxide caused by atmospheric nitrogen deposition; indirect emissions of nitrous oxide from dissolution runoff; represents managing nitrous oxide emissions for livestock manure. In this paper, the natural breakpoint method was used to classify and analyze the nitrous oxide emissions from agricultural sources in various provinces.
2.2. Accounting Methods for N2O Emissions from Agricultural Land
In agriculture, nitrous oxide emissions can be divided into two categories: direct and indirect.
2.2.1. Direct Emissions
Mainly from nitrogenous fertilizers applied on agricultural land, such as chemical nitrogen fertilizers and organic fertilizers (manure fertilizer and crop straw). Considering that the application of chemical fertilizers is significantly higher than that of organic fertilizers [24], and data on the use of the latter are often difficult to obtain accurately, the impact of chemical fertilizers and straw returning is mainly taken into account when assessing direct N2O emissions from agricultural land.
where, represents direct nitrous oxide emissions from agricultural land; indicates the amount of chemical fertilizer applied (nitrogen fertilizer and compound fertilizer); indicates the nitrogen input of straw returning (aboveground straw returning nitrogen and underground root nitrogen); indicates the direct N2O emission factors from agricultural land (Table 1)
Among them, the formula for calculating nitrogen input from straw returning is as follows equation (3).
where: represents nitrogen for straw returning; represents the yield of the th crop in terms of grain; represents the crop economic coefficient; represents crop straw returning rate; represents the percentage of nitrogen in the crop straw; represents the root-shoot ratio of crops. Based on the data of the National Bureau of Statistics, this paper selects 10 major crops, and the specific parameters are derived from the Guidelines for the Preparation of Provincial Greenhouse Gas Inventories (Trial) issued by the National Development and Reform Commission (NDRC) (Table 2).
2.2.2. Indirect Emissions
The formula for calculating N2O emissions caused by atmospheric nitrogen deposition is as follows in equation (4).
where represents represents the nitrogen content in poultry and livestock manure, and represents the nitrogen input of the farmland soil. According to the Guidelines for the Preparation of Provincial Greenhouse Gas Inventories (Trial) and and according to Guidelines for the preparation of provincial greenhouse gas inventories (Trial), the recommended values for nitrogen volatilization rates are 20% and 10%, respectively, and the corresponding emission factors are set at 0.01.
The formula for calculating N2O emissions caused by leaching runoff is as follows in equation (5).
where: indicates the indirect emission of N2O caused by leaching runoff; The quantity of nitrogen lost by nitrogen leaching and runoff accounted for 20% of the nitrogen input to agricultural land. The nitrous oxide emission factor caused by leaching runoff was 0.0075. Refer to the Guidelines for the Compilation of Provincial Greenhouse Gas Inventories (Trial) issued by the National Development and Reform Commission for specific parameters.
2.3. Accounting Methods for N2O Emissions from Animal Manure
Nitrous oxide emissions from livestock manure management include nitrous oxide from storage and treatment prior to soil application. Equation (6) is as follows:
Among them, the formula for calculating nitrogen input from straw returning is as follows equation (3).
where: represents managing nitrous oxide emissions for animal manure; represents managing emission factors for livestock and poultry manure in category ; represents the number of animals in livestock and poultry category , and the specific parameters are shown in Table 3.
2.4. Accounting Methods for the Intensity of Non-Carbon Dioxide Greenhouse Gas Emissions from Agricultural Activities
In this paper, the intensity of nitrous oxide emissions is assessed by calculating the emissions intensity concerning agricultural value added () and agricultural land area () on a per-unit basis. It is calculated as follows:
where: and represents the emission intensity per unit of agricultural added value (t CO2-eq/10,000 yuan) and the emission intensity per unit of agricultural land area (kg CO2-eq/km2) of region j, respectively. is nitrous oxide emissions from agricultural sources; is the agricultural value added of region j; is the area of farmland (arable land plus pasture area) in area j. This study used the natural breakpoint method to classify the nitrous oxide emission intensity of agricultural sources in various provinces of China (including municipalities and autonomous regions).
2.5. Nitrous Oxide Emission Scenario Prediction Model from Agricultural Activities
This study employs a scalable stochastic environmental impact assessment (STIRPAT) model to conduct future projections of nitrous oxide emissions by evaluating the interaction among population, economy, technology, and environment. The STIRPAT model is fundamentally structured as follows:
In the aforementioned formula, , , , and represent environmental pressure, demographics, affluence, and technological level. refers to the constant term of the model, and , , and are, respectively, the elasticity of the impact of population, income, and technology on environmental pressures, representing the model’s error term. On this basis, to profoundly analyze the factors affecting N2O emissions from agricultural activities, the logarithmic processing of both sides of the model was conducted to obtain:
where , , , , , and represent the coefficients of each index; denotes Demographics; represents GDP per capita; denotes the total power of agricultural machinery, indicating the degree of agricultural mechanization; represents the effective irrigation area of agriculture, reflecting the status and stability of agricultural production and operation; represents the gross agricultural output value, reflecting the scale of rural economic development; represents the size of the rural population and demonstrates the level of urbanization.
To verify the Kuznets curve (EKC) of China’s agricultural nitrous oxide environment, this study incorporated the secondary and tertiary terms of per capita gross domestic product (GDP) into the analysis model to investigate whether there exists a “U” or “N” shaped relationship between per capita GDP and nitrous oxide emissions. The model is presented as follows:
This study employed the methods of literature review, policy document review, and existing data trend analysis to construct three distinct levels of change: low, medium, and high (Table 4). Data from 2000 to 2021 were selected and applied to the STIRPAT model for in-depth analysis. Based on the unique attributes of different regions, a series of scenarios were developed, and a baseline model was constructed to predict the potential trends in nitrous oxide emissions from agricultural activities in each region from 2025 to 2050.
2.6. Data
The crop yield data were sourced from various publications, including the China Statistical Yearbook, the China Agricultural Yearbook, the China Animal Husbandry Yearbook, and local statistical yearbooks. Additionally, the areas of cultivated land and pastureland were obtained from the China Rural Statistical Yearbook, the China Land and Resources Yearbook, and the China Environment Yearbook.
3. Analysis of Results
3.1. Evolution of Spatiotemporal Patterns of Nitrous Oxide Emissions from Agricultural Sources
Agricultural land is the dominant source of nitrous oxide emissions (Figure 2). In 2021, national nitrous oxide emissions totaled 77.87 Mt CO2-eq, with agricultural land contributing 55.13 Mt CO2-eq and animal manure management 22.75 Mt CO2-eq. Of the agricultural emissions, 89.32% stemmed from chemical fertilizer application, resulting in 49.39 Mt CO2-eq. In 2007, nitrous oxide emissions from livestock activities sharply declined due to disease control measures, particularly in response to the H5N1 avian influenza outbreak, the implementation of regulatory policies such as the Measures for the Management of National Meat Reserves and the Animal Disease Quarantine Law, and severe flooding in the Huaihe River Basin. Similar environmental and health-related disruptions, including widespread flooding in 2017 and 2018 and the outbreak of African swine fever in 2019, further contributed to the significant reduction in emissions from livestock.
Temporal variation in nitrous oxide emissions from agricultural activities has been relatively stable; however, regional disparities are more evident. Emissions have decreased in highly urbanized regions such as Beijing, Tianjin, and Shanghai, where agricultural activities comprise a smaller share of land use. Conversely, emissions are rising in regions like Inner Mongolia, Jilin, Heilongjiang, Ningxia, and Xinjiang, where agricultural practices are more extensive. Regions like Tibet, Qinghai, and Ningxia, with smaller agricultural land areas and crops with lower nitrogen demand (e.g., barley, wheat, and potatoes), demonstrate lower fertilizer use and consequently lower nitrous oxide emissions.
Research manuscripts reporting large datasets that are deposited in a publicly available database should specify where the data have been deposited and provide the relevant accession numbers. If the accession numbers have not yet been obtained at the time of submission, please state that they will be provided during review. They must be provided prior to publication.
From a regional perspective (Figure 3), Eastern, Central, and Southwest China significantly contribute to nitrous oxide emissions in China. Emissions in East China have gradually declined over time, while nitrous oxide emissions in Northeast China have increased year after year, particularly in Heilongjiang. There was no alteration in the proportion of total nitrous oxide emissions in North China and Southwest China during the four time periods, but the specific emissions of each province and region varied. For instance, nitrous oxide emissions in Beijing and Tianjin in northern China have been decreasing yearly, while in Inner Mongolia, they have been rising.
In this study, five key time points (2000, 2005, 2010, 2015, and 2021) were selected to analyze the temporal and spatial evolution of N₂O emissions from agricultural sources in China, with a focus on identifying emission types and their provincial distributions.
From a spatiotemporal perspective, total agricultural N₂O emissions exhibited an initial increase, peaking at 69.99 Mt CO₂-eq in 2000 and 84.01 Mt CO₂-eq in 2015, before decreasing to 77.87 Mt CO₂-eq in 2021, reflecting an overall growth of 11.26%. High-emission regions were predominantly located in the southeast of the Yangtze River Basin, southern coastal areas, and provinces such as Henan, Guangdong, Guangxi, Shandong, and Hubei.
Regionally, East China contributed the highest emissions, accounting for 25.33% of the national total, with Jiangsu, Shandong, and Anhui leading within this region. Central China followed, with Henan responsible for 41.20% of the regional emissions, positioning it as the largest emitting province.
Temporal analysis revealed notable increases in emissions from 2000 to 2005 across central, northeastern, and southwestern China, with Inner Mongolia, Xinjiang, Ningxia, Jilin, and Heilongjiang experiencing substantial growth. By 2010, central and northeastern China continued to exhibit significant emission increases. In 2015, emissions rose across most regions, with a minor decline observed in southern China. By 2021, emissions in Northeast China had surged by 47.59% relative to 2000, while East China saw a 15.55% reduction. Although Guangdong, Guangxi, and Henan remained among the highest emitting provinces, their emissions decreased between 2015 and 2021—from 5.66 Mt CO₂-eq to 4.85 Mt CO₂-eq in Guangdong and Guangxi, a reduction of 14.31%, and from 6.6 Mt CO₂-eq to 5.69 Mt CO₂-eq in Henan, a decline of 13.79%.
3.2. Changes in the Emission Intensity of Nitrous Oxide Gas from Agricultural Sources
The analysis of N₂O emission intensity from agricultural sources is fundamental for informing environmental policy decisions. Figure 4a - 4c. depict the spatiotemporal distribution of N₂O emissions per unit of agricultural value added. In 2000, provinces such as Zhejiang, Tianjin, Xinjiang, Shaanxi, Beijing, and Gansu exhibited relatively low emission intensities, whereas a general west-to-east increasing trend was observed in other regions. The provinces of Guangxi, Tibet, and Qinghai reported the highest emission intensities, a trend that persisted throughout the period from 2000 to 2021. Despite regional disparities, national emission intensity has shown an overall annual decline, largely attributed to the intensification of animal husbandry and advances in industrialization. By 2021, Tibet, Jilin, and Qinghai remained among the provinces with the highest emission intensities, although Qinghai experienced a significant reduction of 85.06%, from 31.26 t CO₂-eq/10,000 CNY to 4.67 t CO₂-eq/10,000 CNY.
Figure 4d - 4f. further illustrate the distribution of N₂O emissions per unit of agricultural land area, revealing a clear geographical dichotomy along the “Hu Huanyong Line.” West of the line, most provinces, with the exception of Beijing, experienced modest increases in emission intensity. In contrast, eastern regions saw more substantial increases, particularly in South China, driven by rapid urbanization and the conversion of agricultural land for construction purposes. Provinces such as Fujian, Hainan, Guangdong, and Guangxi exhibited the highest intensities. In western regions, emission intensity remained below 3.68 kg CO₂-eq/km², whereas in the east, values reached up to 24.90 kg CO₂-eq/km². This east-west disparity is primarily driven by urbanization processes in the eastern provinces, where the conversion of agricultural land has led to a concentration of emissions relative to the remaining land.
From 2000 to 2021, nitrous oxide emission intensity per unit of agricultural added value declined across all provinces (Figure 5a). In Jilin Province, the intensity initially decreased by 5.33 t CO2-eq/10,000 CNY, followed by a modest increase of 0.46 t CO2-eq/10,000 CNY. While East China experienced simultaneous reductions in both emissions and agricultural added value intensity, other regions exhibited rising emissions despite declining intensity. For instance, emissions in Northwest China increased by 59.37%, while intensity dropped by 45.70 t CO2-eq/10,000 CNY. Similarly, emissions in Southwest China rose by 10.68%, accompanied by a reduction in intensity of 44.64 t CO2-eq/10,000 CNY. Tibet exhibited the highest emission intensity nationwide, largely due to its animal husbandry-based agricultural practices and unique geographical and climatic conditions, which result in lower agricultural productivity and higher emission intensity.
Figure 5b illustrates the variation in nitrous oxide emission intensity per unit of agricultural land across provinces. Between 2000 and 2021, Shanghai showed the largest decrease in emission intensity per unit of cultivated land, with a reduction of 4.67 kg CO2-eq/km², reflecting an average annual decline of 1.85%. This trend is mainly attributed to the significant reduction in cultivated land area. Except for East China, all regions demonstrated a general increase in emission intensity per unit of farmland.
3.3. Nitrous Oxide Emission Scenario Projection from Agricultural Sources
This study applies the STIRPAT model to forecast and analyze the peak of N₂O emissions resulting from agricultural activities across 31 provinces in China. Initially, the variables were standardized, followed by a multicollinearity test, which revealed a variance inflation factor (VIF) exceeding 10, indicating significant multicollinearity in the dataset. Additionally, the p-values for each region passed the 1% significance threshold based on the Hausman test, which supported the selection of a fixed-effects ridge regression model. In total, 682 observations were included in the analysis, with the regression results of the STIRPAT model presented in Table 5.
Population growth in the southern, southwestern, and northwestern regions has significantly contributed to N₂O emissions from agricultural sources. However, in Northeast China, while the population increase led to a reduction in emissions, rural population changes had no significant effect. Additionally, increased per capita income was associated with a reduction in agricultural N₂O emissions in North, East, South, and Northwest China, but had no significant impact in other regions.
Agricultural mechanization exacerbated N₂O emissions in North, Northeast, East, South, and Southwest China, while it suppressed emissions in Central China and had no notable effect in Northwest China. The expansion of effective irrigation contributed significantly to N₂O emissions across all regions except Central China, where no substantial impact was detected. Moreover, gross agricultural output consistently intensified N₂O emissions in all regions except Southwest China, where no significant effect was observed.
By incorporating quadratic and cubic terms of per capita GDP into the STIRPAT model, this study confirms the presence of an Environmental Kuznets Curve (EKC) relationship between N₂O emissions and per capita GDP. Regression results (Table 6) indicate that the coefficients of lnA, (lnA)², and (lnA)³ were m < 0, n > 0, and k < 0, respectively, reflecting an inverted N-shaped relationship. This suggests that N₂O emissions from agricultural activities in China peaked between 2000 and 2021 and are now in decline.
Based on prior research, notable regional disparities in N₂O emissions from agricultural sources are observed across China, with region-specific influencing factors. To account for these differences, this study developed multiple scenarios to model the drivers of N₂O emissions from agricultural activities, with the goal of predicting future emission trends. After excluding statistically insignificant variables, we established three scenarios: a baseline scenario (BL), a green development scenario (GD), and an extensive development scenario (ES) for seven regions (Table 7). Using the STIRPAT model, this study projects N₂O emissions from agricultural activities in China from 2025 to 2050 (Figure 6). Furthermore, using the STIRPAT model, this paper projects N₂O emissions from agricultural activities across various regions in China from 2025 to 2050.
The prediction results based on the STIRPAT model indicate that from 2025 to 2050, agricultural N₂O emissions in various regions of China will exhibit the following trends under different development scenarios: green development scenario < baseline scenario < extensive development scenario. In the baseline scenario, agricultural N₂O emissions in the East China region initially decline sharply, but the rate of decrease gradually slows down as influencing factors change, reaching a minimum in 2040 before starting to rise slowly. Emissions in Central China first decrease, then gradually increase, followed by a sharp rise, while emissions in other regions generally increase. In the green development scenario, the growth rate of emissions in North and Northeast China gradually falls below that in South, Southwest, and Northwest China. At the same time, the emissions in East and South China exhibit a downward trend, contrasting with the baseline scenario. Under the extensive development scenario, the emissions in East China first decrease and then increase, but the overall trend remains relatively stable, whereas emissions in other regions rise rapidly. Overall, while the emissions from agricultural activities in East China are expected to continue decreasing, emissions in other regions are projected to increase, posing significant challenges for emission reduction. To achieve effective reductions, it is essential to develop targeted strategies based on the specific characteristics of each region.
4. Conclusion and Discussion
4.1. Conclusion
This study utilizes official statistical data and methods recommended by the IPCC to calculate N₂O emissions from crop cultivation and manure management across different countries and regions. We investigated and compared the spatial and temporal variations in emission intensities relative to the value-added in agriculture and agricultural land area. The STIRPAT model was employed to assess the effects of population, economic, and technological factors on N₂O emissions from agricultural sources across various regions. Furthermore, the study projects future emission trends and identifies the shape of the Environmental Kuznets Curve (EKC) for N₂O emissions from agricultural activities in China, providing a robust foundation for policymaking on N₂O mitigation strategies.
The primary source of agricultural N₂O emissions in China are farmland, particularly emissions driven by chemical fertilizer use, with the largest contributions coming from Guangxi, Henan, and Shandong. By around 2015, N₂O emissions from agricultural sources in all regions had peaked, with the Ministry of Agriculture’s “Zero Growth Ac-tion Plans for Fertilizer and Pesticide Use by 2020” achieving substantial reductions.
In terms of regional differences, by 2021, regions east of the Hu Line exhibited higher emission intensities per unit of cultivated land, whereas regions west of the Hu Line, particularly agro-pastoral areas, showed higher N₂O emissions per unit of agricultural economic output, reflecting lower resource use efficiency and higher environmental costs.
Moreover, the relationship between N₂O emissions from agricultural sources and per capita GDP in China follows an inverted “N”-shaped Environmental Kuznets Curve (EKC). Although overall emissions have entered a declining phase, the Northeast and South China regions still face considerable pressure to reduce emissions. Therefore, it is more effective to develop region-specific mitigation policies tailored to the unique eco-nomic and agricultural contexts of these areas, rather than adopting a “one-size-fits-all” approach.
4.2. Discussion
The global warming potential of N₂O is significantly higher than that of CO₂, with agricultural fields, especially those applying fertilizers, being the primary source of N₂O emissions from agricultural activities. This study identifies manure management and fertilizer use as the key contributors to N₂O emissions from agricultural activities in China, suggesting that future mitigation efforts should focus on these two aspects.
In terms of fertilizer management, optimizing nitrogen fertilizer formulations, precision application, and adopting practices such as crop rotation and conservation tillage have been shown to effectively reduce the negative environmental impacts of nitrogen fertilizers and, consequently, lower N₂O emissions from agricultural fields. Additionally, compared to traditional irrigation systems, drip irrigation significantly improves the efficiency of water and fertilizer use, leading to a notable reduction in N₂O emissions globally. For manure management, optimizing animal feed formulations to reduce excessive nitrogen intake can decrease nitrogen content in manure, thereby reducing ammonia and N₂O emissions. Composting can further stabilize organic matter in manure and mitigate N₂O emissions.
Given the substantial differences in agricultural practices and economic development across different regions of China, there are significant spatial and temporal variations in N₂O emissions from agricultural activities. To achieve the targets of carbon peaking by 2030 and carbon neutrality by 2060, tailored mitigation strategies must be developed based on regional characteristics.
This study calculates N₂O emissions from agricultural activities in China from 2000 to 2021, analyzing their spatial and temporal trends and projecting future scenarios. However, the collection of data on indirect emissions from agricultural fields presents challenges, potentially leading to an underestimation of actual emissions. Future research should aim to refine emission source classifications and provincial emission factors to enhance data accuracy. Furthermore, the mechanisms of manure management on N₂O emissions and scenario predictions warrant further exploration.
Author Contributions
Conceptualization, Miaoling Bu and Weiming Xi; methodology, Miaoling Bu and Guofeng Wang; formal analysis, Yu Wang; investigation, Miaoling Bu; resources, Guofeng Wang; data curation, Guofeng Wang; writing—original draft preparation, Miaoling Bu; writing—review and editing, Weiming Xi; supervision, Guofeng Wang; project administration, Guofeng Wang; funding acquisition, Guofeng Wang. All authors have read and agreed to the published version of the manuscript.
Funding
This research was funded by the Innovation Centre for Digital Business and Capital Development of Beijing Technology and Business University, grant number SZSK20220x, and the National Natural Science Foundation of China, grant number 72003111.
Institutional Review Board Statement
Not applicable.
Data Availability Statement
Data available on request.
Acknowledgments
The authors are also thankful to the anonymous reviewers and editor for their constructive feedback which significantly improved the manuscript.
Conflicts of Interest
The authors declare no conflicts of interest.
Declaration of Competing Interest
The authors declare that they have no known competing financial interests or personal relationships that could have appeared to influence the work reported in this paper.
References
- Sanford, M.; Painter, J.; Yasseri, T.; Lorimer, J. Controversy around climate change reports: a case study of Twitter responses to the 2019 IPCC report on land. Climatic change 2021, 167, 59. [Google Scholar] [CrossRef] [PubMed]
- Müller, R. The impact of the rise in atmospheric nitrous oxide on stratospheric ozone: This article belongs to Ambio’s 50th Anniversary Collection. Theme: Ozone Layer. Ambio 2021, 50, 35–39. [Google Scholar] [CrossRef] [PubMed]
- Thompson, R.L.; Lassaletta, L.; Patra, P.K.; Wilson, C.; Wells, K.C.; Gressent, A.; Koffi, E.N.; Chipperfield, M.P.; Winiwarter, W.; Davidson, E.A. Acceleration of global N2O emissions seen from two decades of atmospheric inversion. Nature Climate Change 2019, 9, 993–998. [Google Scholar] [CrossRef]
- Lee, H.; Calvin, K.; Dasgupta, D.; Krinner, G.; Mukherji, A.; Thorne, P.; Trisos, C.; Romero, J.; Aldunce, P.; Barret, K. IPCC, 2023: Climate Change 2023: Synthesis Report, Summary for Policymakers. Contribution of Working Groups I, II and III to the Sixth Assessment Report of the Intergovernmental Panel on Climate Change [Core Writing Team, H. Lee and J. Romero (eds.)]. IPCC, Geneva, Switzerland. 2023.
- Menegat, S.; Ledo, A.; Tirado, R. Greenhouse gas emissions from global production and use of nitrogen synthetic fertilisers in agriculture. Scientific Reports 2022, 12, 1–13. [Google Scholar] [CrossRef]
- Tian, H.; Yang, J.; Xu, R.; Lu, C.; Canadell, J.G.; Davidson, E.A.; Jackson, R.B.; Arneth, A.; Chang, J.; Ciais, P. Global soil nitrous oxide emissions since the preindustrial era estimated by an ensemble of terrestrial biosphere models: Magnitude, attribution, and uncertainty. Global change biology 2019, 25, 640–659. [Google Scholar] [CrossRef]
- Liang, M.; Zhou, Z.; Ren, P.; Xiao, H.; Hu, Z.; Piao, S.; Tian, H.; Tong, Q.; Zhou, F.; Wei, J. Four decades of full-scale nitrous oxide emission inventory in China. National Science Review 2024, 11, nwad285. [Google Scholar] [CrossRef]
- Harmsen, J.; van Vuuren, D.P.; Nayak, D.R.; Hof, A.F.; Höglund-Isaksson, L.; Lucas, P.L.; Nielsen, J.B.; Smith, P.; Stehfest, E. Long-term marginal abatement cost curves of non-CO2 greenhouse gases. Environmental Science & Policy 2019, 99, 136–149. [Google Scholar] [CrossRef]
- Lynch, J.; Cain, M.; Frame, D.; Pierrehumbert, R. Agriculture’s contribution to climate change and role in mitigation is distinct from predominantly fossil CO2-emitting sectors. Frontiers in sustainable food systems 2021, 4, 518039. [Google Scholar] [CrossRef]
- Liu, C.M.; Sandhu, N.K.; McCoy, S.T.; Bergerson, J.A. A life cycle assessment of greenhouse gas emissions from direct air capture and Fischer–Tropsch fuel production. Sustainable Energy & Fuels 2020, 4, 3129–3142. [Google Scholar] [CrossRef]
- Ning, J.; Zhang, C.; Hu, M.; Sun, T. Accounting for Greenhouse Gas Emissions in the Agricultural System of China Based on the Life Cycle Assessment Method. Sustainability 2024, 16, 2594. [Google Scholar] [CrossRef]
- Grados, D.; Butterbach-Bahl, K.; Chen, J.; van Groenigen, K.J.; Olesen, J.E.; van Groenigen, J.W.; Abalos, D. Synthesizing the evidence of nitrous oxide mitigation practices in agroecosystems. Environmental Research Letters 2022, 17, 114024. [Google Scholar] [CrossRef]
- You, L.; Ros, G.H.; Chen, Y.; Yang, X.; Cui, Z.; Liu, X.; Jiang, R.; Zhang, F.; de Vries, W. Global meta-analysis of terrestrial nitrous oxide emissions and associated functional genes under nitrogen addition. Soil Biology and Biochemistry 2022, 165, 108523. [Google Scholar] [CrossRef]
- Fabregat-Aibar, L.; Niñerola, A.; Pié, L. Computable general equilibrium models for sustainable development: past and future. Environmental Science and Pollution Research 2022, 29, 38972–38984. [Google Scholar] [CrossRef] [PubMed]
- Zhang, X.; Wu, L.; Ma, X.; Qin, Y. Dynamic computable general equilibrium simulation of agricultural greenhouse gas emissions in China. Journal of Cleaner Production 2022, 345, 131122. [Google Scholar] [CrossRef]
- Hu, B.; Zhang, L.; Liang, C.; Yang, X.; Shi, Z.; Wang, C. Characterizing Spatial and Temporal Variations in N2O Emissions from Dairy Manure Management in China Based on IPCC Methodology. Agriculture 2024, 14, 753. [Google Scholar] [CrossRef]
- Li, Z.; Fu, W.; Luo, M.; Chen, J.; Li, L. Calculation and scenario prediction of methane emissions from agricultural activities in China under the background of “carbon peak”. IOP Conference Series: Earth and Environmental Science 2022, 1087, 012021. [Google Scholar] [CrossRef]
- Frank, S.; Havlík, P.; Stehfest, E.; van Meijl, H.; Witzke, P.; Pérez-Domínguez, I.; van Dijk, M.; Doelman, J.C.; Fellmann, T.; Koopman, J.F. Agricultural non-CO2 emission reduction potential in the context of the 1.5 ℃ target. Nature Climate Change 2019, 9, 66–72. [Google Scholar] [CrossRef]
- Ou, Y.; Roney, C.; Alsalam, J.; Calvin, K.; Creason, J.; Edmonds, J.; Fawcett, A.A.; Kyle, P.; Narayan, K.; O’Rourke, P. Deep mitigation of CO2 and non-CO2 greenhouse gases toward 1.5 ℃ and 2 ℃ futures. Nature communications 2021, 12, 6245. [Google Scholar] [CrossRef]
- Rogelj, J.; Lamboll, R.D. Substantial reductions in non-CO2 greenhouse gas emissions reductions implied by IPCC estimates of the remaining carbon budget. Communications Earth & Environment 2024, 5, 35. [Google Scholar] [CrossRef]
- Lin, J.; Khanna, N.; Liu, X.; Wang, W.; Gordon, J.; Dai, F. Opportunities to tackle short-lived climate pollutants and other greenhouse gases for China. Science of the Total Environment 2022, 842, 156842. [Google Scholar] [CrossRef]
- Huang, T.; Yang, H.; Huang, C.; Ju, X. Effects of nitrogen management and straw return on soil organic carbon sequestration and aggregate-associated carbon. European journal of soil science 2018, 69, 913–923. [Google Scholar] [CrossRef]
- Searchinger, T.D.; Wirsenius, S.; Beringer, T.; Dumas, P. Assessing the efficiency of changes in land use for mitigating climate change. Nature 2018, 564, 249–253. [Google Scholar] [CrossRef] [PubMed]
- Yu, Z.; Zhang, F.; Gao, C.; Mangi, E.; Ali, C. The potential for bioenergy generated on marginal land to offset agricultural greenhouse gas emissions in China. Renewable and Sustainable Energy Reviews 2024, 189, 113924. [Google Scholar] [CrossRef]
- Wang, Y.; Zhu, Y.; Zhang, S.; Wang, Y. What could promote farmers to replace chemical fertilizers with organic fertilizers? Journal of cleaner production 2018, 199, 882–890. [Google Scholar] [CrossRef]
- National Development and Reform Commission. Guidelines for the preparation of provincial greenhouse gasinventories (Trial). 2011. http://www.cbcsd.org.cn/sjk/nengyuan/standard/home/20140113/download/shengjiwenshiqiti.pdf.
- Gao, F.; Lv, K.; Qiao, Z.; Ma, F.; Jiang, O. Assessment and prediction of carbon neutrality in the eastern margin ecotone of Qinghai-Tibet Plateau. Acta Ecologica Sinica 2022, 42, 9442–9455. [Google Scholar] [CrossRef]
- Zhao, L.; Zhao, T.; Yuan, R. Scenario simulations for the peak of provincial household CO2 emissions in China based on the STIRPAT model. Science of The Total Environment 2022, 809, 151098. [Google Scholar] [CrossRef]
- Ministry of Agriculture and Rural Affairs. Ministry of Agriculture and Rural Affairs Issued the “14th Five- Year Plan” National Agricultural Mechanization Development Plan. 2022-01-05. http://www.moa.gov.cn/xw/zwdt/202201/t20220105_6386352.htm.
- Jiang, J.; Zhao, T.; Wang, J. Decoupling analysis and scenario prediction of agricultural CO2 emissions: An empirical analysis of 30 provinces in China. Journal of Cleaner Production 2021, 320, 128798. [Google Scholar] [CrossRef]
Figure 1.
Processes and key drivers of agricultural N2O production.
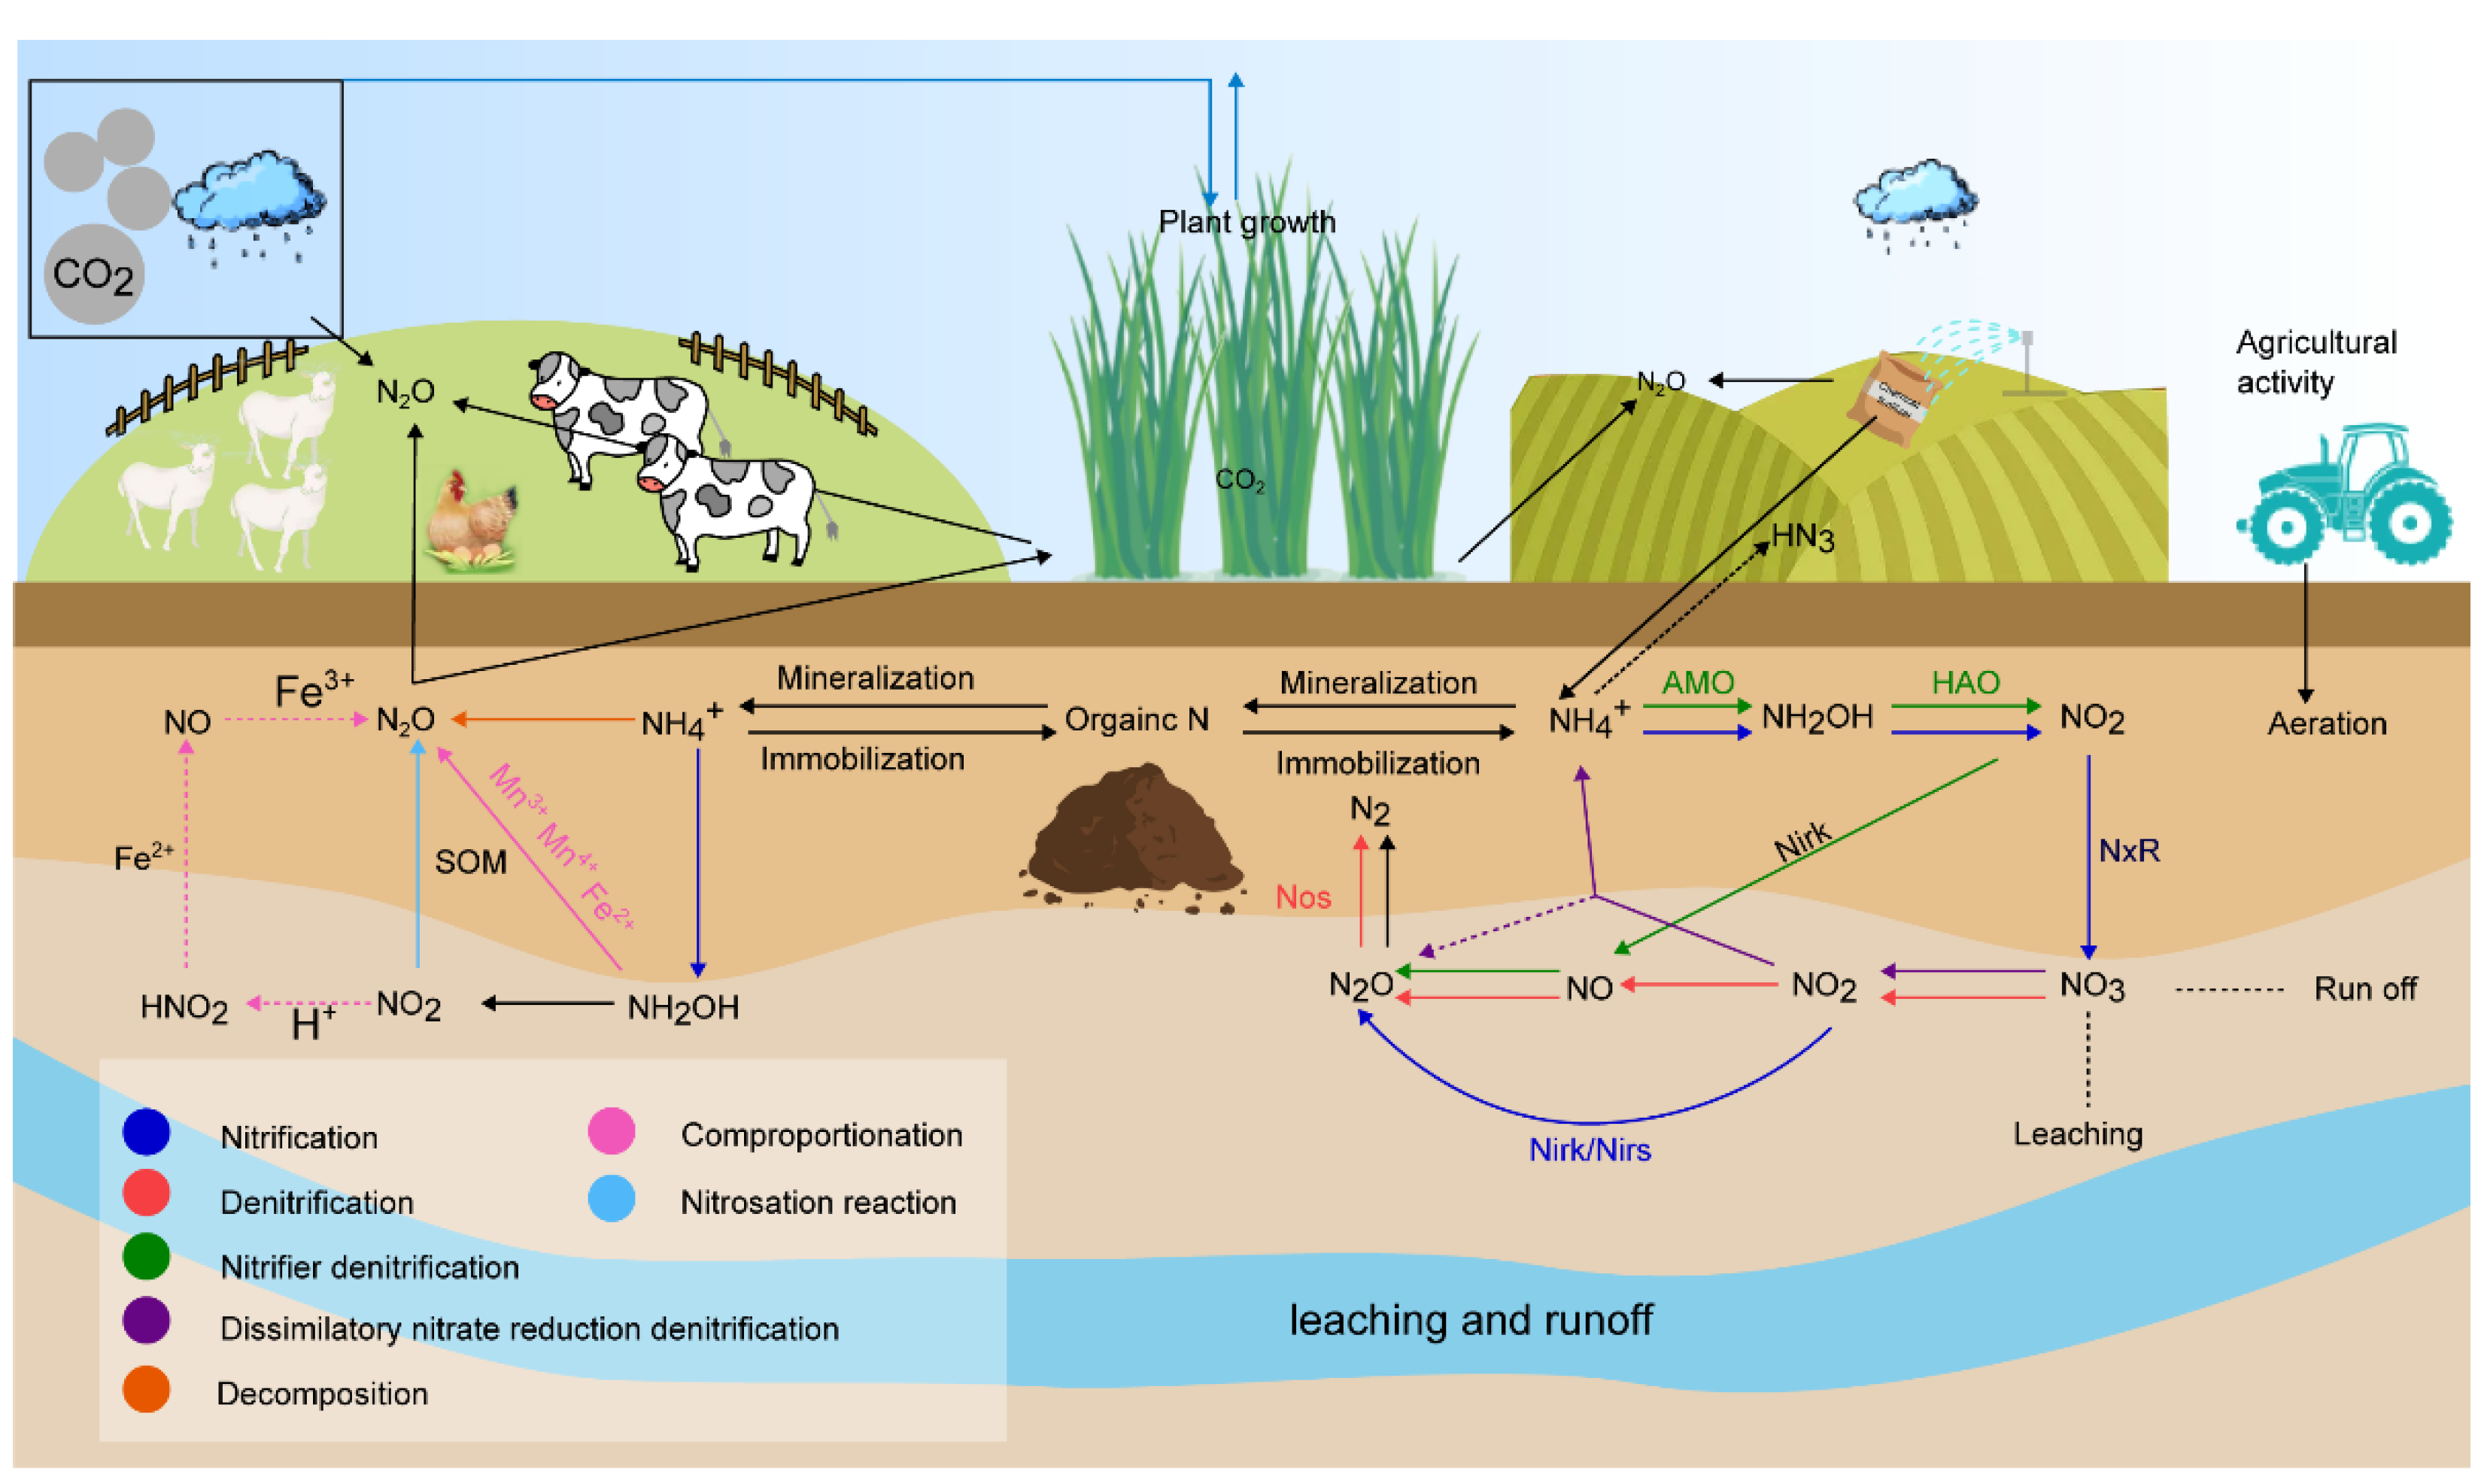
Figure 2.
Cumulative agricultural N2O emissions by province in periods from 2000 to 2021.
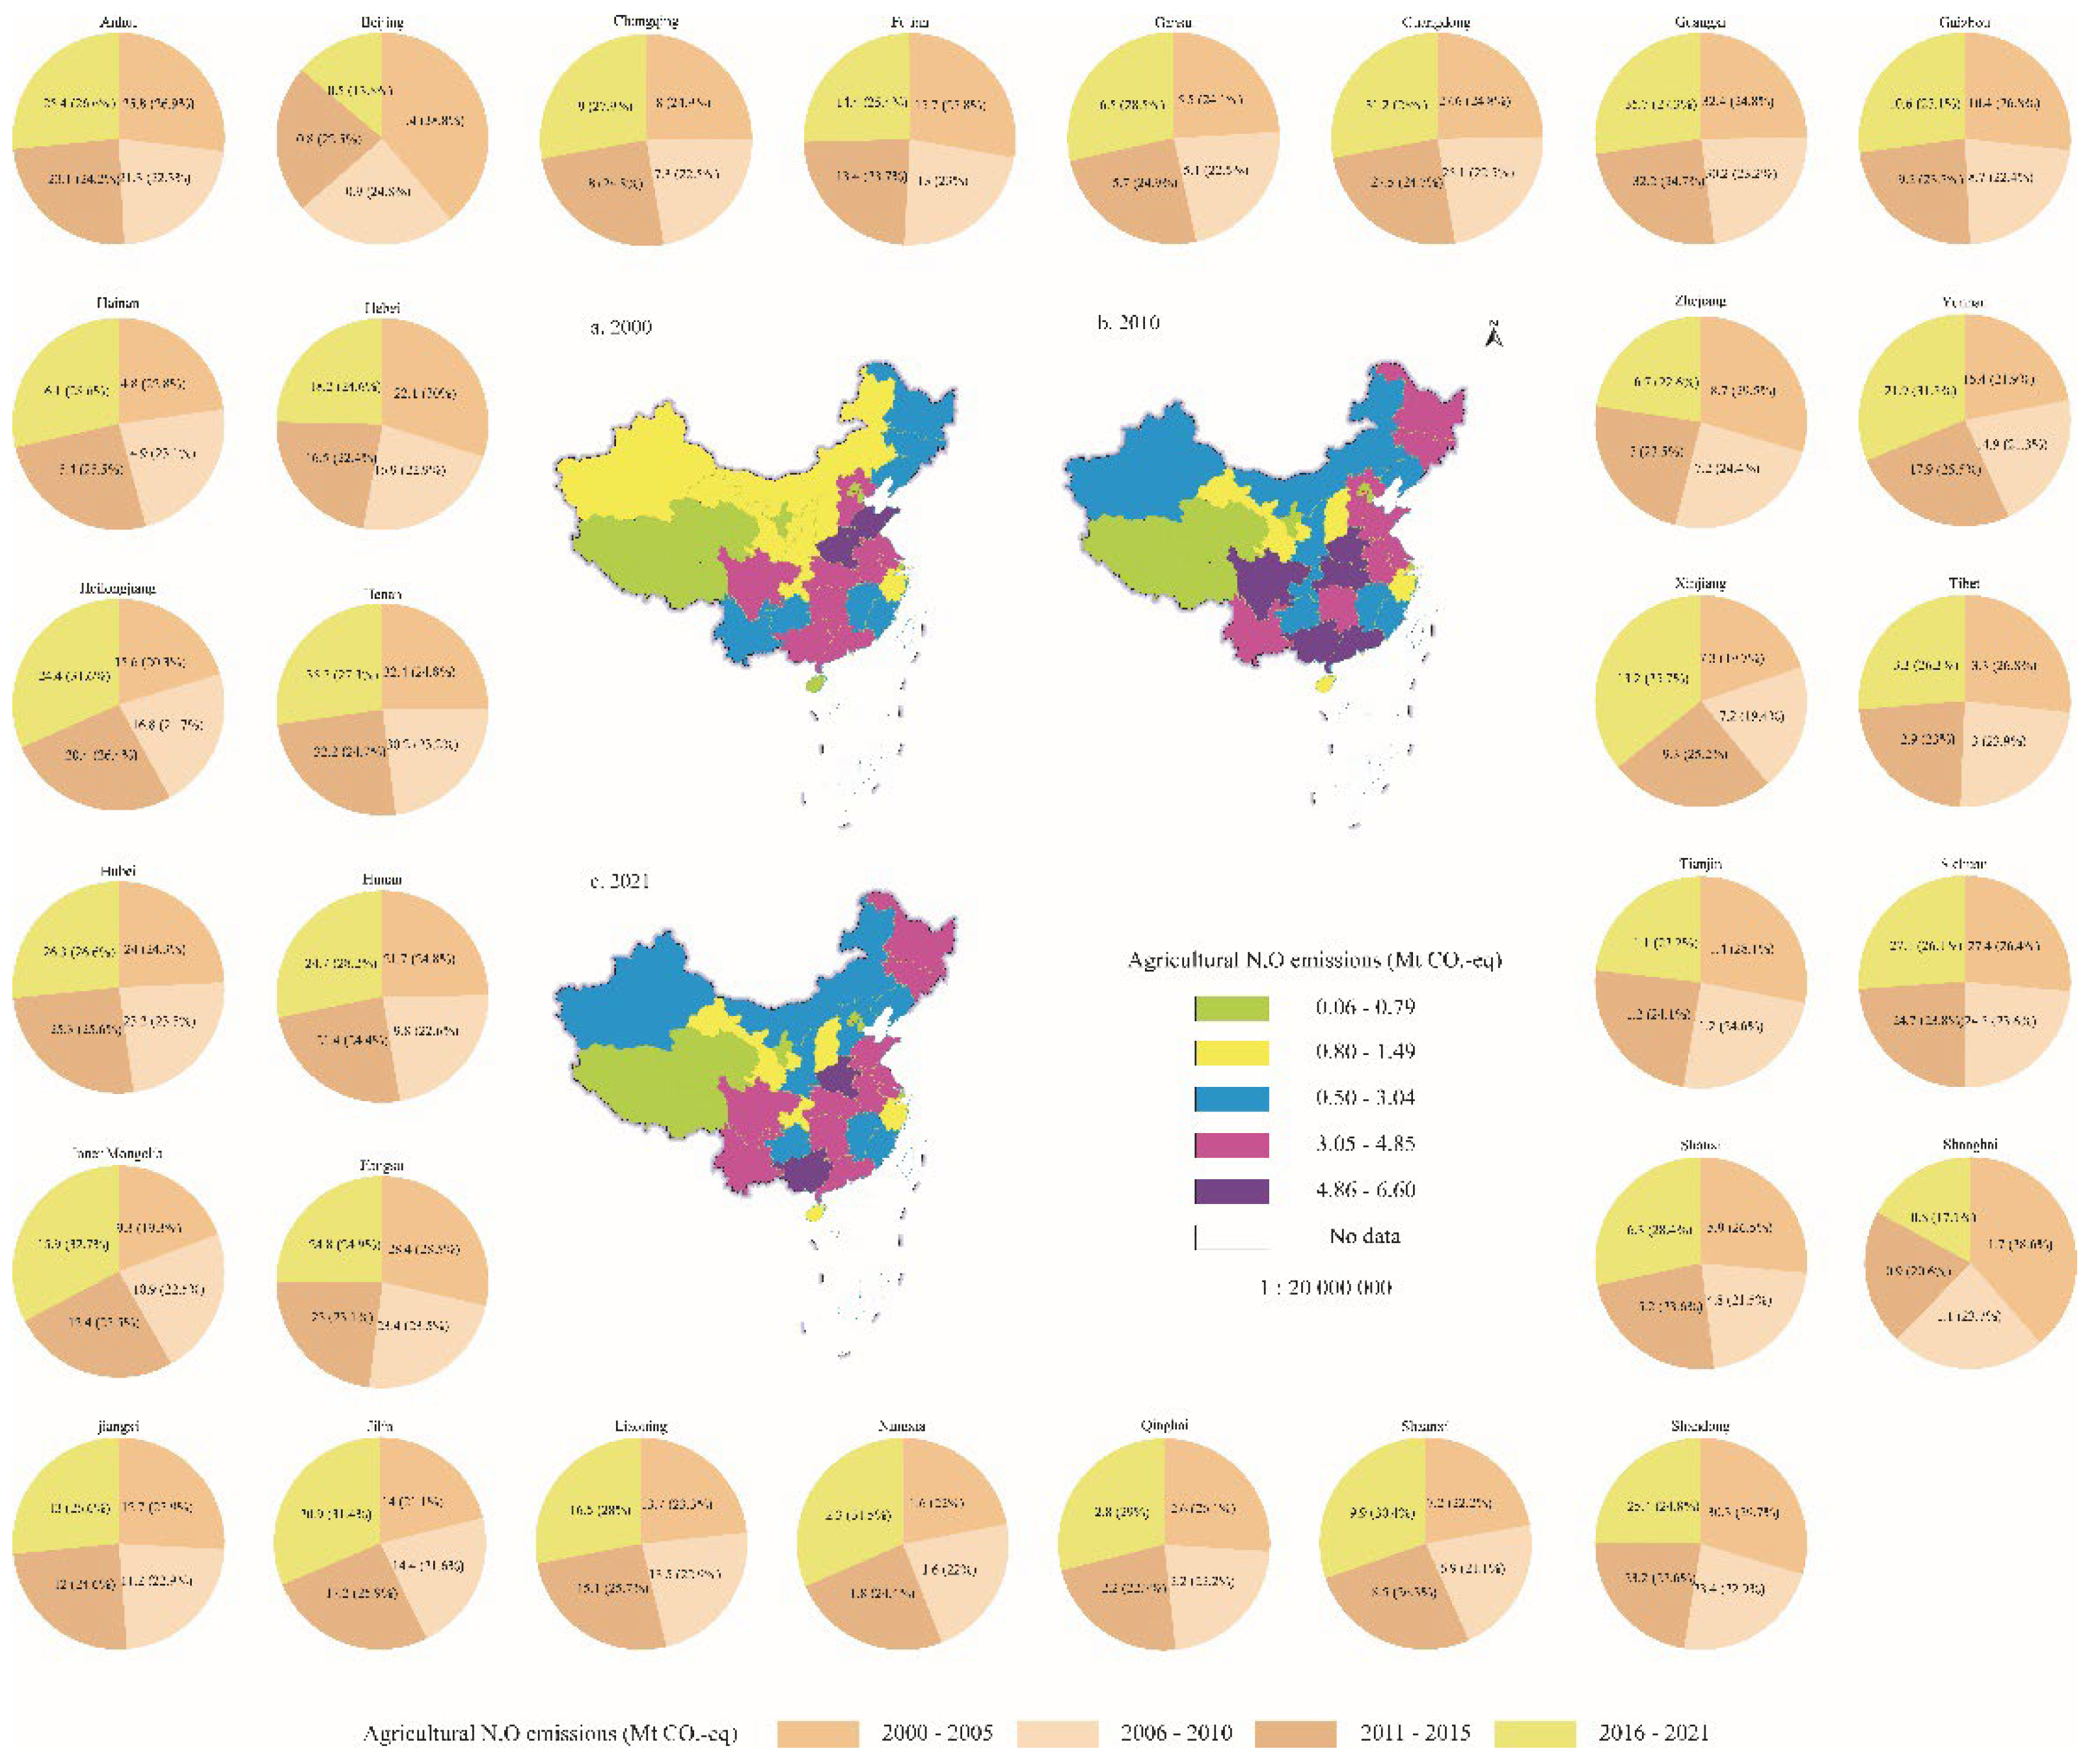
Figure 3.
Cumulative agricultural N2O emissions by province in periods from 2000 to 2021.
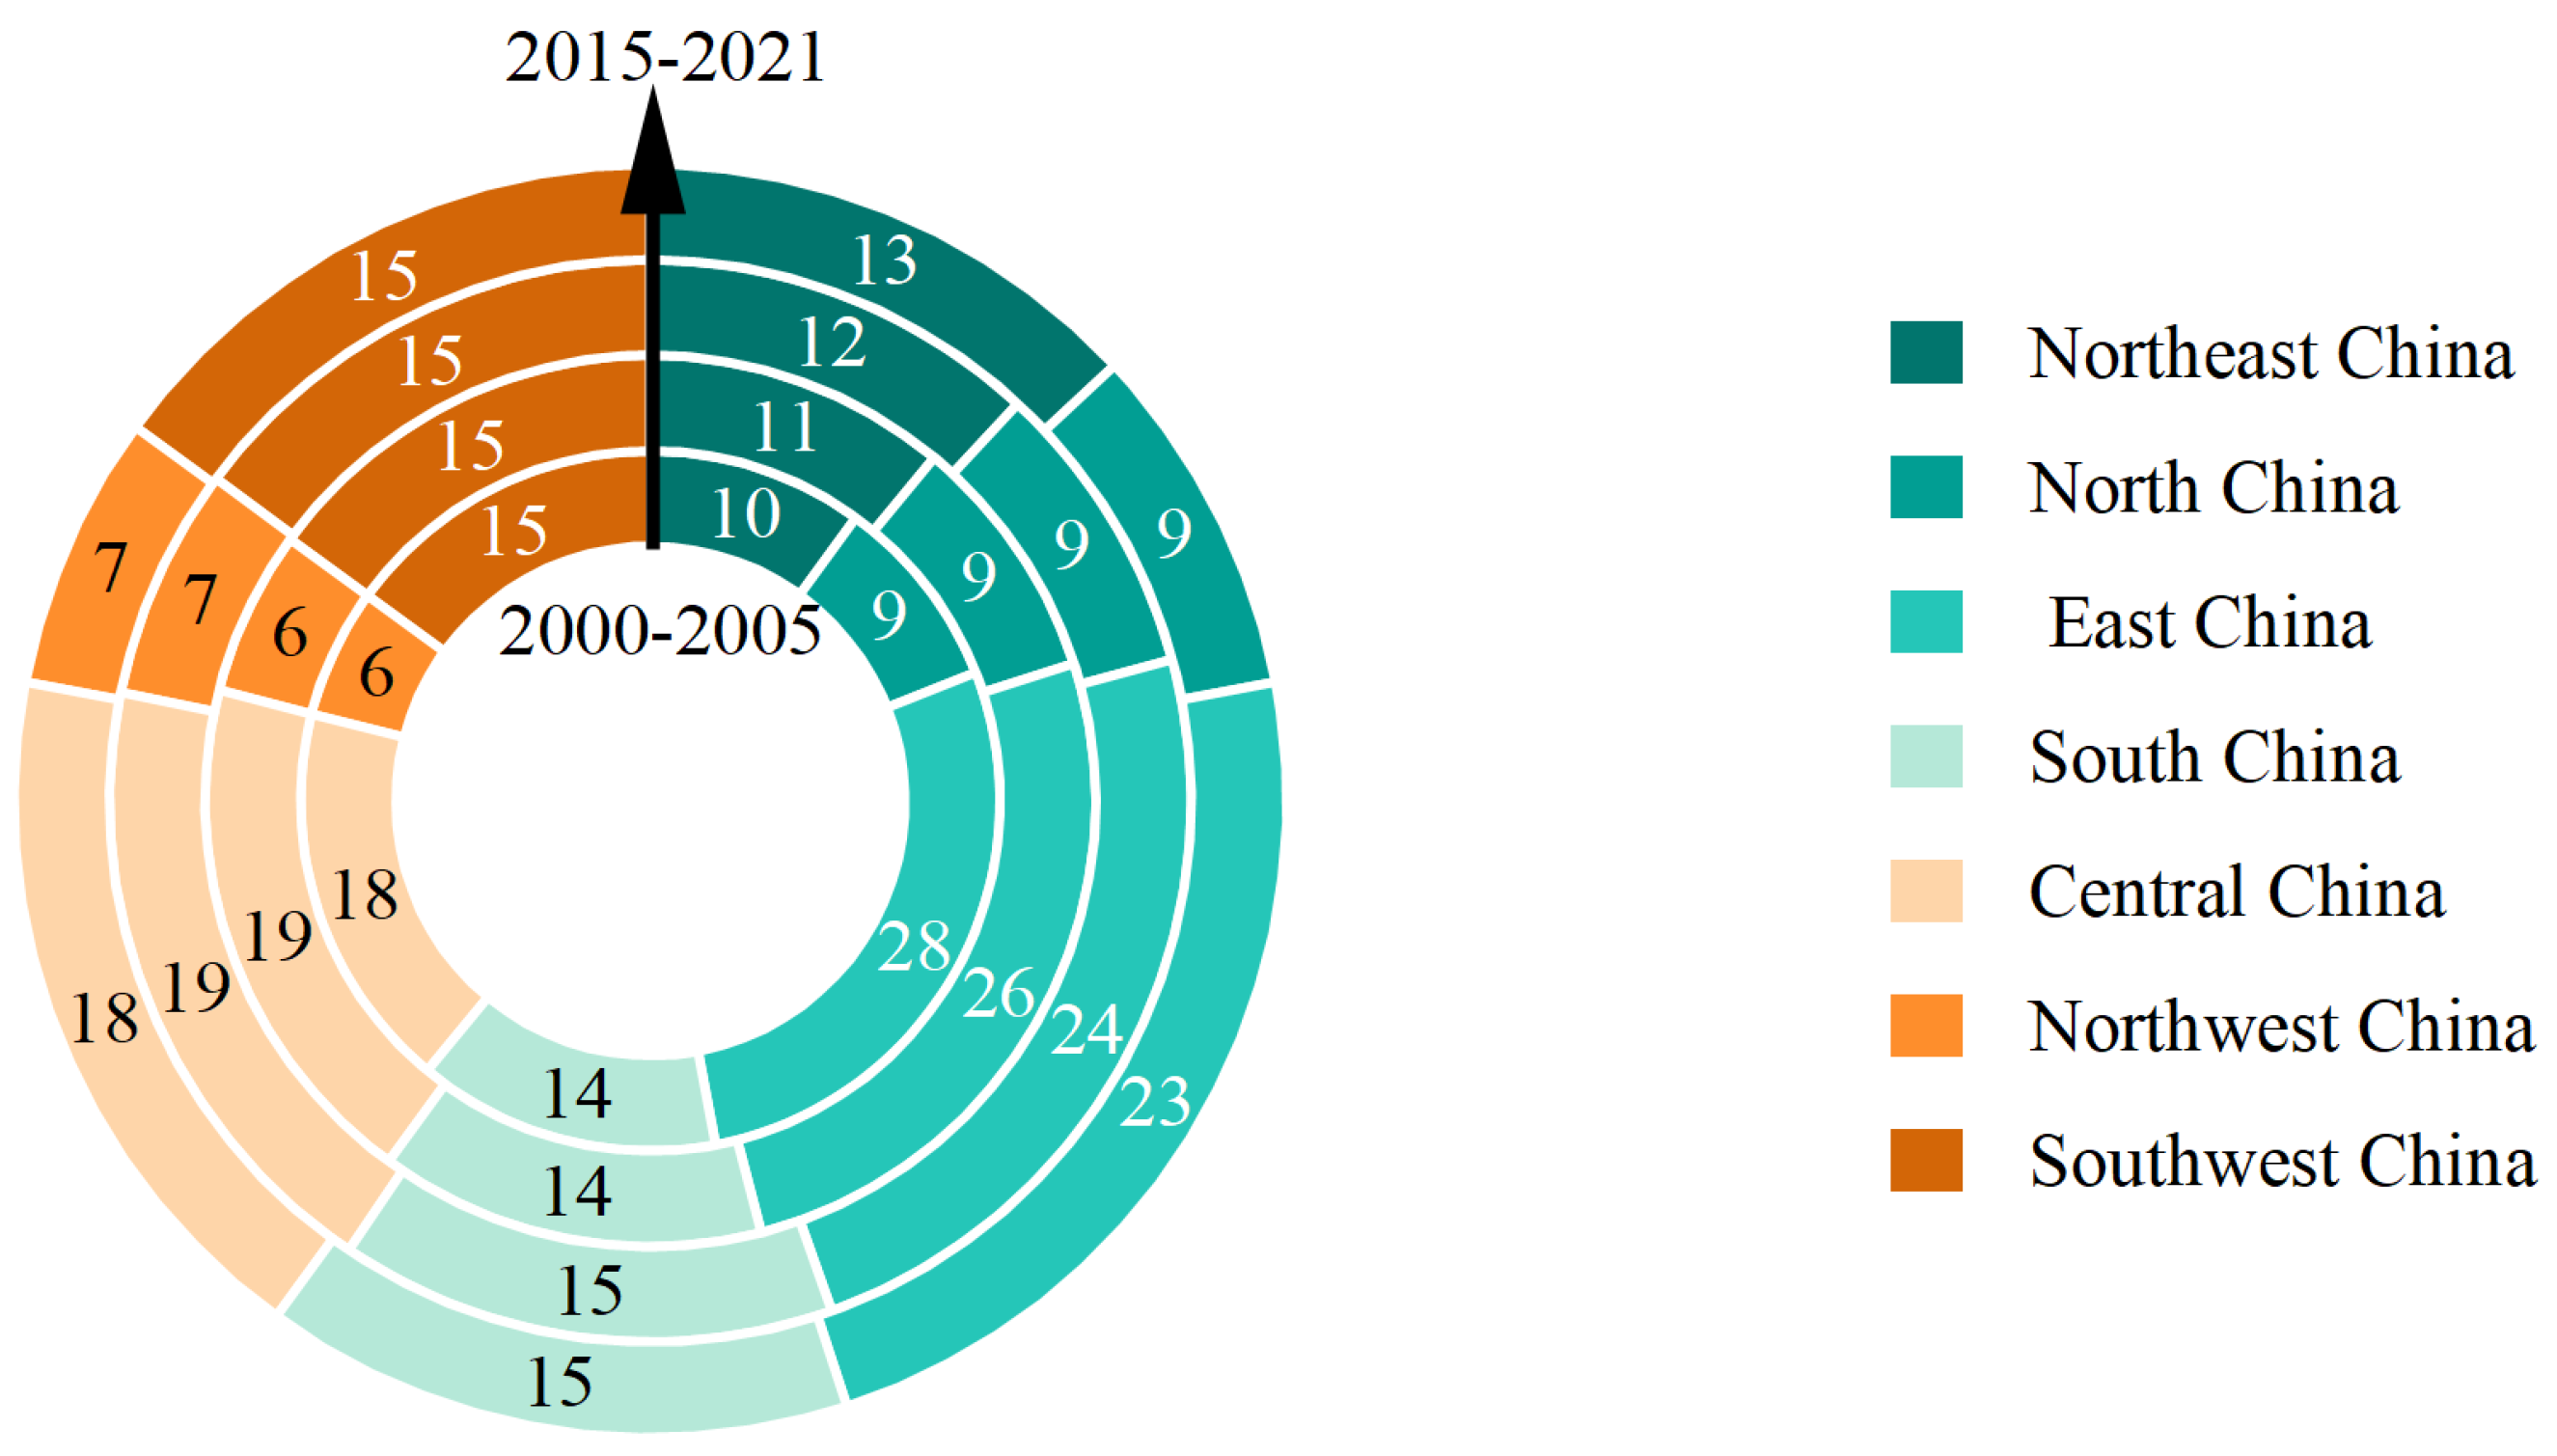
Figure 4.
Intensity of agricultural N2O emissions per unit of agricultural value added and per unit of agricultural land area in 2000, 2010, and 2021
Figure 4.
Intensity of agricultural N2O emissions per unit of agricultural value added and per unit of agricultural land area in 2000, 2010, and 2021
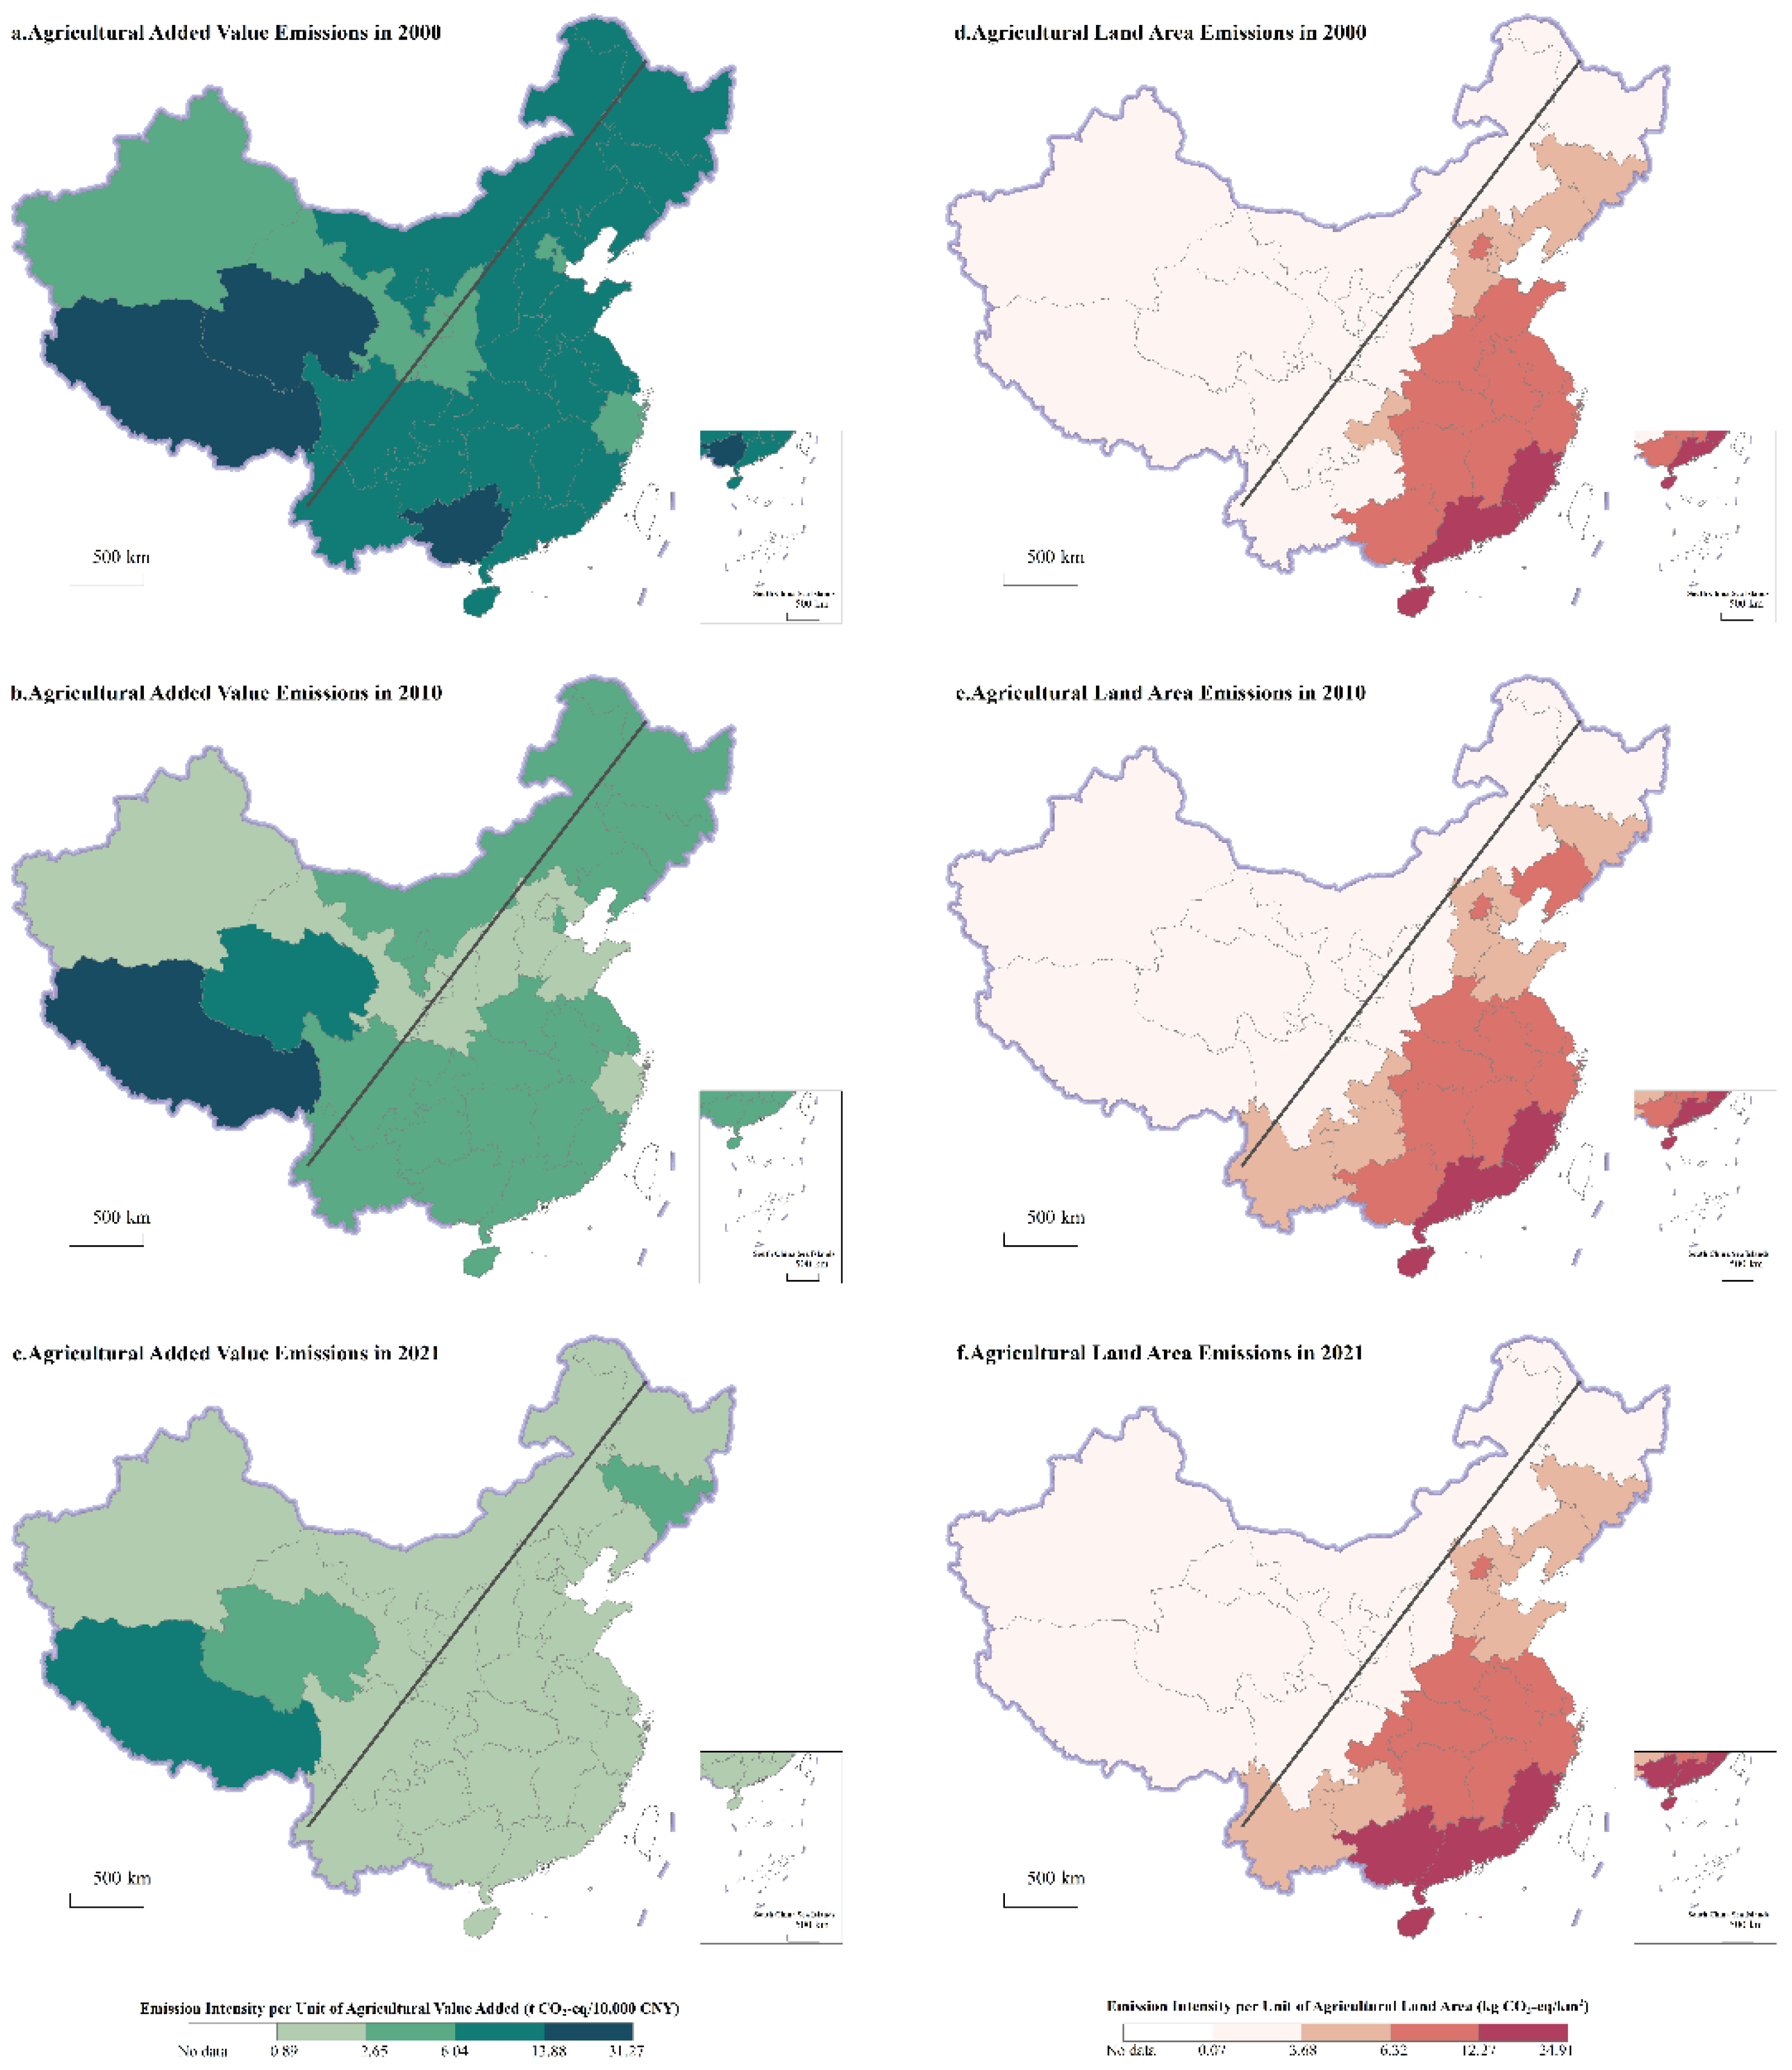
Figure 5.
Trends in nitrous oxide emission intensity per unit of agricultural value added and agricultural land area by province from 2000 to 2021
Figure 5.
Trends in nitrous oxide emission intensity per unit of agricultural value added and agricultural land area by province from 2000 to 2021
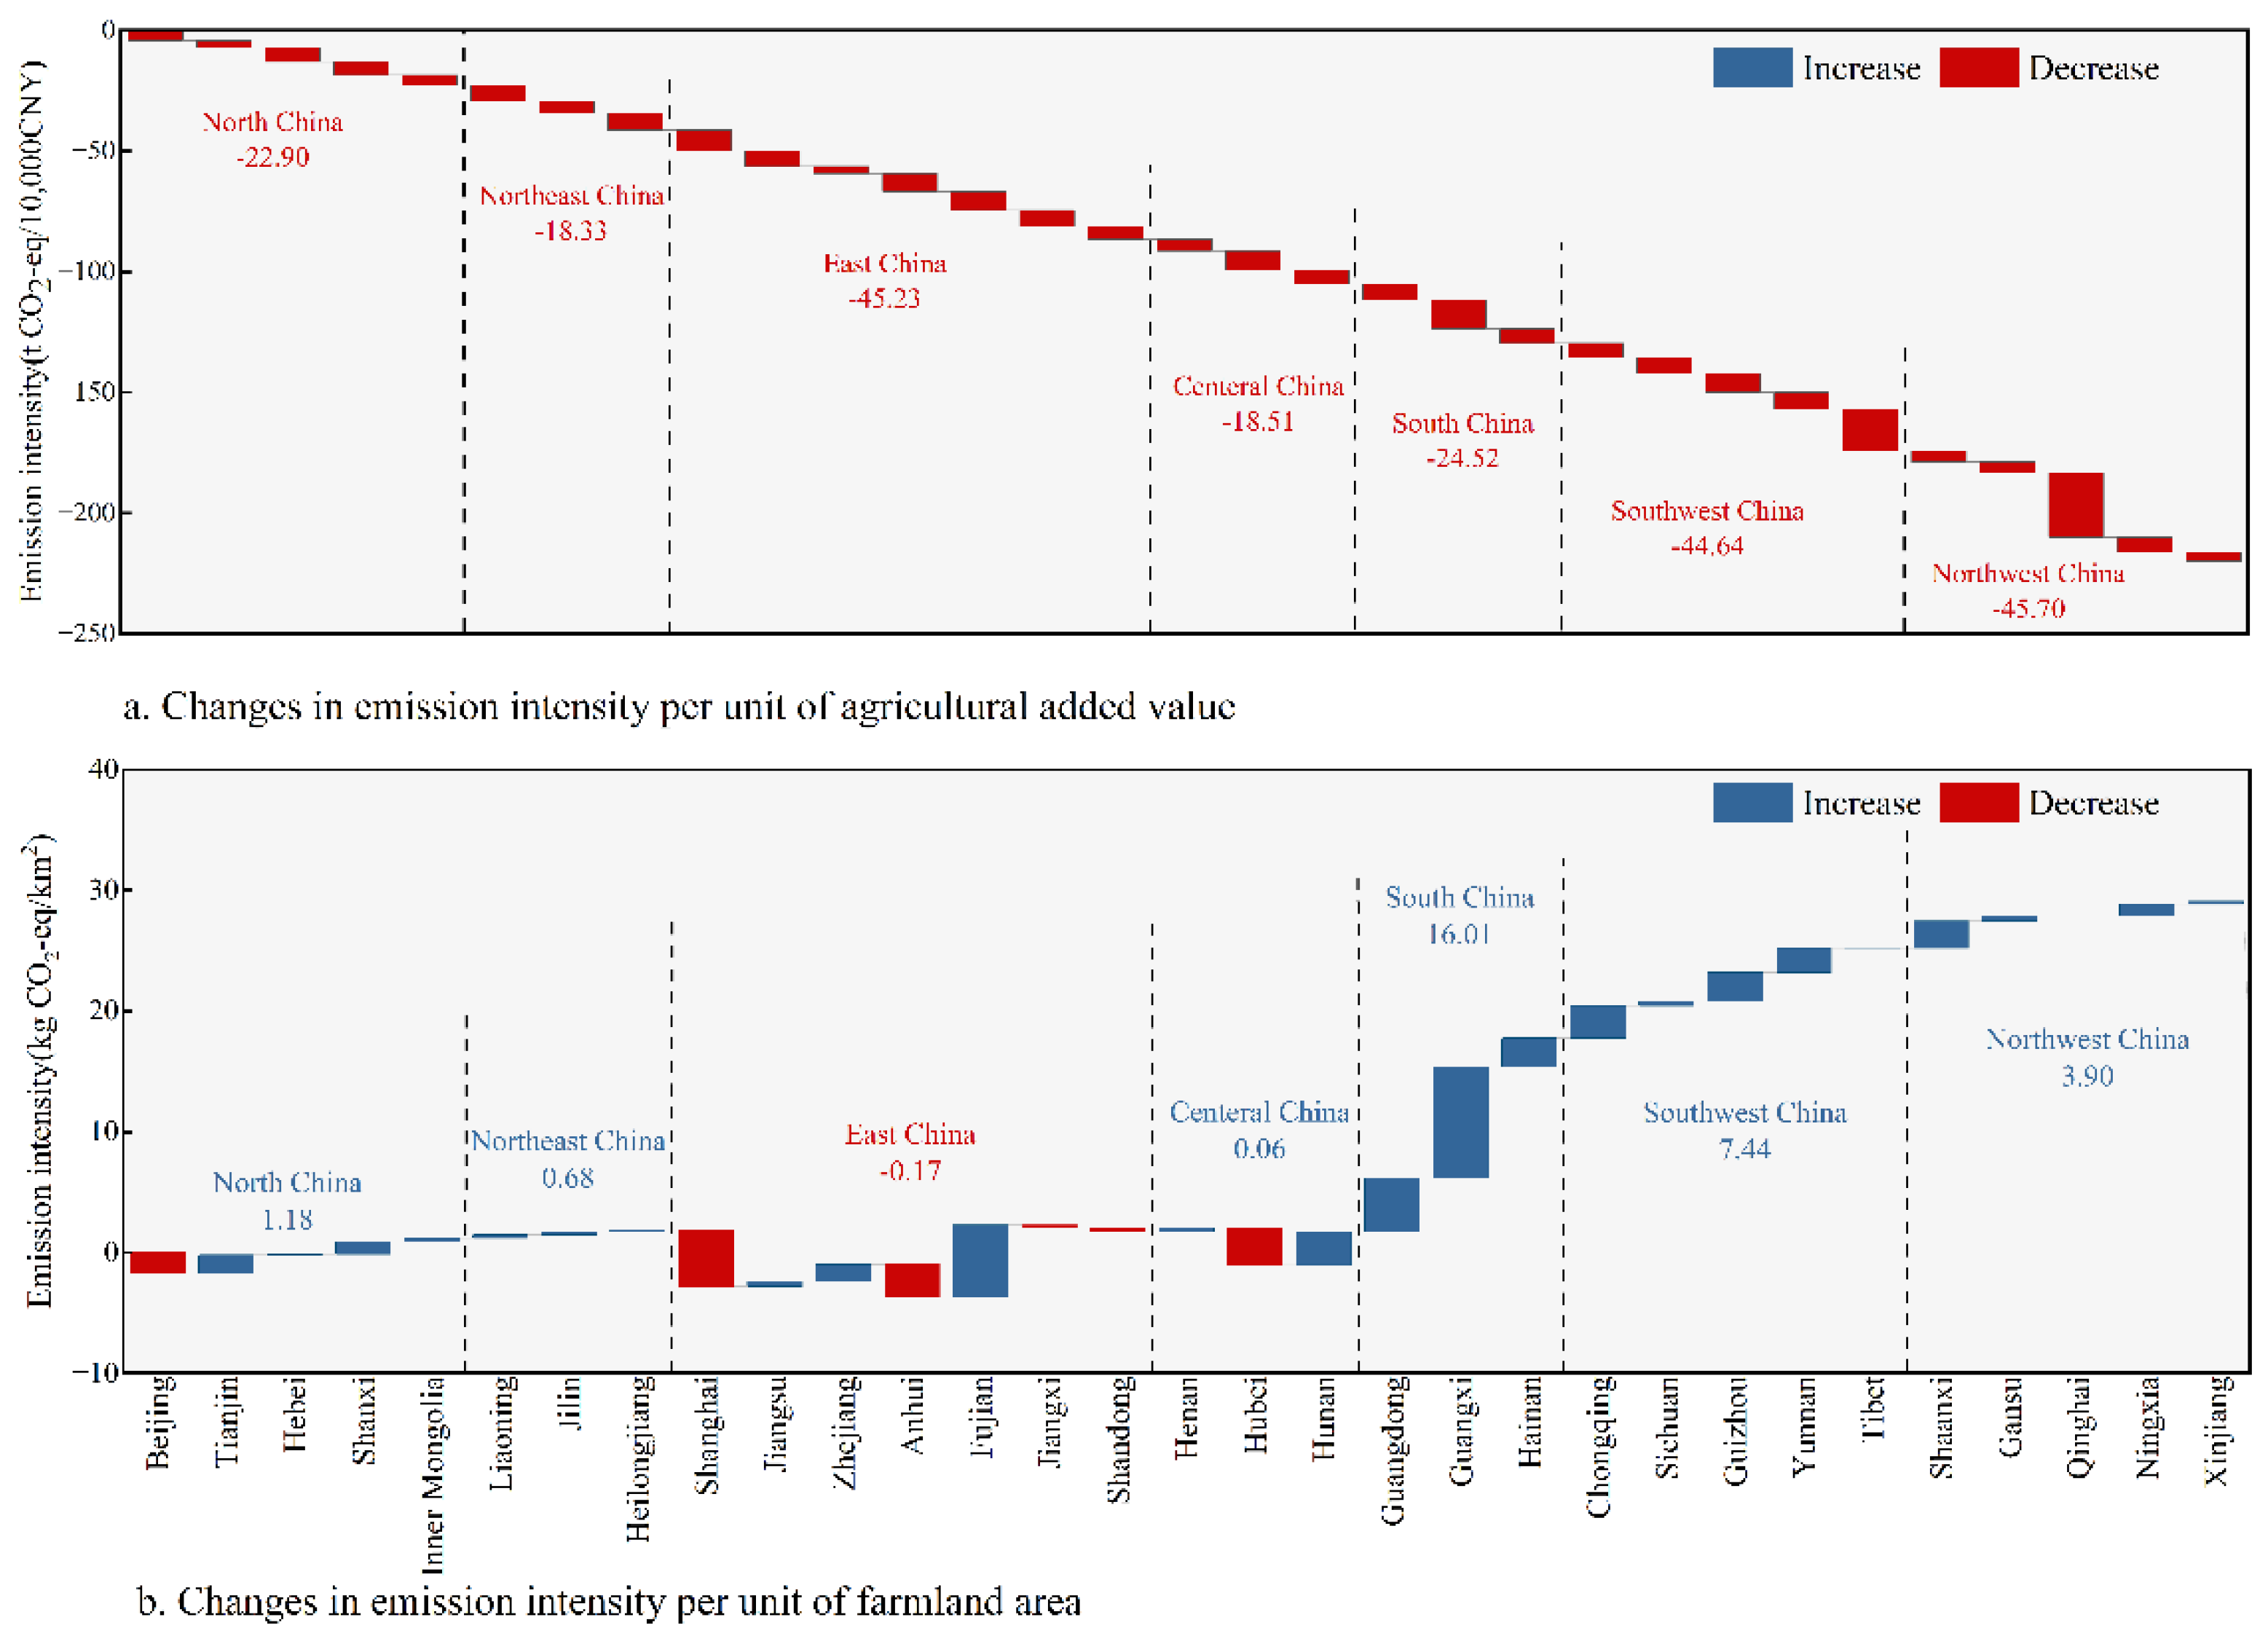
Figure 6.
Simulation of regional agricultural N2O gas emission scenarios.
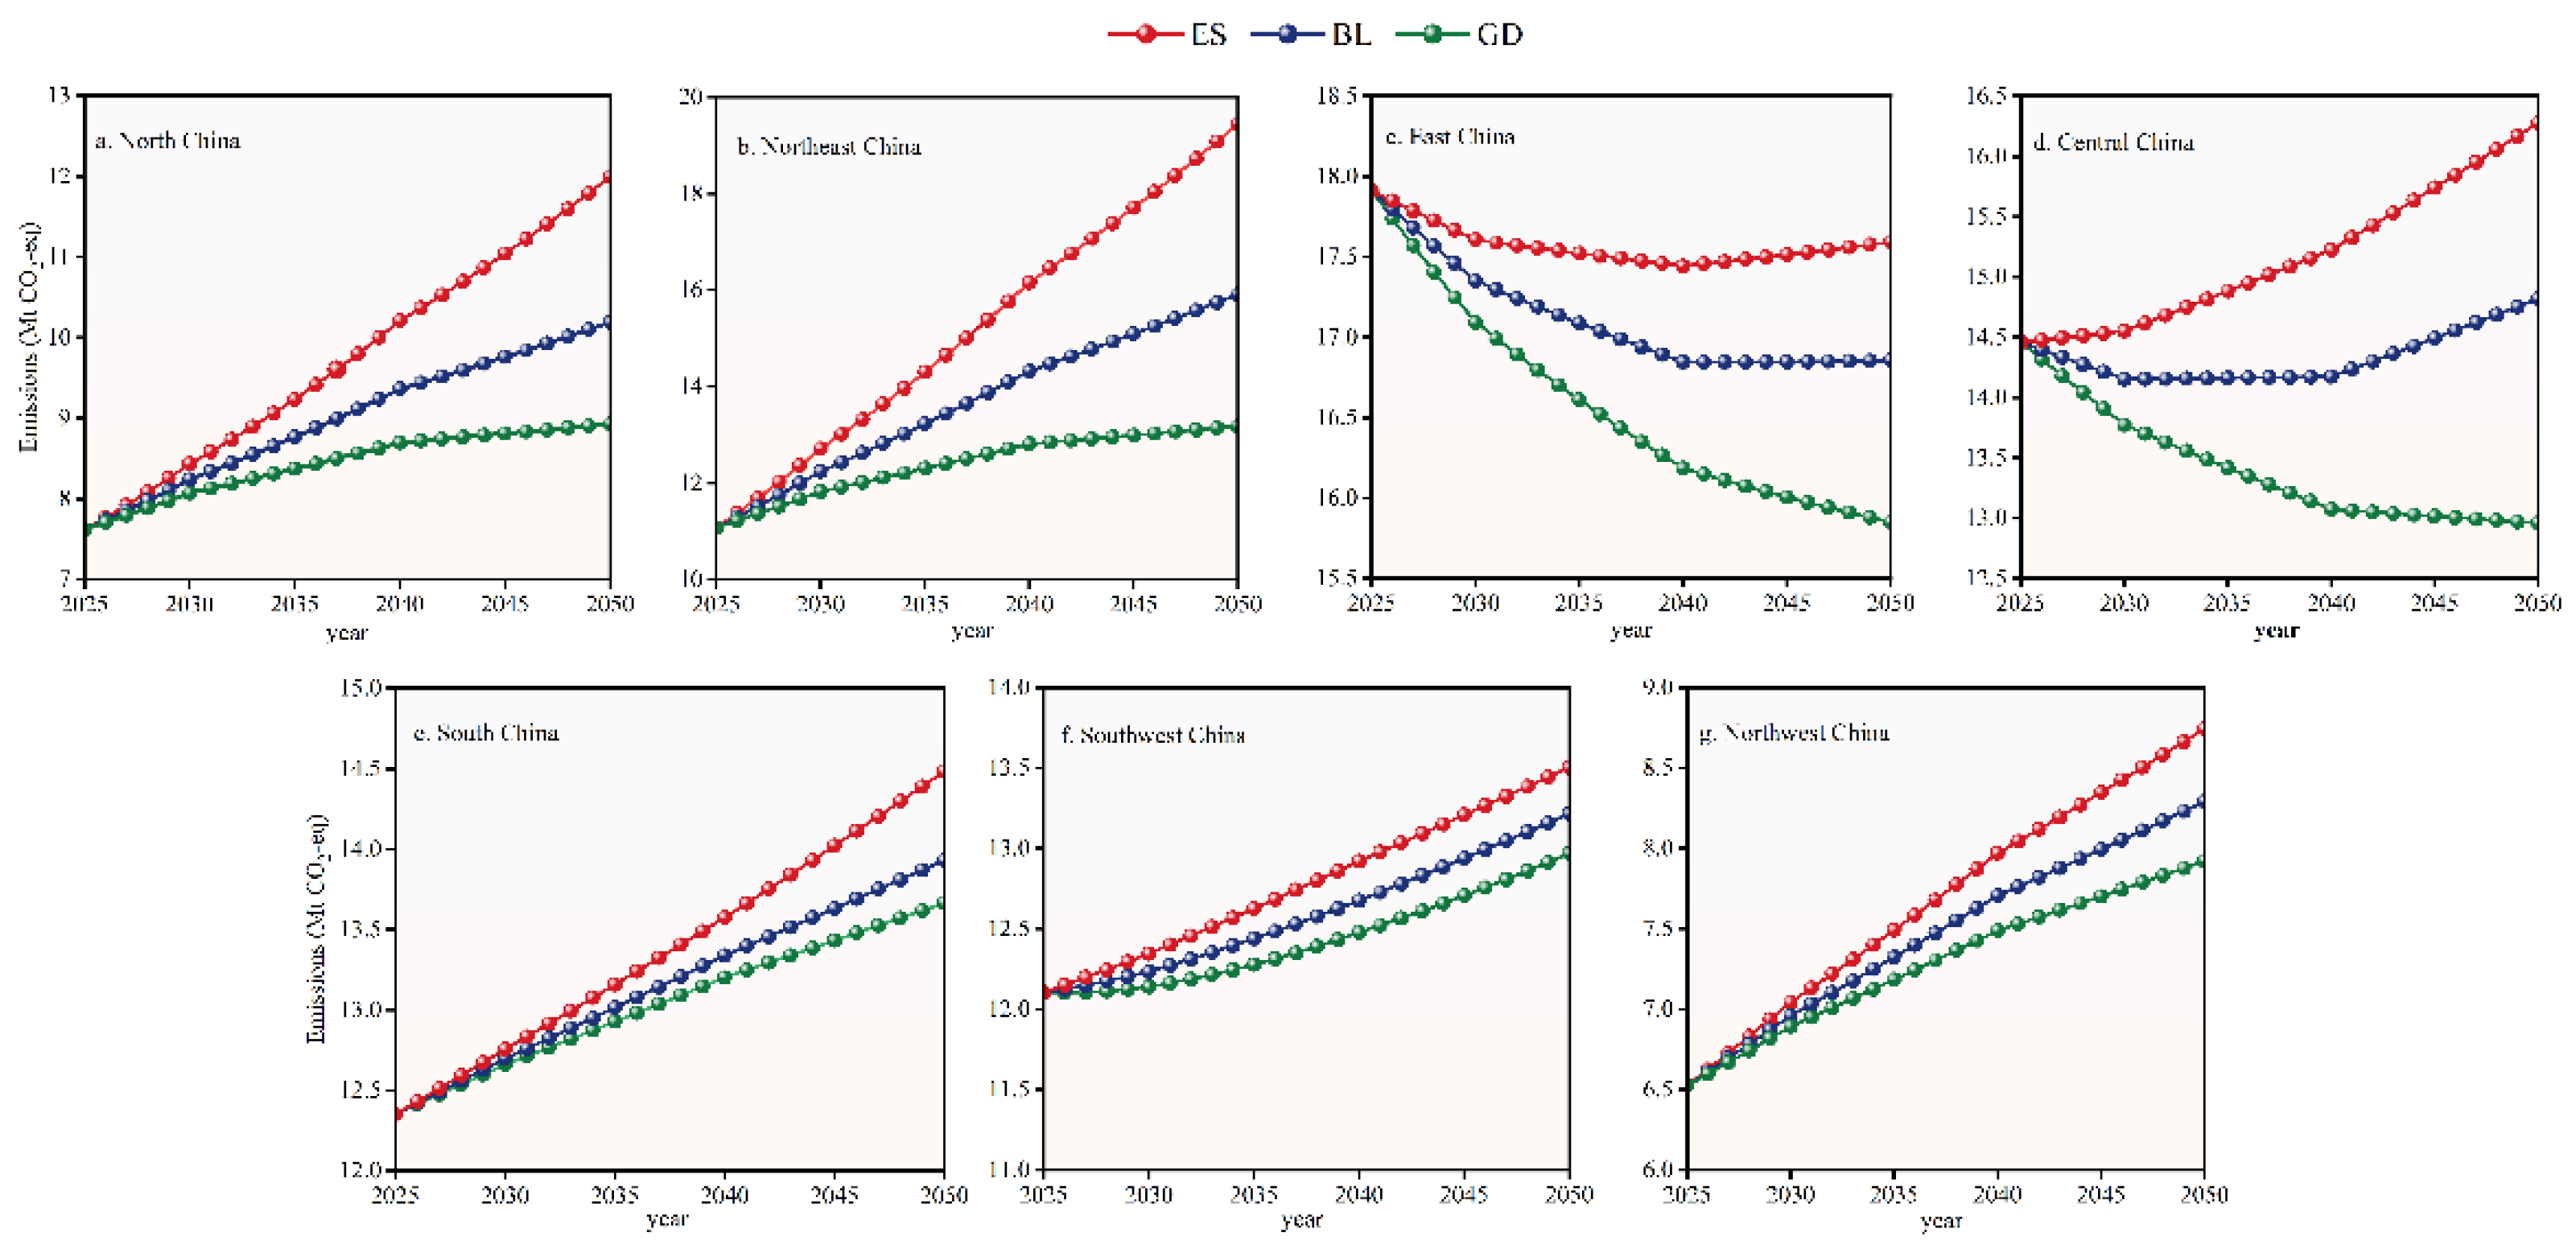

Table 1.
Direct emission factor of N2O from agricultural land. (kg N2O-N per kg N input).
| region | range | |
|---|---|---|
| Zone I (Shaanxi, Gansu, Xinjiang, Inner Mongolia, Ningxia, Tibet, Shanxi, Qinghai) | 0.0056 | 0.0015~0.0085 |
| Zone II (Liaoning, Jilin, Heilongjiang) Zone III (Beijing, Shandong, Hebei, Henan, Tianjin) Zone IV (Zhejiang, Jiangsu, Shanghai, Chongqing, Hunan, Sichuan, Jiangxi, Hubei, Anhui) Zone V (Hainan, Guangxi, Fujian, Guangdong) Zone VI (Guizhou, Yunnan) |
0.0114 0.0057 0.0109 0.0178 0.0106 |
0.0021~0.0258 0.0014~0.0081 0.0026~0.022 0.0046~0.0228 0.0025~0.0218 |
Note: The data are from the literature[25], and the data from Hong Kong, Macao and Taiwan are not available.
Table 2.
Parameters of the main crops.
| Crop category | Nitrogen content of the grain |
Nitrogen content of straw |
Economic coefficient |
Root-shoot ratio |
Straw returning rate |
|---|---|---|---|---|---|
| rice | 0.01 | 0.00753 | 0.489 | 0.125 | 0.323 |
| wheat | 0.014 | 0.00516 | 0.434 | 0.166 | 0.765 |
| corn | 0.017 | 0.0058 | 0.438 | 0.17 | 0.093 |
| sorghum | 0.017 | 0.0073 | 0.393 | 0.185 | 0.04 |
| soybean | 0.06 | 0.0181 | 0.425 | 0.13 | 0.093 |
| Hemp | 0.0131 | 0.0131 | 0.83 | 0.25 | 0.093 |
| Potato | 0.004 | 0.011 | 0.667 | 0.05 | 0.3992 |
| rapeseed | 0.00548 | 0.00548 | 0.271 | 0.15 | 0.6185 |
| Vegetable leaves | 0.008 | 0.008 | 0.83 | 0.25 | 0.6185 |
| tobacco | 0.041 | 0.0144 | 0.83 | 0.2 | 0.6185 |
Table 3.
Emission factors of greenhouse gases from animal manure management (kg per. (head a))
| region | dairy cattle | Non-dairy cows | buffalo | sheep | goat | pig | poultry | horse | Donkey/ mule |
camel |
|---|---|---|---|---|---|---|---|---|---|---|
| North Northeast East Central South southwest northwest |
1.846 1.096 2.065 1.710 1.884 1.447 |
0.794 0.913 0.846 0.805 0.691 0.545 |
— — 0.875 0.860 1.197 — |
0.093 0.057 0.113 0.106 0.064 0.074 |
0.093 0.057 0.113 0.106 0.064 0.074 |
0.227 0.266 0.175 0.157 0.159 0.195 |
Note: Data are from literature [26].
Table 4.
Rate of change setting.
| variable | Level of | Time period of change | ||
|---|---|---|---|---|
| change (%) | 2025-2030 | 2031-2040 | 2041-2050 | |
| Demographic[27] | low | 0.5 | 0.10 | 1.50 |
| middle | 1.00 | 0.60 | 1.10 | |
| high | 1.50 | 0.20 | 0.70 | |
| GDP per capita[28] | low | 2.50 | 2.0 | 1.50 |
| middle | 3.50 | 3.00 | 2.50 | |
| high | 5.50 | 4.50 | 3.50 | |
| Agricultural mechanization[29] | low | 3.00 | 2.50 | 2.00 |
| middle | 3.50 | 3.00 | 2.50 | |
| high | 4.00 | 3.50 | 3.00 | |
| Effectively irrigated area | low | 0.07 | 0.10 | 0.15 |
| middle | 0.10 | 0.13 | 0.18 | |
| high | 0.13 | 0.16 | 0.21 | |
| Agricultural output value[30] | low | 2.90 | 3.10 | 3.20 |
| middle | 3.30 | 3.50 | 3.60 | |
| high | 3.40 | 3.60 | 3.70 | |
| Rural populations[27] | low | -2.00 | -1.00 | -0.50 |
| middle | -3.50 | -2.00 | -0.50 | |
| high | -5.00 | -3.50 | -2.00 | |
Note: The data on the effective irrigated area are derived from statistical data fitting.
Table 5.
Regression results of the STIRPAT model.
| argument | InI | ||||||
|---|---|---|---|---|---|---|---|
| North | Northeast | East | Central | South | Southwest | Northwest | |
| InP | 0.045 | -0.251*** | -0.037 | 0.099 | 0.118*** | 0.112*** | 0.157*** |
| (1.327) | (-6.121) | (-0.434) | (0.898) | (14.522) | (9.655) | (8.487) | |
| lnA | -0.165*** | 0.004 | -0.376*** | -0.071 | -0.032*** | -0.018 | 0.143*** |
| (-6.914) | (0.385) | (-11.397) | (-2.17) | (-3.627) | (-1.241) | (9.016) | |
| lnT | 0.236*** | 0.231*** | 0.065** | -0.049** | 0.268*** | 0.118*** | 0.011 |
| (14.105) | (11.735) | (2.421) | (-1.032) | (22.909) | (5.17) | (0.424) | |
| lnG | 0.417*** | 0.076*** | 0.367*** | 0.085 | 0.239*** | 0.389*** | 0.161*** |
| (26.033) | (4.709) | (9.923) | (1.033) | (22.367) | (16.797) | (8.032) | |
| lnAG | 0.258*** | 0.06*** | 0.5*** | 0.252*** | 0.058*** | 0.01 | 0.055*** |
| (16.899) | (4.534) | (13.442) | (6.405) | (4.837) | (0.794) | (5.895) | |
| lnRP | 0.083*** | 0.065 | 0.146*** | 0.195*** | 0.209*** | 0.137*** | 0.2*** |
| (4.963) | (1.644) | (3.45) | (3.064) | (17.6) | (9.118) | (9.515) | |
| Constant terms | -5.917*** | -0.183 | -3.192*** | -2.468*** | -5.086*** | -4.688*** | -5.296*** |
| (-21.025) | (-0.522) | (-5.857) | (-3.82) | (-52.005) | (-35.53) | (-30.429) | |
| R2 | 0.976 | 0.906 | 0.935 | 0.751 | 0.986 | 0.95 | 0.912 |
Note: The t-statistic is in parentheses; ***, **, and * are significant at the significance levels of 1%, 5%, and 10%, respectively.
Table 6.
EKC curve test of nitrous oxide from agricultural sources.
| argument | InI | |||
|---|---|---|---|---|
| Model 1 | Model 2 | Model 3 | ||
| InP | -0.115 | -0.002 | 0.025 | |
| (-1.277) | (-0.026) | (0.28) | ||
| lnA | -0.229*** | -1.262*** | -3.541*** | |
| (-5.557) | (-8.95) | (-4.052) | ||
| (lnA)2 | - | 0.058*** | 0.338*** | |
| (7.634) | (3.18) | |||
| (lnA)3 | - | - | -0.011*** | |
| (-2.642) | ||||
| lnT | -0.027 | -0.052 | -0.054 | |
| (-0.6) | (-1.218) | (-1.266) | ||
| lnG | 0.17*** | 0.183*** | 0.177*** | |
| (3.894) | (4.383) | (4.239) | ||
| lnAG | 0.49*** | 0.521*** | 0.53*** | |
| (13.126) | (14.43) | (14.682) | ||
| lnRP | 0.566*** | 0.52*** | 0.507*** | |
| (8.957) | (8.528) | (8.324) | ||
| Constant terms | -4.952*** | -1.105** | 4.847** | |
| (-29.189) | (-2.087) | (2.095) | ||
| R2 | 0.867 | 0.877 | 0.878 | |
Note: The t-statistic is in parentheses; ***, **, and * are significant at the significance levels of 1%, 5%, and 10%, respectively.
Table 7.
Scenario setting.
| region | North China, Northeast China |
East China, Central China |
Northwest | South China, Southwest China |
||||
|---|---|---|---|---|---|---|---|---|
| scene | ES | GD | ES | GD | ES | GD | ES | GD |
| P | high | low | low | high | high | low | low | high |
| A | low | high | high | low | high | low | low | high |
| T | high | low | low | high | low | high | high | low |
| G | low | high | high | low | high | low | low | high |
| AG | high | low | high | low | low | high | high | low |
| RP | low | high | low | high | high | low | low | High |
Note: GD: green development scenarios, ES: extensive development scenarios.
Disclaimer/Publisher’s Note: The statements, opinions and data contained in all publications are solely those of the individual author(s) and contributor(s) and not of MDPI and/or the editor(s). MDPI and/or the editor(s) disclaim responsibility for any injury to people or property resulting from any ideas, methods, instructions or products referred to in the content. |
© 2024 by the authors. Licensee MDPI, Basel, Switzerland. This article is an open access article distributed under the terms and conditions of the Creative Commons Attribution (CC BY) license (http://creativecommons.org/licenses/by/4.0/).
Copyright: This open access article is published under a Creative Commons CC BY 4.0 license, which permit the free download, distribution, and reuse, provided that the author and preprint are cited in any reuse.


