Submitted:
13 October 2024
Posted:
14 October 2024
You are already at the latest version
Abstract
Purpose: The objective of this study was to evaluate the facial profile changes of patients treated for class II skeletal malocclusions with the Elastodontic appliance compared to those treated with the Herbst appliance and a control group.
Methods: Forty class II patients were treated using the Elastodontic appliance (Group EA) and were compared with 40 patients treated with a Herbst appliance (Group H) and with 40 untreated class II children (Group C). Aesthetic profile variables were analysed using Arnett's analysis. Cephalograms were compared pre-treatment (T0) and post-treatment (T1). The Wilcoxon signed-rank test or paired-samples t-test were used for pairwise comparison of cephalometric measurements taken at T0 and T1. One-way ANOVA and Tuckey's post-hoc test were performed to assess differences between the groups.
Results: In Group C, from T0 to T1, the LL-TVL distance and POG'-TVL distance decreased. In the EA group, the 1+SN angle increased from T0 to T1, while the POG'-TVL and B'-TVL distances decreased. In Group H from T0 to T1, the POG'-TVL, B'-TVL, LL-TVL, and 1+SN measurements decreased while 1-GOME (IMPA) increased. There were significant differences on ANOVA in 1+SN, IMPA, 1+TVL, LL-TVL, and UL-TVL. Compared to Group C, 1+SN and UL-TVL were lower in Group H, while IMPA and 1+TVL were higher in group H. Compared to the EA group, 1+SN and UL-TVL were lower in the H Group, while IMPA and LL-TVL were higher in the H Group.
Conclusion: The profile changes achieved by both devices are favourable for correcting class II skeletal malocclusion.
Keywords:
Facial Aesthetic
; Profile changes
; Herbst
; Elastodontics
1. Introduction
In orthodontics, it is very common to treat patients with a diagnosis of class II dentoskeletal malocclusion, as it has an incidence of 19.56% in the global population [1] and 12–32% in the Caucasian population [2] According to Angle [3], class II dental malocclusion is characterised by the distal position of the lower first molar in relation to the upper first molar. Patients with class II dental and skeletal malocclusion have protruding upper incisors, a reduced mentolabial angle, a retruded lower lip, a non-prominent chin, and a convex and retrognathic facial profile [4,5]. The main cause of class II dentoskeletal malocclusion is mandibular retrognathia, which is found in 48% of young patients with class II malocclusion [4]. As is well known from studies by Moss [6], mandibular retrognathia is influenced by the function of the surrounding soft tissues. To correct Class II malocclusion, various therapeutic approaches can be used, including extra-oral traction, a fixed appliance, extraction procedures, and functional orthopaedic appliances [4]. In the literature, different functional orthopaedic appliances have been proposed to induce skeletal and neuromuscular adaptations in order to achieve mandibular growth. Some of these appliances include the Herbst, the Twin Block, elastodontics, the Sander’s bite jumping appliance, the SOCIA (Swallowing Occlusal Contact Intercept Appliance), and the Frankel [7,8,9,10].
The Herbst appliance is a rigid fixed functional orthodontic appliance widely used for the treatment of Class II malocclusion [11]. It corrects sagittal skeletal and occlusal relationships, stimulates the condylar growth upward and backward, and promotes advancement of the mandibular body, the chin prominence, and the lower lip to improve the aesthetics of the facial profile [7,12,13]. Elastodontic devices are removable silicone elastomer devices which are used in patients with permanent early teething to treat Class II malocclusion [14,15]. When used during the initial stage of mixed teething, they act as a "shield" for the cheeks and lips; prevent incorrect positioning of the tongue and lower lip during swallowing; produce transverse bone growth; promote nasal breathing; correct open bite, overjet, overbite and sagittal discrepancy; and improve the relationship between the jaws. [15,16].
Individuals with Class II malocclusion require orthodontic treatment for aesthetic improvement because, due to the increased overjet and unfavourable profile, they often have low self-esteem. Facial aesthetics therefore influence the social life of patients [17]. For this reason, changes in facial aesthetics must be evaluated when choosing one therapeutic approach over another. In order to calculate these changes, use proportional relationships of soft tissues, as well as cephalometric references that relate teeth position to cranial or facial bones [13]. Although there are several studies that examine the dental, skeletal, and aesthetic effects of each appliance separately [5,7,10], there have been no studies that have analysed these effects simultaneously in patients treated with the Herbst appliance compared to patients treated with elastodontics.
The aim of this study was to evaluate modifications in facial profile aesthetics following Herbst and elastodontic therapy in patients with Class II malocclusion compared to a control group. The null hypothesis tested was that the profile changes obtained with Herbst and elastodontics therapy were not significantly different compared to those in the untreated control group.
2. Materials and Methods
This study was reported following the Strengthening The Reporting of OBservational Studies in Epidemiology (STROBE) guidelines for observational studies [18].
All the procedures of this research protocol have adhered to the Declaration of Helsinki and have been approved by the Ethics Committee of the University of XXXXX (Approval no.43 / CE / 2019). The records were retrieved retrospectively and analysed anonymously, and the patients signed a written informed consent form. The inclusion criteria were class II skeletal malocclusion (ANB>4°), mandibular retrognathia (SNB<78°), age between 8 and 11 years, overjet ≥ 5 mm, late mixed dentition, absence of temporomandibular joint disorders and skeletal age between CS2 and CS3 according to the cervical vertebral maturation method. The exclusion criteria were destructive caries, skeletal malformation, mono or bilateral cross bite and scissor bite, systematic diseases, congenitally missing or extracted permanent tooth, previous orthodontic treatment and impacted teeth.
A power analysis (G*Power 3.1.9.2, Franz Faul, Universitat Kiel, Germany) showed that to detect a large effect size of 0.4 [19] with a one-way ANOVA test with an α error probability of 0.05 and a power of 0.95, 34 subjects for each group would be needed.
The sample consisted of three groups: one group composed of patients treated with Herbst appliance (Group H), one group composed of patients treated with Elastodontic appliance (Group EA) and one group composed of untreated controls (Group C). Groups H and EA were retrospectively enrolled from patients treated at the Department of Orthodontics, University XXXXX, Italy, in chronological order from October 2018 to July 2020. Once a Class I molar and canine relationship was attained, the treatment reached its conclusion. Group C was selected from the Michigan Medical Library. Similar dentoskeletal characteristics were observed in the three samples at baseline (T0). The records included pre-treatment (T0) and post-treatment (T1) assessments comprising study models, photographs, panoramic radiographs, and lateral cephalograms.
2.1. Group H
The group treated with the Herbst appliance (Group H) consisted of 16 females and 24 males with a mean age of 9.2 ± 0.6 years. Figure 1 shows the clinical photos of the Herbst appliance. The mean treatment time was 10 months. The Herbst appliance was composed of a telescopic tube attached to the band of the superior first permanent molar and by a telescope plunger attached to the inferior canine. In the maxillary arch, the anchorage was provided by a palatal or buccal sectional arch wire connecting the first molar to the first premolar. Additionally, a stainless steel lingual arch was used to connect the left mandibular molars to the right mandibular molars, with occlusal rests on the lower first premolars or deciduous second molars.
2.2. Group EA
The group treated with the elastodontic appliance (Group EA) consisted of 22 females and 18 males with a mean age of 9.46 ± 0.6 years. The mean treatment time was 14 months. The EAs used (AMCOP SC series, Micerium, Genoa, Italy) were preformed elastomeric silicone appliances. To select the size, patient impressions were evaluated, and the distance between the vestibular cusps of the upper first molars was measured. This measurement was then compared to a size selection chart provided by the manufacturer. Patients were instructed to wear the appliance during sleep and for four hours in the afternoon. The patients were not asked to perform myofunctional exercises. Figure 2 shows the clinical photos of the Elastodontic appliance.
2.3. Group C
The control group (Group C) consisted of 26 females and 14 males with a mean age of 9.7 ± 0.6 years. These subjects did not receive any orthodontic treatment. These patients were sourced from the Michigan Medical Library and specifically chosen based on age and gender to ensure comparability with the other two analysed groups.
2.4. Cephalometric Analysis
Lateral head films (Gendex GXDP-700) were taken with the patient’s head correctly positioned in a cephalostat, ensuring centric occlusion and providing ample visibility of reference structures without significant head rotation. To minimise methodological errors, cephalometric analysis was performed by a qualified examiner, and all measurements were conducted twice by the same operator.
Facial profile assessments were carried out using the Arnett analysis [20]. This analysis is based on linear measurements and angles, with reference to a line called the True Vertical Line (TVL). The TVL is a vertical line perpendicular to the Frankfurt plane which passes through the subnasal point (SN). The landmarks and reference lines used in the cephalometric analysis are presented in Figure 3 and described in Table 1.
2.5. Statistical Analysis
Data distribution analysis was conducted using the Shapiro-Wilk normality test (Table 2). Descriptive statistics were also performed (Table 2). Wilcoxon signed-rank test (Table 2) was used for pairwise comparison of the cephalometric measurements taken at T0 (pre-treatment) and at T1 (post-treatment) within each group, while a paired sample t-test was used in the case of a normal distribution of the data. The data were analysed using the GraphPad Prism software 6.0 (GraphPad Prism Software, San Diego, CA,USA). A p-value of <0.05 was considered to be statistically significant. The differences between the three groups were evaluated by a one-way ANOVA test for the T1 − T0 difference of each variable, followed by Tukey’s post hoc test (Table 3 and Table 4).
3. Results
3.1. Dental Outcomes
The EA group showed an increase in the 1+SN angle (p< 0.01). The H group showed an increase in the IMPA (p<0.01) and a decrease in the 1+SN angle (p<0.01).
3.2. Aesthetic Outcomes
The C group showed a decrease in the linear distance of the LL-TVL (p<0.01) and a decrease in the POG’-TVL distance (P<0.05). The EA Group showed a significant reduction of B’-TVL (p< 0.01) and POG’-TVL (p <0.01) distances. The H group had a reduction in the LL-TVL distance (p< 0.01), B’-TVL (p <0.05), and POG’-TVL (p<0.05) distances.
3.3. Comparison of Outcomes between Groups
One-way ANOVA (Table 3) showed a statistically significant difference in the following variables: 1+SN, IMPA,1+TVL, ULTVL, and LLTVL. Tukey’s post hoc test (Table 4) showed significant differences as follows:
- -
- 1+SN: was 3.85° greater in Group C than in Group H, and in Group EA was 4.47° greater than in Group H.
- -
- IMPA: was 5.73° greater in Group H than in Group C and 4.48° greater in Group H than in Group EA.
- -
- 1+TVL: in Group H was 2.19° greater than in Group C.
- -
- UL-TVL: was 2.29° greater in Group C than in Group H, and in Group EA was 1.71° greater than in Group H.
- -
- LL-TVL: in Group H was 2.72° greater than in Group EA.
4. Discussion
The purpose of orthodontic treatment is to achieve a good occlusal relationship with facial harmony, which are both determined by the hard and soft tissues of the face [21]. The treatment plan for class II malocclusion should, therefore, aim to resolve dental and skeletal disharmony in order to achieve a favourable facial aesthetic [22]. It is not possible to define the characteristics of an attractive soft tissue profile, but according to some authors [13] a relatively straight profile is preferred. Since Class II malocclusion is characterised by a convex facial profile of the soft tissues, orthodontic treatment should enhance facial aesthetics by reducing the convexity of the profile [13].
To the best of our knowledge, this is the first study to evaluate changes in facial aesthetics in Class II patients treated with the Herbst appliance, treated with elastodontics, and a control group.
From T0 to T1, elastodontic treatment resulted in a significant increase in 1+SN due to increased labial inclination of the upper incisors, in line with the previous observations by Keski-Nisula et al. [16]. A reduced 1+TVL distance is also indicative of labial inclination of the upper incisors, which can worsen the patients' facial profile. However, Galluccio et al. [23] reported significant retraction of the upper lip relative to Ricketts' aesthetic line in Class II subjects treated with Occlus-O-Guide.
However, from T0 to T1, elastodontic treatment was also associated with an increase in IMPA due to the increase in labial inclination of the lower incisors, which also resulted in the advancement of the lower lip as indicated by a reduction in the LL-TVL distance, which, nevertheless, was not statistically significant. Furthermore, a reduction in B'-TVL and POG'-TVL distances was observed in patients treated with elastodontic appliances. Therefore, elastodontic treatment resulted in a change in the facial profile of the patients, leading to an improvement of the lower third of the face.
Patients treated with Herbst appliance experienced greater discomfort including irritation, pain, and difficulty speaking and eating. However, the device provided more precise and constant control over tooth movements and required less active effort from the patients, although they showed more difficulty in maintaining appropriate oral hygiene. The elastodontic appliance required good cooperation from the patients, who had to wear it for the number of hours per day indicated by the orthodontist. However, patients had no difficulty managing oral hygiene and experienced less discomfort and pain during therapy.
In patients treated with Herbst's appliance, B'-TVL, POG'-TVL, and LL-TVL decreased significantly from T0 to T1, while an increase in IMPA related to the labial inclination of the lower incisors was observed. These patients also showed a decrease in 1+SN due to the palatal inclination of the upper incisors. These results are in agreement with those reported by Pancherz et al. [13] in a group of patients with Class II malocclusion treated with the Herbst appliance, where the E-line was used to assess soft tissue-related changes. Therefore, the Herbst appliance results in an advancement of the mandible, a proclination of the lower incisors, and a palatal inclination of the upper incisors, which result in a reduction of the convexity of the profile by improving the skeletal and soft tissue relationships of the middle third of the face, as reported by Irezli and Baysal [24].
When comparing the groups, a greater inclination of the upper incisors was observed in patients treated with elastodontics compared to those treated with the Herbst appliance, while a greater labial inclination of the lower incisors was observed in patients treated with the Herbst appliance compared to those treated with elastodontics. The effects observed on soft tissues reflect the action of the appliances on the teeth and hard tissue; in fact, the UL-TVL distance was increased in patients treated with elastodontics compared to those treated with the Herbst appliance. Finally, the LL-TVL distance was greater in patients treated with the Herbst appliance compared to those treated with elastodontics.
The results of the present study show that both devices resulted in an improvement in soft tissue by reducing the profile convexity in patients with Class II malocclusion. It is likely that the effect on soft tissue is, in part, due to the action of the devices on the muscles, as a change in neuro-muscular circuits promotes a balancing of hard tissue and consequently improves soft tissue projection.
Limitations of the Study
The limitations of the study are related to its retrospective nature and lack of long-term follow-up. Moreover, when comparing a fixed and a mobile device, the results observed in the group of patients treated with elastodontic devices could be influenced by patient compliance. As the untreated subjects were recruited from a university dental clinic, some inherent biases are possible. Long-term clinical studies with a large sample are therefore required to overcome these limitations.
5. Conclusions
Elastodontics are removable devices whose effectiveness is related to patient compliance, as opposed to the Herbst device, which is cemented and therefore fixed. Both devices are effective in correcting class II malocclusions. These devices are able to modify soft tissues and thus improve patient profiles.
Contribution
DC: ML and RL: acquisition, analysis and interpretation of data, and revision of the article. MT, APC and ML: acquisition, analysis and interpretation of data, and revision of the article. DC and CF: concept and design of the work, analysis and interpretation of data, critical review of the important intellectual content. SC: concept and design of the work, critical review of the important intellectual content. DC and MT; concept and design of the work, analysis and interpretation of data, drafting and revision of the article.
Disclosure of interest
The authors declare that they have no competing interest.
References
- Alhammadi MS, Halboub E, Fayed MS, Labib A, El-Saaidi C: Global distribution of malocclusion traits: A systematic review. Dental Press J Orthod 2018, 23(6):40 e41-40 e10.
- Bock NC, von Bremen J, Ruf S: Stability of Class II fixed functional appliance therapy--a systematic review and meta-analysis. Eur J Orthod 2016, 38(2):129-139.
- ngle EH: Classification of malocclusion. Dent Cosmos 1899, 41:350-357.
- McNamara JA, Jr.: Components of class II malocclusion in children 8-10 years of age. Angle Orthod 1981, 51(3):177-202.
- von Bremen J, Erbe C, Pancherz H, Ruf S: Facial-profile attractiveness changes in adult patients treated with the Herbst appliance. J Orofac Orthop 2014, 75(3):167-174.
- Moss ML: The functional matrix hypothesis revisited. 4. The epigenetic antithesis and the resolving synthesis. Am J Orthod Dentofacial Orthop 1997, 112(4):410-417.
- Baysal A, Uysal T: Soft tissue effects of Twin Block and Herbst appliances in patients with Class II division 1 mandibular retrognathy. Eur J Orthod 2013, 35(1):71-81.
- Di Palma E, Tepedino M, Chimenti C, Tartaglia GM, Sforza C: Effects of the functional orthopaedic therapy on masticatory muscles activity. J Clin Exp Dent 2017, 9(7):e886-e891.
- Ciavarella D, Lo Russo L, Nichelini J, Mastrovincenzo M, Barbato E, Laurenziello M, Montaruli G, Lo Muzio L: Treatment of hyperdivergent growth pattern and anterior open bite with posterior metallic bite planes. Minerva Stomatol 2017, 66(6):267-274.
- Ciavarella D, Campobasso A, Campa R, Suriano C, Illuzzi G, Cazzolla A, Tepedino M: Cephalometric effects of the elastodontic appliance in managing skeletal Class II division 1 cases. Australasian Orthodontic Journal 2021, 37:251-258.
- Ruf S: Orthodontic treatment of the Class II noncompliant patient. Current principles and techniques (2006). European Journal of Orthodontics 2007, 29(1):110-110.
- Atresh A, Cevidanes LHS, Yatabe M, Muniz L, Nguyen T, Larson B, Manton DJ, Schneider PM: Three-dimensional treatment outcomes in Class II patients with different vertical facial patterns treated with the Herbst appliance. Am J Orthod Dentofacial Orthop 2018, 154(2):238-248 e231.
- Pancherz H, Anehus-Pancherz M: Facial profile changes during and after Herbst appliance treatment. Eur J Orthod 1994, 16(4):275-286.
- Keski-Nisula K, Keski-Nisula L, Salo H, Voipio K, Varrela J: Dentofacial changes after orthodontic intervention with eruption guidance appliance in the early mixed dentition. Angle Orthod 2008, 78(2):324-331.
- Usumez S, Uysal T, Sari Z, Basciftci FA, Karaman AI, Guray E: The effects of early preorthodontic trainer treatment on Class II, division 1 patients. Angle Orthod 2004, 74(5):605-609.
- Keski-Nisula K, Keski-Nisula L, Varrela J: Class II treatment in early mixed dentition with the eruption guidance appliance: effects and long-term stability. Eur J Orthod 2020, 42(2):151-156.
- Moresca AHK, de Moraes ND, Topolski F, Flores-Mir C, Moro A, Moresca RC, Correr GM: Esthetic perception of facial profile changes in Class II patients treated with Herbst or Forsus appliances. Angle Orthod 2020, 90(4):571-577.
- von Elm E, Altman DG, Egger M, Pocock SJ, Gotzsche PC, Vandenbroucke JP, Initiative S: The Strengthening the Reporting of Observational Studies in Epidemiology (STROBE) Statement: guidelines for reporting observational studies. Int J Surg 2014, 12(12):1495-1499.
- Cohen J: Statistical Power Analysis. Current Directions in Psychological Science 1992, 1(3):98-101.
- Arnett GW, Jelic JS, Kim J, Cummings DR, Beress A, Worley CM, Jr., Chung B, Bergman R: Soft tissue cephalometric analysis: diagnosis and treatment planning of dentofacial deformity. Am J Orthod Dentofacial Orthop 1999, 116(3):239-253.
- Spyropoulos MN, Halazonetis DJ: Significance of the soft tissue profile on facial esthetics. Am J Orthod Dentofacial Orthop 2001, 119(5):464-471.
- Quintao C, Helena I, Brunharo VP, Menezes RC, Almeida MA: Soft tissue facial profile changes following functional appliance therapy. Eur J Orthod 2006, 28(1):35-41.
- Galluccio G, Guarnieri R, Jamshir D, Impellizzeri A, Ierardo G, Barbato E: Comparative Evaluation of Esthetic and Structural Aspects in Class II Functional Therapy. A Case-Control Retrospective Study. Int J Environ Res Public Health 2021, 18(13).
- . Irezli EC, Baysal A: Changes in the craniofacial structures and esthetic perceptions of soft-tissue profile alterations after distalization and Herbst appliance treatment. Am J Orthod Dentofacial Orthop 2021, 159(3):292-304.
Figure 1.
The clinical photos of the Herbst appliance.
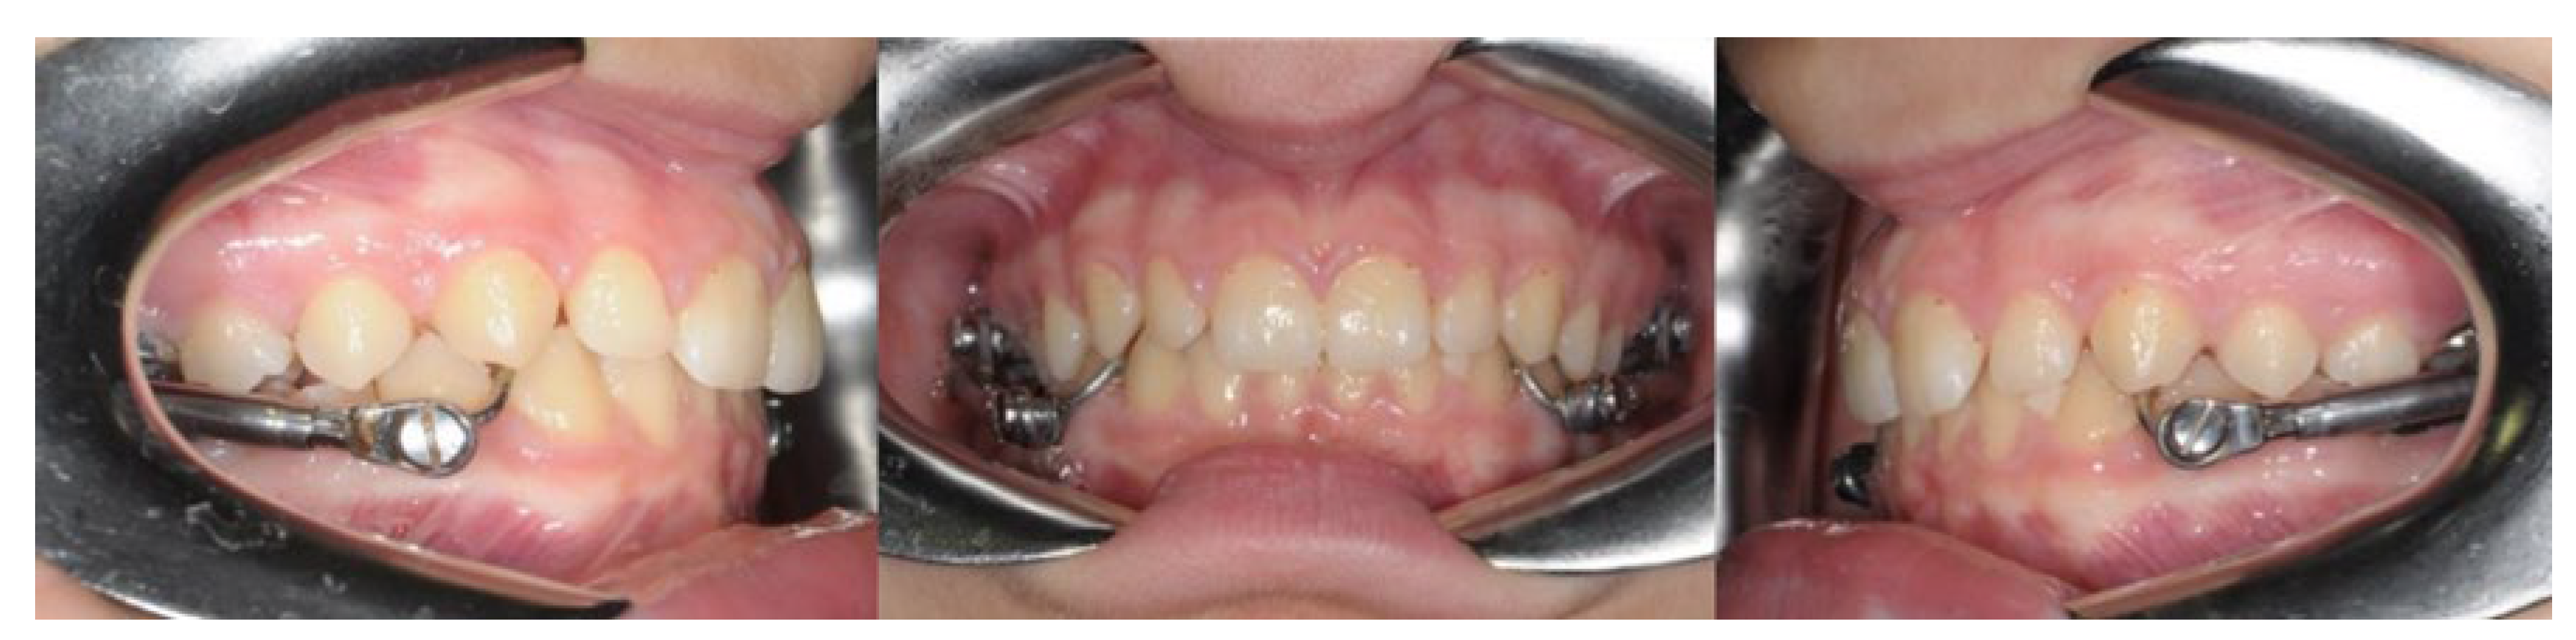
Figure 2.
The clinical photos of the Elastodontic appliance.
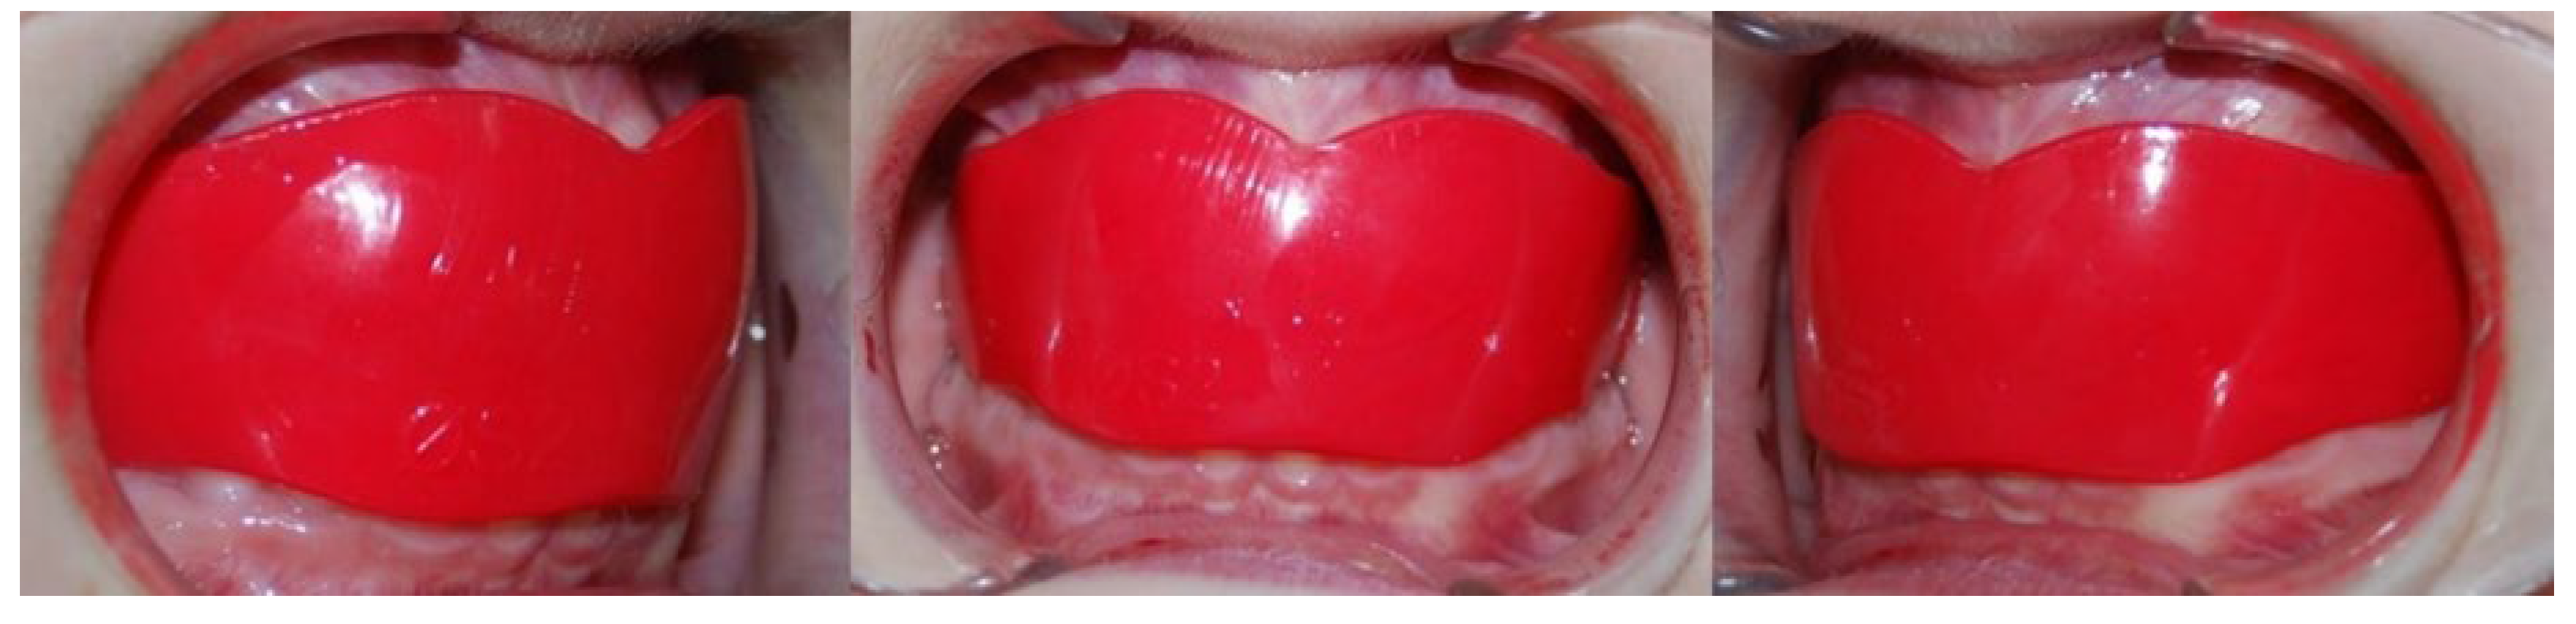
Figure 3.
Cephalometric landmarks and reference lines.
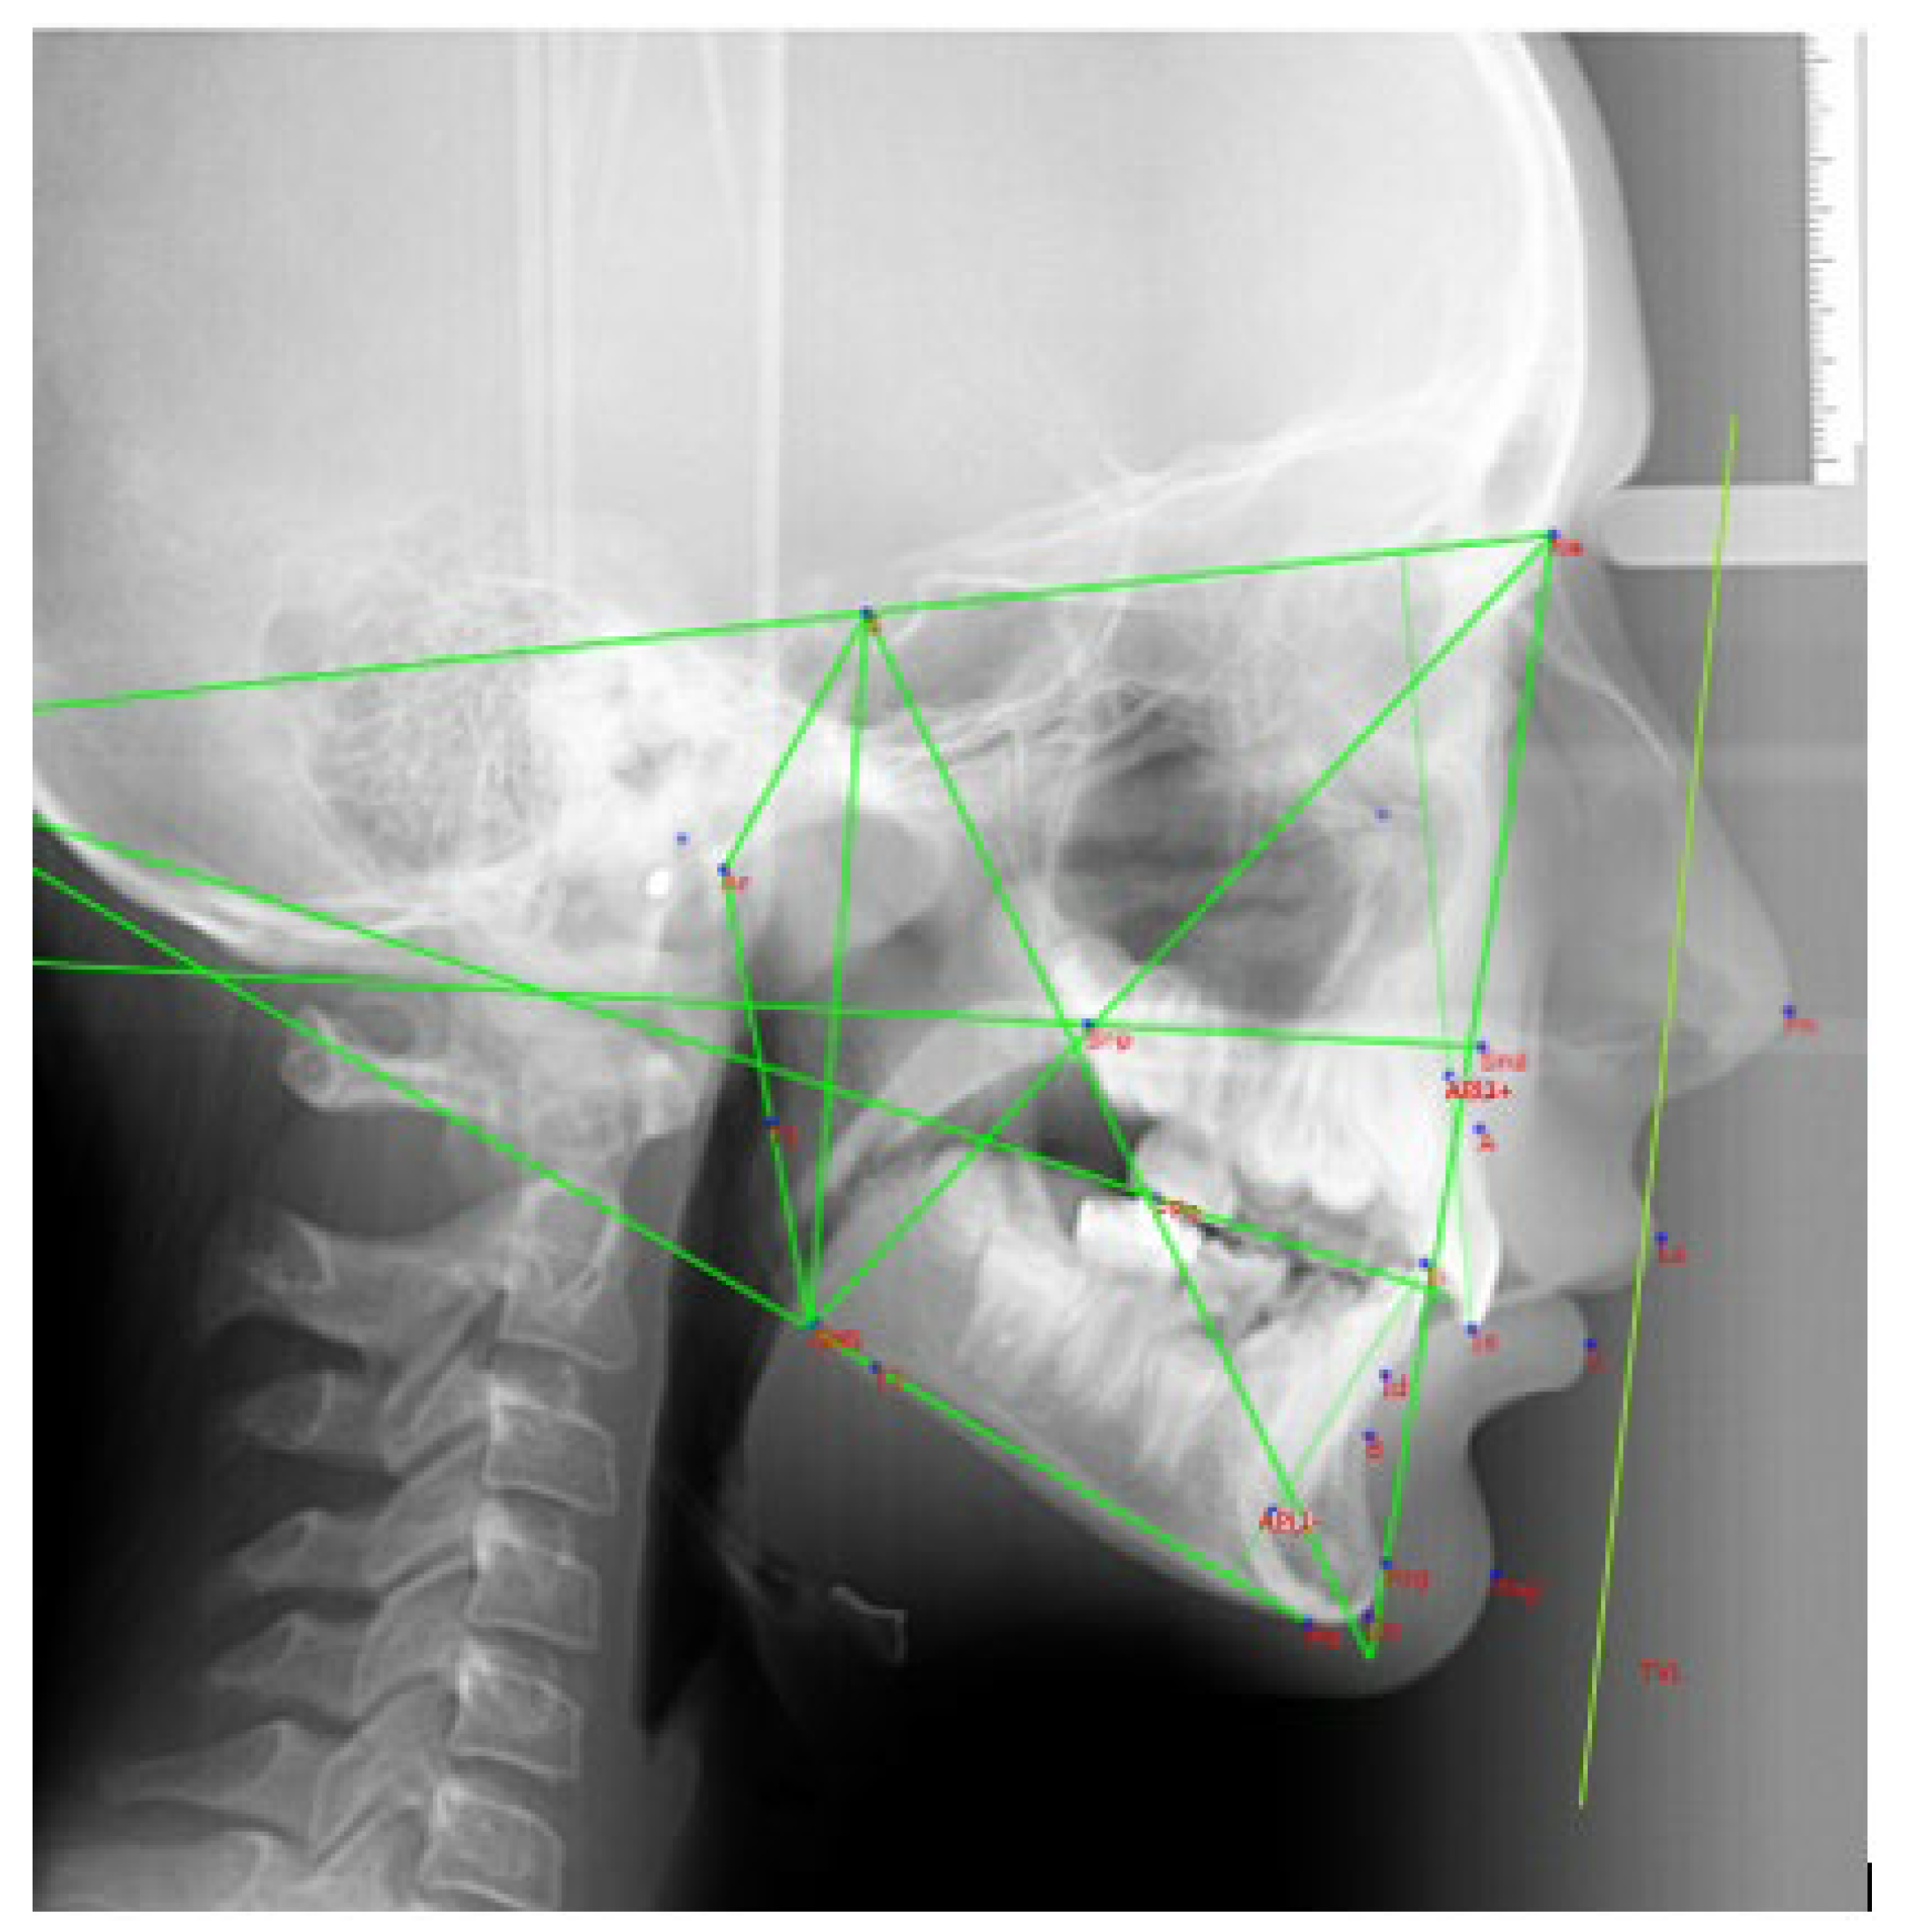

Table 1.
Cephalometric measurements: dental and aesthetic parameters.
| Dental measurements | |
|---|---|
| 1+SN | Basal incisor angle between the line joining S-N and the straight line passing between the incisal edge and API+ (Apical Point upper Incisor) |
| IMPA | Incisor angle between the line passing through the lower incisor margin and API- (Apical Point lower Incisor) and the Go-Me line |
| 1+TVL | Linear distance between the most vestibular point of 1+ and the TVL |
| Aesthetic measurements | |
| SupportLab-TVL | Linear value of the distance between the lip support point and the True Vertical Line |
| UL-TVL | Linear value of the distance between the most protruding point of the upper lip and the True Vertical Line |
| LL-TVL | Linear value of the distance between the most protruding point of the lower lip and the True Vertical Line |
| B’-TVL | Linear value of the distance between the most recessed point of the chin and the True Vertical Line |
| POG’-TVL | Linear value of the distance between the most protruding point of the chin and the True Vertical Line |
Table 2.
Descriptive statistics, Wilcoxon signed-rank test and t-test between cephalometric variables taken at T0 and at T1 within the three groups.
Table 2.
Descriptive statistics, Wilcoxon signed-rank test and t-test between cephalometric variables taken at T0 and at T1 within the three groups.
| Group C | GROUP EA | GROUP H | ||||
|---|---|---|---|---|---|---|
|
1+SN Median Mean Std.Deviation Std.Error of mean Normality test P value |
T0 | T1 | T0 | T1 | T0 | T1 |
|
103,72 105,90 4,82 1,07 N.S. |
106,12 107 5,80 1,29 N.S. |
97,96 96,85 10,84 2,42 <0.05 |
101,10 100,90 7,77 1,73 <0.05 |
109,50 110,00 7,74 1,73 N.S. |
108,20 107,50 6,42 1,43 <0.05 |
|
| N.S. | p< 0.01 | p< 0.01 | ||||
|
IMPA Median Mean Std.Deviatiom Std.Error of mean Normality test P value |
92,13 90,85 6,48 1,45 <0.05 |
93,25 91,18 7,24 1,62 <0.05 |
95,49 95,98 3,09 0,69 <0.05 |
96,58 97,20 6,34 1,41 <0.05 |
95,47 94,79 3,99 0,89 N.S. |
100,70 100,90 3,45 0,77 N.S. |
| N.S. | N.S. | p< 0.01 | ||||
|
1+TVL Median Mean Std.Deviation Std.Error of mean Normality test P value |
-10,65 -11,98 2,82 0,63 <0.05 |
-11,89 -10,57 2,54 0,57 <0.05 |
-9,89 -9,66 2,46 0,55 N.S. |
-9,41 -8,83 2,24 0,50 N.S. |
-8,08 -8,33 2,02 0,45 N.S. |
-9,39 -9,11 1,50 0,33 N.S. |
| N.S. | N.S. | N.S. | ||||
|
SupportLab-TVL Median Mean Std. Deviation Std. Error of Mean Normality test P value |
-0,21 -0,24 0,68 0,15 <0.05 |
0,02 0,04 2,0 0,44 <0.05 |
-0,03 0,36 1,74 0,39 N.S. |
-0,08 0,04 0,93 0,20 N.S. |
-0,66 -0,44 0,86 0,19 N.S. |
-0,28 -0,08 1,01 0,22 <0.05 |
| N.S. | N.S. | N.S. | ||||
|
UL TVL Median Mean Std. Deviation Std. Error of Mean Normality test P value |
1,29 1,49 1,92 0,42 N.S. |
0,68 0,71 3,26 0,72 N.S. |
2,33 2,09 2,13 0,47 <0.05 |
1,76 2,04 2,26 0,50 N.S. |
0,80 1,05 1,13 0,25 N.S. |
0,88 1,37 1,31 0,29 N.S |
| N.S. | N.S. | N.S. | ||||
|
LL TVL Median Mean Std. Deviation Std. Error of Mean Normality test P value |
-5,17 -5,44 4,00 0,89 <0.05 |
-3,43 -3,77 3,48 0,77 <0.05 |
-2,86 -2,33 2,96 0,66 <0.05 |
-1,19 -1,42 3,35 0,75 N.S. |
-2,71 -2,82 1,89 0,42 N.S. |
0,18 -0,51 2,21 0,49 N.S. |
| p<0.01 | N.S. | p< 0.01 | ||||
|
B’ TVL Median Mean Std. Deviation Std. Error of Mean Normality test P value |
-15,26 -15,81 5,12 1,14 <0.05 |
-13,31 -13,86 3,74 0,83 <0.05 |
-11,65 -12,19 2,96 0,66 N.S. |
-9,58 -10,40 3,95 0,88 N.S. |
-12,27 -12,33 2,55 0,57 N.S. |
-8,83 -10,07 3,50 0,78 N.S. |
| N.S. | p< 0.01 | p<0.05 | ||||
|
POG’ TVL Median Mean Std. Deviation Std. Error of Mean Normality test P value |
-18,93 -17,73 5,42 1,21 N.S. |
-15,32 -14,43 5,49 1,22 N.S. |
-13,63 -12,85 3,42 0,76 <0.05 |
-10,19 -10,01 3,51 0,78 <0.05 |
-11,95 -12,86 4,30 0,96 N.S. |
-7,57 -10,28 5,98 1,33 N.S. |
| p<0.05 | p<0.01 | p <0.05 | ||||
Table 3.
One-way ANOVA test for all the cephalometric variables between the three groups.
| Sum of squares | df | Mean square | F | Sig. | ||
|---|---|---|---|---|---|---|
| 1+SN | Between groups | 234.82 | 4 | 117.41 | 7.294 | 0.002* |
| Within groups | 917.55 | 114 | 16.09 | |||
| Total | 1152.37 | 118 | ||||
| 1-GOME(IMPA) | Between groups | 381.28 | 4 | 190.61 | 8.49 | 0.001* |
| Within groups | 1279.46 | 114 | 22.447 | |||
| Total | 1660.70 | 118 | ||||
| 1+TVL | Between groups | 51.52 | 4 | 25.76 | 4.32 | 0.018* |
| Within groups | 339.88 | 114 | 5.96 | |||
| Total | 391.40 | 118 | ||||
| SUPPORTLAB-TVL | Between groups | 5.45 | 4 | 2.72 | 1.06 | 0.353 |
| Within groups | 146.39 | 114 | 2.56 | |||
| Total | 151.85 | 118 | ||||
| UL TVL | Between groups | 56.81 | 4 | 28.40 | 14.57 | 0.000* |
| Within groups | 111.06 | 114 | 1.94 | |||
| Total | 167.87 | 118 | ||||
| LL TVL | Between groups | 74.26 | 4 | 37.13 | 5.60 | 0.006* |
| Within groups | 377.47 | 114 | 6.62 | |||
| Total | 451.73 | 118 | ||||
| B’ TVL | Between groups | 5.38 | 4 | 2.69 | 0.21 | 0.805 |
| Within groups | 705.64 | 114 | 12.38 | |||
| Total | 711.02 | 118 | ||||
| POG’ TVL | Between groups | 10.90 | 4 | 5.45 | 0.29 | 0.750 |
| Within groups | 1073.05 | 114 | 18.82 | |||
| Total | 1083.96 | 118 | ||||
Table 4.
Tukey’s post hoc test.
| Dependent variable | (I) Group | (J) Group | Mean difference (I − J) |
Std error | Sig. | 95% Confidence interval | |
|---|---|---|---|---|---|---|---|
| Lower bound | Upper bound | ||||||
| 1+SN | C EA EA |
H | 3.85* | 1.26 | 0.01 | 0.79 | 6.90 |
| C | 0.62 | 1.26 | 0.87 | −2.42 | 3.67 | ||
| H | 4.47* | 1.26 | 0.00 | 1.42 | 7.25 | ||
| 1-GOME (IMPA) | C EA EA |
H | -5.73* | 1.49 | 0.00 | -9.34 | -2.13 |
| C | 0.89 | 1.49 | 0.82 | −2.70 | 4.50 | ||
| H | -4.84* | 1.49 | 0.00 | -8.44 | -1.23 | ||
| 1+TVL | C EA EA |
H | -2.19* | 0.77 | 0.01 | 0.33 | 4.05 |
| C | -0.59 | 0.77 | 0.72 | -2.45 | 1.26 | ||
| H | 1.60 | 0.77 | 0.10 | -0.25 | 3.45 | ||
| SUPPORTLAB-TVL | C EA EA |
H | -0.10 | 0.50 | 0.97 | -1.32 | 1.11 |
| C | -0.57 | 0.50 | 0.49 | -1.79 | 0.64 | ||
| H | -0.68 | 0.50 | 0.37 | -1.90 | 0.53 | ||
| UL TVL | C EA EA |
H | 2.29* | 0.44 | 0.00 | 1.22 | 3.35 |
| C | -0.57 | 0.44 | 0.39 | -1.63 | 0.48 | ||
| H | 1.71* | 0.44 | 0.00 | 0.65 | 2.77 | ||
| LL TVL | C EA EA |
H | -1.33 | 0.81 | 0.23 | -3.29 | 0.62 |
| C | -1.38 | 0.81 | 0.21 | -3.34 | 0.56 | ||
| H | -2.72* | 0.81 | 0.00 | -4.68 | -0.76 | ||
| B’ TVL | C EA EA |
H | -0.30 | 1.11 | 0.96 | -2.97 | 2.37 |
| C | -0.42 | 1.11 | 0.92 | -3.10 | 2.24 | ||
| H | -0.73 | 1.11 | 0.79 | -3.40 | 1.94 | ||
| POG’ TVL | C EA EA |
H | 1.04 | 1.37 | 0.72 | -2.25 | 4.34 |
| C | -0.49 | 1.37 | 0.93 | -3.79 | 2.80 | ||
| H | 0.54 | 1.37 | 0.91 | -2.75 | 3.85 | ||
According to the results of the study, the null hypothesis was rejected.
Disclaimer/Publisher’s Note: The statements, opinions and data contained in all publications are solely those of the individual author(s) and contributor(s) and not of MDPI and/or the editor(s). MDPI and/or the editor(s) disclaim responsibility for any injury to people or property resulting from any ideas, methods, instructions or products referred to in the content. |
© 2024 by the authors. Licensee MDPI, Basel, Switzerland. This article is an open access article distributed under the terms and conditions of the Creative Commons Attribution (CC BY) license (http://creativecommons.org/licenses/by/4.0/).
Copyright: This open access article is published under a Creative Commons CC BY 4.0 license, which permit the free download, distribution, and reuse, provided that the author and preprint are cited in any reuse.


