Submitted:
14 October 2024
Posted:
14 October 2024
You are already at the latest version
Abstract
Six up-to-date reconstructions of hemispheric and global temperature and two indices of volcanic activity were analyzed using both Fourier and wavelet approaches over time intervals up to 1500 years. A cyclicity with a period of 188-250 years was found present in both Northern Hemisphere temperature and volcanic activity. These cycles were found to be negatively correlated, with the maximum correlation coefficient being reached when volcanic variations lead temperature vari-ations by 20 years. The combined probability of the null hypothesis – the proposition that in the Northern Hemisphere there is no real association between the bicentennial change in volcanic activity and temperature and that the revealed correlations arose purely by chance – was found to be no more than 1.2×10⁻² over the entire time interval and less than 10-2 over the time interval AD 1270-1980. The effect was weaker in global temperature and was not detected in the Southern Hemisphere. Possible origins of the identified bicentennial correlations are discussed and guidelines for further research are proposed.
Keywords:
climatic variability
; volcanic activity
; paleoclimatology
1. Introduction
Global climate change, due to its great impact on all aspects of human activity, has become one of the most important problems of modern natural science. One of the main challenges in global change research is isolating variations caused by external forcings, as they need to be separated from the background of natural climate variability. For example, identifying the anthropogenic contribution to global warming over the past 120 years rep-resents an important scientific task. The main difficulty of such an analysis is related to the brevity of available of instrumental data sets. Direct temperature records typically span no more than the last 100–150 years, so they are insufficient to set limits on the am-plitude of long-term (multidecadal or longer) climate variability. Paleoclimatology, which has been actively developing in recent years, makes it possible to overcome these difficul-ties. The use of long-term paleocrecords provides a unique opportunity to expand our knowledge of long-term climate change. Modern long-term climate reconstructions from natural climate archives span up to the last few millennia. Thus, they seem to be a poten-tial source of information on the climatic variations with periods up to century or even more. The most commonly used source of information on temperature in the past is tree rings since they provide annually resolved and precisely dated climate signal which cor-relates well with observed temperature and precipitation records. One of the major chal-lenges in dendroclimatology is that the standardization procedure — biological trend re-moval — can suppress long-term variations and thus limit the preservation of medium- and low-frequency variability. However, recent advances in standardization techniques make it possible to retain much more low-frequency climate information [1]. Therefore, modern temperature reconstructions have become suitable for analyzing long-term varia-tions with periods of up to several centuries.
In the last 15 years, a number of evidences have been obtained for the presence of a bicentennial (about 200 years) variability in the Earth's climate. This variation has al-ready been identified in: (a) temperature in Central Asia [2], (b) temperature in northeast-ern Alaska [3], (c) monsoon precipitation on the Qinghai–Tibetan Plateau [4], (d) mon-soon precipitation in South America [5], (e) temperature in Southern Hemisphere [6,7]. Breitenmoser et al. [8] analyzed near global collection of 17 annually-resolved tree-ring-based climate proxies and found bicentennial periodicity in 10 of them. This work continues the study of such variability of the Earth's climate. The aim of this work is to search for quasi-200-year climate changes on a hemispheric scale and to study their possible links with long-term changes in solar and volcanic activity.
2. Materials and Methods
In this work, I used the four most recent Northern Hemisphere temperature recon-structions by Schneider et al. [9], Wilson et al. [10], Guillet et al. [11], Büntgen et al. [12] ob-tained during the last 10 years. The Southern Hemisphere temperature reconstruction by Neukom et al. [13] and the median of the full ensemble of PAGES2k global mean temper-ature reconstructions [14] were also used. These series aggregate information from tens to thousands individual records most relevant to understanding the evolution of tempera-ture over two millennia. These indicators include data on tree-ring width (TRW), maxi-mum latewood density (MXD), stable isotopes in terrestrial archives, marine and lake sediments, documentary information, borehole temperature, speleothems and cover the period up to the last 2000 years. They were obtained using advanced standardization methods that preserve low-frequency information. Thus, they are suitable for studying temperature variations with periods of up to several centuries. Most of the time series used reconstruct summer temperatures. However, given that instrumentally measured summer temperatures in the Northern Hemisphere correlate well with yearly averages (Rl≈0.9), the used reconstructions should also reflect long-term variations in annual average tempera-tures well.
Volcanic sulfate aerosols are deposited with snow and preserved in polar ice. Thus, signals of past volcanic eruptions can be distinguished and quantified by measuring, sul-fate or acidity in polar ice cores. In this work I used two longest records of volcanic activity obtained by Gao et al. [15] and Crowley and Unterman [16] from the Greenland and Ant-arctic cores. The frequency of volcanic activity is not constant, but increases during certain periods, forming repeated clusters of volcanic eruptions, and is thus subject to long-term fluctuations. (see Figure 1a, b). Volcanic series averaged over 40 years were used as indicators of the long-term changes in volcanic activity. All data used are described in Table 1 and shown in Figure 1.
Fourier and wavelet analyses were used for study of the spectral properties of climatic and volcanic series. Levels of significance of the peaks of Fourier and global wavelet spectra were estimated relative to red noise background according to (Torrence and Compo[17]).
To select quasi-bicentennial cycles all analyzed records were wavelet filtered in 171–259 year band using the real-valued MHAT (Mexican hat) basis (see Torrence and Compo [17]).
The significance of the correlation between band-pass filtered records was assessed using a statistical experiment involving an ensemble of Monte Carlo simulations. Each simulation contained: (a) generating random copies of the analyzed signals by randomizing the phases of their Fourier transforms, (b) wavelet filtering of the random copies in the range 171-272 years, (c) calculating the correlation coefficient between two filtered random copies and comparing them with the coefficient of correlation between filtered actual data sets. If coefficient of correlation between filtered random copies was greater than the coefficient of correlation between the filtered actual records the result of simulation was considered positive. The probability of the null hypothesis – the assumption that the observed band-pass correlation between the time series under study occurs by chance – was estimated as a ratio of number of positive results to a total number of simulations. The statistical test applied uses the nonparametric random phase method of Ebisuzaki [18], based on the generation of a large number of random series with the same power spectra as the analyzed signal, but with random phases in the Fourier modes (see also [19,20]).
Fisher’s method for assessing of the combined probability was used to estimate probability of the overall null hypothesis using a number of temperature series.
3. Results
The Fourier spectra of the analyzed time series obtained using the Morlet basis are shown in Figure 2.
Figure 2 shows that almost all analyzed data sets, both volcanic and temperature, have a significant variation with a period of 188-250. Only global temperature has variation with period 170 years, which probability of null-hypothesis p exceeds 0.05. The global wavelet spectra of these records also show the presence of a bicentennial (periods of 195-250 years) variation. The period of this variation is close to the period of the Suess solar cycle, which is 195-250 years [21,22]. To examine a possible relationship between the quasi 200-year temperature variations and corresponding change in solar and volcanic activity, correlation coefficients were calculated between time series wavelet filtered in the bicentennial frequency band (171–282 years). No significant correlation between the quasi 200-year periodicities in hemispheric and global climate proxies and millennial solar activity reconstructions obtained in [23,24,25,26,27,28] were found. Change in volcanic activity is another potential contributor to the bicentennial hemispheric-scale cyclicity [8]. The coefficients of correlation between wavelet filtered volcanic and temperature data sets are shown in Table 2 together with their significances (p-values) in brackets.
The analysis carried out showed that the two-hundred-year variations in Northern Hemisphere and global temperatures are negatively correlated with the corresponding change in volcanic activity. In two cases, NHW and NHB, the correlation is significant with p values less than 0.05, but the NHG series is very weakly correlated. In most cases, the correlation coefficient is maximum when the lag between volcanic activity and temperature is 20 years. That is, the two-hundred-year cycle in volcanic activity is 20 years ahead of the corresponding cycle in temperature. In some cases, the maximum is reached with a shift of 10 and 30 years, but the difference is small. In the Southern Hemisphere, this effect is not detected. Figure 3 illustrates these correlations:
If we consider the significances of the volcano-climatic correlation, obtained by using reconstructions [9,10,11,12], as results of the four independent tests of null-hypothesis for the actual temperature variability in the Northern Hemisphere, then we can use Fisher's method [29] to estimate the joint probability. Using Fisher's test, we can calculate the test statistic:
where is the probability of null-hypothesis obtained by i-test and k is a number of tests. For bicentennial correlations with SLF and AOD series we have:
According to Fisher [29] when all the tests are independent and all the null-hypotheses are true has a distribution. Probabilities of null-hypothesis for the obtained values are:
PSLF (19.9) = 1.1×10⁻²,
PAOD (23.7) = 2.5×10⁻³.
PAOD (23.7) = 2.5×10⁻³.
Thus, within the Fisher approach, the probability that the two-century temperature periodicity in the Northern Hemisphere is not associated with corresponding variations in volcanic activity is quite small. Figure 3 shows that in some cases the coherency between the two-hundred-year variations in volcanic activity and temperature is more pronounced in the second part of the analyzed time interval. Taking this into account, I calculated the correlation coefficients for the time interval AD 1270-1980. They are shown in Table 3.

Table 2.
Bandpass (171–282 years) correlations between volcanic and temperature indices shifted by 20 years calculated over the time interval AD 1270-1980.
Table 2.
Bandpass (171–282 years) correlations between volcanic and temperature indices shifted by 20 years calculated over the time interval AD 1270-1980.
| Source | NHS [9] |
NHW [10] |
NHG [11] |
NHB [12] |
GLB [14] | SHN [13] |
|---|---|---|---|---|---|---|
| SLF [15] | -0.52 (0.078) | -0.70 (0.027) | -0.38 (0.191) | -0.58 (0.067) | -0.50 (0.131) | -0.05 (0.901) |
| AOD [16] | -0.59 (0.068) | -0.72 (0.021) | -0.50 (0.113) | -0.72 (0.019) | -0.58 (0.068) | -0.20 (0.534) |
Small bold figures display coefficients of correlation with significance p<0.10, big bold figures – p<0.05.
Using Fisher's statistical test, we now obtain the following results:
Thus, in the last seven centuries, the correlation between the bicentennial cycles in temperature and volcanic activity has been increasing. The negative correlation in this interval is manifested both in the reconstruction NHG and in the global temperature. The overall probability of the null hypothesis in Northern Hemisphere is now less than 0.01. However, in the Southern Hemisphere the temperature-volcanic correlation does not appear after the middle of the 13th century.
Calculations using volcanic data averaged over 30 and 50 years as indicators of long-term volcanic activity yielded similar results.
4. Discussion and Conclusion
An analysis using four recent paleoreconstructions of Northern Hemisphere temperature found a negative correlation between bicentennial cycles in temperature and volcanic activity, although not all were highly significant. It should be noted, however, that we should not expect a perfect correlation because (a) the temperature series do not reconstruct real temperature with absolute accuracy, with reconstruction errors increasing in the past, (b) the ice core volcanic records may not accurately reflect volcanic activity because small eruptions may not be detected in high-latitude ice cores. It is all the more remarkable that the two-century variation in the NHB series correlates significantly with the corresponding cycle in volcanic activity over a period of almost 1500 years. Fisher's combined probability performed using the obtained separate p-values shows that the probability of the null hypothesis (the assumption that there is no relationship between the two-century variations in volcanic activity and temperature) for the entire Northern Hemisphere is no more than 1.1×10⁻².
Short-term influence of volcanic eruptions on climate is well-known. Volcanic eruptions release ash and sulfur gases that become sulfate aerosols. Large ash particles fall quickly, but the aerosols can remain in the stratosphere for several years, reducing the amount of solar radiation reaching the Earth's surface, lowering tropospheric temperatures, and changing atmospheric circulation patterns. The direct cooling effect can last to several years depending on the eruption. However, the cooling trend probably can be further extended by some feedback mechanisms. There is evidence that clusters of volcanic eruptions can maintain surface cooling for periods of up to centuries [30,31,32,33] and even millennia [34] due to ocean–sea-ice feedbacks.
In most cases, the correlation is greatest when the bicentennial periodicity in volcanic activity is 20 years ahead of the corresponding temperature variation. Such a delay time probably reflect the characteristic times of oceanic response to volcanic radiative forcing. For example, model experiments of Zhong et al. [31] showed that maximum cooling in the upper 100 meters of the subpolar North Atlantic reaches maximum about 30 years after a cluster of four eruptions. Results of model simulation performed by Miller et al. shows that explosive volcanism can produces abrupt summer cooling which can be maintained by sea-ice-ocean feedbacks long after volcanic aerosols are removed. A similar result was obtained by Waple et al. [35], who studied climatic reaction to the solar radiative forcing and found that the lag between long-term changes in solar forcing and temperature response is 1–15 years for global temperature and up to 30 years for the temperature of separate large regions. The mechanisms that provide delays in the temperature response to the corresponding forcing in cases of solar and volcanic activity may be similar.
The volcano-temperature correlation is more pronounced over the last 700 years. Fisher's exact test shows that in the Northern Hemisphere the overall probability of the null hypothesis is less than 10-2 over the period 1270-1980 AD. This result is not surprising since it is from the middle of the 13th century that the amplitude of long-term variations in volcanic activity increases significantly – see Figure 1A-C. Until the 13th century, volcanic eruptions occurred less frequently and were distributed more evenly over time.
In the Southern Hemisphere, no correlation between volcanic activity and temperature is observed either over the entire interval or over the last seven centuries. This is consistent with the modeling results of [31], which showed that the temperature response to volcanic forcing is significantly weaker in the Southern Hemisphere than in the Northern Hemisphere. Neukom also found that in the Southern Hemisphere, the links between external forcing and temperature variability are generally weaker than in the Northern Hemisphere. On a global scale, the two-century volcano-temperature correlation is weaker than in the Northern Hemisphere. Obviously, this is due to the fact that the global temperature summarizes the data of both hemispheres - the Northern, where the effect is noticeable, and the Southern, where it is absent.
It should be noted, there is a problem with Fisher's test, which is that the four Northern Hemisphere data sets may not be completely independent. Some of the reconstructed series may have a portion of identical individual temperature indices. For example, in the reconstruction of the NHB, four of the fifteen regional series used – Tornetrask, Jamtland, Athabasca, Zhaschiviersk – were taken from regions geographically coinciding with the areas which were also used in the NHS – Northern Scandinavia, Great Basin, North Yakutia. In such cases, Fisher's approach cannot be considered fully justified and this point requires further study. Therefore, for more reliable conclusions about the influence of long-term variations in volcanic activity on the Earth's temperature, it is desirable to obtain new paleoreconstructions based on completely independent individual indicators. This will allow the use of advanced statistical methods, including Fisher’s approach, that will facilitate more complex and in-depth studies of the effect.
Author Contributions
All work done by the author
Funding
This research received no external funding.
Data Availability Statement
Publicly available datasets were analyzed in this study. This data can be found here: ftp://ftp.ncdc.noaa.gov/pub/data/paleo/climate_forcing/volcanic_aerosols/crowley2013/crowley2013aod-reff.txt; http://climate.envsci.rutgers.edu/IVI2/IVI2TotalLoading501-2000.txt; ftp://ftp.ncdc.noaa.gov/pub/data/paleo/climate_forcing/solar_variability/bard_irradiance.txt; https://www.ncei.noaa.gov/pub/data/paleo/climate_forcing/solar_variability/delaygue2010be10.txt; http://cdsarc.u-strasbg.fr/ftp/J/A+A/649/A141/osn.dat; ftp://ftp.ncdc.noaa.gov/pub/data/paleo/climate_forcing/solar_variability/steinhilber2012.txt; https://www.ncei.noaa.gov/pub/data/paleo/treering/reconstructions/buentgen2021/buengten2021recon.txt; https://www.ncei.noaa.gov/pub/data/paleo/reconstructions/guillet2017/guillet2017nhtemp.txt; https://www.ncei.noaa.gov/pub/data/paleo/treering/reconstructions/schneider2015mxd.txt; https://www.ncei.noaa.gov/pub/data/paleo/treering/reconstructions/n_hem_temp/ntrend2015regionc3.txt
Conflicts of Interest
The author declare no conflict of interest.
References
- Andreu-Hayles; L., Leland, C., Dendrochronology, Progress. Encyclopedia of Scientific Dating Methods, 2014. 1–12. [CrossRef]
- Raspopov, O.M.; Dergachev, V.A.; Esper, J.; Kozyreva, O.V.; Frank, D.; Ogurtsov, M.; Shao, X. , The influence of the de Vries (∼200-year) solar cycle on climate variations: Results from the Central Asian Mountains and their global link. Palaeogeography, Palaeoclimatology, Palaeoecology 2008. 259, 6-16. [CrossRef]
- Ogurtsov, M.; Veretenenko, S.; Lindholm, M.; Jalkanen, R. Possible solar-climate imprint in temperature proxies from the middle and high latitudes of North America. Adv. Space Res. 2016, 57, 1112–1117. [Google Scholar] [CrossRef]
- Liu, X.Q.; Dong, H.L.; Yang, X.D.; Herzschuh, U.; Zhang, E.L.; Stuut, J.B.W.; Wang, Y.B. Late Holocene forcing of the Asian winter and summer monsoon as evidenced by proxy records from the northern Qinghai–Tibetan Plateau. Earth Planet. Sci. Lett. 2009, 280, 276–284. [Google Scholar] [CrossRef]
- Novello, V.; Vuille, M.; Cruz, F. W.; Strikis, N.; Paula, M.; Edwards, R. L.; et al. , Centennial-scale solar forcing of the South American Monsoon System recorded in stalagmites. Sci. Reports, 2016; 6, 24762. [Google Scholar] [CrossRef]
- Ogurtsov, M. Long-term variability of summer temperature in the southern part of South America – is there a connection with changes in solar activity? Atmosphere 2022, 13, 1360. [Google Scholar] [CrossRef]
- Ogurtsov, M. Study on possible solar influence on the сlimate of the Southern Hemisphere. Atmosphere 2022, 13, 680. [Google Scholar] [CrossRef]
- Breitenmoser, P.; Beer, J.; Brönnimann, S.; Frank, D.; Steinhilber, F.; Wanner, H. Solar and volcanic fingerprints in tree-ring chronologies over the past 2000 years. Palaeogeography, Palaeoclimatology, Palaeoecology 2012, 313-314, 127–139. [Google Scholar] [CrossRef]
- Schneider, L.; Smerdon, J.E.; Büntgen, U.; Myglan, V.; Kirdyanov, A.V.; Esper, J. Revising midlatitude summer temperatures back to A.D. 600 based on a wood density network. Geophys. Res. Lett. 2015, 42, 4556–4562. [Google Scholar] [CrossRef]
- Wilson, R.; Anchukaitis, K.; Briffa, K.; Büntgen, U.; Cook, E.; D'Arrigo, R. Last millennium northern hemisphere summer temperatures from tree rings: Part I: The long term context. Quat. Sci. Rev. 2016, 134, 1–18. [Google Scholar] [CrossRef]
- Guillet, S.; Corona, C.; Khodri, M.; Lavigne, F.; Ortega, P.; Eckert, N.; et al. Climate response to the Samalas volcanic eruption in 1257 revealed by proxy records. Nat. Geosci. 2017, 10, 123–128. [Google Scholar] [CrossRef]
- Büntgen, U.; Allen, K.; Anchukaitis, K.J.; Arseneault, D.; Boucher, E. , Chatterjee, S. The influence of decision-making in tree ring-based climate reconstructions. Nat. Commun. 2021, 12, 3411. [Google Scholar] [CrossRef]
- Neukom, R.; Gergis, J.; Karoly, D.; et al. Inter-hemispheric temperature variability over the last millennium. Nature Climate Change 2014, 4, 362–367. [Google Scholar] [CrossRef]
- PAGES 2k Consortium. Consistent multidecadal variability in global temperature reconstructions and simulations over the Common Era. Nat. Geosci. 2019, 12, 643–649. [Google Scholar] [CrossRef] [PubMed]
- Gao, C.; Robock, A.; Ammann, C. Volcanic forcing of climate over the past 1500 years: An improved ice core-based index for climate models, J. Geophys. Res. 2008, 113, D23111. [Google Scholar] [CrossRef]
- Crowley, T.; Unterman, M. Technical details concerning development of a 1200 yr proxy index for global volcanism. Earth System Science Data 2013, 5, 187–197. [Google Scholar] [CrossRef]
- Torrence, C.; Compo, G.P. A Practical Guide to Wavelet Analysis. Bull. American Meteorol. Soc. 1998, 79, 61–78. [Google Scholar] [CrossRef]
- Ebisuzaki, W. A Method to Estimate the Statistical Significance of a Correlation When the Data Are Serially Correlated. Journal of Climate, 1997, 10, 2147–2153. [Google Scholar] [CrossRef]
- Sugihara, G.; May, R.; Ye, H.; et al. Detecting causality in complex ecosystems. Science, 2012, 338, 496–500. [Google Scholar] [CrossRef]
- Poluianov, S.; Usoskin, I. Critical Analysis of a Hypothesis of the Planetary Tidal Influence on Solar Activity. Sol. Phys. 2014, 289, 2333–2342. [Google Scholar] [CrossRef]
- Lihua Ma; Vaquero J. M. New evidence of the Suess/de Vries cycle existing in historical naked-eye observations of sunspots. Open Astron. 2020, 29, 28–31. [Google Scholar] [CrossRef]
- Vaquero, J. M. , Gallego, M. C.; García, J. A. A 250-year cycle in naked-eye observations of sunspots Geophys. Res. Lett. 2002; 29, 58-1–58-4. [Google Scholar] [CrossRef]
- Bard, E.; Raisbeck, G.; Yiou, F.; Jouzel, J. , Solar irradiance during the last 1200 years based on cosmogenic nuclides. Tellus B, 2000, 52, 985–992. [Google Scholar] [CrossRef]
- Delaygue, G.; Bard, E. , An Antarctic view of Beryllium-10 and solar activity for the past millennium. Clim. Dyn. 2011, 36, 2201–2218. [Google Scholar] [CrossRef]
- Steinhilber, F.; Abreu, J.A.; Beer, J.; Brunner, I.; Christl, M.; et al. , 9,400 years of cosmic radiation and solar activity from ice cores and tree rings. Proc. Nat. Acad. Sci. 2012, 109(16), 5967–5971. [Google Scholar] [CrossRef] [PubMed]
- Roth, R.; Joos, F. , A reconstruction of radiocarbon production and total solar irradiance from the Holocene 14C and CO2 records: Implications of data and model uncertainties. Climate of the Past. 2013, 9, 1879–1909. [Google Scholar] [CrossRef]
- Egorova, T.; Schmutz, W.; Rozanov, E.; et al. , Revised historical solar irradiance forcing. Astron. Astrophys. 2018, 615, A85. [Google Scholar] [CrossRef]
- Usoskin, I.; Solanki, S.; Krivova, N.; et al. Solar cyclic activity over the last millennium reconstructed from annual 14C data. Astron. Astrophys, 2021; 649. [Google Scholar] [CrossRef]
- Fisher,R. A. Statistical methods for research workers. 1925, Oliver and Boyd, Edinburgh.
- Gleckler, P.; Achutarao, K.; Gregory, J.; et al. Krakatoa lives: The effect of volcanic eruptions on ocean heat content and thermal expansion. Geophys. Res. Lett. 2006, L17702. [Google Scholar] [CrossRef]
- Zhong, Y.; Miller, G.; Otto-Bliesner, B.; et al. Centennial-scale climate change from decadally-paced explosive volcanism: A coupled sea ice-ocean mechanism. Clim. Dyn. 2011, 37, 2373–2387. [Google Scholar] [CrossRef]
- McGregor, H. V.; Evans, M. N.; Goosse, H.; et al. Robust global ocean cooling trend for the pre-industrial Common Era. Nat. Geosci. 2015, 8, 671–677. [Google Scholar] [CrossRef]
- Lee, J.-Y.; Marotzke, J.; Bala, G. , et al. Climate Change 2021 – The Physical Science Basis Working Group I Contribution to the Sixth Assessment Report of the Intergovernmental Panel on Climate Change, 553–672.
- Baldini, J. , Brown, R. , Mcelwaine, J. Was millennial scale climate change during the Last Glacial triggered by explosive volcanism? Sci. Rep. 2015, 5, 17442. [Google Scholar] [CrossRef]
- Waple, A.M.; Mann, M.E.; Bradley, R.S. Long-term patterns of solar irradiance forcing in model experiments and proxy- based surface temperature reconstructions. Clim. Dynam. 2002, 18, 563–57. [Google Scholar] [CrossRef]
Figure 1.
A – stratospheric sulphate aerosol injection [15]; B – aerosol optical depth at 550 nm [16]; C – sulphate aerosol injection (black line) and aerosol optical depth (gray line) smothed by 40 years; D – temperature in Northern Hemisphere [9]; E – temperature in Northern Hemisphere Wilson et al. [10]; F – temperature in Northern Hemisphere Guillet et al. [11] ; G – temperature in Northern Hemisphere Büntgen et al. [12]; H – the median of the full 7000-member ensemble accross all methods of the PAGES2k global temperature reconstrucnions [14]; I – temperature in Southern Hemisphere [13].
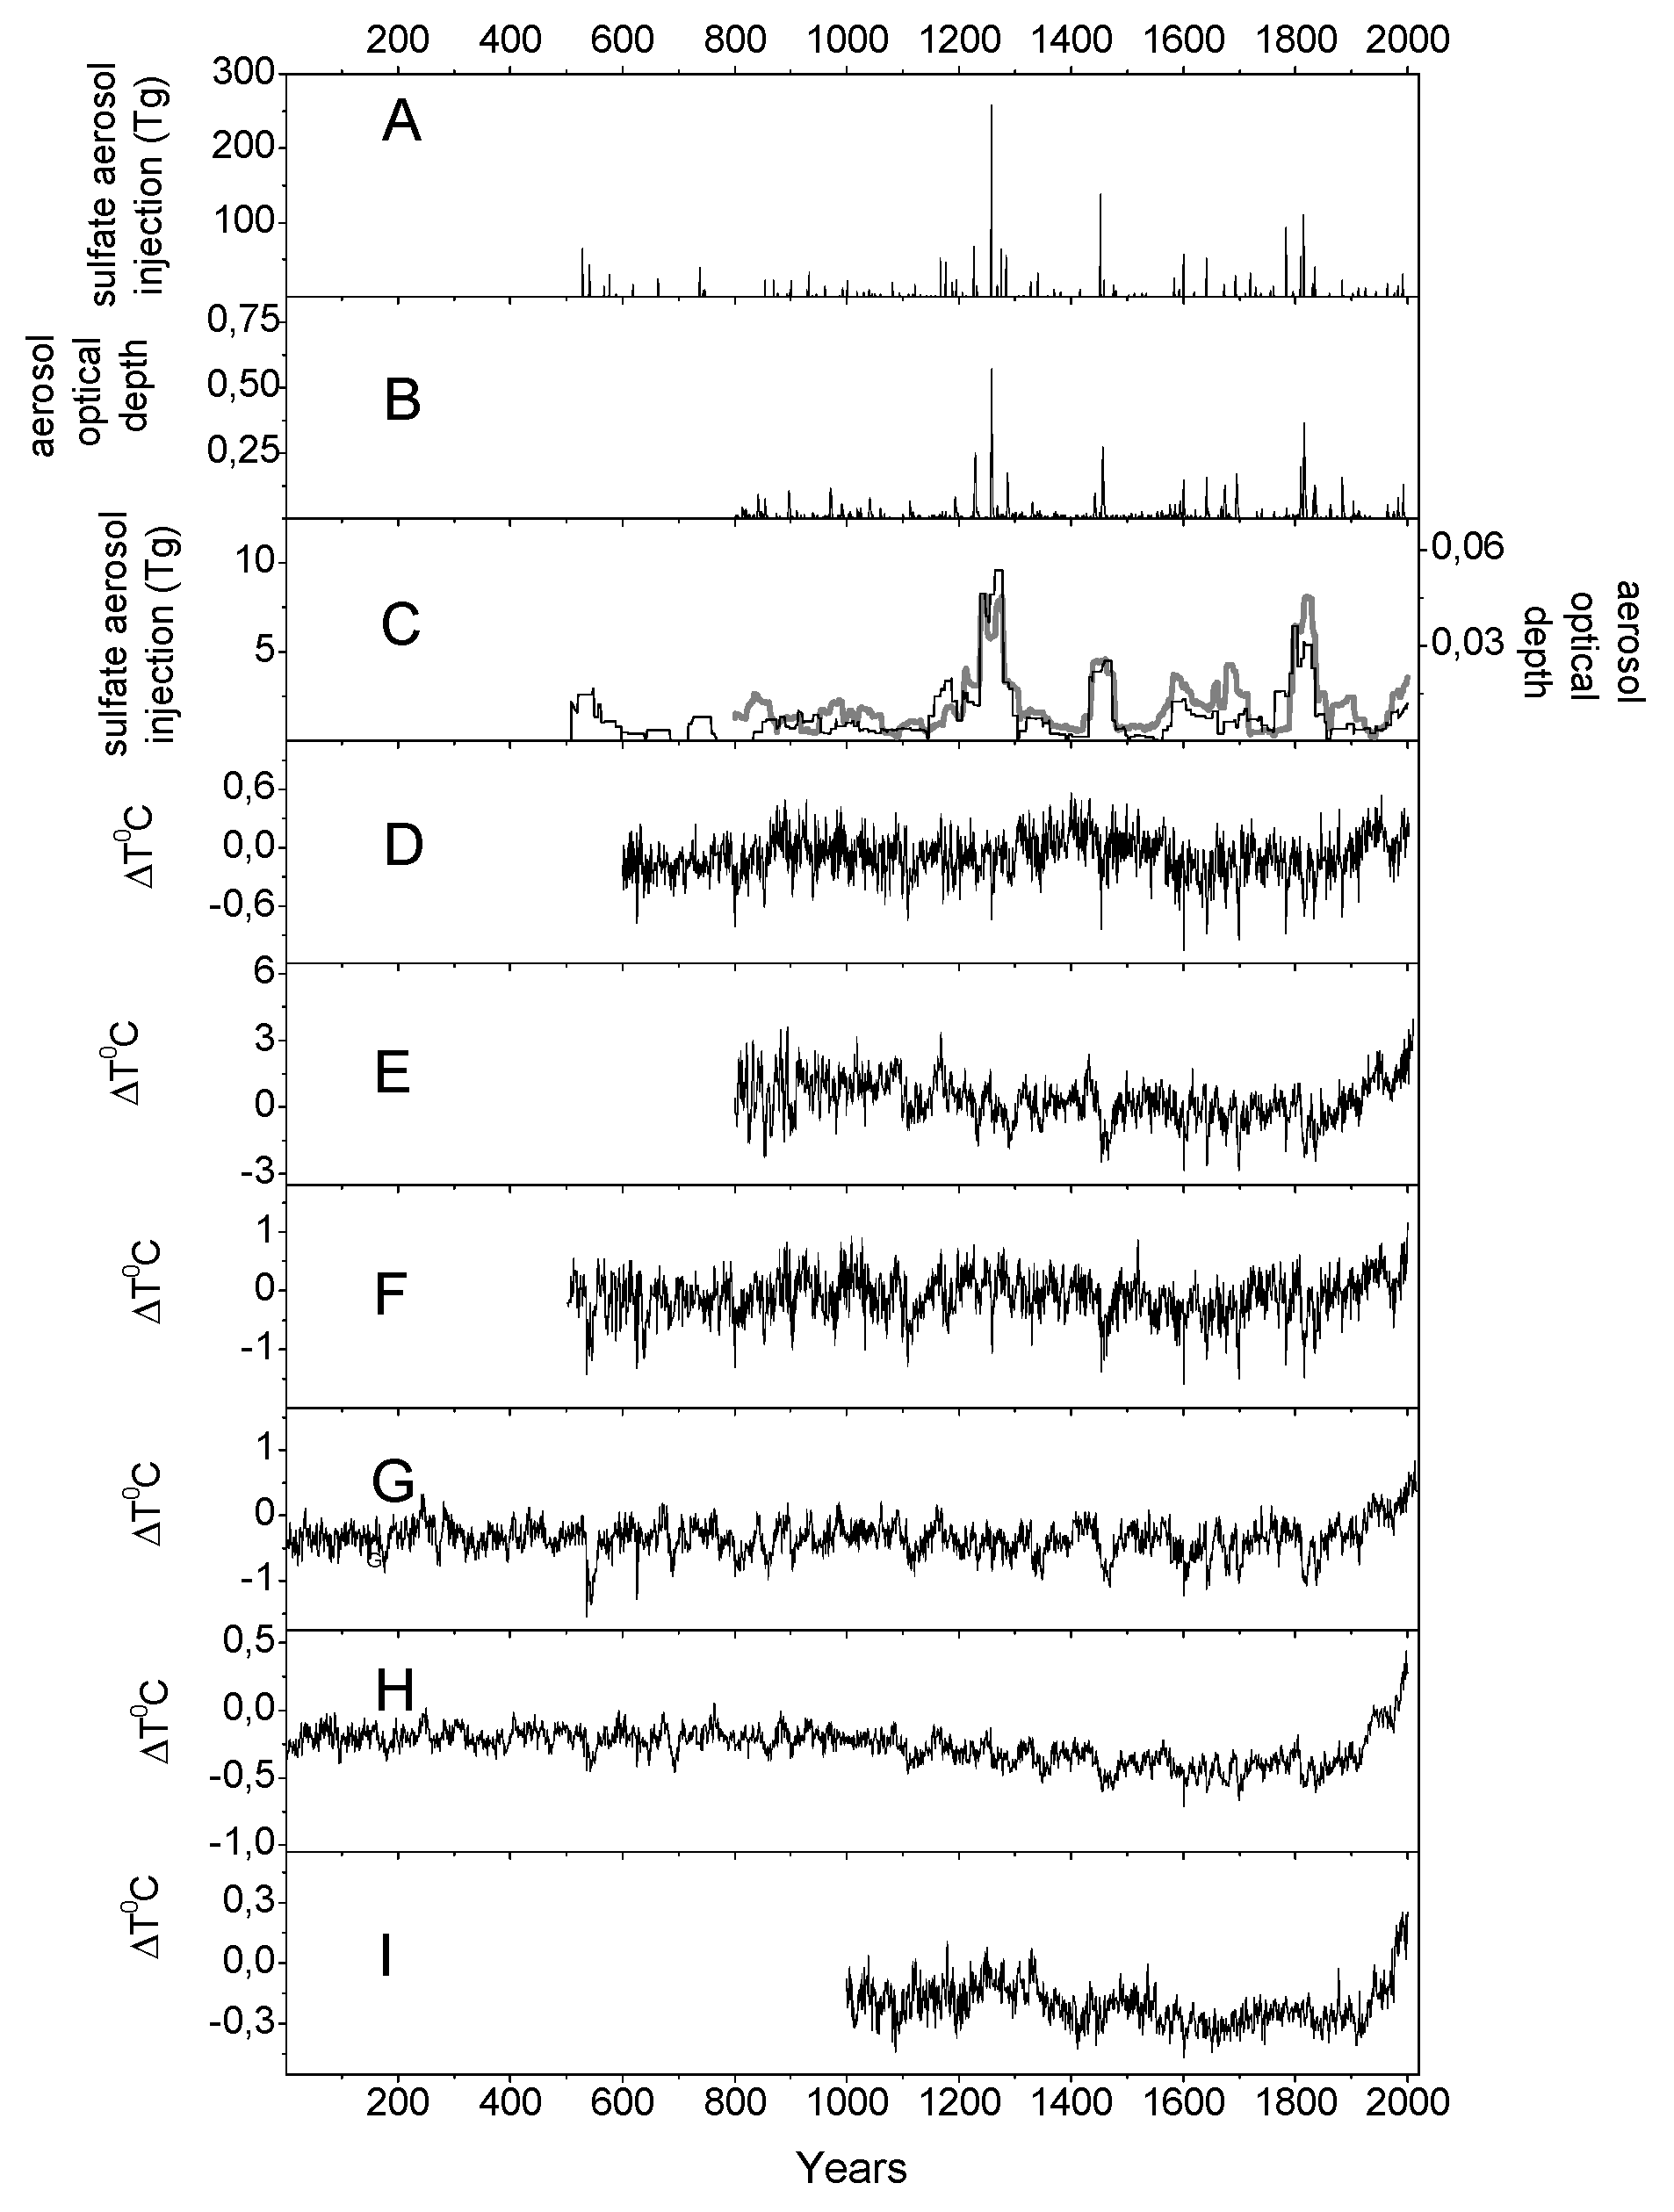
Figure 2.
Fourier spectra of: A – smoothed AOD [16]; B – smoothed SLF [15]; C – NHS [9]; D – NHW Wilson et al. [10]; E – NHG [11] ; F – NHB [12]; G – GLB [14]; H – SHN [13]. Dotted lines – confidence level 0.95 based on continuum of spectrum of a red noise with corresponding AR(1) coefficients.
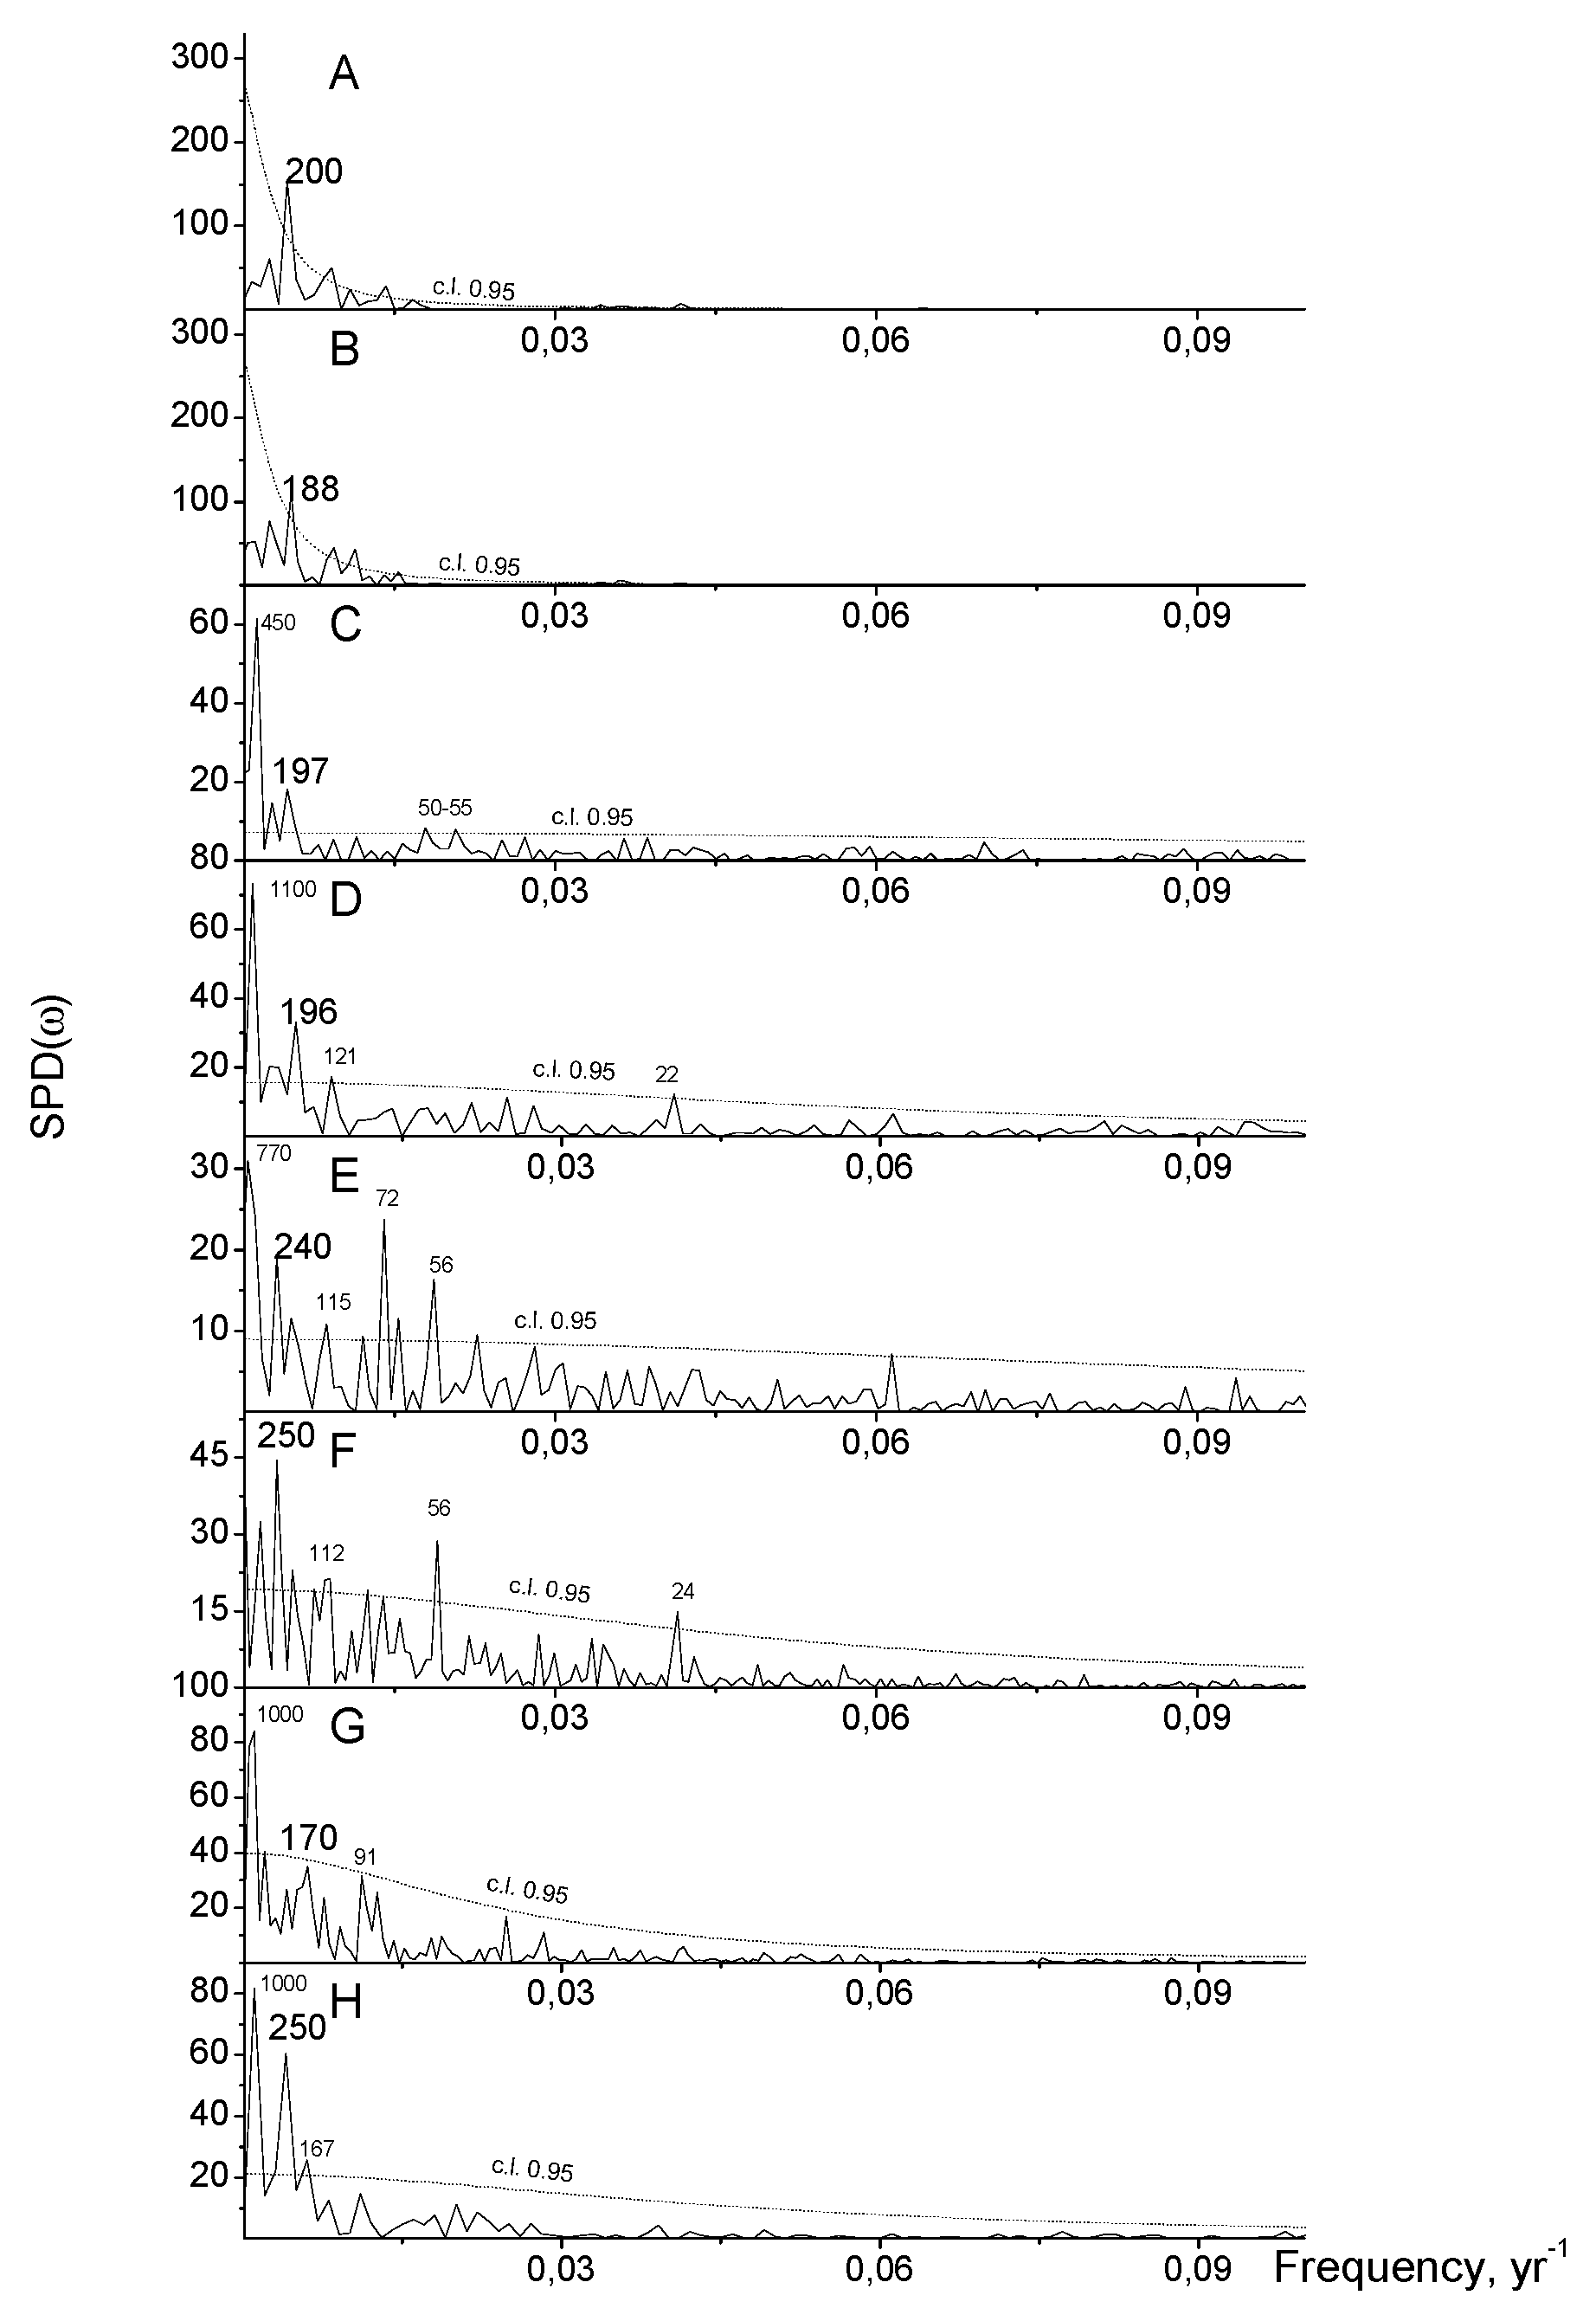
Figure 3.
Different proxies, wavelet filtered in 171 –272 yr scale band. Gray line – aerosol optical density; black lines: A – NHS [9]; B – NHW [10]; C – NHG [11] ; D – NHB [12]; E – GLB [14]; F – SHN [13]. Temperature is shifted by 20 years.
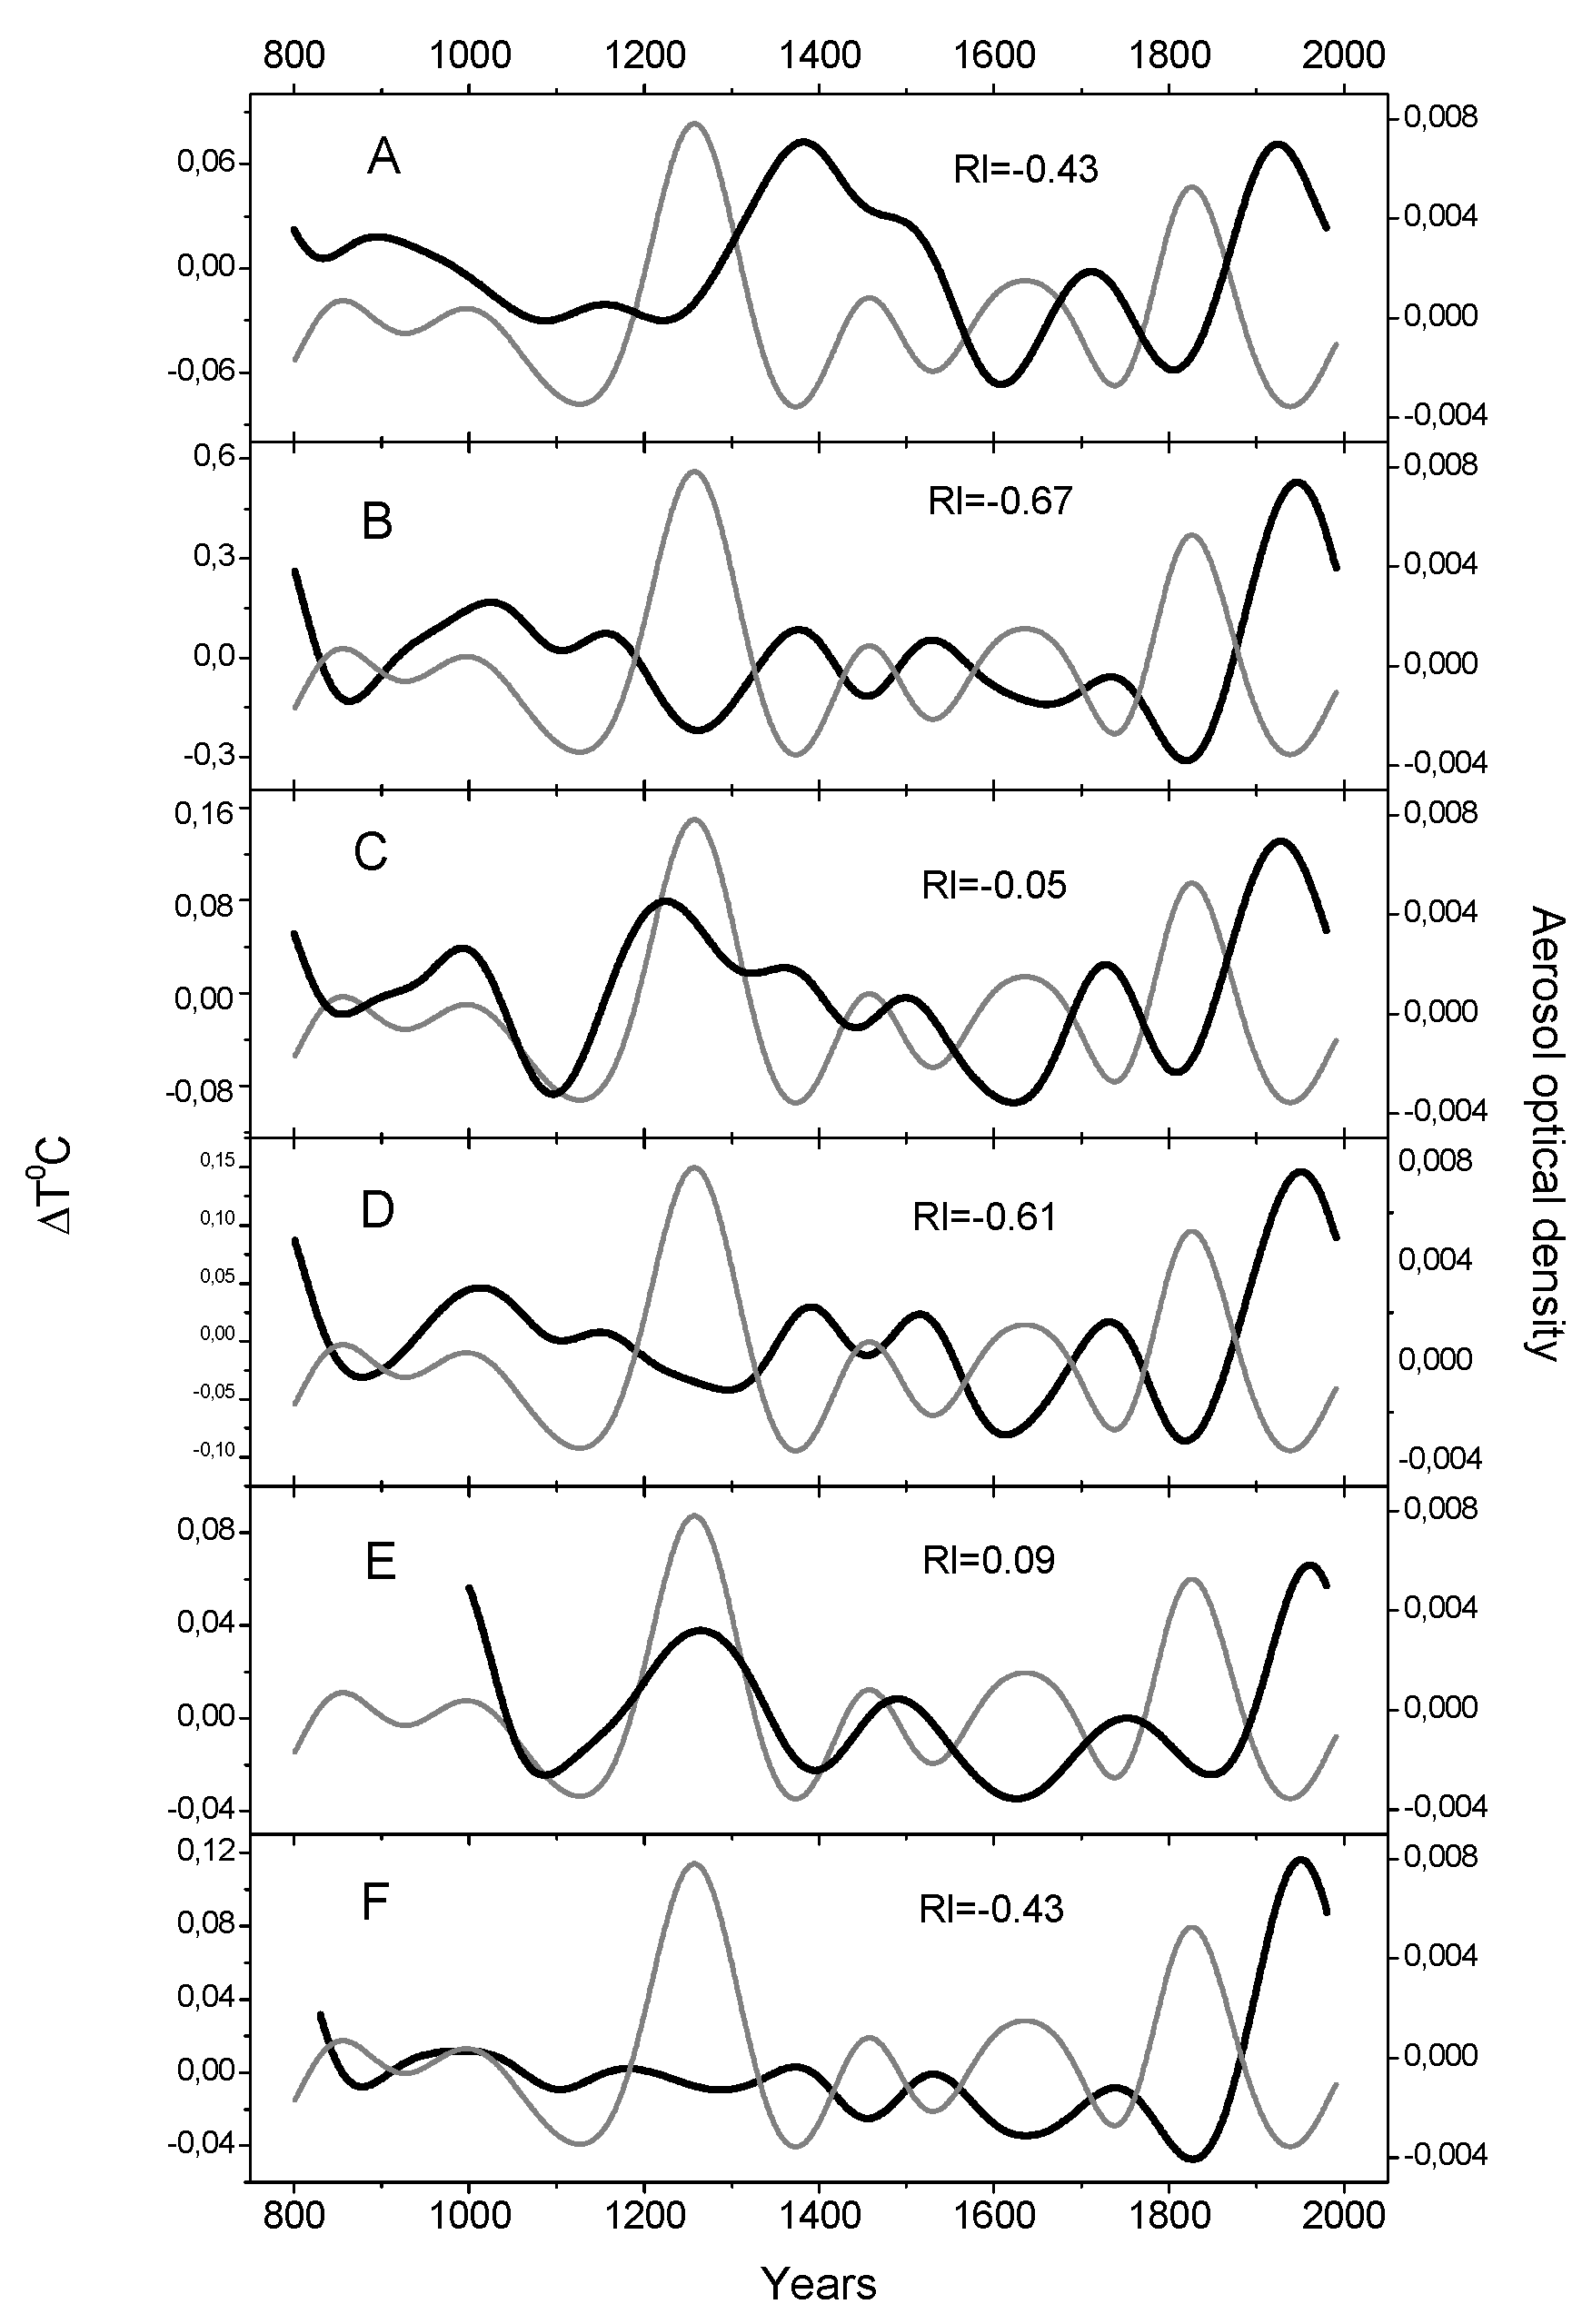
Table 1.
A list paleorecords used in analysis.
| Source | Abbrevi-ation | Time span | Reconstruc-ted value | Geographic area | Data type | |
|---|---|---|---|---|---|---|
| Crowley and Unterman [16] | SLF | 501-2000 | aerosol optical depth | Greenland, Antarctica | SO4 concentration, conductivity, 21 records | |
| Gao et al. [15] | AOD | 800-2000 | stratospheric sulphate aerosol injection | Greenland, Antarctica | SO4 concentration, conductivity, 36 records | |
| Schneider et al. [9] | NHS | 600-2002 | June-August temperature | Extratropical part of the Hemisphere (Φ>300 N) | Tree-ring (MXD), 15 regional records | |
| Wilson et al. [10] | NHW | 800-2010 | May-August temperature | Northern Hemisphere | Tree-ring (MXD), 54 records | |
| Guillet et al. [11] | NHG | 500-2000 | June-August temperature | Northern Hemisphere | Multi-proxy (TRW, MXD, δ18O), 27 records | |
| Büntgen et al. [12] | NHB | 1-2016 | June-August temperature | Northern Hemisphere | TRW, 9 regional records | |
| The median of the full ensemble of the PAGES2k [14] | GLB | 1-2017 | Annual | Globe | Multi-proxy (TRW, MXD, ice core, corals, historic documents, sediments, boreholes, speleothems) 692 individual records | |
| Neukom et al. [13] | SHN | May-April temperature | Southern Hemisphere | Multi-proxy (TRW, MXD, ice core, corals, historic documents, sediments), 111 individual records | ||
Table 2.
Bandpass (171–282 years) correlations between volcanic and temperature indices shifted by 20 years calculated over the entire time interval.
Table 2.
Bandpass (171–282 years) correlations between volcanic and temperature indices shifted by 20 years calculated over the entire time interval.
| Source | NHS [9] |
NHW [10] |
NHG [11] |
NHB [12] |
GLB [14] | SHN [13] |
|---|---|---|---|---|---|---|
| SLF [15] | -0.38** (0.21) | -0.67* (0.011) | -0.05*** (0.75) | -0.55*** (0.039) | -0.35*** (0.174) | 0.30 + (0.292) |
| AOD [16] | -0.43* (0.137) | -0.68* (0.009) | -0.06* (0.87) | -0.61* (0.018) | -0.43* (0.123) |
0.09+ (0.703) |
* – coefficient of correlation, calculated over AD 800-1980, ** – AD 600-1980, *** – AD 501-1980, + – AD 1000-1980. Big bold figures display coefficients of correlation with significance p<0.05.
Disclaimer/Publisher’s Note: The statements, opinions and data contained in all publications are solely those of the individual author(s) and contributor(s) and not of MDPI and/or the editor(s). MDPI and/or the editor(s) disclaim responsibility for any injury to people or property resulting from any ideas, methods, instructions or products referred to in the content. |
© 2024 by the author. Licensee MDPI, Basel, Switzerland. This article is an open access article distributed under the terms and conditions of the Creative Commons Attribution (CC BY) license (https://creativecommons.org/licenses/by/4.0/).
Copyright: This open access article is published under a Creative Commons CC BY 4.0 license, which permit the free download, distribution, and reuse, provided that the author and preprint are cited in any reuse.


