Submitted:
14 October 2024
Posted:
15 October 2024
You are already at the latest version
Abstract
Background: Statistics from the Ministry of Health and Welfare reported oral cancer as one of the most prevalent malignant cancers, with the third highest incidence and the fifth leading cause of death among men in Taiwan. Lymph node metastasis in oral cancer usually has a low survival rate, with no significant improvement in the past 30 years. Therefore, a more effective survival predictor is warranted. Many cancer studies revealed that monitoring tumor thickness and lymph node density, in addition to tumor, node, and metastasis (TNM) stages, can provide more accurate predictions.Methods: This retrospective study analyzed data from 612 patients with oral cancer who had the habit of chewing betel nuts. The study focused on tumor thickness, lymph node density, and the regional distribution of lymph node metastasis to determine their effectiveness as predictors.Results: The results revealed that a tumor thickness of 6 mm indicated cervical lymph node metastasis and was the optimal cutoff point for overall survival. The optimal cutoff value for lymph node density was 0.04. Patients with a tumor thickness of >6 mm and a lymph node density of >0.04 had significantly lower overall survival rates. Additionally, patients with >1 lymph node metastasis level and lower cervical metastasis exhibited a relatively worse prognosis.Conclusion: Therefore, in addition to TNM staging, tumor thickness, lymph node density and metastasis level are suitable as a parameter for predictors that can be used as references for adjuvant therapies for better therapeutic effects.
Keywords:
1. Introduction
2. Materials and Methods
2.1. Patients
2.2. Statistics
3. Results
3.1. Cox Univariate and Multivariate Analyses of Overall Survival
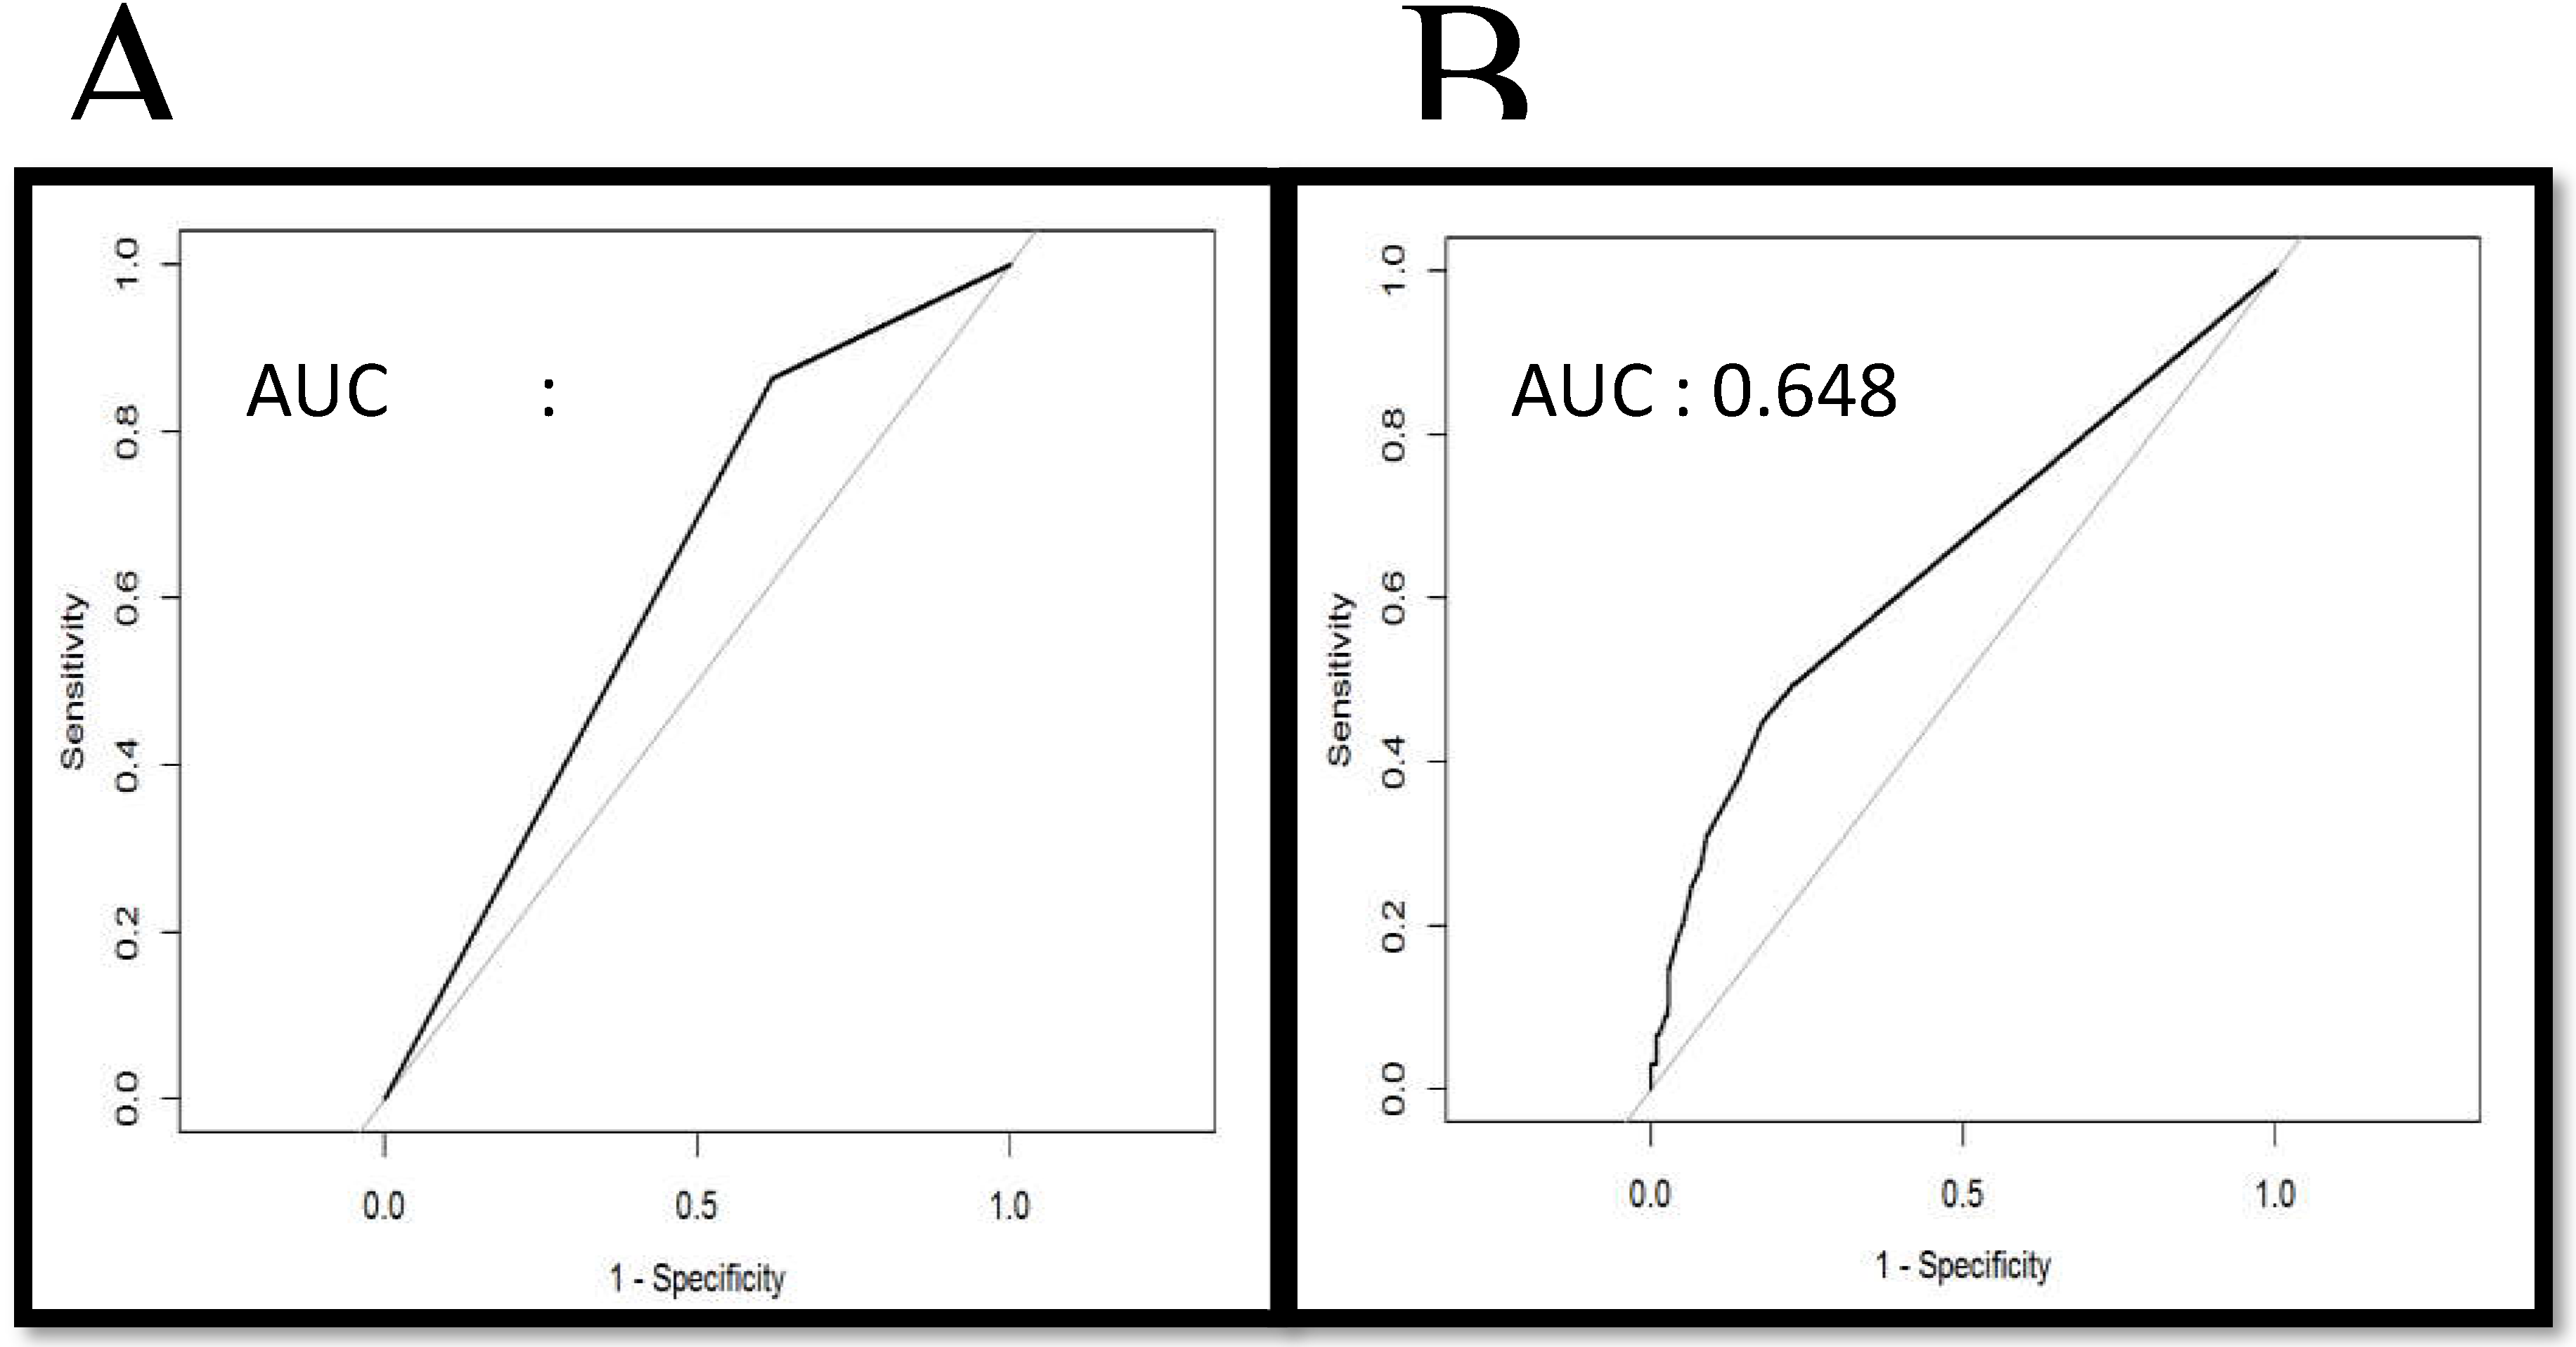
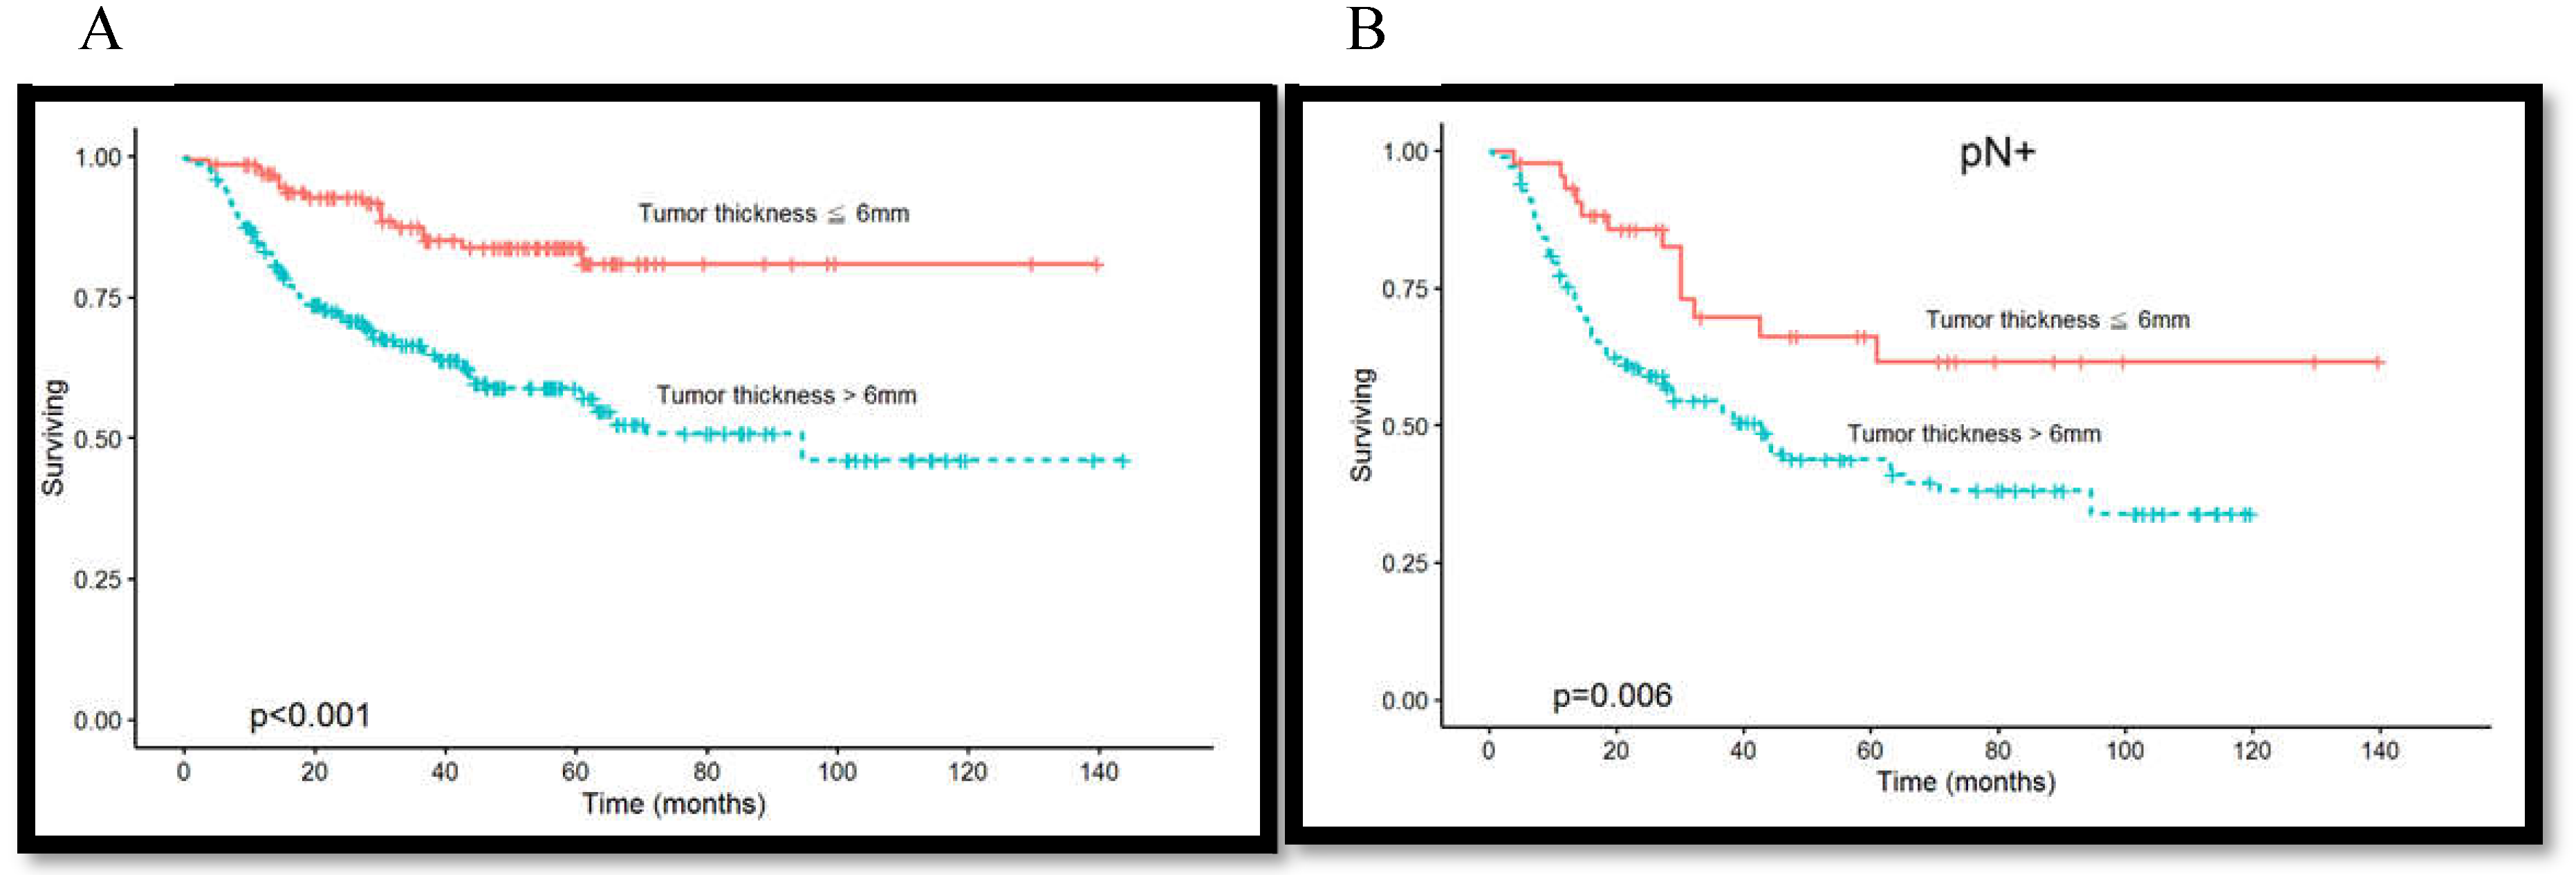
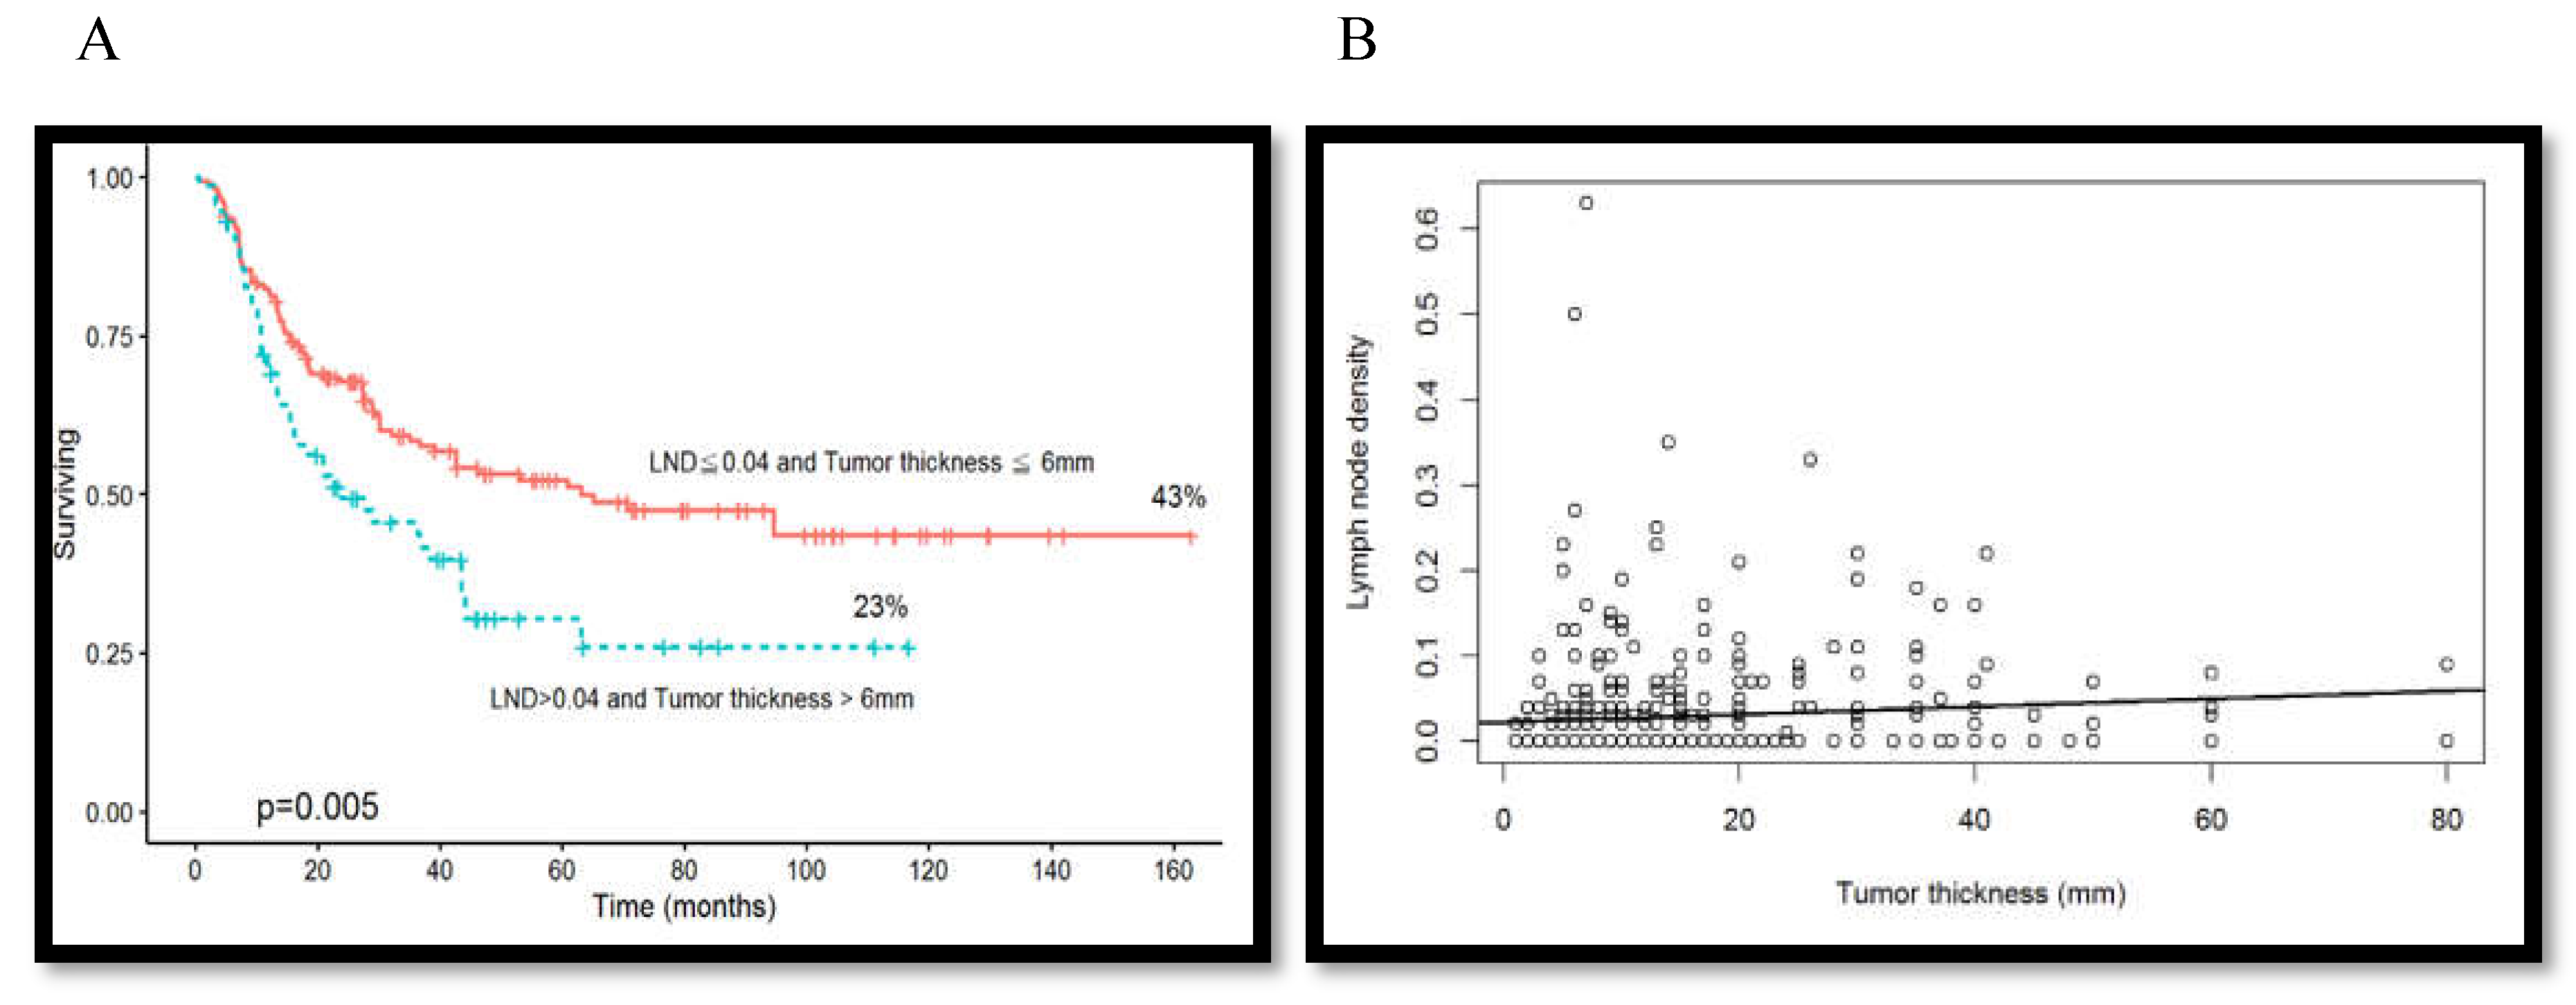
3.2. Association Among Tumor Thickness, Lymph Node Metastasis, and Overall Survival Rate
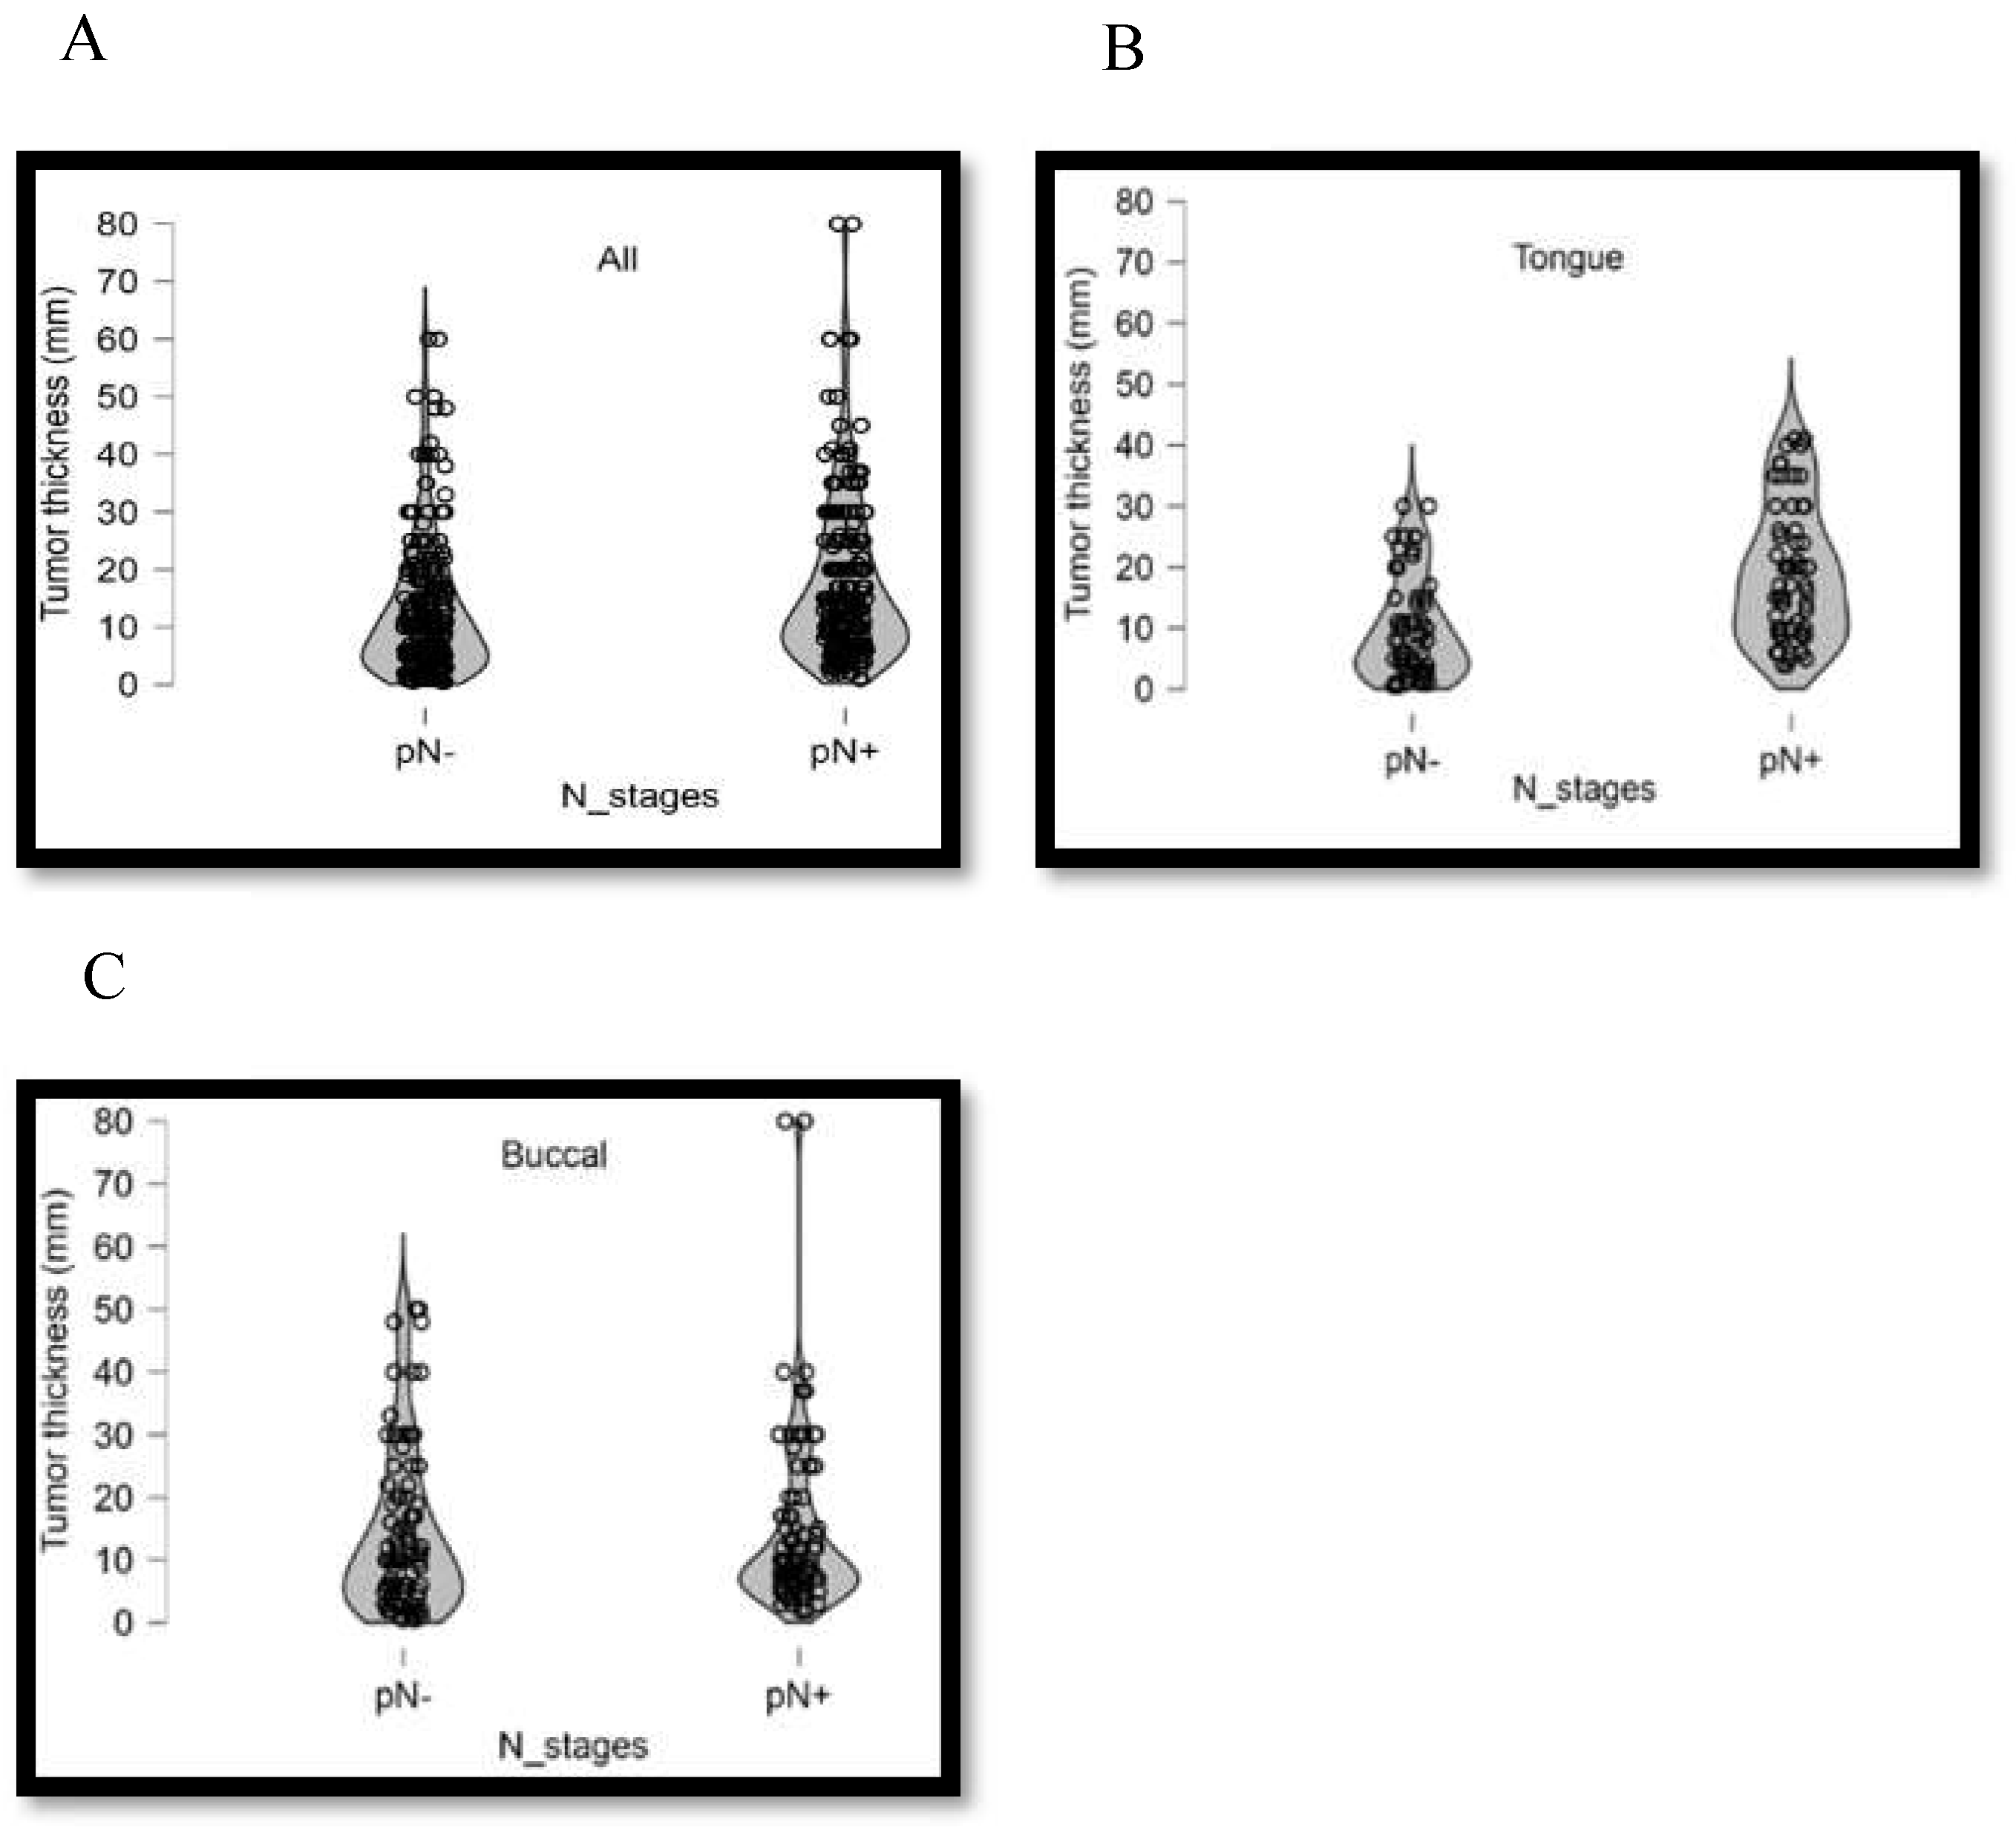
3.3. Association between Clinical Pathological Parameters and Tumor Thickness
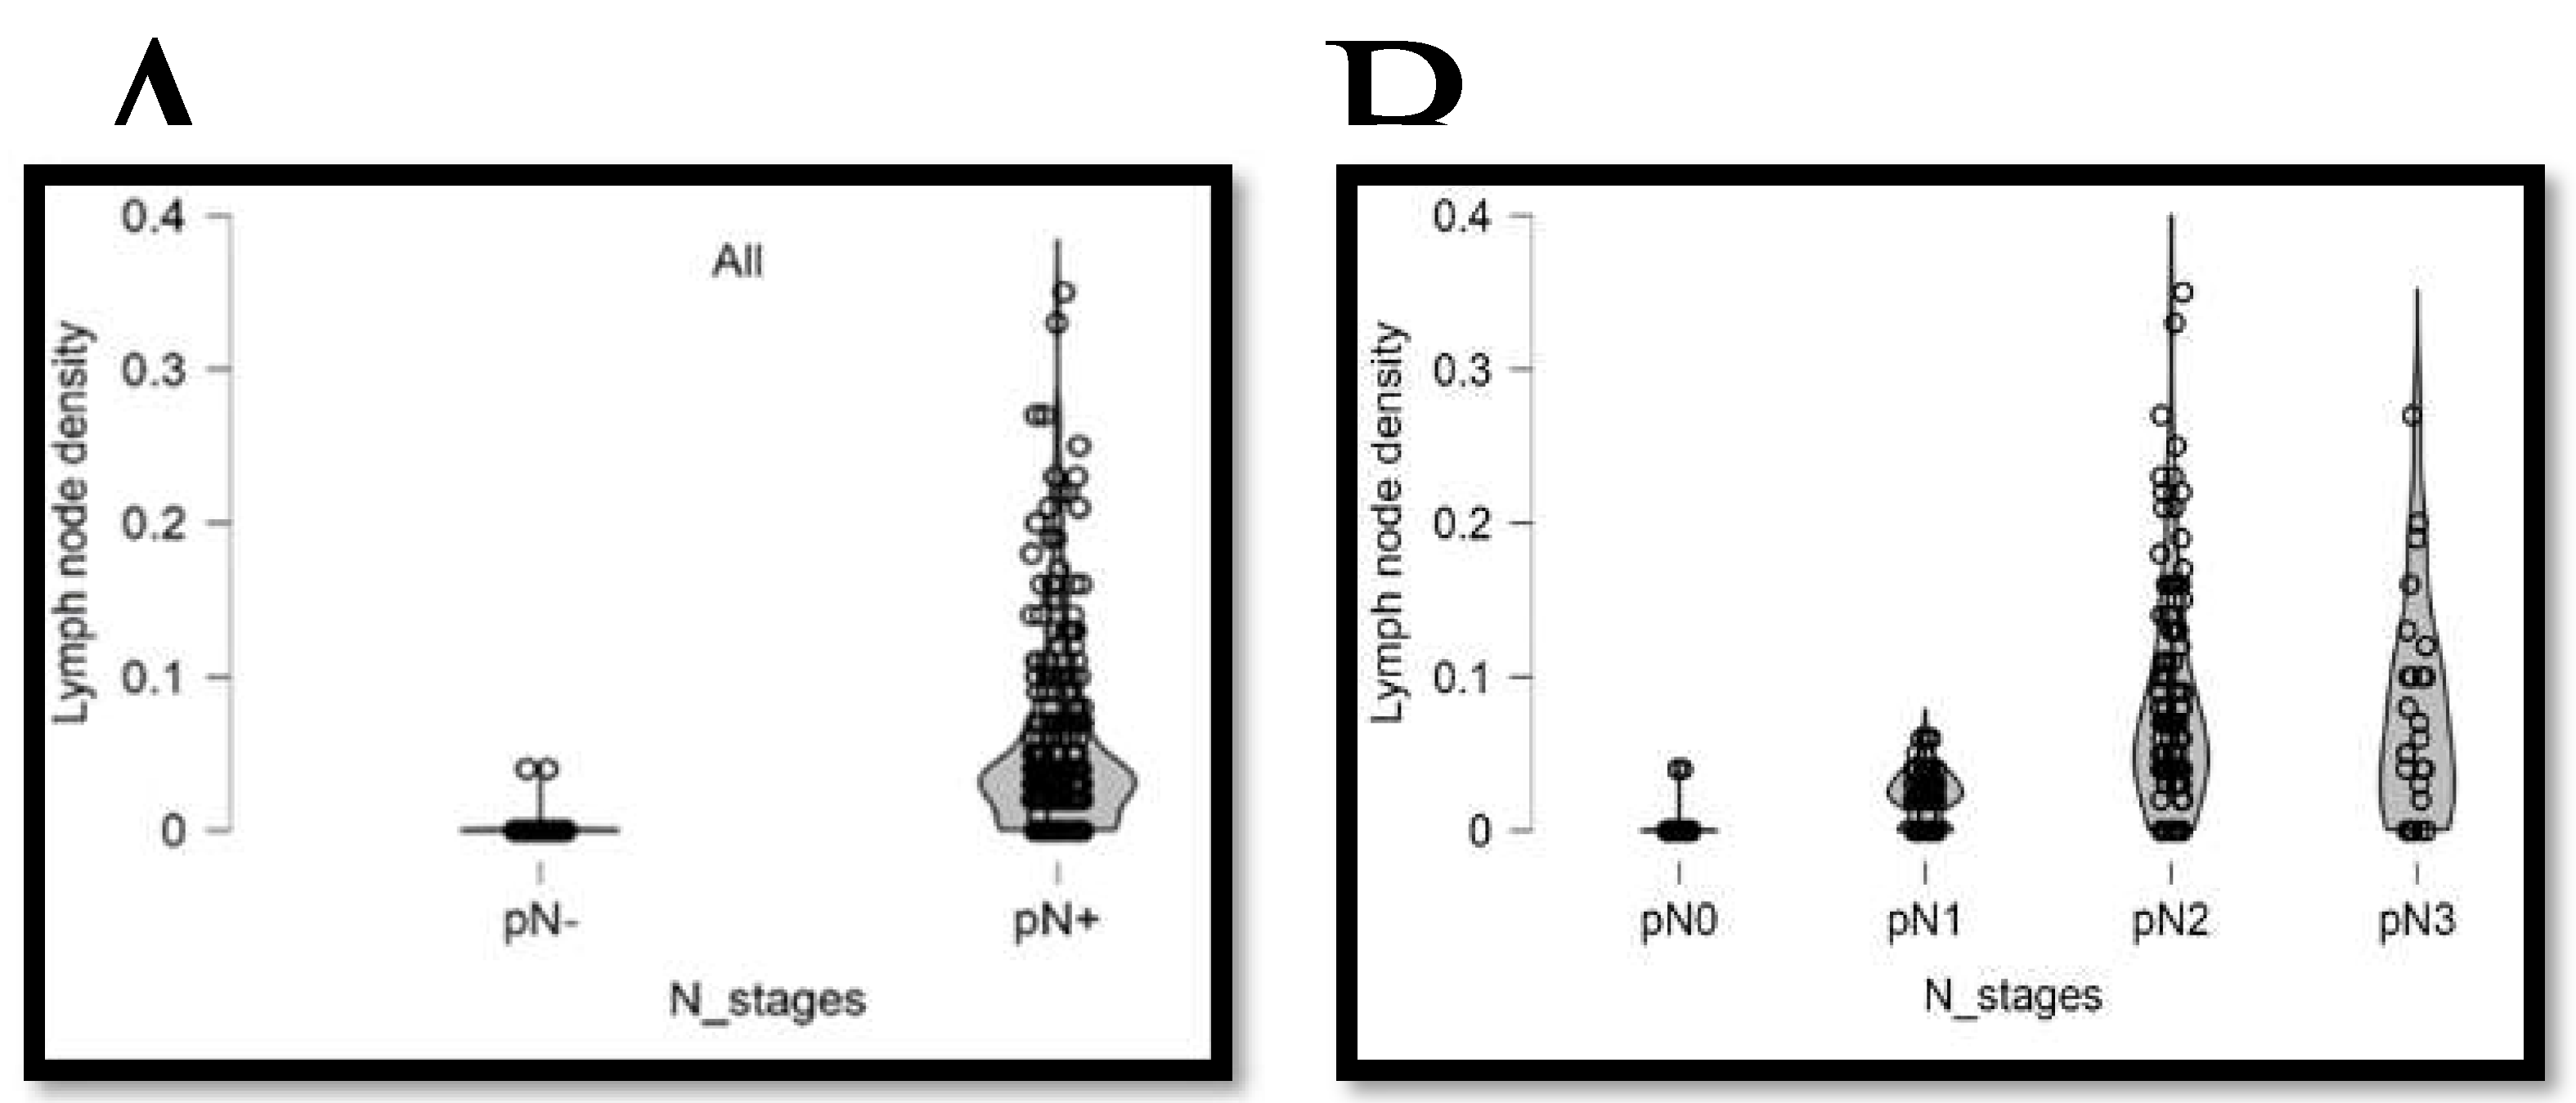
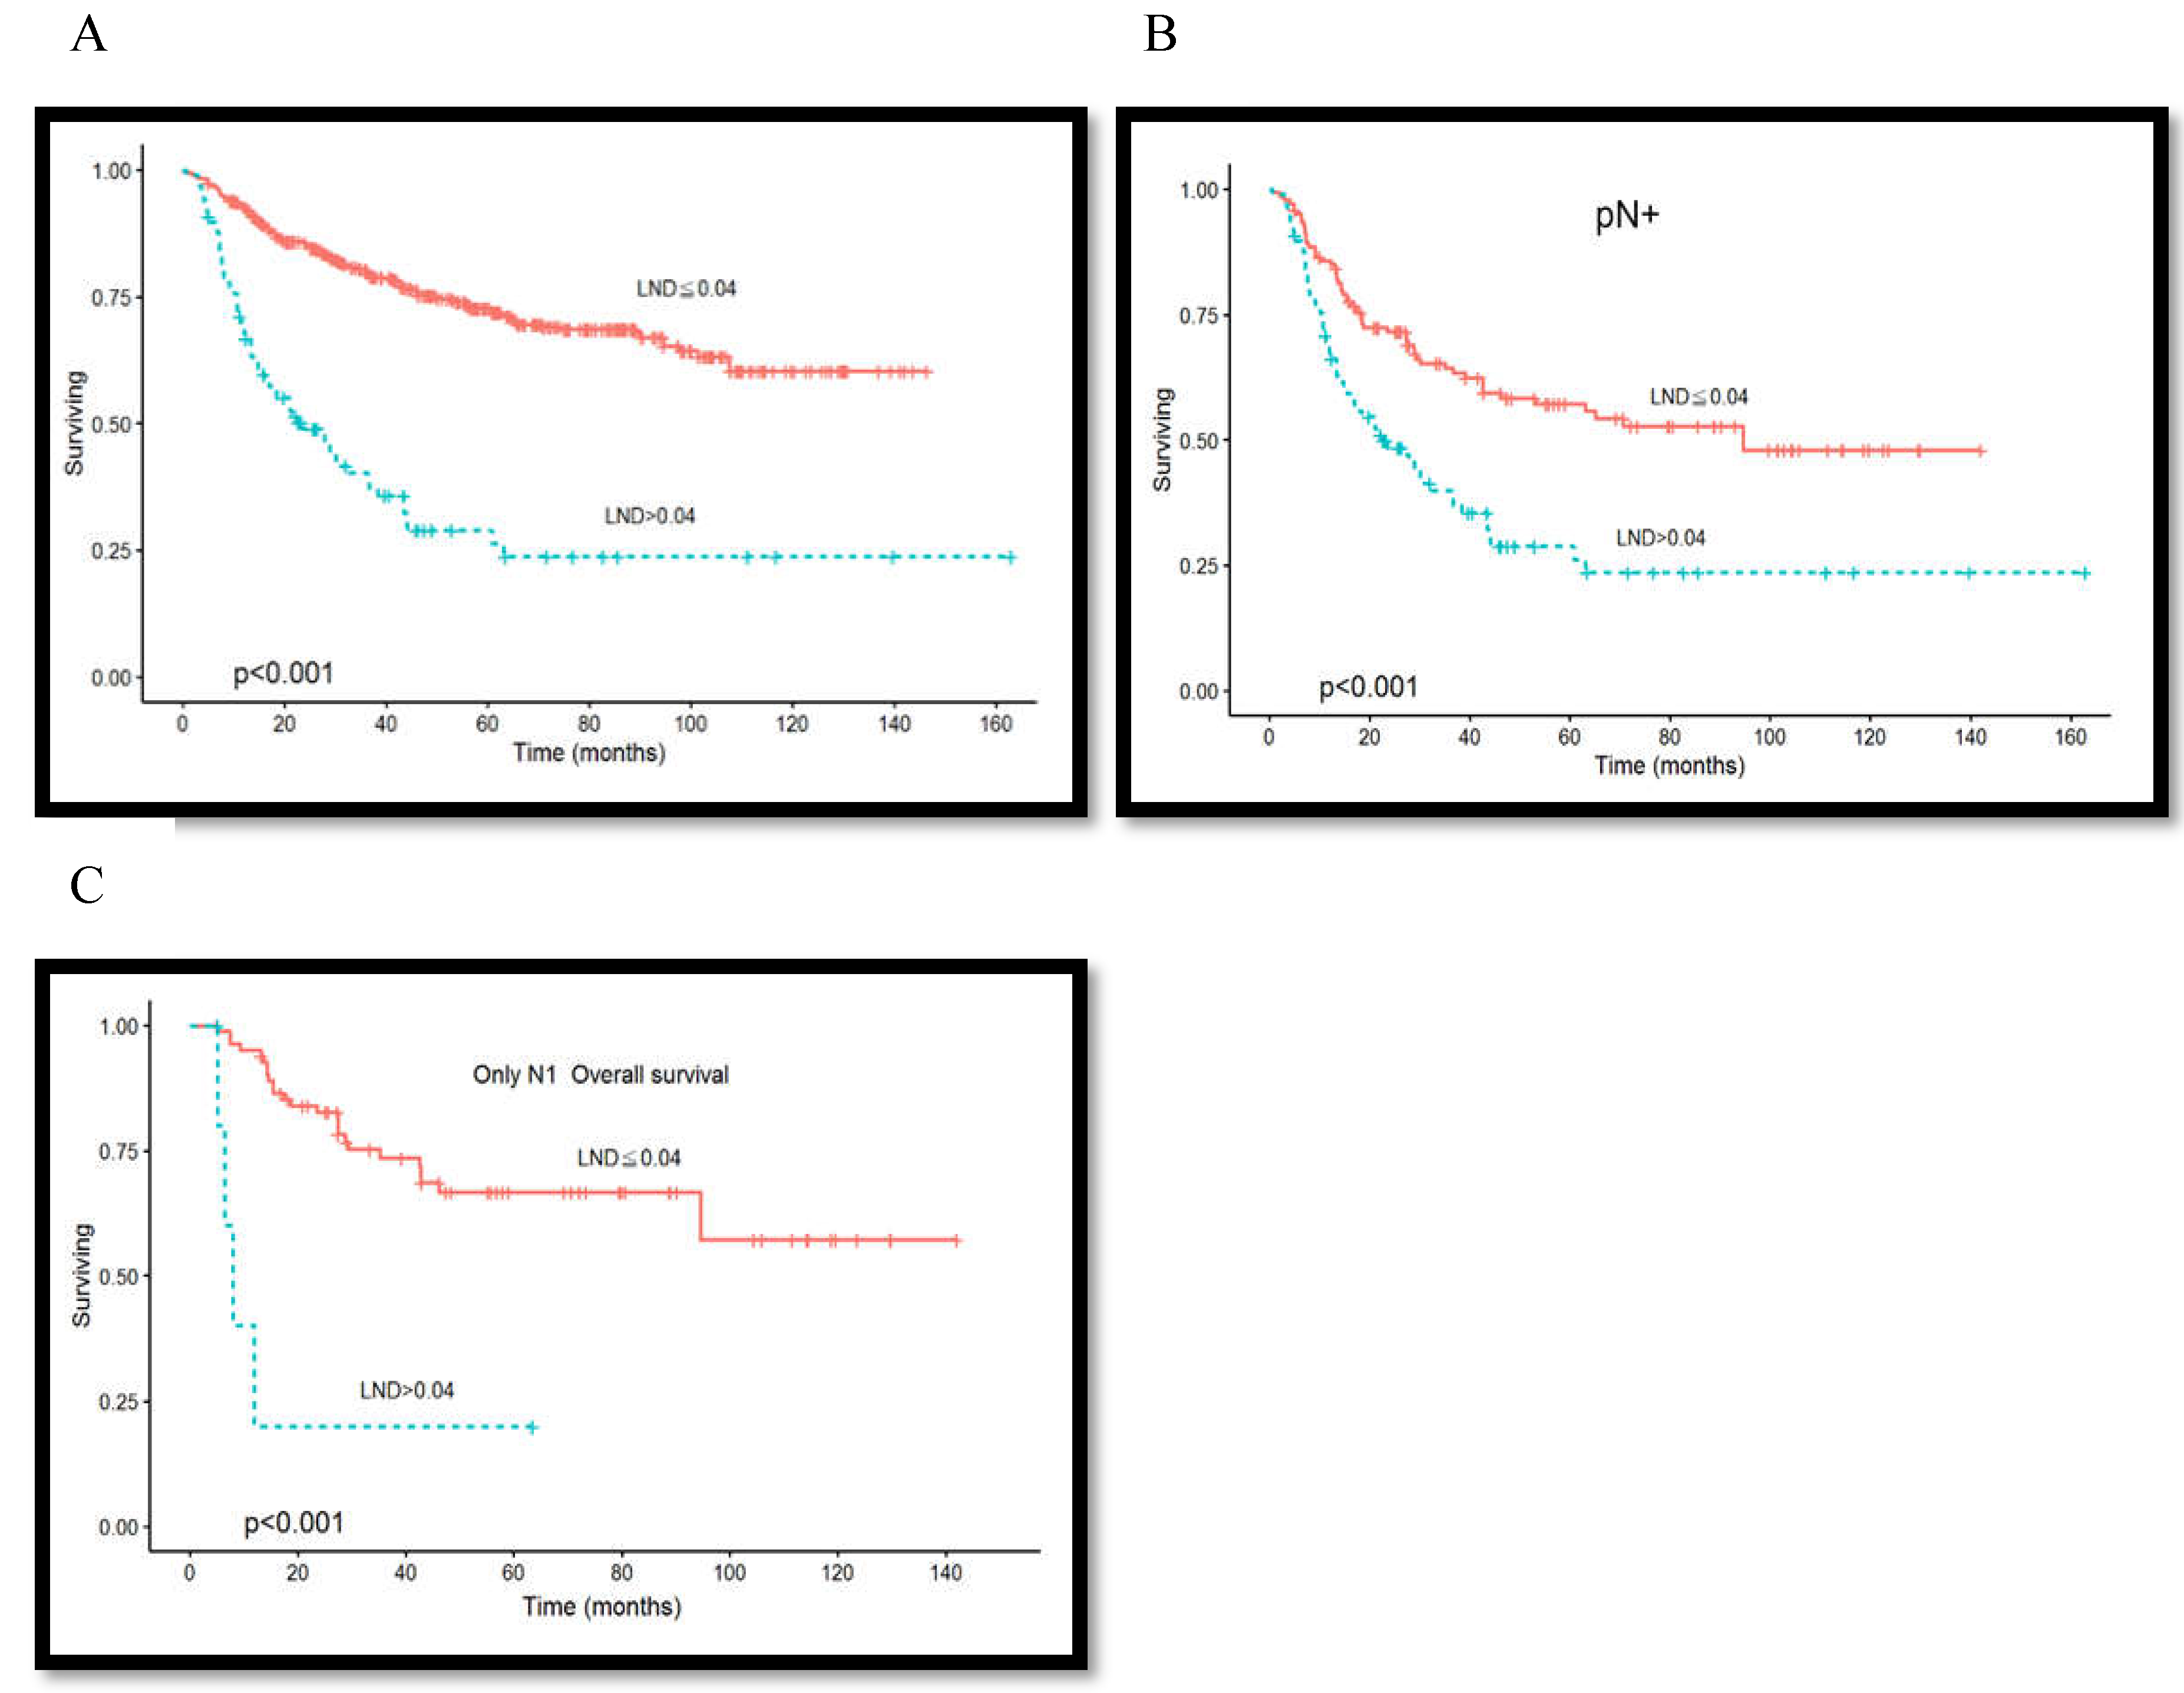
3.4. Association between Lymph Node Density and Overall Survival Rate
3.5. Association between Clinical Pathological Parameters and Lymph Node Density
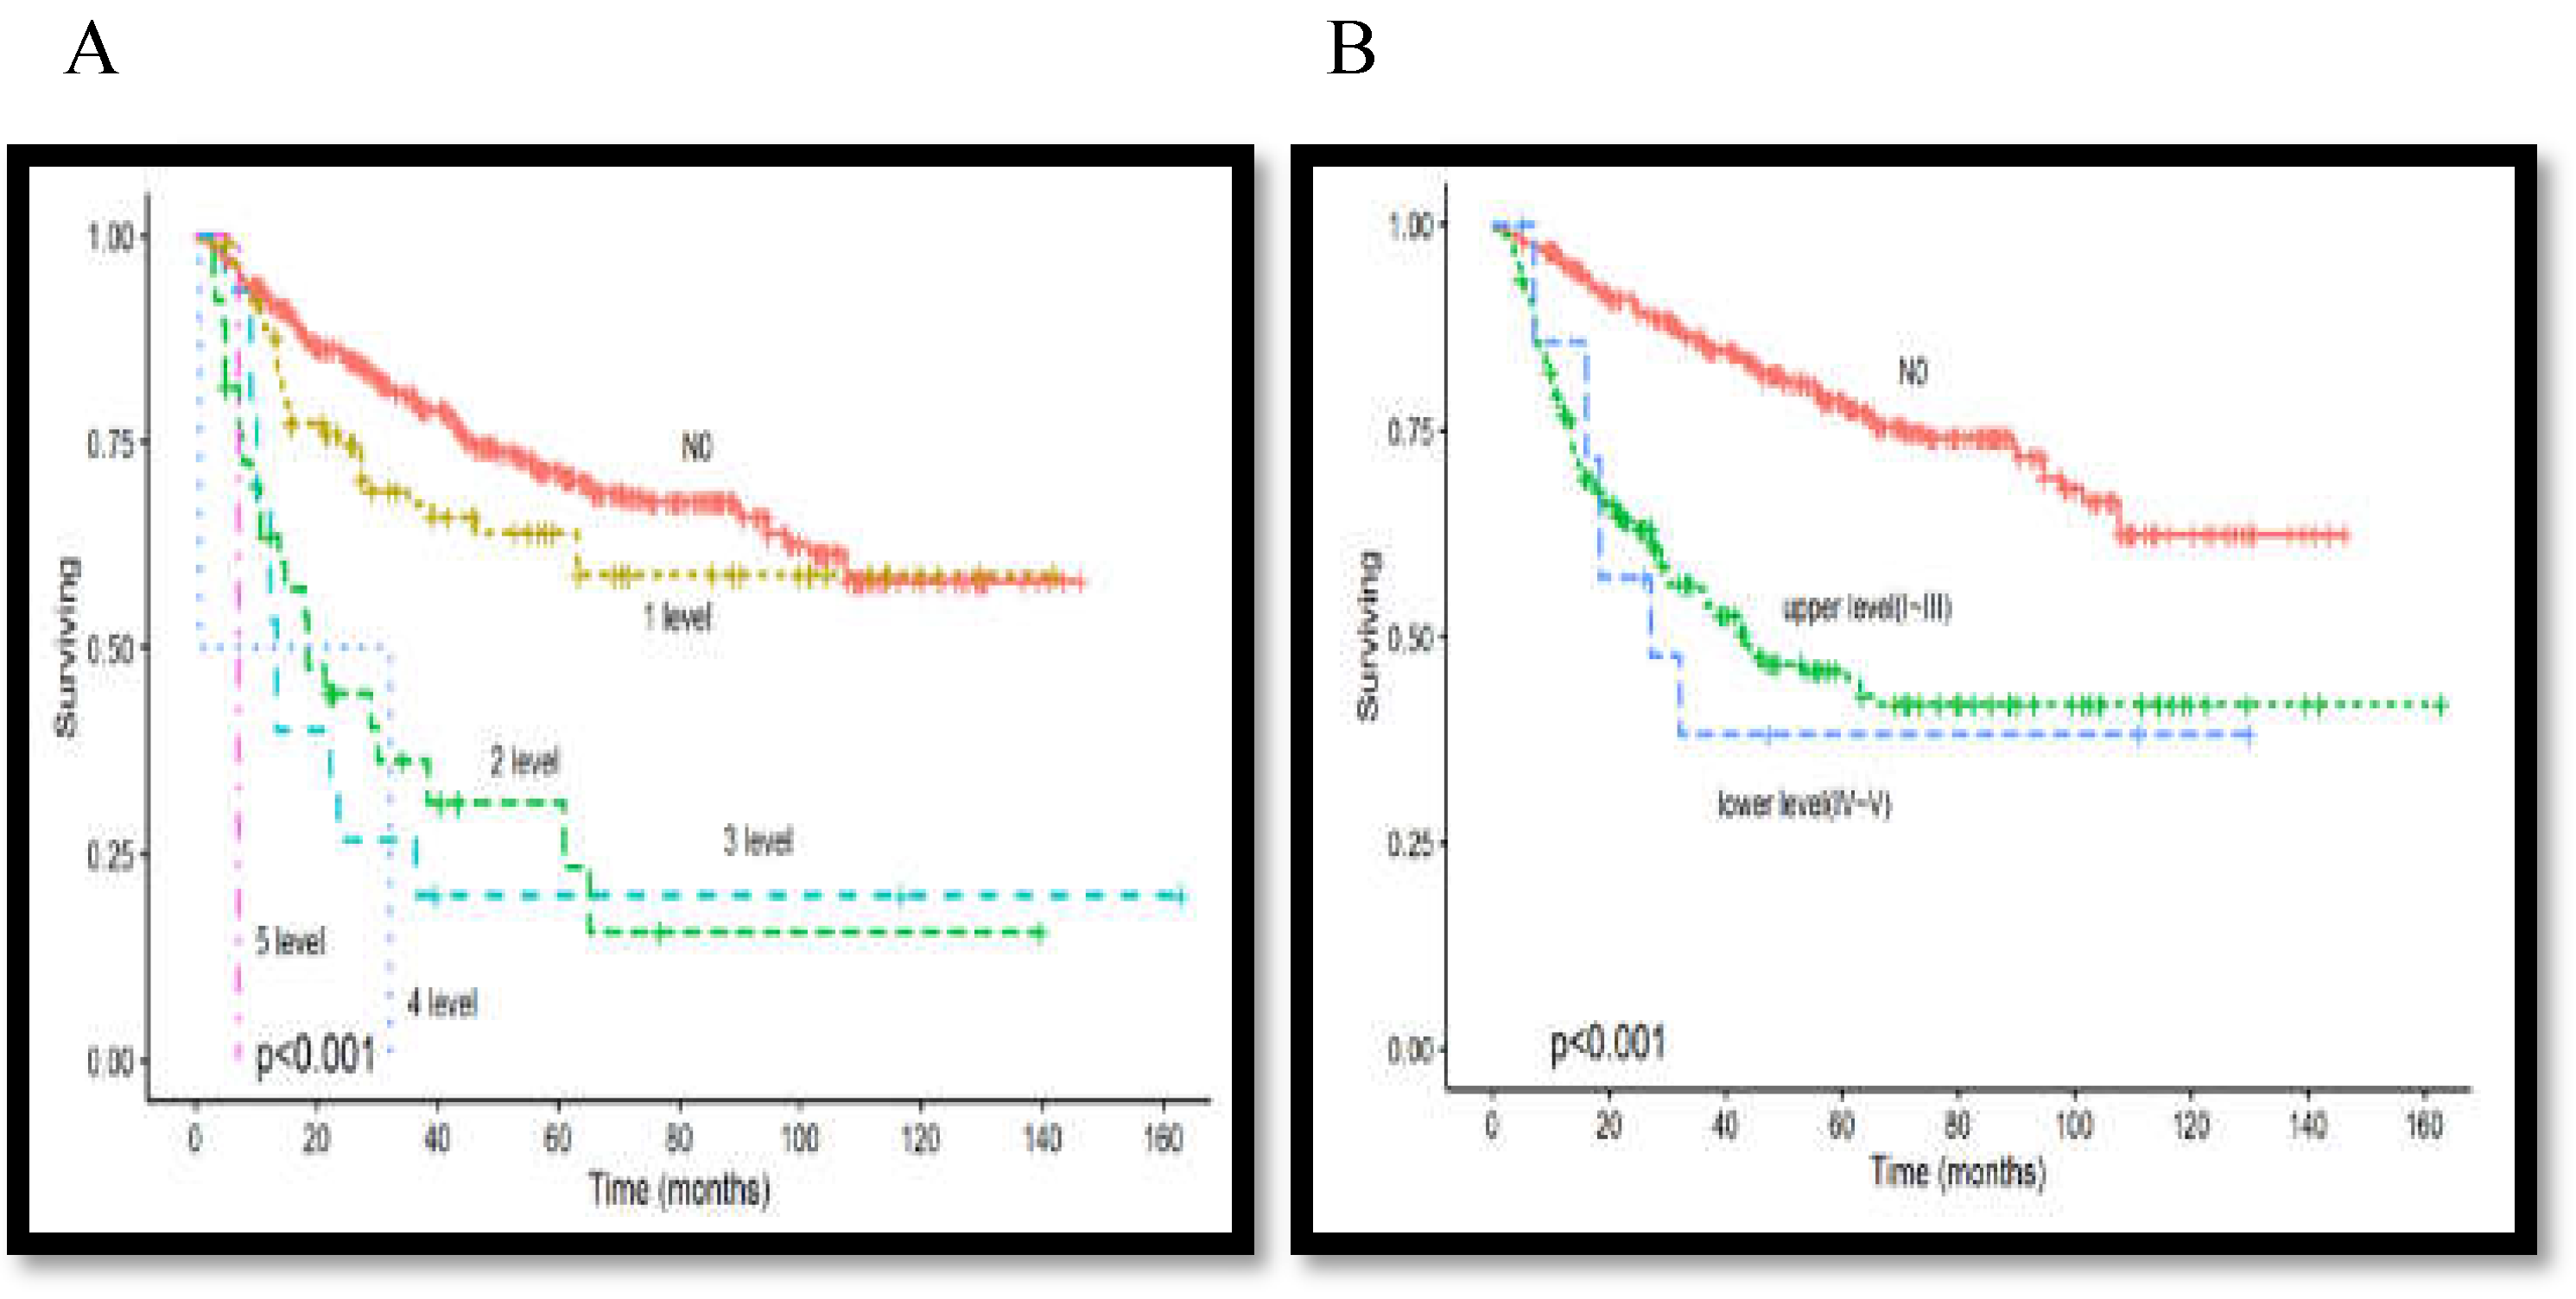
3.6. Association between Lymph Node Metastasis Level and Overall Survival Rate
3.7. Association between Overall Survival Rate and Tumor Thickness Combined with Lymph Node Density
4. Discussion
5. Conclusions
Author Contributions
Acknowledgments
Conflicts of Interest
References
- Department of Health. Cancer registry annual report in Taiwan area. Taiwan, ROC: Department of Health Executive Yuan ROC (Taiwan) death statistics. Available online: https://www.hpa.gov.tw/Pages/Detail.aspx?nodeid=269&pid=10227 (accessed on 16 March 2020).
- Jemal, A.; Murray, T.; Ward, E.; Samuels, A.; Tiwari, R.C.; Ghafoor, A.; et al. Cancer statistics, 2004. CA. Cancer J Clin 2005, 54, 8–29. [Google Scholar]
- Lo, W.L.; Kao, S.Y.; Chi, L.Y.; Wong, Y.K.; Chang, R.C. Outcomes of oral squamous cell carcinoma in Taiwan after surgical therapy: Factors affecting survival. J. Oral. Maxillofac. Surg. 2003, 61, 751–758. [Google Scholar] [CrossRef] [PubMed]
- Balasubramanian, D.; Ebrahimi, A.; Gupta, R.; Gao, K.; Elliott, M.; Palme, C.E.; et al. Tumour thickness as a predictor of nodal metastases in oral cancer:comparison between tongue and floor of mouth subsites. Oral. Oncol. 2014, 50, 1165–1168. [Google Scholar] [CrossRef] [PubMed]
- Woolgar, J.A. Micrometastasis in oral/oropharyngeal squamous cell carcinoma: Incidence, histopathological features and clinical implications. Br. J. Oral. Maxillofac. Surg. 1999, 37, 181–186. [Google Scholar] [CrossRef]
- Huang, S.H.; Hwang, D.; Lockwood, G.; Goldstein, D.P.; O’Sullivan, B. Predictive value of tumor thickness for cervical lymph-node involvement in squamous cell carcinoma of the oral cavity: A meta-analysis of reported studies. Cancer 2009, 115, 1489–1497. [Google Scholar] [CrossRef]
- O’Brien, C.J.; Lauer, C.S.; Fredricks, S.; Clifford, A.R.; McNeil, E.B.; Bagia, J.S.; et al. Tumor thickness influences prognosis of T1 and T2 oral cavity cancer–but what thickness? Head. Neck 2003, 25, 937–945. [Google Scholar] [CrossRef]
- Al-Rajhi, N.; Khafaga, Y.; El-Husseiny, J.; Saleem, M.; Mourad, W.; Al-Otieschan, A.; et al. Early stage carcinoma of oral tongue: Prognostic factors for local control and survival. Oral. Oncol. 2000, 36, 508–514. [Google Scholar] [CrossRef]
- Mücke, T.; Mitchell, D.A.; Ritschl, L.M.; Tannapfel, A.; Wolff, K.D.; Kesting, M.R.; et al. Influence of tumor volume on survival in patients with oral squamous cell carcinoma. J. Cancer Res. Clin. Oncol. 2015, 141, 1007–1011. [Google Scholar] [CrossRef]
- Pentenero, M.; Gandolfo, S.; Carrozzo, M. Importance of tumor thickness and depth of invasion in nodal involvementand prognosis of oral squamous cell carcinoma: A review of the literature. Head. Neck 2005, 27, 1080–1091. [Google Scholar] [CrossRef]
- Yang, X.; Huang, X.; Hu, Q.; Wang, Z. Metastases to lingual lymph nodes from squamous cell carcinoma of the tongue. Br. J. Oral. Maxillofac. Surg. 2008, 46, 376–378. [Google Scholar]
- Kassouf, W.; Agarwal, P.K.; Herr, H.W.; Munsell, M.F.; Spiess, P.E.; Brown, G.A.; et al. Lymph node density is superior to TNM Nodal status in predicting disease-specific survival after radical cystectomy for bladder cancer: Analysis of pooled data from MDACC and MSKCC. J. Clin. Oncol. 2008, 26, 121–126. [Google Scholar] [CrossRef] [PubMed]
- Ooki, A.; Yamashita, K.; Kobayashi, N.; Katada, N.; Sakuramoto, S.; Kikuchi, S.; et al. Lymph node metastasis density and growth pattern as independent prognostic factors in advanced esophageal squamous cell carcinoma. World J. Surg. 2007, 31, 2184–2191. [Google Scholar] [CrossRef] [PubMed]
- Kowalski, L.P.; Bagietto, R.; Lara, J.R.; Santos, R.L.; Silva Jr, J.F.; Magrin, J. Prognostic significance of the distribution of neck node metastasis from oral carcinoma. Head. Neck 2000, 22, 207–214. [Google Scholar] [CrossRef]
- Gil, Z.; Carlson, D.L.; Boyle, J.O.; Kraus, D.H.; Shah, J.P.; Shaha, A.R.; et al. Lymph node density is a significant predictor of outcome inpatients with oral cancer. Cancer 2009, 115, 5700–5710. [Google Scholar] [CrossRef]
- Patel, S.G.; Shah, J.P. TNM staging of cancers of the head and neck: Striving for uniformity among diversity. CA Cancer J. Clin. 2005, 55, 242–258. [Google Scholar] [CrossRef]
- Carinci, F.; Farina, A.; Longhini, L.; Urso, R.G.; Pelucchi, S.; Calearo, C. Is the new TNM (1997) the best system for predicting prognosis? Int. J. Oral. Maxillofac. Surg. 1999, 28, 203–205. [Google Scholar] [CrossRef]
- Spiro, R.H.; Huvos, A.G.; Wong, G.Y.; Spiro, J.D.; Gnecco, C.A.; Strong, E.W. Predictive value of tumor thickness in squamous carcinoma confined to the tongue and floor of the mouth. Am. J. Surg. 1986, 152, 345–350. [Google Scholar] [CrossRef]
- O-charoenrat, P.; Pillai, G.; Patel, S.; Fisher, C.; Archer, D.; Eccles, S.; Rhys-Evans, P. Tumor thickness predicts cervical nodal metastases and survival in early oral tongue cancer. Oral. Oncol. 2003, 39, 386–390. [Google Scholar] [CrossRef]
- Kurokawa, H.; Yamashita, Y.; Takeda, S.; Zhang, M.; Fukuyama, H.; Takahashi, T. Risk factor for late cervical metastasis in patients with stage I or II carcinoma of the tongue. Head. Neck 2002, 24, 731–736. [Google Scholar] [CrossRef]
- Woolgar, J.A.; Scott, J. Prediction of cervical lymph node metastasis in squamous cell carcinoma of the tongue/floor of mouth. Head. Neck 1995, 17, 463–472. [Google Scholar] [CrossRef]
- Giacomarra, V.; Tirelli, G.; Papanikolla, L.; Bussani, R. Predictive factors of nodal metastases in oral cavity and oropharynx carcinomas. Laryngoscope 1999, 109, 795–799. [Google Scholar] [CrossRef] [PubMed]
- Breslow, A. Tumor thickness, level of invasion and node dissection in stage I cutaneous melanoma. Ann. Surg. 1975, 182, 572–575. [Google Scholar] [CrossRef] [PubMed]
- Mohit-Tabatabai, M.A.; Sobel, H.J.; Rush, B.F.; Mashberg, A. Relation of thickness of floor of mouth stage I and II cancers to regional metastasis. Am. J. Surg. 1986, 152, 351–353. [Google Scholar] [CrossRef]
- Asakage, T.; Yokose, T.; Mukai, K.; Tsugane, S.; Tsubono, Y.; Asai, M.; et al. Tumor thickness predicts cervical metastasis in patients with stage I/II carcinoma of the tongue. Cancer 1998, 82, 1443–1448. [Google Scholar] [CrossRef]
- Mücke, T.; Kanatas, A.; Ritschl, L.M.; Koerdt, S.; Tannapfel, A.; Wolff, K.D.; et al. Tumor thickness and risk of lymph node metastasis in patients with squamous cell carcinoma of the tongue. Oral. Oncol. 2016, 53, 80–84. [Google Scholar] [CrossRef]
- Brown, B.; Barnes, L.; Mazariegos, J.; Taylor, F.; Johnson, J.; Wagner, R.L. Prognostic factors in mobile tongue and floor of mouth carcinoma. Cancer 1989, 64, 1195–1202. [Google Scholar] [CrossRef]
- Morton, R.P.; Ferguson, C.M.; Lambie, N.K.; Whitlock, R.M. Tumor thickness in early tongue cancer. Arch. Otolaryngol. Head. Neck Surg. 1994, 120, 717–720. [Google Scholar] [CrossRef]
- Chiang, C.P.; Chang, M.C.; Lee, J.J.; Chang, J.Y.; Lee, P.H.; Hahn, L.J.; et al. Hamsters chewing betel quid or areca nut directly show a decrease in body weight and survival rateswith concomitant epithelial hyperplasia of cheek pouch. Oral. Oncol. 2004, 40, 720–727. [Google Scholar] [CrossRef] [PubMed]
- Yen, A.M.; Chen, S.C.; Chen, T.H. Dose-response relationships of oral habits associated with the risk of oral pre-malignant lesions among men who chew betel quid. Oral. Oncol. 2007, 43, 634–638. [Google Scholar] [CrossRef]
- Wong, T.Y.; Jin, Y.T.; Chen, H.O.; Lin, L.M. Studies on Taiwan betel-quid carcinogenicity in hamster cheek pouch. Chin Dent J. 1992, 11, 155–162. [Google Scholar]
- Liao, C.T.; Wang, H.M.; Chang, J.T.; Ng, S.H.; Hsueh, C.; Lee, L.Y.; et al. Analysis of risk factors for distant metastases in squamous cell carcinoma of the oral cavity. Cancer 2007, 110, 1501–1508. [Google Scholar] [CrossRef] [PubMed]
- Huang, C.H.; Chu, S.T.; Ger, L.P.; Hou, Y.Y.; Sun, C.P. Clinicopathologic evaluation of prognostic factors for squamous cell carcinoma of the buccal mucosa. J. Chin. Med. Assoc. 2007, 70, 164–170. [Google Scholar] [CrossRef] [PubMed]
- Vaccaro, C.A.; Im, V.; Rossi, G.L.; Quintana, G.O.; Benati, M.L.; de Arenaza, D.P.; et al. Lymph node ratio as prognosis factor for colon cancer treated by colorectal surgeons. Dis. Colon. Rectum 2009, 52, 1244–1250. [Google Scholar] [CrossRef] [PubMed]
- Woodward, W.A.; Vinh-Hung, V.; Ueno, N.T.; Cheng, Y.C.; Royce, M.; Tai, P.; et al. Prognostic value of nodal ratios in node-positive breast cancer. J. Clin. Oncol. 2006, 24, 2910–2916. [Google Scholar] [CrossRef]
- Fleming, N.D.; Frumovitz, M.; Schmeler, K.M.; Dos Reis, R.; Munsell, M.F.; Eifel, P.J.; et al. Significance of lymph node ratio in defining risk category in node-positive early stage cervical cancer. Gynecol. Oncol. 2015, 136, 48–53. [Google Scholar] [CrossRef]
- Kim, S.Y.; Nam, S.Y.; Choi, S.H.; Cho, K.J.; Roh, J.L. Prognostic value of lymph node density in node-positive patients with oral squamous cell carcinoma. Ann. Surg. Oncol. 2011, 18, 2310–2317. [Google Scholar] [CrossRef]
- Patel, S.G.; Amit, M.; Yen, T.C.; Liao, C.T.; Chaturvedi, P.; Agarwal, J.P.; et al. Lymph node density in oral cavity cancer: Results of the international consortium for outcomes research. Br. J. Cancer 2012, 109, 2087–2095. [Google Scholar] [CrossRef]
- Kuo, P.; Mehra, S.; Sosa, J.A.; Roman, S.A.; Husain, Z.A.; Burtness, B.A.; et al. Proposing prognostic thresh olds for lymph node yield in clinically lymph node-negative and lymph node-positive cancers of the oral cavity. Cancer 2016, 122, 3624–3631. [Google Scholar] [CrossRef]

| Characteristics | No. of Patients(%) | ||
|---|---|---|---|
| Gender | Female | 44(7.2%) | |
| Male | 568(92.8%) | ||
| Age | Mean | 53.3 y/o | |
| DM | No | 486(79.4%) | |
| Yes | 126(20.6%) | ||
| Tumor size | T1~T3 | 259(42.3%) | |
| T4 | 353(57.7%) | ||
| Lymph node stage | pN0 | 372(60.8%) | |
| pN+ | 240(39.2%) | ||
| Pathologic stage | I-III | 583(95.3%) | |
| IV | 29(4.7%) | ||
| Primary site | Buccal | 246(40.2%) | |
| Tongue | 170(27.7%) | ||
| Other | 206(32.1%) | ||
| Cell differentation | Well | 219(35.8%) | |
| Moderate + Poor | 393(64.2%) | ||
| Lymphovascular invasion | No | 500(81.7) | |
| Yes | 112(18.3%) | ||
| Perineural invasion | No | 479(78.3%) | |
| Yes | 133(21.7%) | ||
| Extranodal extension | No | 522(89.7%) | |
| Yes | 60(10.3%) | ||
| Tumor thickness | ≦6mm | 133(30.5%) | |
| >6mm | 305(69.5%) | ||
| Lymph node density | ≦0.04 | 514(84.0%) | |
| >0.04 | 98(16.0%) | ||
| Level of nodal metastasis | level I~III | 223(92.9%) | |
| level IV~V | 17(7.1%) | ||
| Survival status | Alive | 414(67.7%) | |
| Dead | 198(32.4%) | ||
| Follow-up | Mean | 54.5 months | |
| Variable | Univariate Analysis | Multivariate Analysis | ||
|---|---|---|---|---|
| HR (95%CI) | p-Value | HR (95%CI) | p-Value | |
| Lymph node density | ||||
| ≦0.04 vs >0.04 | 3.99(2.94-5.42) | <0.001 | 2.18(1.11-4.28) | 0.024 |
| Lymph node status | ||||
| pN0 vs pN+ | 2.96(2.23-3.92) | <0.001 | 1.83(1.01-3.34) | 0.048 |
| Tumor size | ||||
| T1-3 vs T4 | 3.31(2.31-4.63) | <0.001 | 2.29(2.16-4.35) | <0.001 |
| Diabetes mellitus | ||||
| No vs Yes | 2.59(1.94-3.47) | <0.001 | 2.96(1.71-5.13) | <0.001 |
| Gender | ||||
| Female vs Male | 1.46(0.89-2.40) | 0.138 | ||
| Cell differentiation | ||||
| Well vs Moderate +Poor | 3.03(1.83-5.00) | <0.001 | ||
| Perineural invasion | ||||
| No vs Yes | 2.70(2.00-3.67) | <0.001 | 2.32(1.60-3.36) | <0.001 |
| Lymphovascular invasion | ||||
| No vs Yes | 2.65(1.96-3.60) | <0.001 | ||
| Tumor thickness | ||||
| ≦6mm vs >6mm | 3.89(2.24-6.71) | <0.001 | 2.95(1.59-5.47) | 0.001 |
| Primary Site | pN0(%) | pN+(%) | p-Value | |
|---|---|---|---|---|
| All | Tumor thickness≦6mm | 89(39.6%) | 44(20.7%) | <0.001 |
| Tumor thickness >6mm | 136(60.4%) | 169(79.3%) | ||
| Tongue | Tumor thickness≦9mm | 33(54.1%) | 12(20.0%) | <0.001 |
| Tumor thickness >9mm | 28(45.9%) | 48(80.0%) | ||
| Buccal | Tumor thickness≦7mm | 35(40.2%) | 23(25.8%) | <0.001 |
| Tumor thickness >7mm | 52(59.8%) | 66(74.2%) |
| Variables | Univariate | Multivariate | ||
|---|---|---|---|---|
| HR (95% CI) | p-Value | HR (95% CI) | p-Value | |
| Lymphovascular invasion | ||||
| No | Reference | |||
| Yes | 2.97(1.64-5.39) | <0.001 | ||
| Perineural invasion | ||||
| No | Reference | Reference | ||
| Yes | 3.99 (2.18-7.31) | <0.001 | 2.75 (1.41-5.36) | <0.003 |
| Tumor size | ||||
| T1-T3 | Reference | Reference | ||
| T4 | 8.25 (5.12-13.28) | <0.001 | 2.55 (1.13-5.74) | <0.001 |
| Pathologic stage | ||||
| I-III | Reference | Reference | ||
| IV | 1.75 (1.37-2.22) | <0.001 | 4.13 (1.87-9.11) | <0.001 |
| Level of nodal metastasis | ||||
| Level I-III | Reference | |||
| Level IV-V | 1.06(0.26-4.23) | 0.929 | ||
| Involved level | ||||
| 1 Level | Reference | |||
| 2 Levels | 1.39(0.59-3.25) | 0.442 | ||
| >2 Levels | 2.22(0.47-10.31) | 0.308 | ||
| Extranodal extension | ||||
| No | Reference | |||
| Yes | 3.68(1.62-8.35) | 0.002 | ||
| Diabetes mellitus | ||||
| No | Reference | |||
| Yes | 2.40(1.32-4.38) | 0.004 | ||
| Cell differentation | ||||
| Well | Reference | Reference | ||
| Moderate + Poor | 1.94 (1.27-2.97) | <0.002 | 2.08 (1.25-3.467) | <0.004 |
| Variables | Univariate | Multivariate | ||
|---|---|---|---|---|
| HR (95% CI) | p-Value | HR (95% CI) | p-Value | |
| Lymphovascular invasion | ||||
| N0 | Reference | Reference | ||
| Yes | 6.84(4.24-11.01) | <0.001 | 4.84(2.58-8.22) | <0.001 |
| Perineural invasion | ||||
| No | Reference | |||
| Yes | 3.29(2.08-5.22) | <0.001 | ||
| Tumor size | ||||
| T1-T3 | Reference | |||
| T4 | 1.61(1.02-2.548) | 0.041 | ||
| Pathologic stage | ||||
| I-III | Reference | |||
| IV | 1.57(0.95-2.58) | 0.073 | ||
| Level of nodal metastasis | ||||
| Level I-III | Reference | |||
| Level IV-V | 2.28(0.79-6.60) | 0.126 | ||
| Involved level | ||||
| 1 Level | Reference | |||
| 2 Levels | 5.98(3.10-11.53) | <0.001 | ||
| >2 Levels | 9.28(3.34-25.72) | <0.001 | ||
| Extranodal extension | ||||
| No | Reference | |||
| Yes | 17.87(9.75-32.76) | <0.001 | ||
| Tumor thickness | ||||
| ≦6mm | Reference | Reference | ||
| >6mm | 2.92(1.56-5.49) | <0.001 | 1.98(1.02-3.86) | <0.044 |
| Diabetes mellitus | ||||
| No | Reference | Reference | ||
| Yes | 2.16(1.34-3.49) | <0.002 | 2.09(1.18-3.86) | <0.011 |
| Differentation | ||||
| Well | Reference | Reference | ||
| Moderate + Poor | 2.46(1.46-4.15) | <0.001 | 1.987(1.08-3.64) | <0.027 |
| Variables | Univariate | Multivariate | ||
|---|---|---|---|---|
| HR (95% CI) | p-Value | HR (95% CI) | p-Value | |
| Level of nodal metastasis | ||||
| I-III | Reference | Reference | ||
| IV-V | 1.87(1.06-3.30) | 0.03 | 0.11(0.03-8.22) | 0.003 |
| Involved level | ||||
| 1 Level | Reference | |||
| 2 Levels | 2.22(1.46-3.38) | <0.001 | ||
| >2 Levels | 2.23(1.27-3.83) | 0.01 | ||
Disclaimer/Publisher’s Note: The statements, opinions and data contained in all publications are solely those of the individual author(s) and contributor(s) and not of MDPI and/or the editor(s). MDPI and/or the editor(s) disclaim responsibility for any injury to people or property resulting from any ideas, methods, instructions or products referred to in the content. |
© 2024 by the authors. Licensee MDPI, Basel, Switzerland. This article is an open access article distributed under the terms and conditions of the Creative Commons Attribution (CC BY) license (https://creativecommons.org/licenses/by/4.0/).


