
Submitted:
12 October 2024
Posted:
15 October 2024
You are already at the latest version
Abstract
Presently, the recurrent flood disasters resulting from global extreme weather have inflicted damage upon the Chinese ancient site. Considering the complexity of the materials consist of the Chinese ancient sites, a flood risk assessment method for the ancient sites in Henan province considering multiple types of materials is proposed in this paper. Within the framework, the hazard, sensitivity and vulnerability of the ancient sites are selected and calculated by the selected indicators respectively. To overcome the complexity of the materials, we regard the types of ancient sites as the material score to calculate vulnerability of ancient site. Subsequently, the weight of each indicator is captured based on the analytic hierarchy process (AHP) method. Finally, 157 ancient sites in Henan province are selected for the flood disasters risk calculation and analysis in this paper. The results demonstrate our proposed method can obtain more accurate rainstorm and flood risk of the ancient sites.
Keywords:
flood risk assessment
; disasters
; AHP
; material
; ancient sites
1. Introduction
The Third National Cultural Relics Survey shows there are 193,282 ancient sites which are the important part of cultural heritages and have important historical, cultural and economic values [1]. In recent years, with global warming, extreme rainstorms, flood events have become more frequent, resulting in the frequent destruction of Chinese ancient sites. To prevent the damage of ancient sites caused by floods, the application of risk management theory to the protection and research of cultural heritage against various natural disaster has become the consensus of scholars around the world [2,3,4]. Natural disaster risk assessment is the core of risk management. Thus, there is an urgent need to enhance flood risk assessment, enabling governments, emergency management agencies, and the public to prepare in advance and implement appropriate mitigation measures to reduce the threat of flood events to ancient sites [5].
The natural disaster risk involves capacity, exposure of persons and assets, hazard characteristics, the environment and vulnerability [6] based on the Sendai Framework for Disaster Risk Reduction 2015-2030 which was adopted at the Third UN World Conference in Sendai, Japan. In terms of flood risk, the capacity mainly refers to the ability of the flood prevention and mitigation; exposure is an indicator for measuring the exposure level of physical, environmental, and social assets to flood; the hazard which can cause disaster is used to describe the factors that have adverse effects on human life, property, or various activities in natural or man-made environments and the potential adverse effects caused by exposure are expressed as vulnerability. The flood risk is coupled by these risk elements. Focusing on these involved risk assessment elements, various of flood risk assessment models (or framework) have been proposed.
To obtain the mapping of the flood hazard, some researchers select the historical flood data to predict the future flood risk. For example, Huang et al. [7] put forward a practical method for agricultural natural disaster risk assessment by optimizing of historical disaster data based on more than 200 years of historical flood disaster data in GuanZhong region. The storm water management model (SWMM) is one of the typical models for the mapping of the flood hazard. In the early time, SWMM is mainly used for flood simulation [8,9]. With the continuous improvement of demand, some people gradually combined geographic information system (GIS) visualization technology or coupled other models for simulation to achieve high-precision simulation effect [13]. Besides SWMM, other similar methods including HEC-RAS and MIKE FLOOD are proposed for predicting the future flood [10,11,12]. This type of the models can precisely reflect the mapping of the flood hazard, and flood risk assessment indicators including the historical flood (or rain fall) data, the land-use data, the terrain data and the drainage pipeline are required as the input data of these methods. In the analysis of flood exposure and vulnerability, flood risk assessment methods based on GIS and remote sensing (RS) techniques are usually applied to obtain inundation range, inundation duration, disaster-bearing body and other information in disaster-affected areas [13,14]. [] The high-resolution images and spatially explicit data are needed to capture various flood risk assessment indicators [15,16,17]. Generally, in the process of flood risk assessment, the researchers select multiple flood risk assessment elements to determine the future flood risk based on characters of research object. Liang et al. [18] select the hazard factors, disaster formative environment and hazard bearing-body of cultural heritages. material type as a vulnerability indicator of cultural relics ontology to assess the risk of flooding on 24 ancient sites under national key protection of cultural relics (abbreviation national protection) in 18 counties (cities) in Fujian Province, China.
Obviously, the flood risk assessments are different in the different application fields. This is mainly because the characters of the flood risk assessment object vary greatly. For example, aiming at the flood risk of Changchun Urban Rail Transit System, Liu Gexu et al [19]employ comprehensive natural disaster risk assessment theory, establishing an assessment database with 22 indicators. Among the 22 indicators, passenger flow, metro line proximity, type of exit and metro station density are applied to determine the vulnerability of the urban rail transit system. To predict the flood risk of the immovable culture heritage in Fujian Province in China, the indicators relating to the vulnerability contain the protection level, management organization, structure type and material type are selected in [18]. In our previous work [20], the waterlogging risk assessment method for PuZhou ancient city sites considering the microtopography is proposed at the scale of the Chinese ancient city sites. To better reflect the waterlogging hazards, both the SWMM and the GIS techniques are applied to obtain the inundation range based on the captured the historical rain data, land cover and the terrain data etc.
In the field of cultural heritage, Marvin Ravan et al. [21] propose a cultural heritage vulnerability index which encompasses the susceptibility (or sensitivity) and the coping and adaptive capacities. The susceptibility is divided into four components including the structure, materials, immovable elements, and movable elements. Each component is further classified various of assessment indicators. The materials mainly referred to Building or decorative materials which contains the artificial stones, natural stones, organic materials, glass and metals. Aiming at the different natural disasters, the weights of the indicators at different levels are defined by experts. Based on the AHP method, the cultural heritage vulnerability index. Julio Garrote et al. [22] classify the cultural heritage vulnerability into the materials vulnerability, structural vulnerability and artworks. The vulnerability in [] doesn’t contain the coping and adaptive capacities. Besides this difference, the materials of culture heritage mainly contain the earth, adobe, timber, rubble, stone ashlar, mortar masonry, bricks, bedrock and concrete which are different from the materials used in [23] due to the difference of the research object. These methods need a plenty of detailed data relating to the vulnerability of cultural heritage. To overcome this limitation, some studies regard the materials of the single (or multiple) cultural heritages as the single material in some cases. Wang yi et al. [24] applies the comprehensive risk assessment method to predict the flood risk. However, In China, many ancient sites exist in the form of national key cultural relics protection unit. Generally, there are multiple cultural heritages within the range of protection unit. This results that the captured materials can not real material type. For single materials, some scholars have also conducted relevant studies [25,26,27], which conducted flood hazard assessment on Adobe Buildings.
Although we consider the flood risk for the ancient sites in HeNan province and in other counties as essentially the same, there are still some challenges for the flood risk assessment of the ancient sites.
- ■
- One hand, the ancient sites in Henan province have their own flood risk characteristics including the flood hazard, environment and character of the body of cultural heritage. Both The proper risk assessment indicator and the flood risk assessment method are needed to effectively and efficiently reduce flood losses and to develop and implement appropriate control strategies.
- ■
- On the other hand, in the process of flood risk assessment for the ancient sites in Henan province, the assessment unit should be the cultural relics protection unit which contain multiple cultural heritage elements. The previous study regards the material of the cultural relic protection unit as a single material without considering the material differences. The complex material composition brings difficulties to obtain the vulnerability of cultural heritage.
To address the above-mentioned limitations, this study aims to construct a flood risk assessment framework for the ancient sites based on the comprehensive hazard risk assessment theory of natural disasters proposed by Zhang and Liang et al. [28]. Within our proposed framework, the material of the ancient sites is calculated by the types of the ancient sites.
The rest of this paper is organized as follows: Section 2 gives an overview of our proposed framework and the study area and data sources. Section 3 describes and analyzes the detailed flood risk assessment indicators. Section 4 gives the calculation method for flood risk index for the ancient sites in Henan province. Section 5 presents the experimental results, and makes a comparative analysis. Finally, section 6 concludes this article.
2. Proposed Flood Risk Assessment Framework for the Ancient Sites
2.1. The Proposed Flood Risk Assessment Framework
In this paper, the flood risk assessment for the ancient sites is divided into three elements, including hazard, vulnerability, and the sensitivity of flood-forming environment, on the basis of the comprehensive risk assessment theory of natural disasters as is expressed as in equation (1).
where, is the risk value, is the hazard, is the sensitivity value of the flood-forming environment , is the vulnerability value of the ancient sites, and , , , and are the corresponding weights.
Figure 1 shows our proposed flood risk assessment framework for the ancient sites. This framework is divided into five steps for the risk assessment of the ancient sites in Henan province.
- ■
- Firstly, based on the comprehensive risk assessment theory, three types of indicators are selected separately to establish a complete indicator system. All risk indicators are processed in the GIS system and imported into the GlS system to form an indicator map so that each indicator can be visually represented.
- ■
- Subsequently, the AHP technique is applied to calculate the weights of each indicator, respectively.
- ■
- Thirdly, based on the raster layers and weighting results, we capture the flood risk of the ancient sites.
- ■
- Finally, the flood risk flood of the ancient sites in Henan province is analyzed.
2.2. Study Area and Data Source
2.2.1. Study Area
Henan Province is located in the central-eastern part of China, with a latitude and longitude range of 110°21′E-116°39′E, 31°23′N-36°22′N, and a total area of about 16.7 square kilometers. The overall terrain is high in the west and low in the east, surrounded by mountains in the north, west and south, with a rich variety of landforms, mainly plains, basins and mountains, which account for 82.3% of the total area, and at the same time spanning four major river basins: the Yangtze River, the Huaihe River, the Yellow River and the Haihe River. Henan Province, spanning the warm temperate zone and subtropical zone, has a continental monsoon climate, and at the same time, it is characterized by the transition of the climate from the plains to the hills from east to west, with four distinct seasons, simultaneous rain and heat, complex and diverse climates, and frequent meteorological disasters.
In nature, there is no strict distinction between sites and ruins. They are both human cultural sites that have been preserved in history, preserving some structural functions and materials, while also losing their structural integrity and original functional functions. Hence, the sites and ruins are categorized into the ancient sites in this paper. Up to 2019, there are a total of 157 ancient sites at the level of the national key cultural relics protection units established by the State Council of the People's Republic of China as is shown in Figure 2.
2.2.2. Data Sources
According to the indicator system for flood risk assessment of ancient sites constructed in this study, the data used in the study can be categorized into three types, rainfall data related to the hazard, attribute information related to the ancient site ontology, and geographic data of the flood-forming environment obtained by using remote sensing and GIS.
Among them, the rainfall data derives from the daily value dataset of China's surface climate data (V3.0) of the China National Meteorological Science Data Center Network, which contains meteorological data from a total of 699 national benchmark and basic stations on the ground in China, from which the daily cumulative precipitation was obtained for the period of 1990-2020, and based on which the number of days of torrential rainfall was counted to obtain the value of the annual rainstorm frequency. Among the geographic data, the height data (DEM) are from the SRTMDEM 90m resolution raw height dataset of the Geospatial Data Cloud Platform. The administrative boundaries, Normalized Difference Vegetation Index (NDVI) and GDP data of Henan Province were obtained from the Resource and Environment Science and Data Center of the Chinese Academy of Sciences (CAS). Population density data were obtained from the World pop website of the spatial distribution of China's population density in 2020 based on country total adjusted to match the corresponding UNPD estimate. In order to be more elaborate and specific, the river distribution data are from the 1:1 million public version of the basic geographic information dataset (2021) in the National Catalogue Service for Geographic Information (www.webmap.cn), where the water system data are vector data produced in 2020.
The attribute information (including age, scale, material classification and value) of the ancient site ontology is assigned based on a total of eight lists of NP units published by the State Council, the websites of local cultural relics bureaus and some internet data. The specific data description and source are shown in Table 1.
After acquiring the data, data pre-processing was carried out according to the required indicator values. The data resolution was resampled uniformly to 1km×1km, the projected coordinate system was unified as WGS 1984 World Mercator.
3. Analysis of Indicators and Weight Calculation
3.1. Indicators Analysis
3.1.1. Hazard Indicators
Hazard is the probability of flooding in Henan province and the degree of risks it may cause. In this paper, the average annual rainfall and the average annual rainfall frequency are applied as the Hazard Indicators.
- ■
- Average Annual Rainfall (AAR): AAR refers to the average value of rainfall for many years in a certain area, which is calculated by dividing the accumulated rainfall data for many years in the area by the number of years.
- ■
- Average Annual Rainfall Frequency (AARF): AARF reflect the frequency of rainfall which is more than 50 mm.
The impact of rainfall on the ancient sites includes two aspects. One hand, the rainfall will flush away the surface of ancient sites; on the other hand, the submerging will cause degradation of ancient site materials. The greater the rainfall and the more frequent the rainfall, the more hazardous it is to the ancient sites. Figure 3 (a) and (b) show the spatial distribution of AAR and AARF, separately. The AAR and AARF gradually increase from the northwest to the southeast of Henan Province.
3.1.2. The Sensitivity of Flood-Forming Environment
In the case of the ancient sites flooding, the sensitivity of flood-forming environment refers to the sensitivity of the environment to the formation of floods. In this paper, the following indicators are selected to assess the sensitivity of flood-forming environment to the ancient sites:
- ■
- Height: The height of Henan is mainly concentrated in the west as is shown in Figure 4(a). Height is an important factor in assessing the sensitivity of flood-forming environment of the ancient sites to flooding. Rainfall and floods will gather to low-lying places. The lower the height, the more probability the ancient sites are to flooding, and vice versa.
- ■
- Slope: The slope reflects the degree of steepness of the surface. The steeper the slope, the faster the flow rate. If the slope of an ancient site is too small or lacks drainage facilities, it may lead to ponding and flooding when rainfall is high, thus affecting the safety of the ancient sites. Compared with the eastern region of Henan, the slope in the western region of Henan is steeper as is shown in Figure 4(b).
- ■
- Drainage Density: Areas with a higher DD have a higher likelihood of flooding. When the area receives high rainfall or there is prolonged rainfall, the rivers around the ancient sites rise, increasing the flood-forming of the ancient sites. By analyzing the density of the DD, potential flood accumulation areas and flow paths can be identified to help assess the sensitivity of flood-forming environment to flood events. Rivers in areas with a high DD may interact with each other to form river systems. During high rainfall, the water flow in the river system may increase and be more difficult to control, posing a flood risk to the ancient sites.
- ■
- Vegetation Coverage (VC): VC refers to the proportion of the vertical projection area of vegetation on the surface, which indicates the status of vegetation coverage on the surface. Vegetation can affect the direction and velocity of water flow. It is generally believed that the higher the vegetation coverage, the greater its resistance to flood water and the lower the corresponding sensitivity value.
- ■
- Population Density (PD): PD is the number of people per unit of land area, which indicates the number and concentration of human beings in the current area. The higher the population density, the greater the anthropogenic damage to the environment of the region. The population of Henan is mainly concentrated in the city Zhengzhou and is sparser elsewhere as is shown in Figure 4(e).
- ■
- Gross Domestic Product (GDP): GDP indicates the economic situation, indirectly reflecting the level of post-disaster reconstruction capacity.
3.1.3. Vulnerability of Ancient Sites
In the ancient sites flooding, vulnerability refers to the degree of damage to intrinsic individuals and facilities. In this paper, the age, scale, material, and value of the ancient sites are selected as indicators for evaluating the site's vulnerability as is shown in Table 2.
The older and larger the ancient site is, the greater the loss caused by the floods, which corresponds to higher vulnerability. The value of a site directly affects post-disaster losses, including cultural and economic losses. The greater the value, the greater the loss. Materials directly influence the deterioration degree of the site itself.
In general, the materials of ancient sites include the rammed earth and adobe, soil, wood, stone, brick, concrete and others. However, the spatial scale of the ancient sites is relatively large, and there are multiple cultural relics sites within the site boundaries, which may be ancient buildings, stone monuments or tombs, and many modern buildings (e.g., museums, residential housing) or other features newly constructed within the site. According to the types of material, the ancient sites can be divided into 9 categories: earth and adobe sites, brick and tile sites, ceramic sites, stone sites, civil mixed site, cave sites, earth rock mixed site, wooden and stone ruins and other sites. The different types of the ancient sites contain the multiple types of materials. In this paper, the vulnerability scores for different types of the ancient sites is determined by the experts as is shown in Table 3.
3.2. Weight Calculation based on AHP
The indicators of flood risk assessment for the ancient sites include three first-level indicators and the twelve second-level indicators. To determine the flood risk for the ancient sites in Henan province, the weights of each indicator is calculated based on the AHP method firstly; subsequently, both the three first-level indicators and the flood risk for the ancient sites are captured.
AHP is a decision analysis method that can quantify qualitative problems to a certain extent, and is now widely used in several scientific research fields due to its advantages of clear hierarchy and easy calculation. The AHP method determines the importance of factors by comparing them in pairs, divides the hierarchy according to the standard scale table (commonly used is a nine-point scale), and constructing a judgment matrix that includes all the factors in order to calculate their respective weights. After that, the consistency index (CI) and consistency ratio (CR) are calculated to measure the reliability of the judgment matrix. Generally, when the CI < 0.1, the judgment matrix can be considered to have satisfactory consistency otherwise the matrix needs to be modified. The formulas for the calculation of the CI and CR are as follows:
where, is the maximum eigenvalue of the judgment matrix, is the number of factors, is the random consistency index, the values are shown in Table 4.
The weights of the three first-level indicators and the twelve second-level indicators are calculated using the AHP method. The results of the weight calculation are shown in Table 5.
4. Modeling of Flood Risk Index for the ancient sites in Henan province
Considering the difference of data, the units and magnitudes of each indicators value are different. In order to ensure the comparability and relative relationship of data, it is necessary to normalize the values of each indicator. Commonly normalization methods include min-max, Z-scores, distance to target and ranking. In this study, min-max was used to normalize the indicator data, and all the ranges of indicator values was unified into [0-1]. Since the indicators may have opposite correlations to the upper indicators, in order to facilitate the unified calculation, different formulas need to be used to normalize the positively and negatively correlated indicators, such as formulas (4) and (5).
Positive correlation is:
Negative correlation is:
where, is the normalized indicator value, is the original indicator value, and is the minimum and maximum indicator value . After the normalization of indicator, ,, and is modelled as flows:
- ■
- Hazard Calculation
- ■
- Sensitivity of Flood-Forming Environment Calculation
In the formula, is the score value of six second-level indicators, height, slope, vegetation coverage, drainage density, population density and GDP density, and is the corresponding weights.
- ■
- Vulnerability Calculationwhere, is the score value of the four second-level indicators of age, scale, material and value of the ancient site.
According to the equation (1), the flood risk for the ancient sites can be obtained based on the calculated ,,, and weights in this study.
5. Result and Analysis
5.1. Hazard Level Maps
Figure 5 shows the spatial visualization results of the hazard level maps of the ancient sites. Figure 5(a) represents the hazard of each ancient site in Henan Province, and it can be seen that the spatial distribution of the hazard is increasing from north-west to south-east, which is consistent with the spatial distribution of AAR and AARF. Figure 5(b) shows the hazards of each ancient site in each city in Henan Province. The spatial distribution pattern of urban hazards also shows a trend of low in the north-west and high in the south-east, while in the east-west direction it shows that, the hazards in the western cities are slightly lower than those in the eastern cities, a phenomenon that is closely related to the distribution of AAP and AASF.
5.2. Sensitivity of Flood-Forming Environment Level Maps
Figure 6 shows the sensitivity of flood-forming environment for the ancient sites in Henan Province. As is shown in Figure 6(a), the flood-forming environment sensitivity of ancient sites in Henan Province is slightly higher in the north and center than that in the south, which is more in line with the distribution pattern of vegetation coverage. From the perspective of city level, the closer the ancient sites are to densely populated areas with low vegetation coverage, the higher the sensitivity is. In addition, by comparing the spatial distribution of the six geographic indicators, it is known that the density of the river network is also higher in the areas where the ancient sites with higher sensitivity are located.
Figure 6(b) shows the mean sensitivity values of the ancient sites in the cities of Henan Province, where the northern and eastern cities such as JiaoZuo, XinXiang, HeBi, Anyang and ShangQiu have the strongest value, followed by cities located in the central of the Henan Province, while the cities in the west have the weakest sensitivity. Although there is no clear trend in the distribution of the sensitivity assessment results in terms of direction, a comparison with the indicators reveals that the correlation between sensitivity and river network density as well as vegetation coverage is the strongest.
5.3. Vulnerability Level Maps
Our proposed method applies the multiple types of materials to calculate the vulnerability of each ancient site according to the type of ancient sites. The captured Vulnerability Level Maps of the ancient sites in Henan province is shown in Figure 7. Figure 7(a) shows the vulnerability of each ancient site and Figure 7(b) shows the vulnerability of each city, respectively. Obviously, the vulnerability of the ancient sites within Jiyuan, Anyang, and Xiuyang is higher than that in the other cities.
Figure 8(a) shows the vulnerability of each ancient site and Figure 8(b) shows the vulnerability of each city based on the single type of materials, respectively.
Compared with the vulnerability calculation method based on the single type of material, the proposed vulnerability calculation method shows more advantages. Here, we take the Yin Ruins as an example to illustrate the advantages. Based on the single type of materials and multiple types of materials, the calculated vulnerability values are 0.78 and 0.956, respectively. The reason is that the latter method usually regards ancient sites as single Rammed earth and adobe sites, ignoring other materials such as stone and concrete that constitute the site, which leads to a higher score. It can be seen that it is precisely because the introduction of mixed materials refines the intrinsic characteristics of ancient sites, making the vulnerability assessment score of ancient sites more realistic.
As is shown in Table 6, the difference in vulnerability score between Zhenghan ancient site and Huayang ancient site is only 0.002 when the vulnerability assessment is conducted using a single material, but it is 0.023 when the assessment is conducted using a mixture of materials. This shows that there is a clear distinction in vulnerability scores between the two sites due to differences in the main body materials.
5.4. Flood Risk Level Maps for The Ancient Sites in Henan Province
Figure 9(a) and (b) show the flood risk level maps for the ancient sites in Henan province. The flood risk assessment results show that the ancient site within Xiuyang have higher flood risk. Figure 10 show the flood risk level maps for the ancient sites in Henan province based on the single type of materials. To verify the reliability of the multiple types of materials calculation method in this paper, the real post-flood in the "Investigation and Assessment Report on the Damage of Immovable Cultural Relics in Henan Heavy Rain Disaster" completed by the Chinese Academy of Cultural Heritage in October 2021 is applied.
The calculation results show that under the same assumption of Hazard, as shown in Table 7, the risk value of Huayang ancient site ( 0.281 ) calculated by using multiple types of materials is greater than that of Zhenghan ancient site ( 0.279 ), which is in line with the real situation that the disaster grades of Huayang Ancient site and Zhenghan Ancient site in the ' assessment report ' are very serious and relatively serious respectively, which proves the scientific nature of the calculation method of multiple types of materials.
In the same case, the results calculated by using a single material, that the risk value of the Huayang ancient site is 0.360 and the Zhenghan ancient site is 0.371, are inconsistent with the true value data, which further indicates that the mixed material can refine the material of the site to obtain more accurate assessment results than a single type of material.
6. Conclusions
In this paper, a risk assessment framework considering multiple types of materials is proposed for the flood risk assessment of ancient sites in China, and an experiment is carried out in Henan Province, China. The following conclusions are drawn:
(1) A flood risk assessment framework is proposed in this paper. The flood risk assessment indicators include three first-level indicators and the twelve second-level indicators. Based on our proposed method, the flood risk for the ancient sites in Henan province are calculated.
(2) The multiple types of materials are considered to calculate the vulnerability of the ancient sites within our flood risk assessment framework. The experimental results demonstrate the captured vulnerability of the ancient sites is more reliable.
(3) Through experimental verification, the results of risk assessment grades obtained based on the proposed method are consistent with the actual rainstorm and flood disaster grades of ancient sites in Henan Province. For example, the disaster grade of the ancient site of Huayang is higher than that of the ancient site of Zhenghan in the actual investigation. And the risk value of the ancient site of Huayang obtained based on the proposed is 0.281 higher than that of the ancient site of Zhenghan 0.279, which indicates the reliability of the proposed method.
Author Contributions
Conceptualization, Ximin CUI and Caihuan WEN; methodology, Ximin CUI; software, Ximin CUI; validation, Ximin CUI, Caihuan WEN; formal analysis, Ximin CUI; investigation, Ximin CUI; resources, Ximin CUI; data curation, Ximin CUI; writing—original draft preparation, Caihuan WEN; writing—review & editing, Caihuan WEN; visualization, Caihuan WEN; supervision, Ximin CUI; project administration, Ximin CUI; funding acquisition, Caihuan WEN. All authors have read and agreed to the published version of the manuscript.” Please turn to the CRediT taxonomy for the term explanation. Authorship must be limited to those who have contributed substantially to the work reported.
Funding
S&T Program of Hebei (20375901D) and S&T Program of Hebei Geological and Mineral Exploration and Development Bureau(13000024P0069B410311A).
Data Availability Statement
We encourage all authors of articles published in MDPI journals to share their research data. In this section, please provide details regarding where data supporting reported results can be found, including links to publicly archived datasets analyzed or generated during the study. Where no new data were created, or where data is unavailable due to privacy or ethical restrictions, a statement is still required. Suggested Data Availability Statements are available in section “MDPI Research Data Policies” at https://www.mdpi.com/ethics.
Conflicts of Interest
The authors declare no conflict of interest.
References
- http://gl.ncha.gov.cn/#/public-service.
- Qiao, Y.F. Study on natural disaster risk management of immovable cultural relics. China Cultural Heritage 2021, 4, 12–18. [Google Scholar]
- Natural disaster risk management and prevention of immovable cultural relics based on historical natural disaster research. China Cultural Heritage 2021, 4, 4–11.
- Romãoa, X.; Paupério, E.; Pereira, N. A framework for the simplified risk analysis of cultural heritage assets. Journal of Cultural Heritage 2016, 20, 696–708. [Google Scholar] [CrossRef]
- Yu, I.; Jung, H. Flood Risk Assessment to Enable Improved Decision-Making for Climate Change Adaptation Strategies by Central and Local Governments. Sustainability 2022, 14, 14335. [Google Scholar] [CrossRef]
- https://www.undrr.org/.
- Huang, C.F.; Liu, X.L.; Zhou, G.X.; Li, X.J. Agricultural natural disater risk assessment method according to the historic disaster data. Journal of natural disasters 1998, 2, 4–12. [Google Scholar]
- Yang, Q.; Ma, Z.; Zhang, S. Urban Pluvial Flood Modeling by Coupling Raster-Based Two-Dimensional Hydrodynamic Model and SWMM. Water 2022, 14, 11. [Google Scholar] [CrossRef]
- Wu, H.C.; Huang, G.R. Risk assessment of urban waterlogging based on PCSWMM model. Water Resources Protection 2016, 32, 11–16. [Google Scholar]
- Zhang, K.; Shalehy, M.H.; Ezaz, G.T.; Chakraborty, A.; Mohib, K.M.; Liu, L.X. An integrated flood risk assessment approach based on coupled hydrological-hydraulic modeling and bottom-up hazard vulnerability analysis. Environmental Modelling and Software 2022, 148, 105279. [Google Scholar] [CrossRef]
- Zhao, Z.N.; Wang, L.R.; Wang, C.M.; Han, X.Q. Risk Distribution Characteristics of Rainstorms and Flood Disaster Based on Flood Area Model in the Xiaoma River Basin of Xingtai. Journal of Arid Meteorology 2021, 39, 486–493. [Google Scholar]
- Zhao, H.Q.; Zhou, L.; Zhao, R.H.; Li, Z.H.; Qi, Z. Flood Process Modeling in the Plain Basin Based on MIKE Coupling Model. China Rural Water and Hydropower 2022, 7, 97–102. [Google Scholar]
- Haruyama, S.; Ohokura, H.; Simking, T.; Ramphin. Geomorphological zoning for flood inundation using satellite data. GeoJournal 1996, 38, 3. [Google Scholar] [CrossRef]
- Tanavud, C.; Yongchalermchai, C.; Bennui, A.; Densreeserekul, O. Assessment of flood risk in hat yai municipality, southern thailand, using gis. Journal of Natural Disaster Science 2004, 6, 1–14. [Google Scholar] [CrossRef]
- Chubey, M.S.; Hathout, S. Integration of radarsat and gis modelling for estimating future red river flood risk. Geojournal 2004, 59, 237–246. [Google Scholar] [CrossRef]
- Sanyal, J.; Lu, X.X. Remote sensing and gis-based flood vulnerability assessment of human settlements: a case study of gangetic west bengal, india. Hydrological Processes 2005, 19, 3699–3716. [Google Scholar] [CrossRef]
- Zhou, N.; Sheng, S.; He, L.-Y.; Tian, B.-R.; Chen, H.; Xu, C.-Y. An Integrated Approach for Analyzing the Morphological Evolution of the Lower Reaches of the Minjiang River Based on Long-Term Remote Sensing Data. Remote Sens. 2023, 15, 3093. [Google Scholar] [CrossRef]
- Liang, L.; Gong, A.D.; Sun, Y.Z.; Chen, Y.H. Seasonal Rainstorm and Flood Risk Assessment Method for Immovable Cultural Relics. Geomatics and Information Science of Wuhan University 2023, 48, 1978–1989. [Google Scholar]
- Liu, G.X.; Zhang, Y.C.; Zhang, J.Q.; Lang, Q.L.; Chen, Y.N.; Wan, Z.Y.; Liu, H.N. Geographic-Information-System-Based Risk Assessment of Flooding in Changchun Urban Rail Transit System. Remote Sensing 2023, 15, 3533. [Google Scholar] [CrossRef]
- Chan, X.Y.; Dong, Y.Q.; Li, Y.H. Our puzho Waterlogging assessment of Chinese ancient city sites considering microtopography: A case study of PuZhou ancient city site, China. Remote Sensing 2022, 14, 4417. [Google Scholar]
- Ravan, M.; Revez, M. J.; Pinto, I.V.; Brum, P.; Birkmann, J. A Vulnerability Assessment Framework for Cultural Heritage Sites: The Case of the Roman Ruins of Tróia. International Journal of Disaster Risk Science 2023, 14, 26–40. [Google Scholar] [CrossRef]
- Garrote, J.; Andrés, D.H.; Escudero, C.; Inés, G. A framework proposal for regional-scale flood-risk assessment of cultural heritage sites and application to the castile and león region (central spain). Water 2020, 12, 329. [Google Scholar] [CrossRef]
- Sevieri, G.; Galasso, C.; D'Ayala, D.; De Jesus, R.; Oreta, A.; Grio, M.E.D.A.; Ibabao, R. A multi-hazard risk prioritization framework for cultural heritage assets. Natural Hazards and Earth System Sciences 2020, 17, 1–33. [Google Scholar]
- Wang, Y.; Liang, L.; Sun, Y.Z.; Gong, A.D.; Liu, Y.H.; Chen, Y.H. Research on flood disaster risk of immovable cultural relics in Shanxi Province. Journal of Natural Disasters 2022, 31, 35–47. [Google Scholar]
- Trizio, F.; Garzón-Roca, J.; Eguibar, M.Á.; Bracchi, P.; Torrijo, F.J. Above the Ravines: flood vulnerability assessment of Earthen Architectural Heritage in Quito (Ecuador). Applied Sciences 2022, 12, 11932. [Google Scholar] [CrossRef]
- Trizio, F.; Javier Torrijo Echarri, F.; Mileto, C.; Vegas, F. Flood. Risk Assessment of Traditional Adobe Buildings: Analysis of Case Studies in the River Ebro Basin, Spain. In: Endo, Y., Hanazato, T. (eds) Structural Analysis of Historical Constructions. SAHC 2023. RILEM Bookseries, Springer, Cham 2024,46.
- Mileto, C.; Vegas, F.; García, L.; Pérez, A. Assessment of vulnerability of earthen vernacular architecture in the Iberian Peninsula to natural risks. Generation of an analysis tool. Int. J. Archit. Herit 2021, 16, 1–14. [Google Scholar]
- Zhang, J.Q.; Liang, J.D.; Liu, X.P; Tong, Z.J. GlS-Based Risk Assessment of Ecological Disasters in Jilin Province, Northeast China. Hum. Ecol. Risk Assess. 2009, 15, 727–745. [Google Scholar] [CrossRef]
Figure 1.
Flood risk assessment framework for the ancient site.
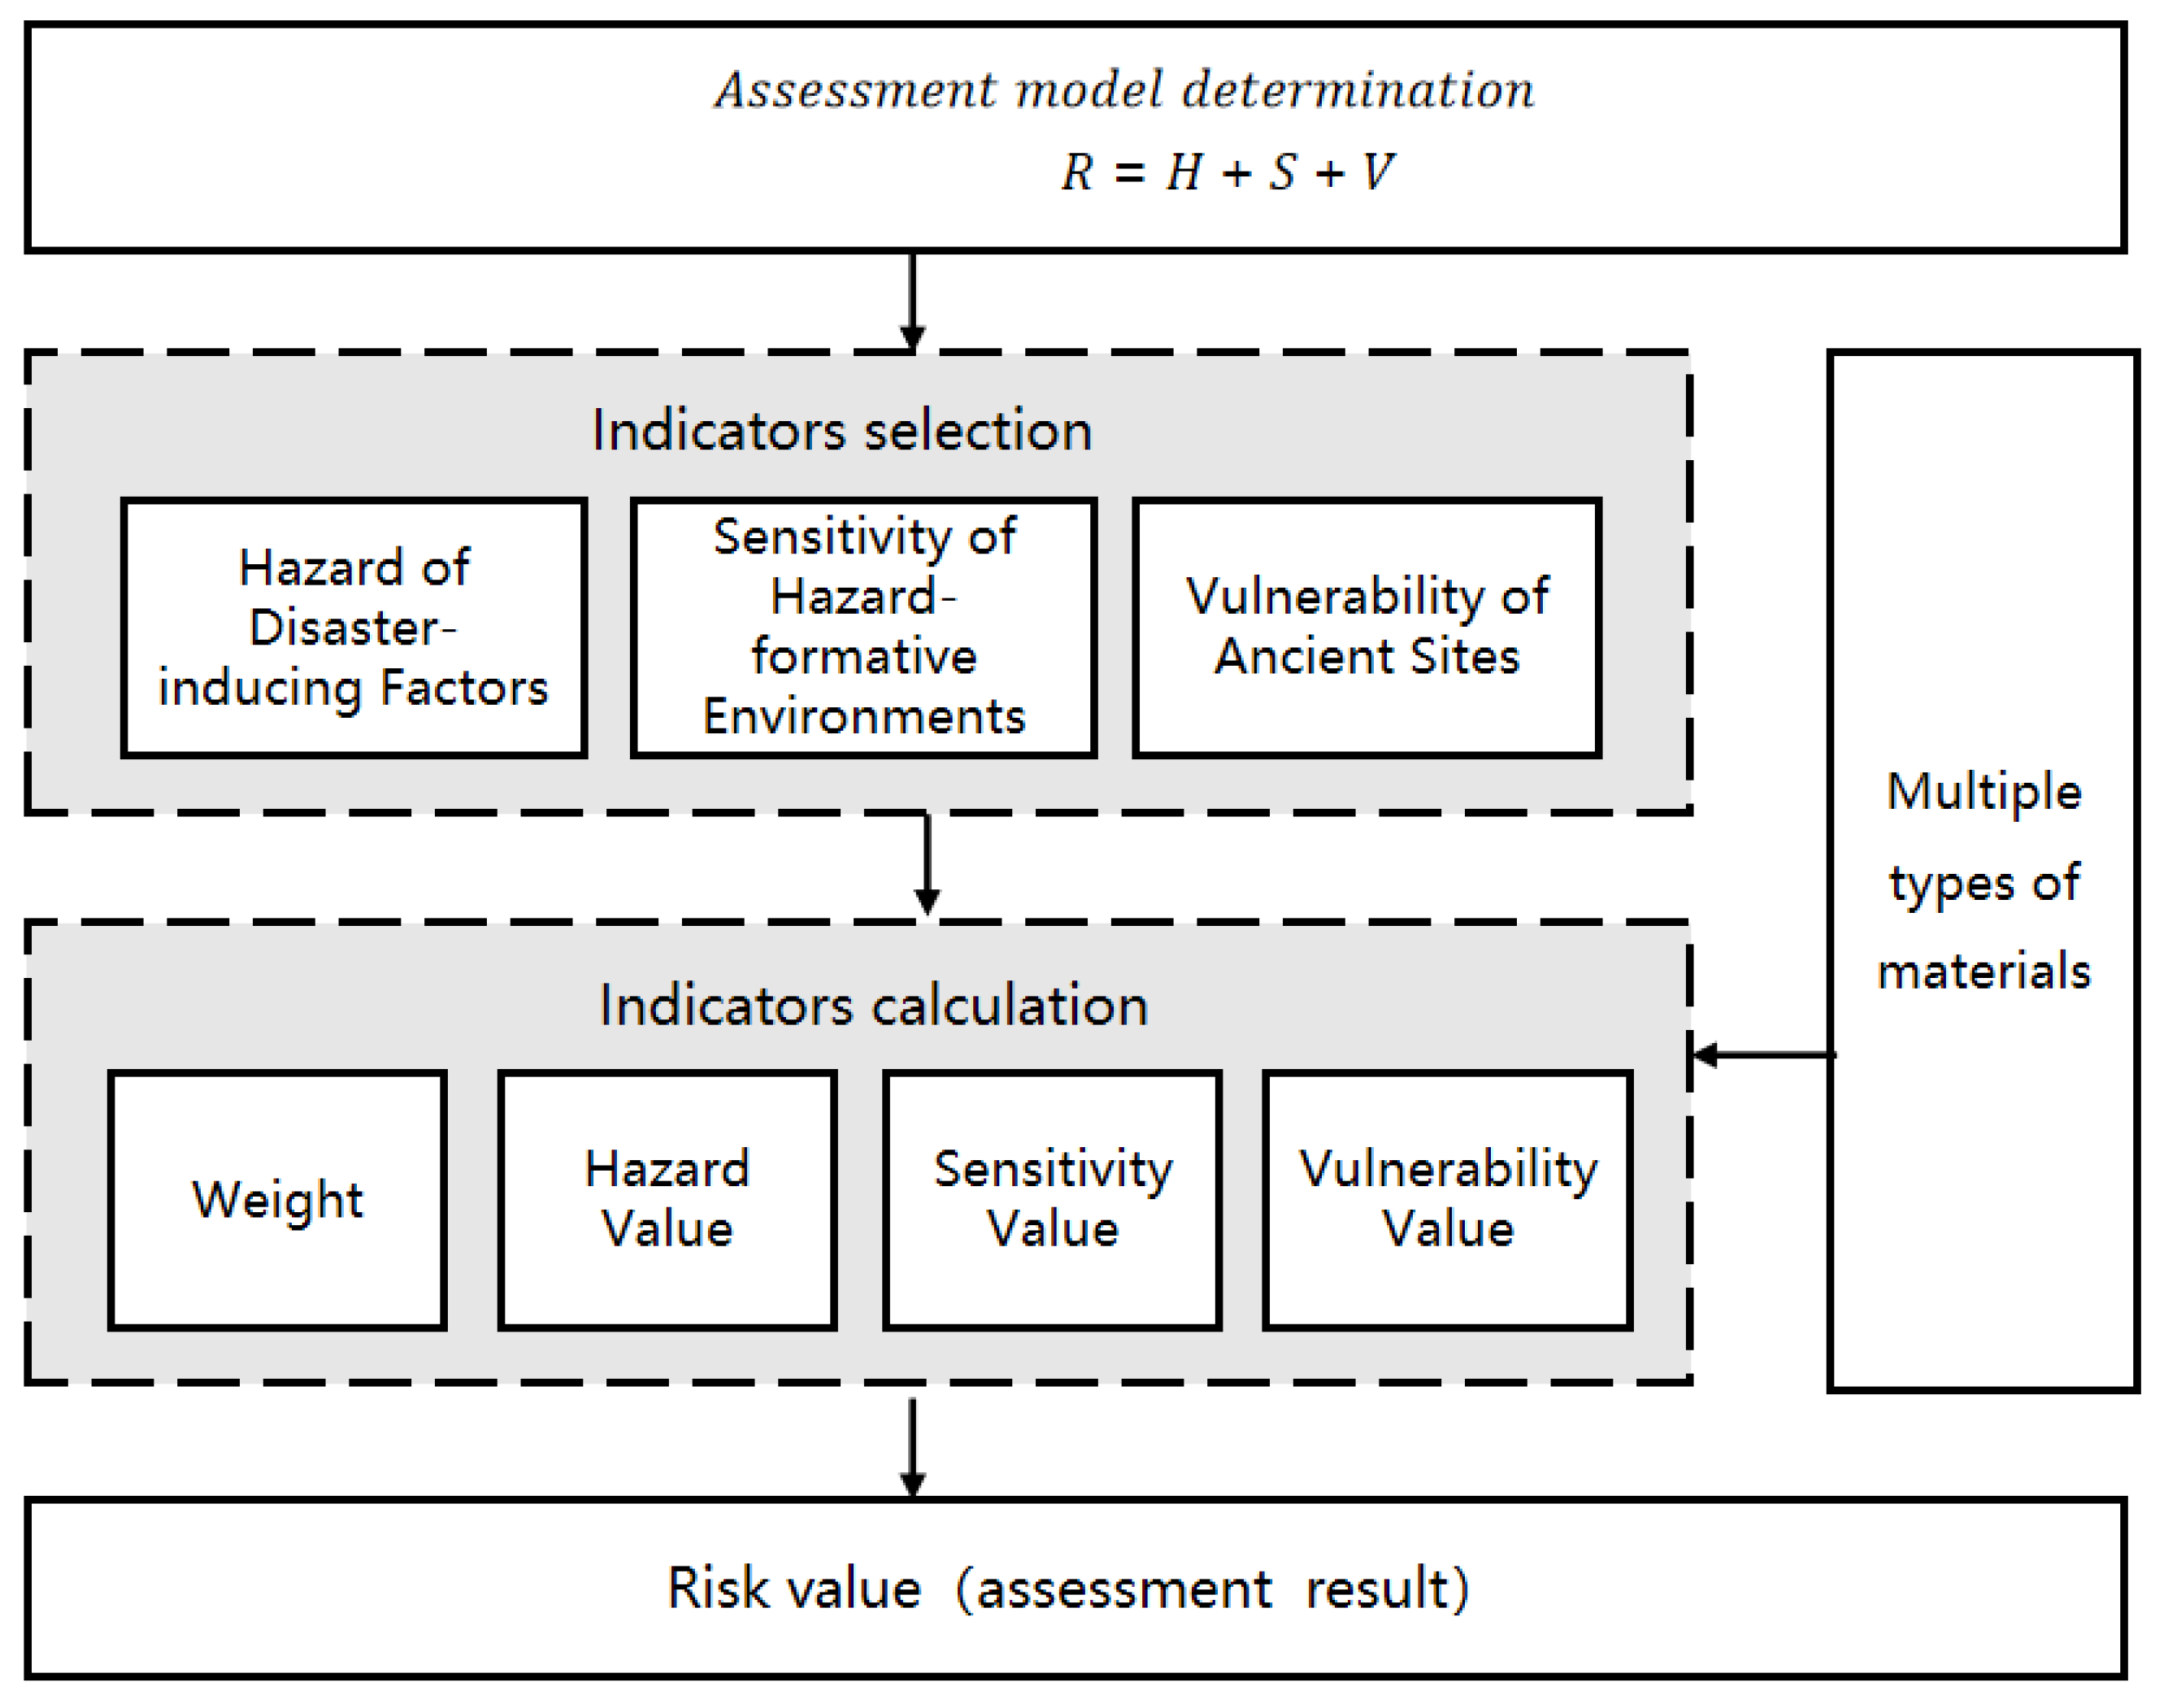
Figure 2.
Study Area and the distribution of the ancient sites in Henan province.
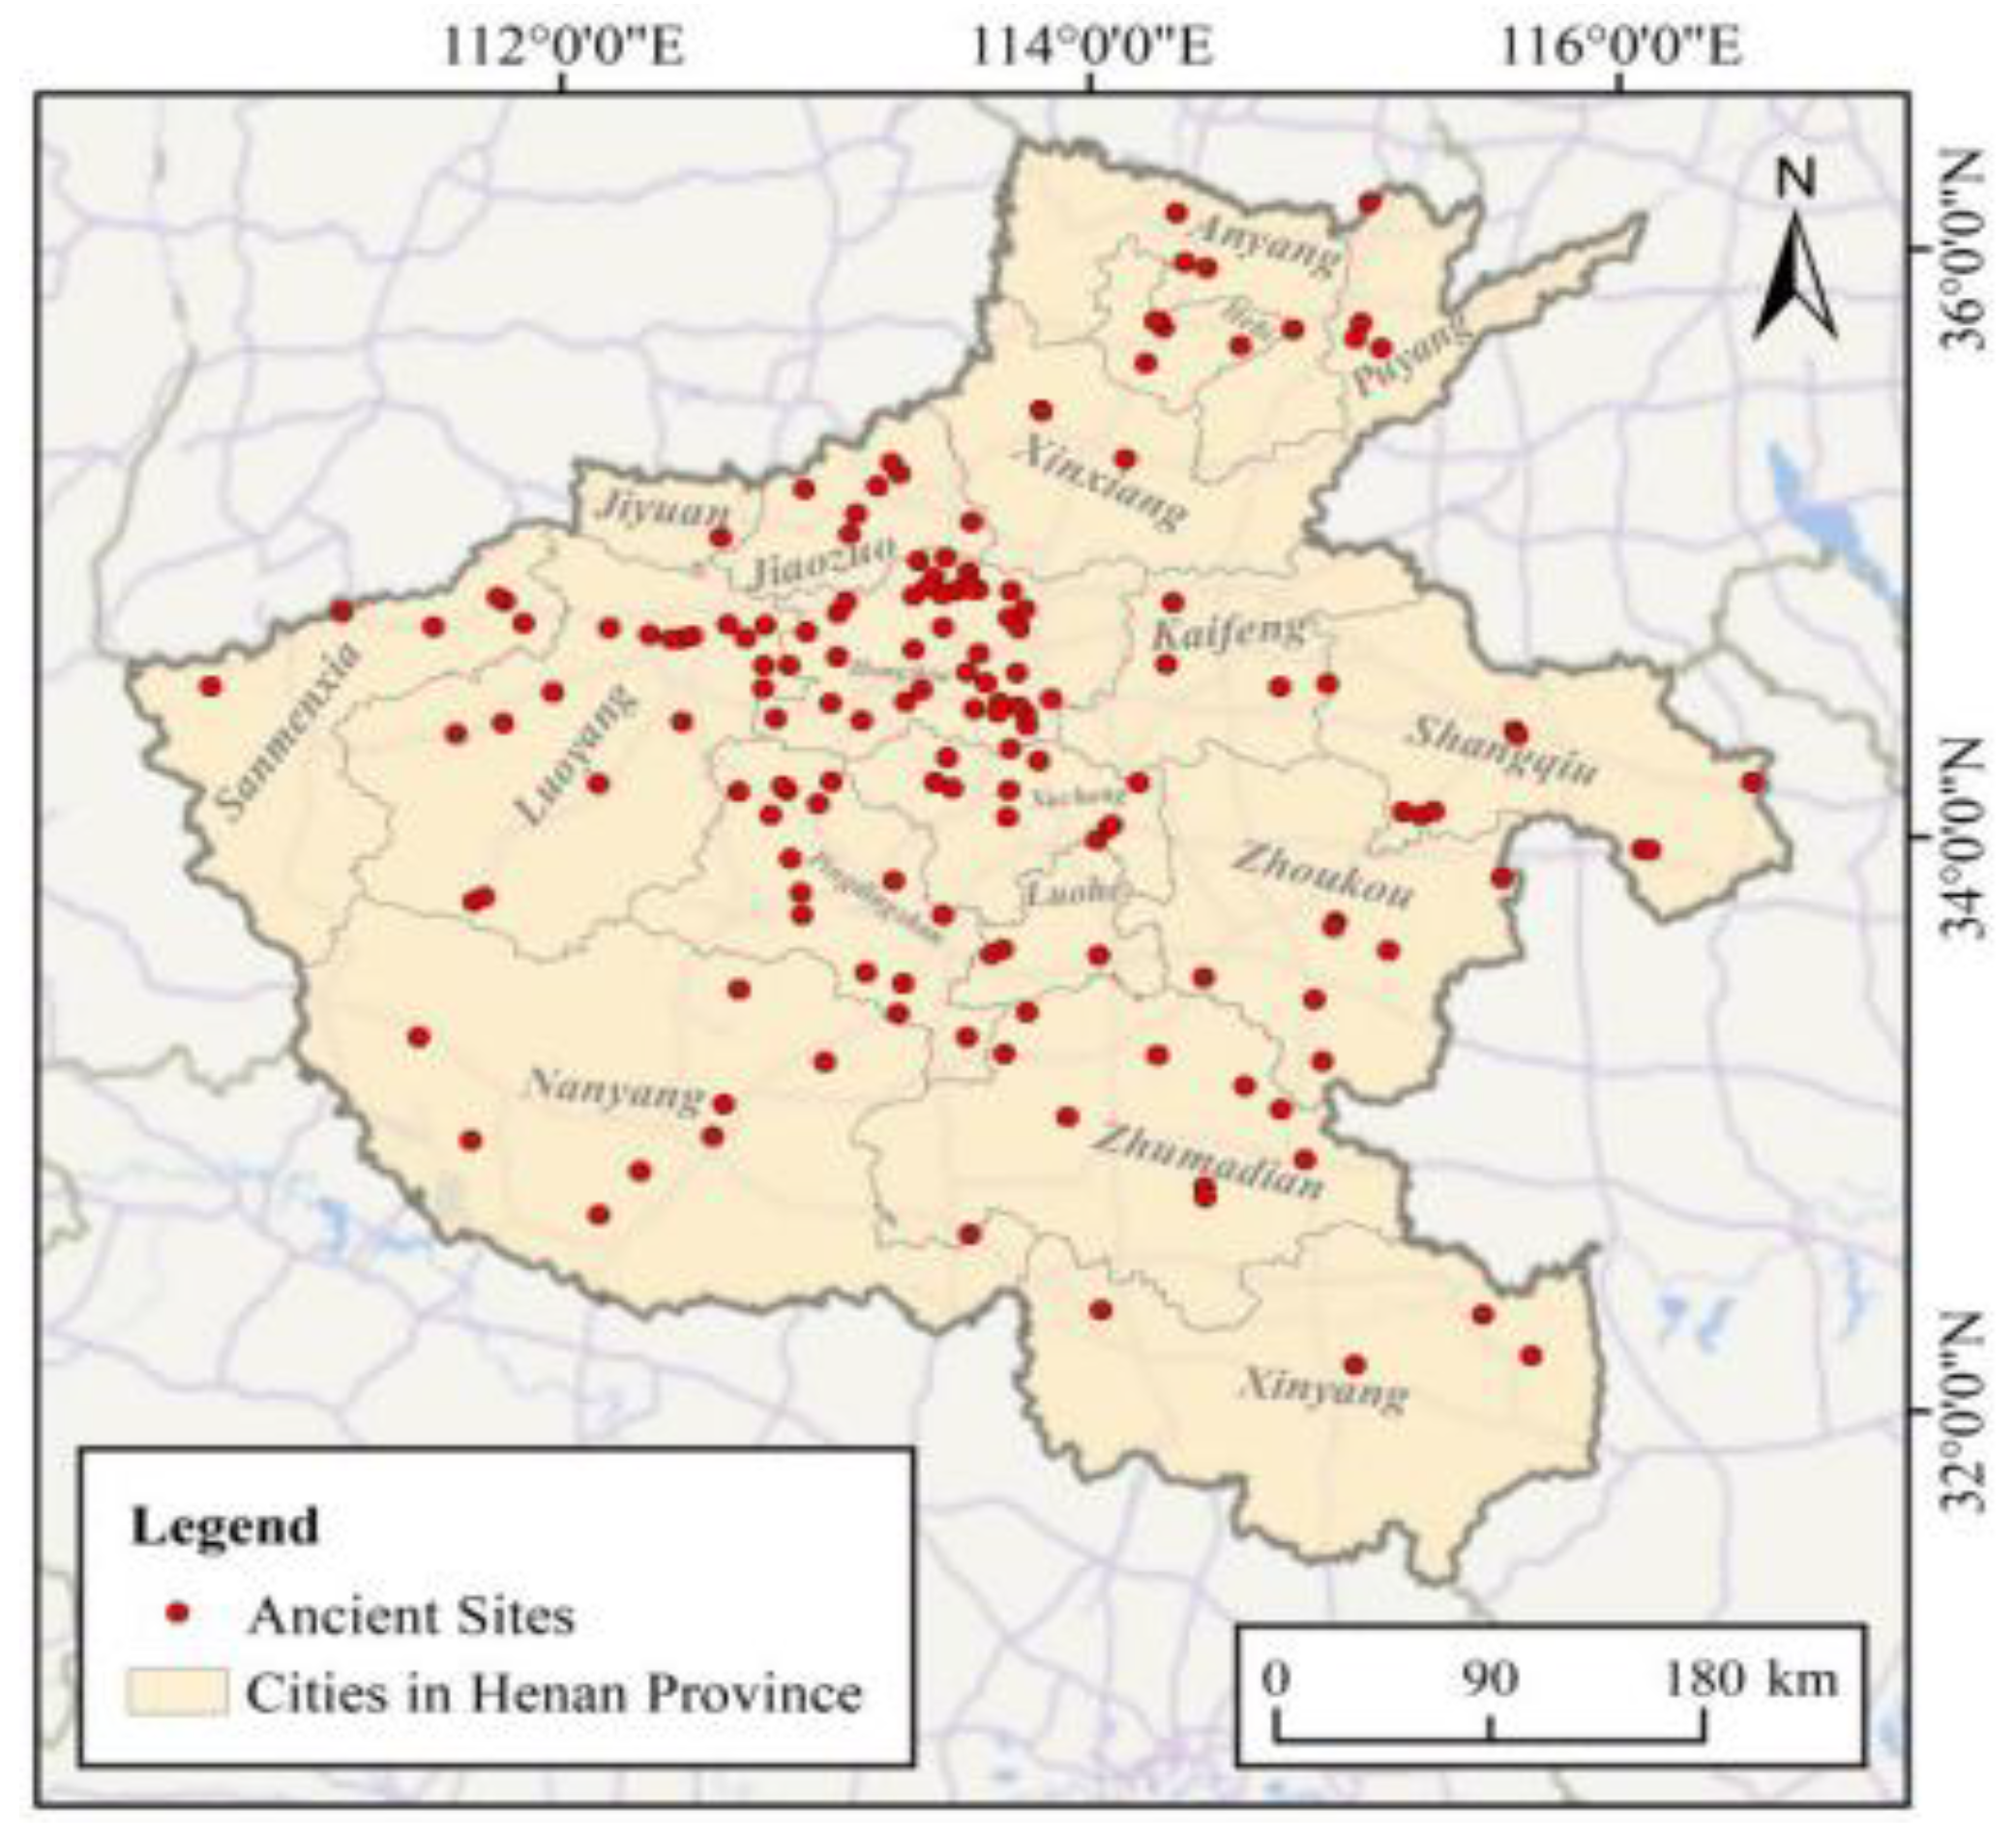
Figure 3.
(a) The average annual rainfall; (b) The average annual storm rainfall frequency.
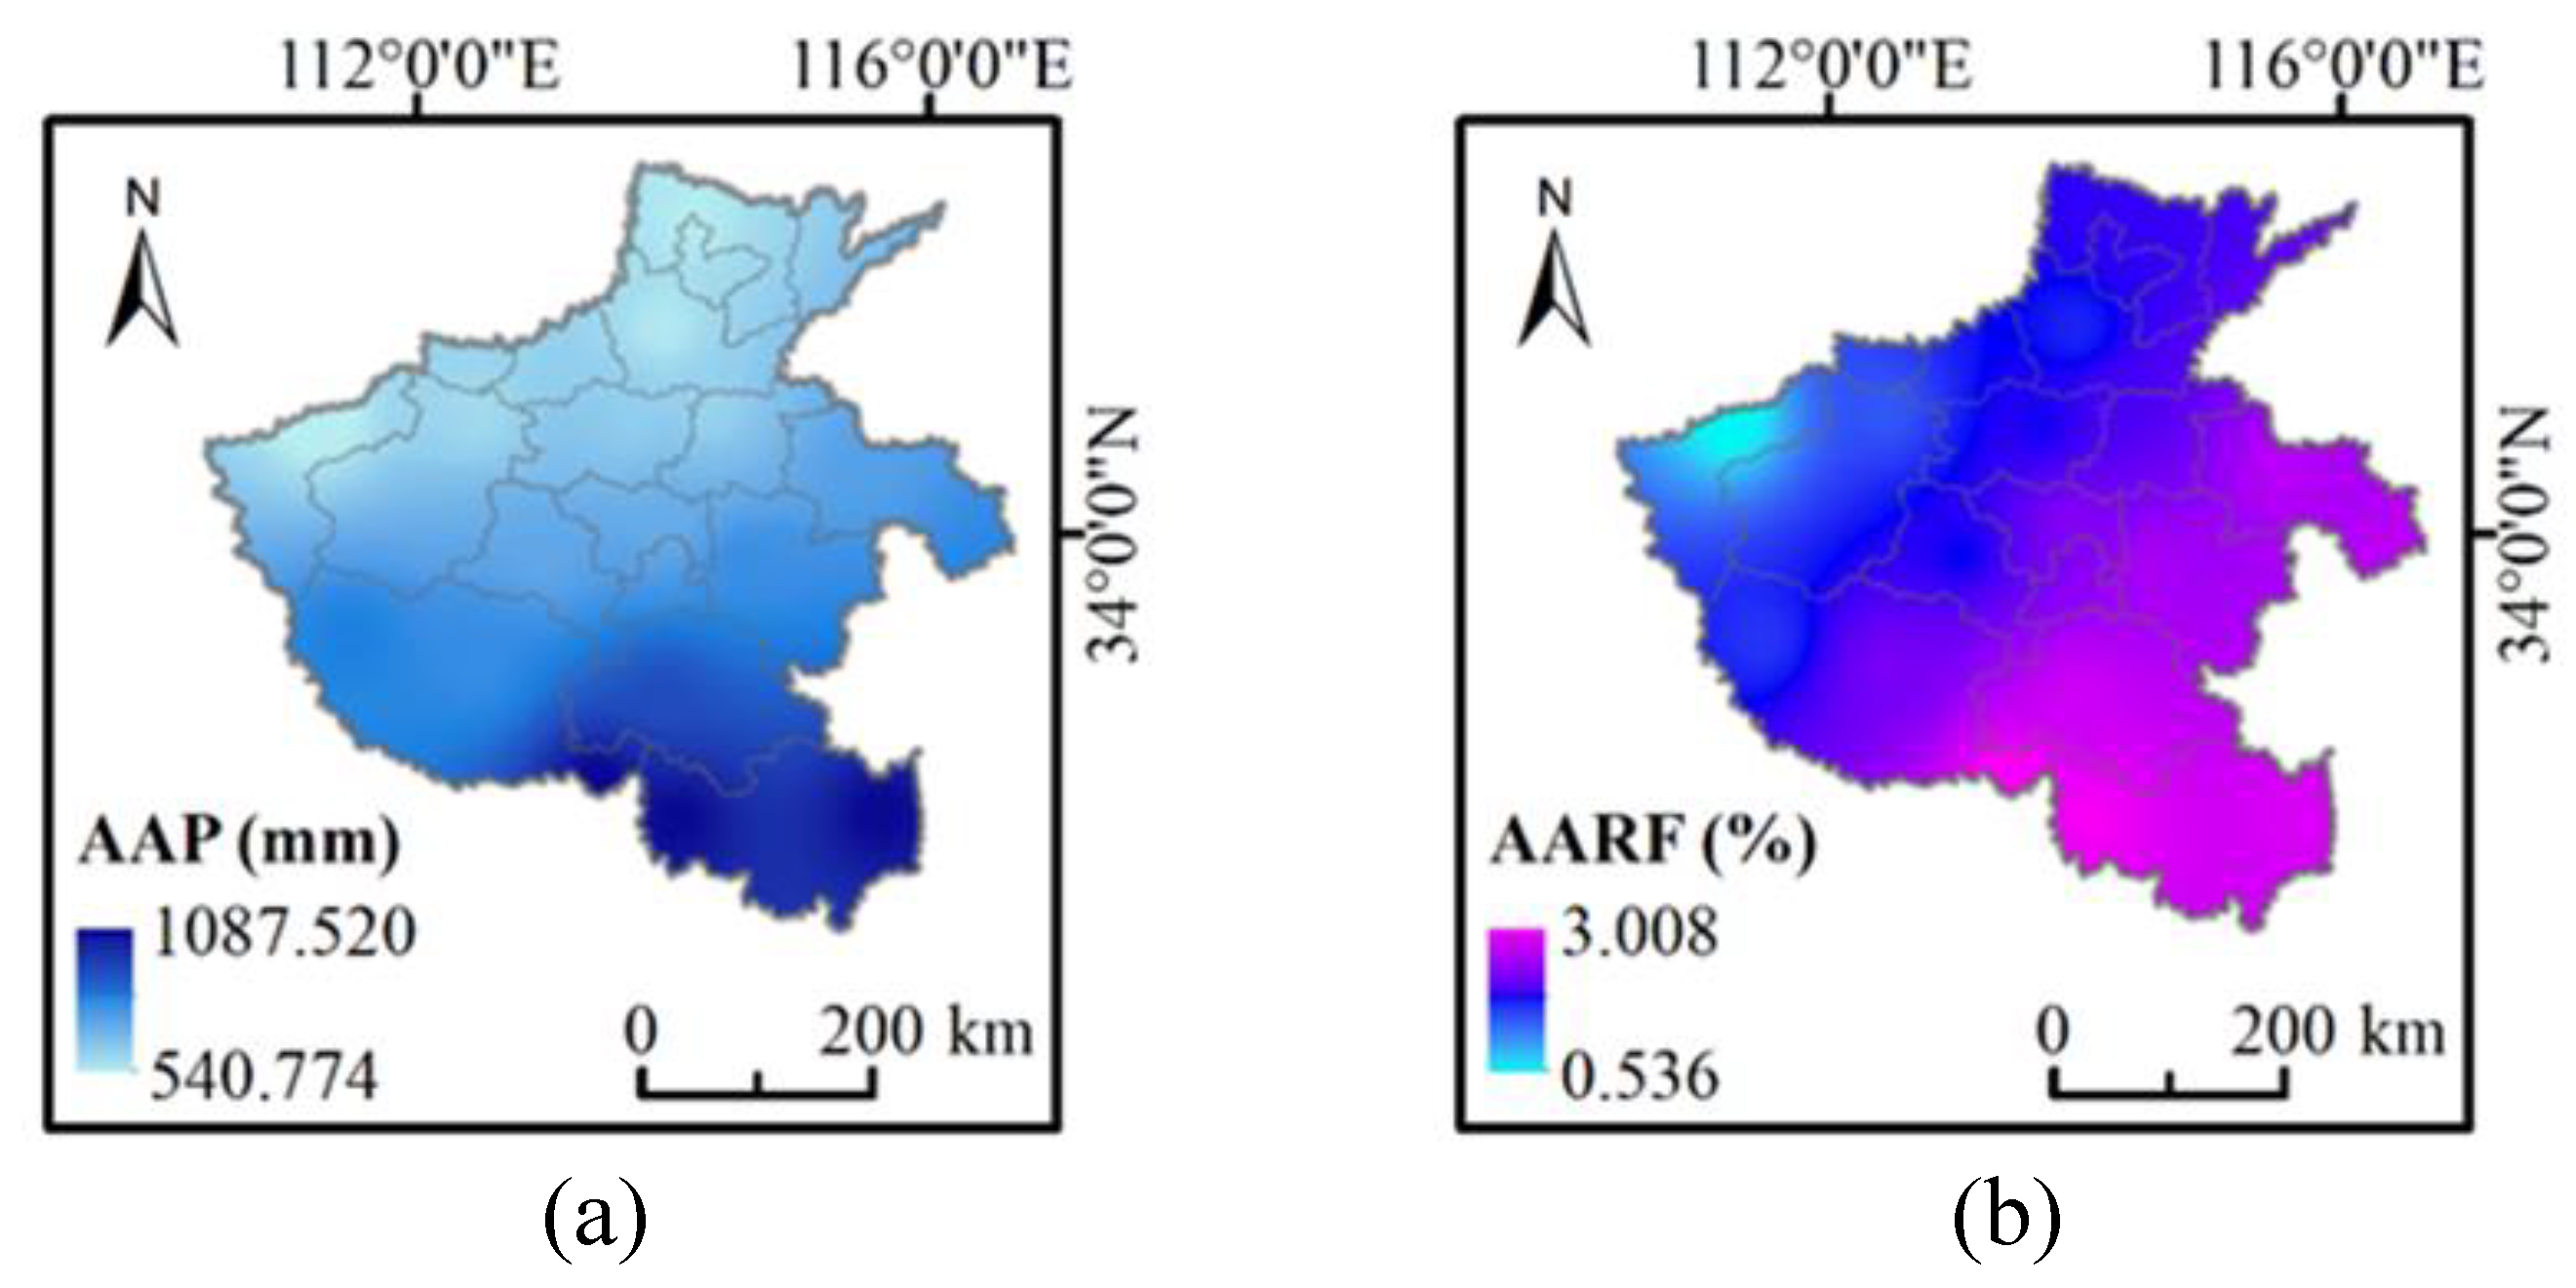
Figure 4.
The indicators relating the sensitivity of flood-forming environment: (a) height; (b) slope; (c) drainage density (DD); (d) vegetation coverage (VC); (e) population density (PD); (f) Gross Domestic Product (GDP).
Figure 4.
The indicators relating the sensitivity of flood-forming environment: (a) height; (b) slope; (c) drainage density (DD); (d) vegetation coverage (VC); (e) population density (PD); (f) Gross Domestic Product (GDP).
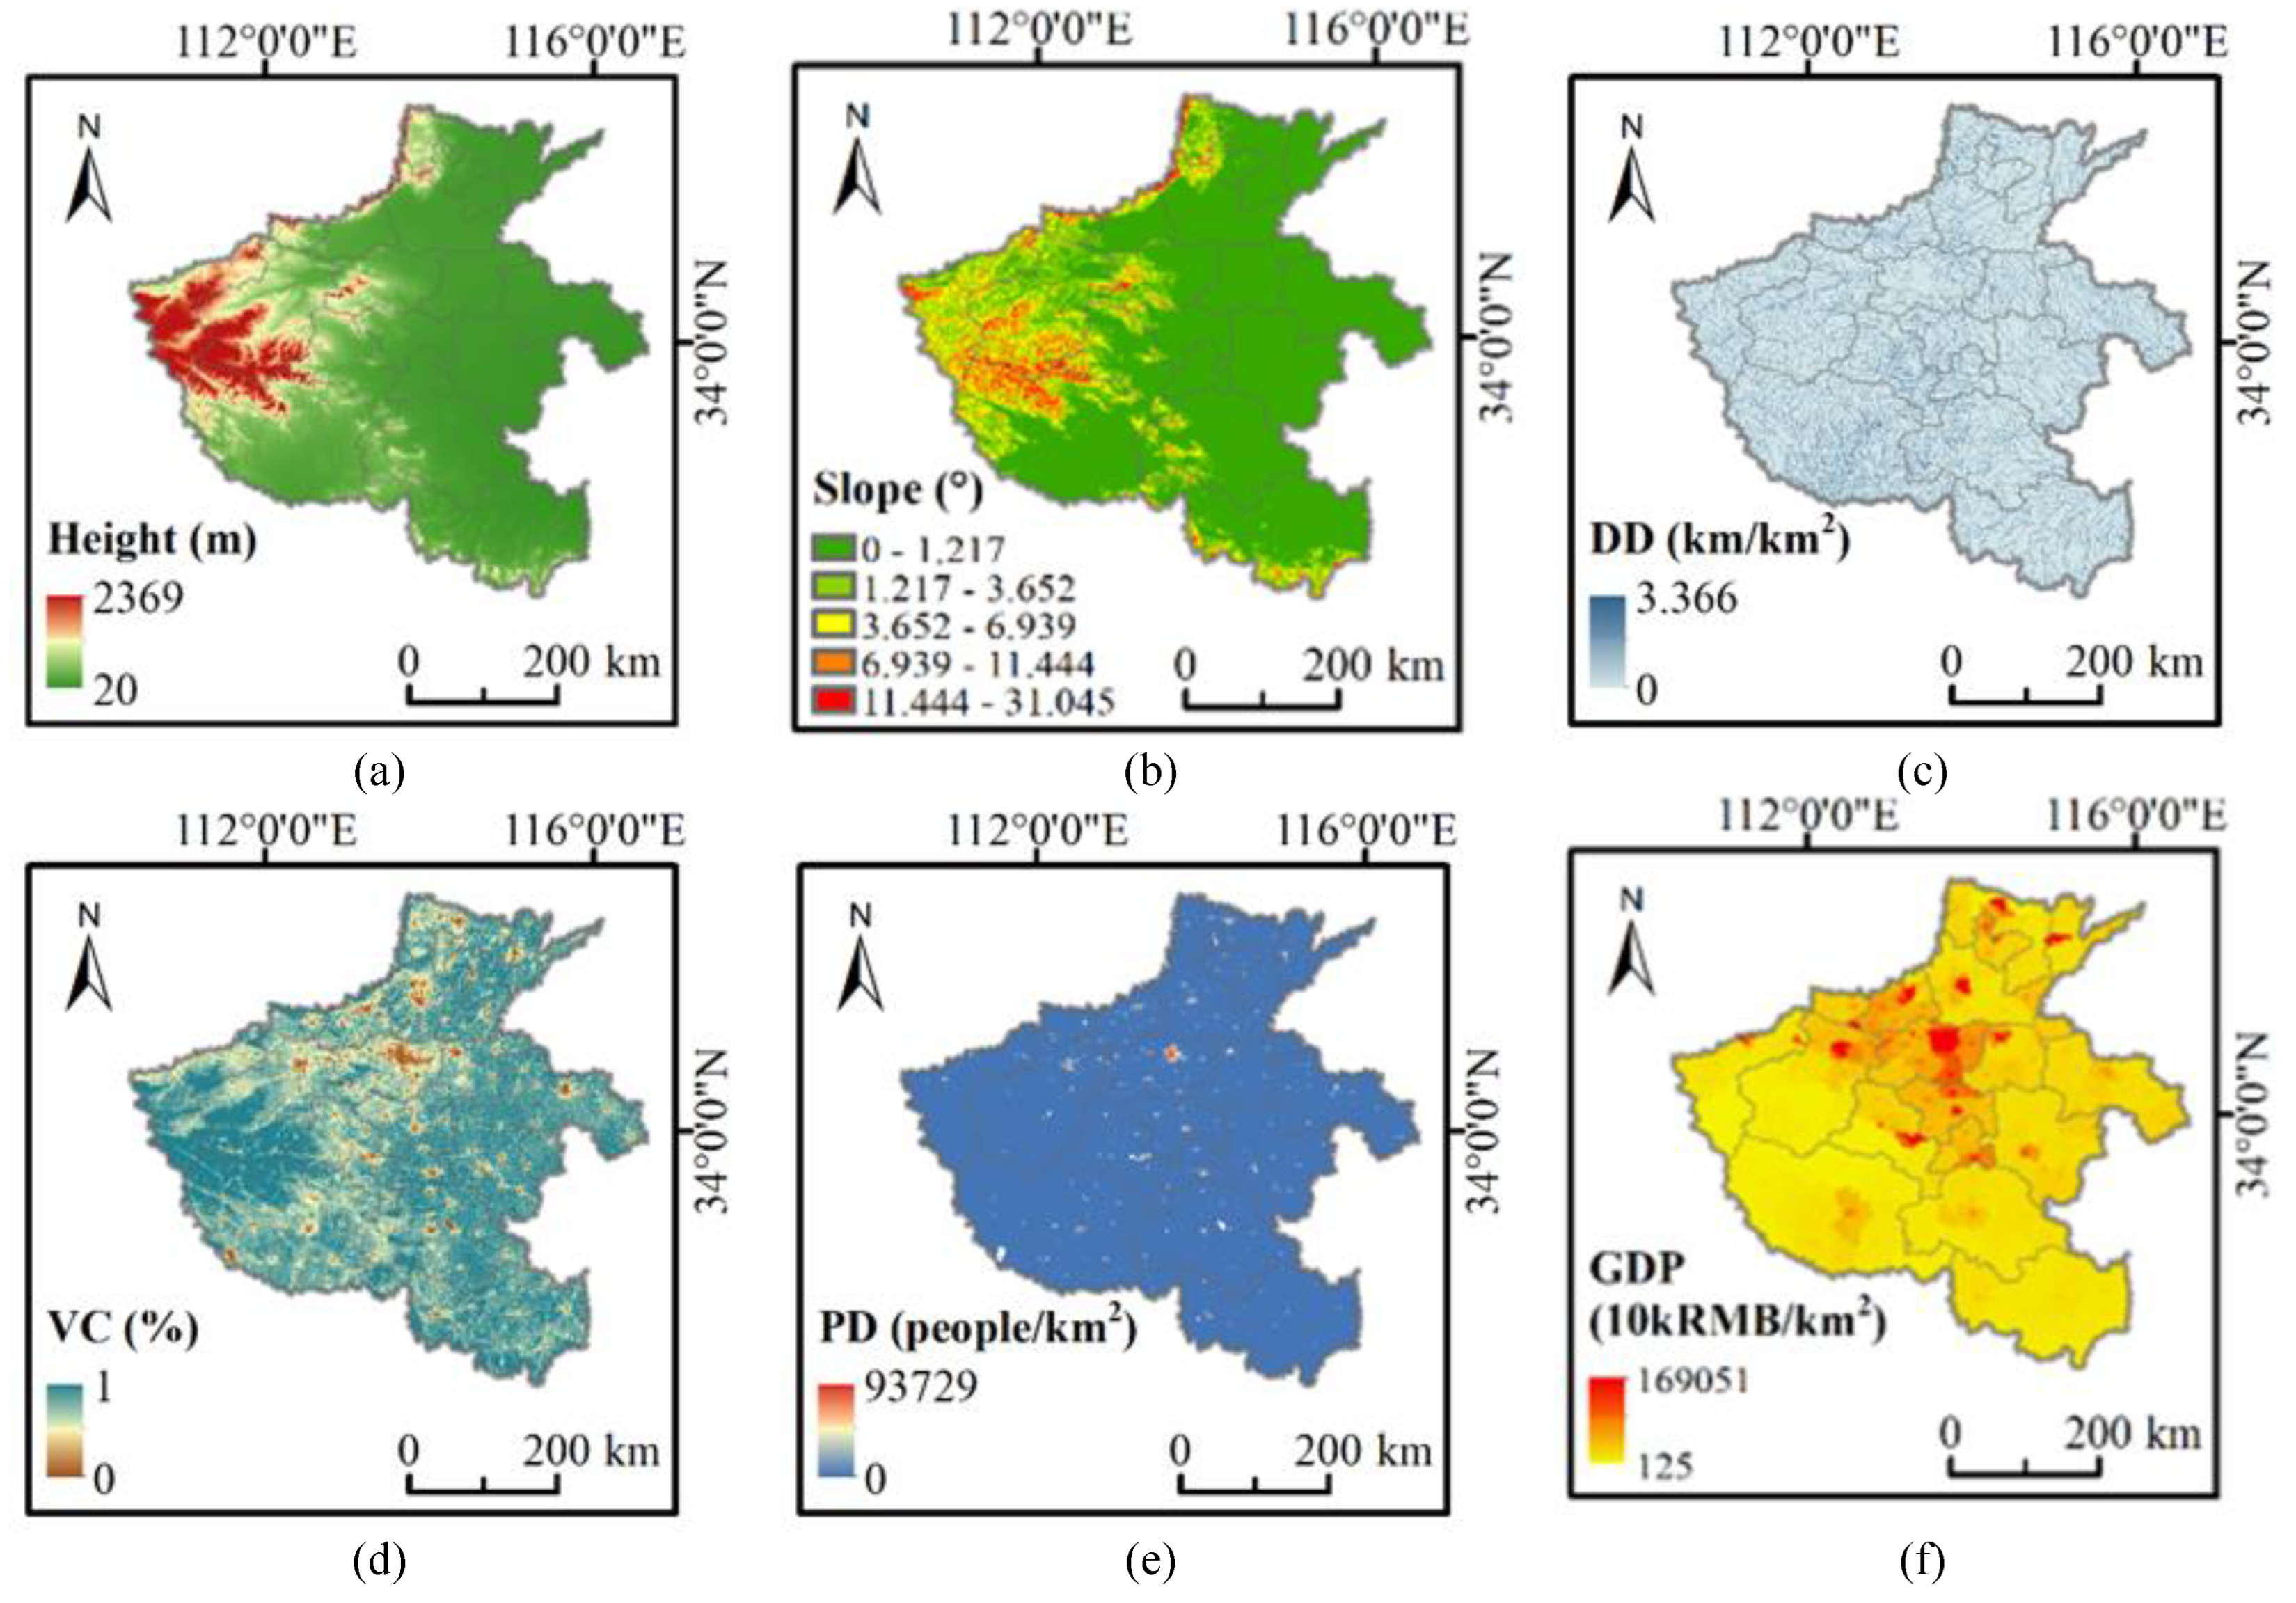
Figure 5.
Hazard level maps: (a) the hazard of each ancient site; (b) the hazard of each city in Henan Province.
Figure 5.
Hazard level maps: (a) the hazard of each ancient site; (b) the hazard of each city in Henan Province.
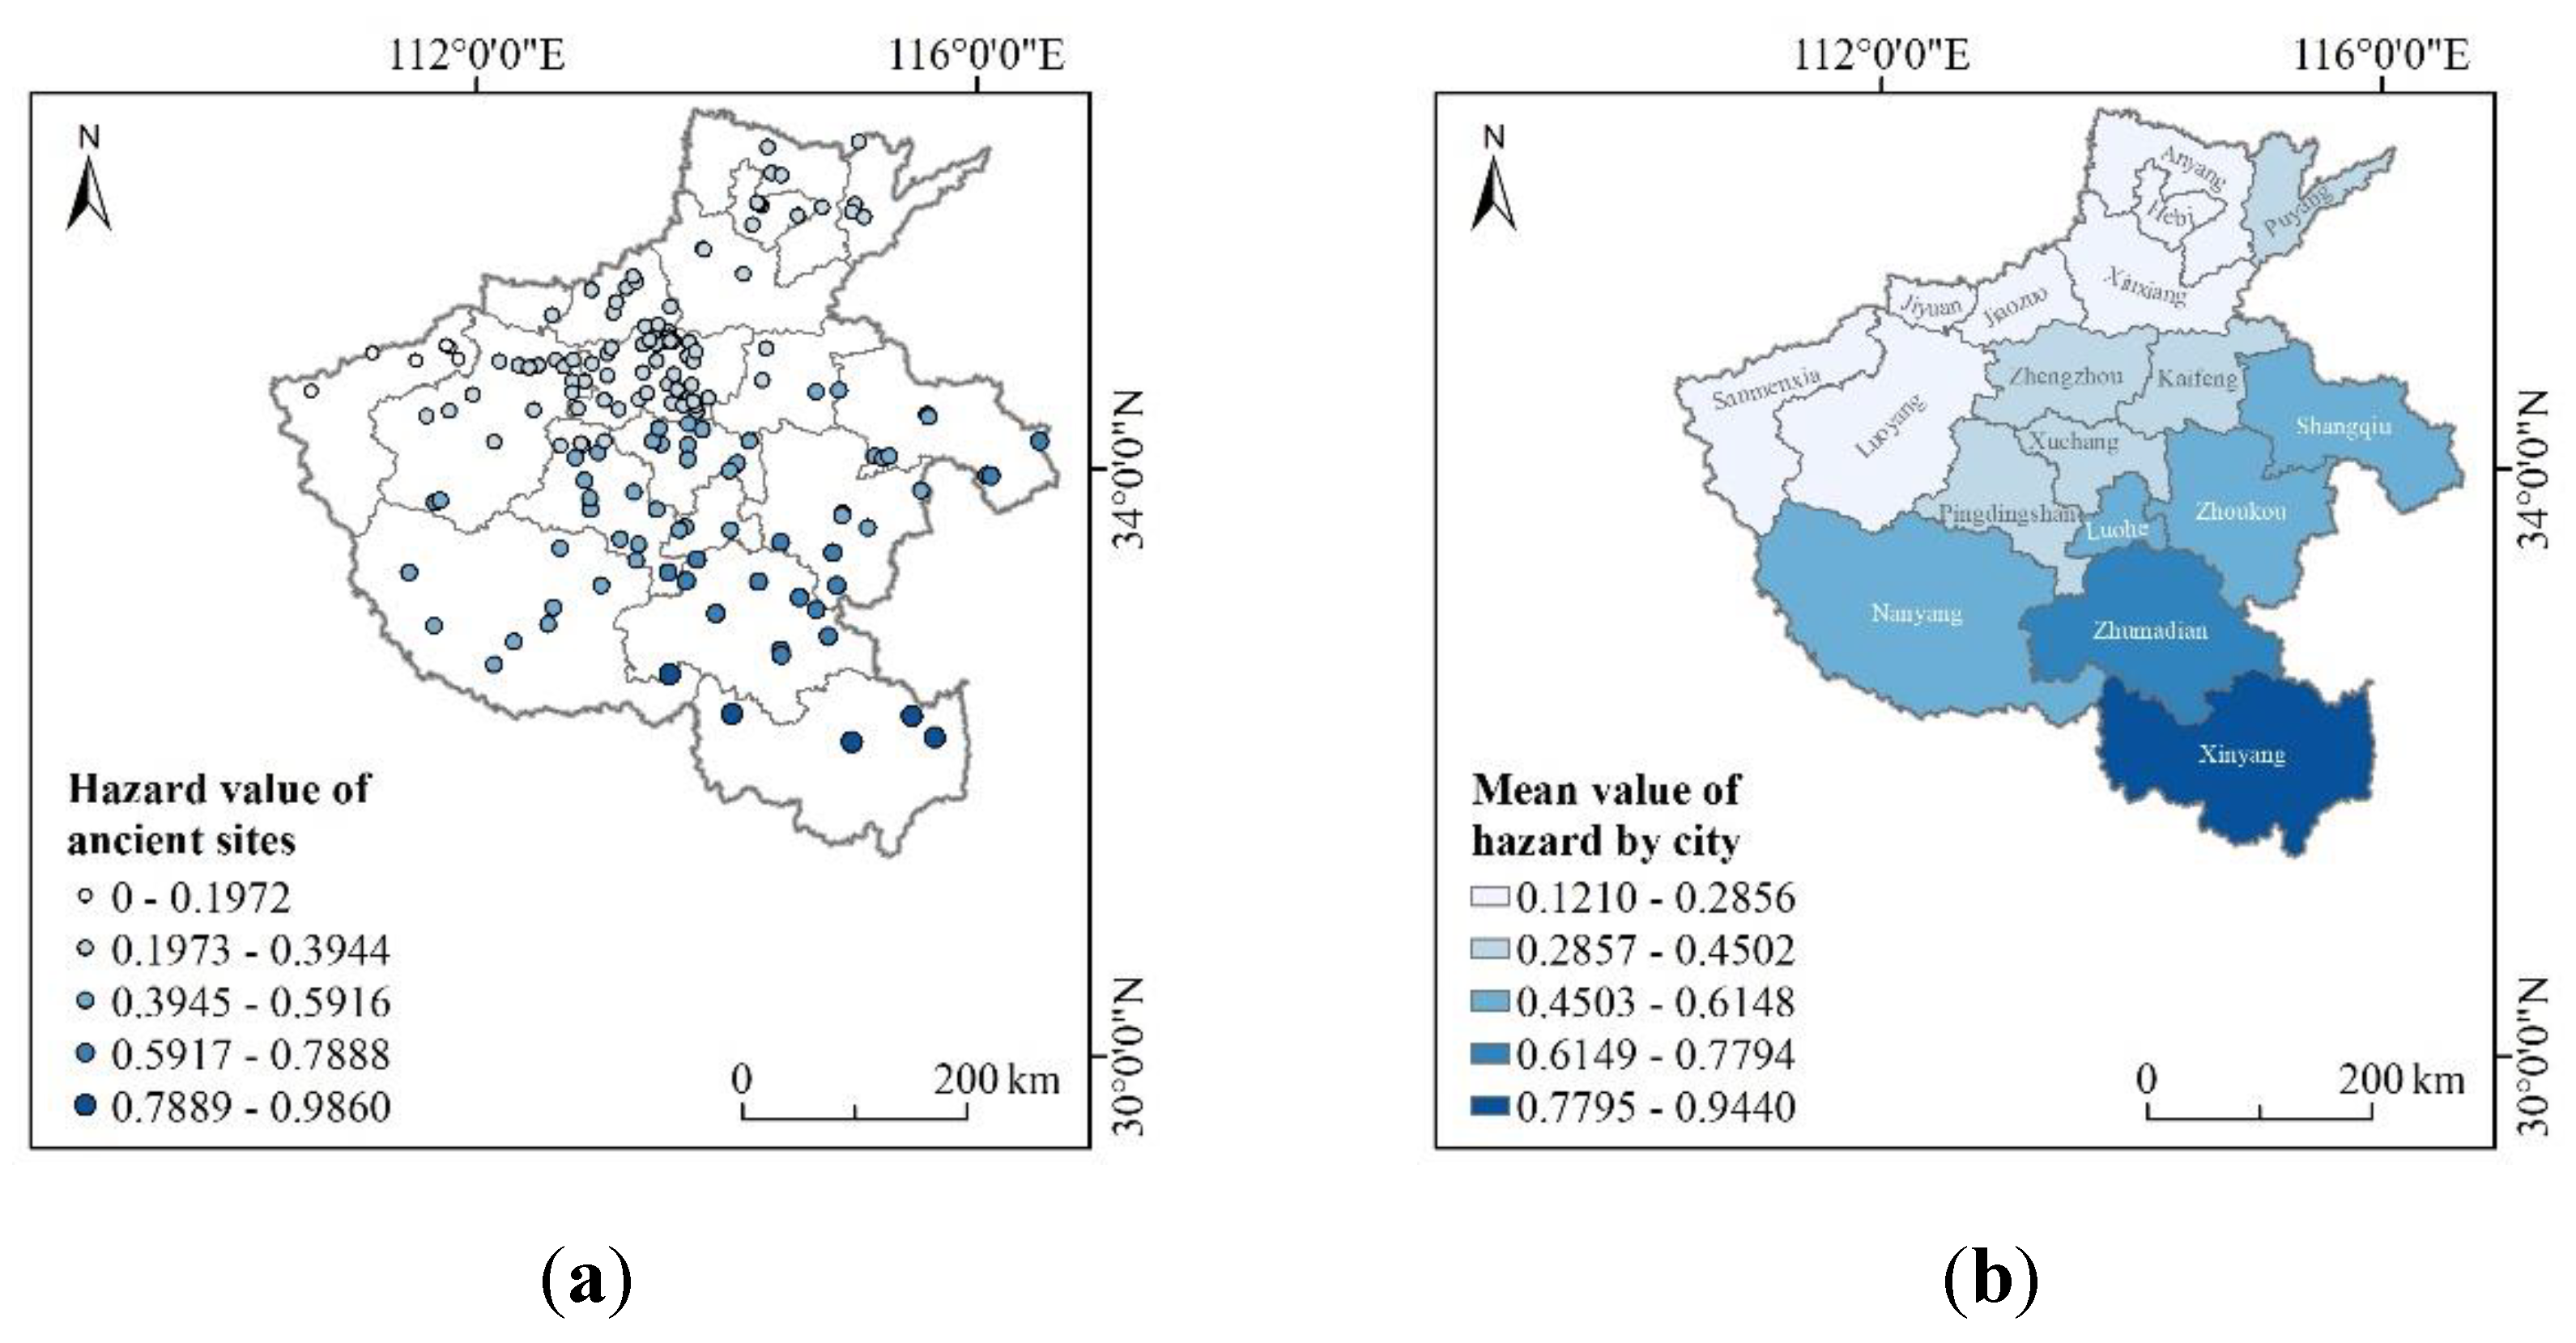
Figure 6.
The sensitivity of flood-forming environment level maps: (a) the sensitivity values of each ancient site; (b) the sensitivity of each city in Henan Province.
Figure 6.
The sensitivity of flood-forming environment level maps: (a) the sensitivity values of each ancient site; (b) the sensitivity of each city in Henan Province.
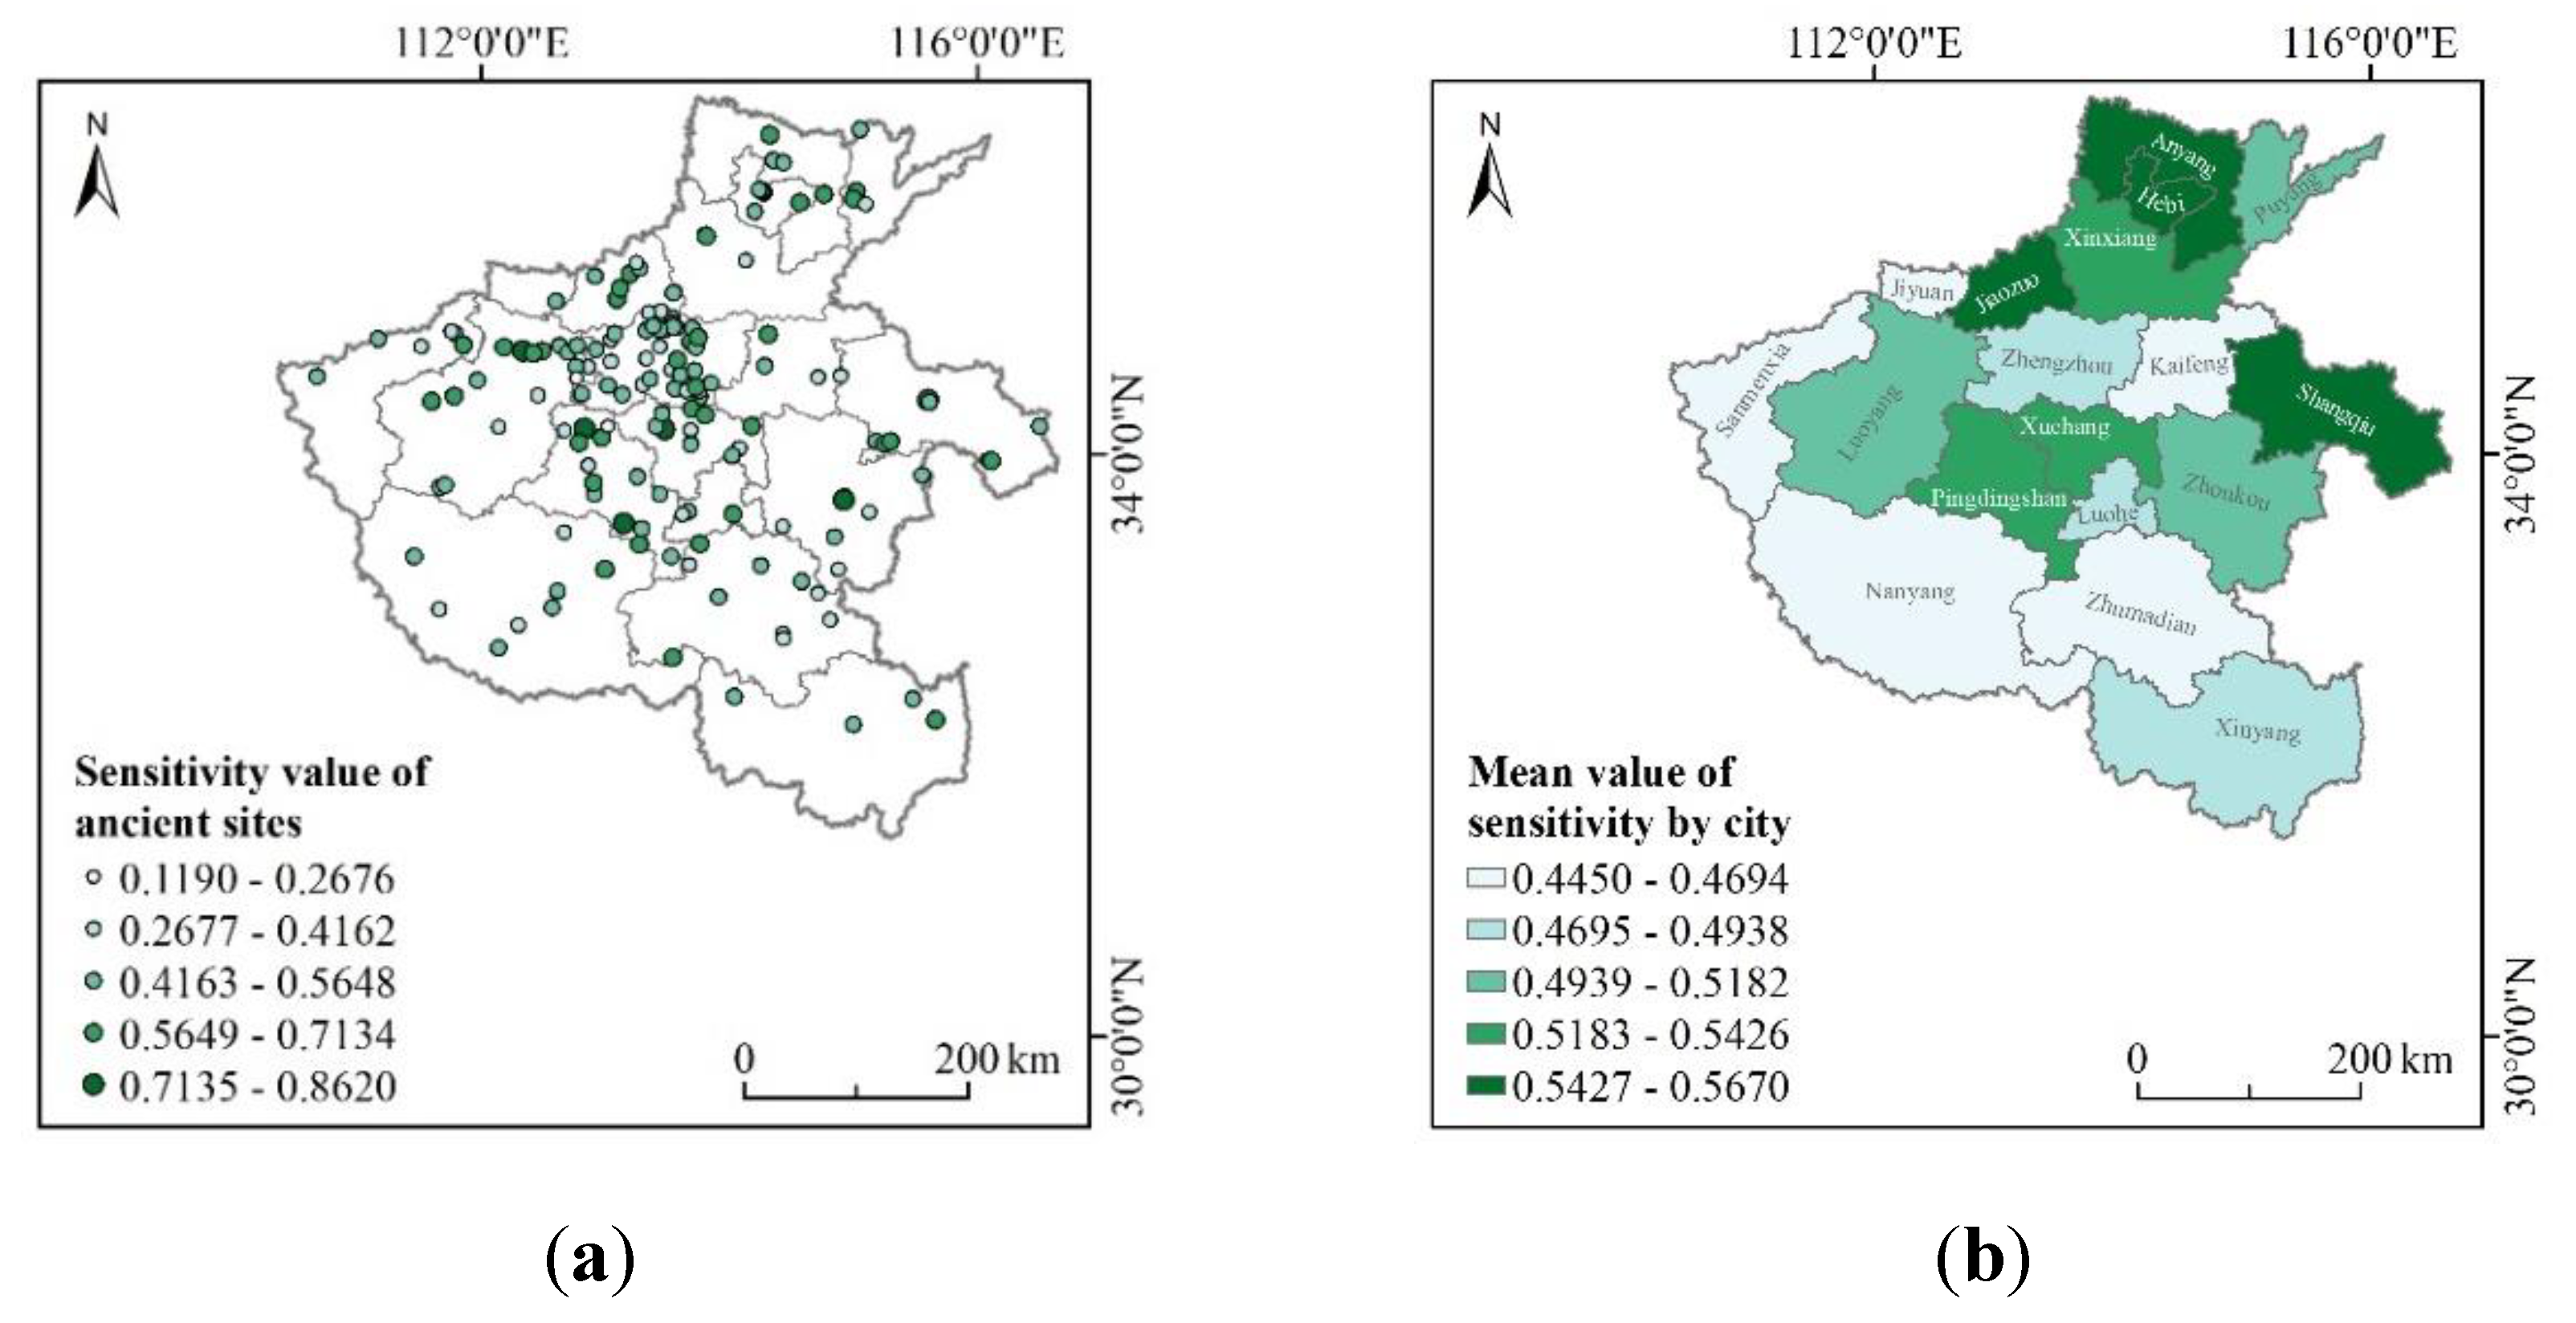
Figure 7.
The vulnerability level maps: (a) the vulnerability of each ancient sites; (b) the vulnerability of each city in Henan Province.
Figure 7.
The vulnerability level maps: (a) the vulnerability of each ancient sites; (b) the vulnerability of each city in Henan Province.
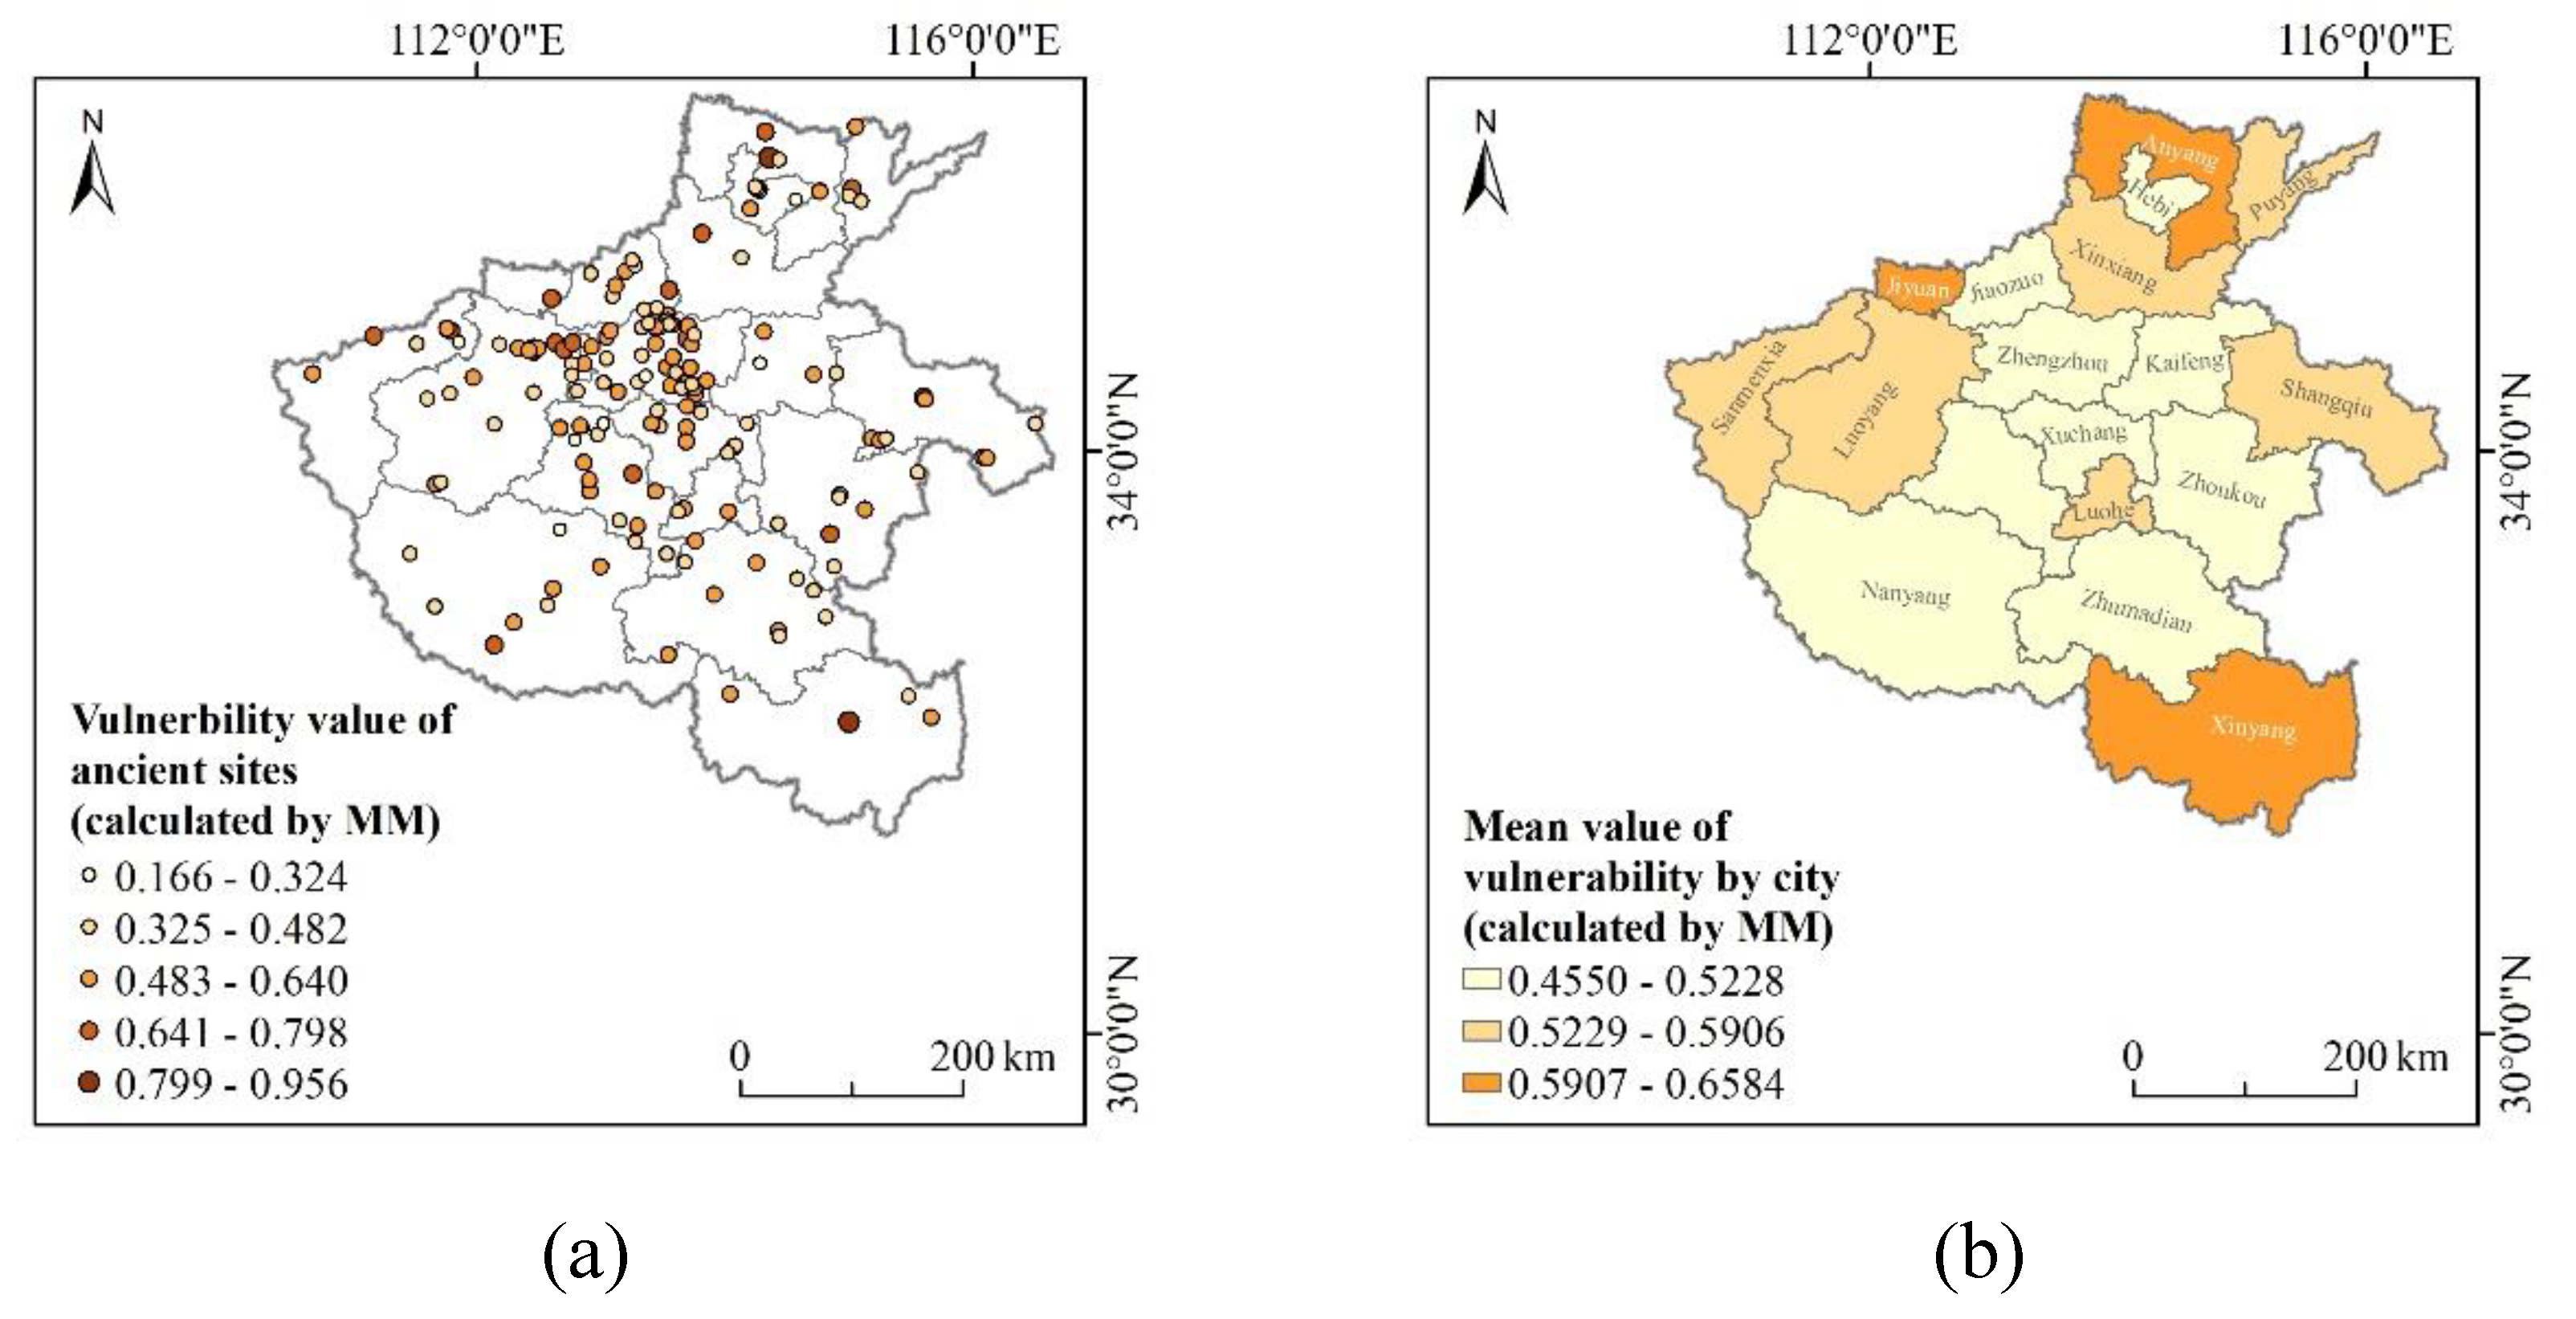
Figure 8.
Assessment result of vulnerability of ancient sites calculated by SM: (a) the vulnerability values of each ancient sites; (b) the means of vulnerability of each city in Henan Province.
Figure 8.
Assessment result of vulnerability of ancient sites calculated by SM: (a) the vulnerability values of each ancient sites; (b) the means of vulnerability of each city in Henan Province.
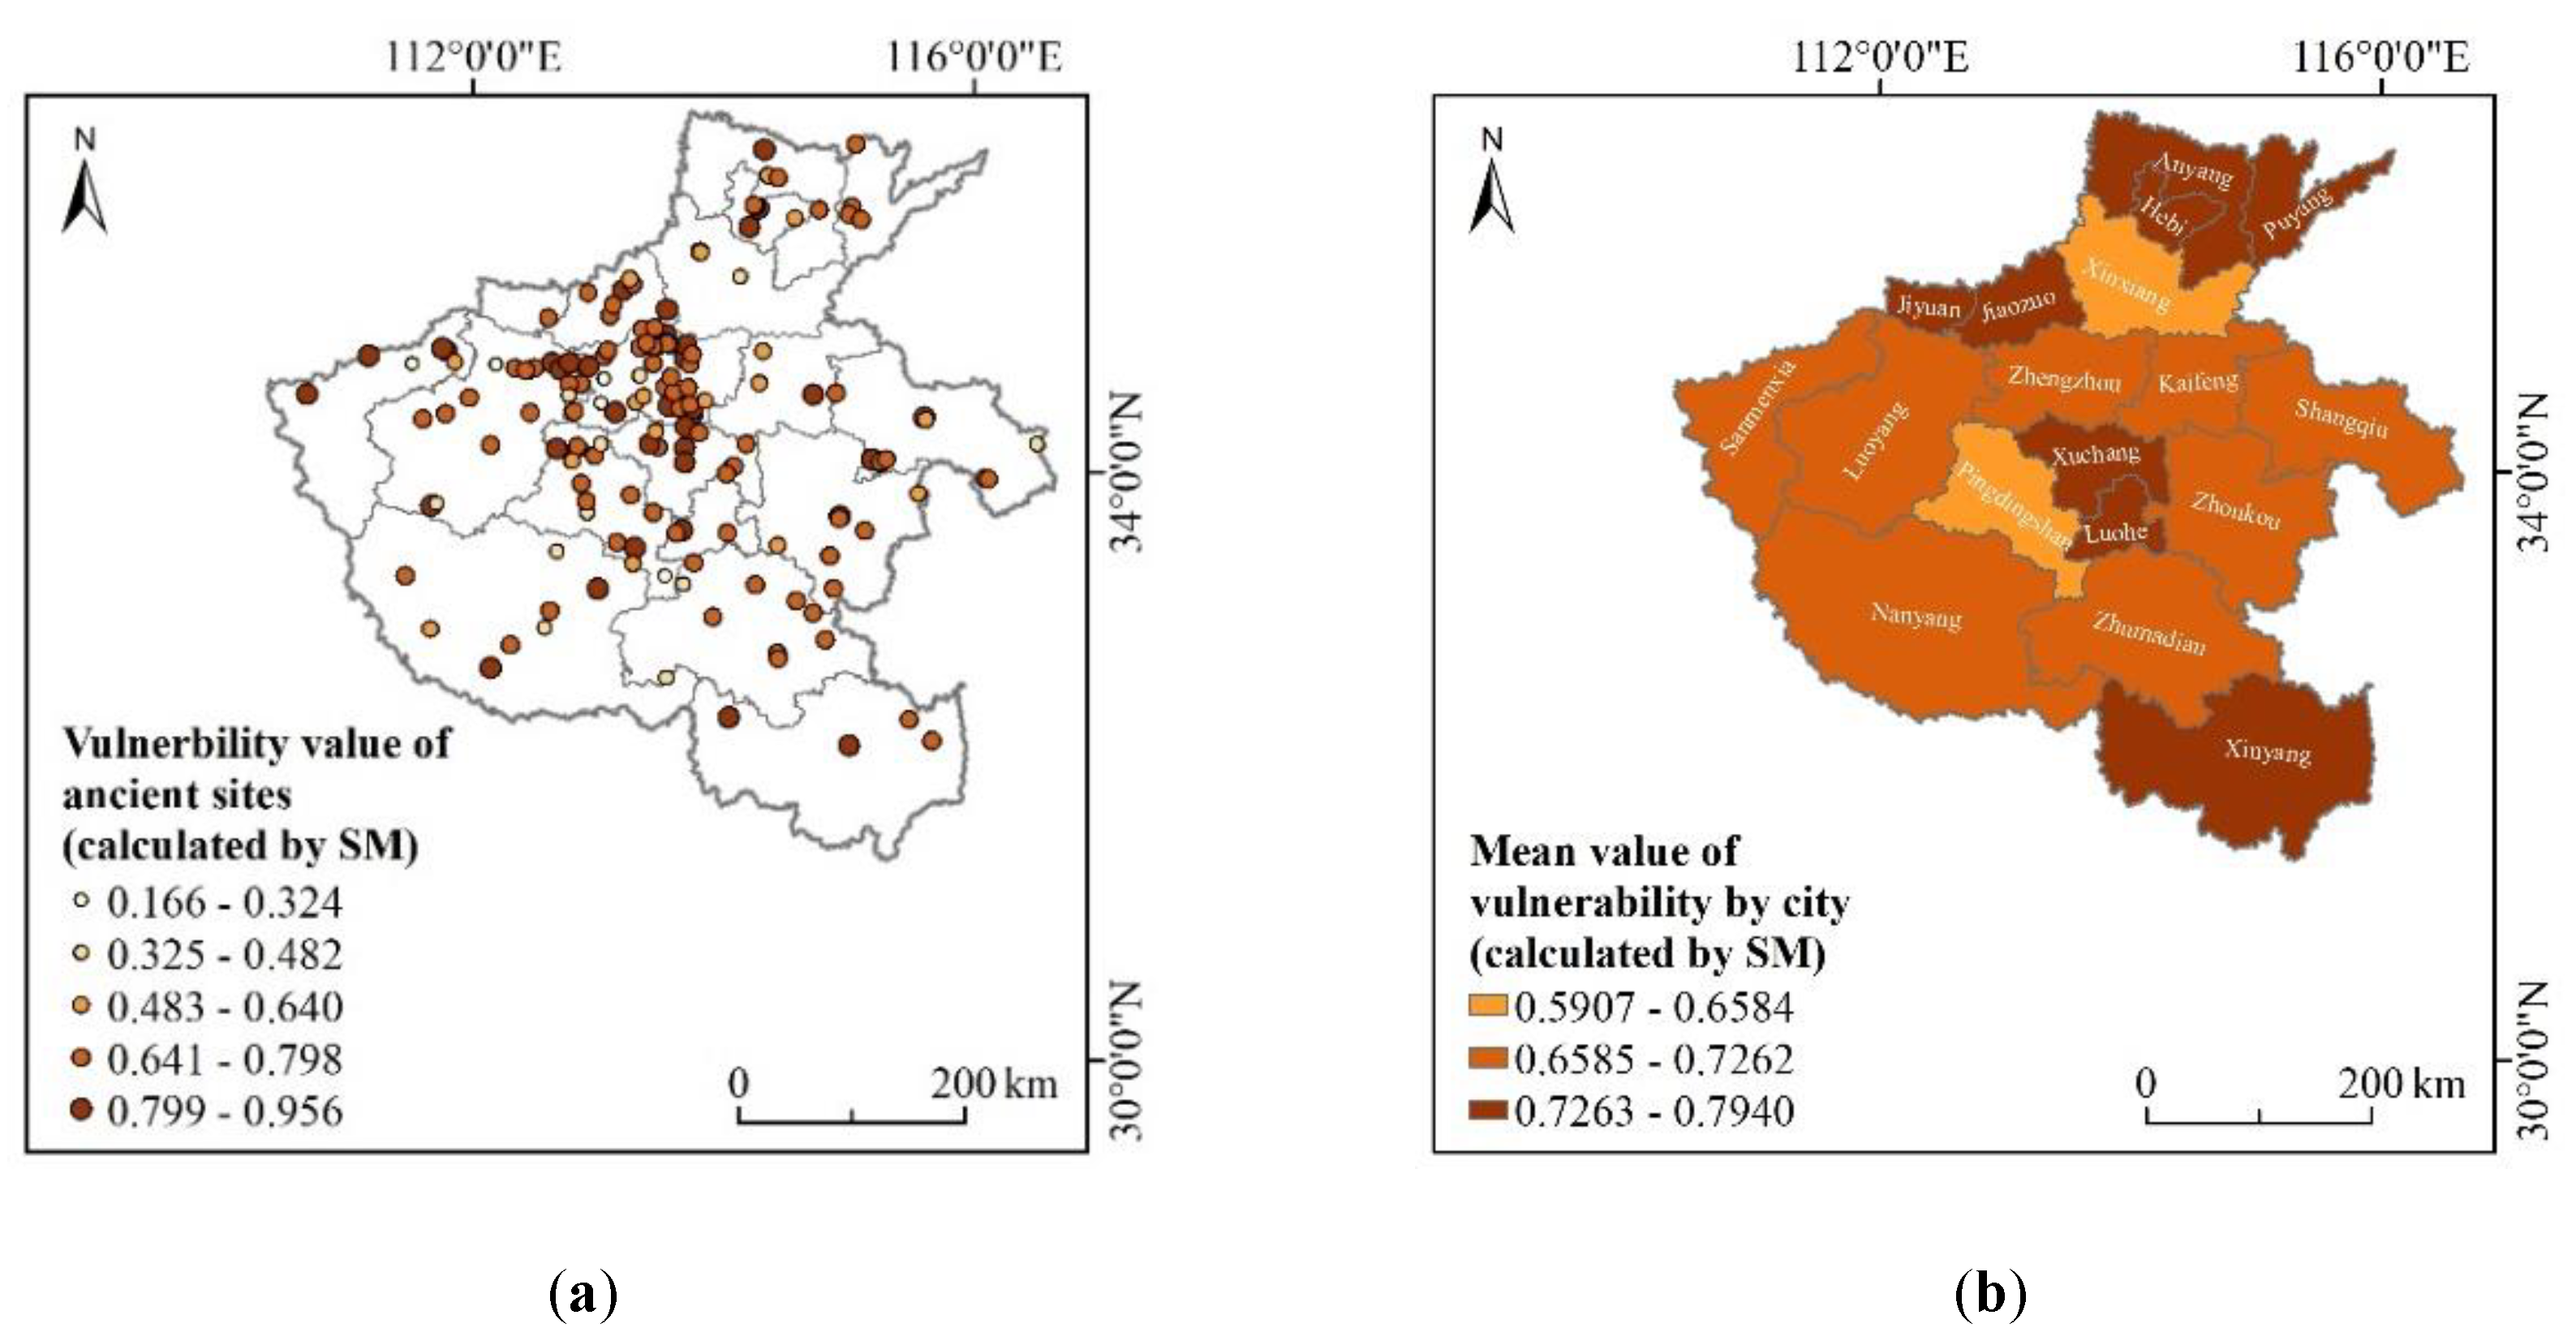
Figure 9.
Assessment result of flood risk for ancient sites calculated by multiple types of materials (a) the risk values of each ancient sites; (b) the means of risk of each city in Henan Province.
Figure 9.
Assessment result of flood risk for ancient sites calculated by multiple types of materials (a) the risk values of each ancient sites; (b) the means of risk of each city in Henan Province.
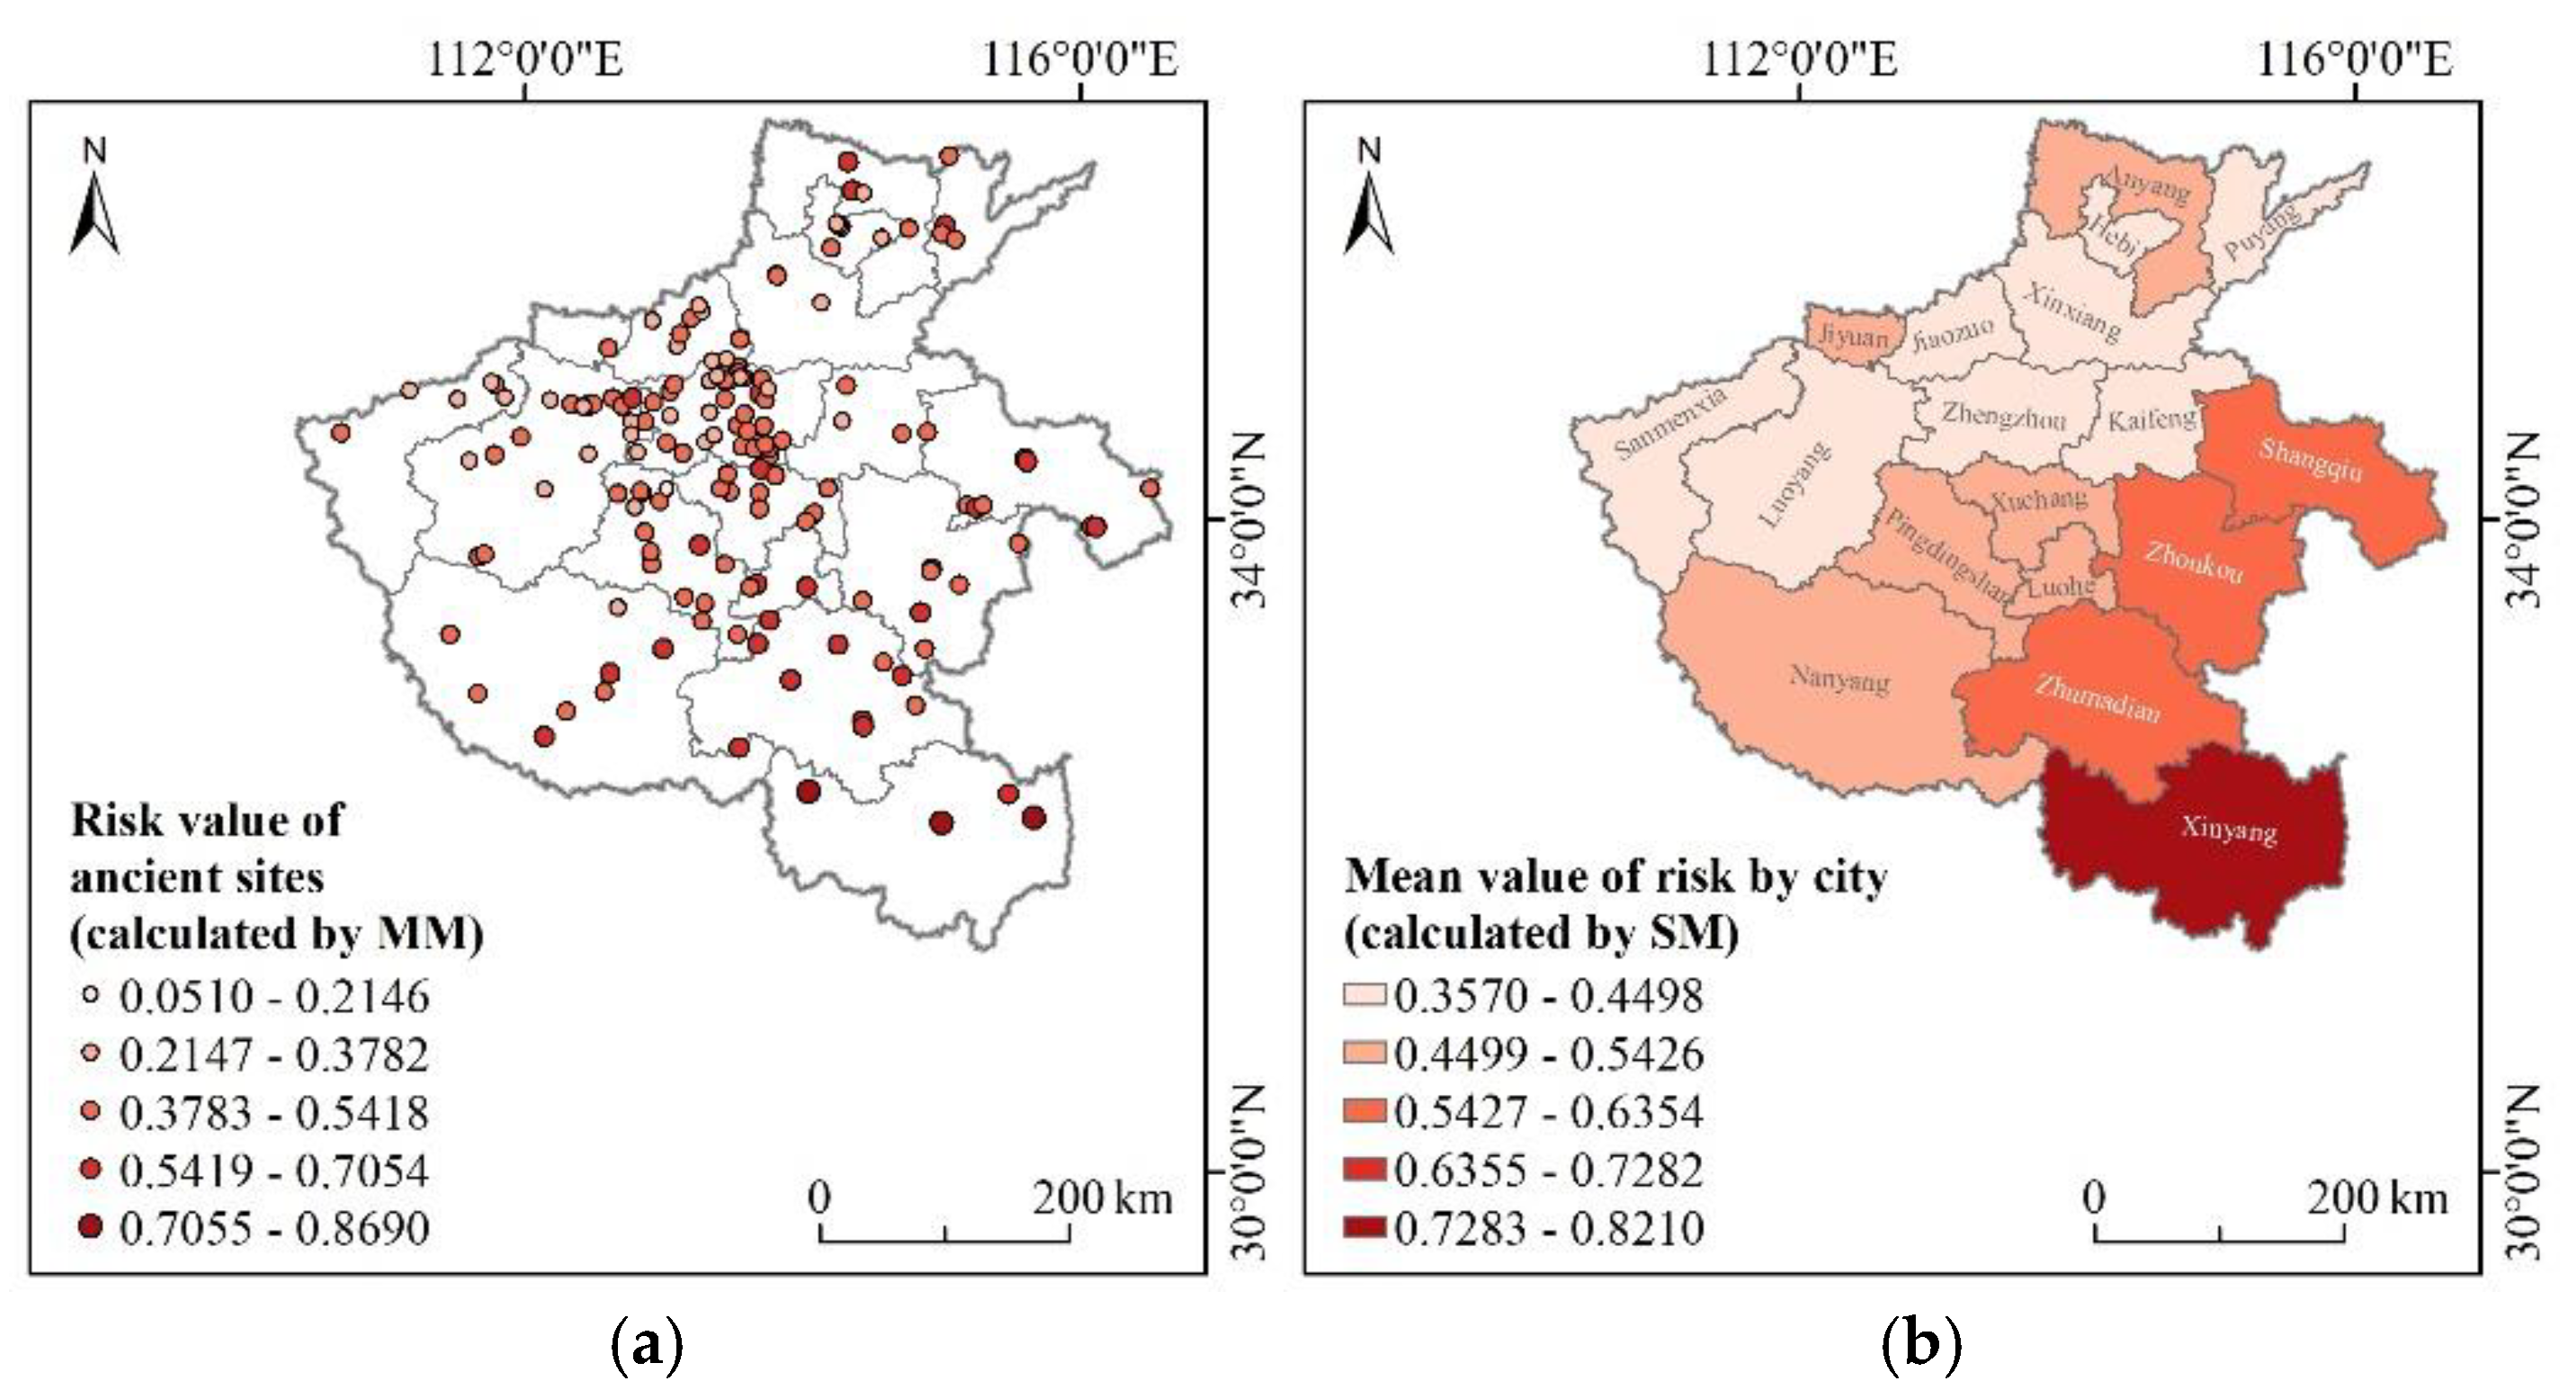
Figure 10.
Assessment result of flood risk for ancient sites calculated by single type of materials: (a) the risk values of each ancient sites; (b) the means of risk of each city in Henan Province.
Figure 10.
Assessment result of flood risk for ancient sites calculated by single type of materials: (a) the risk values of each ancient sites; (b) the means of risk of each city in Henan Province.
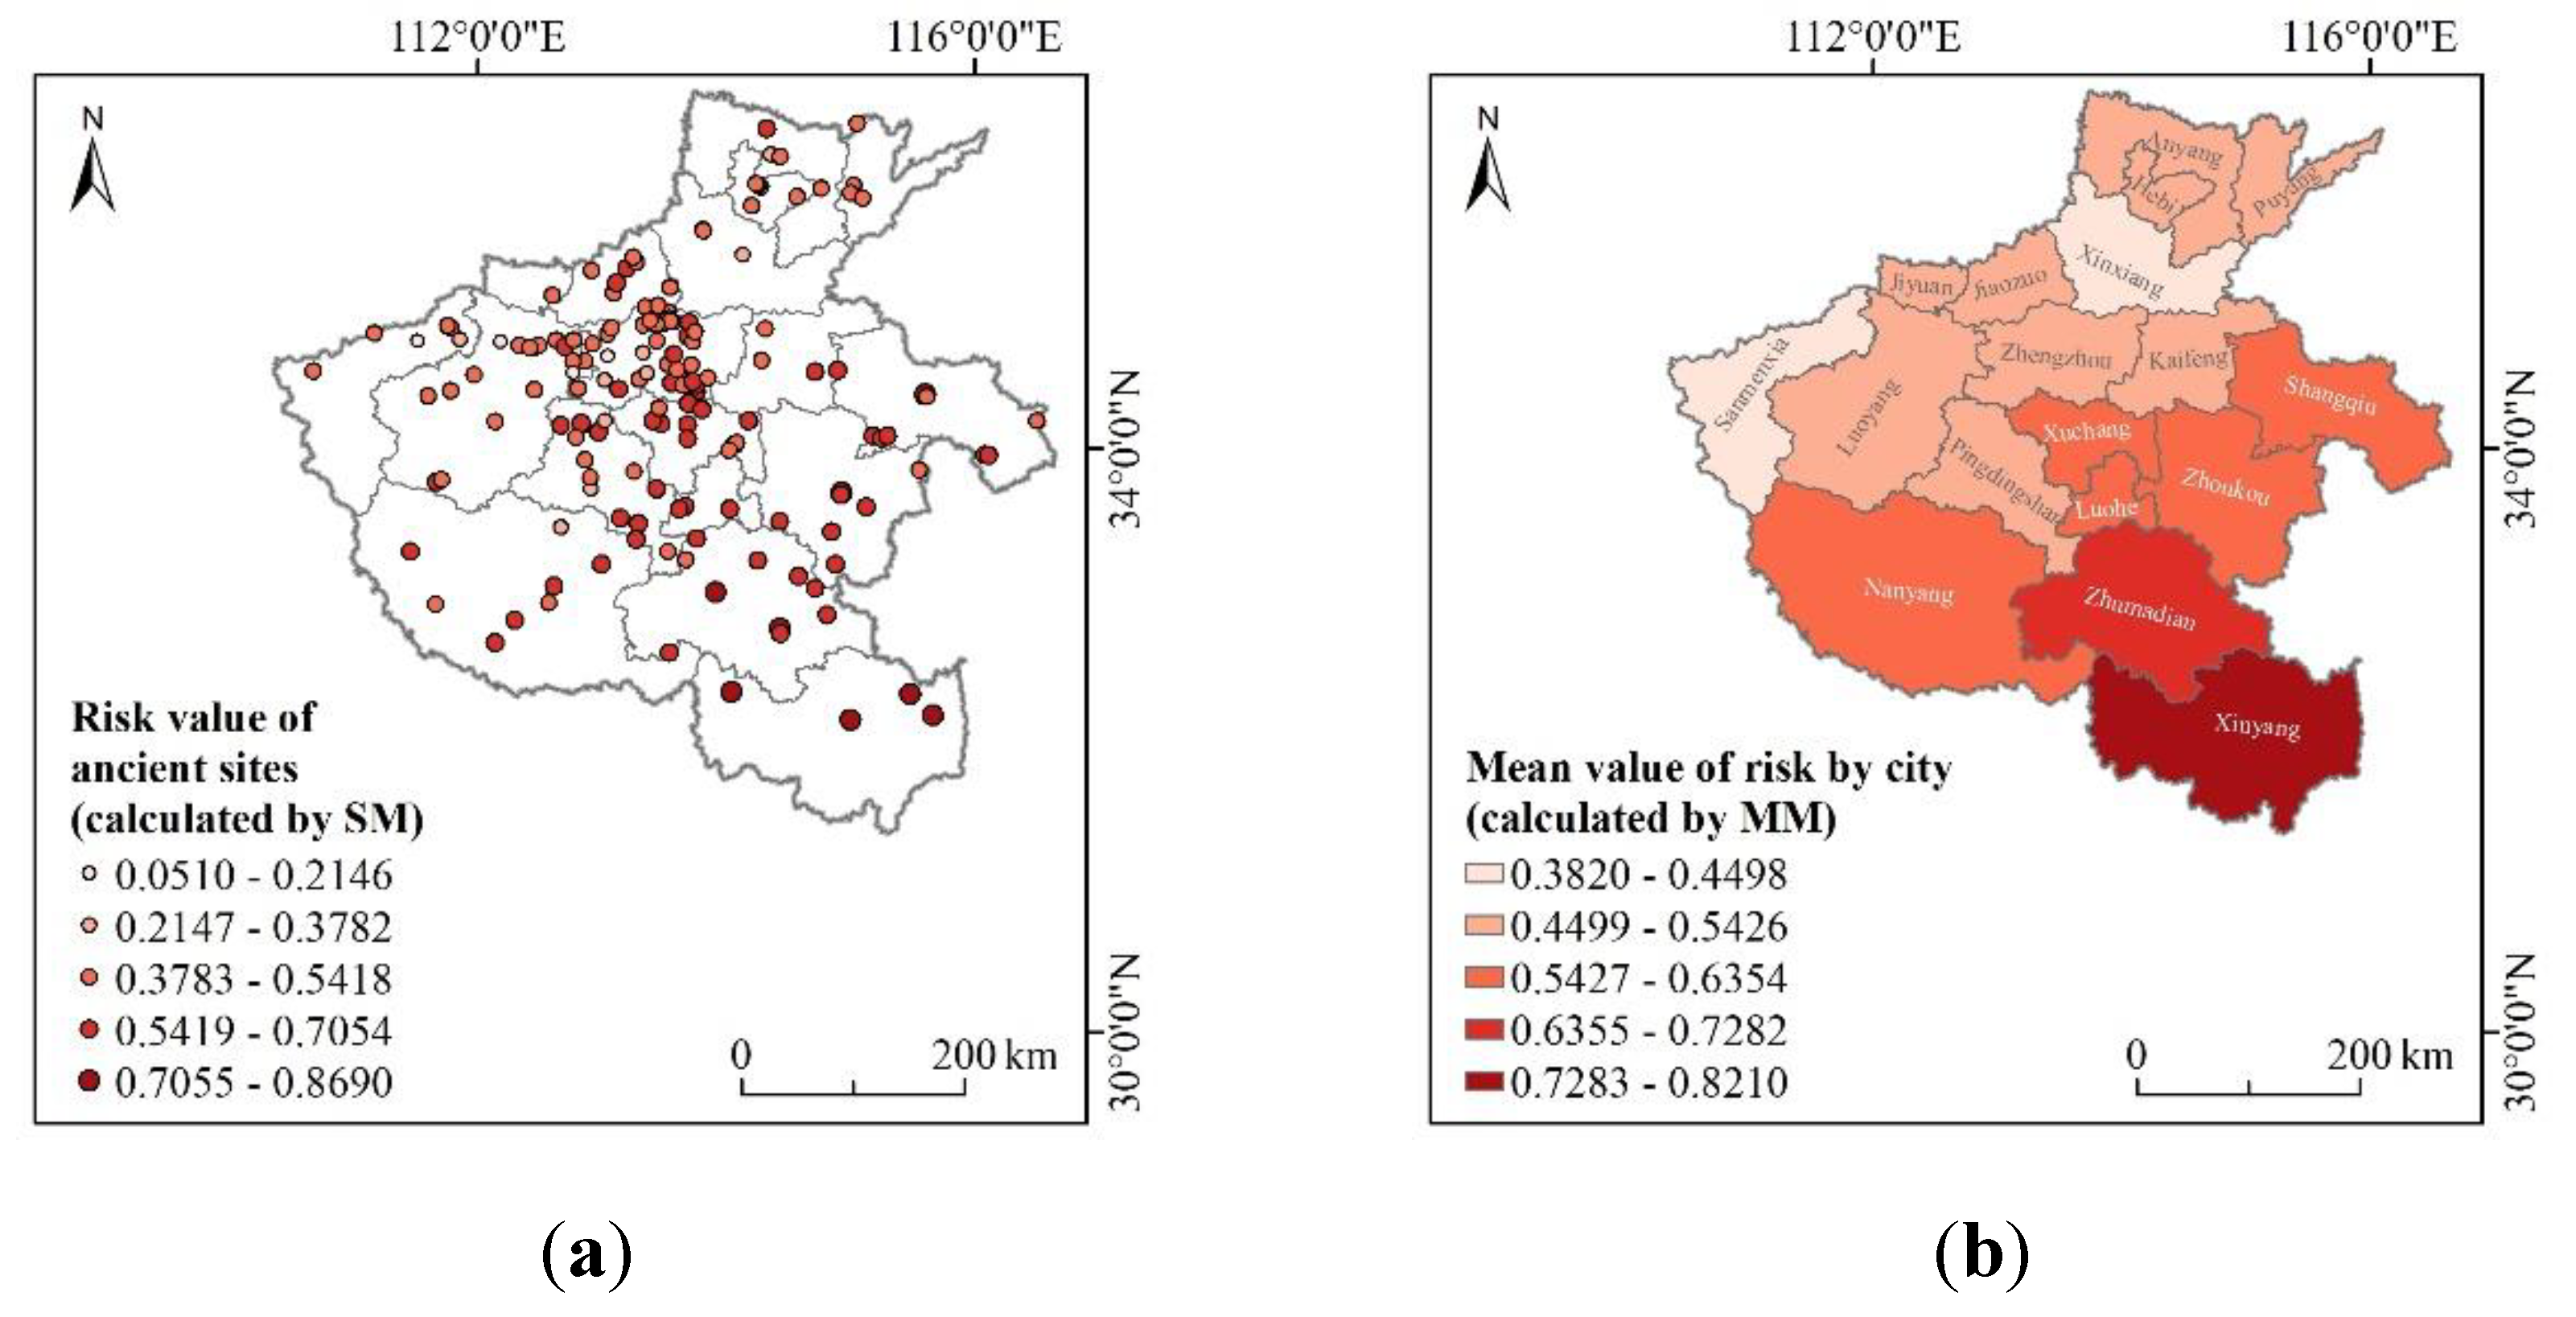

Table 1.
Description and Source of Data.
| No. | Data Type | Format | Resolution | Time | Source |
|---|---|---|---|---|---|
| 1 | Precipitation | Text | Station | 1990-2020 | http://data.cma.cn/ |
| 2 | DEM | Grid | 90m | 2020 | https://www.gscloud.cn/ |
| 3 | Administrative boundary | Vector | - | - | http://www.resdc.cn/Default.aspx |
| 4 | NDVI | Grid | 1km | 2019 | |
| 5 | GDP | Grid | 1km | 2019 | |
| 6 | Population density | Grid | 1km | 2020 | https://www.worldpop.org/ |
| 7 | River distribution | Vector | - | 2020 | www.webmap.cn |
| 8 | Assignment basis of age, scale, material classification and value of ancient sites | Text | - | - | List of important heritage sites under state protection;Provincial cultural heritage administration & Online information |
Table 2.
Assessment indicators of vulnerability of ancient site.
| NO. | Name | Description | Correlation |
| 1 | Age | Represents the age of ancient sites | + |
| 2 | Scale | Represents the scale of the ancient site | + |
| 3 | Material | Reflects the deterioration degree of ancient site materials | + |
| 4 | Value | Reflect the value of ancient sites | + |
Table 3.
The vulnerability scores for different types of the ancient sites .
| Material types | Rammed earth and adobe sites | Ceramic sites | Mixed with soil and wood sites | Mixed with wood and stone sites | Brick sites | Cave sites | Others (mining and smelting) sites | stone sites | Mixed with soil and stone sites |
|---|---|---|---|---|---|---|---|---|---|
| Score | 80 | 75 | 60 | 50 | 40 | 35 | 35 | 25 | 20 |
Table 4.
Random consistency index test (RI) table.
| n | 1 | 2 | 3 | 4 | 5 | 6 | 7 | 8 | 9 | 10 |
|---|---|---|---|---|---|---|---|---|---|---|
| 0 | 0 | 0.58 | 0.90 | 1.12 | 1.24 | 1.32 | 1.41 | 1.45 | 1.49 |
Table 5.
Indicator system of risk assessment of flood for the ancient sites.
| Target | Level 1 indicators | Weight | Level 2 indicators | Weight |
| Risk of rainstorm and flood in ancient sites | Hazard of disaster-inducing factors | 0.458 | Average annual rainfall (H1) | 0.667 |
| Average annual storm frequency (H2) | 0.333 | |||
| Sensitivity of hazard-formative environments | 0.126 | Height (S1) | 0.137 | |
| Slope (S2) | 0.173 | |||
| Vegetation coverage (S3) | 0.227 | |||
| Drainage density (S4) | 0.338 | |||
| Population density (S5) | 0.045 | |||
| GDP (S6) | 0.08 | |||
| Vulnerability of ancient sites | 0.416 | Age (V1) | 0.139 | |
| Scale (V2) | 0.086 | |||
| Material (V3) | 0.455 | |||
| Value (V4) | 0.32 |
Table 6.
The calculated vulnerabilities of two ancient sites based on the single and multiple types of materials.
Table 6.
The calculated vulnerabilities of two ancient sites based on the single and multiple types of materials.
| No. | Name | Single material score | vulnerability Based on singe material |
Multiple-material score | vulnerability Based on Multiple types of material |
|---|---|---|---|---|---|
| 1 | HuaYang | 0.8 | 0.764 | 0.3529 | 0.529 |
| 2 | ZhengHan | 0.8 | 0.762 | 0.3269 | 0.506 |
Table 7.
The calculated flood risk for two ancient sites based on the single and multiple types of materials.
Table 7.
The calculated flood risk for two ancient sites based on the single and multiple types of materials.
| No. | Name | Single type of material score | Risk Based on singe type of material | Mixed-material score | Risk Based on Multiple types of material | Risk level |
|---|---|---|---|---|---|---|
| 1 | HuaYang | 0.8 | 0.360 | 0.3529 | 0.281 | very Serious |
| 2 | ZhengHan | 0.8 | 0.371 | 0.3269 | 0.279 | relatively serious |
Disclaimer/Publisher’s Note: The statements, opinions and data contained in all publications are solely those of the individual author(s) and contributor(s) and not of MDPI and/or the editor(s). MDPI and/or the editor(s) disclaim responsibility for any injury to people or property resulting from any ideas, methods, instructions or products referred to in the content. |
© 2024 by the authors. Licensee MDPI, Basel, Switzerland. This article is an open access article distributed under the terms and conditions of the Creative Commons Attribution (CC BY) license (http://creativecommons.org/licenses/by/4.0/).
Copyright: This open access article is published under a Creative Commons CC BY 4.0 license, which permit the free download, distribution, and reuse, provided that the author and preprint are cited in any reuse.


