Submitted:
10 October 2024
Posted:
11 October 2024
You are already at the latest version
Abstract
Background: Endurance athletes require personalized nutrition strategies to optimize performance, recovery, and training adaptations. While traditional sports nutrition guidelines provide a foundation for personalization, individual variability in metabolic responses underscores the need for precision nutrition, tailored to genetic, biological, and environmental factors. This scoping review evaluates the application of systems biology-driven sports nutrition for endurance athletes, focusing on ‘omics’ and wearable technologies. Methods: A scoping review of the literature was conducted following PRISMA guidelines across PubMed, Scopus, and Web of Science with the following inclusion criteria: original research in English, involving endurance athletes, systems biology approaches, and nutritional interventions or continuous glucose monitoring (CGM). Relevant data were extracted in a systematic way. Results: Forty-eight reports were included with running as most studied sport. Eleven reports used metabolomics, ten nutrigenetics, nine metagenomics, nine CGM, six multi-omics, one proteomics, one epigenomics, and one lipidomics. Over half (62%) were randomized controlled trials (RCTs). Most studies were proof-of-concept investigations aimed at assessing biomarkers; however, the evidence linking these biomarkers to performance, recovery, and long-term health outcomes in endurance athletes remains insufficient. Significant inter-individual variability in responses to exercise and nutritional interventions was observed. Furthermore, many studies were constrained by small sample sizes and inadequate reporting of training status. Conclusions: While evidence is limited, some of the reviewed papers suggest a potential utility of systems biology-driven nutritional recommendations for endurance athletes. Future research should focus on well-powered replicated crossover RCTs, 360-degree systems-wide approaches, and validation of genetic impacts on nutritional interventions to refine dietary guidelines.
Keywords:
systems biology
; nutrigenomics
; endurance athletes
; multiomics
; nutrition
; continuous glucose monitoring
; metagenomics
1. Introduction
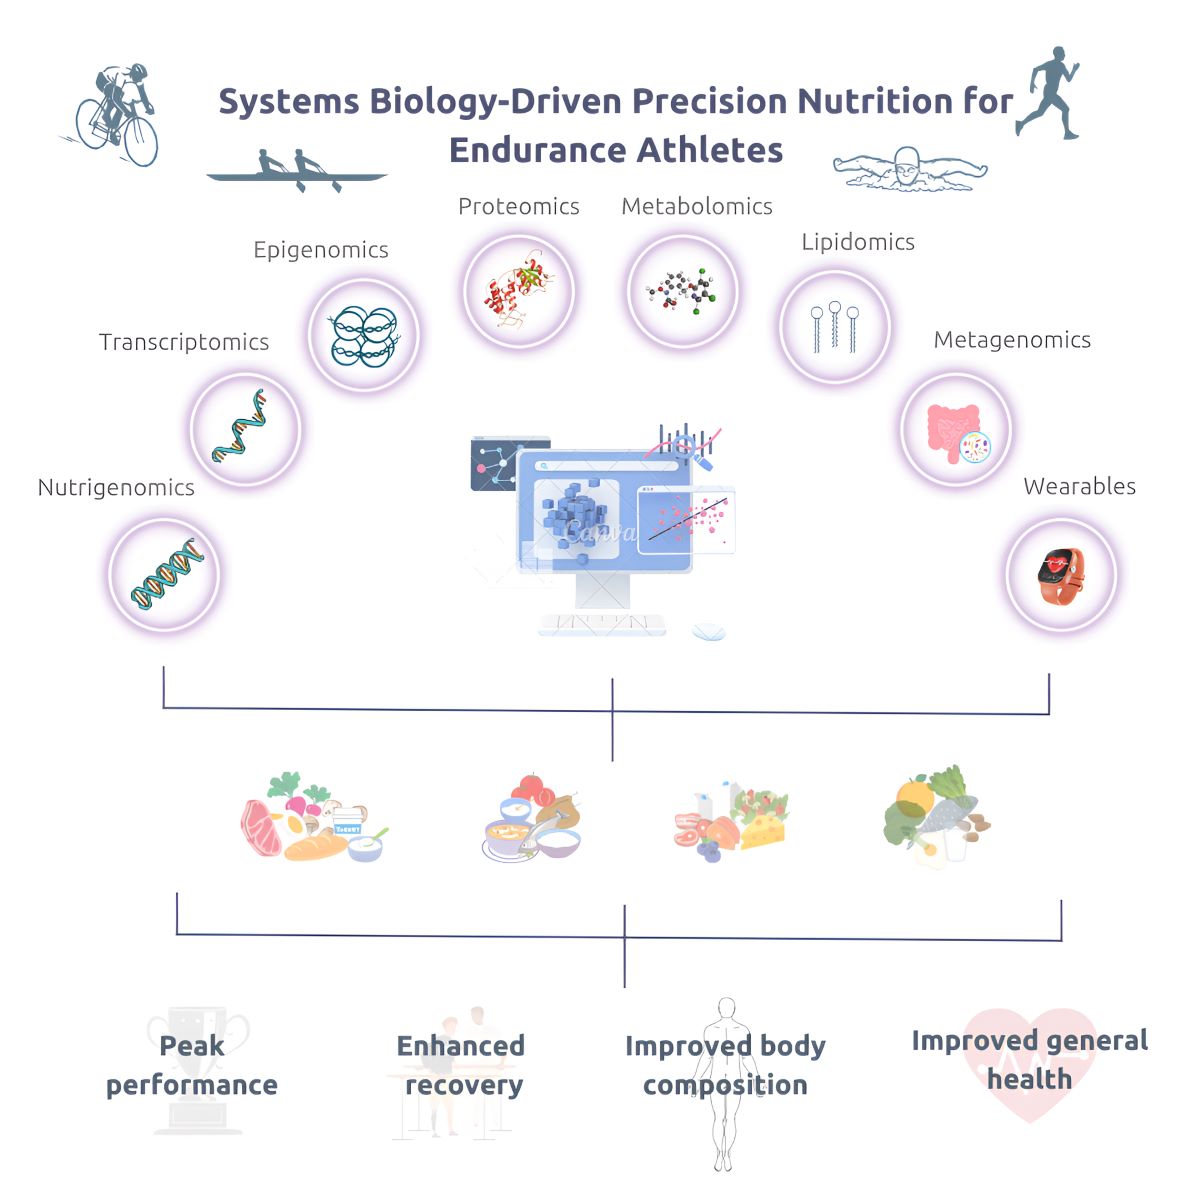
Endurance athletes, such as triathletes, long-distance runners, race walkers, cyclists, swimmers, rowers, and cross-country skiers, represent the pinnacle of human athletic performance, characterized by a remarkable capacity for sustained physical exertion and exceptional metabolic efficiency [1]. Nutrition serves as a cornerstone of athletic success, fueling performance, promoting recovery, and facilitating adaptations to training demands [2]. Optimizing sports performance requires a personalized nutrition plan that considers individual athletes’ goals, needs, and physiological characteristics [3]. This is particularly important for endurance athletes, as the timing of nutrient intake, hydration, the digestibility of foods and absorptive capacity of nutrients are key factors for enhanced performance and recovery, in addition to body composition management [4]. While macronutrient-based dietary recommendations provide a foundational level of personalization, the substantial individual variability in responses to exercise and nutrition highlights the need for a deeper understanding of metabolic heterogeneity and physiological functions of nutrients [5,6]. Unlike most sports nutrition guidelines that rely on group averages and expert consensus, precision nutrition for athletes seeks to personalize nutritional practices to optimize performance and long-term health. To derive such recommendations, it is imperative to consider the multifaceted interactions between genetics, biological processes, nutrients, and environmental factors. A systems-wide approach is essential for integrating these complex relationships [5,6].
Systems biology, utilizing multiple high-throughput ‘omics’ technologies including
functional genomics, transcriptomics, epigenomics, proteomics, metabolomics, and lipidomics for athlete characterization, along with metagenomics for microbiome analysis, holds significant potential to unravel the full effects of the exposome, including training and diet [5,6].
Nutrigenomics and nutrigenetics examine the impact of genetic variations on individual metabolic responses to nutrients and the effect of dietary components on gene expression, utilizing genomic data and advanced genetic testing [7]. Transcriptomics investigates gene expression at the RNA level, providing insights into gene structure and function, which helps to elucidate molecular mechanisms governing biological processes [8]. Epigenomics, on the other hand, examines chemical modifications in chromatin, including folding, nuclear matrix attachment, nucleosome packaging, histone tail modifications, and DNA methylation, which influence gene expression without altering the DNA sequence [9]. Proteomics involves the large-scale analysis of protein structures, functions, and interactions, enabling the identification of biomarkers for health, disease processes, and therapeutic responses [10]. Metabolomics provides the ultimate molecular fingerprint of human physiology by comprehensively assessing small molecule metabolites within biological samples, thereby offering a robust framework for identifying metabolic shifts in response to diet, lifestyle, and environmental factors [11,12]. Lipidomics, a subfield of metabolomics, involves the analysis of cellular lipids using advanced mass spectrometry techniques to elucidate lipid metabolism and its biochemical pathways, providing insights into systemic metabolic perturbations [13]. Lastly, microbial metagenomics examines the role and modulation of the gut microbiome in host’s nutrient uptake and energy metabolism [14]. Moreover, wearable technologies and real-time sensors, such as continuous glucose monitors, enable continuous monitoring of physiological parameters, providing actionable data to inform training and nutrition strategies in real time [15,16]. To harness the full benefits of these new technologies, it is essential to integrate systems biology data into predictive biomedical models capable of generating actionable strategies. The goal is to identify “the right diet for the right person at the right time,” rather than relying on a “one-diet-fits-all” approach proposed by general guidelines [5,17].
For sports nutrition practitioners and coaches, the main goals are delivering evidence-informed nutrition advice, supporting behavior change, and monitoring health and performance. A critical step in this process is a thorough evaluation of the existing scientific evidence to assess its practical applicability [18]. Despite the growing interest in precision nutrition for athletes [19], no comprehensive review has synthesized the current evidence on the application of multi-omics and wearable sensor technologies in this field. The aim of this scoping review is to systematically evaluate the utility and applicability of systems biology-driven sports nutrition specifically focusing on endurance athletes. The primary objectives are to:
• Map the existing literature;
• Summarize key findings and insights;
• Identify research gaps to guide the field;
• Provide evidence-informed practical recommendations for athletes.
2. Materials and Methods
2.1. Research Methods
Steps for conducting this review were adopted from the 5-step approach [20]. The review was conducted in accordance with the PRISMA extension for scoping reviews [21] (Supplementary File). A scoping review methodology was selected based on the need to identify the type and extent of the research in the evolving field of precision sports nutrition, and to identify research gaps. A comprehensive literature search was conducted in PubMed (MEDLINE), Scopus, and Web of Science between June 1st and August 5th, 2024. Additionally, Google Scholar was used to assess grey area literature and to identify any missing articles. Citation searching, including reviewing reference lists of included studies and forward citation tracking, was also employed to ensure all relevant studies were captured. Search strings were developed and independently tested by two authors (L.B. and F.C.) to ensure the collection of relevant studies and to minimize any potential biases. Research question, search strategy, and eligibility criteria were guided by the broad Population-Concept-Context (PCC) framework recommended by the Joanna Briggs Institute for scoping review [22]. The search terms encompassed three primary domains: (1) personalized and/or sports nutrition, (2) endurance athletes, and (3) systems biology approaches including wearables technology. Detailed search strategies for each database can be found in Supplementary File.
2.2. Eligibility Criteria
To be included in this scoping review, peer-reviewed publications needed to: (1) involve endurance athletes, defined as athletes participating in sports requiring sustained physical effort such as marathon and long-distance running, race walking, cycling, triathlon, swimming, rowing, and cross-country skiing; (2) utilize at least one of the systems biology approaches (e.g., genomics, proteomics, metagenomics, metabolomics), including wearables technology in the context of sports nutrition; (3) investigate nutritional interventions and/or continuous glucose monitoring (CGM) in the context of endurance exercise; (4) examine the impacts of omics-driven nutritional approaches on health, performance or recovery metrics; (5) be original research studies. Studies were excluded if they: (1) focused on non-endurance athletes; (2) did not report nutritional intervention and/or CGM data; (3) lacked the application of systems biology or ‘omics’ approaches. Additionally, the search was limited to articles published in the English language, restricted to human studies, with no restrictions on the publication period or study design. Finally, the studies had to be fully completed and published; abstract-only, presentation-only, and unpublished studies were excluded.
2.3. Study Selection
Two authors (L.B. and L.D.) independently screened titles and abstracts to identify potentially relevant studies. Full-text articles of the selected studies were retrieved and assessed for eligibility based on the inclusion criteria. Any disagreements on study selection or data extraction were resolved by consensus or after discussion with the third author (S.T.).
2.4. Data Charting
A standardized data extraction form was developed to systematically collect relevant information from the eligible studies. The data charting table was developed by the first author (L.B) and further improved and approved by the other authors to finally include key variables. Data extraction included study characteristics such as authors, publication year, study design and population characteristics such as gender, age, training status and performance level (reflected by VO2max where applicable). Intervention details were captured including duration, frequency and types of nutritional and exercise interventions, respectively. Additionally, information on the systems biology approach was extracted, focusing on the specific ‘omics’ platform and/or wearable technology used, along with the biological matrix employed for analysis. The outcomes of interests were related to performance, recovery or health parameters. A thematic analysis was used to identify key findings and synthesize interpretation from the included studies.
3. Results
3.1. Literature Search and Study Selection
A total of 644 studies were identified through databases and registers, with three additional studies from Google Scholar, and 24 from citation searching. After removing duplicates and initial screening, 58 reports were sought for retrieval, of which 28 were excluded during eligibility assessment. Of the additional 27 reports identified, 26 were assessed for eligibility and nine excluded. In total, 48 reports were included in the review, presented in 47 studies. The PRISMA flow diagram for study selection is presented in Figure 1.
3.2. Characteristics of Studies
Figure 2 illustrates the distribution of ‘omics’ platforms and wearable technologies employed in the studies included in this review. Ten out of 47 studies (21%) focused on nutrigenetics [24-33] (Table 1). Ten studies assessed metabolomics (23%) [34-43], with one additional report on metabolomics from a metagenomic study [44]. Additionally, one study each assessed proteomics (2%) [45], epigenomics (2%) [46], and lipidomics (2%) [47], while six studies (13%) employed multi-omics approaches [48-53] (Table 2). Nine studies (19%) investigated metagenomics [44,54-61] (Table 3), while CGM was used in nine studies [62-70] (Table 4). No studies involving transcriptomics were identified. Overall, 29 (62%) of the studies were randomized controlled trials (RCTs), of which 18 (62%) were placebo controlled and 17 (59%) adopted a crossover design [43,35-37,39,40,41,43,45-49,51-53,60]. Furthermore, ten studies (21%) were non-randomized interventional studies [24-27,29,55,56,61,67,69], five (11%) were longitudinal cohort studies [62,63,65,66,70] and three (6%) were case studies [59,64,68]. Study durations ranged from one day [65,68] to eight weeks [59]. The studies were conducted between 2009 and 2024 across several continents, including North America (n = 17; 36%), South America (n = 5; 11%) Europe (n = 11; 23%), Asia (n = 8; 17%), and Australia (n = 6; 13%). A total of 1572 participants were included, of which 127 (8%) were classified as elite athletes, defined as individuals with a VO2max above 65 mL kg-1 min-1. Sample sizes ranged from n = 1 [49,64,68] to n = 125 [26,27]. Most studies (n = 25; 53%) included both sexes albeit with a skew toward the male population. The majority focused on adult athletes, with five studies (11%) including athletes under 18 years of age. Notably, 21 (45%) studies involved master athletes, defined as individuals over 40 years of age. Running was the most frequently studied endurance sport, accounting for 34% (n = 16) of the studies [24-27,29,38,42,51,54,58,63-65,67,68,70], followed by cycling (n = 13; 28%) [28,30,37,39-41,43,47-50,52,53]. Other studied disciplines included swimming (n = 1; 2%) [61], rowing (n = 1; 2%) [59], race walking (n = 3; 6%) [55,56,69], triathlon (n = 1; 2%) [57], and cross-country skiing (n = 1; 2%) [45]. Six studies (13%) reported mixed endurance type sports [31,33,35,36,62,66], and five studies (11%) did not specify the type of discipline [32,34,46,47,60] (Figure 2b). Moreover, one study (2%) examined athletes with type 1 diabetes [62]. Of the interventional studies, 24 (51%) employed supplements as the nutritional intervention, with the remaining studies investigating individual foods or combinations thereof. The effect of ergogenic aids was assessed in 16 studies (34%).
3.3. Nutrigenetics
Table 1 details the application of nutrigenetics in precision sports nutrition for endurance athletes. The 10 studies reviewed assessed two types of supplementation interventions: five studies investigated the effect of genetic variations on caffeine metabolism, the other five studies examined the impact of different gene variants related to antioxidant defense systems in response to pequi oil supplementation. Pequi oil showed anti-inflammatory properties and the potential to mitigate exercise-induced oxidative stress and cellular damage [27,71]. Significant associations were reported between genetic variations in endogenous antioxidant systems, specifically MnSOD, CAT, and GPX1 genes, and responses to pequi oil supplementation [25]. Notably, all studies evaluating pequi oil were conducted by the same research group, involving a similar sample size of recreational runners, suggesting the use of a potentially homogeneous cohort.
Two of the five caffeine-related nutrigenomics studies were also conducted by the same research group, likely using the same cohort [31,33]. Both studies employed placebo-controlled designs: the first study found that caffeine supplementation enhanced performance in CYP1A2 rs762551 ‘fast’ (AA) metabolizers [31], while the second study identified that athletes with the HTR2A CC genotype within this subgroup experienced the greatest ergogenic benefit [33]. In addition, a similar ergogenic effect of caffeine was observed in ‘fast’ (AA) metabolizers in a study of 35 trained male cyclists [28]. Furthermore, rs762551 ‘fast’ metabolizers showed improved cognitive performance in the psychomotor vigilance test [32]. However, the ADORA2A rs5751876 had no effect on cognitive performance, and neither the CYP1A2 rs762551 nor the ADORA2A rs5751876 influenced exercise performance. Pataky et al. [30] reported no significant ergogenic benefit from caffeine for rs762551 ‘fast’ (AA) metabolizers, though a small benefit was noted among rs762551 AC carriers, typically classified as ‘slow’ metabolizers.
3.4. Metabolomics, Proteomics, Epigenomics, Lipidomics, and Multi-Omics
Table 2 gives an overview of the application of various ‘omics’ platforms in nutritional interventions targeting endurance athletes. Of the 20 reports reviewed, eleven were led by Nieman et al., involving various cohorts of athletes, primarily cyclists and runners. This research group has been instrumental in advancing the application of ‘omics’ technologies in sports nutrition, notably with their 2012 study comparing banana consumption with isotonic carbohydrate supplementation during a 75-km cycling trial [37]. Their research has primarily focused on investigating the impact of polyphenols from fruits, supplements, and nuts on exercise-induced immune system perturbations and recovery [38-40,47,48-53]. Using a metabolomics-based approach, they showed that both blueberry and banana consumption attenuated exercise-induced increases in pro-inflammatory oxylipins in cyclists, with significant inter-individual variability in gut-derived phenolic metabolite levels [5,50]. Earlier research revealed distinct phenolic metabolite profiles in runners following polyphenol-rich soy protein supplementation, albeit with no attenuation of traditional inflammation markers [38]. Similarly, a more recent study found that 2-week mango fruit supplementation did not reduce post-exercise inflammatory response compared to water ingestion [53]. In contrast, banana consumption consistently outperformed carbohydrate-only ingestion by enhancing anti-inflammatory responses and improving monocyte metabolism [47,48]. Nieman et al. [51] also examined the effects of astaxanthin supplementation using multi-omics and while astaxanthin failed to suppress exercise-induced cytokine and oxylipin elevations, it countered reductions in plasma immunoglobulins, suggesting an immune-normalizing effect post-exercise. Similarly, Nieman et al. [52] assessed a 2-week nitrate supplementation regimen from beet-based products, observing increases in anti-inflammatory oxylipins and reduced complement activation despite no reduction in pro-inflammatory oxylipins. However, the acute effects of nitrates on metabolic recovery warrant further investigation, as Stander et al. [42] reported no accelerated recovery with beetroot juice following a marathon.
Research by other groups using ‘omics’ approaches has highlighted the benefits of carbohydrate-protein blends [34] and oligopeptides [43] for improving metabolic recovery and lipid metabolism, while post-exercise protein supplementation has been shown to mitigate disruptions in sulfur amino acid metabolism [41]. Conversely, proteomics research indicates that low energy availability (LEA) impairs performance and immune function in female endurance athletes [45]. Finally, a single epigenomics study suggests that dietary fat and exercise modulate muscle DNA methylation, evidenced by significant hypomethylation in CpG islands [46].
3.5. Metagenomics
Table 3 provides a summary of metagenomic studies investigating the role of the microbiome in endurance athletes, focusing on its impact on health, performance, and recovery. Six of the nine studies examined the effects of prebiotic or probiotic supplementation, while three explored the influence of various dietary strategies. Most studies reported non-significant differences in alpha diversity following nutritional/probiotic interventions or physical activity. Murtaza et al. [55] found negative correlations between Bacteroides and Dorea abundances and performance measures following the consumption of the low carbohydrate high fat (LCHF) diet in elite race walkers. In a separate analysis of the oral microbiome of the same cohort, the LCHF diet had the most pronounced impact, reducing the relative abundance of Haemophilus, Neisseria, and Prevotella, and was linked to increased nitrate/nitrite-reducing activity and nitric oxide generation [56].
Studies investigating the effects of probiotic supplementation on exercise performance revealed a positive impact of Bifidobacterium longum subsp. longum OLP-01, Veillonella atypica FB0054, Lactobacillus plantarum PS128 and Bifidobacterium animalis subsp. lactis BL-99 supplementation on endurance performance in middle- and long-distance runners, recreational athletes, triathletes and in cross-country skiers, respectively [44,57,58,60]. Additionally, OLP-01 supplementation protected against muscle mass reduction [58], whereas BL-99 supplementation improved lipid metabolism, evidenced by reductions in triglycerides and low-density lipoprotein cholesterol [45]. Finally, Jaago et al. [59] demonstrated that prebiotic supplementation with dietary fibers induced a shift from acetate- to butyrate-producing bacteria, promoting beneficial gut microbiome modulation and a significant decrease in alpha diversity.
3.6. Wearables: Continuous Glucose Monitoring
Table 4 summarizes studies investigating the use of CGM technology during endurance events, encompassing both healthy individuals and those with diabetes. Most studies were observational, focusing on the impact of physiologically relevant parameters during and after exercise interventions. Notably, three studies compared CGM measurements from interstitial fluids with glucose concentrations from venous or capillary blood [66,67,70]. In elite race walkers, glucose levels were comparable to those of the general population, despite variations in diet and activity levels, with males exhibiting higher mean 24-hour glucose levels than females [69]. Ultra-endurance runners generally maintained normoglycemia during extreme events; however, the risk of hypoglycemia increased at peak exertion [63,64,68,70]. Conversely, male athletes with type 1 diabetes demonstrated a decline in glucose levels throughout a cycling race but experienced hyperglycemia post-race [62]. Similarly, the risk of hyperglycemia increased in the 48 hours following cycling and ultra-endurance trail events, particularly after carbohydrate intake, with elevated basal glucose levels persisting for up to five days [66,70]. Finally, higher carbohydrate consumption before endurance events and increased energy intake during events were associated with improved performance [63-65].
4. Discussion
This scoping review represents the first systematic synthesis of systems biology approaches within the emerging field of precision sports nutrition for endurance athletes. The objective was to map the existing literature, identify research gaps, and summarize the evidence to provide practical insights for athletes. A total of 47 studies of varying quality met the inclusion criteria. With the exception of nutrigenetics studies, most were proof-of-concept investigations focused on biomarkers associated with performance and metabolic recovery, primarily derived from plasma or stool samples. Our findings indicate paucity of evidence linking the identified biomarkers to performance, recovery, and long-term health outcomes in endurance athletes. Additionally, significant inter-individual variability in responses to exercise and nutritional interventions was observed. Moreover, many studies were limited by small sample sizes and inadequate reporting of training status.
4.1. Nutrigenetics
An individual’s genome typically differs from the reference human genome at approximately 4-5 million sites [72]. Such genetic variation impacts a wide range of biological processes, including those related to nutrient metabolism and the body’s response to these nutrients. Tailoring nutrition to an athlete’s DNA could potentially enhance performance and optimize health outcomes [73]. Numerous gene-nutrient interactions have been proposed to impact sports performance. The data, however, is not robust and the effects of genetic variations on performance need to be validated to develop precision nutrition strategies [74]. Despite the growing popularity and availability of genetic testing, only ten studies in this review investigated nutrigenetics in endurance athletes, focusing on only two supplements.
Pequi oil, derived from the pulp of the pequi fruit, is a carotenoid-rich supplement that remains underexplored in sports nutrition. Research by Miranda-Vilela et al. have reported associations between genetic variations in antioxidant systems and responses to pequi oil supplementation [24-27,29]. However, these studies have several methodological limitations, including before-and-after designs and inadequate statistical adjustments for multiple associations. As a result, the reported associations may be due to chance and need validation in independent cohorts.
Conversely, caffeine is one of the most extensively studied compounds in nutrigenetics, with significant inter-individual variability in its effects on sports performance linked to genetic factors [74]. Over 95% of caffeine is metabolized by the CYP1A2 enzyme [31]. The –163A>C (rs762551) SNP has been shown to influence CYP1A2 inducibility and activity, enabling the stratification of individuals as ‘slow’ (AC, CC genotypes) or ‘fast’ (AA genotype) caffeine metabolizers [31]. Another significant gene in caffeine metabolism and response is ADORA2A; the rs5751876 SNP is used to categorize individuals based on their caffeine sensitivity as ‘high’ (TT genotype) or ‘low’ (CT or CC genotypes) [32]. While placebo-controlled studies suggest that caffeine benefits ‘fast’ metabolizers, with enhanced performance and cognitive function, the findings are inconsistent. For instance, some studies reported minimal or no significant ergogenic benefits in ‘fast’ metabolizers [30]. These inconsistencies warrant further research in larger, independent athlete cohorts to refine recommendations on optimal dosing, timing, and exercise conditions for caffeine supplementation.
4.2. Proteomics, Metabolomics, Epigenomics, Lipidomics, and Multi-Omics
While genomics holds promise for identifying athletic talent, optimizing performance, predicting sports-related injury risks, and determining recovery timelines, the athlete’s genome represents only one aspect of sport science [75]. The physiological underpinnings of athletes are shaped by the complex interplay of genetic traits and a host of environmental stimuli necessitating advanced approaches such as metadata analysis and multi-omics profiling to be fully elucidated [76-78]. The emerging field of multi-omics facilitates a comprehensive evaluation of metabolic responses to exercise, nutrition, and lifestyle interventions [79]. Technological advancements have revolutionized exercise science, enabling simultaneous measurement of thousands of molecules from minimal quantities of biological fluids, cells, and tissues. While traditional metabolic studies of intense exertion focused on a limited set of biochemical markers, recent research has demonstrated that acute vigorous exercise alters approximately 15,000 transcripts, over 300 proteins, and more than 700 metabolites and lipids [79,80].
Endurance athletes encounter considerable physiological stress, leading to muscle damage, oxidative stress, inflammation, gastrointestinal disturbances, and transient immune suppression [37,39,47-50]. In contrast to moderate exercise, which generally enhances immune function, this immunosuppression may persist for hours to days and is frequently associated with an increased incidence of upper respiratory tract infections 1-2 weeks post-competition. Such infections can disrupt training goals within meso- and macrocycles, thereby affecting peak performance. Exercise-induced inflammation activates immune cells, which can be monitored in real-time using metabolomics and lipidomics [50-53]. Intense exercise elevates oxylipin production and lipid mobilization, driving post-exercise inflammation and oxidative stress. Both acute carbohydrate intake and chronic polyphenol consumption attenuate, though do not fully suppress, these responses [50]. These findings provide valuable insights into the complex role of post-exercise inflammation and oxidative stress, revealing their dual function in driving essential adaptations at optimal levels, while excessive responses may compromise recovery and long-term health [81].
While carbohydrate supplementation is well-established for modulating immune responses to prolonged exercise, the use of polyphenols remains an emerging area [5]. Peri-workout carbohydrate intake effectively reduces post-exercise stress hormones, inflammation, and fatty acid mobilization. Fruits rich in carbohydrates, and polyphenols, offer immune modulating benefits comparable to sports drinks, with the added potential for long-term health benefits. Notably, individual responses to different polyphenol rich carbohydrate sources vary, with one study showing up to a 14-fold difference in plasma levels of blueberry-derived metabolites among cyclists. Higher responders exhibited lower post-exercise plasma oxylipin levels, highlighting the need for further research to elucidate these variations [5,50]. Additionally, the reduction of post-exercise plasma oxylipin levels appears to be influenced by the specific macronutrient and polyphenol composition of the fruit consumed, suggesting that the type of polyphenols and macronutrient balance play role in modulating exercise-induced inflammatory responses [53]. Finally, the limited research on modulation of the proteome and epigenome induced by specific nutritional interventions in endurance athletes underscores an important area for future investigation.
4.3. Metagenomics
Over the past two decades, the human gut microbiome has been recognized as a crucial component of health, influenced by various factors such as diet, medications, and physical activity. Research on the gut microbiota in athletes faces several confounding factors. These include the timing of sample collection (in-season versus off-season), the specific sport discipline (as different exercises impact the microbiota differently), and methodological constraints such as small sample sizes that can lead to variability in results [14,82]. Exercise and dietary fiber consumption are associated with increased bacterial diversity and presence of short-chain fatty acid (SCFA) producing bacterial species, like butyrate. Butyrate is the primary energy source for colonocytes and has anti-inflammatory properties. Increased butyrate production may be crucial for mitigating mucosal inflammation (leaky gut), a key concern for endurance athletes, who experience substantial gastrointestinal stress during intense training and competition [59,82]. While emerging research indicates promising potential of harnessing the gut microbiome to enhance endurance performance, further investigation is required to establish causal relationships between microbiome shifts induced by diet and exercise, and their impacts on health and athletic performance. Additionally, the influence of peri-workout simple carbohydrate intake on dental health and its association with microbial shifts warrants investigation in the field of metagenomics.
4.4. Wearables: Continuous glucose monitoring
Energy availability (EA) is crucial for athletic performance, and its effective management is essential for endurance athletes due to increased energy demands over extended periods. Blood glucose levels serve as a key indicator of EA, influenced by diet and exercise, and exhibit significant inter-individual variability [15]. CGM, originally developed for diabetes management, is increasingly used in endurance sports to evaluate glucose variability during exercise and recovery. This technology allows athletes to monitor glucose levels and responses to food intake and exercise [15,83]. Associations between glucose levels during exercise and performance remain inconclusive [65,68], although one study found a positive correlation between moderate glucose increases and running speeds [63]. Moreover, while CGM data generally align with capillary and venous blood glucose measurements [66,70], some studies report increased measurement bias during exercise [67]. CGM technology offers valuable insights into glucose fluctuations and real-time EA of athletes [15]; however, the extent to which interstitial glucose values reflect physiological disturbances from daily training and fueling or represent an athlete’s adaptive response to training remains to be fully elucidated. Recently established reference ranges for the glycemic variability provide a more robust framework for interpreting CGM data in endurance athletes [69]. Finally, while only CGM met the inclusion criteria for this scoping review within the concept of systems biology in endurance athletes, other wearable technologies and real-time sensors show promise for developing precision sports nutrition strategies and warrant further investigation [16].
4.5. Limitations, Knowledge Gaps and Future Directions
The main limitation of this scoping review is the exclusion of non-published data in the rapidly evolving field of systems biology, which may have restricted the identification of relevant studies. Despite the promise of a systems biology framework to address the complex interactions that elicit an athlete’s metabolic response to nutrition-derived stimuli, significant knowledge gaps persist. These gaps are largely due to the intricate interactions within the biological contexts and the limitations of current bioinformatics tools in interpreting large datasets. Moreover, assessing the impact of dietary nutrient alterations on athletes’ metabolic profiles is further complicated by interactions with non-nutrient signals from environmental exposure [5].
Advancing the application of systems biology in precision sports nutrition for endurance athletes requires a deeper understanding of the underlying mechanisms governing metabolic heterogeneity in response to nutrition and exercise. To achieve this, a comprehensive 360-degree systems biology approach is needed, incorporating the collection of individual-specific data, identification of biomarkers or a distinct “fingerprint” of biomarkers associated with performance, health, and recovery, and the development of predictive biomedical models. This approach should generate evidence-based nutritional strategies while continuously monitoring health and performance outcomes. To drive progress in the field, addressing the following research gaps is warranted:
- Study design: Implement adequately powered RCTs employing replicated crossover designs to elucidate the sources of variability in responses to nutritional interventions. These studies should focus on the diet-by-person interaction by analyzing within-person variance [84].
- In situ research: Bridge the gap between laboratory findings and practical applications by conducting exercise interventions that accurately resemble the physiological demands of endurance sports. Ensure that nutritional strategies, particularly those implemented during exercise, are standardized, feasible, and applicable in real-world settings.
- CGM: Conduct studies with larger cohorts and clearly defined dietary protocols to elucidate the relationships between diet, glucose levels and variability, and their effects on athletic performance, recovery, and health.
- Metagenomics: Initiate large-scale, multi-center shotgun sequencing studies to elucidate the microbiome’s role in athletic performance. Although cost-prohibitive, such studies are crucial for advancing the understanding of gut microbiota and developing tailored nutrition strategies. Additionally, investigate the effects of peri-workout sugar intake on oral health and microbiota, and its implications for long-term health.
- Multi-Omics integration: Employ a comprehensive multi-omics approaches to investigate the direct effects of dietary interventions on recovery and performance, accounting for individual metabolic differences.
- Nutrigenetics: Validate the impact of genetic variations on the effectiveness of nutritional interventions, especially supplements, on sports performance in larger, independent cohorts of athletes.
5. Conclusions and Practical Recommendations for Athletes
Recent advancements in the application of systems biology to tailor dietary recommendations for endurance athletes have supported and extended established sports nutrition guidelines. The integration of multi-omics and wearable technologies presents an opportunity to refine sports nutrition strategies based on athletes’ individual biological profiles. While the evidence on utility and applicability of most data-driven insights remains preliminary, some hold the potential to enhance recovery, performance, and health. However, the lack of established causal relationships between detected biomarkers and relevant outcomes, along with significant inter-individual variability, remains a considerable challenge for precision sports nutrition. Future research should prioritize well-powered, replicated crossover RCTs, comprehensive systems-wide approaches, and validation of genetic impacts on nutritional interventions to further refine dietary guidelines. Based on the current evidence, Table 5 outlines practical recommendations, grounded in current sports nutrition consensus statements and informed by systems biology insights, that can be safely integrated into athletes’ nutrition programs.
Supplementary Materials
The following supporting information can be downloaded at the website of this paper posted on Preprints.org, Table S1: PRISMA-ScR-Checklist; Table S2: Key search terms and search strategy
Author Contributions
Conceptualization, L.B.; methodology, L.B., L.D. and S.T.; visualization, -U.A.; writing—original draft, L.B.; writing—review and editing, L.D., J.Š., M.Č., F.C., L.V. and E.K. All authors have read and agreed to the published version of the manuscript.
Funding
There was no funding for this research project.
Institutional Review Board Statement
Not applicable.
Informed Consent Statement
Not applicable.
Data Availability Statement
All data available upon request.
Acknowledgments
The authors would like to thank Alesija Mevlja and Natalija Sebanc for their valuable contributions to data curation. We also extend our gratitude to Metta Pratt, PhD for her assistance with proof-reading the manuscript.
Conflicts of Interest
L.B., F.C., L.D., M.Č., S.T., J.Š., U.A., L.V. and E.K. are employees of The NU B.V. and may hold shares and stock options in the company.
References
- Pitsiladis, Y.P.; Tanaka, M.; Eynon, N.; Bouchard, C.; North, K.N.; Williams, A.G.; Collins, M.; Moran, C.N.; Britton, S.L.; Fuku, N.; et al. Athlome Project Consortium: A Concerted Effort to Discover Genomic and Other “Omic” Markers of Athletic Performance. Physiol Genomics 2016, 48, 183–190. [Google Scholar] [CrossRef] [PubMed]
- Amawi, A.; AlKasasbeh, W.; Jaradat, M.; Almasri, A.; Alobaidi, S.; Hammad, A.A.; Bishtawi, T.; Fataftah, B.; Turk, N.; Saoud, H. Al; et al. Athletes’ Nutritional Demands: A Narrative Review of Nutritional Requirements. Front Nutr 2024, 10. [Google Scholar] [CrossRef] [PubMed]
- Thomas, D.T.; Erdman, K.A.; Burke, L.M. American College of Sports Medicine Joint Position Statement. Nutrition and Athletic Performance. Med Sci Sports Exerc 2016, 48, 543–568. [Google Scholar] [CrossRef]
- Jeukendrup, A.E. Nutrition for Endurance Sports: Marathon, Triathlon, and Road Cycling. J Sports Sci 2011, 29 Suppl 1. [CrossRef]
- Nieman, D.C. Multiomics Approach to Precision Sports Nutrition: Limits, Challenges, and Possibilities. Front Nutr 2021, 8. [Google Scholar] [CrossRef] [PubMed]
- van Ommen, B.; van den Broek, T.; de Hoogh, I.; van Erk, M.; van Someren, E.; Rouhani-Rankouhi, T.; Anthony, J.C.; Hogenelst, K.; Pasman, W.; Boorsma, A.; et al. Systems Biology of Personalized Nutrition. Nutr Rev 2017, 75, 579–599. [Google Scholar] [CrossRef]
- Bouchard, C.; Ordovas, J.M. Fundamentals of Nutrigenetics and Nutrigenomics. Prog Mol Biol Transl Sci 2012, 108, 1–15. [Google Scholar] [CrossRef]
- Dong, Z.C.; Chen, Y. Transcriptomics: Advances and Approaches. Sci China Life Sci 2013, 56, 960–967. [Google Scholar] [CrossRef]
- Wang, K.C.; Chang, H.Y. Epigenomics—Technologies and Applications. Circ Res 2018, 122, 1191. [Google Scholar] [CrossRef]
- Sobsey, C.A.; Ibrahim, S.; Richard, V.R.; Gaspar, V.; Mitsa, G.; Lacasse, V.; Zahedi, R.P.; Batist, G.; Borchers, C.H. Targeted and Untargeted Proteomics Approaches in Biomarker Development. Proteomics 2020, 20. [Google Scholar] [CrossRef]
- McGhie, T.K.; Rowan, D.D. Metabolomics for Measuring Phytochemicals, and Assessing Human and Animal Responses to Phytochemicals, in Food Science. Mol Nutr Food Res 2012, 56, 147–158. [Google Scholar] [CrossRef]
- Zivkovic, A.M.; German, J.B. Metabolomics for Assessment of Nutritional Status. Curr Opin Clin Nutr Metab Care 2009, 12, 501–507. [Google Scholar] [CrossRef] [PubMed]
- Yang, K.; Han, X. Lipidomics: Techniques, Applications, and Outcomes Related to Biomedical Sciences. Trends Biochem Sci 2016, 41, 954–969. [Google Scholar] [CrossRef] [PubMed]
- Fontana, F.; Longhi, G.; Tarracchini, C.; Mancabelli, L.; Lugli, G.A.; Alessandri, G.; Turroni, F.; Milani, C.; Ventura, M. The Human Gut Microbiome of Athletes: Metagenomic and Metabolic Insights. Microbiome 2023, 11. [Google Scholar] [CrossRef]
- Bowler, A.L.; Whitfield, J.; Marshall, L.; Coffey, V.G.; Burke, L.M.; Cox, G.R. The Use of Continuous Glucose Monitors in Sport: Possible Applications and Considerations. Int J Sport Nutr Exerc Metab 2022, 33, 121–132. [Google Scholar] [CrossRef] [PubMed]
- Muniz-Pardos, B; Angeloudis, K. ; Guppy F.M.; Keramitsoglou, I.; Sutehall, S.; Bosch A.; Tanisawa, K.; Hosokawa, Y.; Ash, G.I.; Schobersberer W.; et al. Wearable and Telemedicine Innovations for Olympic Events and Elite Sport. J Sports Med Phys Fitness 2021, 61, 1061–1072. [Google Scholar] [CrossRef]
- Mitchelson, K.A.J.; Ni Chathail, M.B.; Roche, H.M. Systems Biology Approaches to Inform Precision Nutrition. Proc Nutr Soc 2023, 82. [Google Scholar] [CrossRef]
- Ritson, A.J.; Hearris, M.A.; Bannock, L.G. Bridging the Gap: Evidence-Based Practice Guidelines for Sports Nutritionists. Front Nutr 2023, 10. [Google Scholar] [CrossRef]
- Jonvik, K.L.; King, M.; Rollo, I.; Stellingwerff, T.; Pitsiladis, Y. New Opportunities to Advance the Field of Sports Nutrition. Front Sports Act Living 2022, 4. [Google Scholar] [CrossRef]
- Mak, S.; Thomas, A. Steps for Conducting a Scoping Review. J Grad Med Educ 2022, 14, 565. [Google Scholar] [CrossRef]
- Tricco, A.C.; Lillie, E.; Zarin, W.; O’Brien, K.K.; Colquhoun, H.; Levac, D.; Moher, D.; Peters, M.D.J.; Horsley, T.; Weeks, L.; et al. PRISMA Extension for Scoping Reviews (PRISMA-ScR): Checklist and Explanation. Ann Intern Med 2018, 169, 467–473. [Google Scholar] [CrossRef]
- Peters, M.D.J.; Godfrey, C.; McInerney, P.; Munn, Z.; Tricco, A.C.; Khalil, H. Scoping Reviews. In JBI Manual for Evidence Synthesis; Aromataris, E., Lockwood, C., Porritt, K., Pilla, B., Jordan, Z., Eds.; JBI. 2020. [Google Scholar] [CrossRef]
- Page, M.J.; McKenzie, J.E.; Bossuyt, P.M.; Boutron, I.; Hoffmann, T.C.; Mulrow, C.D.; Shamseer, L.; Tetzlaff, J.M.; Akl, E.A.; Brennan, S.E.; et al. The PRISMA 2020 Statement: An Updated Guideline for Reporting Systematic Reviews. BMJ 2021, 372. [Google Scholar] [CrossRef]
- Miranda-Vilela, A.L.; Akimoto, A.K.; Alves, P.C.; Pereira, L.C.; Gonçalves, C.A.; Klautau-Guimarães, M.N.; Grisolia, C.K. Dietary Carotenoid-Rich Pequi Oil Reduces Plasma Lipid Peroxidation and DNA Damage in Runners and Evidence for an Association with MnSOD Genetic Variant -Val9Ala. Genet Mol Res 2009, 8, 1481–1495. [Google Scholar] [CrossRef] [PubMed]
- Miranda-Vilela, A.L.; Akimoto, A.K.; Alves, P.C.Z.; Pereira, L.C.S.; Klautau-Guimarães, M.N.; Grisolia, C.K. Dietary Carotenoid-Rich Oil Supplementation Improves Exercise-Induced Anisocytosis in Runners: Influences of Haptoglobin, MnSOD (Val9Ala), CAT (21A/T) and GPX1 (Pro198Leu) Gene Polymorphisms in Dilutional Pseudoanemia (Sports Anemia). Genet Mol Biol 2010, 33, 359–367. [Google Scholar] [CrossRef] [PubMed]
- Miranda-Vilela, A.L.; Lordelo, G.S.; Akimoto, A.K.; Alves, P.C.Z.; Pereira, L.C.D.S.; Klautau-Guimarães, M.D.N.; Grisolia, C.K. Genetic Polymorphisms Influence Runners’ Responses to the Dietary Ingestion of Antioxidant Supplementation Based on Pequi Oil (Caryocar Brasiliense Camb.): A before-after Study. Genes Nutr 2011, 6, 369–395. [Google Scholar] [CrossRef]
- Miranda-Vilel, A.L.; Ribeiro, I.F.; Grisolia, C.K. Association between Interleukin 6 -174 G/C Promoter Gene Polymorphism and Runners’ Responses to the Dietary Ingestion of Antioxidant Supplementation Based on Pequi (Caryocar Brasiliense Camb.) Oil: A before-after Study. Genet Mol Biol 2016, 39, 554–566. [Google Scholar] [CrossRef]
- Womack, C.J.; Saunders, M.J.; Bechtel, M.K.; Bolton, D.J.; Martin, M.; Luden, N.D.; Dunham, W.; Hancock, M. The Influence of a CYP1A2 Polymorphism on the Ergogenic Effects of Caffeine. J Int Soc Sports Nutr 2012, 9. [Google Scholar] [CrossRef]
- Ribeiro, I.F.; Miranda-Vilela, A.L.; Klautau-Guimarães, M.D.N.; Grisolia, C.K. The Influence of Erythropoietin (EPO T → G) and α-Actinin-3 (ACTN3 R577X) Polymorphisms on Runners’ Responses to the Dietary Ingestion of Antioxidant Supplementation Based on Pequi Oil (Caryocar Brasiliense Camb.): A before-after Study. J Nutrigenet Nutrigenomics 2013, 6, 283–304. [Google Scholar] [CrossRef]
- Pataky, M.W.; Womack, C.J.; Saunders, M.J.; Goffe, J.L.; D’Lugos, A.C.; El-Sohemy, A.; Luden, N.D. Caffeine and 3-Km Cycling Performance: Effects of Mouth Rinsing, Genotype, and Time of Day. Scand J Med Sci Sports 2016, 26, 613–619. [Google Scholar] [CrossRef]
- Guest, N.; Corey, P.; Vescovi, J.; El-Sohemy, A. Caffeine, CYP1A2 Genotype, and Endurance Performance in Athletes. Med Sci Sports Exerc 2018, 50, 1570–1578. [Google Scholar] [CrossRef]
- Carswell, A.T.; Howland, K.; Martinez-Gonzalez, B.; Baron, P.; Davison, G. The Effect of Caffeine on Cognitive Performance Is Influenced by CYP1A2 but Not ADORA2A Genotype, yet Neither Genotype Affects Exercise Performance in Healthy Adults. Eur J Appl Physiol 2020, 120, 1495–1508. [Google Scholar] [CrossRef]
- Guest, N.S.; Corey, P.; Tyrrell, P.N.; El-Sohemy, A. Effect of Caffeine on Endurance Performance in Athletes May Depend on HTR2A and CYP1A2 Genotypes. J Strength Cond Res 2022, 36, 2486–2492. [Google Scholar] [CrossRef] [PubMed]
- Chorell, E.; Moritz, T.; Branth, S.; Antti, H.; Svensson, M.B. Predictive Metabolomics Evaluation of Nutrition-Modulated Metabolic Stress Responses in Human Blood Serum during the Early Recovery Phase of Strenuous Physical Exercise. J Proteome Res 2009, 8, 2966–2977. [Google Scholar] [CrossRef]
- Nelson, A.R.; Phillips, S.M.; Stellingwerff, T.; Rezzi, S.; Bruce, S.J.; Breton, I.; Thorimbert, A.; Guy, P.A.; Clarke, J.; Broadbent, S.; et al. A Protein-Leucine Supplement Increases Branched-Chain Amino Acid and Nitrogen Turnover but Not Performance. Med Sci Sports Exerc 2012, 44, 57–68. [Google Scholar] [CrossRef] [PubMed]
- Nelson, A.R.; Jackson, L.; Clarke, J.; Stellingwerff, T.; Broadbent, S.; Rowlands, D.S. Effect of Post-Exercise Protein-Leucine Feeding on Neutrophil Function, Immunomodulatory Plasma Metabolites and Cortisol during a 6-Day Block of Intense Cycling. Eur J Appl Physiol 2013, 113, 2211–2222. [Google Scholar] [CrossRef] [PubMed]
- Nieman, D.C.; Gillitt, N.D.; Henson, D.A.; Sha, W.; Shanely, R.A.; Knab, A.M.; Cialdella-Kam, L.; Jin, F. Bananas as an Energy Source during Exercise: A Metabolomics Approach. PLoS One 2012, 7. [Google Scholar] [CrossRef] [PubMed]
- Nieman, D.C.; Gillitt, N.D.; Knab, A.M.; Shanely, R.A.; Pappan, K.L.; Jin, F.; Lila, M.A. Influence of a Polyphenol-Enriched Protein Powder on Exercise-Induced Inflammation and Oxidative Stress in Athletes: A Randomized Trial Using a Metabolomics Approach. PLoS One 2013, 8. [Google Scholar] [CrossRef]
- Nieman, D.C.; Scherr, J.; Luo, B.; Meaney, M.P.; Dréau, D.; Sha, W.; Dew, D.A.; Henson, D.A.; Pappan, K.L. Influence of Pistachios on Performance and Exercise-Induced Inflammation, Oxidative Stress, Immune Dysfunction, and Metabolite Shifts in Cyclists: A Randomized, Crossover Trial. PLoS One 2014, 9. [Google Scholar] [CrossRef]
- Nieman, D.C.; Gillitt, N.D.; Sha, W.; Meaney, M.P.; John, C.; Pappan, K.L.; Kinchen, J.M. Metabolomics-Based Analysis of Banana and Pear Ingestion on Exercise Performance and Recovery. J Proteome Res 2015, 14, 5367–5377. [Google Scholar] [CrossRef]
- Olsen, T.; Sollie, O.; Nurk, E.; Turner, C.; Jernerén, F.; Ivy, J.L.; Vinknes, K.J.; Clauss, M.; Refsum, H.; Jensen, J. Exhaustive Exercise and Post-Exercise Protein Plus Carbohydrate Supplementation Affect Plasma and Urine Concentrations of Sulfur Amino Acids, the Ratio of Methionine to Homocysteine and Glutathione in Elite Male Cyclists. Front Physiol 2020, 11. [Google Scholar] [CrossRef]
- Stander, Z.; Luies, L.; van Reenen, M.; Howatson, G.; Keane, K.M.; Clifford, T.; Stevenson, E.J.; Loots, D.T. Beetroot Juice—a Suitable Post-Marathon Metabolic Recovery Supplement? J Int Soc Sports Nutr 2021, 18. [Google Scholar] [CrossRef]
- Jin, A.; Kan, Z.; Tan, Q.; Shao, J.; Han, Q.; Chang, Y.; An, N.; Yi, M. Supplementation with Food-Derived Oligopeptides Promotes Lipid Metabolism in Young Male Cyclists: A Randomized Controlled Crossover Trial. J Int Soc Sports Nutr 2023, 20. [Google Scholar] [CrossRef] [PubMed]
- Li, T.; Rui, Z.; Mao, L.; Chang, Y.; Shao, J.; Chen, Y.; Han, Q.; Sui, X.; An, N.; Li, H.; et al. Eight Weeks of Bifidobacterium Lactis BL-99 Supplementation Improves Lipid Metabolism and Sports Performance through Short-Chain Fatty Acids in Cross-Country Skiers: A Preliminary Study. Nutrients 2023, 15. [Google Scholar] [CrossRef] [PubMed]
- Jeppesen, J.S.; Caldwell, H.G.; Lossius, L.O.; Melin, A.K.; Gliemann, L.; Bangsbo, J.; Hellsten, Y. Low Energy Availability Increases Immune Cell Formation of Reactive Oxygen Species and Impairs Exercise Performance in Female Endurance Athletes. Redox Biol 2024, 75. [Google Scholar] [CrossRef]
- Gorski, P.P.; Turner, D.C.; Iraki, J.; Morton, J.P.; Sharples, A.P.; Areta, J.L. Human Skeletal Muscle Methylome after Low-Carbohydrate Energy-Balanced Exercise. Am J Physiol Endocrinol Metab 2023, 324, E437–E448. [Google Scholar] [CrossRef] [PubMed]
- Nieman, D.C.; Gillitt, N.D.; Chen, G.Y.; Zhang, Q.; Sakaguchi, C.A.; Stephan, E.H. Carbohydrate Intake Attenuates Post-Exercise Plasma Levels of Cytochrome P450-Generated Oxylipins. PLoS One 2019, 14. [Google Scholar] [CrossRef] [PubMed]
- Nieman, D.C.; Gillitt, N.D.; Sha, W.; Esposito, D.; Ramamoorthy, S. Metabolic Recovery from Heavy Exertion Following Banana Compared to Sugar Beverage or Water Only Ingestion: A Randomized, Crossover Trial. PLoS One 2018, 13. [Google Scholar] [CrossRef]
- Nieman, D.C.; Gillitt, N.D.; Sha, W. Identification of a Select Metabolite Panel for Measuring Metabolic Perturbation in Response to Heavy Exertion. Metabolomics 2018, 14. [Google Scholar] [CrossRef]
- Nieman, D.C.; Gillitt, N.D.; Chen, G.Y.; Zhang, Q.; Sha, W.; Kay, C.D.; Chandra, P.; Kay, K.L.; Lila, M.A. Blueberry and/or Banana Consumption Mitigate Arachidonic, Cytochrome P450 Oxylipin Generation During Recovery From 75-Km Cycling: A Randomized Trial. Front Nutr 2020, 7. [Google Scholar] [CrossRef]
- Nieman, D.C.; Woo, J.; Sakaguchi, C.A.; Omar, A.M.; Tang, Y.; Davis, K.; Pecorelli, A.; Valacchi, G.; Zhang, Q. Astaxanthin Supplementation Counters Exercise-Induced Decreases in Immune-Related Plasma Proteins. Front Nutr 2023, 10. [Google Scholar] [CrossRef]
- Nieman, D.C.; Sakaguchi, C.A.; Williams, J.C.; Mulani, F.A.; Shivprasad Suresh, P.; Omar, A.M.; Zhang, Q. Beet Supplementation Mitigates Post-Exercise Inflammation. Front Nutr 2024, 11. [Google Scholar] [CrossRef]
- Sakaguchi, C.A.; Nieman, D.C.; Omar, A.M.; Strauch, R.C.; Williams, J.C.; Lila, M.A.; Zhang, Q. Influence of 2 Weeks of Mango Ingestion on Inflammation Resolution after Vigorous Exercise. Nutrients 2024, 16, 36. [Google Scholar] [CrossRef] [PubMed]
- Moreno-Pérez, D.; Bressa, C.; Bailén, M.; Hamed-Bousdar, S.; Naclerio, F.; Carmona, M.; Pérez, M.; González-Soltero, R.; Montalvo-Lominchar, M.G.; Carabaña, C.; et al. Effect of a Protein Supplement on the Gut Microbiota of Endurance Athletes: A Randomized, Controlled, Double-Blind Pilot Study. Nutrients 2018, 10. [Google Scholar] [CrossRef] [PubMed]
- Murtaza, N.; Burke, L.M.; Vlahovich, N.; Charlesson, B.; O’ Neill, H.; Ross, M.L.; Campbell, K.L.; Krause, L.; Morrison, M. The Effects of Dietary Pattern during Intensified Training on Stool Microbiota of Elite Race Walkers. Nutrients 2019, 11. [Google Scholar] [CrossRef]
- Murtaza, N.; Burke, L.M.; Vlahovich, N.; Charlesson, B.; O’neill, H.M.; Ross, M.L.; Campbell, K.L.; Krause, L.; Morrison, M. Analysis of the Effects of Dietary Pattern on the Oral Microbiome of Elite Endurance Athletes. Nutrients 2019, 11. [Google Scholar] [CrossRef] [PubMed]
- Huang, W.C.; Pan, C.H.; Wei, C.C.; Huang, H.Y. Lactobacillus Plantarum PS128 Improves Physiological Adaptation and Performance in Triathletes through Gut Microbiota Modulation. Nutrients 2020, 12, 1–15. [Google Scholar] [CrossRef] [PubMed]
- Lin, C.L.; Hsu, Y.J.; Ho, H.H.; Chang, Y.C.; Kuo, Y.W.; Yeh, Y.T.; Tsai, S.Y.; Chen, C.W.; Chen, J.F.; Huang, C.C.; et al. Bifidobacterium Longum Subsp. Longum OLP-01 Supplementation during Endurance Running Training Improves Exercise Performance in Middle- and Long-Distance Runners: A Double-Blind Controlled Trial. Nutrients 2020, 12, 1–14. [Google Scholar] [CrossRef]
- Jaago, M.; Timmusk, U.S.; Timmusk, T.; Palm, K. Drastic Effects on the Microbiome of a Young Rower Engaged in High-Endurance Exercise After a Month Usage of a Dietary Fiber Supplement. Front Nutr 2021, 8. [Google Scholar] [CrossRef]
- Gross, K.; Santiago, M.; Krieger, J.M.; Hagele, A.M.; Zielinska, K.; Scheiman, J.; Jäger, R.; Kostic, A.; Kerksick, C.M. Impact of Probiotic Veillonella Atypica FB0054 Supplementation on Anaerobic Capacity and Lactate. iScience 2023, 27. [Google Scholar] [CrossRef]
- Li, X.; Lin, Y.; Chen, Y.; Sui, H.; Chen, J.; Li, J.; Zhang, G.; Yan, Y. The Effects of Race and Probiotic Supplementation on the Intestinal Microbiota of 10-Km Open-Water Swimmers. Heliyon 2023, 9. [Google Scholar] [CrossRef]
- Yardley, J.E.; Zaharieva, D.P.; Jarvis, C.; Riddell, M.C. The “Ups” and “Downs” of a Bike Race in People with Type 1 Diabetes: Dramatic Differences in Strategies and Blood Glucose Responses in the Paris-to-Ancaster Spring Classic. Can J Diabetes 2015, 39, 105–110. [Google Scholar] [CrossRef]
- Ishihara, K.; Uchiyama, N.; Kizaki, S.; Mori, E.; Nonaka, T.; Oneda, H. Application of Continuous Glucose Monitoring for Assessment of Individual Carbohydrate Requirement during Ultramarathon Race. Nutrients 2020, 12. [Google Scholar] [CrossRef] [PubMed]
- Ishihara, K.; Inamura, N.; Tani, A.; Shima, D.; Kuramochi, A.; Nonaka, T.; Oneda, H.; Nakamura, Y. Contribution of Solid Food to Achieve Individual Nutritional Requirement during a Continuous 438 Km Mountain Ultramarathon in Female Athlete. Int J Environ Res Public Health 2021, 18. [Google Scholar] [CrossRef] [PubMed]
- Kinrade, E.J.; Galloway, S.D.R. Dietary Observations of Ultra-Endurance Runners in Preparation for and During a Continuous 24-h Event. Front Physiol 2021, 12. [Google Scholar] [CrossRef] [PubMed]
- Kulawiec, D.G.; Zhou, T.; Knopp, J.L.; Chase, J.G. Continuous Glucose Monitoring to Measure Metabolic Impact and Recovery in Sub-Elite Endurance Athletes. Biomed Signal Process Control 2021, 70, 103059. [Google Scholar] [CrossRef]
- Clavel, P.; Tiollier, E.; Leduc, C.; Fabre, M.; Lacome, M.; Buchheit, M. Concurrent Validity of a Continuous Glucose-Monitoring System at Rest and During and Following a High-Intensity Interval Training Session. Int J Sports Physiol Perform 2022, 17, 627–633. [Google Scholar] [CrossRef]
- Takayama, F.; Mori, H. The Relationship between 24 h Ultramarathon Performance and the “Big Three” Strategies of Training, Nutrition, and Pacing. Sports (Basel) 2022, 10. [Google Scholar] [CrossRef]
- Bowler, A.L.M.; Burke, L.M.; Coffey, V.G.; Cox, G.R. Day-to-Day Glycemic Variability Using Continuous Glucose Monitors in Endurance Athletes. J Diabetes Sci Technol 2024. [CrossRef]
- Parent, C.; Mauvieux, B.; Lespagnol, E.; Hingrand, C.; Vauthier, J.C.; Noirez, P.; Hurdiel, R.; Martinet, Q.; Delaunay, P.L.; Besnard, S.; et al. Glycaemic Effects of a 156-Km Ultra-Trail Race in Athletes: An Observational Field Study. Sports Med 2024, 54. [Google Scholar] [CrossRef]
- Gomez-Cabrera, M.C.; Domenech, E.; Viña, J. Moderate Exercise Is an Antioxidant: Upregulation of Antioxidant Genes by Training. Free Radic Biol Med 2008, 44, 126–131. [Google Scholar] [CrossRef]
- Auton, A.; Abecasis, G.R.; Altshuler, D.M.; Durbin, R.M.; Bentley, D.R.; Chakravarti, A.; Clark, A.G.; Donnelly, P.; Eichler, E.E.; Flicek, P.; et al. A Global Reference for Human Genetic Variation. Nature 2015, 526, 68–74. [Google Scholar] [CrossRef]
- Martín-Rodríguez, A.; Belinchón-deMiguel, P.; Rubio-Zarapuz, A.; Tornero-Aguilera, J.F.; Martínez-Guardado, I.; Villanueva-Tobaldo, C.V.; Clemente-Suárez, V.J. Advances in Understanding the Interplay between Dietary Practices, Body Composition, and Sports Performance in Athletes. Nutrients 2024, 16. [Google Scholar] [CrossRef] [PubMed]
- Guest, N.S.; Horne, J.; Vanderhout, S.M.; El-Sohemy, A. Sport Nutrigenomics: Personalized Nutrition for Athletic Performance. Front Nutr 2019, 6. [Google Scholar] [CrossRef] [PubMed]
- Tanisawa, K.; Wang, G.; Seto, J.; Verdouka, I.; Twycross-Lewis, R.; Karanikolou, A.; Tanaka, M.; Borjesson, M.; Di Luigi, L.; Dohi, M.; et al. Sport and Exercise Genomics: The FIMS 2019 Consensus Statement Update. Br J Sports Med 2020, 54, 969–975. [Google Scholar] [CrossRef] [PubMed]
- Furrer, R.; Hawley, J.A.; Handschin, C. The Molecular Athlete: Exercise Physiology from Mechanisms to Medals. Physiol Rev 2023, 103, 1693–1787. [Google Scholar] [CrossRef] [PubMed]
- Sellami, M.; Elrayess, M.A.; Puce, L.; Bragazzi, N.L. Molecular Big Data in Sports Sciences: State-of-Art and Future Prospects of OMICS-Based Sports Sciences. Front Mol Biosci 2022, 8. [Google Scholar] [CrossRef]
- van der Zwaard, S.; Brocherie, F.; Jaspers, R.T. Under the Hood: Skeletal Muscle Determinants of Endurance Performance. Front Sports Act Living 2021, 3. [Google Scholar] [CrossRef]
- Contrepois, K.; Wu, S.; Moneghetti, K.J.; Hornburg, D.; Ahadi, S.; Tsai, M.S.; Metwally, A.A.; Wei, E.; Lee-McMullen, B.; Quijada, J. V.; et al. Molecular Choreography of Acute Exercise. Cell 2020, 181, 1112–1130e16. [Google Scholar] [CrossRef]
- Sakaguchi, C.A.; Nieman, D.C.; Signini, E.F.; Abreu, R.M.; Catai, A.M. Metabolomics-Based Studies Assessing Exercise-Induced Alterations of the Human Metabolome: A Systematic Review. Metabolites 2019, 9. [Google Scholar] [CrossRef]
- Merry, T.L.; Ristow, M. Do Antioxidant Supplements Interfere with Skeletal Muscle Adaptation to Exercise Training? J Physiol 2016, 594, 5135–5147. [Google Scholar] [CrossRef]
- Mohr, A.E.; Jäger, R.; Carpenter, K.C.; Kerksick, C.M.; Purpura, M.; Townsend, J.R.; West, N.P.; Black, K.; Gleeson, M.; Pyne, D.B.; et al. The Athletic Gut Microbiota. J Int Soc Sports Nutr 2020, 17. [Google Scholar] [CrossRef]
- Flockhart, M.; Larsen, F.J. Continuous Glucose Monitoring in Endurance Athletes: Interpretation and Relevance of Measurements for Improving Performance and Health. Sports Med 2024, 54, 247–255. [Google Scholar] [CrossRef] [PubMed]
- Senn, S. Mastering Variation: Variance Components and Personalised Medicine. Stat Med 2016, 35, 966–977. [Google Scholar] [CrossRef] [PubMed]
- Maughan, R.J.; Burke, L.M.; Dvorak, J.; Larson-Meyer, D.E.; Peeling, P.; Phillips, S.M.; Rawson, E.S.; Walsh, N.P.; Garthe, I.; Geyer, H.; et al. IOC Consensus Statement: Dietary Supplements and the High-Performance Athlete. Br J Sports Med 2018, 52, 439–455. [Google Scholar] [CrossRef] [PubMed]
Figure 1.
PRISMA flow diagram [23].
Figure 1.
PRISMA flow diagram [23].
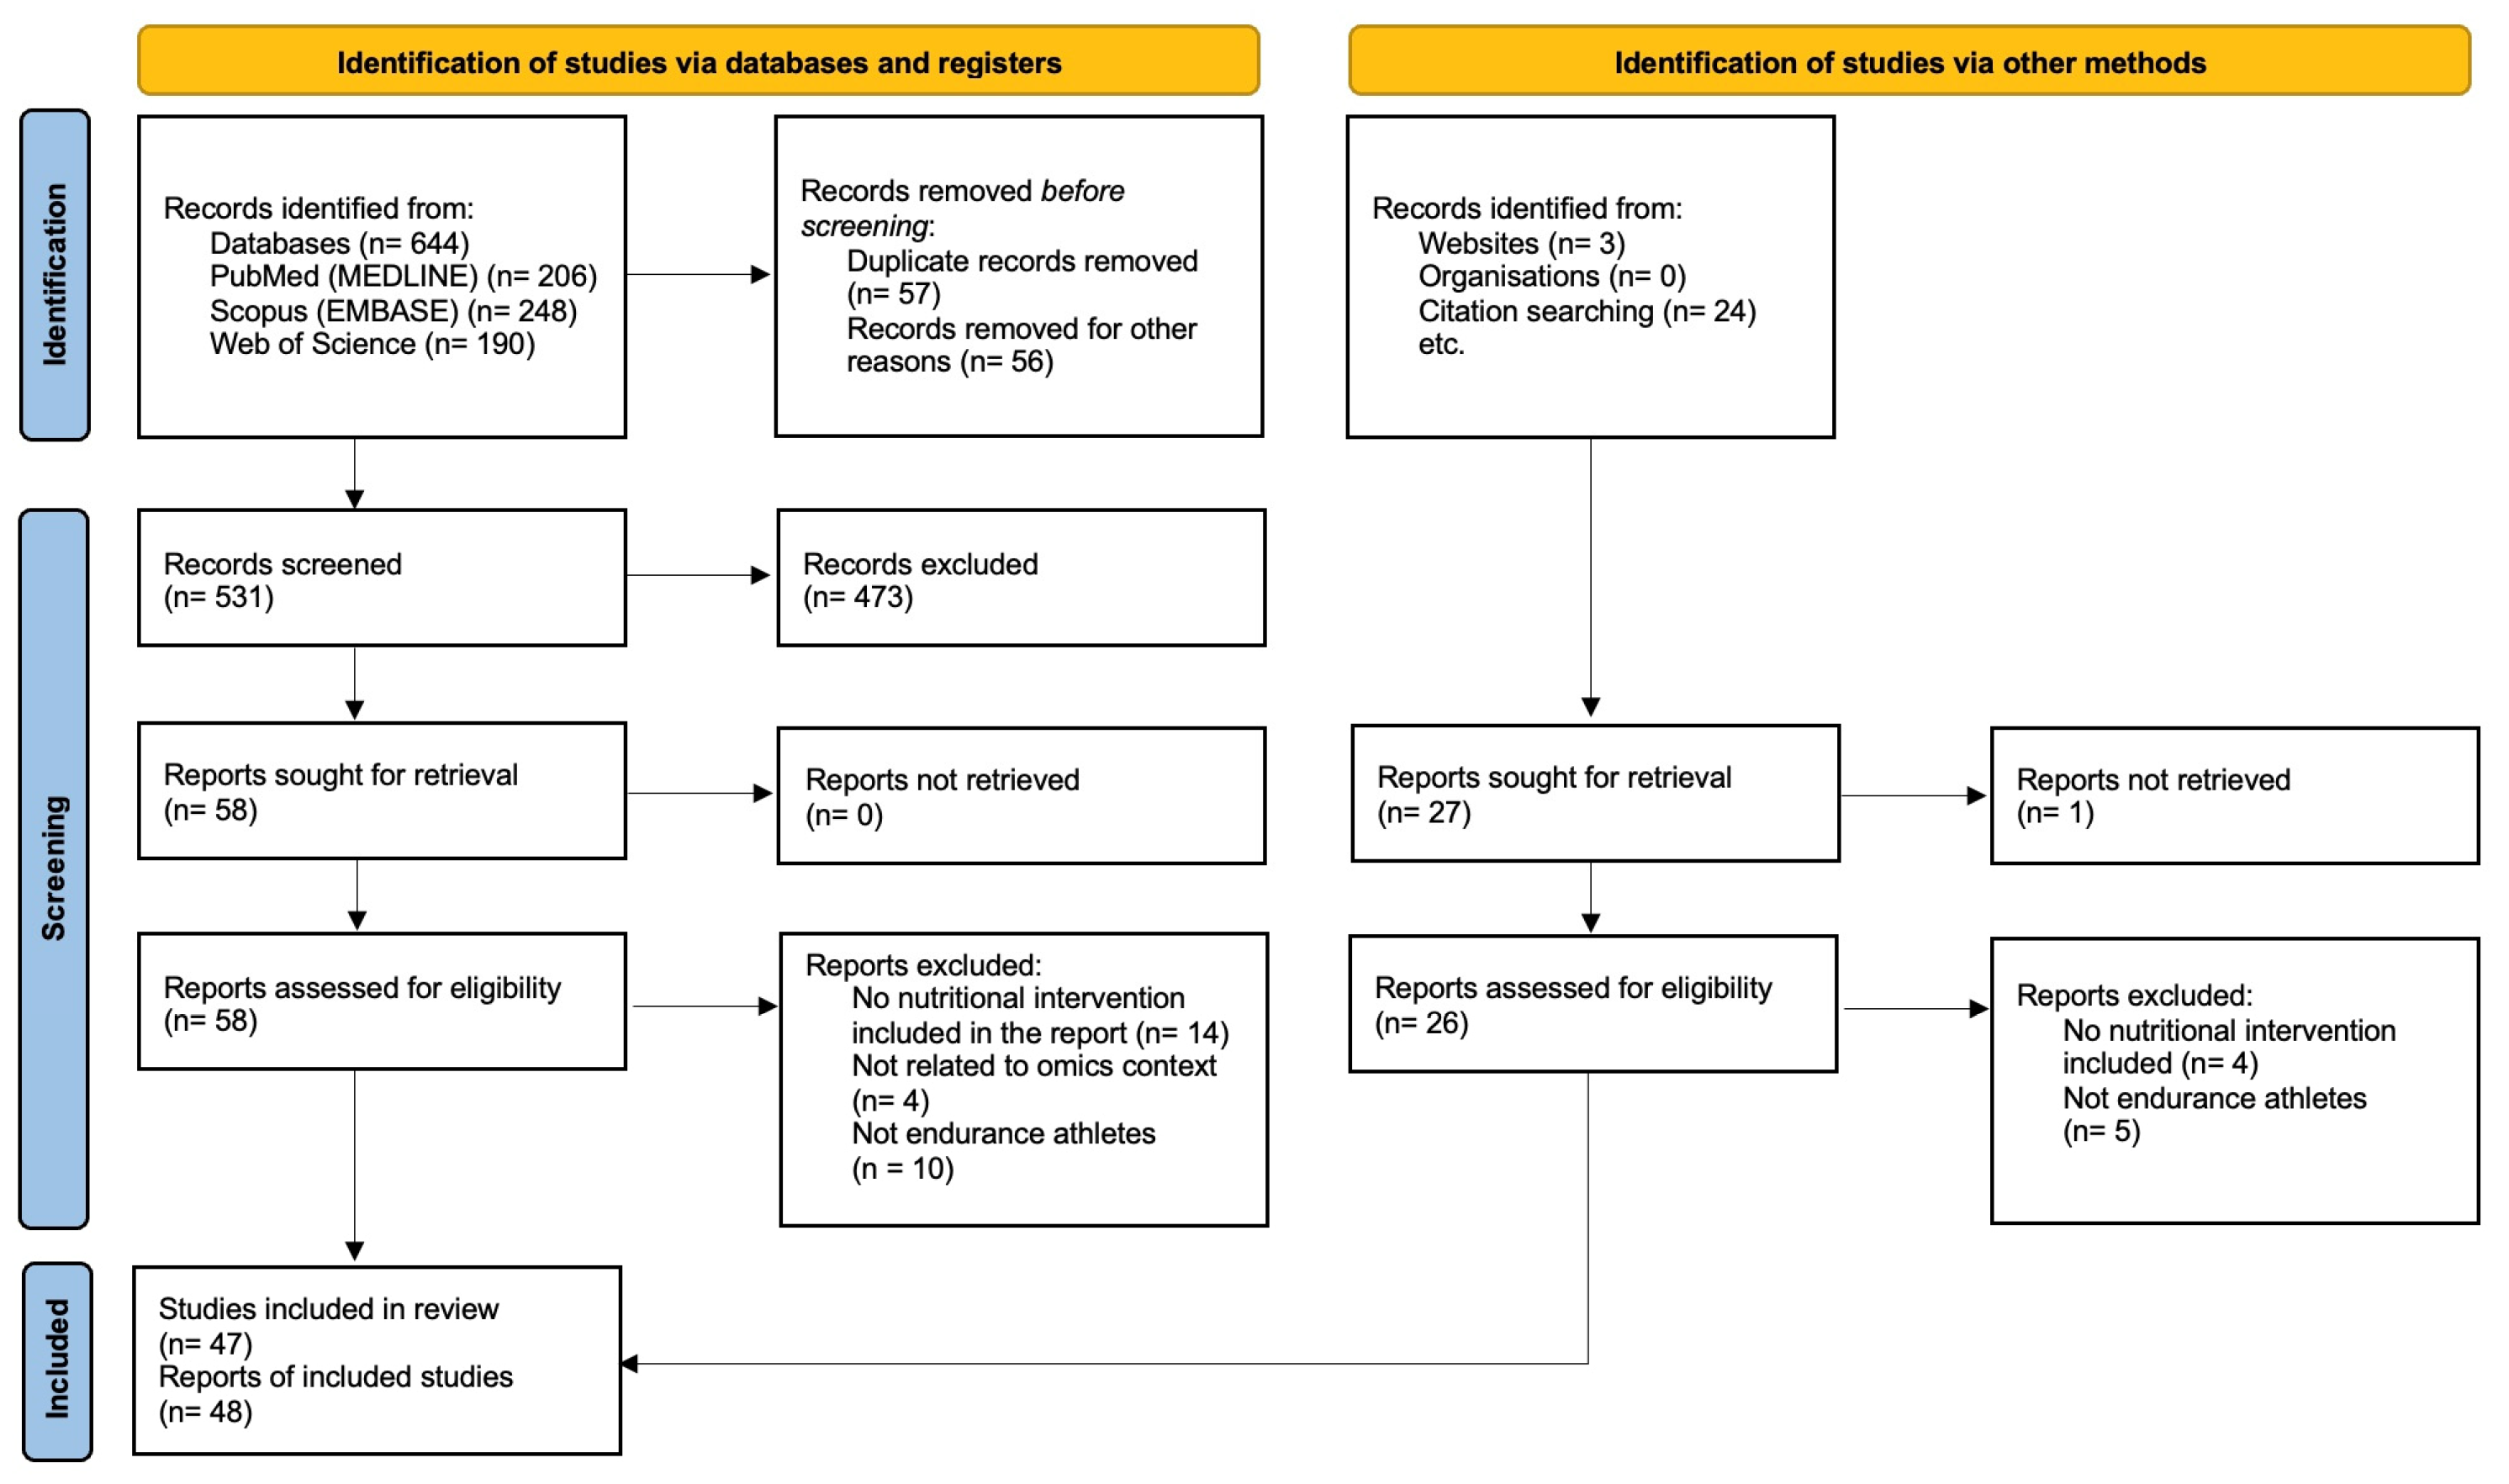
Figure 2.
Number of studies identified across individual ‘omics’ or wearables platforms, stratified by: (a) randomized controlled trials (RCTs) versus other study designs; (b) type of endurance sport studied.
Figure 2.
Number of studies identified across individual ‘omics’ or wearables platforms, stratified by: (a) randomized controlled trials (RCTs) versus other study designs; (b) type of endurance sport studied.
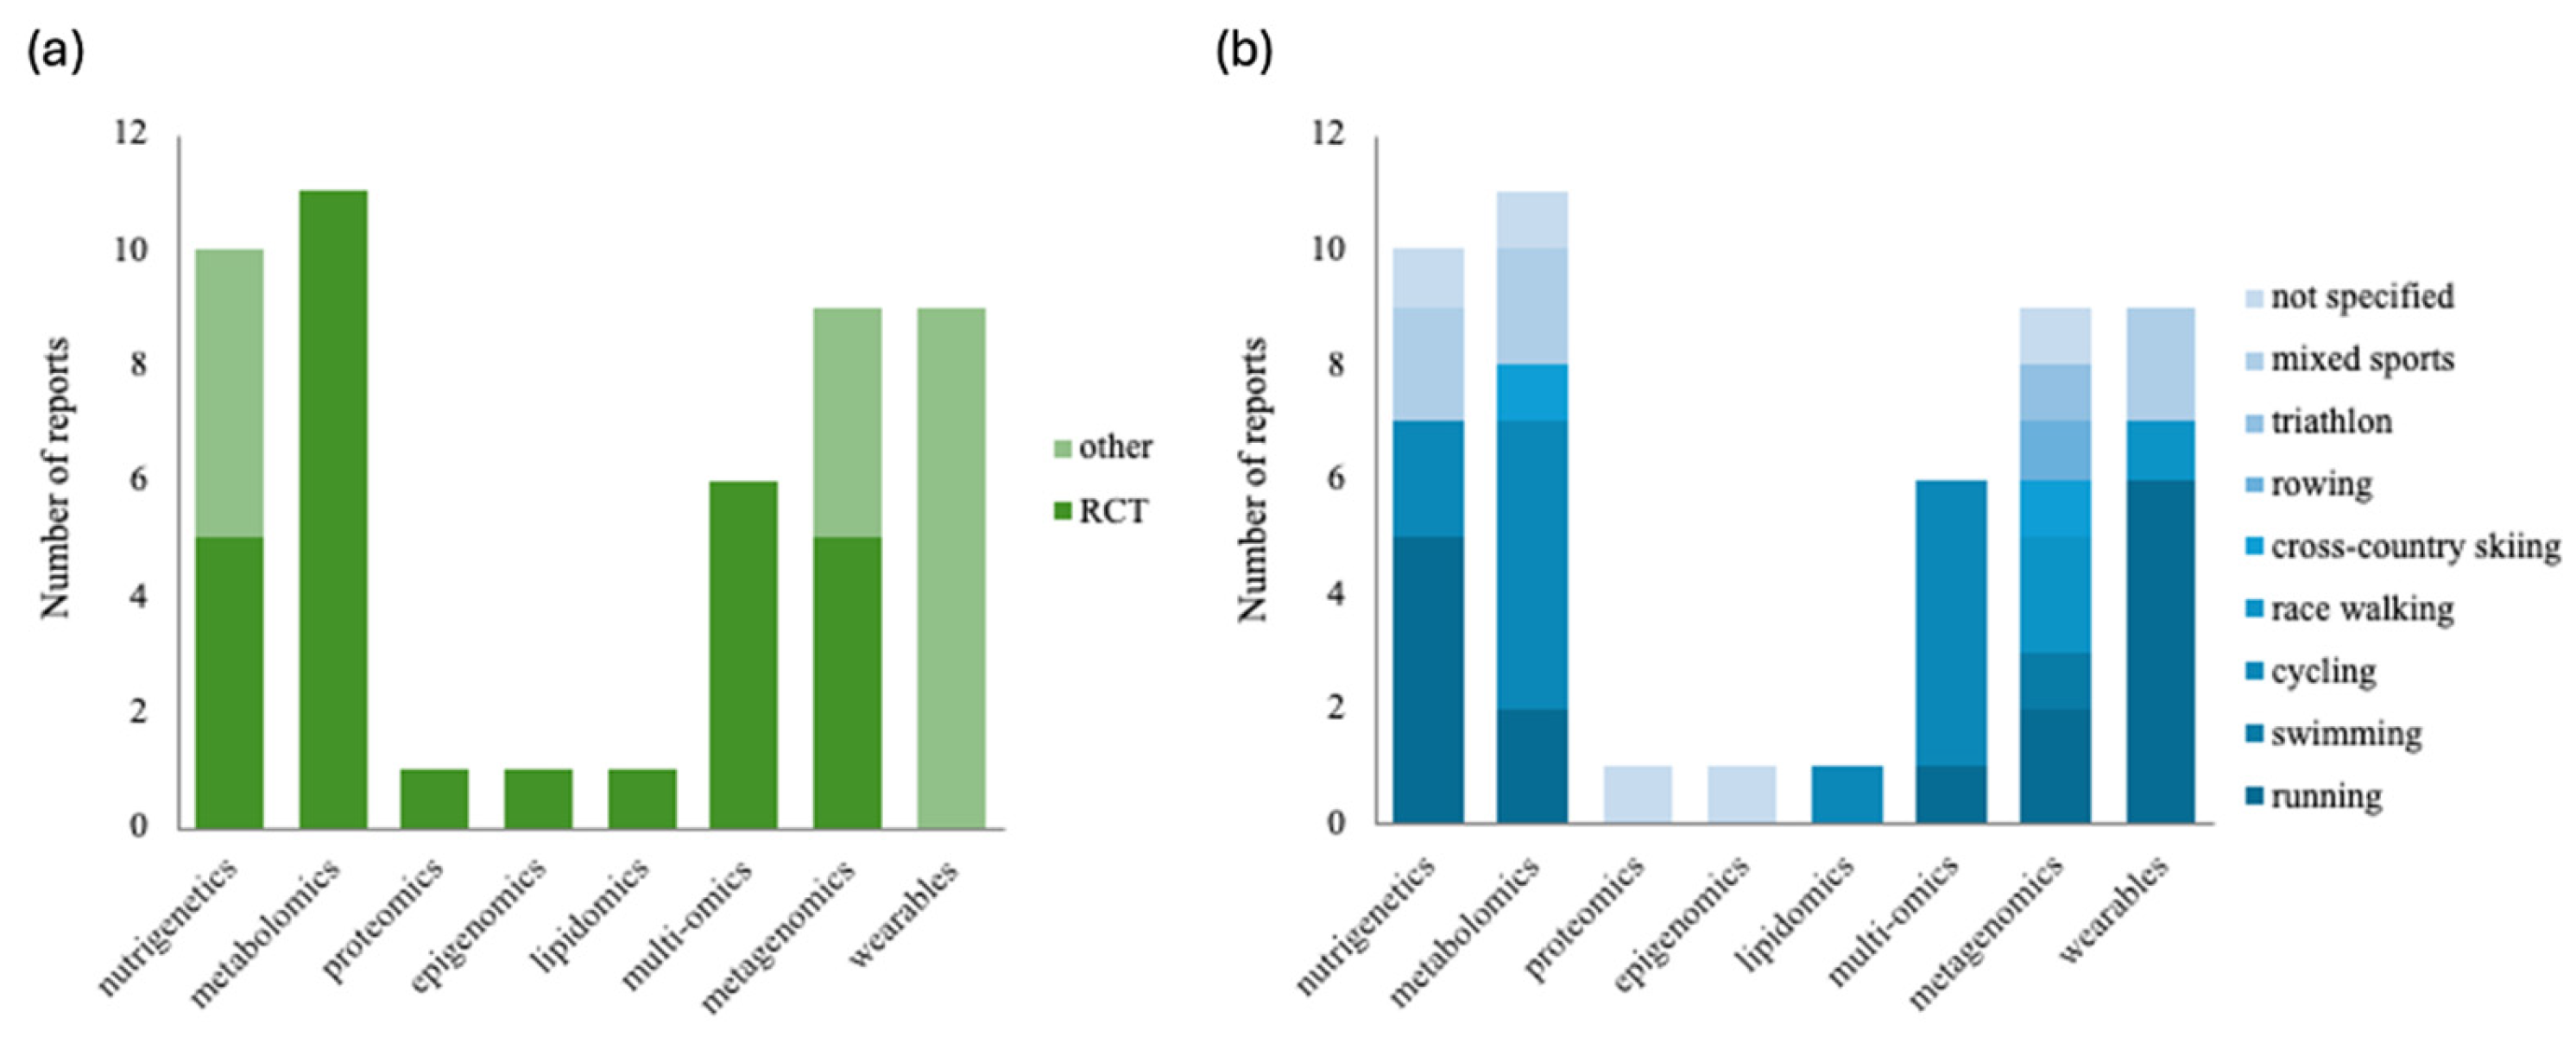

Table 1.
Summaries of nutrigenetics studies characteristics and key findings in endurance athletes.
| Authors, publication year | Study design | Study population | Analytical platform; Matrix | Intervention | Key findings |
| Miranda-Vilela et al., 2009 [24] | One-arm interventional design with a 14-nutritional intervention between two running races; blood samples time points: after each race | 124 recreational runners; 75 males and 49 females (age range: 15-67 years) | Genotyping (PCR-RFLP), target SNPs: MnSOD -Val9Ala (rs1799725), CAT -21A/T (rs7943316), GPX1 Pro198Leu (rs1050450); Blood |
Volunteers participated in two races under identical training and environmental conditions, before (control) and after (treatment) 14 days of daily supplementation with 400 mg of pequi oil. Athletes chose the distance (4–21 km) based on their weekly training. | MnSOD Val/Ala heterozygotes had the least DNA and tissue damage, lowest lipid peroxidation, and best response to pequi oil against exercise-induced damage; No significant effects for CAT or GPX1 genes. |
| Miranda-Vilela et al., 2010 [25] | Same as Miranda-Vilela et al. (2009) | 119 recreational runners; 74 males and 45 females (age range: 15-67 years) | Genotyping (allele-specific PCR and PCR-RFLP), target polymorphisms: Hp, MnSOD -Val9Ala (rs1799725), CAT -21A/T (rs7943316), GPX1 Pro198Leu (rs1050450); Blood |
Same as Miranda-Vilela et al. (2009) | MnSOD Val/Val homozygotes, CAT A-allele carriers, and GPX1 Pro allele carriers showed the best response to pequi oil for improving exercise-induced anisocytosis and blood oxygen-carrying capacity. |
| Miranda-Vilela et al., 2011 [26] | Same as Miranda-Vilela et al. (2009) | 125 recreational runners; 76 males and 49 females (age range: 15-67 years) | Genotyping (allele-specific PCR and PCR-RFLP), target polymorphisms: Hp, MnSOD -Val9Ala, CAT -21A/T, GPx-1 Pro198Leu, GSTT1-null, ACE I/D, GSTM1-null, CK-MM TaqI, CK-MM NcoI, CRP G1059C, MTHFR C677T, MTHFR A1298C; Blood | Same as Miranda-Vilela et al. (2009) | Post-supplementation, Hp, ACE, GSTT1, and MTHFR -A1298C affected lipid profile; MTHFR A1298C impacted CRP levels; and Hp and MnSOD influenced lipid peroxidation; In before-after comparisons, differences between ACE genotypes in leukogram and cholesterol, Hp and MnSOD in lipid peroxidation, and MTHFR A1298C in CRP disappeared. |
| Miranda-Vilela et al., 2016 [27] | Same as Miranda-Vilela et al. (2009) | 125 recreational runners; 76 males and 49 females (age range: 15-67 years) | Genotyping (allele-specific PCR), target SNP: IL-6 –174 G/C (rs1800795); Blood | Same as Miranda-Vilela et al. (2009) | Pequi oil best protected against muscle damage in IL-6 GC genotypes; C-allele carriers showed ¯ lipid peroxidation than GG homozygotes. |
| Womack et al., 2012 [28] | Randomized double-blind, placebo-controlled design with two separate time trials; blood samples time points: before each trial | 35 trained male cyclists (mean age: 25.0 ± 7.3 years, VO2max: 59.35 ± 9.72 mL kg-1 min-1) | Genotyping (PCR-RFLP), target SNP: CYP1A2 rs762551; Blood |
Participants consumed caffeine (6 mg/kg) or placebo 60 minutes before each time trial. 40-km time trials were performed on an indoor cycle trainer on two separate mornings after a 12-hour fast and at least 24 hours without caffeine. | Caffeine ¯ average cycling time to a greater degree in CYP1A2 AA homozygotes (4.9%) compared to C allele carriers (1.8%). |
| Ribeiro et al., 2013 [29] | Same as Miranda-Vilela et al. (2009) | 123 recreational runners; 74 males and 49 females (age range: 15-58 years) | Genotyping (PCR-RFLP), target SNPs: ACTN3 R577X rs1815739, EPO rs1617640; Blood | Same as Miranda-Vilela et al. (2009) | Post-supplementation, the EPO TG genotype had ¯ CRP and GG had ¯ platelet count compared to TT; ACTN3 XX had ¯ MCH and lymphocyte count compared to RX; In before-after comparisons, ACTN3 RX showed ¯ AST, and XX showed ¯ CK. |
| Pataky et al., 2016 [30] | Randomized, counterbalanced, double-blind, placebo-controlled design with 6 cycling time trials, 3-7 days apart; blood samples time points: after the final time trial | 38 recreational trained cyclists (min 1 day of cycling per week); 25 males and 13 females (mean age: 21 ± 1 years, VO2max: 51 ± 6 mL kg-1 min-1) | Genotyping (PCR-RFLP), target SNP: CYP1A2 rs762551; Blood | Subjects ingested a 6 mg/kg caffeine or placebo capsule 1 hour before each cycling trial. Each trial started with a 5-minute warm-up with two mouth rinses, followed by a 3-km time trial. Subjects received two 25 mL mouth rinses with either 300 mg caffeine or a placebo. The four treatments were: (1) placebo capsule + placebo rinse, (2) placebo capsule + caffeine rinse, (3) caffeine capsule + caffeine rinse, and (4) caffeine capsule + placebo rinse. | power output in CYP1A2 AC heterozygotes by caffeine capsule (6.1%) and caffeine capsule + caffeine rinse (4.1%); AA homozygotes by 3.4% with the capsule + rinse but ¯ with the rinse alone (-0.4%); AC heterozygotes benefited more from caffeine capsule than AA genotypes. |
| Guest et al., 2018 [31] | Split-plot randomized, double-blinded, placebo-controlled design with 3 supplementation days, 1 week apart; saliva samples time point: before the intervention | 101 competitive male athletes; CYP1A2 rs762551 AA genotype (mean age: 24 ± 4 years, VO2max: 49 ± 8 mL kg-1 min-1), AC genotype (age: 25 ± 5 years, VO2max: 47 ± 12 mL kg-1 min-1), CC genotype (age: 25 ± 5 years, VO2max: 44 ± 12 mL kg-1 min-1) | Genotyping (Sequenom MassArray platform, Sequenom Inc.), target SNP: CYP1A2 rs762551; Saliva | Participants received placebo or caffeine (2 mg/kg or 4 mg/kg) before a 10-km cycling time trial. | Caffeine ¯ cycling time in the CYP1A2 AA genotype at both 2 mg/kg (-4.8%) and 4 mg/kg (-6.8%) without a dose difference; 4 mg/kg cycling time by 13.7% in the CC genotype; no effect in the AC genotype. |
| Carswell et al., 2020 [32] | Randomized double-blind, placebo-controlled crossover design with 3-9-day washout period between each supplementation day; blood samples time points: pre-supplementation, pre-exercise, and post-exercise | 18 active adults (mean age: 24 ± 4 years); 12 males (VO2max: 49.5 ± 7.7 mL kg−1 min−1) and 6 females (VO2max: 43.2 ± 10. 6 mL kg−1 min−1) | Genotyping (rhAmp assays), target SNPs: ADORA2A rs5751876, CYP1A2 rs762551; Blood | Participants received caffeine (3 mg/kg) or placebo, with measures of endurance (15-min cycling, 70 min post-supplementation) and cognitive performance (pre, 50-, and 95-min post-supplementation). | Caffeine performance similarly across CYP1A2 and ADORA2A genotypes; Faster reaction times and higher response speeds in CYP1A2 AA homozygotes with no differences in C-allele carriers or ADORA2A genotypes. |
| Guest et al., 2022 [33] | Whole-plot complete randomized block, double-blinded, placebo-controlled design with 3 supplementation days, 1 week apart; saliva samples time point: before the intervention | 100 competitive male athletes; HTR2A rs6313 CC genotype (mean age: 24 ± 4 years, VO2max: 49 ± 8 mL kg-1 min-1), CT genotype (mean age: 25 ± 5 years, VO2max: 47 ± 12 mL kg-1 min-1), TT genotype (mean age: 25 ± 5 years, VO2max: 44 ± 12 mL kg-1 min-1) | Genotyping (Sequenom MassArray platform, Sequenom Inc.), target SNPs: HTR2A rs6313, CYP1A2 rs762551; Saliva | Participants received placebo or caffeine (2 mg/kg or 4 mg/kg) before a 10-km cycling time trial. | 4 mg/kg caffeine performance in individuals with both the HTR2A CC and CYP1A2 AA genotypes; Among CYP1A2 AA individuals, HTR2A CC genotypes outperformed T-allele carriers; No performance differences in CYP1A2 C-allele carriers based on HTR2A genotype. |
Table Legend: ACE: Angiotensin I-converting enzyme; ACTN3: α-actinin-3; ADORA2A: Adenosine A2A receptor; AST: aspartate aminotransferase; CAT: Catalase; CK: creatine kinase; CK-MM: Creatine kinase muscle type; CRP: C-reactive protein; CYP1A2: Cytochrome P450 1A2; EPO: Erythropoietin; GPX1: Glutathione peroxidase 1; GSTM1: Glutathione S-transferase M1; GSTT1: Glutathione S-transferase T1; Hp: haptoglobin; HTR2A: 5-Hydroxytryptamine receptor 2A; IL-6: Interleukin-6; MCH: Mean corpuscular hemoglobin; MnSOD: Manganese superoxide dismutase; MTHFR: Methylenetetrahydrofolate reductase; PCR: Polymerase chain reaction; PCR-RFLP: Polymerase chain reaction-restriction fragment length polymorphism; SNP: single-nucleotide polymorphism.
Table 2.
Summaries of proteomics, metabolomics, epigenomics, and multi-omics studies characteristics and key findings in endurance athletes.
Table 2.
Summaries of proteomics, metabolomics, epigenomics, and multi-omics studies characteristics and key findings in endurance athletes.
| Authors, publication year | Study design | Study population | Analytical platform; Matrix | Intervention | Key findings |
| Chorell et al., 2009 [34] | Randomized, controlled trial of four interventions; blood samples time points: before- and post-exercise (0-h, 0.25-h, 0.5-h, 1-h, 1.5-h) | 24 non-elite male athletes (age: 25.7 ± 2.7 years, VO2max: 59.1 ± 7.3 mL kg-1 min-1) | Predictive metabolomics (GC−TOF MS, HMCR); Plasma | Participants ingested one of four beverages after 90 minutes of cycling across four test sessions: LCHO (1 g CHO/kg), HCHO (1.5 g CHO/kg), LCHO-P (1 g/kg CHO, 0.5 g PROT/kg), and water; PROT included 90% casein and 10% whey protein; CHO included 37.5% maltodextrin, 31.25% sucrose, 15.6% glucose, and 15.6% galactose. | LCHO-P: amino acids, PSU, cholesterol, and 4-deoxyerythronic acid; ¯ 3-methylhistidine; Water: fatty acids; LCHO and HCHO: sugar levels; PSU with LCHO-P, suggesting protein synthesis; adenine catabolism and metabolic stress in high VO2max individuals ( uric acid levels) |
| Nelson et al., 2012 [35]; Nelson et al., 2013 [36] | Randomized, double blind, placebo controlled, crossover design with a 14-day washout period; blood samples time points: before- and post-exercise (0-h, 0.5-h, 1-h,1.5-h, 2-h, 3-h) on days 1 and 6 | 12 well-trained male cyclists or triathletes (mean age, 35 ± 10 years; VO2max: 64.8 ± 6.8 mL kg-1 min-1) | Targeted metabolomics (GC-MS); Plasma | Athletes ingested either LEUPRO (protein/leucine/carbohydrate/fat: 20/7.5/89/22 g/h) or CON (carbohydrate/fat: 119/22 g/h) for 1-3 h post-exercise during 6 days of high-intensity training. | LEUPRO altered amino acid and acylcarnitine metabolism (¯ muscle damage); No significant performance improvements; (Nelson et al., 2012:); LEUPRO neutrophil oxidative burst after 6 days of training; Acutely, LEUPRO ¯ neutrophil oxidative burst ( myristic acid levels) (Nelson et al., 2013). |
| Nieman et al., 2012 [37] | Randomized, crossover design with a 3-week washout period; blood samples time points: before- and post-exercise (0-h, 1-h) | 14 trained non-elite male cyclists (mean age 37.0 ± 7.1 years; VO2max: 58.6 ± 5.2 mL kg-1 min-1) | Untargeted metabolomics (GC-MS); Plasma | Subjects ingested 0.4 g/kg carbohydrate from bananas (BAN) or from a standard 6% CHO beverage (Gatorade™, Chicago, IL) before exercise and 0.2 g/kg body weight every 15 minutes during the 75-km time trials. | No significant differences between groups in blood glucose and performance metrics; Exercise levels of multiple inflammatory and oxidative stress markers with different patterns for IL-10 and IL-8 between CHO and BAN and FRAP in BAN; Differences in dopamine levels between groups. |
| Nieman et al., 2013 [38] | Randomized, double-blind, placebo-controlled, parallel group design of 17 days supplementation period with a 3-day periods of exercise test inserted at day 14; blood samples time points: before- and after 14-day supplementation, and immediately and 14 h after 3rd day of running | 31 non-elite competitive long-distance runners: 18 males and 13 females, (mean age: 33.7 ± 6.8 years; VO2max: 50.0-64.4 mL kg-1 min-1) | Untargeted metabolomics (UHPLC/MS/MS2, GC-MS); Plasma | 2 x 20 g daily of 3∶1 blueberry-green tea-polyphenol soy protein complex over a 17-day period, including a 14-day pre-exercise period, and during each day of the 3-day intensified exercise period | Exercise: significant physiological, inflammatory and oxidative stress; Supplementation: no ¯ stress biomarkers post-exercise, gut-derived phenolic metabolites; Exercise-induced gut permeability led to fat oxidation and ketogenesis in recovery. |
| Nieman et al., 2014 [39] | Randomized, crossover design with 2-week supplementation period followed by a time trial and a 2-week washout period; blood samples time points: 45 min before- and post-exercise (0-h, 1.5-h, 21-h) | 19 non-elite male competitive cyclists (mean age: 38.0 ± 1.6 years; VO2max: 51.7 ± 1.4 mL kg-1 min-1) | Untargeted metabolomics (UHPLC/MS/MS, GC-MS); Plasma | 2 weeks of pistachio (3 oz/day) or no pistachio supplementation followed by 75 km time trial after an overnight fast. Participants also consumed 1.5 oz before and after 1 h of the time trial. | Pistachio ¯ time trial performance by 4.8%; Exercise induced changes in inflammatory, oxidative stress, and metabolic markers; raffinose correlated with oxidative stress markers; specific bile acids, amino acids, fatty acid metabolites, and lysolipids. |
| Nieman et al., 2015 [40] | Randomized, crossover design with a 2-week washout period; blood samples time points: before- and post-exercise (0-h, 1.5-h, 21-h) | 20 non-elite male competitive cyclists (mean age: 39.2 ± 1.9 years; VO2max: 51.0 ± 1.4 mL kg-1 min-1) | Metabolomics (UPLC–MS/MS); Plasma | Participants completed three 75-km cycling time trials under three conditions: water only, bananas and water, and pears and water. CHO intake (0.4 g/kg pre-exercise, 0.15 g/kg every 15 min) was provided for banana and pear groups. | Banana and pear: cycling performance (5.0% and 3.3%), compared to water; ¯ cortisol, IL-10, and total leukocytes; blood glucose, insulin, and FRAP; Banana: fructose, dopamine, serotonin-related metabolites, and antioxidant markers (pear showed similar but less pronounced effects); Pear consumption associated with gastrointestinal discomfort. |
| Olsen et al., 2020 [41] | Double-blind, randomized, crossover design with at least a 6-day washout period between two experimental interventions; blood samples time points: Day 1 post-exercise (0 h, 0.25 h, 0.5 h, 1 h, 1.5 h, 2 h); Day 2 before exercise, during exercise (15 min, 30 min, and 70 min after the start of the time trial), and 15 min post-exercise exercise. | 8 elite male cyclists (mean age: 22.7 ± 3.5 years; VO2max: 74.7 ± 4.01 mL kg-1 min-1) | Targeted metabolomics (LC-MS/MS); Plasma and urine | Athletes cycled to exhaustion and received supplementation immediately after exercise and at 30-minute intervals for 120 minutes: CHO+PROT: 0.8 g/kg/h CHO (glucose + maltodextrin, 1:1) and 0.4 g/kg/h PROT (whey); CHO: 1.2 g/kg/h (glucose + maltodextrin, 1:1). After an ~18-hour recovery period, athletes completed a 60-minute time trial | The CHO+ PROT group cycled 8.5% faster than the CHO group; Post-exercise: methionine ¯ by 55% in CHO vs. 33% in CHO+PROT (p < 0.001); The methionine/homocysteine ratio ¯ by 54% in CHO vs. 27% in CHO+PROT (p < 0.001); Cystathionine by 72% in CHO vs. 282% in CHO+PROT; Total cysteine, taurine, and glutathione by 12%, 85%, and 17%, (during exercise). |
| Stander et al., 2021 [42] | Randomized, placebo controlled, participant groups were matched according to predicted marathon finishing times; blood samples time points: before the race and post-exercise (0-h, 24-h, 48-h) | 31 marathon athletes; 19 males and 12 females; placebo group (mean age: 39 ± 12 years, marathon finishing time 04:30:25 ± 00:36:48), beetroot group (mean age: 42 ± 10 years, marathon finishing time 04:07:08 ± 00:39:16) | Untargeted metabolomics (GC-GC-TOFMS); Plasma | During the two consecutive days following the race, athletes received either beetroot juice or isocaloric placebo. Supplements were consumed as follows: 3 x 250 mL on marathon day (immediately after, ± 3 h post-race, and at 20:00); 3 × 250 mL the day after (upon waking, with lunch, and supper); 250 mL upon waking on the second day post-marathon. | Both the beetroot and placebo groups returned to pre-marathon levels in metabolic profiles within 48 hours; Random interindividual variation observed post-marathon in 2 metabolites deriving from CHO (arabitol and xylose) and 2 from odd-chain fatty acids (nonanoate and undecanoate); No immediate metabolic recovery benefits were identified. |
| Jin et al., 2023[43] | Randomized, controlled, single-blinded, crossover trial with a 2-week washout period; blood samples time points: fasted, before- and post-exercise (90-min after 1st exercise, after time trial), fasted after 19h recovery | 16 male cyclists (mean age: 17.0 ± 1.0 years; VO2max: 56.3 ± 5.8 mL kg-1 min-1) | Quantitative metabolomics (UPLC-MS/MS); Plasma | Athletes consumed two 6% CHO and electrolyte beverages, with or without 2.7% FOPS, across two test sessions involving intraday fasting, 30 minutes of sitting still, 85 minutes of prolonged exercise, 5-minute sprint, a 60-minute recovery period, a 20-minute time trial, and recovery until the next morning. FOPS provided 35 g of oligopeptides, including 7.5 g of essential amino acids and 1.5 g of leucine per athlete during the trial. | 101 TGs, 32 FAAs and their metabolites, and 8 Krebs cycle metabolites were identified; 5 of 20 plasma FAAs 20 minutes after oligopeptide ingestion before exercise; Serum TGs and non-esterified fatty acids were ¯ in the experimental group post-exercise and post-time trial; ¯ plasma TGs post-exercise and during fasting in the experimental group, fat oxidation. |
| Li et al., 2023a [44] | Randomized, single-blind, placebo-controlled design with an 8-week probiotic supplementation period; blood samples time points: before and after the 8-week intervention period | 16 male national top-level cross-country skiers; control group (mean age: 19.3 ± 0.7 years, VO2max: 55.9 ± 4.4 mL kg-1 min-1), probiotic group (mean age: 19.6 ± 1.1 years, VO2max: 55.8 ± 5.4 mL kg-1 min-1) | Untargeted metabolomics (LC-MS) | Yoghurt with the addition of 1 × 10⁹ CFU of Bifidobacterium animalis subsp. lactis BL-99, four times per day for 8 weeks. VO2max and isokinetic muscle strength test were conducted before and after the intervention. | BL-99 combined with training improved lipid metabolism (¯ TGs and LDL) and VO2max and knee extensor strength); BL-99 DHA, adrenic, linoleic, and acetic acids, and ¯ glycocholic and glycodeoxycholic acids. |
| Jeppesen et al., 2024 [45] | Randomized, single-blinded crossover study with a 14-day dietary intervention followed by 3 days of refueling and a 11-day washout period; blood samples time points: before, 7 days into and after 14 days of both interventions, and after each 3-day refueling period | 12 female endurance athletes (mean age: 26.8 ± 3.4 years; VO2max: 55.2 ± 5.1 mL kg-1 min-1) | Proteomics (Olink Proteomics, Uppsala, Sweden, Target 96 Inflammation Panel); Plasma | Participants completed two 14-day dietary phases: OEA (50 kcal/kg FFM/day) and LEA (22 kcal/kg FFM/day). After each phase, a 3-day OEA refueling period was implemented, with phases separated by an 11-day washout. Eight 20-minute cycling time trials were performed: before the intervention, on day 7, after 14 days of OEA and LEA, and following each 3-day refueling period. | LEA NADPH oxidase and systemic cortisol, altered inflammatory proteins, and exercise-induced hydrogen peroxide emission in peripheral blood mononuclear cells; Performance ¯ after LEA with limited recovery post-refueling and impaired immune function; 78/96 plasma proteins quantifiable; LEA ¯ 5 and 2 proteins. |
| Gorski et al., 2023 [46] | Randomized, counterbalanced, cross-over design with a 1–2-week washout period; blood samples time points: before morning exercise, during exercise and post-recovery drink after morning exercise (0-h, 0.5-h, 1-h, 2-h, 3-h) | 9 well-trained male athletes; (mean age: 30 ± 7 years; VO2max: 66 ± 6 mL kg-1 min-1) | Epigenomics (Infinium Methylation EPIC BeadChip Array, Illumina); Plasma | Standardized diet for 24 h before the lab visit: 40 kcal/kg FFM (1.2 g/kg FFM fat, 6.0 g/kg FFM CHO, 1.35 g/kg FFM PROT); Post-exercise day 1: EB-HF: 30 kcal/kg FFM (73% fat, 16% CHO, 11% PROT); ED-LF: 9 kcal/kg FFM (10% fat, 53% CHO, 37% PROT); Day 2: Both groups consumed a recovery drink (1.2 g/kg FFM CHO and 0.38 g/kg FFM protein) 30 min post-morning exercise. | Baseline: EB-HF showed hypermethylated DNA (60%) compared to ED-LF; Post-exercise: EB-HF: significant hypomethylation in regulatory regions (CpG islands) and expression of HDAC2, MECR, IGF2, and c13orf16; ED-LF: expression of HDAC11; EB-HF: epigenetic and transcriptional changes that support exercise recovery and metabolism. |
| Nieman et al., 2019 [47] | Randomized, crossover, counterbalanced four arm design with a 2-week washout period; blood samples time points: before- and post-exercise (0-h, 0.75-h, 1.5-h, 3-h, 4.5-h, 24-h, 45-h) | 20 non-elite competitive cyclists: 14 males (mean age: 37.1 ± 2.5 years; VO2max: 47.0 ± 1.5 kg-1 min-1); 6 females (mean age: 43.7 ± 2.2 years; VO2max: 46.5 ± 2.8 mL kg-1 min-1) | Lipidomics (LC-MRM-MS); Plasma | Overnight-fasted cyclists completed a 75-km time trial while ingesting either water (3 mL/kg), a 6% sugar beverage (0.2 g/kg CHO), Cavendish bananas (0.2 g/kg carbohydrate), or polyphenol-rich mini-yellow bananas (0.2 g/kg carbohydrate) every 15 minutes of exercise. | CHO intake ¯ ARA and DHA mobilization, and CYP-derived oxylipin generation after 75-km cycling; Oxylipin levels in the water trial, while CHO ¯ this rise, particularly for 9 of 12 CYP-derived oxylipins; This effect was most pronounced in the first three hours of recovery, with most oxylipins coming from ARA, including over 15 eicosanoids from LOX and CYP pathways. |
| Nieman et al., 2018a [48] | Randomized, crossover, counterbalanced four arm design with a 2-week washout period; blood samples time points: before- and post-exercise (0-h, 0.75-h, 1.5-h, 3-h, 4.5-h, 24-h, 45-h) | 20 non-elite competitive cyclists: 14 males (mean age: 37.1 ± 2.5 years; VO2max: 47.0 ± 1.5 kg-1 min-1); 6 females (mean age: 43.7 ± 2.2 years; VO2max: 46.5 ± 2.8 mL kg-1 min-1) | Multi-omics: Global metabolomics (UPLC–MS/MS)/Lipidomics (LC-MRM-MS); Plasma | Overnight-fasted cyclists completed a 75-km time trial while ingesting either water (3 mL/kg), a 6% sugar beverage (0.2 g/kg CHO), Cavendish bananas (0.2 g/kg carbohydrate), or polyphenol-rich mini-yellow bananas (0.2 g/kg carbohydrate) every 15 minutes of exercise. | CHO from bananas or sugar beverages ¯ exercise-induced stress responses (cortisol, inflammation, and lipid disturbances); Water-only group: 109 metabolites >2-fold, while 71 ¯ by > 0.5-fold; Post-exercise: 65% of the ¯ metabolites were triacylglycerol esters;: metabolic disruption in the water-only condition compared to the banana and sugar beverages; Banana: ¯ COX-2 mRNA expression in monocytes. |
| Nieman et al., 2018b[49] | Randomized, double blind, placebo controlled, crossover design | 59 participants from 3 studies (Nieman et al., 2014, Nieman et al., 2015, Nieman et al., 2018a) | Multi-omics: Global metabolomics (UPLC–MS/MS)/Lipidomics (LC-MRM-MS); Plasma | Overnight-fasted participants were subjected to different nutritional interventions during a 75 km cycling time trial: Two trials: 3 mL/kg of water or water containing 0.15–0.20 g/kg of CHO every 15 minutes (CHO sources: bananas, pears, or a 6% sugar beverage); One trial: 3 oz. of pistachio nuts per day for 2 weeks. On the day of the trial, they ingested 1.5 oz. of pistachio nuts before and after a 1-hour of the time trial. | 26 key metabolites associated with exercise-induced changes; CHO ingestion ¯ the metabolic impact of exercise by 28-47% compared to water-only, depending on CHO type and recovery time. |
| Nieman et al., 2020 [50] | Randomized, double-blind, placebo-controlled, parallel four group design with 2-week supplementation period followed by time trial and 2.5 days of recovery monitoring; blood samples time points: before- and after supplementation, and post-exercise (0-h, 1.5-h, 3-h, 5-h, 24-h, 48-h) | 59 non-elite competitive cyclists; 40 males and 19 females (age range: 36-41 years; VO2max: 44.1-52.3 mL kg-1 min-1) | Metabolomics (UPLC–MS/MS) Lipidomics (LC-MRM-MS); Plasma | Freeze-dried blueberry ingestion (26 g/d) vs placebo for 2 weeks. Both groups were further randomized to ingestion of a water-only control or water with a CHO source (Cavendish bananas, 0.2 g/kg CHO every 15 min) during a 75 km cycling time trial. | Exercise 64 of 67 oxylipins; both blueberry and banana intake ¯ pro-inflammatory oxylipins within first 3 hours of recovery; Blueberry intake 24 gut-derived phenolics and ¯ post-exercise oxylipins, while acute banana intake strongly ¯ 10 pro-inflammatory oxylipins. |
| Nieman et al., 2023 [51] | Randomized, double-blind, placebo-controlled, crossover design with two 4-week supplementation periods and a 2-week washout period; blood samples time points: before- and after supplementation, and post-exercise (0-h, 1.5-h, 3-h, 24-h) | 18 recreational distance runners; 11 males (mean age: 40.7 ± 2.7 years; VO2max: 52.7 ± 2.9 mL kg-1 min-1) and 7 females (mean age: 43.7 ± 2.9 years; VO2max: 52.7 ± 2.9 mL kg-1 min-1) | Multi-omics: Untargeted proteomics (MS-DIA)/Targeted oxylipins profiling (LC-MRM-MS); Plasma | 4-weeks of 8 mg astaxanthin supplementation prior to 2.25 h treadmill running test | No effect on exercise-induced muscle soreness, muscle damage, and no elevation in 6 plasma cytokines and 42 oxylipins; Supplementation countered exercise-induced ¯ in 82 plasma proteins related to immune functions (restoration of IgM); Significant between-subject variability observed in 500 identified plasma proteins. |
| Nieman et al., 2024 [52] | Randomized, double-blind, placebo-controlled, crossover design with two 2-week supplementation periods and a 2-week washout period; blood samples time points: before- and after supplementation, and post-exercise (0-h, 1.5-h, 3-h, 24-h) | 20 non-elite recreational cyclists; 14 males (mean age: 46.5 ± 2.6 years; VO2max: 41.2 ± 1.6 mL kg-1 min-1) and 6 females (mean age: 51.3 ± 4.3 years; VO2max: 40.9 ± 2.9 mL kg-1 min-1) | Multi-omics: Untargeted proteomics (MS-DIA)/Targeted oxylipins profiling (LC-MRM-MS); Plasma | 2-weeks of BEET supplementation prior to a 2.25 h cycling test in a fasted state. The BEET supplement contained 212 mg of nitrates, 200 mg caffeine, 44 mg vitamin C, 40 % RDA of thiamine, riboflavin, niacin, and vitamin B6, and 2.5 g of a mushroom blend (Cordyceps sinensis and Inonotus obliquus). | Cycling 41 of 67 oxylipins, with BEET supplementation further two anti-inflammatory oxylipins (18-HEPE, 4-HDoHE); BEET impacted 66 of 616 proteins, ¯ 45 and 21 compared to placebo; BEET ¯ inflammation-related proteins, involved in complement activation, acute phase response, and immune function. |
| Sakaguchi et al., 2024 [53] | Randomized, crossover design with a 2-week washout period; blood and urine samples time points: pre- and post- supplementation and blood sampling post-exercise (0-h, 1.5-h, 3-h, 24-h) | 22 cyclists; 13 males (mean age: 43.2 ± 2.1 years; VO2max: 43.4 ± 2.3 mL kg-1 min-1) and 9 females (mean age: 37.9 ± 3.2 years; VO2max: 37.9 ± 2.9 mL kg-1 min-1) | Multi-omics: Targeted lipidomics (LC-MRM-MS)/Metabolomics (UPLC-ESI-TOF); Plasma and urine | Cyclists ingested 330 g of mango/day with 0.5 L water or 0.5 L of water alone for 2 weeks, followed by a 2.25 h cycling bout challenge; 1.5 h after exercise, mango group consumed 165 g of mango, while water-only group drank 0.45 L of a 6% CHO sports drink. | After supplementation mango-derived phenolic metabolites ; no effect on post-exercise oxylipin patterns or inflammation; significant post-exercise in 49 oxylipins and inflammation; Mango supplementation did not alter these responses compared to water. |
Table Legend: 18-HEPE: 18-hydroxyeicosapentaenoic acid; 4-HDoHE: 4-hydroxy-docosahexanoic acid; ARA: arachidonic acid; BCAAs: branched-chain amino acids; CFU: colony forming units; CHO: carbohydrate; CYP: cytochrome P450; DHA: docosahexaenoic acid; EB-HF: energy balance high fat; ED-LF: energy deficit low fat; FAAs: free amino acids; FFM: fat-free mass; FOPS: food-derived oligopeptides; FRAP: ferric reducing ability of plasma; GC-MS: gas chromatography coupled with mass spectrometry; GC-MS: gas chromatography–mass spectrometry; GC−TOF MS: gas chromatography/time-of-flight mass spectrometry; GCxGC-TOFMS: two-dimensional gas chromatography time-of-flight mass spectrometry; HCHO: high-carbohydrate; HMCR: hierarchical multivariate curve resolution; IL-10: interleukin 10; IL-6: interleukin 6; IL-8: interleukin 8; LCHO: low-carbohydrate; LCHO-P: low-carbohydrate-protein; LC-MRM-MS: liquid chromatography coupled with multiple reaction monitoring mass spectrometry; LC-MS/MS: liquid chromatography coupled with tandem mass spectrometry; LC-MS: liquid chromatography coupled with mass spectrometry; LDL: low-density lipoprotein; LEA: low energy availability; LOX: lipoxygenase; MS-DIA: Mass spectrometry with data-independent acquisition; OEA: optimal energy availability; PROT: protein; PSU: pseudouridine; PUFAs: polyunsaturated fatty acids; RDA: recommended dietary allowance; SCFAs: short-chain fatty acids; TGs: triglycerides; UHPLC/MS/MS: ultrahigh performance liquid chromatography coupled with tandem mass spectrometry; UPLC: ultra-performance liquid chromatography; UPLC-ESI-TOF: ultra-performance liquid chromatography electrospray ionization time of flight mass spectrometry.
Table 3.
Summaries of metagenomics studies characteristics and key findings in endurance athletes.
| Authors, publication year | Study design | Study population | Analytical platform; Matrix | Intervention | Key findings |
| Moreno-Pérez et al., 2018 [54] | Randomized, double-blind, placebo-controlled pilot design with a 10-week supplementation period; stool samples time points: before and after the intervention | 18 male cross-country runners who regularly engaged in endurance training (240 min/week); PRO group (mean age: 34.90 ± 9.49 years), CHO group (mean age: 35.38 ± 9.00 years) | Amplicon metagenomic sequencing (MiSeq platform, llumina) and targeted metabolomics (GC-MS); Stool | The protein (PRO) group received a blend of whey isolate (10 g) and beef hydrolysate (10 g) daily for 10 weeks. The control (CHO) group received maltodextrin. | PRO group: ¯ Bifidobacterium longum, Roseburia, Blautia, Coprococcus; PRO vs. CHO groups: Bacteroides, ¯ Citrobacter and Klebsiella; no significant differences in faecal SCFA levels |
| Murtaza, et al., 2019a [55], Murtaza et al., 2019b [56] | Non-randomized, controlled design with three dietary intervention groups during a 3-week period of intensified training; stool samples time points: before and after intervention | 21 male elite race walkers (age range: 20-35 years); HCHO group (VO2max: 61.6 ± 6.8 mL kg−1 min−1), PCHO group (VO2max: 64.6 ± 5.3 mL kg−1 min−1), LCHF group (VO2max: 66.3 ± 4.8 mL kg−1 min−1) | Amplicon metagenomic sequencing (MiSeq platform, Illumina); stool (Murtaza et al., 2019a) and saliva (Murtaza et al., 2019b) | HCHO diet: 60% carbohydrate (~8.5 g/kg/day), 16% protein (~2.1 g/kg/day), 20% fat; PCHO diet: Similar macronutrient composition as HCHO but periodized in consumption across the day and throughout the week; LCHF diet: 78% fat, 17% protein (~2.2 g/kg/day), 3.5% carbohydrate (<50 g/day) | PCHO diet: Ruminococcaceae, Coprococcus, Bifidobacterium, Streptococcus and Akkermansia muciniphila, ¯ Bilophila; HCHO diet: Clostridiaceae, Lachnospiraceae, Ruminococcaceae, ¯ Sutterella; LCHF diet: Dorea, Bacteroides, Akkermansia, ¯ Faecalibacterium, Veillonella, Streptococcus, Succinivibrio, Odoribacter, Lachnospira, Bifidobacterium (Murtaza et al., 2019a); LCHF diet: Gram-positive bacteria (Streptococcus, Faecalibacterium, Peptostreptococcus, Rothia), ¯ Gram-negative bacteria (Neisseria and Prevotella); HCHO/PCHO diets: Gram-negative bacteria (Haemophilus, Leptotrichia) (Murtaza et al., 2019b). |
| Huang et al., 2020 [57] | Randomized, double-blind, placebo-controlled, design with a 4-week probiotic supplementation period; stool samples time points: after intervention | 20 male triathletes; L. plantarum group (mean age: 21.6 ± 1.3 years, VO2max: 55.5 ± 8.6 mL kg-1 min-1), placebo group (mean age: 21.9 ± 1.4 years, VO2max: 56.6 ± 9.0 mL kg-1 min-1) | Amplicon Metagenomic Sequencing (Roche 454 GS FLX); Stool | Daily supplementation of Lactobacillus plantarum PS128 at a dose of 3 × 10¹⁰ CFU for 4 weeks. | PS128 group: ¯ Anaerotruncus, Caproiciproducens, Coprobacillus, Desulfovibrio, Dielma, Holdemania and Oxalobacter, Akkermansia, Bifidobacterium, Butyricimonas and Lactobacillus. |
| Lin et al., 2020 [58] | Randomized, double-blind, placebo-controlled design with a 5-week probiotic supplementation period (3 weeks training, 2 weeks de-training). Stool samples time points: before and after intervention | 21 well-trained middle- and long-distance runners; 14 males and 7 females (age range: 20-30 years) | Amplicon metagenomic sequencing (HiSeq2500 platform, llumina); Stool | Daily supplementation of Bifidobacterium longum subsp. longum OLP-01 at a dose of 1.5 x 10¹⁰ CFU for 5 weeks. 12-minute Cooper’s running test was conducted before and after the supplementation period; distance travelled was recorded every 3 min (3rd, 6th, 9th, and 12th min). | The OLP-01 group: Bifidobacterium genus and the specific probiotic strain Bifidobacterium longum subsp. longum. |
| Jaago et al., 2021 [59] | Case study of an athlete over an 8-month period with a 30-day supplementation period; stool samples time points: preseason, at week 27, and at week 31 after 30 days of supplementation. | 18-year-old male academic rower | Amplicon metagenomic sequencing (MiSeq platform, llumina); Stool | Daily supplementation with 20 g of prebiotic mix containing 8.79 g dietary fiber, consisting of resistant starch (2.25 g), arabinoxylan (2.05 g), citrus fiber (2 g), beta-glucans (1.03 g), inulin (1.03 g), and rye fiber (0.57 g) for 30 days. | ¯ Firmicutes/Bacteroidetes ratio during period of intense competition and after fiber consumption. |
| Gross et al., 2023 [60] | Randomized, double-blind, placebo-controlled, crossover design with two 2-week supplementation periods and a 3-week washout period; stool samples time points: before and after each supplementation period. | 7 recreational athletes; 3 males and 4 females (age: 30.7 ± 7.5 years; VO2max: 49.2 ± 8.4 mL kg-1 min-1) | Shotgun metagenomic sequencing (NovaSeq 6000, llumina), untargeted metabolomics (UHPLC-HRMS); Stool | Daily supplementation of Veillonella atypica FB0054 at a dose of 1 x 10¹⁰ CFU for 14 days. Treadmill time to exhaustion run test was conducted before and after each supplementation period. | No changes in specific taxa or functions observed after placebo use, the washout, or FB0054 use. 14 metabolites differed significantly between the FB0054 use and both baseline and placebo. |
| Li et al., 2023a [44] | Randomized, single-blind, placebo-controlled design with an 8-week probiotic supplementation period; stool samples time points: before and after intervention | 16 male national top-level cross-country skiers; control group (mean age: 19.3 ± 0.7 years, VO2max: 55.9 ± 4.4 ml kg-1), probiotic group (mean age: 19.6 ± 1.1 years, VO2max: 55.8 ± 5.4 mL kg-1 min-1) | Shotgun metagenomic sequencing (sequencing platform using a high-intensity DNA nanochip technique); Stool | Yoghurt with the addition of 1 × 10⁹ CFU of Bifidobacterium animalis subsp. lactis BL-99, four times per day for 8 weeks. VO2max and isokinetic muscle strength test were assessed before and after the intervention. | 40-fold of Bifidobacterium animalis in the BL-99 group; 2-fold in the placebo group. |
| Li et al., 2023b [61] | One-arm interventional study with a 5-day probiotic supplementation period; stool samples time points: on a regular training day and post intervention. | 15 elite open-water swimmers; 8 males (mean age: 18.32 ± 4.41 years) and 7 females (mean age: 18.04 ± 2.96 years) | Amplicon metagenomic sequencing (NovaSeq 6000, Illumina) and untargeted metabolomics (HPLC-HRMS); Stool | 2 g of probiotic formula (inulin, oligofructose, lactitol, solid sterilized fermented carrot juice, Bifidobacterium lactis HN019, Lactobacillus acidophilus NCFM, Lactobacillus plantarum Lp-115, Bifidobacterium longum Bl-05) were administered twice daily over five training days. | Female athletes: ¯ Firmicutes (positive correlation with organic acids and derivatives). Pusillimonas, Acinetobacter, Aeromonas, and Stenotrophomonas (Proteobacteria) associated with phenylpropanoids, polyketides, organic oxygen compounds, and organic acids; Male athletes: Proteobacteria (positive correlation with organosulfur compounds), Bacteroidetes (negative correlation with alkaloids), Lactobacillus (Firmicutes) (positive association with organophosphorus compounds); Athletes ¯ pathways related to endocrine resistance, sphingolipid metabolism, and estrogen signaling. |
Table Legend: GC-MS: gas chromatography coupled with mass spectrometry; LC-MS: liquid chromatography coupled with mass spectrometry; UHPLC-HRMS: ultra-high performance liquid chromatography coupled with high-resolution mass spectrometry; HPLC-HRMS: high performance liquid chromatography coupled with high-resolution mass spectrometry; CFU: colony forming units; HCHO: high carbohydrate; PCHO: periodized carbohydrate; LCHF: low carbohydrate high fat; SCFA: short chain fatty acid.
Table 4.
Summaries of studies characteristics and key findings employing continuous glucose monitoring in endurance athletes.
Table 4.
Summaries of studies characteristics and key findings employing continuous glucose monitoring in endurance athletes.
| Authors, publication year | Study design | Study population | Analytical platform; Matrix | Intervention | Key findings |
| Yardley et al., 2015 [62] | Prospective observational cohort during an endurance cycling race; interstitial glucose measured continuously from the day before the race, through the race and overnight after the race | 6 male athletes with T1D (mean age: 36.3 ± 9.3 years) | CGM (various devices); Interstitial fluid | Participants were asked to maintain their regular prerace routines for insulin dosage and food intake and to record their food intake before, during, and after the race. | 3 participants experienced mild to moderate hypoglycemia during the event; all experienced hyperglycemia 3 hours post-exercise; ¯ insulin administration pre-race and 40-60 g/h of CHOs ¯ the occurrence of hypoglycemia and avoided hyperglycemia during the race. |
| Ishihara et al., 2020 [63] | Prospective observational cohort study during a 160-km ultra-marathon race; interstitial glucose measured continuously during the race | 7 experienced ultramarathon runners; 4 males (mean age: 41. 5 ± 6.2 years), 3 females (mean age: 42.6 ± 1.2years). | CGM (FreeStyle Libre, Abbott); Interstitial fluid | Participants were asked to record their food and drink intake throughout the race. Running time and speed for each of 11 race segments were also collected. | Runners consuming <0.8 g/kg/h of CHOs had ¯ speed; the lowest and average glucose from resting levels correlated positively with running speed. |
| Ishihara et al., 2021 [64] | Case study during a 438-km ultramarathon; interstitial glucose measured continuously from 1 day before the race, during the 7-day ultra-marathon, and 3 days after. | 44-year-old female professional trail runner | CGM (FreeStyle Libre, Abbott); Interstitial fluid | Participant’s food and drink intake was recorded by accompanying runners. Running speed was measured via 33 timing gates. | Minimal diurnal glucose fluctuations and slight total glucose during the ultramarathon (limited sleep); glucose levels were not associated with running pace; pace was associated with nutrient and solid food intake. |
| Kinrade & Galloway, 2021 [65] | Prospective observational cohort study during a competitive 24-h event; interstitial glucose measured continuously during the race. | 18 amateur ultra-endurance runners; 11 males (mean age: 39.3 ± 4.1 years, VO2max: 52.0 ± 5.1 mL kg-1min−1) and 7 females (mean age: 45.0 ± 4.7 years, VO2max: 47.1 ± 7.2 1 mL kg-1min−1) | CGM (FreeStyle Libre, Abbott); Interstitial fluid | Dietary intake for 48 hours pre-race and during the race was recorded using a weighed food intake method. | No association between mean interstitial glucose and dietary intake, or with race distance; runners who consumed ≥40 g/h CHO covered a greater distance compared to <40 g/h. |
| Kulawiec et al., 2021 [66] | Prospective observational cohort study with a monitoring and testing period; interstitial glucose measured continuously during the endurance test. | 10 sub-elite athletes; 7 males and 3 females (age range: 22-50 years, VO2max: 37-67 mL kg−1 min−1) | CGM (Ipro2, Medtronic Minimed; Guardian Real-time device, Medtronic Minimed; Optium Xceed; Abbott); Interstitial fluid | Glucose levels, exercise, and nutrition were monitored for 4–6 days. Athletes performed an endurance exercise test to exhaustion after 1–2 days of monitoring. | Glycemic variability and response to CHO intake on the testing day and normalized the next day; overnight glucose levels remained up to 3-4 days post-test. |
| Clavel et al., 2022 [67] | Prospective interventional study assessing the validity of CGM against finger prick measures in 4 days over 2 weeks; interstitial glucose measured every 10 minutes, finger-prick blood glucose measured over 4 different periods (post-breakfast, pre-exercise, exercise, and post-exercise). | 8 recreational athletes regularly participating in running and resistance-based training (8 ± 2 hours per week); 5 males and 3 females (mean age 30.8 ± 9.5 years) | CGM (FreeStyle Libre, Abbott) and finger prick measures (FreeStyle Libre Reader, Abbott); Interstitial fluid and capillary blood | Two breakfasts were provided before exercise: CHO (65 ± 7g of carbohydrates, 9 ± 1g of proteins and 1 ± 0g of fat, 311 ± 31 kcal) and PROT (1 ± 0g of carbohydrates, 30 ± 0g of proteins and 23 ± 0g of, 311 ± 31 kcal). The exercise routine included a 10-minute low-intensity run, high-intensity intervals, and a 10-minute walk. | The CGM device is accurate at rest but not reliable during exercise, especially when CHOs are consumed beforehand. |
| Takayama & Mori, 2022 [68] | Case study during a 24h marathon; interstitial glucose measured continuously during the race. | 32-year-old male ultra-marathon runner (VO2max: 67.6 mL kg−1 min−1) | CGM (FreeStyle Libre, Abbott); Interstitial fluid | Nutrition intake during the week leading up to the 24 h ultramarathon was recorded using MyFitnessPal App. Speed was calculated from laps per hour. | Glucose levels remained stable during the race due to adequate CHO intake prior and during the race; No significant correlation with running speed. |
| Bowler et al., 2024 [69] | Non-randomized, controlled design with two 4-day trial periods, separated by three days; interstitial glucose measured continuously during the two trials | 12 elite race walkers; 7 males and 5 females (mean age: 22.5 ± 3.5 years, VO2max: 61.6 ± 7.3 mL kg−1 min−1) | CGM (Freestyle Libre 2, Abbott); Interstitial fluid | Participants were provided a standardized diet (225 kJ/kg/day, 8.5 g/kg/day CHO, 2.1 g/kg/day protein, 1.2 g/kg/day fat) during each trial. Exercise routine included steady state race-walk on day 1, economy and biomechanical testing on day 2, resistance training on day 3, and a 10 km race walk on day 4. | Glycemic variability in athletes was comparable to healthy individuals and ¯ than T2D, despite a high-CHO diet and intense training; Males had 24-hour mean glucose levels than females, even with standardized diet and exercise. |
| Parent et al., 2024 [70] | Prospective observational cohort study during a 156-km ultra-trail race; interstitial glucose measured continuously from a day before the race until 10 days after. | 55 ultra-endurance runners; 34 males and 7 females (mean age: 43.7 ± 9.6 years) | CGM (Freestyle Libre Pro IQ, Abbott); Interstitial fluid | Food intake data were collected the day before, during, and the day after the race. | No major glycemic events occurred during the race; Significant hyperglycemia risk was observed during recovery, up to 48 hours; Glycemic metrics did not affect performance or behavioral alertness. |
Table Legend: CGM: continuous glucose monitoring; CHO: carbohydrate; PROT: protein; T1D: type 1 diabetes; T2D: type 2 diabetes.
Table 5.
Practical recommendations for endurance athletes: Insights from systems biology.
| Nutritional Aspect | Foundational recommendations [3,4,85] | Systems biology-informed recommendations |
| Carbohydrate intake |
|
|
| Protein intake |
|
|
| Fat intake |
|
|
| Peri-workout substrate management |
|
|
| Hydration |
|
|
| Supplements |
|
|
| Body composition management |
|
|
Table Legend: BM: body mass, BW: Body weight.
Disclaimer/Publisher’s Note: The statements, opinions and data contained in all publications are solely those of the individual author(s) and contributor(s) and not of MDPI and/or the editor(s). MDPI and/or the editor(s) disclaim responsibility for any injury to people or property resulting from any ideas, methods, instructions or products referred to in the content. |
© 2024 by the authors. Licensee MDPI, Basel, Switzerland. This article is an open access article distributed under the terms and conditions of the Creative Commons Attribution (CC BY) license (http://creativecommons.org/licenses/by/4.0/).
Copyright: This open access article is published under a Creative Commons CC BY 4.0 license, which permit the free download, distribution, and reuse, provided that the author and preprint are cited in any reuse.


