
Submitted:
09 October 2024
Posted:
10 October 2024
You are already at the latest version
Abstract
New asphalt mixtures have been improved by using fibers (polypropylene, polyester, asbestos, carbon, glass, nylon, lignin, coconut, sisal, recycled rubber, PET, wood, bamboo and cellulose), reducing the temperature and compaction energy for their collocation, minimizing the impact on the environment, increasing the tenacity and resistance to cracking of hot mix asphalt (HMA), preventing asphalt drainage in a Stone Mastic Asphalt (SMA). Hence, this paper aims to evaluate the influence of the chemical (lignin content, ash, viscosity, degree of polymerization and elemental analysis), morphological (SEM), spectroscopic (FTIR-ATR and XRD) and calorimetric (ATG and DSC) properties of celluloses from bagasse Agave tequilana Weber var. Azul (ABP), corrugated paperboard (CPB) and commercial cellulose fiber (CC) as Schellenberg drainage (D) inhibitors of the SMA. The ABP was obtained through a chemical process by alkaline cooking, while CPB by a mechanical refining process. The chemical, morphological, spectroscopic and calorimetric properties were similar among the analyzed celluloses, but CPB and ABP cellulose are excellent alternatives to CC cellulose for inhibiting drainage. However, CPB is the most effective at low concentrations. This is attributed to its morphology, which includes roughness, waviness, filament length, orientation and diameter, as well as its lignin content and crystallinity.
Keywords:
asphalt drainage
; asphalt mixture
; cellulose pulp
; lignocellulosic
1. Introduction
The rapid development of urbanization, along with the increase in traffic load, volume, and speed, has negatively impacted the ecosystem through energy consumption, CO2 emissions, water discharges, and solid waste generation in pavement manufacturing [1,2]. Flexible pavements made with asphalt mix are of particular interest because they deteriorate under loading as they age, causing the wearing surface to become uneven for traffic [3]. Conventional mixes, such as hot mix asphalt (HMA), are very sensitive to several factors, including temperature, load level, load duration, and humidity [4]. Thus, the use of discontinuous granulometry asphalt mixes, such as Stone Mastic Asphalt (SMA), is becoming increasingly common, as they demonstrate good resistance to permanent deformation, wear, and the appearance of premature fatigue cracks compared to hot mix asphalt (HMA) [5]. Its texture provides greater contact adherence between the tire and the pavement, enhancing safety for the user [6]. SMA mixes typically have a coarser aggregate particle size composition and a higher asphalt content than HMA mixes, which necessitates the use of stabilizing fibers to prevent asphalt drainage [5,7,8]. Among the most commonly used fibers are lignocellulose fibers.
Lignocellulose is a naturally occurring material with a complex structure consisting of three main biopolymers: cellulose (a glucose polymer), hemicellulose (a polymer primarily composed of pentoses), and lignin (a phenolic polymer) [9,10]. The structure and composition of these biopolymers vary greatly depending on several parameters related to their source, such as the type of plant species and its growing conditions [9].
The most common lignocellulose fibers are derived from plants or waste paper and are added to the SMA asphalt mix as a stabilizer at concentrations between 0.3% and 0.5% [7] ], either fluffed or in pellets [4]. These fibers inhibit asphalt drainage in the mix, promoting better distribution of the asphalt and forming a thick, homogeneous film around the aggregates [8]. Considering this, De la Cruz Analya [8] demonstrated that for an optimum asphalt content of 6.52%, a percentage of 0.40% Sudaglass basalt fibers (L = 6 mm, thickness = 13 µm) was necessary, resulting in an asphalt drainage value of 0.10%. The study concluded that basalt fibers could substitute conventional cellulose fibers to stabilize the SMA mixture. Unfortunately, the cost of basalt fiber was found to be higher than that of cellulose. Huang et al. [4] aimed to achieve a better cost-benefit ratio and discovered that adding 0.40% cellulose-basalt fiber in a 50/50 ratio resulted in favorable drainage behavior of the asphalt mixture, with an asphalt drainage value of 0.125%. They concluded that hybrid modification could provide a more balanced cost-benefit performance. On the other hand, Preciado Bolívar & Sierra Martínez [11] compared two SMA mixtures: one containing 0.3% pelletized cellulose fiber and the other made with coconut husk fiber. The SMAs were tested for asphalt drainage, revealing that the addition of 0.05% coconut fiber inhibited asphalt drainage in the mix. Similarly, Oda et al. [5] provided a comparison in which they used natural coconut and sisal fibers alongside paper cellulose fibers added at 0.3% and 0.5% in an SMA mix with 6.8% asphalt content. They found that using coconut and sisal fibers at 0.5% resulted in asphalt drainage similar to that observed with paper cellulose fiber.
At the same time, vegetable fibers play an important role in SMA mixtures, as their use reduces contamination generated by these materials and is environmentally friendly [12]. Additionally, these fibers possess excellent mechanical and microstructural properties; they are biodegradable, non-abrasive, eco-adaptable, non-toxic, economical, and accessible [13,14]. They also have low density and a good strength-to-weight ratio, which means that the smaller the fibers are, the lighter and stronger they can potentially become [15,16]. Furthermore, the higher the cellulose content and crystallinity, the more resistant properties they will impart to the material to which they are added [14].
The bagasse of Agave tequilana Weber Var. Azul (ABF) is a residue generated from the production of tequila from the agave plant. Tequila is an internationally consumed liquor with a designation of origin, cultivated in a limited and exclusive manner in 181 municipalities across five Mexican states: Jalisco (125 municipalities), Michoacán (30), Tamaulipas (11), Nayarit (8), and Guanajuato (7) [17]. is a lignocellulosic material composed mainly of cellulose (70% to 80%), lignin (15% to 20%), and hemicellulose (5% to 10%) [18]. According to the Consejo Regulador del Tequila [19], between 2017 and 2023, an average of 1,680,286 tons of tequila agave were processed, with waste accounting for 40% of the total weight of the agave [20], resulting in an average ABF waste of 672,114 tons. This waste has been utilized to produce alcohols, organic acids, compost, paper, fuel, edible mushrooms, and animal feed. However, the generation rate of this waste exceeds its utilization [20,21,22]. Another lignocellulosic waste available on a massive scale is paperboard waste, which is also prone to recycling. However, these processes cannot be repeated indefinitely, as each cycle causes the fibers to lose strength, affecting the quality of the recycled paper. Consequently, the material often does not meet quality standards prior to the manufacturing process and is discarded.
The literature indicates that population growth and increased traffic have generated negative environmental impacts on pavement manufacturing. Conventional asphalt mixes (HMA) have been particularly affected due to their sensitivity to factors such as increased loads, temperature, and humidity. Consequently, the use of Stone Mastic Asphalt (SMA) mixes has been promoted, as they offer better resistance and safety. However, SMA mixes require a significant amount of asphalt, which can lead to drainage issues. To stabilize the asphalt and reduce drainage, lignocellulosic fibers are incorporated, thereby improving durability. Therefore, utilizing natural fibers from agro-industrial waste, such as agave bagasse and paperboard, can help lower the cost of SMA mixes while also minimizing their harmful environmental impact.
Therefore, the objective of this work is to evaluate the influence of the chemical properties (lignin and ash content, viscosity, degree of polymerization, and elemental analysis), morphological properties (SEM), spectroscopic properties (FTIR-ATR and XRD), and calorimetric properties (ATG and DSC) of celluloses derived from Agave tequilana bagasse (ABP), corrugated paperboard (CPB), and commercial cellulose (CC) as Schellenberg drainage (D) inhibitors in the SMA asphalt mixture. This evaluation aims to utilize these materials in developing value-added products, and to minimize the pollution generated by the tequila and paper industry wastes in the western region of Mexico.
2. Materials and Methods
2.1. Materials
The ABF was donated by Tequila Jose Cuervo La Rojeña (Tequila, Jalisco, Mexico), and the CPB, also known as Kraft, was donated by a paper company in Tala, Jalisco, Mexico. The CC was provided by Asphalt Pavement and Construction Laboratories S.A. de C.V. (Ixtlahuacán de los Membrillos, Jalisco, Mexico). Sodium hydroxide (NaOH, 97% purity), sulfuric acid (H₂SO₄, 97% purity), potassium iodide (KI, 97% purity), and sodium chlorite (NaClO₂, 97% purity) were acquired from Golden Bell Reactivos (Zapopan, Jalisco, Mexico). Anthraquinone (97% purity), cuprylenediamine (CED, 97% purity), sodium acetate (C₂H₃NaO₂), and glacial acetic acid (CH₃COOH) were obtained from Sigma-Aldrich (Toluca, Mexico). Potassium permanganate (KMnO₄, 97% purity) was supplied by Monterrey Reactivo Analítico (Monterrey, Nuevo Leon, Mexico). Sodium thiosulfate (Na₂S₂O₃, 96% purity) was obtained from Karal Reactivos Analíticos (León, Guanajuato, Mexico). Throughout all procedures, Milli-Q water with a resistivity of 18.2 MOhm x cm at 25°C was used.
2.2. Obtaining Celluloses
2.2.1. Cellulose from Agave Tequila Bagasse (ABP)
The procedure reported by Gallardo-Sánchez et al. [18] was followed to obtain the ABP. First, the ABF was washed and de-medullated, then subjected to a full drying process at ambient temperature. Subsequently, 1 kg of dry, clean bagasse (ABF) was placed in self-made batch steel reactor containing a solution of 20% NaOH and 0.1% anthraquinone (6:1 ratio), under a constant temperature of 170°C for 90 minutes and a pressure of 7.73 kg/cm² (110 psi) [18]. The cellulosic pulp obtained was washed with water to eliminate the residual liquor. The washed pulp was cleaning in a depurator (Lorentzen and Wettre, model F102, manufactured in Switzerland) with a 0.40 mm grid sieve to remove impurities. Finally, the ABP cellulose was fluffed using a universal mill (IKA, model Mühle M20, manufactured in the United States) to separate the pellets without disrupting the cellulose structure.
2.2.2. Cellulose from Corrugated Paperboard (CPB)
The CPB consists of three paper layers: two liner faces (internal and external) and a central layer formed by B-flute corrugated paper. The cellulose used in this work was obtained based on the assumption that a pulping process had already been conducted for the paperboard's manufacture. The corrugated paperboard was soaked in water until the pulp separated. It was then refined for 10 minutes using a Pila Valley refiner. Afterward, the pulp was air-dried at room temperature and finally processed in a universal mill (IKA, model Mühle M20, manufactured in the United States) to separate the fibers.
2.2.3. Commercial Cellulose (CC)
The commercial cellulose fiber (CC) used in this study is distributed in Mexico for drainage and viscosity control in asphalt mixtures. It is made from waste paper products, has a gray appearance, and is available in the market either in pellet form or as separate fibers. In this work, the fiber was used in its separate form as received.
2.3. Chemical Properties of Celluloses
For the three types of cellulose (Agave tequila bagasse ABP, corrugated paperboard CPB, and commercial CC), the Kappa Number (KN), ash content, viscosity, degree of polymerization (PD) and elemental analysis were determined. The procedure for each determination is described below.
2.3.1. Kappa Number (KN)
The KN was determined according to the standard TAPPI T236 om-06 [23]. A higher NK value indicates a higher lignin content. Once the KN value is known, the percentage of lignin (also known as “Klason” lignin) can be obtained using the following equation:
2.3.2. Ash Content
The ash content provides an approximate estimate of the quantity of mineral salts and other inorganic materials present in the cellulose. Based on the standard TAPPI T211 om-85 TAPPI T211 om-85 [24], the ash content is obtained using the following equation (2). In this case, the procedure was performed twice:
where: A is the weight of ash (g) and B is the weight of the ash sample without moisture (g).
2.3.3. Viscosity (µ) and Degree of Polymerization (DP)
To evaluate the degradation that the cellulose molecular chain may have experienced due to the pulping and bleaching processes for each one of the used sources, the viscosity value (µ) was obtained according to the standard norm TAPPI T230 om-19 [25]. Therefore, four determinations were made per cellulose and the value was calculated using equation (3):
where: tp is the time (s), it takes for the solution to pass through the viscometer and C is the constant of the capillary viscometer.
Using the relative viscosity (ηrel) calculated with equation (4), along with the data [η]c, the intrinsic viscosity (η) was obtained using equation (5):
where: to is the time (s), it takes for the solution without sample (blank) to pass through the viscometer, [η]c is the value obtained from table 3 of the standard ASTM D1795 [26], and c is the ratio between the weight of the sample (0.150 gr) and the solvent (30 ml).
Through the relationship between viscosity (µ) and intrinsic viscosity (η), a simple expression for the degree of polymerization (DP) is obtained, as shown in expression (6):
2.3.4. Elementary Analyses
The combustion elemental analysis technique can determine the total content of each element present in a sample, whether of organic or inorganic nature, and in both solids and liquids. The equipment used for this analysis was a combustion elemental analyzer (Leco model TruSpec® Micro, manufactured in the United States). In this analyzer, the elements are quantified relative to the initial weight of the sample, which is subjected to complete combustion at temperatures up to 970 °C. This article reports on the measurement of carbon, hydrogen, nitrogen, and sulfur oxide using this equipment.
2.4. Morphology of Celluloses
The morphology of the celluloses was analyzed using scanning electron microscopy (SEM) with a high-resolution microscope (TESCAN MIRA 3, Micra Nano-technology, Mexico City, Mexico). The analysis was conducted at an accelerating voltage of 10 kV and a working distance of 15 mm. Before analysis, each sample was coated with a gold layer through sputtering for 30 seconds using the SPI-module sputter coater (Micra Nanotecnología, Mexico City, Mexico).
2.4. Spectroscopy of Celluloses
2.4.1. Fourier Transform Infrared Spectroscopy (FTIR_ATR)
FTIR spectra were obtained for the three celluloses type using a spectro-photometer (Spectrum two; PerkinElmer, Mexico City, Mexico) employing the attenuated total reflectance (ATR) technique. The spectrum was constructed from an average of 36 scans over a frequency range of 4000 to 400 cm⁻¹, and this procedure was performed in duplicate.
2.4.2. X-ray Diffraction (XRD)
X-Ray Diffraction (XRD) analysis was conducted using an X-ray diffractometer (Malvern Panalytical, model Empyream, Mexico City, Mexico) operating at 40 kV and 30 mA. The analysis was performed with an incidence angle ranging from 5° to 70°, a step size of 0.2°, and a duration of 30 seconds per step, utilizing CuKa radiation, a Ni filter, and a graphite monochromator.
2.5. Calorimetric Properties of Celluloses
Differential Scanning Calorimetry (DSC) and Thermogravimetric Analysis (TGA) were conducted on each cellulose sample using a TA Instruments DSC Discovery calorimeter (manufactured in the United States and provided by Waters S.A. de C.V., Ciudad de México, México). The DSC analysis involved heating the samples from -30 °C to 130 °C, followed by cooling and reheating from -30 °C to 400 °C, at a rate of 10 °C/min. TGA measurements were performed using a TA Instruments Discovery TGA (also manufactured in the United States and provided by Waters S.A. de C.V.) across a temperature range of 50 °C to 600 °C with a heating ramp of 20 °C/min.
2.6. SMA Asphalt Mix
Schellenberg drainage tests (D) were performed on SMA asphalt mixtures using PG 64-16 asphalt with the addition of ABP, CPB, and CC cellulose, each tested independently. The AASHTO 325 standard [7] specifies that the percentage of commercial cellulose in an SMA mix should range from 0.3 to 0.5% by weight of the aggregates. Therefore, SMA asphalt mixtures were produced using various cellulose concentrations: 0.0, 0.1, 0.2, 0.25, 0.3, 0.4, 0.5, 0.7, and 1.0% by weight relative to the coarse aggregates.
Based on the SMA asphalt mix design with a nominal size of 9.5 mm, as developed for commercial cellulose by Magaña-Orozco [27], and meeting the permissible requirements established in the AASHTO 325 standard [7], the particle size distribution of the coarse and fine aggregates used in the SMA mix design was as follows: 15.5% 12.7 mm (1/2“) seal, 54.5% 9.5 mm (3/8”) seal, 25% sand, and 5.0% calcium carbonate. The optimum asphalt content (AC) was determined to be 8.0%. Based on this design, the grain size distribution and AC of the SMA mix were kept constant, while the cellulose concentration was varied.
2.6.1. Schellenberg Drainage (D)
Asphalt drainage in the SMA mix was evaluated using the Schellenberg method, which is recommended for discontinuous mixes [28]. This method determines the amount of asphalt that drains due to an excess of asphalt in the mix, using equation (7). The procedure involves heating the aggregates, asphalt, and cellulose to a temperature of 150 ± 5 °C. The mixing process is then carried out, and when the mixture reaches a weight of 1.0 kg, it is placed into a glass precipitate beaker and introduced into an oven at a constant temperature of 150 ± 5 °C for one hour. Finally, the material in the glass beaker is poured into a container, and the drained residue is weighed.
where: D is the material drainage in %, W1 is the weight of the glass beaker in g, W2 is the weight of the glass beaker plus the total material in g and W3 is the weight of the glass beaker plus the retained material in g.
During the pouring of the material from the glass beaker into the container, no pressure should be applied. The material must simply fall freely. This procedure was followed for all SMA mixtures prepared with the different celluloses (ABP, CPB, and CC) at concentrations of 0.0, 0.1, 0.2, 0.25, 0.3, 0.4, 0.5, 0.7, and 1.0% by weight of the aggregates. Three determinations were conducted for each concentration.
3. Results and Discussion
3.1. Chemical Properties of Celluloses
During the alkaline cooking process of Agave tequilana Weber var. Azul (ABF), he yields of ABP cellulose was 38%, which is similar to the 40% yield reported by Gallardo-Sánchez et al. [18], who used a rotary reactor in their study. In the case of the mechanical purification process of cellulose from corrugated paperboard, a 100% yield was obtained.
Figure 1 shows images of the studied cellulose type; (a) ABP in brown color, (b) CPB in a darker brown shade than that of ABP due to the amount of lignin present in the cellulose, and (c) commercial cellulose in gray color.
In addition to the color of cellulose, the KN serves as an indicator of the lignin content in pulp. Specifically, a higher KN value indicates a greater lignin concentration. [23]. Alkaline cooking of Agave tequilana bagasse (ABF) resulted in delignification. Table 1 shows the chemical properties of each studied cellulose type. The KN value of ABF is 118.7 ± 0.7, indicating a lignin content of 17.8 ± 0.1%. These values are consistent with those reported by Pérez-Pimienta et al. [29], which range from 13 to 20 for Agave tequilana bagasse. During the cooking process, ABP cellulose was obtained from the ABF. This process produced ABP with an KN value of 13.9 ± 0.8, resulting in a lignin content of 2.1 ± 0.1%, evidencing a delignification of 88%. This indicates that ABP cellulose has a lower lignin content compared to the values reported by Gallardo-Sánchez et al. [18], who found an KN value of 23 ± 3 for ABP. Cellulose from corrugated paperboard (CPB) exhibited an KN value of 67.0 ± 0.4, corresponding to a lignin content of 10.1 ± 0.1%. In contrast, CC showed KN and percent lignin values of 30.9 ± 2.4 and 4.6 ± 0.4%, respectively.
The ash content corresponds to the remaining material calculated based on the dry weight of the sample after incineration. The TAPPI T211 om-85 [24] states that, in most cases, the ash content of paper and paperboard consists of inorganic chemical and mineral residues from pulp manufacturing, as well as metal materials from piping and machinery. Table 1 shows that ABP cellulose has the lowest ash content at 7.4 ± 0.9%, while CC cellulose presents the highest ash content (20.7 ± 0.1%) compared to the other celluloses. This higher content is due to the presence of inks, heavy metals, greases, and mineral fillers such as calcium carbonate, along with high starch content, which were not the focus of this study. In this context, Singh et al. [30] mention that the more cellulose is recycled, the more impurities it will contain, resulting in a higher ash content. Furthermore, Singh et al. [29] describe the ash content of corrugated paperboard as ranging from 1% to 10%, making the obtained value for CPB ash content (7.5 ± 0.2%) consistent with the literature.
ABF fiber present a low value of 2.6 ± 1.5%, where Pérez-Pimienta et al. [29] report an ash content for Agave tequilana bagasse between 4% and 6%. Notably, ABP shows an ash content of 7.4 ± 0.9% (see Table 1). Despite both ABF and ABP originating from the same source, ABF grown in volcanic soils tends to accumulate silicate, potassium, and calcium crystals [31], which are retained in the ABF fiber and are difficult to remove during the pulping process. Therefore, after delignification of ABP cellulose through the alkaline cooking process, the ratio of inorganic to organic matter increases, resulting in an increase in the ash content of ABP.
Table 1 shows the intrinsic viscosity (η) and the degree of polymerization (DP) of the celluloses used. CPB cellulose exhibits η and DP values of 505.78 ± 0.68 mL/g and 729.23 ± 1.1, respectively. These values are significantly higher compared to those of ABP and CC celluloses. In the second instance, ABP cellulose shows η = 482.72 ± 14.22 mL/g and DP = 692.60 ± 22.5. These values are lower than those reported by Gallardo-Sánchez et al. [18], which indicate an intrinsic viscosity of 830 mL/g and a degree of polymerization of 750 from a cellulose bleaching process. However, the DP value obtained from ABP (see Table 1) is similar to that reported by Ghosh et al. [31], where they studied rayon soluble grade cellulose with a degree of polymerization of 678.27, which is associated with a high content of short fibers. The lowest η and DP values are presented by CC cellulose due to its origin from recycled paper, which has undergone multiple recycling processes. This has caused modifications in the molecular structure of the cellulose during pulping, resulting in values of η = 302.36 ± 46.85 mL/g and DP = 413.45 ± 70.7. Notably, as the value of η increases, the DP value of cellulose also increases, as described by Li et al. [32]. The DP indicates the size of the polymeric chains; CPB has a higher DP and contains longer, more flexible cellulose fibers compared to ABP and CC.
On the other hand, Figure 2 shows the elemental analysis of each of the celluloses used. As they contain abundant cellulose and hemicellulose, a significant presence of hydrogen (H) and high carbon (C) content is observed. However, there are no significant changes in the C and H elements when comparing the ABF fiber with the ABP, CPB, and CC celluloses. The results of the elemental analysis show that the C values are 28.96 ± 2.35%, while the H values are 2.62 ± 0.24%. Regarding nitrogen (N), which is associated with the presence of lignin, the ABF presented an N content of 2.62%. When pulping is performed, accompanied by delignification to produce ABP cellulose, the N value drops to 0.77%, the lowest among the celluloses. This coincides with its lignin percentage of 2.1 ± 0.1%, which is also the lowest compared to the other celluloses. CPB cellulose, having the highest lignin content (% lignin = 10.1 ± 0.1), shows the highest N value at 1.33%. CC cellulose exhibits a lignin content of 4.6 ± 0.4% with a nitrogen content of 0.85%. Considering the sulfur oxide (SO) content found, the values are consistently below 1%, so this element is disregarded due to the potential measurement error of the equipment.
3.2. Morphology of Celluloses
Figure 3a shows the micrograph of the transversal section of a long ABF fiber at a scale of 100 µm. The observed morphology is typical of bagasse fiber, formed by the union of several fibrils with an average diameter of approximately 254.71 ± 6.89 µm. The fibrils are packed together to form larger diameter fibrils, resembling an electric cable, with noticeable small spaces between them. This structure includes lignin, cellulose, amorphous waxes, and low molecular weight sugars, characteristic of bagasse from Agave tequilana Weber var. Azul. The fiber surface is not uniform; it has undulations along its length and small pores that facilitate water passage and retention, as shown by Gallardo-Sánchez [18].
In Figure 3b, observed at a scale of 500 µm, ABP cellulose shows separation of the fibrils due to the alkaline cooking process, which eliminated 88% of the lignin and hemicelluloses, as well as low molecular weight polysaccharides. ABP cellulose features thin fibrils, with lengths similar to those of ABF but with considerably smaller diameters (a reduction of 86%), averaging 35.63 ± 10.78 µm. The fibrils exhibit a rough, corrugated, and undulated surface, which may enhance adhesion with asphalt, as described by Li et al. [33].
Figure 3c displays the morphology of CPB fibers at a scale of 500 µm. The lengths of these fibers are similar to those of ABF and ABP fibers; however, their diameters are around 18.44 ± 6.82 µm, representing reductions of 93% and 48% compared to ABF and ABP fibers, respectively. The morphology of commercial cellulose, shown in Figure 3d at a scale of 500 µm, presents diameters of approximately 29.26 ± 8.56 µm, closely resembling the shape of CPB cellulose. However, the fibril surface is much more corrugated and non-uniform, displaying folds and openings along the longitudinal axis. This condition is attributed to the high degree of recycling of CC cellulose, indicating significant structural damage consistent with its degree of polymerization (DP).
3.3. Spectroscopy of Celluloses
3.3.1. Fourier Transform Infrared Spectroscopy (FTIR_ATR)
Cellulose fibers contain hydroxyl groups, methyl and side chains, aromatic groups, conjugated double bonds, and other active groups. From this, it can be deduced that there are several functional groups in both cellulose fibers and asphalt, indicating potential affinity between them, as described by Li et al. [34]. The spectra of the celluloses are presented in Figure 4, where it can be observed that the celluloses, regardless of their origin, display similar spectra. At a transmittance value of 3334 cm⁻¹, there is a broad stretching band corresponding to the O-H groups present in ABF, ABP, CPB, and CC celluloses. This band contributes to the formation of hydrogen bonds in the structure of carbohydrates and cellulose [35,36]. The low-intensity peak at 2893 cm⁻¹ present in all four celluloses corresponds to the stretching vibration of the C-H group, primarily due to the presence of cellulose and hemicellulose [18,34,35,37,38].
The absorption band at 1630 cm⁻¹ present in ABP, CPB, and CC cellulose, and at 1607 cm⁻¹ in ABF fiber, is attributed to the absorbed water in the lignocellulosic materials [18,36,37]. Even though the celluloses were subjected to a previous drying process, the FTIR tests provide evidence that they were not completely dry, as indicated by Ma et al. [37]. The band found at 1360 cm⁻¹ is related to the bending vibrations of the C-H and C-O groups in polysaccharide aromatic rings [36], while a peak at 1030 cm⁻¹ represents the C-O bond attributed to the polysaccharides present in cellulose [18,34,37].
At a transmittance of 1730 cm⁻¹, the ABF fiber shows a stretching band of the carbonyl group (C=O), attributed to the presence of acetyl esters and carbonyl aldehydes in the hemicellulose and/or lignin [18,34,36]. At 1240 cm⁻¹, a peak is associated with the out-of-plane stretching vibration of the C-O bond in the aryl group of lignin [36,37]. These two peaks present in ABF fiber have disappeared in ABP cellulose due to the delignification process but are observed with very low intensity in CPB and CC celluloses.
Regarding the crystallinity of celluloses, at a transmittance of 1050 cm-1, a C-O-C band corresponding to vibration of the pyranose ring was identified. Additionally, a band at 896 cm⁻¹ is characteristic of the β-glycosidic bond between the anhydroglucose units of cellulose [36]. Finally, at 1425 cm-1 the transmittance corresponds to the CH2-symmetric bending of cellulose [35], which is most intensely observed in CC and CPB celluloses.
Each peak area of the FTIR spectra shown in Figure 4 was obtained through deconvolution. Table 2 presents the area ratios, relating the area of each FTIR peak to the area of the peak at 896 cm⁻¹, which is constant across all spectra, as reported by Gallardo-Sánchez et al. [18]. Analyzing the transmittance signals at 1730 and 1240 cm⁻¹, which are associated with the presence of lignin and/or hemicelluloses, it is notable that the ABF fiber presents the highest value, indicating a greater presence of lignin. The ABP shows a lower value compared to ABF due to the delignification that occurs during alkaline cooking. In contrast, the highest area ratios among the celluloses are found in paperboard cellulose (CPB), while CC cellulose exhibits intermediate values. For the peaks at 1630, 2893, and 1050 cm⁻¹, attributed to adsorbed water and C-H and C-O-C groups, respectively, the area ratios remain similar for ABP, CPB, and CC.
3.4. X-ray Diffraction (XRD)
The degree of crystallinity of the cellulose was determined using X-ray diffraction (XRD). The sharp peaks are associated with crystalline phases, while the broader peaks correspond to amorphous phases [18,21]. Figure 5 displays the diffractograms for ABF, ABP, CPB, and CC celluloses. Notably, there are signals associated with cellulose at varying magnitudes and amplifications. A small, unique peak at 12° in CC cellulose is related to type II cellulose, which has low crystallinity [39]. The peaks around 16° represent the amorphous components, such as low molecular weight hemicellulose, lignin, and wax compounds [33,38], identified as the (1 -1 0) plane [18,38,40]. These peaks exhibit higher magnitudes in CPB and CC celluloses. At approximately 23°, there is a peak representing the crystalline portion of cellulose [33], associated with the crystalline plane (2 0 0). This peak is more intense in CPB and ABP celluloses and less intense in CC cellulose, indicating its low crystallinity. Upon analyzing the ABF fiber and ABP cellulose, it is observed that this peak is sharper in ABP. This increase in the crystalline part (at 22.7°) is attributed to the partial removal of hemicelluloses and lignin during the alkaline cooking process. This observation is consistent with reports by Navarro-Hermosillo [37] & Gallardo-Sánchez [18], who noted a peak in the crystalline band at 22° for nanocrystals and soluble-grade cellulose pulp derived from the bagasse of Agave tequilana Weber var. Azul.
Li et al [33] Li et al. [33] mentioned that the crystallinity of a fiber is related to its thermal stability, absorption capacity, and mechanical properties. According to equations (8) and (9), the crystallinity index (CI) and the percentage of crystallinity (%Cr) can be calculated as follows:
where: I22 is the maximum intensity of reflection in the crystalline planes of cellulose (22.7°, Figure 5), Iam is the maximum intensity of reflection in the amorphous planes (16° for CPB and ABP, and 2θ= 12° for CC cellulose, Figure 5).
Derived from this mathematical process, a crystallinity index (CI) of 0.44 and 0.23 was obtained for CPB and ABP cellulose, respectively, while a value of 0.17 was obtained for CC cellulose. Regarding %Cr, values of 64.2% and 56.4% were obtained for CPB and ABP cellulose, respectively, with 54.8% for CC cellulose. This indicates that CPB cellulose contains more than 60% crystalline composition, while ABP has 56.4% and CC has 54.8%. These percentages suggest that the molecules or atoms of cellulose are organized in an ordered and repetitive manner, demonstrating that CPB exhibits greater strength and hardness compared to ABP and CC. However, CC cellulose has less rigidity and resistance due to its pulping process. This observation is supported by the total crystallinity index (TCI) shown in Table 3, which is defined as the absorbance ratio obtained by relating the transmittances at 1360 cm⁻¹ and 2893 cm⁻¹ [42,43], as derived from the FTIR spectra. From Table 3, it is evident that the highest TCI is observed in CPB cellulose, followed by ABP, with the lowest value found in CC cellulose.
3.5. Calorimetric Properties of Celluloses
The TGA analysis was performed to identify the thermal resistance behavior of the basic compounds in each cellulose, as these will be subjected to working temperatures of 150 ± 5 °C during the manufacture of SMA asphalt mixtures for flexible pavements. The TGA results are shown in Figure 6a, indicating the weight loss as the temperature increases in the studied celluloses. Remarkably, as shown in Figure 6a, over the temperature range of 50° to 190°, there is a small weight loss of about 2%, attributed to the evaporation of physically absorbed water [41,44,45,46]. Urthermore, at temperatures between 275 °C and 402 °C, ABP and CC celluloses experience material losses of 69% and 78%, respectively, while ABF and CPB celluloses lose a high percentage of material, at 90% and 92% in relation to their initial weight. It is evident that all celluloses suffer the greatest weight loss between 275 °C and 402 °C, which is mostly attributed to the presence of cellulose, hemicellulose, and other unstable materials [33,47]. Notably, ABP and CC demonstrate higher thermal degradation resistance throughout the entire temperature range tested.
Figure 6b shows the derivative of TGA weight loss against temperature. It is observed that the maximum degradation point occurs in CPB cellulose at a temperature of 374 °C. Similarly, the degradation point of ABP cellulose is at 370 °C, while for CC cellulose, it occurs at 368 °C, which is the lowest value. The degradation point as a function of temperature is associated with both the percentage of crystallinity (%Cr) and the degree of polymerization (DP). This indicates that CPB cellulose presents a superior crystalline arrangement (%Cr = 64.2%), as observed in the diffractograms, due to its high degree of polymerization (DP = 729.23). Therefore, this cellulose requires a higher temperature to degrade. In contrast, CC cellulose has the lowest degradation point at the lowest temperature (368 °C), attributed to its lower crystallinity (%Cr = 54.8%) and lower degree of polymerization (DP = 413.45).
Likewise, the thermograms obtained from DSC tests (see Figure 6c) show an endothermic peak observed in the ABF fiber and all the studied celluloses (ABP, CPB, and CC). It is notable that between 115 °C and 125 °C, there is a loss of water due to evaporation, as was observed in the TGA results. A second endothermic peak has been detected in ABF and ABP, in the range from 230 °C to 240 °C. This temperature is associated with the fusion process that may occur simultaneously with the degradation of the material, consistent with what was reported by Ma et al. [33] & Navarro-Hermosillo [37], who noted that cellulose fusions occur in the range of 227 °C to 360 °C. Therefore, cellulose degradation in ABF and ABP was observed in the DSC before the total degradation of cellulose identified by TGA. Since the DSC thermograms were conducted up to 300 °C, the fusion of CPB and CC celluloses was not observed. Finally, based on the results obtained from TGA and DSC, it can be deduced that the ABF fiber and the ABP, CPB, and CC celluloses exhibit thermal stability at the working temperatures of asphalt mix production (150 ± 5 °C, [28]).
3.6. Schellenberg Drainage (D)
According to the AASHTO M325 standard [7], it is established that the drainage (D) in an SMA mix should not exceed 0.30%. Figure 7 shows the mean drainage value (Dmean) of the SMA asphalt mixture fabricated using different concentrations of the studied celluloses (Ccelulose). The drainage values were obtained from three determinations performed for each concentration and type of cellulose.
From Figure 7, it is evident that CPB cellulose affects the SMA asphalt mixture from a cellulose concentration of 0.15%, as the mean drainage is less than the 0.30% established by the standard. Additionally, the AASHTO M325 [7] states that the use of commercial cellulose fiber (CC) should be in the range of 0.30% to 0.50%. Figure 7 shows that at 0.15% CC, the drainage is also less than 0.30%. Similarly, the use of ABP at 0.25% reduces the drainage of the SMA mixture below the 0.30% limit established by the standard. Based on the above, it is concluded that ABP and CPB demonstrate a similar performance to CC cellulose, indicating that celluloses derived from agave and paperboard show effective stabilization behavior against drainage in the asphalt mixture.
Figure 8 shows the Dmean values at the cellulose concentration of 0.30% and 0.40% added to the SMA asphalt mixture. In the first instance, a D value of 0.062 ± 0.013% [11,48] is observed for the CC cellulose, which is taken as a reference since it is the commercially distributed cellulose. For a D value of 0.062 ± 0.005%, CPB cellulose closely approximates the behavior of CC cellulose, making it an excellent candidate to inhibit the drainage of the SMA mixture to the same magnitude as CC cellulose.
On the other hand, ABP cellulose is effective at a concentration of 0.30%, with a D value of 0.114 ± 0.027%. This value is higher than that of CC cellulose but still below the limit of 0.3% specified by the standard [7]. Therefore, at a concentration of 0.30%, ABP is a functional quantity for inhibiting drainage in the SMA mixture. However, to achieve the D value of CC cellulose, an additional 0.10% ABP concentration is necessary, resulting in an ideal concentration of 0.40% for ABP cellulose, which yields a D value of 0.059 ± 0.009%.
Finally, an analysis of variance (ANOVA) of the drainage value (D) was performed between the concentration and type of cellulose used (ABP, CPB and CC) using OriginPro® software. For this study, nine concentrations were utilized: 0, 0.1, 0.2, 0.25, 0.3, 0.4, 0.5, 0.7, and 1% for each type of cellulose studied, with three repetitions per concentration. The ANOVA analysis was conducted at a 95% confidence level, revealing that both concentration and cellulose type were significantly different (p < 0.05), and that the interaction between concentration and cellulose type was also significant (p < 0.05).
From the above, it can be concluded that concentration and type of cellulose have a significant effect on the drainage response, demonstrating that ABP and CPB cellulose are viable alternatives to inhibit the drainage of the SMA mixture to values similar to those achieved by CC cellulose.
4. Conclusions
This paper focused on evaluating the influence of the chemical (lignin and ash content, viscosity, degree of polymerization and elemental analysis), morphological (SEM), spectroscopic (FTIR-ATR and XRD) and calorimetric (ATG and DSC) properties of celluloses from Agave tequilana bagasse (ABP), corrugated paperboard (CPB) and commercial cellulose fiber (CC) as Schellenberg drainage (D) inhibitors of the SMA, in order to take advantage of these materials in the generation of value-added products and minimize the impact on the environment. The following conclusions are derived from this research:
- Chemical Properties: The ash content and degree of polymerization were found to have no significant effect on the absorption of asphalt or in mitigating drainage in the asphalt mix. However, the Kappa Number, which is related to lignin content, and the nitrogen (N) content show a relationship. If the lignin content is very low, as observed in ABP cellulose, a higher concentration of cellulose is required to inhibit drainage effectively.
- Morphological Characteristics: The morphology of the celluloses revealed cylindrical longitudinal shapes, similar to filaments, with a parallel structure, some undulations, rough or corrugated texture, and varying filament diameters. This directly affects the absorption of asphalt, as it enhances adhesion between the fibers and the asphalt [33,44]. In this regard, ABP cellulose has a smoother fiber surface, lacking undulations, and features larger filament diameters. In contrast, CPB and CC celluloses exhibit more corrugation and smaller diameters, providing greater contact surface between the cellulose and the asphalt, which improves absorption and adhesion.
- Spectroscopic Analysis: Spectroscopy indicates that ABP, CPB, and CC celluloses exhibit similar spectral characteristics, with a prominent O-H stretching band at 3334 cm⁻¹, contributing to the formation of hydrogen bonds in the carbohydrate structure. C-H and C-O vibrations, associated with cellulose and hemicellulose, appear in all three celluloses at 2893 cm⁻¹. Water absorption is evident at 1630 cm⁻¹ in all three pulps. Lignin removal in ABP is shown by faint bands at 1730 cm⁻¹ (C=O) and 1240 cm⁻¹ (C-O), which are less noticeable in CPB and CC. Crystallinity bands at 896 cm⁻¹ and 1050 cm⁻¹ indicate the presence of β-glycosidic bonds, with intensification as pulping progresses, becoming more prominent in CPB and CC.
- Crystallinity Assessment: The crystallinity obtained from X-ray diffraction demonstrates evidence of crystallinity among the three celluloses. CPB has a crystallinity index (CI = 0.44) and percentage of crystallinity (%Cr = 64.2%), indicating that more than 60% of its structure is crystalline, which contributes to its greater strength and toughness. ABP presents a CI of 0.23 and %Cr of 56.4%, showing lower crystallinity compared to CPB. CC has the lowest values (CI = 0.17 and %Cr = 54.8%), suggesting low crystallinity, stiffness, and strength. This indicates that the pulping process affects the structural organization of cellulose, with CPB being the most crystalline and resistant. This observation is corroborated by the total crystallinity index (TCI) and is related to the degree of polymerization (DP), both of which are higher in CPB, followed by ABP, with CC cellulose exhibiting the lowest values.
- Performance as Drainage Stabilizers: CPB and ABP are excellent alternatives to CC cellulose for drainage stabilization, with CPB being the most effective at low concentrations. This effectiveness is attributed to its morphology—including roughness, waviness, filament length, orientation, and diameter, as described by Sahu and Gupta [49] —as well as its lignin content and degree of crystallinity.
In conclusion, the production of value-added products derived from the residues of the tequila and paperboard industries represent an alternative solution as a drainage inhibitor in SMA asphalt mixtures. In addition to their excellent chemical and physical properties, these materials exhibit good thermal stability at the temperatures to which cellulose is subjected during the manufacture of asphalt mixtures.
Author Contributions
Conceptualization, L.Y.C-S.; J.A.H.; P.L.-C. and E.R.M.-B.; methodology, L.Y.C-S.; J.A.H.; E.B.F.O.; P.L.-C. and E.R.M.-B.; software, L.Y.C-S.; J.R.G.-G.; D.A.-C.; E.B.F.O.; D.E.H.; M.A.G.-S. and E.R.M.-B.; validation, J.A.H.; D.E.H.; M.A.G.-S.; P.L.-C. and E.R.M.-B.; formal analysis, L.Y.C-S.; J.R.G.-G.; D.A.-C.; D.E.H. and M.A.G.-S.; investigation, L.Y.C-S.; J.R.G.-G.; D.A.-C.; M.A.G.-S.; P.L.-C. and E.R.M.-B.; resources, J.A.H.; E.B.F.O.; D.E.H. and P.L.-C.; data curation, L.Y.C-S.; J.R.G.-G.; D.A.-C.; M.A.G.-S.; P.L.-C. and E.R.M.-B.; writing—original draft preparation, L.Y.C-S.; J.R.G.-G.; D.A.-C.; P.L.-C. and E.R.M.-B.; writing—review and editing, L.Y.C-S.; J.A.H.; J.R.G.-G.; D.A.-C.; E.B.F.O.; D.E.H.; M.A.G.-S.; P.L.-C. and E.R.M.-B.; visualization, L.Y.C-S.; J.R.G.-G.; D.A.-C.; P.L.-C. and E.R.M.-B.; supervision, L.Y.C-S.; J.A.H.; J.R.G.-G.; D.A.-C.; E.B.F.O.; D.E.H.; M.A.G.-S.; P.L.-C. and E.R.M.-B.; project administration, P.L.-C. and E.R.M.-B.; funding acquisition, P.L.-C.; All authors have read and agreed to the published version of the manuscript.
Funding
This research received no external funding.
Institutional Review Board Statement
Not applicable.
Informed Consent Statement
Not applicable.
Data Availability Statement
All data included in this study are available upon request by contact with the corresponding author.
Acknowledgments
The authors of this paper would like to extend their gratitude to the National Council of Science and Technology (CONACYT), University of Guadalajara, and the Asphalt Pavement and Construction Laboratories (APCL) that supplied the mineral aggregate, asphalt binder, additives, and laboratory equipment for their valuable support and contributions.
Conflicts of Interest
The authors declare no conflicts of interest.
References
- Hassani, A.; Taghipoor, M.; Karimi, M.M. A State of the Art of Semi-Flexible Pavements: Introduction, Design, and Performance. Constr Build Mater 2020, 253, 119196. [CrossRef]
- Thives, L.P.; Ghisi, E. Asphalt Mixtures Emission and Energy Consumption: A Review. Renewable and Sustainable Energy Reviews 2017, 72, 473–484.
- Solatiyan, E.; Bueche, N.; Carter, A. A Review on Mechanical Behavior and Design Considerations for Reinforced-Rehabilitated Bituminous Pavements. Constr Build Mater 2020, 257, 119483. [CrossRef]
- Huang, Y.; Liu, Z.; Liu, L.; Zhang, Y.; Xu, Q. Hybrid Modification of Stone Mastic Asphalt with Cellulose and Basalt Fiber. Advances in Materials Science and Engineering 2020, 2020. [CrossRef]
- Oda, S.; Leomar Fernandes, J.; Ildefonso, J.S. Analysis of Use of Natural Fibers and Asphalt Rubber Binder in Discontinuous Asphalt Mixtures. Constr Build Mater 2012, 26, 13–20. [CrossRef]
- Rubio, B.; Miranda, L.; Costa, A.; Sánchez, F.; Lanchas, S.; Expósito, S. Diseño de Mezclas SMA, Como Capa de Rodadura e Intermedia, Para Su Empleo En España; 2012;
- AASHTO M325 Standard Specification for Stone Matrix Asphalt (SMA). 2012.
- De la Cruz Analya, E. Estabilización de Mezclas Asfálticas Stone Mastic Asphalt Utilizando Fibras de Basalto Como Sustituto de Las Fibras de Celulosa, Universidad Ricardo Palma, Lima, Perú. Tesis de Maestría, 2019.
- Morán, D. Modelos de Biorrefinería-La Biorrefinería Lignocelulósica Available online: https://biorrefineria.blogspot.com/2016/04/modelos-de-biorrefineria-lignocelulosica.html.
- Sierra, E.; Alcaraz, J.; Valdivia, Á.; Rosas, A.; Hernández, M.; Vilvaldo, E.; Martínez, A. Bagazo de Agave: De Desecho Agroindustrial a Materia Prima En Las Biorrefinerías Available online: http://ciencia.unam.mx/leer/1112/bagazo-de-agave-de-desecho-agroindustrial-a-materia-prima-en-las-biorrefinerias-.
- Preciado Bolívar, C.A.; Sierra Martínez, C.E. Utilización de Fibras Desechas de Proceso Industriales Como Estabilizador de Mezclas Asfálticas SMA, Pontificia Universidad Javeriana, 2013.
- Karimah, A.; Ridho, M.R.; Munawar, S.S.; Adi, D.S.; Ismadi; Damayanti, R.; Subiyanto, B.; Fatriasari, W.; Fudholi, A. A Review on Natural Fibers for Development of Eco-Friendly Bio-Composite: Characteristics, and Utilizations. Journal of Materials Research and Technology 2021, 13, 2442–2458. [CrossRef]
- Sanjay, M.R.; Madhu, P.; Jawaid, M.; Senthamaraikannan, P.; Senthil, S.; Pradeep, S. Characterization and Properties of Natural Fiber Polymer Composites: A Comprehensive Review. J Clean Prod 2018, 172, 566–581. [CrossRef]
- Varghese, A.M.; Mittal, V. Polymer Composites with Functionalized Natural Fibers. Biodegradable and Biocompatible Polymer Composites: Processing, Properties and Applications 2018, 157–186. [CrossRef]
- Kozłowski, R.M.; Mackiewicz-Talarczyk, M.; Barriga-Bedoya, J. New Emerging Natural Fibres and Relevant Sources of Information. Handbook of Natural Fibres: Second Edition 2020, 1, 747–787. [CrossRef]
- Abtahi, S.M.; Sheikhzadeh, M.; Hejazi, S.M. Fiber-Reinforced Asphalt-Concrete - A Review. Constr Build Mater 2010, 24, 871–877.
- Delgado-Ramírez, C.; Núñez-Palenius, H. Establecimiento de Agave (Agave Tequilana Weber Var. Azul) En Un Sistema de Inmersión Temporal (SIT). Jóvenes en la Ciencia 2015, 1, 54–59.
- Gallardo-Sánchez, M.A.; Hernández, J.A.; Casillas, R.R.; Vázquez, J.I.E.; Hernández, D.E.; Martínez, J.F.A.S.; Enríquez, S.G.; Balleza, E.R.M. Obtaining Soluble-Grade Cellulose Pulp from Agave Tequilana Weber Var. Azul Bagasse. Bioresources 2019, 14, 9867–9881. [CrossRef]
- Consejo Regulador del Tequila (CRT) Datos Estadísticos de Producción Total Available online: https://www.crt.org.mx/EstadisticasCRTweb/.
- González-García, Y.; González-Reynoso, O.; Nungaray-Arellano, J. Potencial Del Bagazo de Agave Tequilero Para La Producción de Biopolímeros y Carbohidrasas Por Bacterias Celulolíticas y Para La Obtención de Compuestos Fenólicos. eGnosis 2005, 3, 18.
- Hidalgo-Reyes, M.; Caballero-Caballero, M.; Hernández-Gómez, L.H.; Urriolagoitia-Calderón, G. Chemical and Morphological Characterization of Agave Angustifolia Bagasse Fibers. Bot Sci 2015, 93, 807. [CrossRef]
- Kestur G., S.; Flores-Sahagun, T.H.S.; Dos Santos, L.P.; Dos Santos, J.; Mazzaro, I.; Mikowski, A. Characterization of Blue Agave Bagasse Fibers of Mexico. Compos Part A Appl Sci Manuf 2013, 45, 153–161. [CrossRef]
- TAPPI T236 om-06 Kappa Number of Pulp. Technical Association of the Pulp and Paper Industry. 2006, 10–14.
- TAPPI T211 om-85 Cenizas En Madera y Pulpa. Technical Association of the Pulp and Paper Industry. 1985.
- TAPPI T230 om-19 Viscosity of Pulp (Capillary Viscometer Method). Technical Association of the Pulp and Paper Industry. 2019, 27–33.
- ASTM D1795 Standard Test Method for Intrinsic Viscosity of Cellulose. ASTM International 2013, 1–6.
- Magaña-Orozco, M. Evaluación de Bagazo de Agave Como Agente Estabilizador de Asfalto En El Diseño de Una Mezcla SMA, Universidad de Guadalajara. Tesis de Licenciatura, 2022.
- Nikolaides, A.F. Bituminous Mixtures & Pavements VI; CRC Press.; 2015; ISBN 978-1-315-66816-1.
- Pérez-Pimienta, J.A.; López-Ortega, M.G.; Sanchez, A. Recent Developments in Agave Performance as a Drought-Tolerant Biofuel Feedstock: Agronomics, Characterization, and Biorefi Ning. Biofuels, Bioproducts and Biorefining 2017, 11, 732–748. [CrossRef]
- Singh, S.K.; Namjoshi, S.A. Evaluation of Thermal Degradation Behavior of Cardboard Waste. In Intelligent Energy Management Technologies. Algorithms for Intelligent Systems: ICAEM 2019; Mohammad, S.U., Avdhesh, S., Kusum, L.A., Mukesh, S., Eds.; Springer Singapore.: Singapore, 2021; pp. 45–52.
- Valenzuela, A. A New Agenda for Blue Agave Landraces: Food, Energy and Tequila. GCB Bioenergy 2011, 3, 15–24. [CrossRef]
- Ghosh, I.; Haider, Q.; Sharma, C. Characterization of Regenerated Cellulose Prepared from Different Pulp Grades Using a Green Solvent. Cellulose Chemistry and Technology 2019, 53, 643–653. [CrossRef]
- Li, Z.; Zhang, X.; Fa, C.; Zhang, Y.; Xiong, J.; Chen, H. Investigation on Characteristics and Properties of Bagasse Fibers: Performances of Asphalt Mixtures with Bagasse Fibers. Constr Build Mater 2020, 248, 118648. [CrossRef]
- Li, N.; Zhan, H.; Yu, X.; Tang, W.; Xue, Q. Investigation of the Aging Behavior of Cellulose Fiber in Reclaimed Asphalt Pavement. Constr Build Mater 2021, 271. [CrossRef]
- Li, Z.; Li, K.; Chen, W.; Liu, W.; Yin, Y.; Cong, P. Investigation on the Characteristics and Effect of Plant Fibers on the Properties of Asphalt Binders. Constr Build Mater 2022, 338, 1–25. [CrossRef]
- Rosli, N.A.; Ahmad, I.; Abdullah, I. Isolation and Characterization of Cellulose Nanocrystals from Agave Angustifolia Fibre. Bioresources 2013, 8, 1893–1908. [CrossRef]
- Ma, N.; Liu, D.; Liu, Y.; Suai, G. Extraction and Characterization of Nanocellulose from Xanthoceras Sorbifolia Husk. International Journal of Nanoscience and Nanoengineering 2015, 2, 43–50.
- Kathirselvam, M.; Kumaravel, A.; Arthanarieswaran, V.P.; Saravanakumar, S.S. Characterization of Cellulose Fibers in Thespesia Populnea Barks: Influence of Alkali Treatment. Carbohydr Polym 2019, 217, 178–189. [CrossRef]
- Robles, E.; Fernández-Rodríguez, J.; Barbosa, A.M.; Gordobil, O.; Carreño, N.L.V.; Labidi, J. Dataset on Cellulose Nanoparticles from Blue Agave Bagasse and Blue Agave Leaves. Data Brief 2018, 18, 150–155. [CrossRef]
- Sanjay, M.R.; Madhu, P.; Jawaid, M.; Senthamaraikannan, P.; Senthil, S.; Pradeep, S. Characterization and Properties of Natural Fiber Polymer Composites: A Comprehensive Review. J Clean Prod 2018, 172, 566–581. [CrossRef]
- Navarro-Hermosillo, A.B. Estudio de La Liberación Controlada de Rosa Bengala, Mediante El Uso de Hidrogeles Acrílicos Reforzados Con Celulosa Nanocristalina (CNC), 2020, Vol. 52.
- Kumar, A.; Singh Negi, Y.; Choudhary, V.; Kant Bhardwaj, N. Characterization of Cellulose Nanocrystals Produced by Acid-Hydrolysis from Sugarcane Bagasse as Agro-Waste. Journal of Materials Physics and Chemistry 2020, 2, 1–8. [CrossRef]
- Carrillo, F.; Colom, X.; Suñol, J.J.; Saurina, J. Structural FTIR Analysis and Thermal Characterisation of Lyocell and Viscose-Type Fibres. Eur Polym J 2004, 40, 2229–2234. [CrossRef]
- Cheng, Y.W. Laboratory Research of Optimum Fiber Content in SMA Mixture Based on High Temperature Performance. Applied Mechanics and Materials 2013, 361–363, 1709–1712. [CrossRef]
- León-Fernández, V.; Rieumont-Briones, J.; Bordallo-López, E.; Gastón-Peña, C.; Chanfón-Curbelo, J. Caracterización Térmica , Estructural y Morfológica de Un Copolímero Base Celulosa. 2014, 45, 66–72.
- Aguilar-Penagos, A.; Gómez-Soberón, J.M.; Rojas-Valencia, M.N. Physicochemical, Mineralogical and Microscopic Evaluation of Sustainable Bricks Manufactured with Construction Wastes. Applied Sciences (Switzerland) 2017, 7. [CrossRef]
- Guimarães, J.L.; Frollini, E.; da Silva, C.G.; Wypych, F.; Satyanarayana, K.G. Characterization of Banana, Sugarcane Bagasse and Sponge Gourd Fibers of Brazil. Ind Crops Prod 2009, 30, 407–415. [CrossRef]
- Kumar, P.; Chandra, S.; Bose, S. Laboratory Investigations on SMA Mixes with Different Additives. International Journal of Pavement Engineering 2007, 8, 11–18. [CrossRef]
- Sahu, P.; Gupta, M.K. Sisal (Agave Sisalana) Fibre and Its Polymer-Based Composites: A Review on Current Developments. Reinforced plastics and composites 2017, 36, 1759–1780. [CrossRef]
Figure 1.
Analyzed celluloses; (a) ABP, (b) CPB and (c) CC.
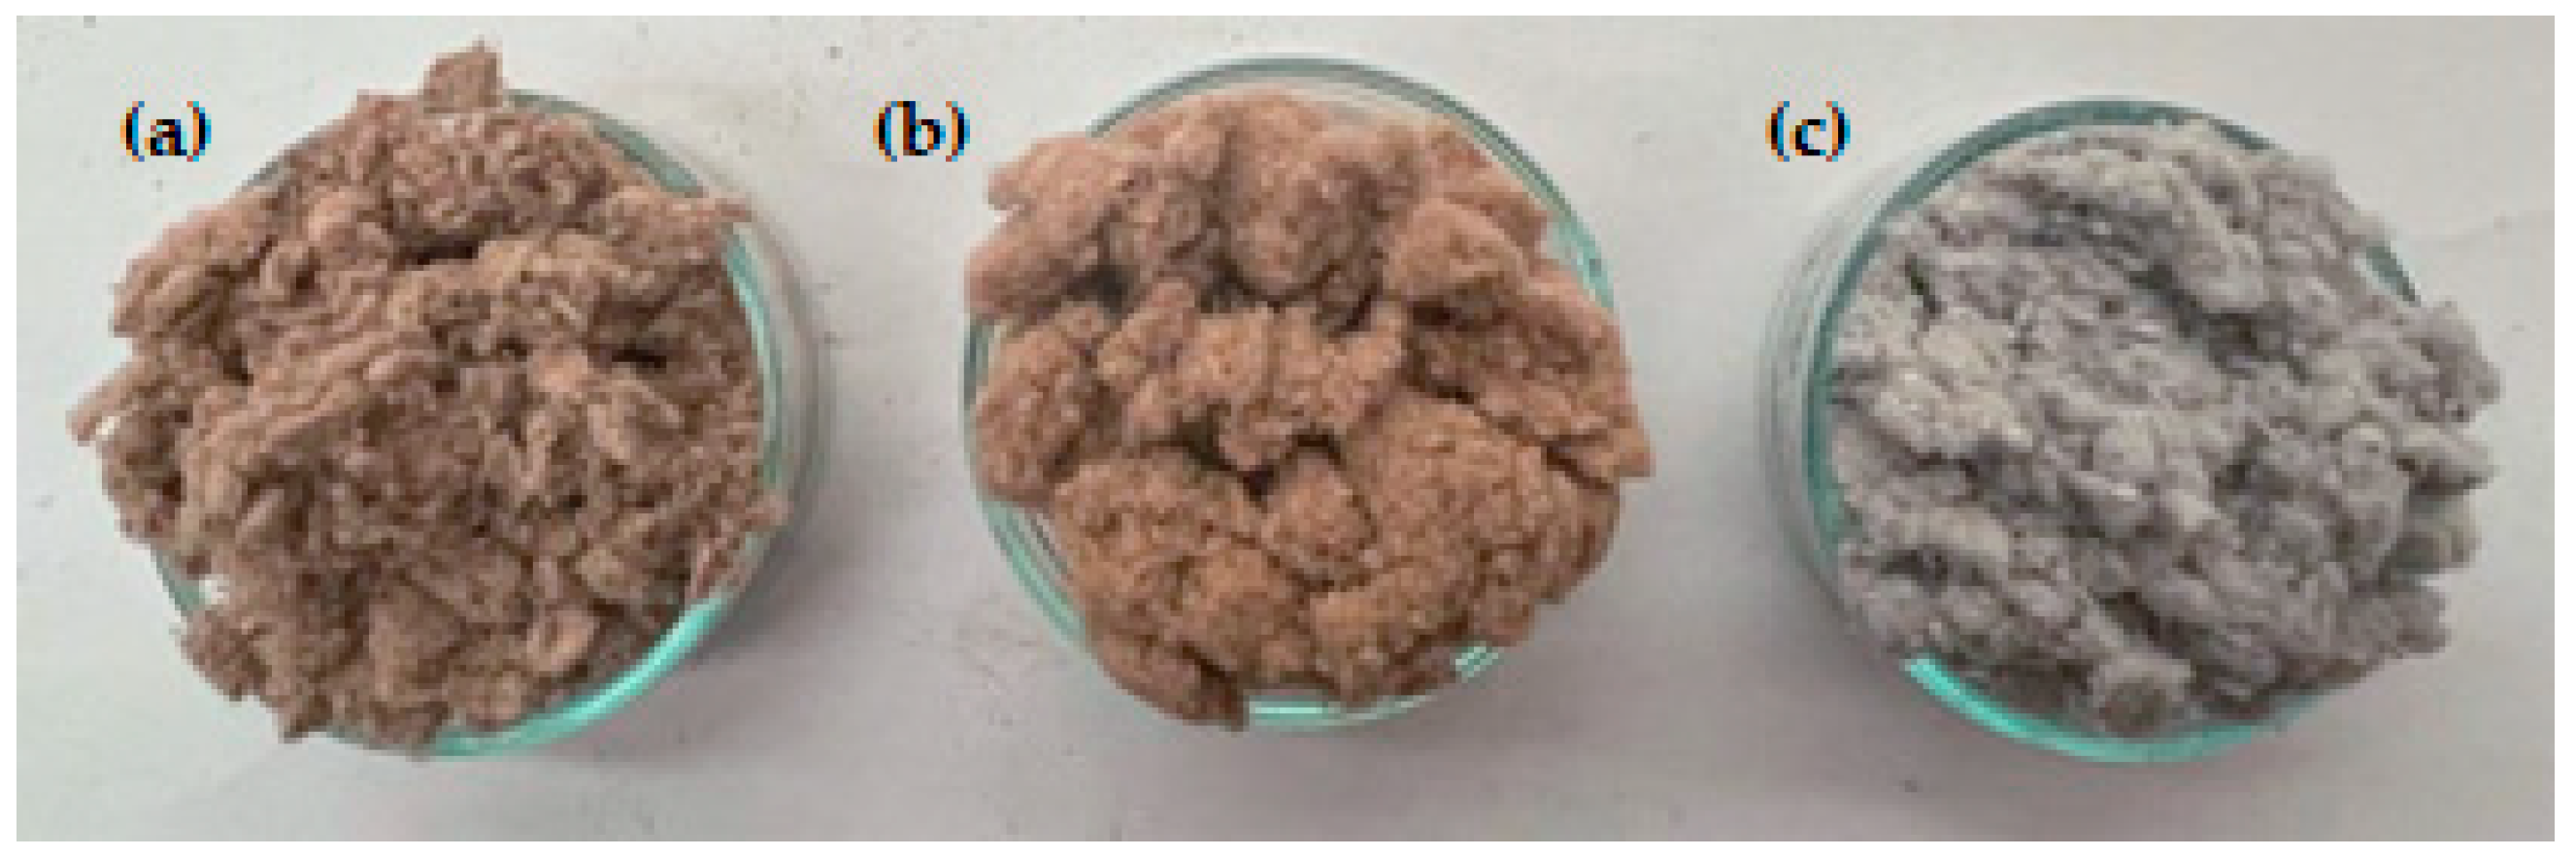
Figure 2.
Elemental composition of Carbon (C), Hydrogen (H), Nitrogen (N) and sulfur oxide (SO) in ABF and the studied celluloses: ABP, CPB, and CC.
Figure 2.
Elemental composition of Carbon (C), Hydrogen (H), Nitrogen (N) and sulfur oxide (SO) in ABF and the studied celluloses: ABP, CPB, and CC.
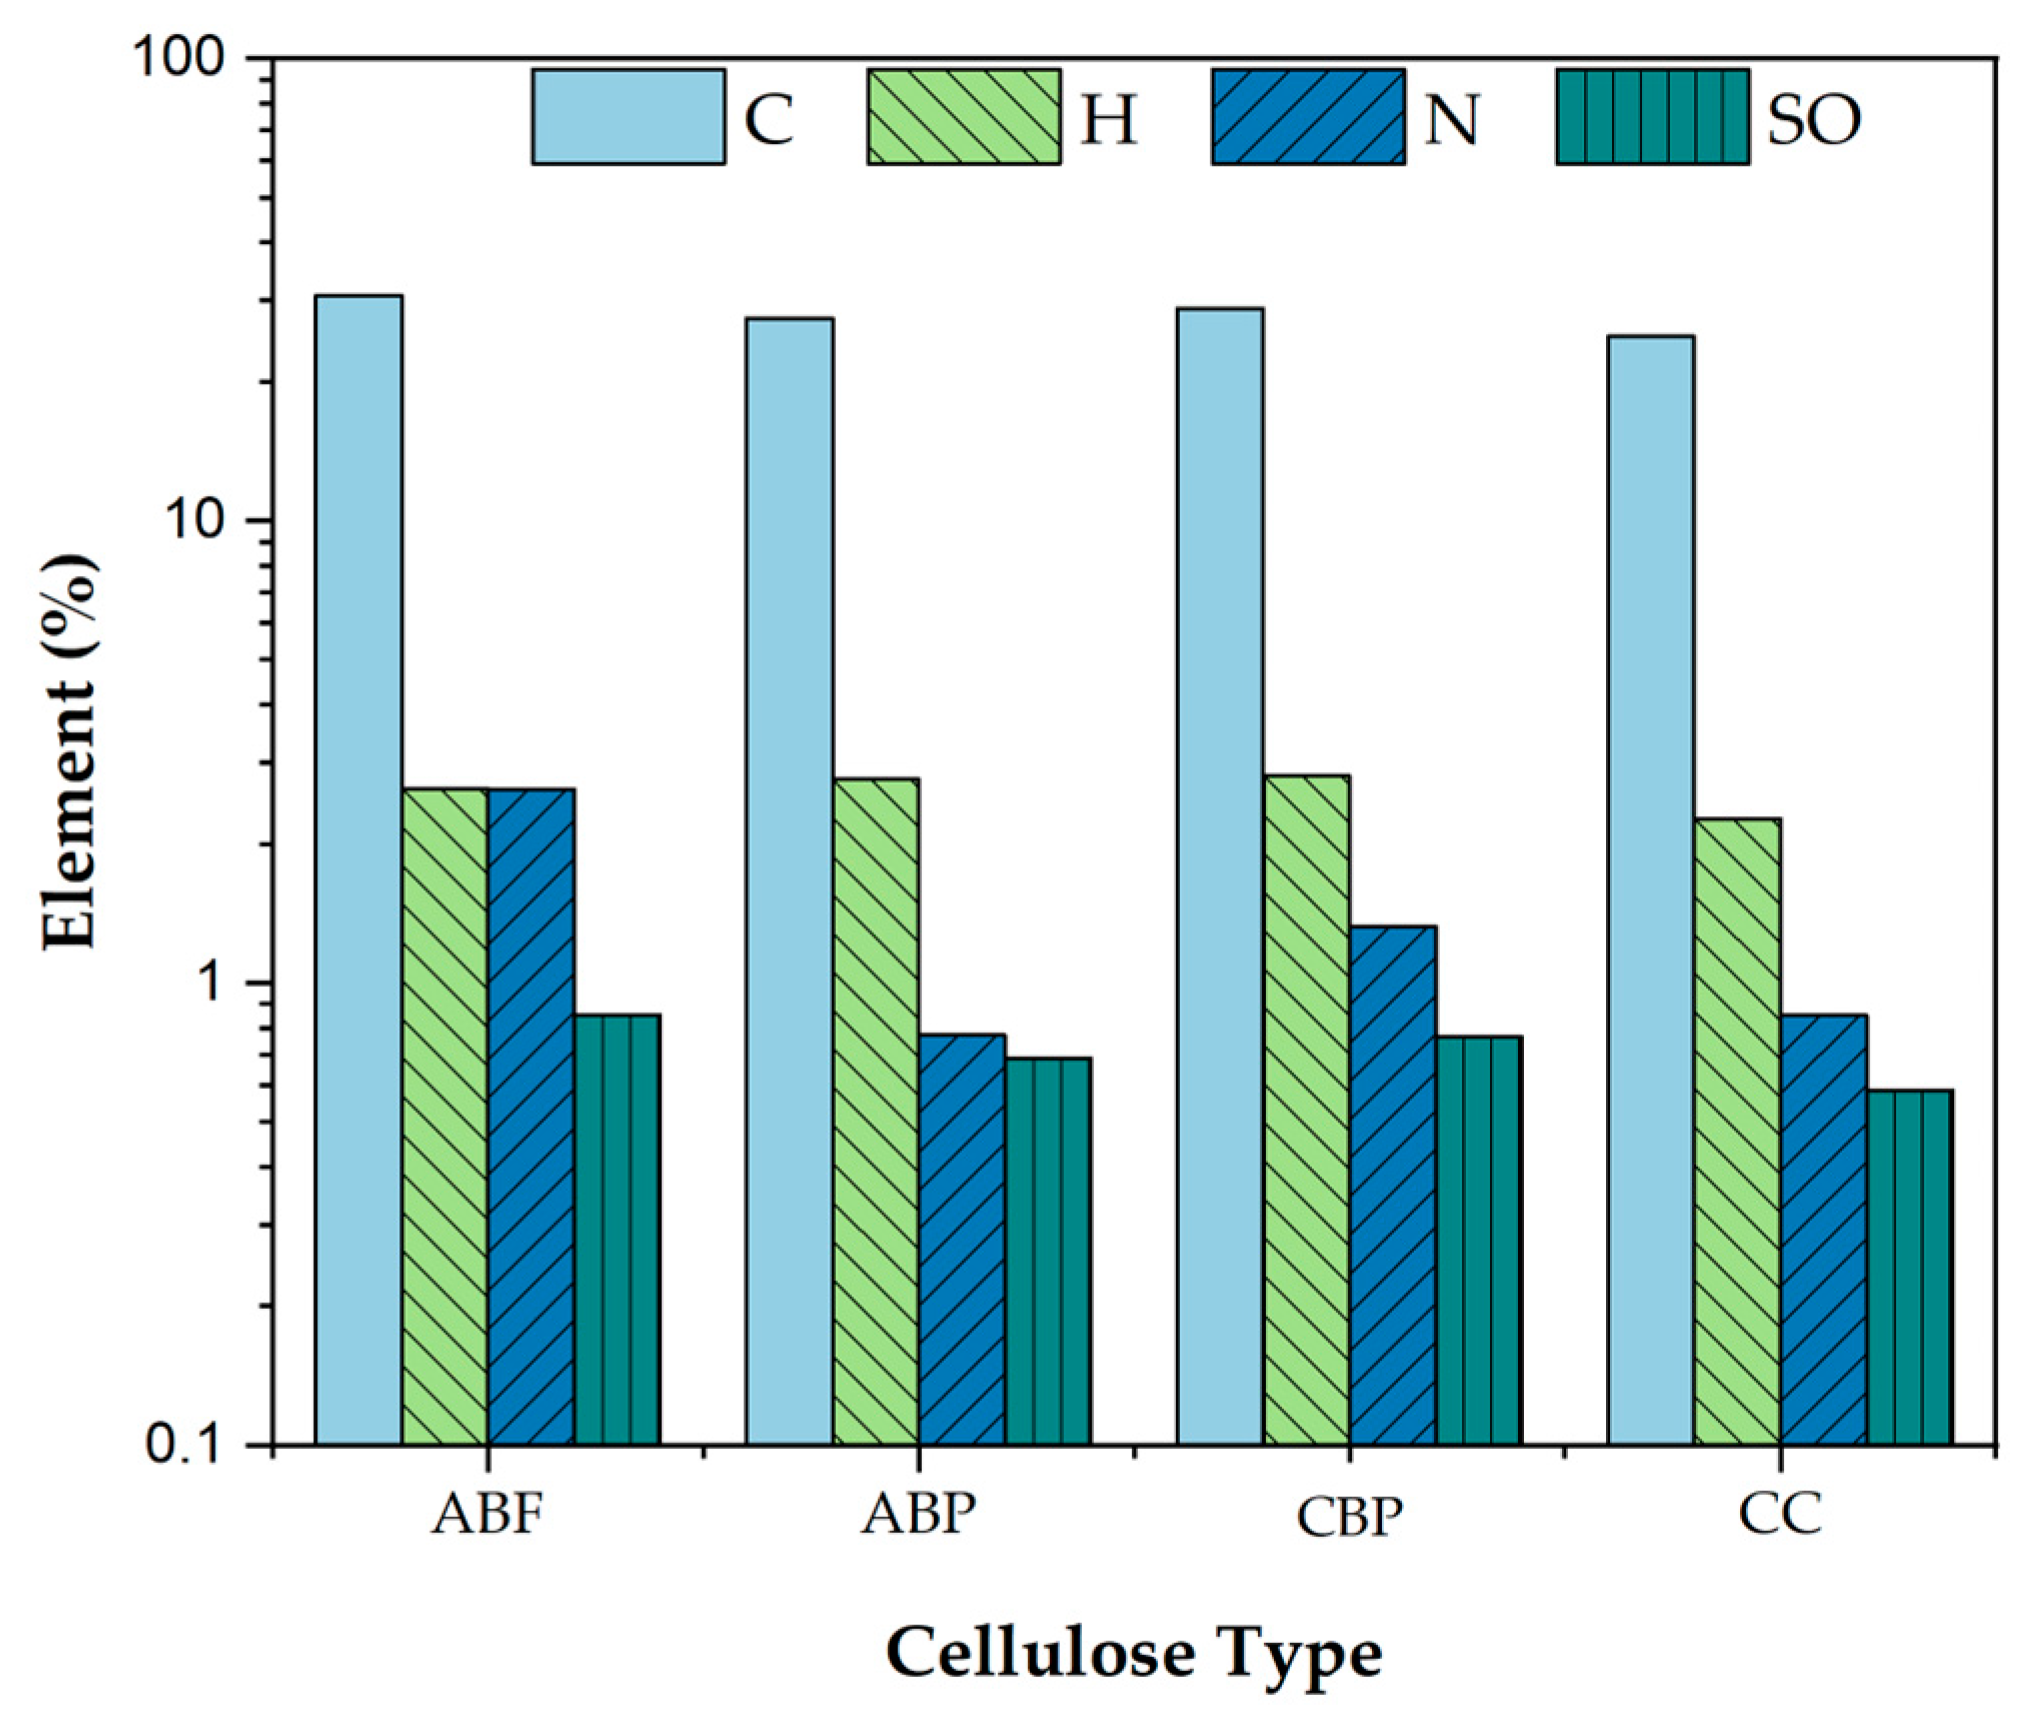
Figure 3.
SEM micrographs from studied celluloses: (a) ABF, (b) ABP, (c) CPB and (d) CC.
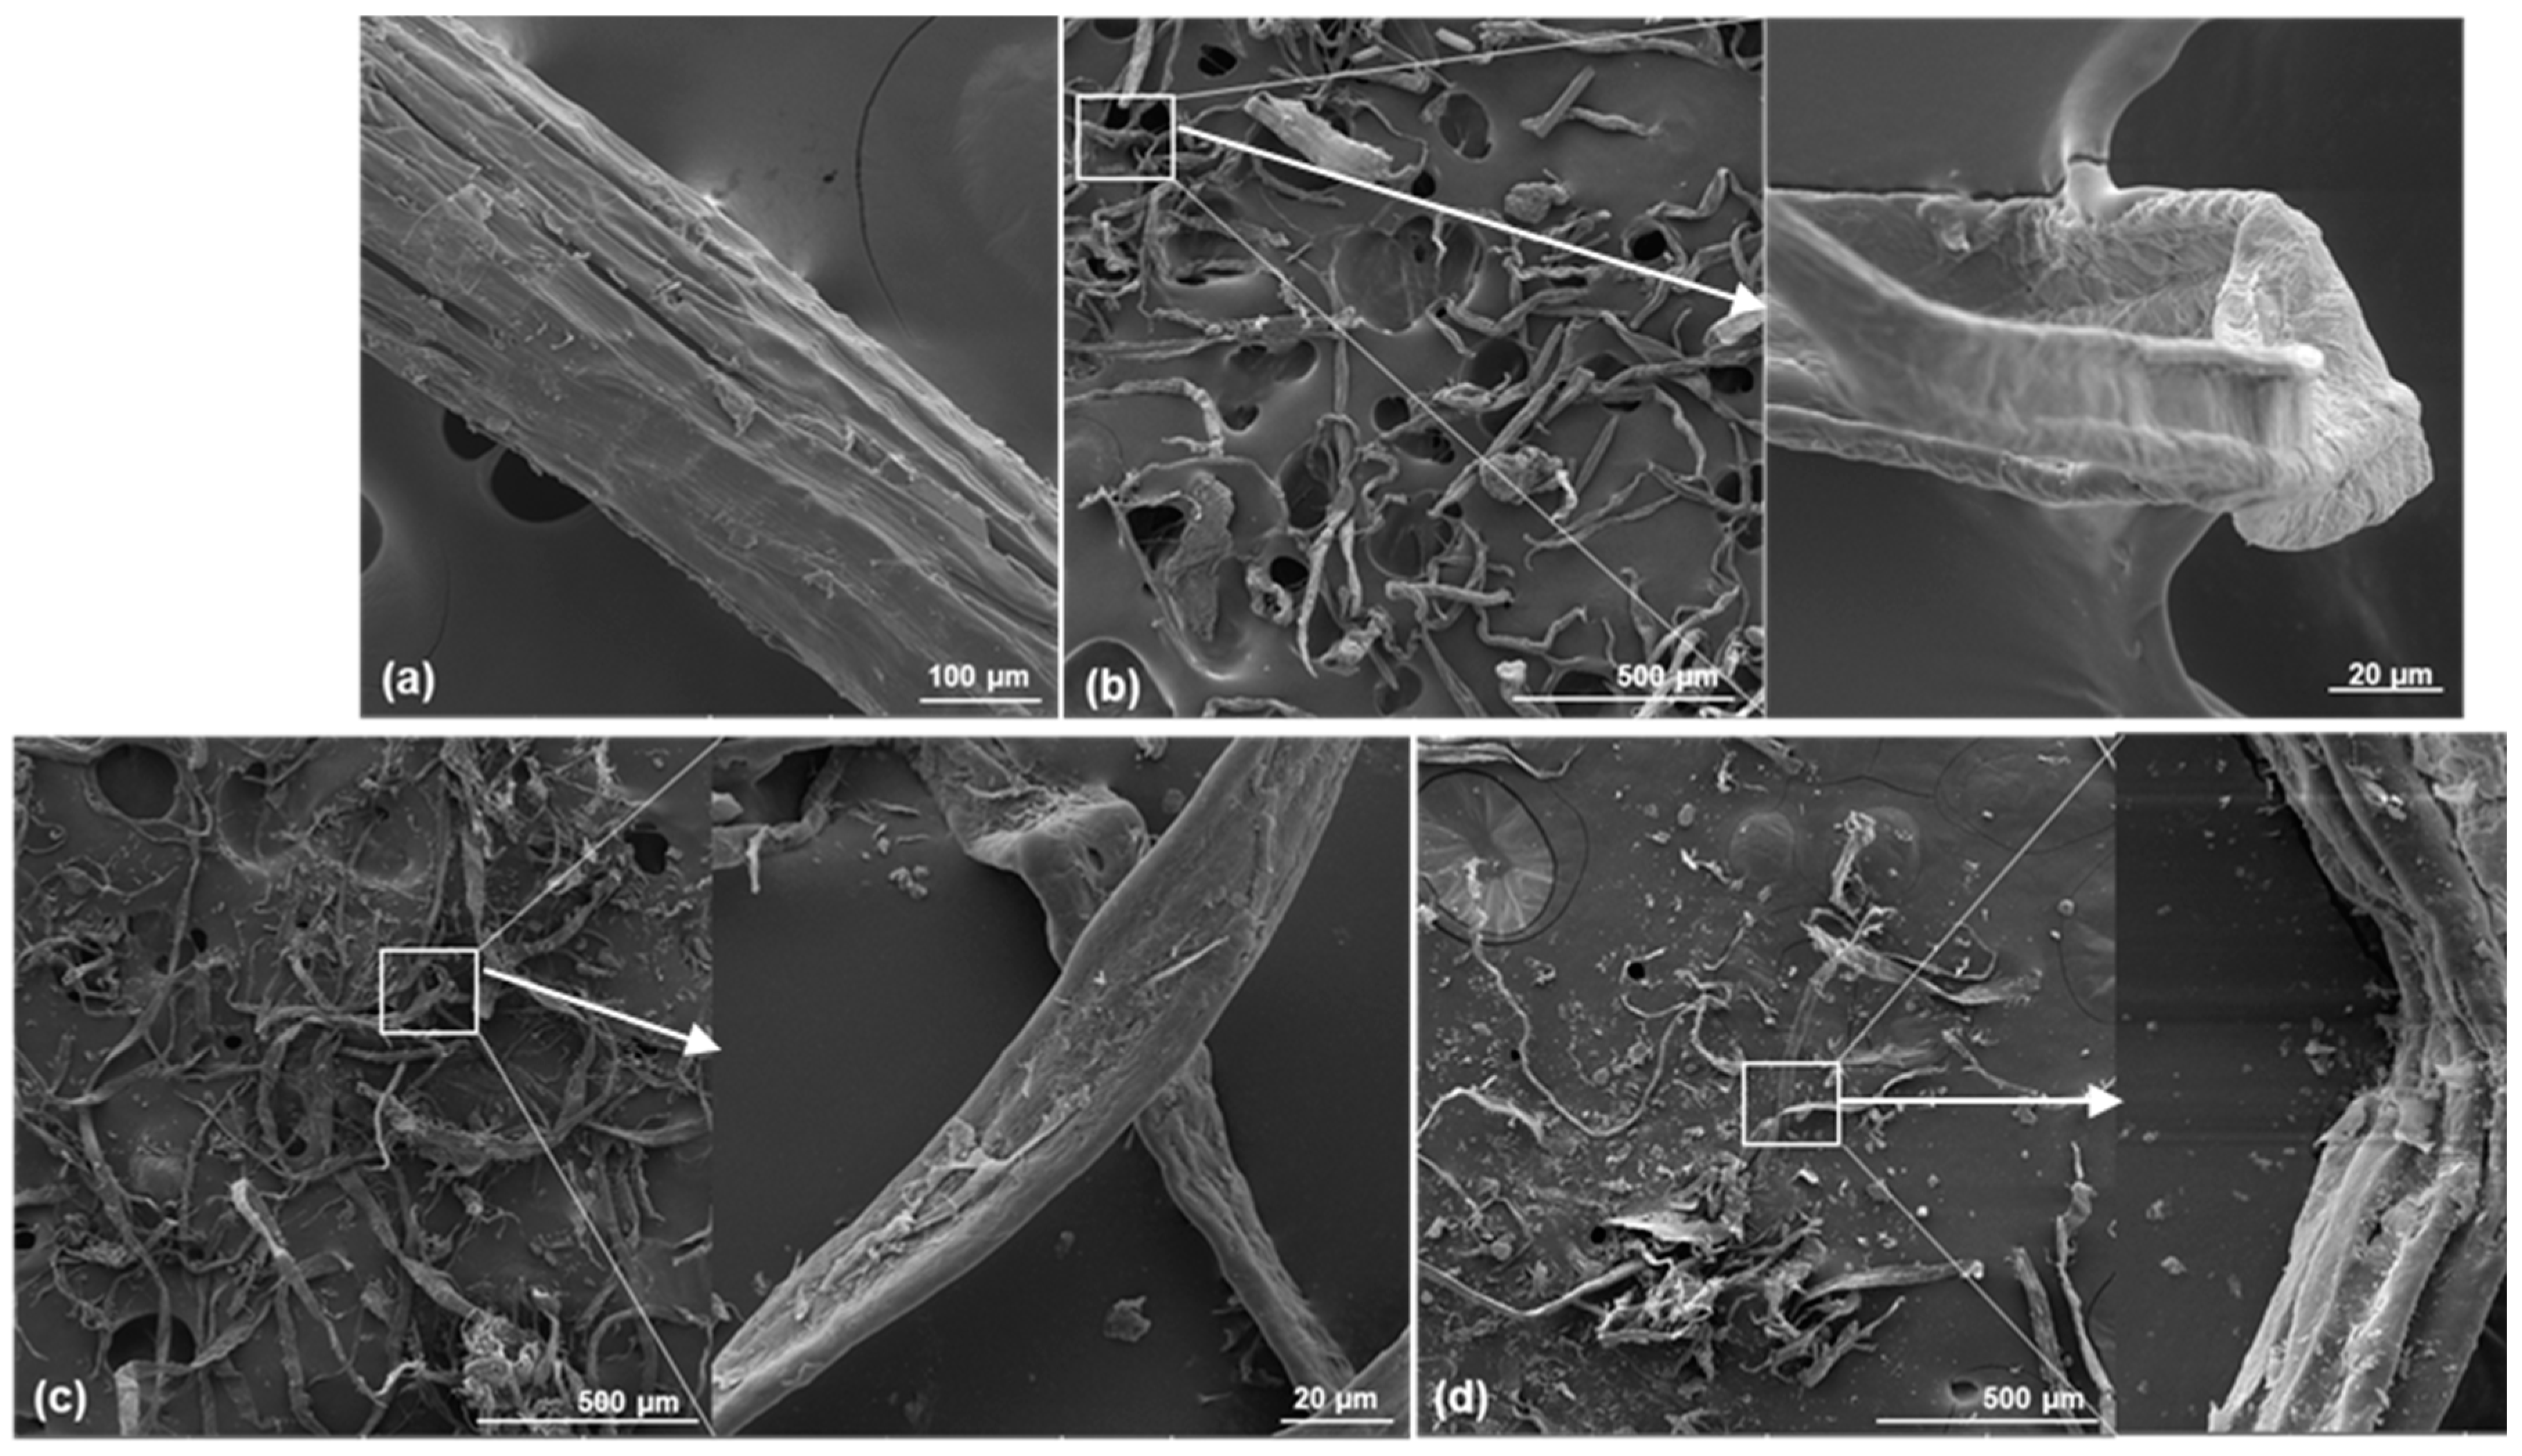
Figure 4.
FTIR_ATR spectra of the ABF fiber and the ABP, CPB and CC celluloses.
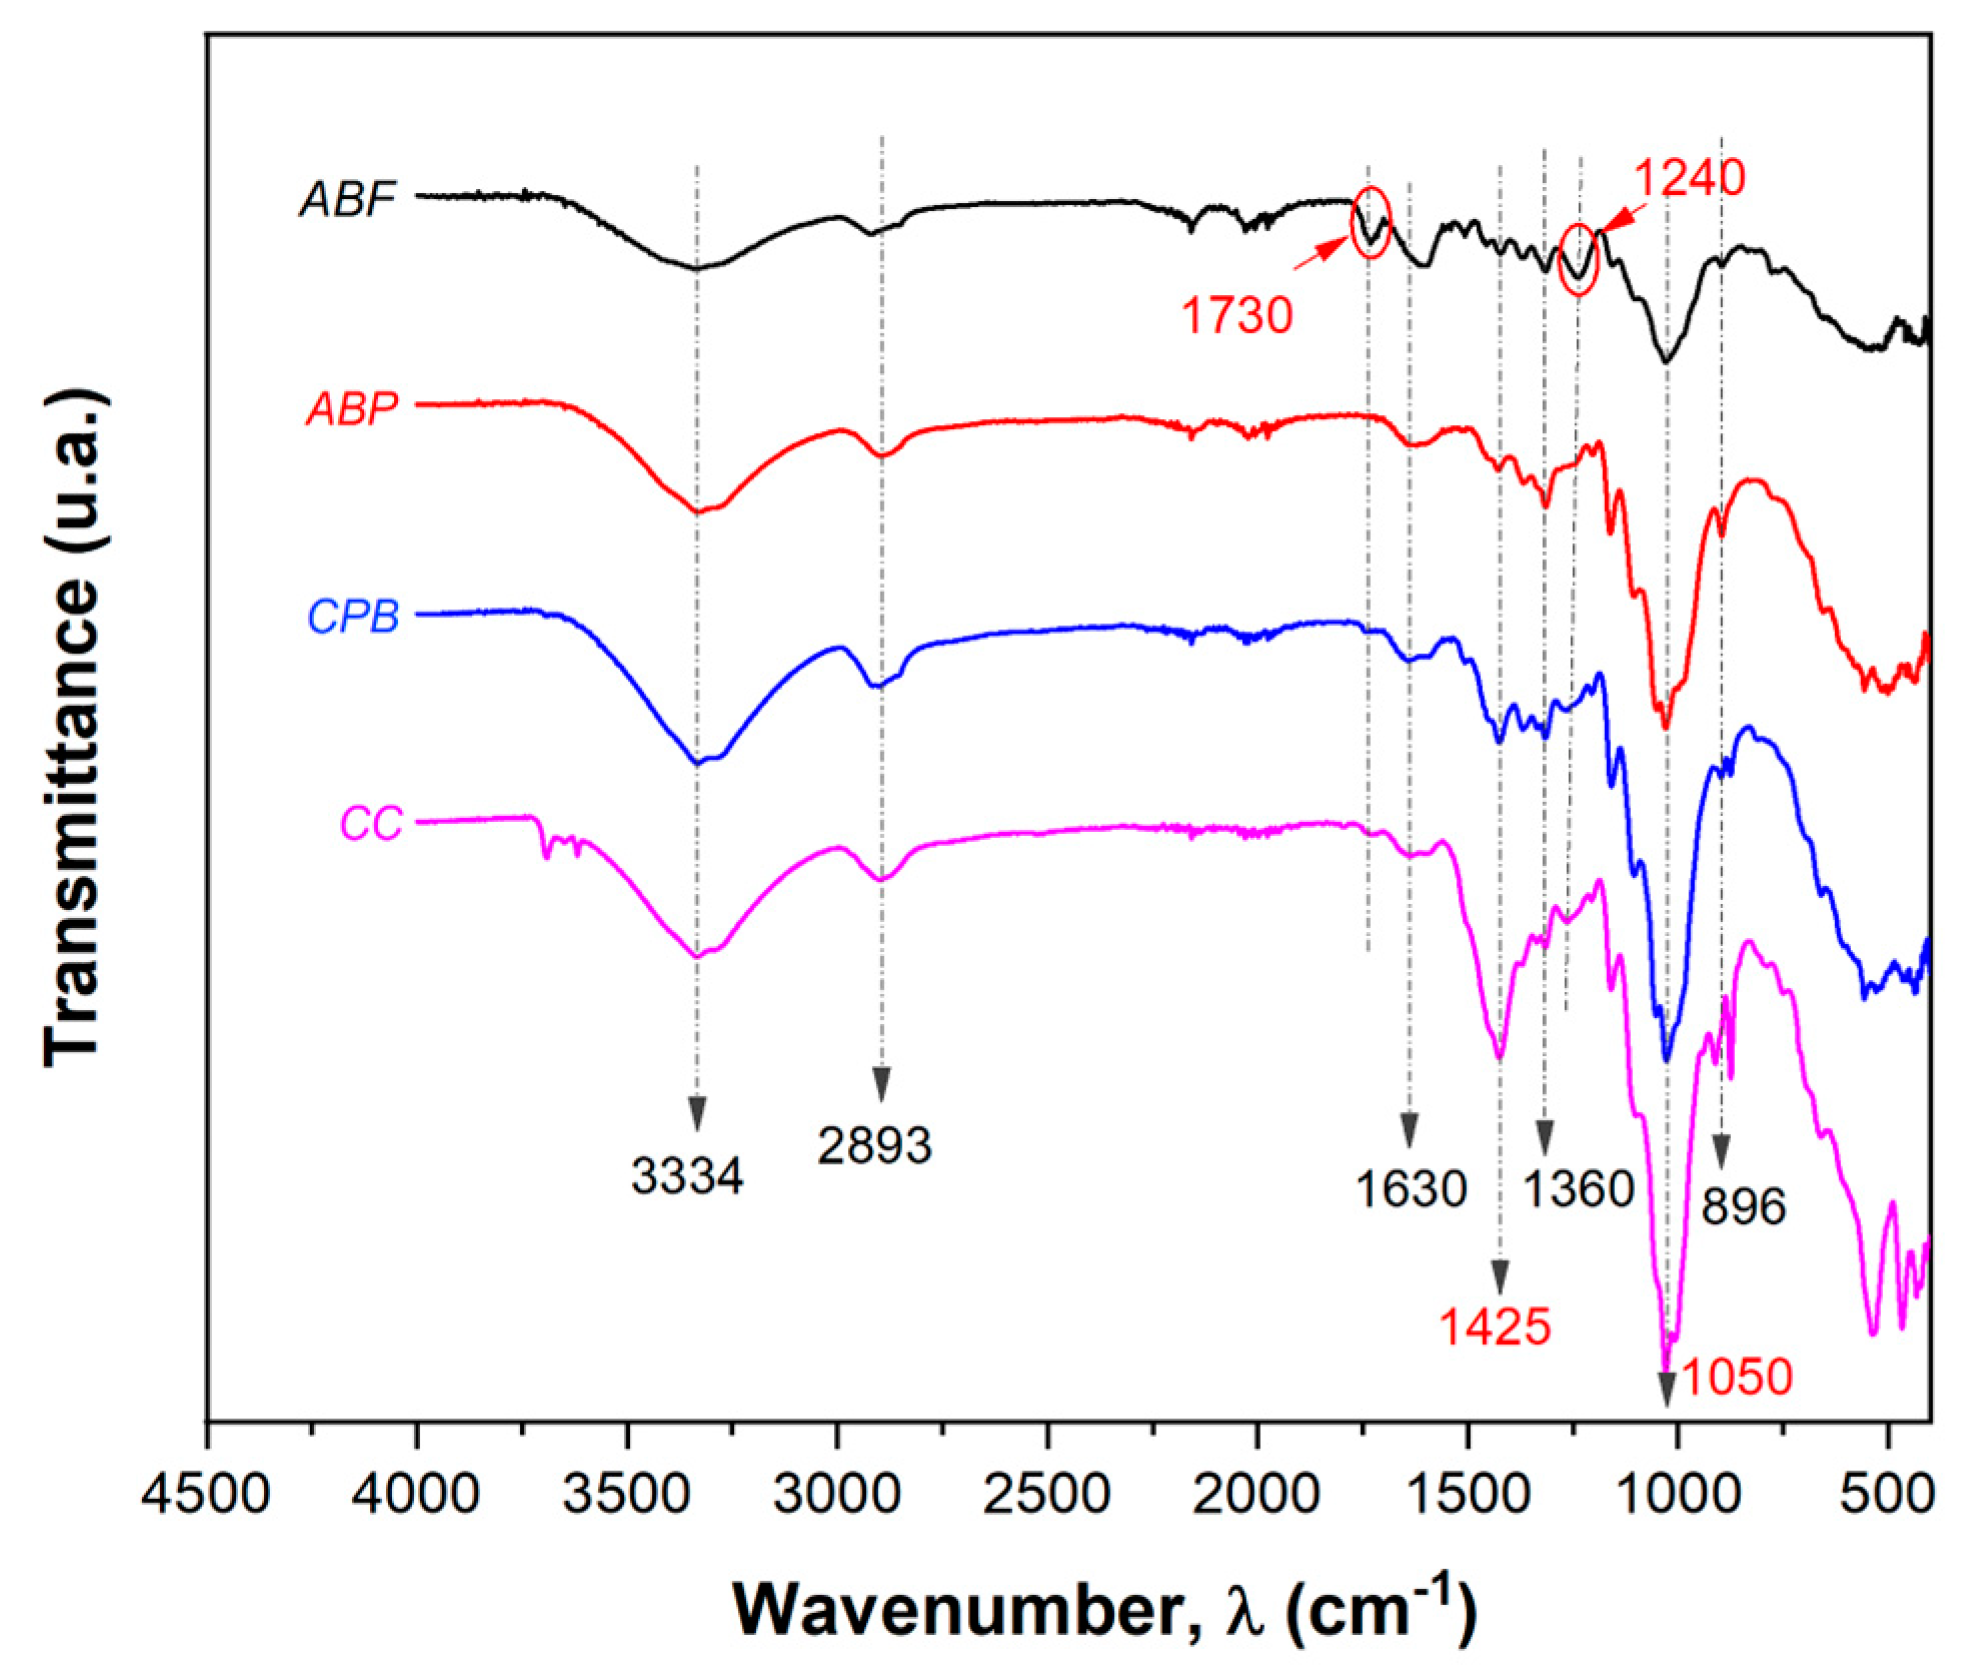
Figure 5.
XRD diffractograms of ABF fiber and ABP, CPB and CC celluloses.
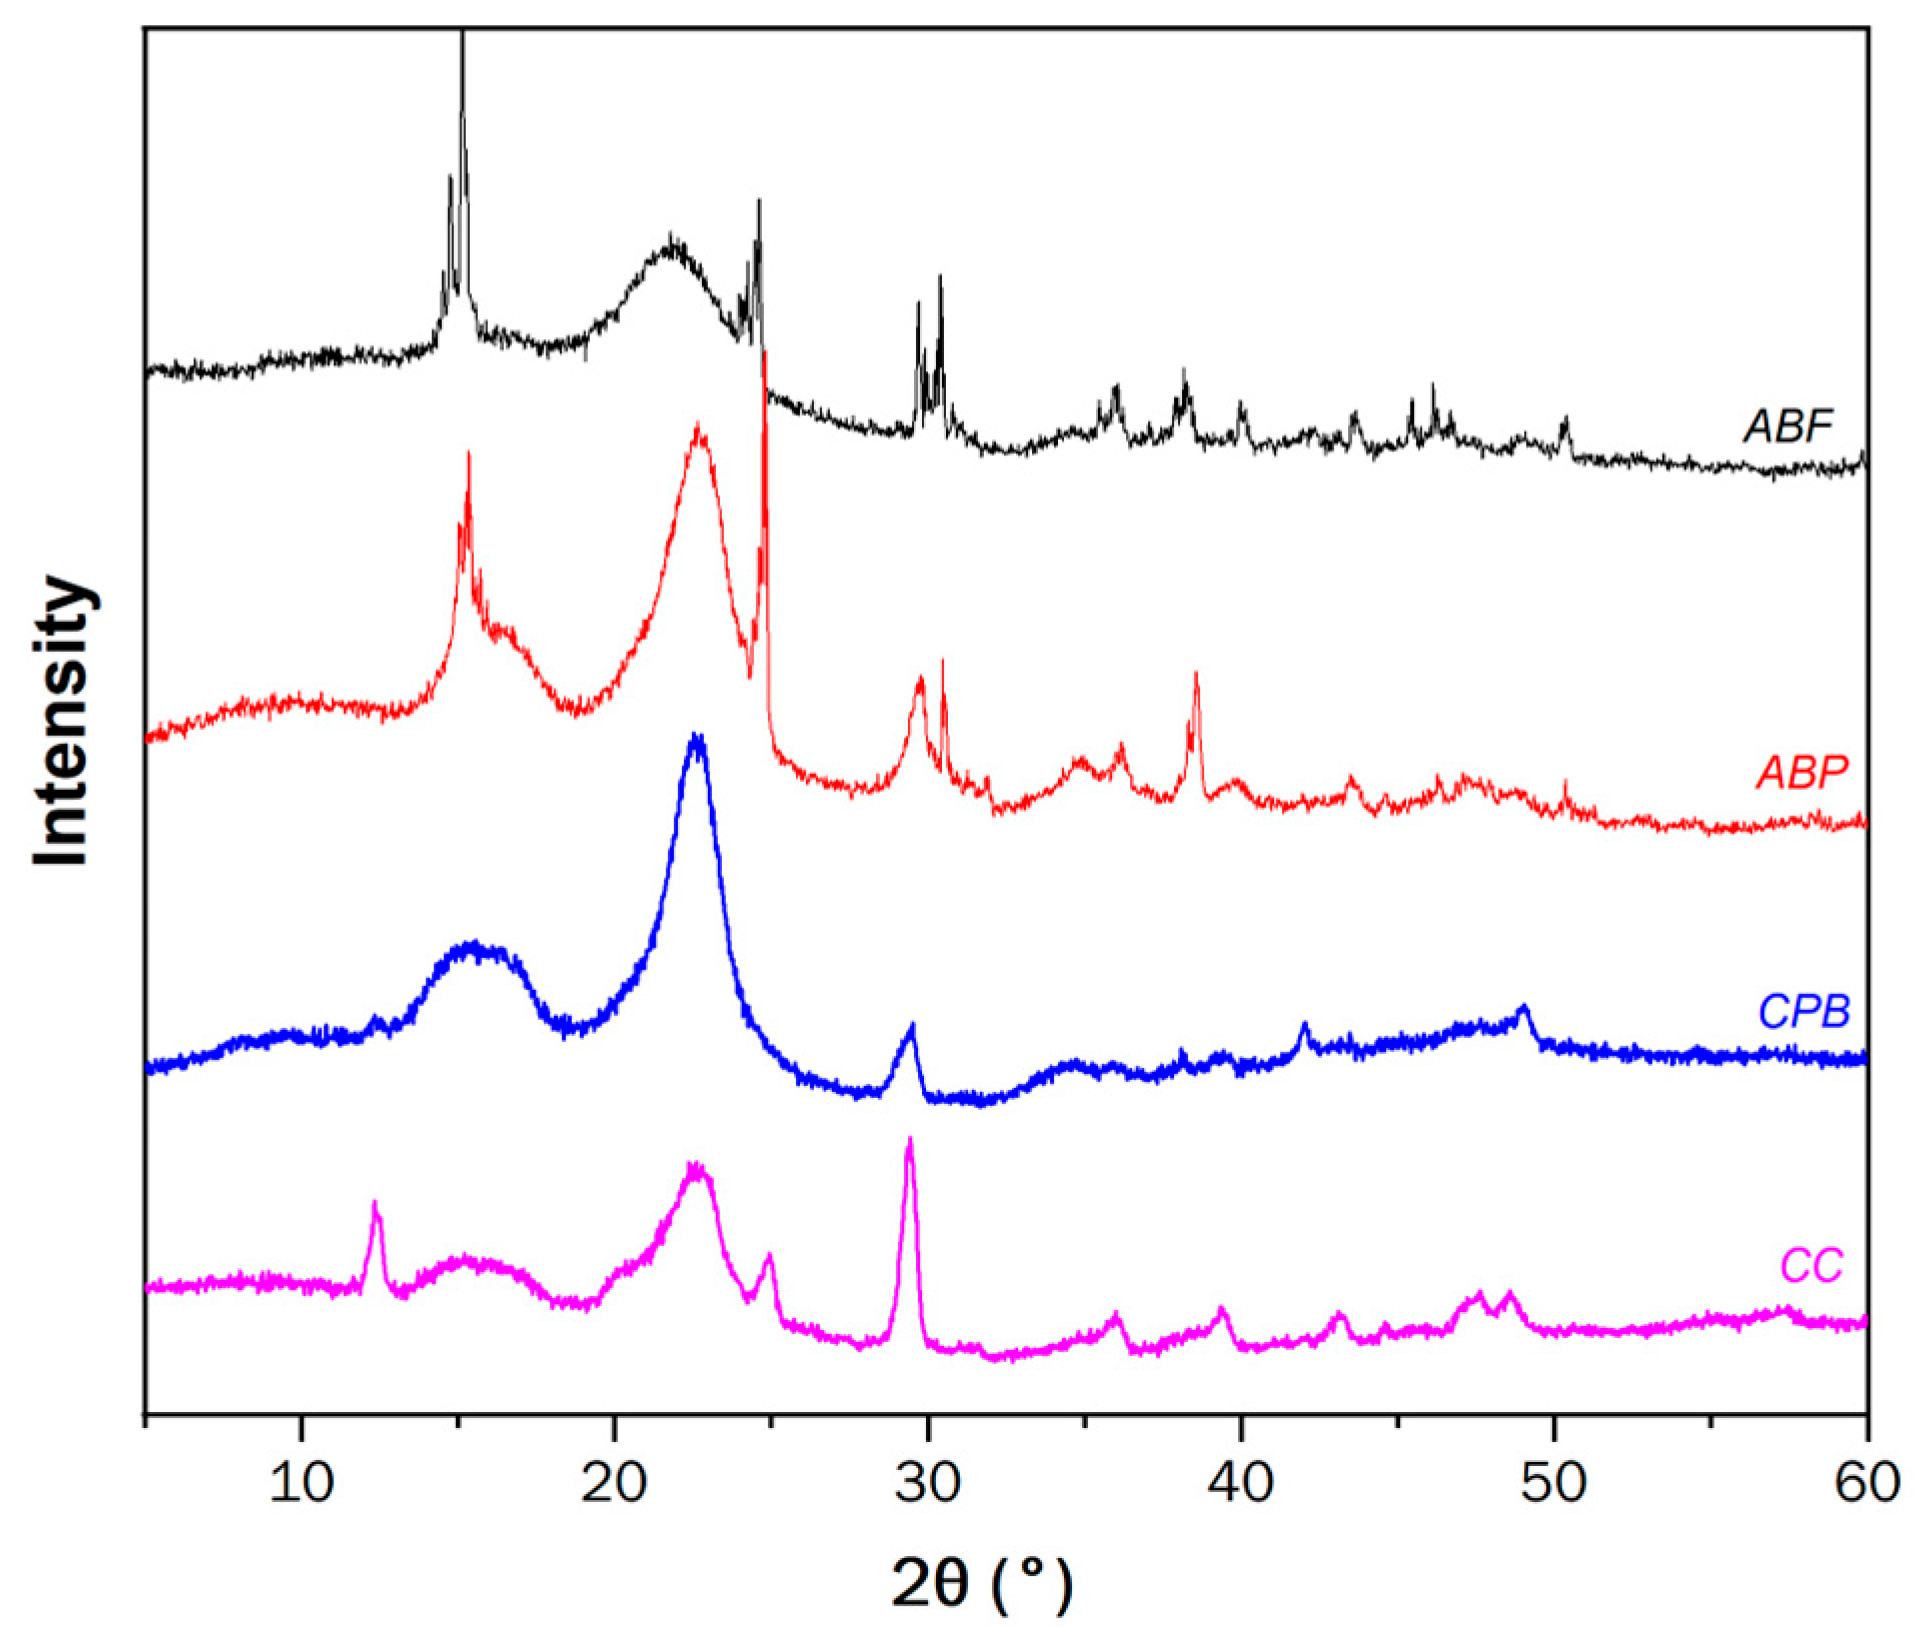
Figure 6.
a) Thermograms obtained from TGA, (b) TGA derivative and (c) DSC of ABF fiber and ABP, CPB and CC celluloses.
Figure 6.
a) Thermograms obtained from TGA, (b) TGA derivative and (c) DSC of ABF fiber and ABP, CPB and CC celluloses.
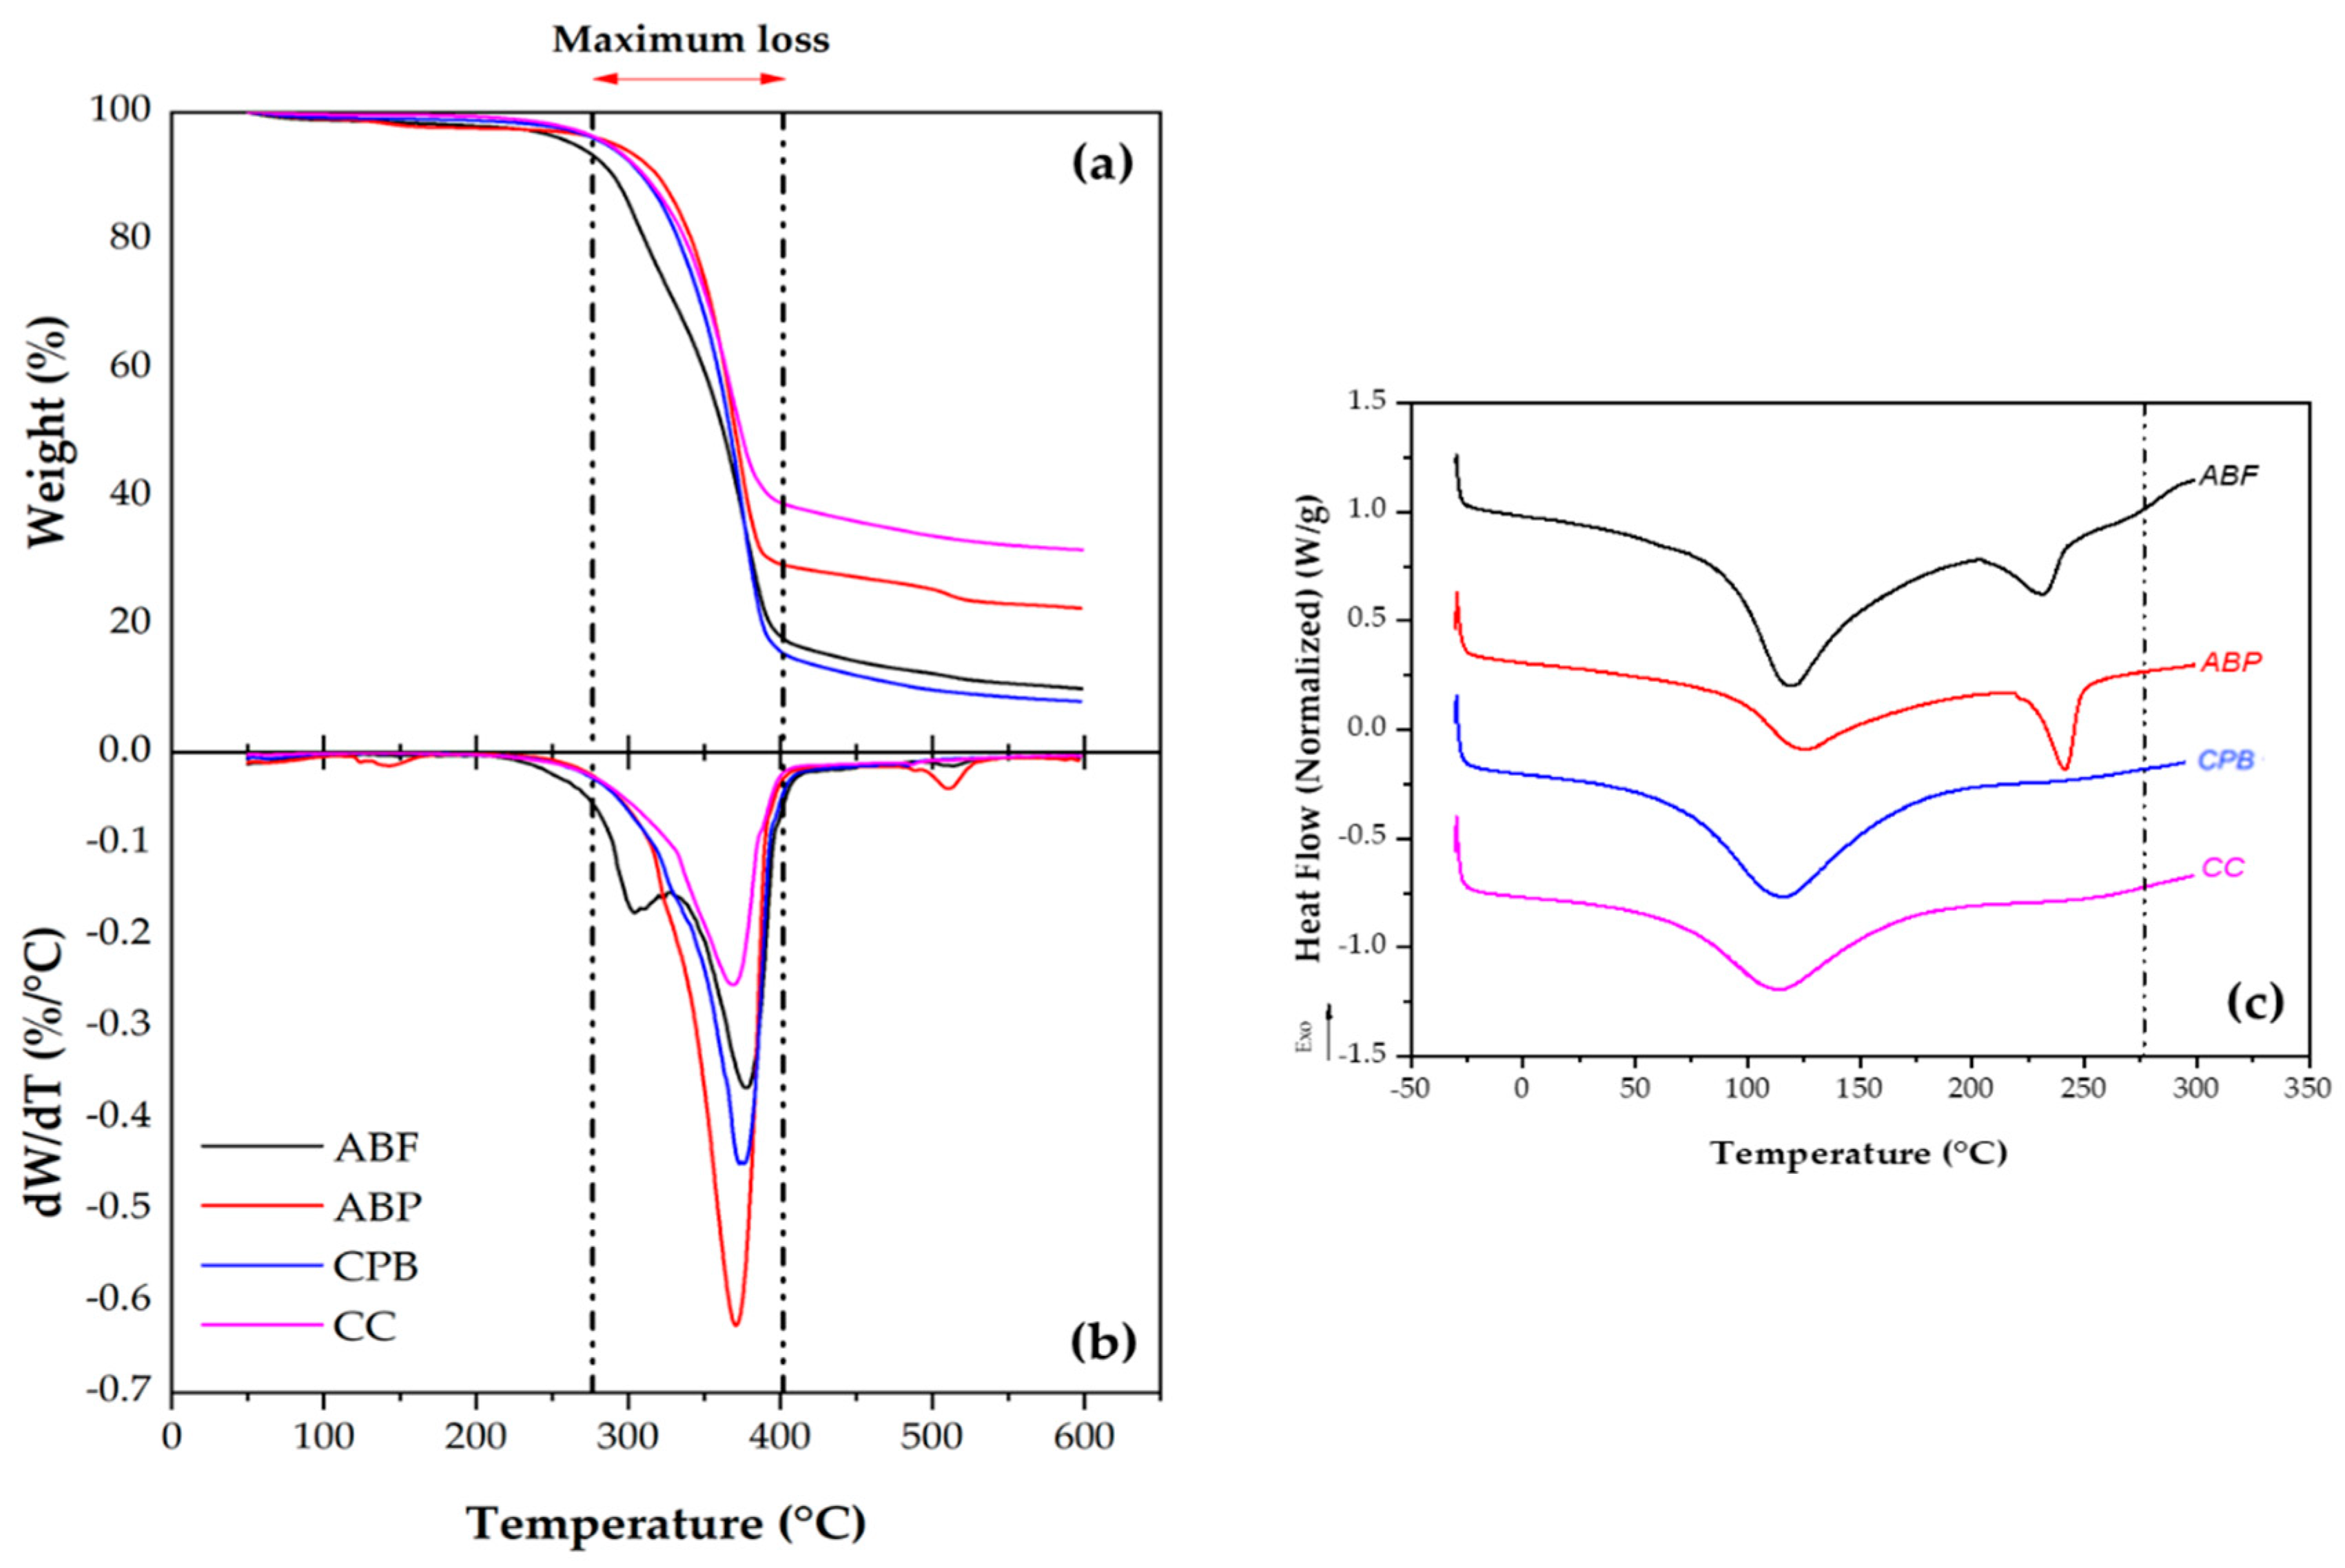
Figure 7.
Schellenberg Drainage mean values (Dpromedio) as a function of cellulose concentration.
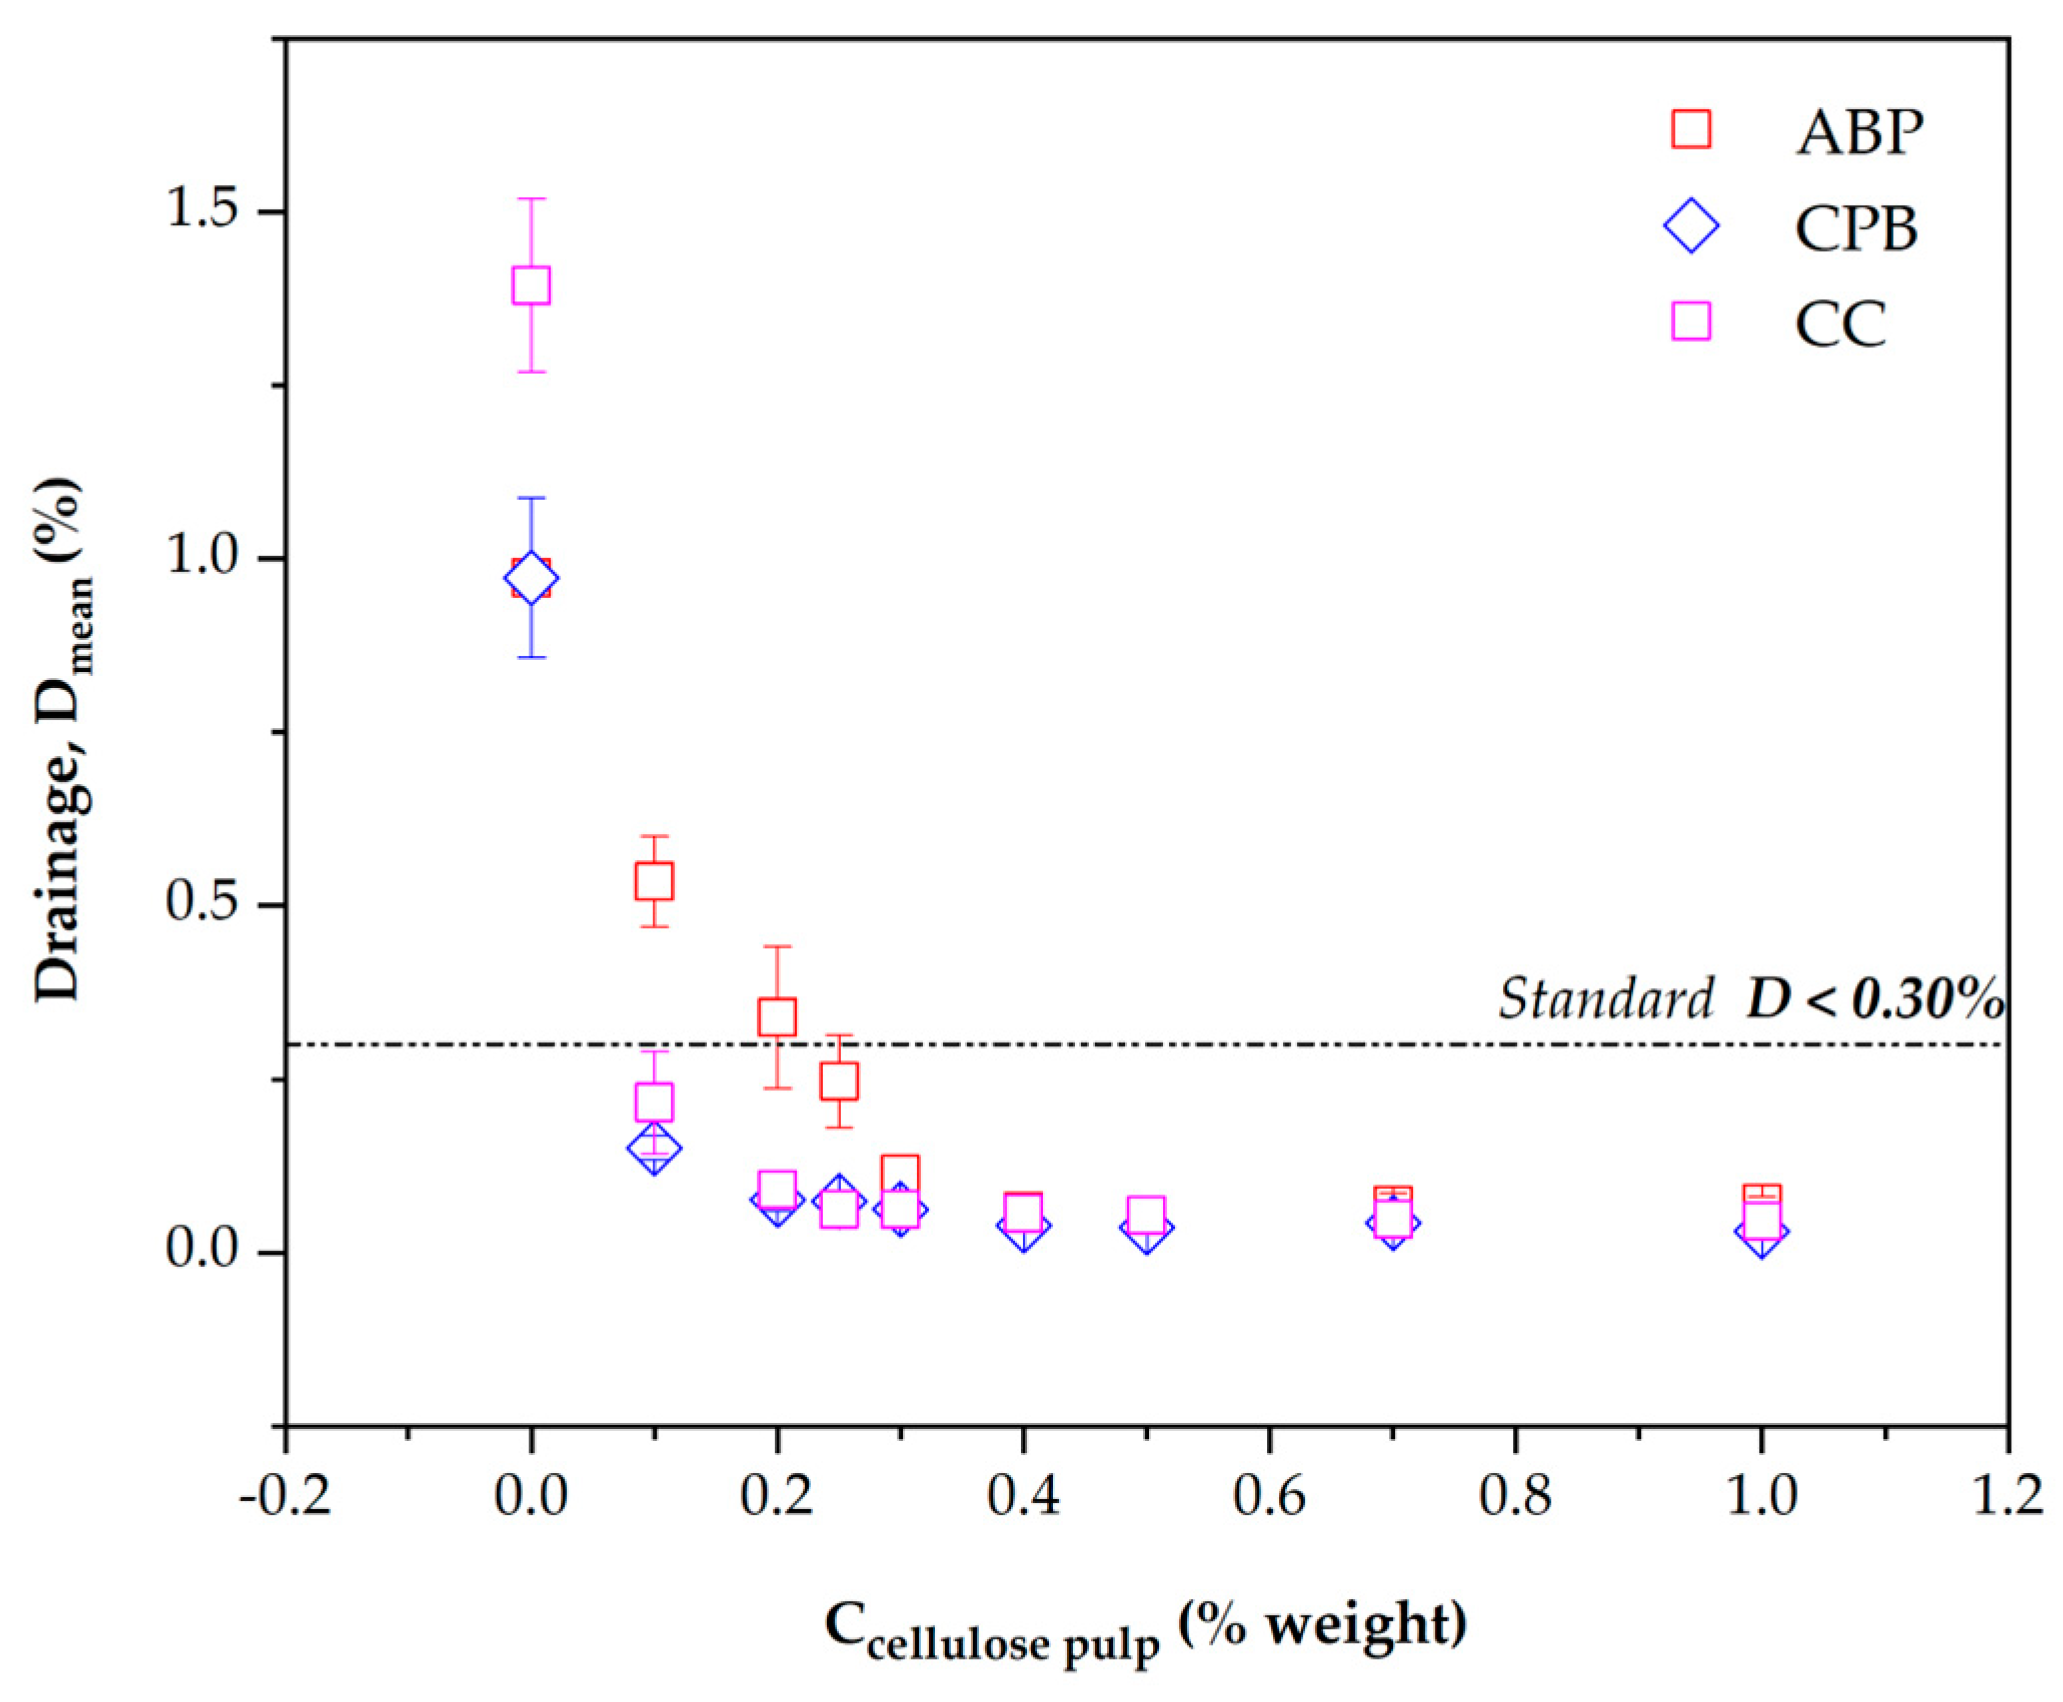
Figure 8.
Schellenberg Drainage mean values (Dmean) for ideal concentrations of 0.30% and 0.40% cellulose.
Figure 8.
Schellenberg Drainage mean values (Dmean) for ideal concentrations of 0.30% and 0.40% cellulose.
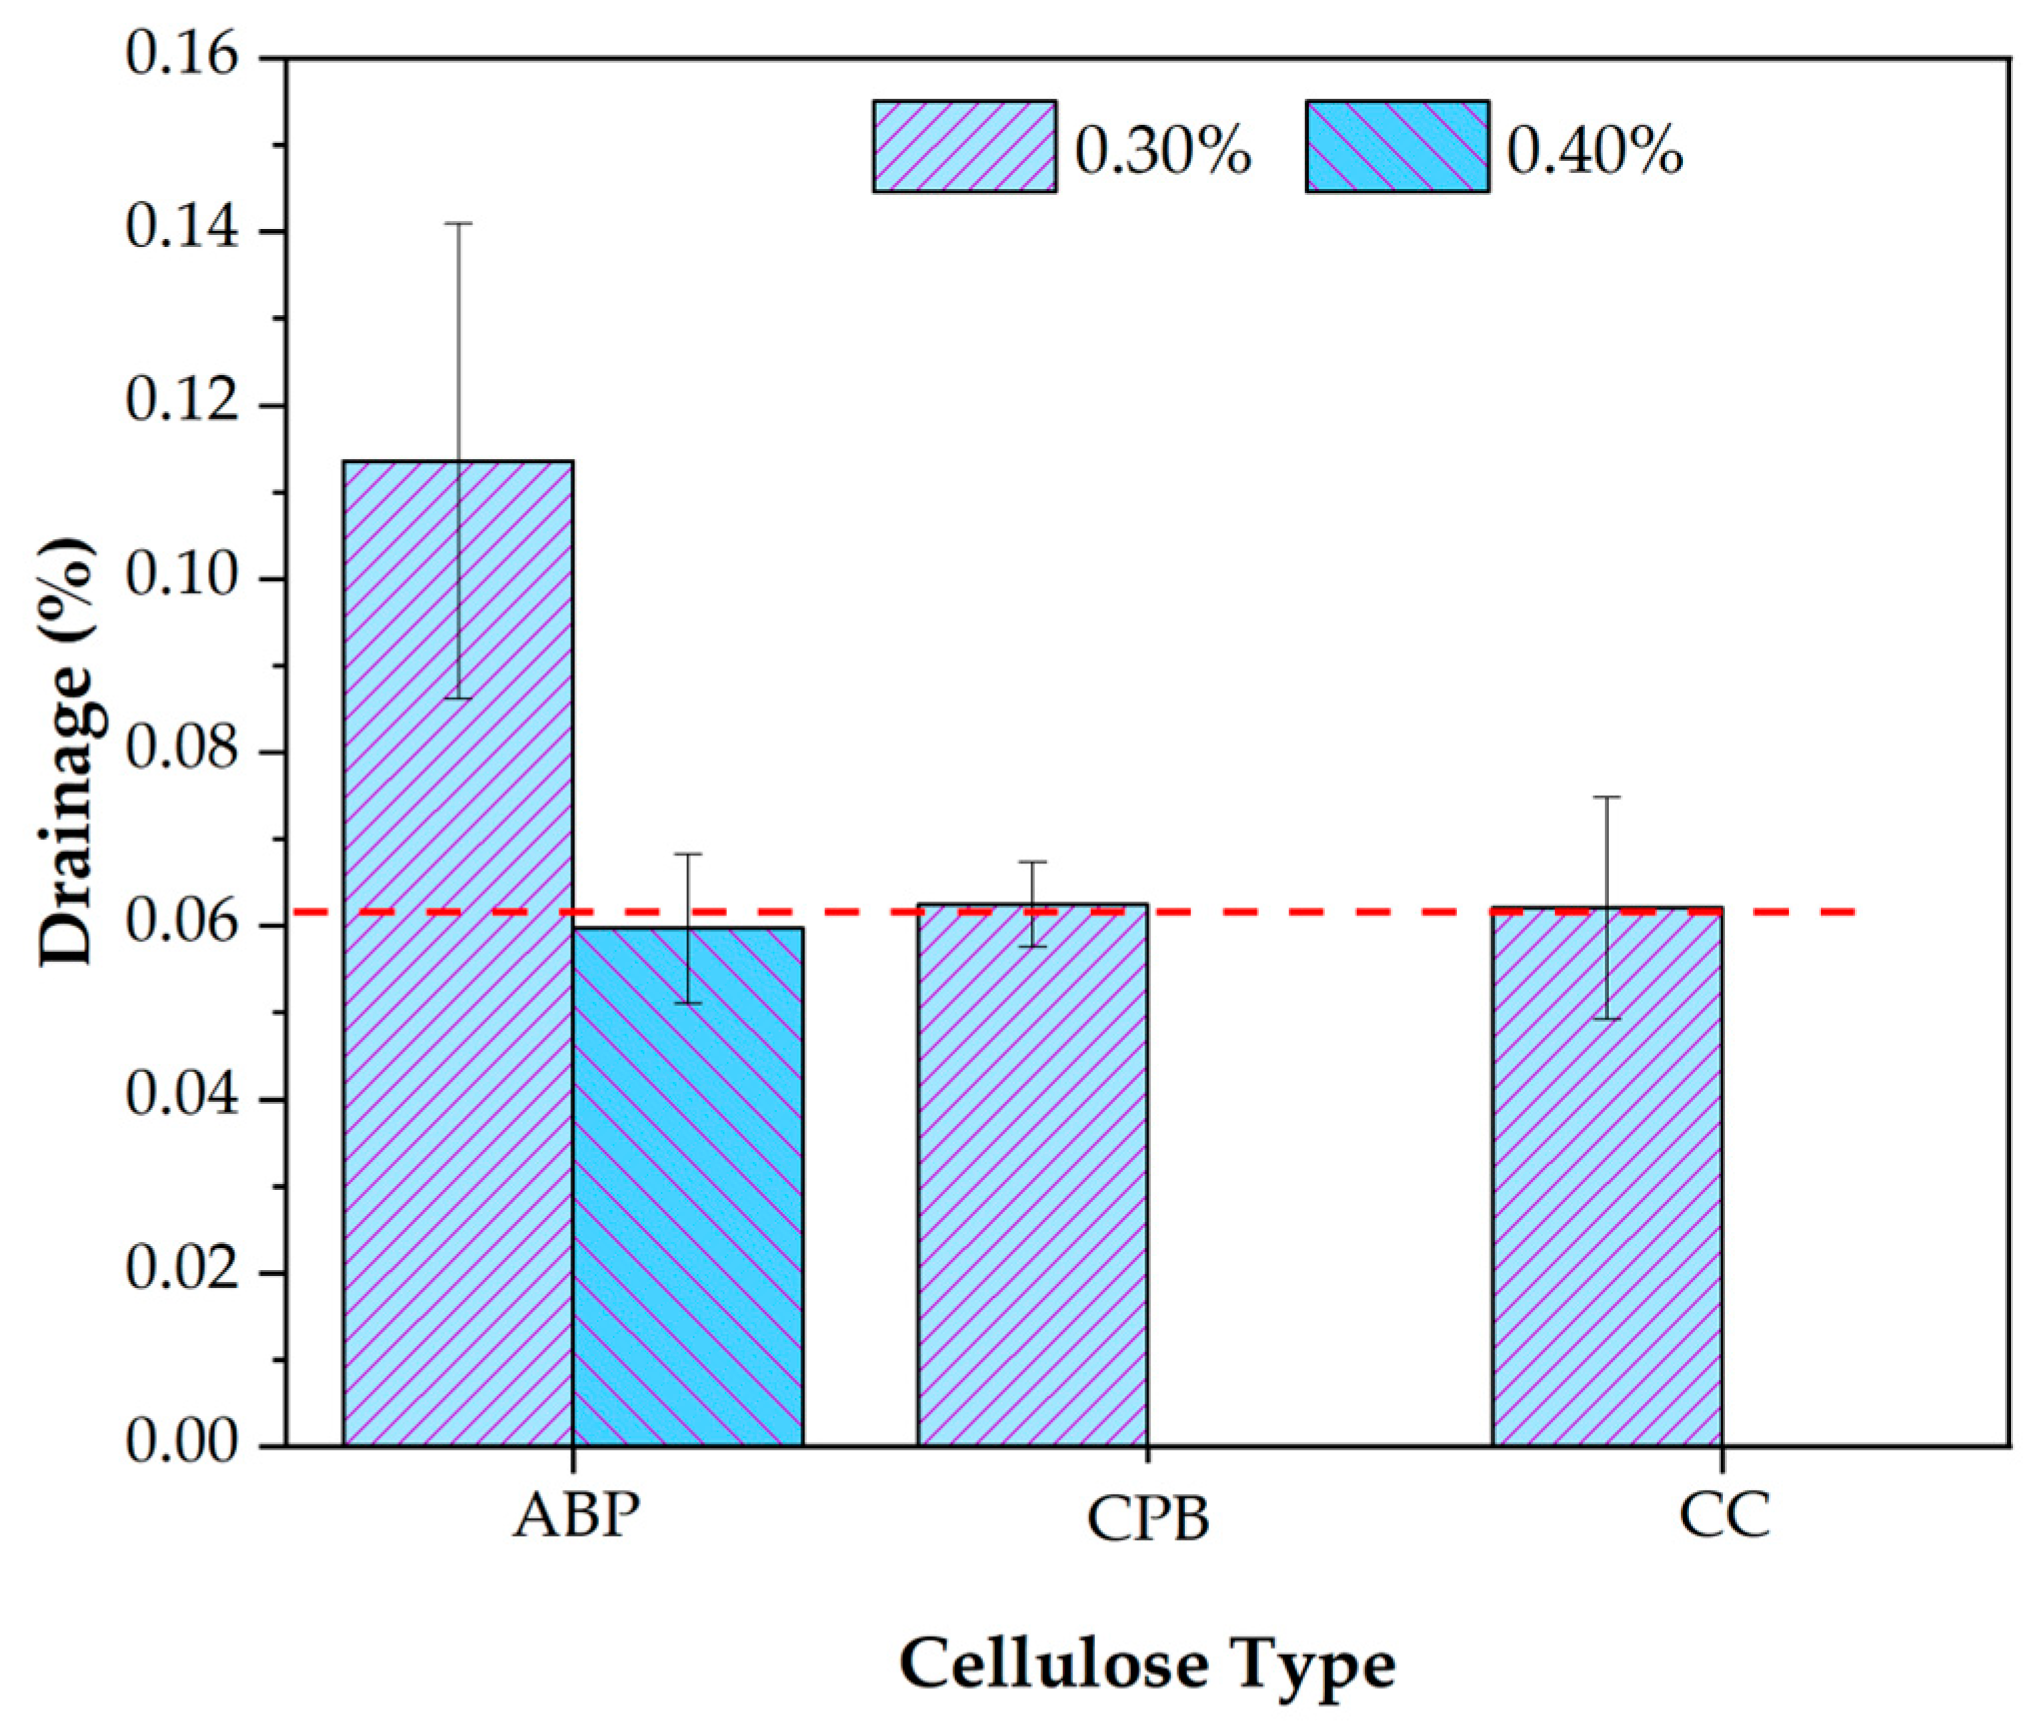

Table 1.
Chemical properties of ABF and cellulose; ABP, CPB and CC, respectively.
| Cellulose type | Kappa Number KN |
% lignin | % ash | Intrinsic Viscosity η (mL/g) |
Degree of Polymerization DP | |
|---|---|---|---|---|---|---|
| ABF | 118.17 ± 0.7 | 17.8 ± 0.1 | 2.6 ± 1.5 | - | - | |
| ABP | 13.9 ± 0.8 | 2.1 ± 0.1 | 7.4 ± 0.9 | 482.72 ± 14.22 | 692.60 ± 22.5 | |
| CPB | 67.0 ± 0.4 | 10.1 ± 0.1 | 7.5 ± 0.2 | 505.78 ± 0.68 | 729.23 ± 1.1 | |
| CC | 30.9 ± 2.4 | 4.6 ± 0.4 | 20.7 ± 0.1 | 302.36 ± 46.85 | 413.45 ± 70.7 |
Table 2.
Area ratio of FTIR spectra (Aλ/A896).
| Wavenumber (λ) |
Area ratio (Aλ/Aλ896) | |||
|---|---|---|---|---|
| ABF | ABP | CPB | CC | |
| 3334 | 9.50 ± 1.95 | 4.92 ± 0.23 | 4.50 ± 0.41 | 4.17 ± 0.39 |
| 2893 | 5.19 ± 0.24 | 2.82 ± 1.01 | 2.75 ± 0.85 | 1.73 ± 0.03 |
| 1730 | 0.87 ± 0.22 | 0.13 ± 0.08 | 0.49 ± 0.05 | 0.11 ± 0.03 |
| 1630 | 2.93 ± 0.39 | 0.67 ± 0.10 | 0.72 ± 0.06 | 0.33 ± 0.08 |
| 1425 | 1.12 ± 0.09 | 0.66 ± 0.09 | 1.46 ± 0.10 | 2.53 ± 0.13 |
| 1360 | 0.70 ± 0.07 | 1.41 ± 0.08 | 1.27 ± 0.05 | 0.70 ± 0.01 |
| 1240 | 2.66 ± 0.21 | 0.28 ± 0.04 | 1.00 ± 0.07 | 0.75 ± 0.08 |
| 1050 | 8.09 ± 0.56 | 6.67 ± 0.04 | 5.95 ± 0.03 | 7.58 ± 0.07 |
Table 3.
Absorbance ratio from FTIR spectra (A1360/A2893), IC and %Cr from XRD.
| ABF | ABP | CPB | CC | |
|---|---|---|---|---|
| TCI= A1360/2893 | 0.89 ± 0.03 | 0.80 ± 0.01 | 0.87 ± 0.07 | 0.72 ± 0.04 |
| IC | - | 0.23 | 0.44 | 0.17 |
| %Cr | - | 56.44 | 64.18 | 54.75 |
Disclaimer/Publisher’s Note: The statements, opinions and data contained in all publications are solely those of the individual author(s) and contributor(s) and not of MDPI and/or the editor(s). MDPI and/or the editor(s) disclaim responsibility for any injury to people or property resulting from any ideas, methods, instructions or products referred to in the content. |
© 2024 by the authors. Licensee MDPI, Basel, Switzerland. This article is an open access article distributed under the terms and conditions of the Creative Commons Attribution (CC BY) license (http://creativecommons.org/licenses/by/4.0/).
Copyright: This open access article is published under a Creative Commons CC BY 4.0 license, which permit the free download, distribution, and reuse, provided that the author and preprint are cited in any reuse.


