
Submitted:
08 October 2024
Posted:
09 October 2024
You are already at the latest version
Abstract
The Association of Mutual Funds of India (AMFI) under the direction of the Securities and Exchange Board of India (SEBI) provided open access to various risk parameters with respect to MidCap and SmallCap funds on its website in February, 2024. This disclosure of month wise cross-sectional data depicting stress-test and liquidity analysis was hailed as a milestone as it provided a glimpse into inherent risk of mutual funds. The AMFI dataset consisted of 14 variables including stress test results, ownership concentration on both liability & asset sides, standard deviation on portfolio’s returns, portfolio beta, trailing 12-month PE ratio, portfolio turnover etc. Among these, the primary variable identified in grading mutual fund is the stress test parameter, expressed as number of days required to liquidate 50% and 25% of the portfolio respectively on a pro-rata basis under stress condition. A higher number of days to liquidate the portfolio under stress conditions represented higher risk for the investor. The objective of our paper is to test various neural network models which can help in predicting stress levels with the highest accuracy and specificity in MidCap and SmallCap mutual funds based on AMFI’s 14 parameters as predictors.Our study utilizes AMFI datasets available for MidCap and SmallCap mutual funds from February 2024 (inception period) to May 2024. To operationalize the analysis, the derived response variable was binned to represent high and low risk based on the time required for pro-rata liquidation of the portfolio. The study employed feed-forward neural networks, with the logistic regression as the step function, to model the relationships. Results suggest that the simpler neural network models with one hidden layer and two to three nodes show higher accuracy and specificity. Analysis also shows that more complex architectures do not always guarantee better performance as these models might suffer from higher bias. By leveraging advanced computational techniques, this study contributes to the ongoing discourse surrounding risk management and decision-making in the realm of mutual fund investments.
Keywords:
Stress Test
; Liquidity Analysis
; Risk Management
; Mutual Funds
; Neural Networks
; Deep Learning
1. Introduction
The growth of mutual funds in India has been remarkable in recent years. Growing participation from retail investors can be attributed to several factors, including increasing financial awareness, favourable regulatory measures, and the attractiveness of mutual funds as a convenient and accessible investment avenue. The proliferation of mutual fund offerings and the democratization of investment access opened new avenues for investors to participate in the capital markets. As a result, mutual funds emerged as preferred investment vehicles, catering to the diverse investment objectives and risk profiles of investors across the spectrum. The mutual fund sector in India has witnessed a surge in retail investor participation as per the AMFI data released for January 2024. MidCap funds have 13 million portfolios with an investment of 29 million (INR). SmallCap funds account for 17.8 million with a value of 24.7 million (INR).1
One of the key drivers behind the surge in retail investor participation in mutual funds is the advent of systematic investment plans (SIPs) which has revolutionized the way retail investors approach mutual fund investments (Kavya and Chokkamreddy, Prakash. 2024). SIPs offer a disciplined and hassle-free approach to wealth accumulation, allowing both seasoned investors and newcomers alike to contribute small amounts at regular intervals. This systematic approach not only helps in mitigating market volatility but also inculcates financial discipline among investors, encouraging them to stay invested for the long term. As a result, mutual fund Assets Under Management (AUM) have witnessed a steady uptrend, reflecting the evolving preferences of investors seeking diversified and professionally managed investment avenues (Narasimha, M, 2024; Joshi and Arora, 2022; Sukumar, R. 2020.).
Furthermore, regulatory initiatives aimed at enhancing transparency and investor protection have bolstered investor confidence in mutual funds. Measures such as the categorization and rationalization of mutual fund schemes, along with stringent disclosure norms, have contributed to greater trust and credibility in the mutual fund industry. As a result of these concerted efforts, India has witnessed a significant uptick in retail investor participation in mutual funds. The democratization of investment access, coupled with robust investor education initiatives, has empowered individuals from diverse backgrounds to take charge of their financial futures and embark on the journey of wealth creation through mutual funds (Berk and van Binsbergen 2012; Li and Rossi. 2020; Patton and Timmermann. 2010). The onset of the global COVID-19 pandemic brought about unprecedented volatility and uncertainty in financial markets worldwide, including India. Despite initial market turbulence, the mutual fund industry in India showcased resilience and adaptability, as evidenced by the sustained growth in AUM across various schemes. This resilience is attributable to the robust regulatory framework, proactive measures by fund managers, and the enduring trust of investors in the mutual fund ecosystem (Narasimha, M, 2024).
However, despite the progress made, there remains a pressing need for continued awareness and education initiatives to ensure that investors make informed investment decisions. As retail investors navigate the complexities of the financial markets, it is imperative to equip them with the knowledge and tools necessary to identify suitable investment opportunities and manage risk effectively (Elton and Gruber. 2020; Jones and Mo 2020; Pástor et.al., 2017; Feng et.al., 2020).
This investment frenzy among retail investors in MidCap and SmallCap funds has not gone unnoticed by market regulators like the Securities Exchange Board of India (SEBI). Concerned about potential risks to retail investors amidst soaring market valuations, SEBI has initiated various steps to safeguard investor interests in these funds (Joshi and Arora, 2022). In response to SEBI’s directives, AMFI has taken some very bold steps such as, it has tasked the Trustees of all Asset Management Companies (AMCs) with framing policies to protect investors in MidCap and SmallCap schemes. The policies being formulated by the Trustees, in consultation with Unitholder Protection Committees of the AMCs, are designed to incorporate proactive measures to shield investors from potential risks. These measures also include moderating inflows into MidCap and SmallCap funds, portfolio rebalancing, and enhancing disclosure of risk parameters and stress tests. The rationale behind these regulatory measures lies in the unprecedented returns witnessed by MidCap and SmallCap indices in recent times, coupled with heightened market volatility due to global events. The surge in investor inflows has led to inflated valuations, raising concerns about market stability and investor protection (Irvine et.al.,2018). Hence, SEBI and AMFI are taking proactive steps to ensure that fund houses are adequately prepared to navigate market uncertainties and protect the interests of retail investors. Through these measures, they aim to uphold market integrity and promote investor confidence in India’s mutual fund industry.
Given this outlook, recently the landscape of mutual fund investments in India has witnessed a notable transformation, marked by the introduction of innovative methodologies for evaluating fund performance and risk. One such significant development is the initiative undertaken by the Association of Mutual Funds of India (AMFI) to assess stress levels in MidCap and SmallCap mutual funds referred to as “Stress Test”. The test involves simulating scenarios where a significant number of investors demand redemption, thereby assessing how quickly a fund can meet redemption requests from investors. For both MidCap and SmallCap Funds, liquidation of either 25 percent or 50 percent of the portfolio on a pro-rata basis and time taken to meet the liquidation request is considered in the dataset. Importantly, the stress test allows fund managers to exclude the bottom 20 percent of the portfolio based on liquidity considerations. This provision enables fund managers to retain stocks deemed essential for long-term gains, enhancing the flexibility and strategic management of the portfolio. This initiative represents a proactive step towards enhancing transparency and accountability within the mutual fund industry, aiming to provide investors with deeper insights into the resilience of their investment portfolios.
The volatility and unpredictability of financial markets pose significant challenges for investors, particularly in assessing the stress levels of mutual funds. While SEBI has outlined a methodology for stress testing mutual funds, there remains a need for advanced analytical tools to accurately predict the stress levels of mutual funds, particularly in the MidCap and SmallCap segments. Traditional approaches may lack the sophistication and predictive power needed to navigate the complexities of modern financial markets. To overcome that limitation, we test various neural network models which can help in predicting stress levels with the highest accuracy and specificity in MidCap and SmallCap mutual funds based on AMFI’s parameters as predictors.
We also test the effectiveness and reliability of the models to provide actionable insights and recommendations to aid investors and fund managers in managing risk and optimizing portfolio strategies. Next two sections provide details on data collection and research methodology. It is followed by data analysis and interpretation. Finally, some conclusions and future research possibilities.
2. Data Collection
For our study, the stress test data was sourced from the AMFI website’s dedicated section, “Disclosure of Stress Test & Liquidity Analysis in respect of MidCap & SmallCap Funds.” Specifically, stress test data pertaining to MidCap and SmallCap mutual funds for four months February 2024 to May 2024 was collected. The number of companies that were part of the dataset from February to May 2024 is provided in Table 1.
The dataset included information on 29 MidCap companies and 27 SmallCap companies till April 2024, but the number of companies decreased in May 2024 to 13 and 10 respectively. The MidCap and SmallCap mutual funds which were part of the dataset is provided in the Table 2 and Table 3 respectively.
Upon collecting the stress test data, a thorough data preprocessing step was conducted to ensure its quality and suitability for analysis. This involved excluding schemes which had missing valuesand inconsistencies within the dataset to enhance its integrity and reliability for subsequent modelling efforts. We tried not to impute values for missing values across parameters identified. Table 3 lists the 14 parameters which were identified as features for model development for evaluation purposes. These parameters were deemed essential for assessing mutual fund stress levels based on its presence in the stress test template and were subsequently used as features in the modelling process.

Table 3.
The 14 parameters as features for model development.
| Sl.No | INDEPENDENT VARIABLES | DESCRIPTION |
|---|---|---|
| 1 | AUM (INR in Crores) | Asset Under Management in crores of INR (1 crore equals 10 million) |
| 2 | Liability side Top 10 investor (%) | Indicates % of AUM held by top 10 investors of the scheme. |
| 3 | Asset side (AUM held in) Large Cap (%) | indicates % of scheme AUM invested in large cap, mid cap and small cap securities, and % held in cash. |
| 4 | Asset side (AUM held in) Mid Cap (%) | |
| 5 | Asset side (AUM held in) Small Cap (%) | |
| 6 | Asset side (AUM held in) Cash (%) | |
| 7 | Portfolio Annualised Standard Deviation (%) | Standard deviation indicates how widely a stock or portfolio’s returns varies from its mean over a given period. For each incremental standard deviation, there is an increasing level of reliability |
| 8 | Benchmark Annualised Standard Deviation (%) | |
| 9 | Portfolio Beta | Beta is a measure of volatility - or systemic risk - of a security or portfolio compared to the market (usually the broad market index such as BSE-500 or NSE-500). Stocks with betas higher than 1.0 can be interpreted as more volatile than the broad market index. |
| 10 | Portfolio Trailing 12m PE | The Price-to-earnings (P/E) ratio is one of the most widely used valuation methods as it accounts for a company’s actual earnings instead of projected earnings. The P/E ratio indicates how much an investor is willing to pay for one unit of earnings for that company. For a given company, whether the value of current P/E is suitable depends on various factors including sector, growth prospects, business cycle etc. |
| 11 | Benchmark PE Trailing 12m PE | |
| 12 | Benchmark PE Trailing 12m PE 1 year ago | |
| 13 | Benchmark PE Trailing 12m PE 2 year ago | |
| 14 | Portfolio Turnover Ratio (%) | Portfolio turnover is a measure of how frequently assets within a mutual fund scheme are bought and sold by the fund manager over a given period. Portfolio turnover is calculated by taking either the total amount of new securities purchased, or the number of securities sold (whichever is less) over a particular period, divided by the total net asset value (NAV) of the fund. The measurement is usually reported for a 12-month period. For example, a 5% portfolio turnover ratio suggests that 5% of the portfolio holdings changed over a one-year period. |
Two dependent variables considered for the study are shown in Table 4. Separate models were built for stress test with 50% portfolio and 25% portfolio for four months separately.
For data exclusion criteria, due to potential data incompleteness or inconsistency, a few companies were excluded from the modelling process to ensure the robustness and reliability of the analysis. This step was crucial for maintaining the integrity of the dataset and mitigating the risk of bias in the modelling results. The companies excluded from the dataset for non-availability of data with respect to few variables is shown in Table 5 and Table 6 for each respective month.
For the response variable, binning was conducted by considering stress level of 7 days and above as high stress companies2. Thus, companies were categorized into two levels namely High Stress and Low Stress level companies across all the months. Table 6, Table 7, and Table 8 show the summary of companies which were further categorized for 50% and 25% portfolio liquidation from February to May 2024.
3. Research Methodology
To build classification-based model, neural network was utilized with the logistic regression as the step function/activation function. For the study, the neural networks used was multilayer feedforward networks, which are networks in which there is an input layer consisting of nodes (sometimes called neurons) which accept the 14 predictor values in our study, and successive layers of nodes are to receive input from the previous layers (Bergstra and Bengio 2012; Trevor et.al., 2009). The outputs of nodes in each layer are inputs to nodes in the next layer. The last layer is called the output layer. Layers between the input and output layers are known as hidden layers. A feedforward network is a fully connected network with a one-way flow and no cycles. Various configurations of neural networks were explored, including models with one, two, and three hidden layers, with the number of nodes ranging from 2 to 10. This approach allowed for flexibility and adaptability in capturing the underlying patterns and relationships within the dataset, ultimately facilitating accurate predictions of mutual fund stress levels (Chen et.al. 2020; Gu et.al., 2020). For model evaluation, the trained neural network models were evaluated using appropriate performance metrics to assess their effectiveness in predicting mutual fund stress levels. These metrics provided insights into the models’ accuracy, precision, recall, F1-score, and overall predictive capability, enabling a comprehensive evaluation of their performance (Crone et.al.,2011; Hyndman and Koehler.2006; Makridakis et.al., 2019). Sensitivity measures the ability of a model to classify the observation as positive given it was positive in nature. It is given by the formula:
Specificity on the other hand measures the ability of a model to classify the observation as Negative given it was Negative in nature. It is given by the formula:
Precision measures the accuracy of positives classified by the model and is given by formula
Finally, F-score/F-Measure is used in binary logistic regression model that combines both precision and recall and is given by:
We also consider the additional metrics such as Kappa and Mcnemar’s Test P-Value.. Kappa measures the agreement between the model’s predictions and the actual labels, correcting for the agreement occurring by chance. Mcnemar’s Test P-Value assesses whether there is a significant difference in performance between two models. In selection of the neural network architectures, the results were evaluated considering the importance of carefully balancing bias and variance when designing. While complex models may capture intricate relationships in the data, they also risk overfitting and poor generalization. Conversely, overly simplistic models may fail to capture essential patterns, leading to high bias (Du et.al., 2019). By understanding the bias-variance trade-off’s, we were able to fine-tune model architectures to achieve optimal performance for specific tasks (Harvey and Liu. 2018; Srivastava et.al., 2014).
4. Data Analysis and Interpretation
In this section we investigate the results of model building for MidCap and SmallCap funds with Pro-rata basis liquidation at 50% portfolio and 25% portfolio for the month of February, March, April and May 2024 respectively.
- a)
- Model Building for MidCap funds for February 2024 with Pro-rata basis liquidation of 50% portfolio
Initially as shown in Figure-1, a simple FFNN with one hidden layer and two nodes was built to predict the stress level of the MidCap funds with 50% portfolio considered for pro-rata basis liquidation for February, 2024. The result of the analysis is shown in Table-10:
As observed from Table 10, while the model demonstrates high sensitivity in correctly identifying instances of low stress levels, it suffers from low specificity and overall poor performance in accurately predicting stress levels. The accuracy of the model is calculated to be 0.8, indicating that it correctly classified 80% of the instances in the dataset. The No Information Rate(NIR) is also calculated to be 0.8, indicating that the model’s accuracy is comparable to simply predicting the majority class (No) for all instances. The kappa score, which measures the agreement between the model’s predictions and the actual values, is calculated to be 0. This suggests that there is no agreement between the model’s predictions and the actual outcomes, indicating poor performance. The sensitivity of the model, also known as the True Positive Rate, is calculated to be 1.0. This indicates that the model correctly identified all instances where the stress level was low (No). The specificity of the model, which measures the True Negative Rate, is calculated to be 0.0. This indicates that the model failed to correctly identify any instances where the stress level was high (Yes). The balanced accuracy of the model, which considers the imbalance in class distribution, is calculated to be 0.5. This suggests that the model’s performance is no better than random guessing. Thus, further refinement and optimization of the model was necessary to improve its predictive capability and reliability. Thus, various combinations of number of hidden layers and number of nodes were assessed using trial and error method. Some of the neural networks built in are shown in Figure-2 and Figure-3 respectively.
The summary of the results obtained in building various FFNN models to predict stress level of MidCap companies with pro-rate liquidation of 50% portfolio for the month of February, 2024 is presented in Table 11.
The results presented in the Table 11 offer insights into the performance of FeedForward Neural Network (FFNN) models with varying architectures for the pro-rata liquidation of a 50% portfolio for MidCap companies in February 2024. These results are typically analyzed through the lens of the bias-variance trade-off, a fundamental concept in machine learning model evaluation. Starting with the models’ accuracies, we see variations across different configurations. Accuracy represents the proportion of correctly classified instances out of the total instances. The model with one hidden layer and three nodes achieves perfect accuracy, indicating that it correctly predicts all instances in the dataset. On the other hand, models with two hidden layers and fewer nodes exhibit slightly lower accuracies, ranging from 0.72 to 0.96. This discrepancy suggests that more complex architectures do not always guarantee better performance. Thus, considering the criteria of bias and variance, in this situation, where bias refers to the error introduced by approximating a real-world problem with a simplified model, we observe that, models with lower accuracy, might suffer from higher bias. These models may not capture the underlying patterns in the data adequately, leading to systematic errors in predictions. Conversely, models with higher accuracy, like the one with one hidden layer and three nodes, will likely have lower bias, as they closely match the true relationship between input features and output. Variance, on the other hand, measures the model’s sensitivity to fluctuations in the training data. Higher variance implies that the model is overly sensitive to noise or random fluctuations, which can lead to poor generalization to unseen data. Models with more complex architectures, such as two hidden layers with 10 nodes, might exhibit higher variance, as evidenced by their lower accuracies compared to simpler models. These models may have learned to capture noise in the training data instead of the underlying patterns, resulting in poor performance on new data.
- b)
- Model Building for all the MidCap funds and SmallCap funds for February and March 2024 with Pro-rata basis liquidation of 50% portfolio and 25% portfolio
The summary of the results obtained in building various FFNN models to predict stress level of MidCap and SmallCap companies with pro-rate liquidation of 50% and 25% portfolio for the month of February, March & April 2024 is shown in Table 12 and Table 13 respectively:
As observed, Table 12 and Table 13 presents the performance metrics of the best neural network (NN) models for mid-cap and small-cap funds with pro-rata liquidation of 50% and 25% portfolios for the months of February and March 2024. These metrics offer valuable insights into the models’ effectiveness in predicting the liquidation strategies for different types of funds and time periods. Across all scenarios, the best-performing NN model consistently achieves perfect accuracy, indicating that it correctly predicts all instances in the dataset. This exceptional accuracy underscores the effectiveness of the model in capturing the underlying patterns and relationships in the data. Furthermore, the models consistently outperform the No Information Rate, which serves as a baseline performance metric, indicating that the models provide substantial value beyond random guessing. The high Kappa values of 1 for all scenarios suggest strong agreement between the model’s predictions and the actual outcomes, correcting for agreement occurring by chance. This indicates robust performance across different liquidation strategies and fund types. Since the Mcnemar’s Test P-Value is not available (NA), it’s challenging to assess whether there is a significant difference in performance between models. However, the consistent high accuracy and Kappa values across scenarios suggest that the performance of the best NN model remains stable and reliable. Moreover, the sensitivity and specificity metrics indicate that the model performs well in correctly identifying both positive and negative instances, respectively. The perfect sensitivity and specificity scores further validate the model’s ability to accurately predict the liquidation strategies for both mid-cap and small-cap funds across different time periods and portfolio liquidation percentages. Overall, the results demonstrate the effectiveness of the NN model in predicting optimal liquidation strategies for mid-cap and small-cap funds, highlighting its potential utility in financial decision-making processes.
5. Conclusion and Scope for Future Research
The recent introduction of innovative methodologies for evaluating mutual fund performance and risk in India, exemplified by the Association of Mutual Funds of India’s (AMFI) “Stress Test” initiative, marks a significant transformation in the investment landscape. This initiative, supported by SEBI’s outlined methodology, aims to assess the stress levels in mid-cap and small-cap mutual funds by simulating scenarios of significant redemption requests. The proactive approach taken by AMFI and SEBI reflects a commitment to enhancing transparency and accountability within the mutual fund industry, ultimately empowering investors with deeper insights into the resilience of their investment portfolios. The results obtained from the analysis highlights the effectiveness of neural network models in predicting optimal liquidation strategies for mid-cap and small-cap funds under different scenarios. The consistently high accuracy, Kappa values, sensitivity, and specificity metrics underscore the reliability and robustness of these models in assessing fund performance and risk.
In conclusion, the integration of innovative methodologies such as stress testing into mutual fund evaluation frameworks represents a positive step towards bolstering investor confidence and promoting informed decision-making. By providing insights into how funds perform under stress scenarios, investors can better understand the potential risks associated with their investments and make more informed choices.
Moving forward, there are several suggestions and avenues for future research. Firstly, ongoing monitoring and refinement of stress testing methodologies will be essential to ensure their effectiveness in capturing evolving market dynamics. Additionally, exploring the application of advanced machine learning techniques beyond neural networks, such as ensemble methods or deep learning architectures, could further enhance the accuracy and predictive power of fund evaluation models. Furthermore, conducting comprehensive studies to evaluate the impact of stress testing initiatives on investor behavior, market stability, and fund performance over the long term would provide valuable insights for industry stakeholders and regulators.
Overall, the introduction of stress testing initiatives represents a significant milestone in the evolution of mutual fund evaluation practices in India. By embracing innovation and adopting proactive measures to enhance transparency and accountability, the mutual fund industry can continue to foster investor trust and contribute to the development of a resilient and sustainable financial ecosystem. By leveraging advanced computational techniques, this study contributes to the ongoing discourse surrounding risk management and decision-making in the realm of mutual fund investments. The insights garnered from this research have practical implications for investors, fund managers, and regulatory bodies, facilitating more informed investment strategies and risk mitigation measures in the mutual fund industry.
| 1 | |
| 2 | In the article titled “Revealed! No. of days Nippon India, biggest small-cap fund, will need to sell off 50% of its portfolio “, emphasized that more than 3-6 days would suggest stress in the mutual fund. https://www.businesstoday.in/mutual-funds/story/revealed-no-of-days-nippon-india-biggest-small-cap-fund-will-need-to-sell-off-50-of-its-portfolio-421556-2024-03-15. |
References
- Berk, Jonathan and van Binsbergen, Jules. Measuring Skill in the Mutual Fund Industry. Journal of Financial Economics 2012, 118, 1–20. [Google Scholar] [CrossRef]
- Bergstra, James and Bengio, Y. Random Search for Hyper-Parameter Optimization. The Journal of Machine Learning Research 2012, 13, 281–305. [Google Scholar] [CrossRef]
- Chen Wei, Xu, Huilin, Jia, Lifen and Gao, Ying. Machine learning model for Bitcoin exchange rate prediction using economic and technology determinants. International Journal of Forecasting 2020, 37, 28–43. [Google Scholar] [CrossRef]
- Crone, Sven, Hibon, Michele and Nikolopoulos, Konstantinos. Advances in forecasting with neural networks? Empirical evidence from the NN3 competition on time series prediction. International Journal of Forecasting 2011, 27, 635–660. [Google Scholar] [CrossRef]
- Du, Mengnan, Liu, Ninghao and Hu, Xia. Techniques for interpretable machine learning. Communications of the ACM 2019, 63, 68–77. [Google Scholar] [CrossRef]
- Elton, Edwin and Gruber, Martin. A Review of the Performance Measurement of Long-Term Mutual Funds. Financial Analysts Journal 2020, 76, 22–37. [Google Scholar] [CrossRef]
- Feng, Guanhao, Giglio, Stefano and Xiu, Dacheng. Taming the Factor Zoo: A Test of New Factors. The Journal of Finance 2020, 75, 1327–1370. [Google Scholar] [CrossRef]
- Gu, Shihao, Kelly, Bryan and Xiu, Dacheng. Empirical Asset Pricing via Machine Learning. The Review of Financial Studies 2020, 33, 2223–2273. [Google Scholar] [CrossRef]
- Harvey, Campbell and Liu, Yan. Detecting Repeatable Performance. The Review of Financial Studies 2018, 31, 2499–2552. [Google Scholar] [CrossRef]
- Joshi, A.; Arora, S. Economic Conditions and Investor Behavior: Evidence from Indian Mutual Funds. Economic Analysis and Policy 2022, 56, 201–220. [Google Scholar]
- Kavya and Chokkamreddy, Prakash. Growth and Dynamics in the Indian Mutual Fund Industry: Analyzing Investor Preferences and Investment Strategies. International Journal of Advanced Research in Science, Communication and Technology, 2024; 175–183. [Google Scholar]
- Trevor Hastie, Robert Tibshirani and Jerome Friedman 2009. The Elements of Statistical Learning: Data Mining, Inference, and Prediction. 2nd Edition, Springer.
- Hoberg, Gerard, Kumar, Nitin and Prabhala, Nagpurnanand. Mutual Fund Competition, Managerial Skill, and Alpha Persistence. Review of Financial Studies 2018, 31, 1896–1929. [Google Scholar] [CrossRef]
- Hyndman, Rob and Koehler, Anne. Another look at measures of forecast accuracy. International Journal of Forecasting 2006, 22, 679–688. [Google Scholar] [CrossRef]
- Irvine, Paul, Kim, Jeong and Ren, Jue. The Beta Anomaly and Mutual Fund Performance. The Beta Anomaly and Mutual Fund Performance. SSRN Electronic Journal 2018. [CrossRef]
- Jones, Christopher and Mo, Haitao. Out-of-Sample Performance of Mutual Fund Predictors. The Review of Financial Studies 2020, 34, 149–193. [Google Scholar] [CrossRef]
- Li, Bin and Rossi, Alberto. Selecting Mutual Funds from the Stocks They Hold: A Machine Learning Approach. SSRN Electronic Journal 2020. [Google Scholar] [CrossRef]
- Makridakis, Spyros, Spiliotis, Evangelos and Assimakopoulos, Vassilis. The M4 Competition: 100,000 time series and 61 forecasting methods. International Journal of Forecasting 2019, 36, 54–74. [Google Scholar] [CrossRef]
- Narasimha, M. Mutual Funds Market in India. International Journal of Marketing & Human Resource Management 2024, 13, 34–41. [Google Scholar]
- Pástor, Ľuboš, Stambaugh, Robert and Taylor, Lucian. Do Funds Make More When They Trade More? The Journal of Finance 2017, 72, 1483–1528. [Google Scholar] [CrossRef]
- Patton, Andrew and Timmermann, Allan. Monotonicity in asset returns: New tests with applications to the term structure, the CAPM, and portfolio sorts. Journal of Financial Economics 2010, 98, 605–625. [Google Scholar] [CrossRef]
- Srivastava, Nitish, Hinton, Geoffrey, Krizhevsky, Alex, Sutskever, Ilya and Salakhutdinov, Ruslan. Dropout: A Simple Way to Prevent Neural Networks from Overfitting. Journal of Machine Learning Research 2014, 15, 1929–1958. [Google Scholar] [CrossRef]
- Sukumar, R. Mutual Funds: A Modern Investment Option for Indian Investors. Asian Journal of Finance & Accounting 2020, 12, 89–102. [Google Scholar]
Figure 1.
FFNN with one hidden layer and two nodes for MidCap companies in February, 2024 with pro-rata liquidation of 50% portfolio.
Figure 1.
FFNN with one hidden layer and two nodes for MidCap companies in February, 2024 with pro-rata liquidation of 50% portfolio.
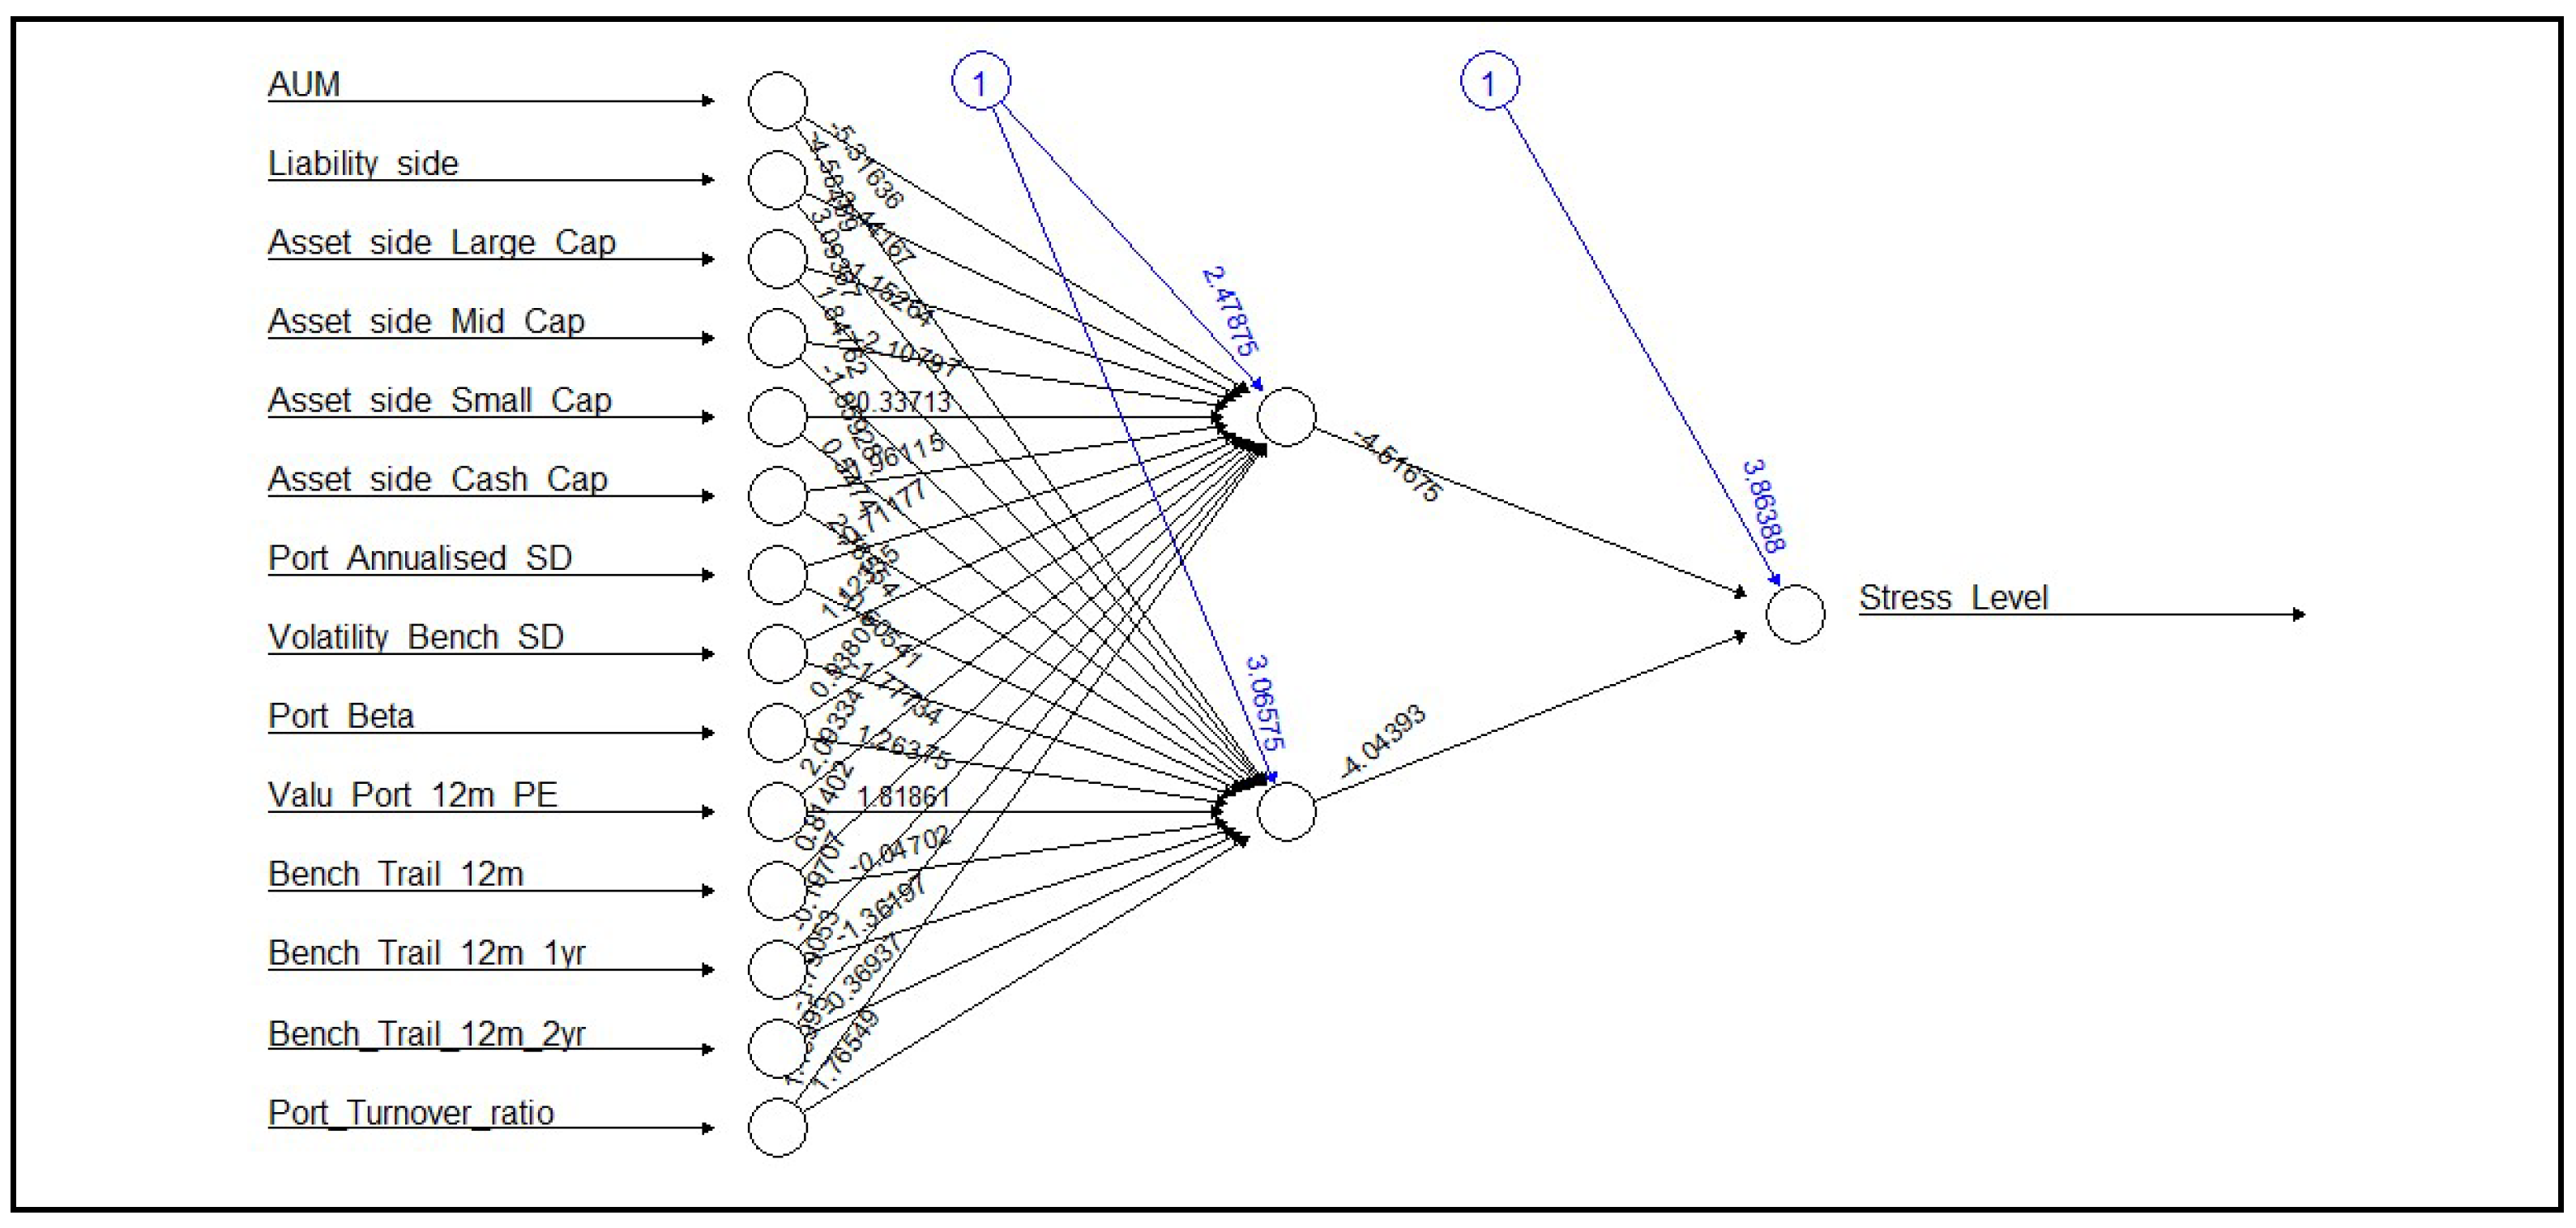
Figure 2.
FFNN with two hidden layer and two nodes for MidCap companies in Feb, 2024 with pro-rata liquidation of 50% portfolio.
Figure 2.
FFNN with two hidden layer and two nodes for MidCap companies in Feb, 2024 with pro-rata liquidation of 50% portfolio.
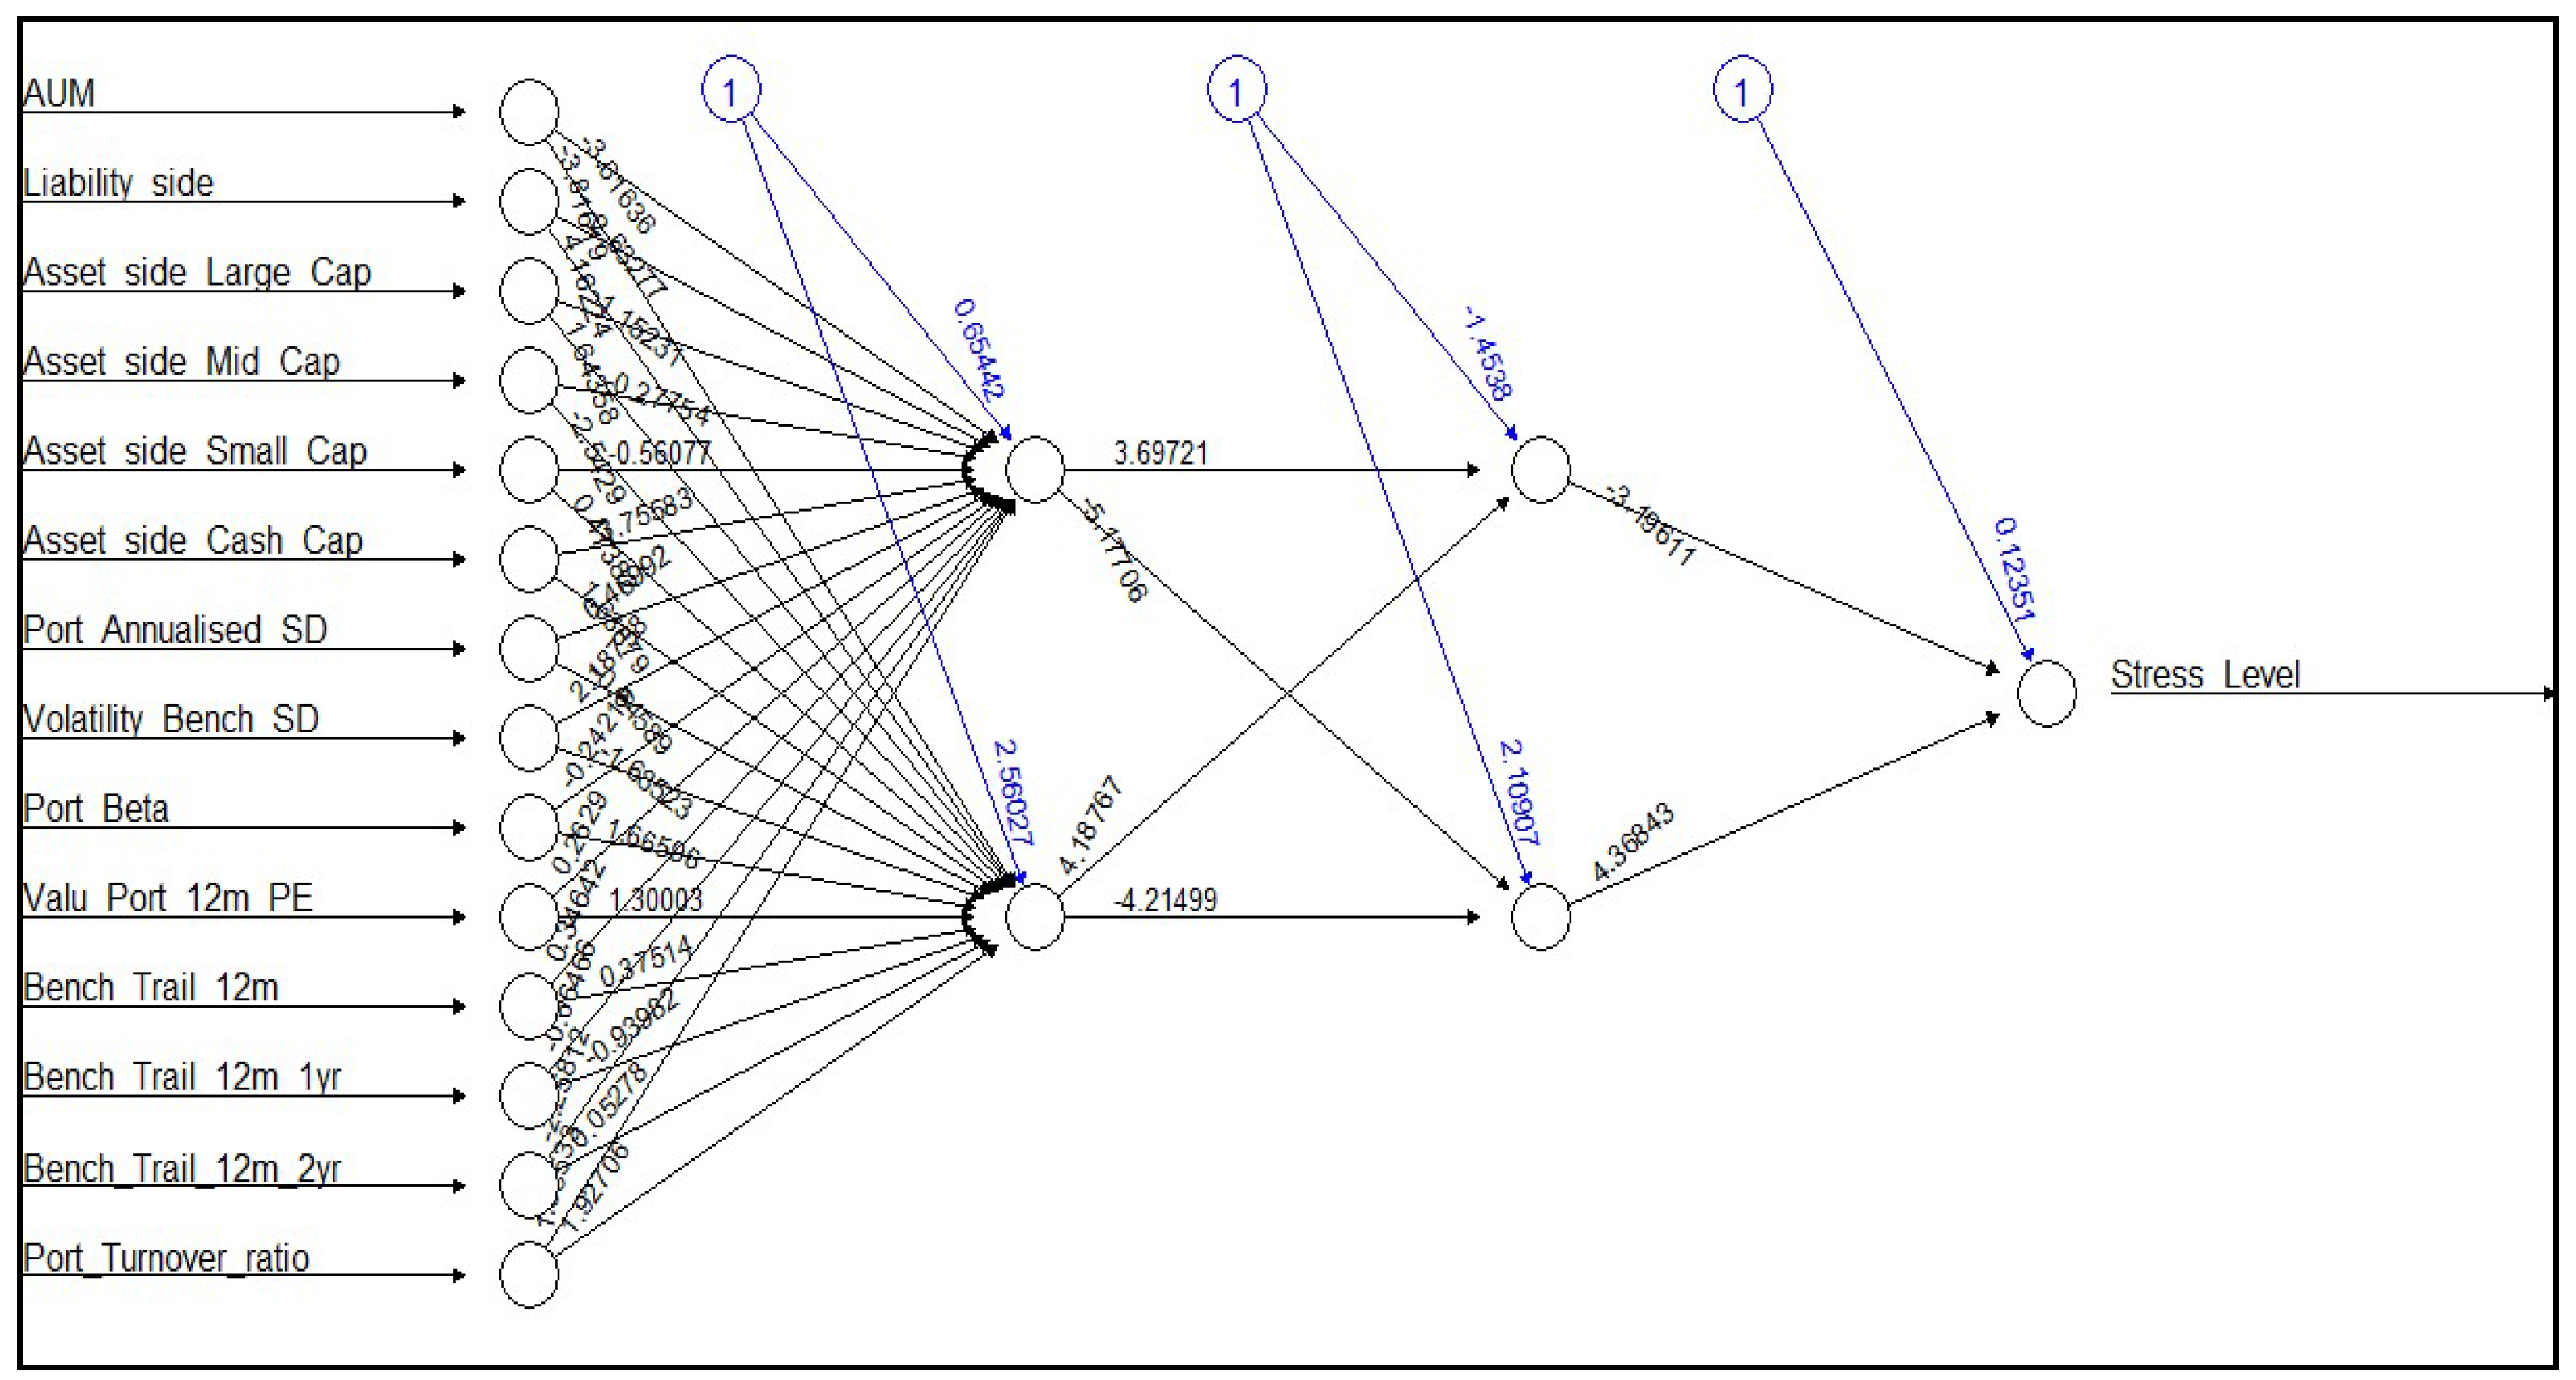
Figure 3.
FFNN with three hidden layer and ten nodes for MidCap companies in Feb, 2024 with pro-rata liquidation of 50% portfolio.
Figure 3.
FFNN with three hidden layer and ten nodes for MidCap companies in Feb, 2024 with pro-rata liquidation of 50% portfolio.
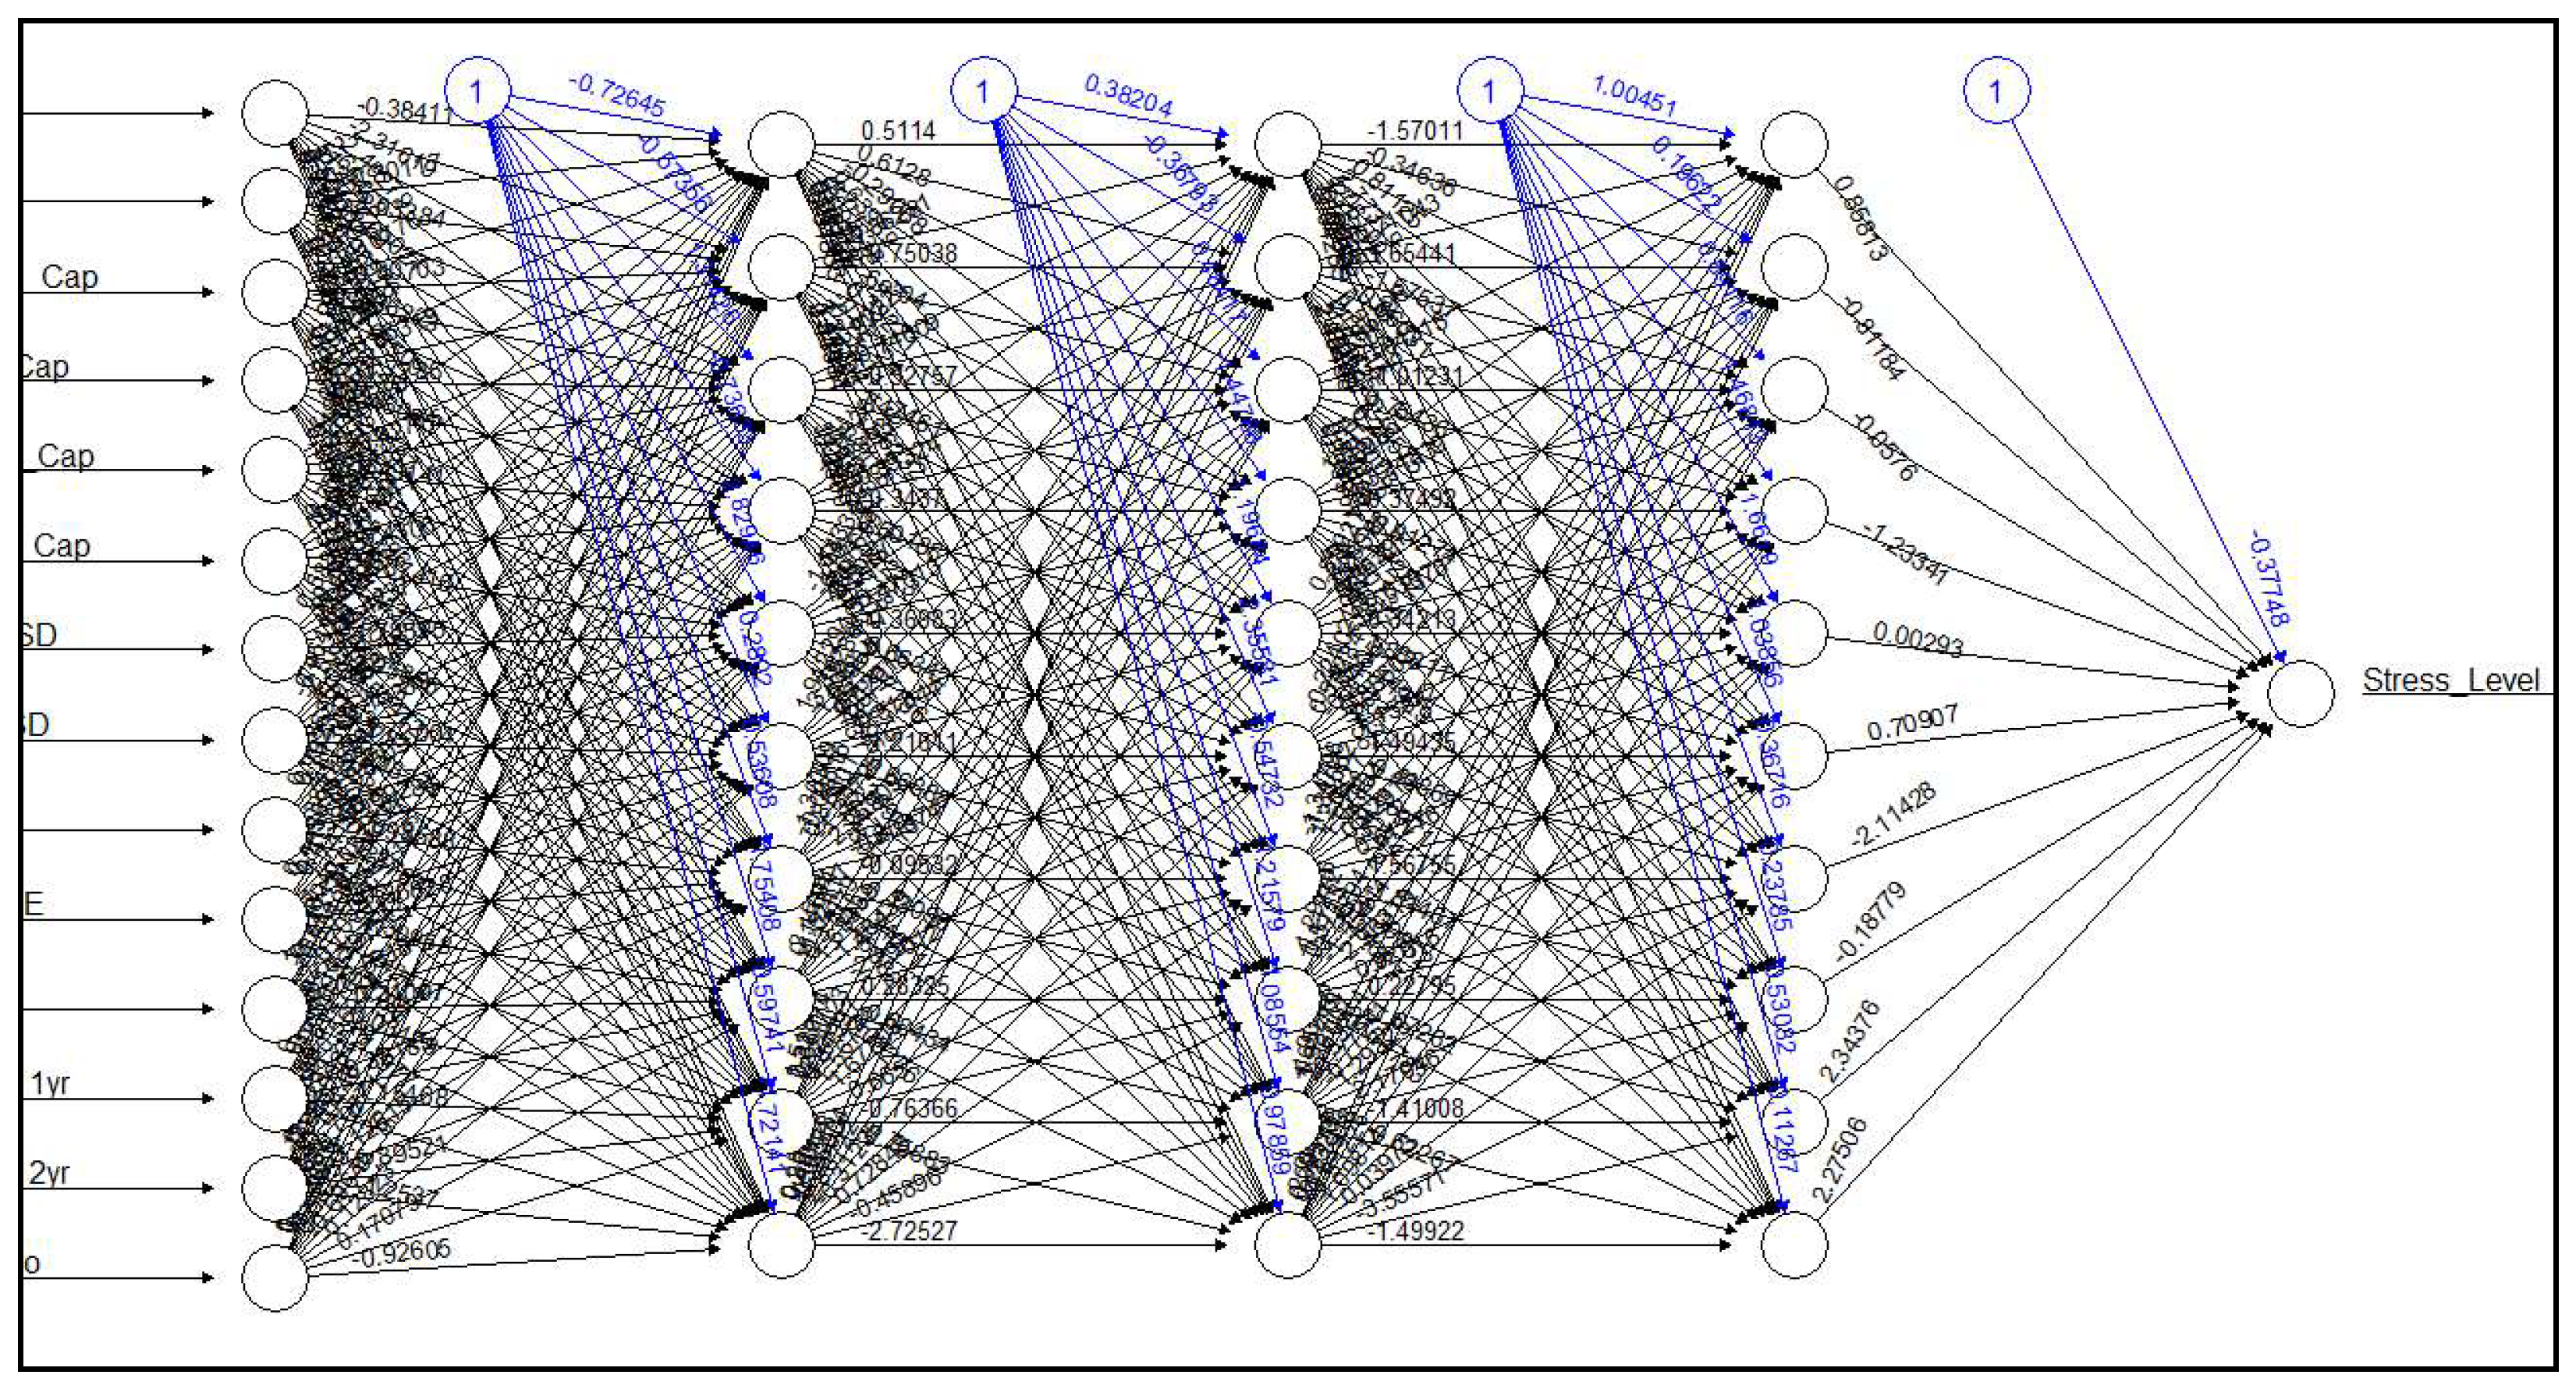
Table 1.
Number of companies as part of monthly stress test datasets.
| Month | Mid Cap funds | Small Cap funds |
|---|---|---|
| February to April, 2024 | 29 | 27 |
| May, 2024 | 13 | 10 |
Table 2.
List of MidCap and SmallCap mutual funds part of dataset (Feb-April 2024).
| SL.NO | MID CAP MUTUAL FUNDS | SMALL CAP MUTUAL FUNDS |
|---|---|---|
| 1 | Aditya Birla Sun Life Mid Cap Fund | Aditya Birla Sun Life Small Cap Fund |
| 2 | Axis Mid Cap Fund | Axis Small Cap Fund |
| 3 | Bandhan Mid Cap Fund | Bandhan Small Cap Fund |
| 4 | Baroda BNP Paribas Mid Cap Fund | Bank Of India Small Cap Fund |
| 5 | Canara Robeco Mid Cap Fund | Baroda BNP Paribas Small Cap Fund |
| 6 | DSP Mid Cap Fund | Canara Robeco Small Cap Fund |
| 7 | Edelweiss Mid Cap Fund | DSP Small Cap Fund |
| 8 | Franklin India Prima Fund | Edelweiss Small Cap Fund |
| 9 | HDFC Mid Cap Opportunities Fund | Franklin India Smaller Companies Fund |
| 10 | HSBC Mid Cap Fund | HDFC Small Cap Fund |
| 11 | ICICI Prudential Mid Cap Fund | HSBC Small Cap Fund |
| 12 | Invesco India Mid Cap Fund | ICICI Prudential Small Cap Fund |
| 13 | ITI Mid Cap Fund | Invesco India Small Cap Fund |
| 14 | JM Mid Cap Fund | ITI Small Cap Fund |
| 15 | Kotak Emerging Equity Fund | Kotak Small Cap Fund |
| 16 | LIC MF Mid Cap Fund | LIC MF Small Cap Fund |
| 17 | Mahindra Manulife Mid Cap Fund | Mahindra Manulife Small Cap Fund |
| 18 | Mirae Asset Mid Cap Fund | Motilal Oswal Small Cap Fund |
| 19 | Motilal Oswal Mid Cap Fund | Nippon India Small Cap Fund |
| 20 | Nippon India Growth Fund | PGIM India Small Cap Fund |
| 21 | PGIM India Mid Cap Opportunities Fund | Quant Small Cap Fund |
| 22 | Quant Mid Cap Fund | Quantum Small Cap Fund |
| 23 | SBI Magnum Mid Cap Fund | SBI Small Cap Fund |
| 24 | Sundaram Mid Cap Fund | Sundaram Small Cap Fund |
| 25 | Tata Mid Cap Growth Fund | Tata Small Cap Fund |
| 26 | Taurus Mid Cap Fund | Union Small Cap Fund |
| 27 | Union Mid Cap Fund | UTI Small Cap Fund |
| 28 | UTI - Mid Cap Fund | |
| 29 | WhiteOak Capital Mid Cap Fund |
Table 3.
List of MidCap and SmallCap mutual funds part of dataset (May 2024).
| SL.NO | MID CAP MUTUAL FUNDS | SMALL CAP MUTUAL FUNDS |
|---|---|---|
| 1 | Bandhan Mid Cap Fund | Bandhan Small Cap Fund |
| 2 | Canara Robeco Mid Cap Fund | Canara Robeco Small Cap Fund |
| 3 | Edelweiss Mid Cap Fund | Edelweiss Small Cap Fund |
| 4 | HSBC Mid Cap Fund | HSBC Small Cap Fund |
| 5 | ITI Mid Cap Fund | ITI Small Cap Fund |
| 6 | JM Mid Cap Fund | Kotak Small Cap Fund |
| 7 | Kotak Emerging Equity Fund | Nippon India Small Cap Fund |
| 8 | Nippon India Growth Fund | Quant Small Cap Fund |
| 9 | Quant Mid Cap Fund | Sundaram Small Cap Fund |
| 10 | Sundaram Mid Cap Fund | UTI Small Cap Fund |
| 11 | Taurus Mid Cap Fund | |
| 12 | UTI - Mid Cap Fund | |
| 13 | WhiteOak Capital Mid Cap Fund |
Table 4.
Dependent Variables for Stress Test.
| DEPENDENT VARIABLE | BINNING CATEGORIZATION |
|---|---|
| Stress Test Pro-rata liquidation after removing bottom 20% of portfolio based on scrip liquidity (considering 10% PV with 3x volumes) 50% portfolio | Stress level >=7 days = High StressStress level <7 days= Low Stress |
| Stress Test Pro-rata liquidation after removing bottom 20% of portfolio based on scrip liquidity (considering 10% PV with 3x volumes) 25% portfolio |
Table 5.
Companies excluded from February and March, 2024 datasets.
| Feb-24 | Mar-24 | Feb-24 | Mar-24 | |
|---|---|---|---|---|
| SL.NO | MidCap MUTUAL FUNDS | MidCap MUTUAL FUNDS | SmallCap MUTUAL FUNDS | SmallCap MUTUAL FUNDS |
| 1 | Canara Robeco MidCap Fund | Canara Robeco Mid Cap Fund | DSP SmallCap Fund | Baroda BNP Paribas SmallCap Fund |
| 2 | ITI MidCap Fund | WhiteOak Capital MidCap Fund | Edelweiss SmallCap Fund | Edelweiss SmallCap Fund |
| 3 | JM Midcap Fund | Mahindra Manulife SmallCap Fund | Mahindra Manulife SmallCap Fund | |
| 4 | WhiteOak Capital MidCap Fund | Motilal Oswal SmallCap Fund | Motilal Oswal SmallCap Fund | |
| 5 | PGIM India SmallCap Fund | PGIM India SmallCap Fund | ||
| 6 | Quantum SmallCap Fund | Quantum SmallCap Fund | ||
| 7 | Union SmallCap Fund |
Table 6.
Companies excluded from April and May, 2024 datasets.
| Apr-24 | May-24 | Apr-24 | May-24 | |
|---|---|---|---|---|
| SL.NO | MidCap MUTUAL FUNDS | MidCap MUTUAL FUNDS | SmallCap MUTUAL FUNDS | SmallCap MUTUAL FUNDS |
| Bandhan Midcap Fund | Baroda BNP Paribas SmallCap Fund | BANDHAN MidCap FUND | Edelweiss SmallCap Fund | |
| Canara Robeco MidCap Fund | Edelweiss SmallCap Fund | Canara Robeco MidCap Fund | ||
| JM Midcap Fund | Mahindra Manulife SmallCap Fund | JM Midcap Fund | ||
| WhiteOak Capital MidCap Fund | PGIM India SmallCap Fund | WhiteOak Capital MidCap Fund | ||
| Quantum SmallCap Fund | ||||
| Union SmallCap Fund |
Table 7.
Companies categorized based on stress levels (Feb-Mar 2024).
| 50% portfolio | 25% portfolio | |
|---|---|---|
| Companies with stress levels | Companies with stress levels | |
| MID-CAP FUNDS | Low Stress = 19 companies High Stress= 8 companies |
Low Stress = 23 companies High Stress= 4 companies |
| SMALL CAP FUNDS | Low Stress = 8 companies High Stress= 13 companies |
Low Stress = 13 companies High Stress= 8 companies |
Table 8.
Companies categorized based on stress levels (Apr 2024).
| 50% portfolio | 25% portfolio | |
|---|---|---|
| Companies with stress levels | Companies with stress levels | |
| MID-CAP FUNDS | Low Stress = 20 companies High Stress= 5 companies |
Low Stress = 22 companies High Stress= 3 companies |
| SMALL CAP FUNDS | Low Stress = 8 companies High Stress= 13 companies |
Low Stress = 13 companies High Stress= 8 companies |
Table 9.
Companies categorized based on stress levels (May 2024).
| 50% portfolio | 25% portfolio | |
|---|---|---|
| Companies with stress levels | Companies with stress levels | |
| MID-CAP FUNDS | Low Stress = 7 companies High Stress= 2 companies |
Low Stress = 8 companies High Stress= 1 companies |
| SMALLCAP FUNDS | Low Stress = 4 companies High Stress= 5 companies |
Low Stress = 6 companies High Stress= 3 companies |
Table 10.
Confusion Matrix and metrics for FFNN with one hidden layer and two nodes for pro-rata liquidation of 50% portfolio forMidCap companies in February 2024.
Table 10.
Confusion Matrix and metrics for FFNN with one hidden layer and two nodes for pro-rata liquidation of 50% portfolio forMidCap companies in February 2024.
| Accuracy | No Information Rate | Kappa | Mcnemar’s Test P-Value | Sensitivity | Specificity |
|---|---|---|---|---|---|
| 0.8 | 0.8 | 0 | 0.07364 | 0.0 | 1.0 |
Table 11.
Confusion Matrix and metrics for various FFNN models with different combination of hidden layers and nodes for pro-rata liquidation of 50% portfolio for MidCap companies in Feb, 2024.
Table 11.
Confusion Matrix and metrics for various FFNN models with different combination of hidden layers and nodes for pro-rata liquidation of 50% portfolio for MidCap companies in Feb, 2024.
| Model | Accuracy | No Information Rate | Kappa | Mcnemar’s Test P-Value | Sensitivity | Specificity |
|---|---|---|---|---|---|---|
| 1 Hidden layer with 2 nodes | 0.8 | 0.8 | 0 | 0.07364 | 0.0 | 1.0 |
| 1 Hidden layer with 3 nodes | 1.0 | 0.64 | 1 | NA | 1.0 | 1.0 |
| 2 Hidden layer with 2 nodes | 0.96 | 0.64 | 0.911 | 1.000000 | 1.0000 | 0.8889 |
| 2 Hidden layer with 3 nodes | 0.72 | 0.72 | 0 | 0.02334 | 1.0 | 0.0 |
| 2 Hidden layer with 10 nodes | 0.72 | 0.72 | 0 | 0.02334 | 1.0 | 0.0 |
| 3 Hidden layer with 10 nodes | 0.72 | 0.72 | 0 | 0.02334 | 1.0 | 0.0 |
Table 12.
Performance metrics of best NN models with for Mid-cap and Small-cap funds with pro-rata liquidation of 50% portfolio and 25% portfolio for the months of February and March 2024.
Table 12.
Performance metrics of best NN models with for Mid-cap and Small-cap funds with pro-rata liquidation of 50% portfolio and 25% portfolio for the months of February and March 2024.
| Model Building for | Best Model | Accuracy | No Information Rate | Kappa | Mcnemar’s Test P-Value | Sensit-ivity | Specif-icity |
|---|---|---|---|---|---|---|---|
| Mid-cap funds for February 2024 with Pro-rata basis liquidation of 25% portfolio | 1 Hidden layer with 2 nodes | 1.0 | 0.84 | 1 | NA | 1.0 | 1.0 |
| Mid-cap funds for March 2024 with Pro-rata basis liquidation of 50% portfolio | 1 Hidden layer with 2 nodes | 1.0 | 0.7037 | 1 | NA | 1.0 | 1.0 |
| Mid-cap funds for March 2024 with Pro-rata basis liquidation of 25% portfolio | 1 Hidden layer with 2 nodes | 1.0 | 0.8519 | 1 | NA | 1.0 | 1.0 |
| Small-cap funds for February 2024 with Pro-rata basis liquidation of 50% portfolio | 1 Hidden layer with 2 nodes | 1.0 | 0.5714 | 1 | NA | 1.0 | 1.0 |
| Small-cap funds for February 2024 with Pro-rata basis liquidation of 25% portfolio | 1 Hidden layer with 2 nodes | 1.0 | 0.619 | 1 | NA | 1.0 | 1.0 |
| Small-cap funds for March 2024 with Pro-rata basis liquidation of 50% portfolio | 1 Hidden layer with 2 nodes | 1.0 | 0.7037 | 1 | NA | 1.0 | 1.0 |
| Small-cap funds for March 2024 with Pro-rata basis liquidation of 25% portfolio | 1 Hidden layer with 2 nodes | 1.0 | 0.619 | 1 | NA | 1.0 | 1.0 |
Table 13.
Performance metrics of best NN models with for Mid-cap and Small-cap funds with pro-rata liquidation of 50% portfolio and 25% portfolio for the months of April and May 2024.
Table 13.
Performance metrics of best NN models with for Mid-cap and Small-cap funds with pro-rata liquidation of 50% portfolio and 25% portfolio for the months of April and May 2024.
| Model Building for | Best Model | Accuracy | No Information Rate | Kappa | Mcnemar’s Test P-Value | Sensit-ivity | Specif-icity |
|---|---|---|---|---|---|---|---|
| Mid-cap funds for April 2024 with Pro-rata basis liquidation of 50% portfolio | 1 Hidden layer with 2 nodes | 1.0 | 0.8 | 1 | NA | 1.0 | 1.0 |
| Mid-cap funds for April 2024 with Pro-rata basis liquidation of 25% portfolio | 2 Hidden layer with 2 nodes | 1.0 | 0.88 | 1 | NA | 1.0 | 1.0 |
| Mid-cap funds for May 2024 with Pro-rata basis liquidation of 50% portfolio | 1 Hidden layer with 2 nodes | 1.0 | 0.7037 | 1 | NA | 1.0 | 1.0 |
| Mid-cap funds for May 2024 with Pro-rata basis liquidation of 25% portfolio | 1 Hidden layer with 2 nodes | 1.0 | 0.8889 | 1 | NA | 1.0 | 1.0 |
| Small-cap funds for April 2024 with Pro-rata basis liquidation of 50% portfolio | 1 Hidden layer with 2 nodes | 1.0 | 0.619 | 1 | NA | 1.0 | 1.0 |
| Small-cap funds for April 2024 with Pro-rata basis liquidation of 25% portfolio | 1 Hidden layer with 2 nodes | 1.0 | 0.619 | 1 | NA | 1.0 | 1.0 |
| Small-cap funds for May 2024 with Pro-rata basis liquidation of 50% portfolio | 1 Hidden layer with 2 nodes | 1.0 | 0.5556 | 1 | NA | 1.0 | 1.0 |
| Small-cap funds for May 2024 with Pro-rata basis liquidation of 25% portfolio | 1 Hidden layer with 2 nodes | 1.0 | 0.6667 | 1 | NA | 1.0 | 1.0 |
Disclaimer/Publisher’s Note: The statements, opinions and data contained in all publications are solely those of the individual author(s) and contributor(s) and not of MDPI and/or the editor(s). MDPI and/or the editor(s) disclaim responsibility for any injury to people or property resulting from any ideas, methods, instructions or products referred to in the content. |
© 2024 by the authors. Licensee MDPI, Basel, Switzerland. This article is an open access article distributed under the terms and conditions of the Creative Commons Attribution (CC BY) license (http://creativecommons.org/licenses/by/4.0/).
Copyright: This open access article is published under a Creative Commons CC BY 4.0 license, which permit the free download, distribution, and reuse, provided that the author and preprint are cited in any reuse.


