
Submitted:
07 October 2024
Posted:
08 October 2024
You are already at the latest version
Abstract
This systematic review assessed the prevalence of lower back pain (LBP) in equestrian athletes (EA), using PRISMA guidelines. Observational studies published between 2004 and 2024 in English, Portuguese, Spanish, and German were included. The review identified relevant studies through EBSCO, MEDLINE, and SCOPUS (last search 30 August 2024), yielding 14 studies with a total of 4,527 participants. PEO of included studies: population comprised EA, exposure was equestrian sports (ES), and the outcome was LBP. The risk of bias was evaluated using the Observation Study Quality Evaluation tool, and six studies were deemed high-quality. LBP prevalence in EA was higher than in the general and athlete population, with point prevalence ranging from 27.9% to 87.9%. Sport-specific factors, including workload and stable duties, were significant risk factors. Methodological inconsistencies, such as varying definitions of LBP and a lack of standardized exposure assessment, and overall low quality of studies, limited the comparability of findings. This review underscores the need for more high-quality research and tailored interventions addressing both riding and off-horse activities in EA. The review was registered in PROSPERO (ID: CRD42024568577), and the study was funded by the Comprehensive Health Research Centre, Évora University.
Keywords:
Back pain
; Equestrian athlete
; Equestrian sports
; Musculoskeletal disorders
; Prevalence
; Risk factors
; Systematic review
1. Introduction
Lower back pain (LBP) is a prevalent musculoskeletal disorder affecting the general population [1], particularly athletes [2]. While regular exercise can mitigate the risk of LBP, high levels of physical activity can paradoxically increase it [3,4]. In the context of equestrian sports (ES), LBP is frequently identified as the most common musculoskeletal complaint among equestrian athletes (EA) [5], with a notably high prevalence in this population [6].
ES are unique in that they depend on the intricate interaction between horse and rider. Historically, scientific literature has primarily focused on the equine athlete, often overlooking the human athlete’s role [7]. However, recent research has begun to address this gap, emphasizing the physical demands placed on the rider. ES are characterized by long career spans, with athletes often beginning competitive riding as early as 6 years old [8] and continuing to compete at the highest levels, such as the Olympics, well into their 60s and 70s [9,10].
Given that previous episodes of LBP are a strong predictor of future occurrences [11], the potential impact of LBP on an EA’s career is concerning. This matter is particularly true considering the rider’s reliance on clear and balanced physical communication with their horse [12]—a crucial aspect of performance when dealing with a 500kg prey animal.
Over the past two decades, efforts have been made to identify the musculoskeletal complaints most affecting EA and to understand the risk factors contributing to their development. Given the distinctive nature of equestrian sports and the high prevalence of LBP among riders, it is crucial for the equestrian community to fully understand the impacts of LBP and identify potential risk factors. This knowledge is essential for developing targeted, evidence-based prevention and management strategies.
The primary aim of this systematic review is to examine the prevalence of LBP in EA and explore the associated risk factors.
The objectives of this systematic review were to determine the prevalence of LBP among EA, identify the primary risk factors contributing to LBP in this population, and distinguish factors that are not associated with an increased risk of LBP. By addressing these objectives, the review aimed to provide a comprehensive understanding of LBP within equestrian sports, guiding the development of effective prevention and management strategies to enhance the well-being and performance of EA.
2. Materials and Methods
2.1. Research Design
A detailed review of observational epidemiological studies on LBP in EA was conducted using the PRISMA statement guidelines (Preferred Reporting Items for Systematic Reviews and Meta-analysis [13]. The only significant amendment to the original protocol was the substitution of the tool used for assessing the risk of bias and quality of the included studies with a more suitable evaluation tool, ensuring a better fit for the specific study designs analyzed. Methods of the analysis and inclusion criteria were prespecified and documented in a protocol (PROSPERO database ID: CRD42024568577). The question format used for the present review is PEO: EA is the population, equestrian sports are the exposure, and LBP is the main outcome.
2.2. Types of Studies
The studies considered for this systematic review were published in English, Portuguese, Spanish (linguistic proficiency of the research team) and German (translated for the team by a native speaker and specialist in equine sciences). The review included studies published between 2004 and 2024. Eligible studies were fully published observational studies, encompassing cohort, case-control, cross-sectional, and survey-based designs, published in scientific journals.
To qualify for inclusion, studies needed to employ descriptive and analytical observational designs that provided data on the incidence of LBP in EA. Data collection was confined to primary sources, utilizing tools such as questionnaires, interviews, and physical assessments.
2.3. Types of Participants and Exposure
The review encompassed EA: individuals of any age or sex that engage in equestrian sports, defined as activities involving horseback riding at all three gaits: walk, trot, and canter. All levels of competition and practice, ranging from leisure to professional, were included. The review considered all recognized equestrian disciplines, apart from studies focusing on driving, vaulting, para-equestrian sports, rodeo, or therapeutic use of horses, due to the specific characteristics inherent to these activities.
2.4. Types of Outcome Measures
The main outcome measure of the study was the prevalence of LBP among EA, encompassing non-specific, acute, and chronic LBP (LBP characteristics like frequency, severity, and disability were also retrieved). Additionally, the research considered secondary outcomes, including exposure data and various risk factors associated with LBP in this population. No restrictions were placed on the definitions of LBP, methods of pain reporting, and verification.
2.5. Information Sources and Search
Relevant papers were identified through a comprehensive search of three electronic databases: EBSCO, MEDLINE/PUBMED and SCOPUS (last search on 30 August 2024). Additionally, other sources, such as reference lists of included studies and review articles, were searched to obtain further relevant papers.
All search strategies are summarized in Supplementary Material I—Tables S1 and S2. Keywords for the database search were defined using terms related to the population and exposure, combined with keywords related to outcomes of interest. These keywords were combined using “OR” and “AND” operators. When possible, restrictions were applied to search terms to include only titles, abstracts, and keywords.
No filters were applied to the study design to ensure all relevant studies were included for abstract screening. The study design was identified by analyzing full papers, looking for terms such as “epidemiology”, “retrospective”, “prospective”, “longitudinal”, “survey”, “questionnaire”, “cross-sectional”, “case-control”, and “cohort”.
2.6. Study Selection
To assess eligibility, two reviewers (R.S. and O.F.) with a background in equestrian sports sciences, equine sciences, health and sports sciences, and training in scientific investigation were involved in the search strategy and identification of relevant records. When discrepancies existed, they were resolved by achieving consensus. The opinion of experts in epidemiology (J.P.S.) or in the field of sports sciences (A.R.) was sought when required.
No attempt was made to rectify the reported study design. Priority was given to the design obtained from each paper title, abstract, and methods section. However, whenever it was not mentioned in the paper, the study design was defined based on the definitions given by Carlson & Morrison [14].
2.7. Data Collection Process
A data extraction form was developed to summarize the evidence and was pilot-tested on three randomly selected papers by one reviewer (C.R.D.). The data extraction was then verified by a second reviewer (O.F.), with any disagreements resolved through discussion. This approach enhanced the quality of data extraction and helped identify additional items to be collected. To ensure consistency and comprehensiveness, all reported characteristics of each study were considered during data extraction, even when matched with other papers.
2.8. Assessment of Methodological Quality and Risk Bias
The quality and risk of bias—and reporting bias—of the studies were assessed using the Observation Study Quality Evaluation (OSQE) tool [15], which has distinct versions for cohort, case-control, and cross-sectional studies, each with its own scoring system. The OSQE cross-sectional version is a subset of items from the OSQE cohort version. Specifically, the OSQE cohort and case-control versions include 14 mandatory items and 2 optional items, while the OSQE cross-sectional version comprises 7 mandatory items and 3 optional items. Higher scores indicate better study quality. Two authors (C.D. and J.P.S.) independently conducted the quality assessments of the selected studies, and consensus on the scores was achieved through meetings. A cut-off of 65% was selected, as previously reported [1,6], with studies scoring above this threshold considered to be of high quality.
For prevalence studies, the Critical Appraisal Checklist for Prevalence Studies [16] was used to assess the methodological quality and to determine the extent to which a study has addressed the possibility of bias in its design, conduct and analysis. To assess the quality of the studies, the same cut-off value of 65% was used. High-quality studies are those that get a score over 65%, low-quality studies score under 65%, and any study receiving a ‘no’ in any item, was not considered as a prevalence study and was excluded from the population prevalence analysis and was only be considered for study-specific prevalence.
2.9. Data Items and Analysis
When a paper lacked complete information, no assumptions were made. If supplementary material was provided this information was also analyzed. The review team did not contact authors for confirmation or additional details. The primary focus was on reporting data directly available to readers. Eligible papers were coded for data extraction. The collected data items, summarized in Supplementary Materials I—Table S3, include details on (i) study characteristics, (ii) data collection, (iii) sample details, (iv) pain details, and (v) risk factors.
Microsoft Excel [17] spreadsheets were used to organize data and for basic calculations: sums, means and proportions. SCALEX SP [18] calculator and Epitools [19] were used to calculate sample sizes and confidence limits for sample proportions, with the level of confidence set at 95%; these calculations were done for studies that did not provide such information.
3. Results
3.1. Study Selection
A total of fourteen papers were identified for inclusion in the review. Figure 1 presents detailed information of the study selection process. The search of the electronic databases provided a total of 284 citations. After duplication removal and language restriction, the final number of citations was 165. Of these, 75 were eliminated after screening the title, abstract, and keywords. 90 full-text papers were examined for final confirmation of eligibility criteria. Bibliographic references of relevant papers identified no additional studies. In total, 77 studies did not meet the inclusion criteria.
3.2. Characteristics of Included Studies
Over the past 20 years, there has been a significant increase in the number of published observational epidemiological studies on LBP in EA (Supplementary Material II—Figure S1). The design details of these studies and outcomes are summarized in Tables S4 and S5 in Supplementary Material II. Notably, 89.3% of the study samples originated in Europe, with a wide range of sport levels and competition statuses. However, all but one study [20] failed to clearly define rider status/ skill level. A diverse array of equestrian disciplines was represented, with only four studies [21,22,23,24] focusing on a single discipline (Table S6 Supplementary Material II). Across the 14 included studies, the total number of participants was 4527 (range: 19–2185). Questionnaires were the predominant data collection method (N=14), with recall periods ranging from point to lifetime. Tables S6, S7 and S8 in Supplementary Material II provide detailed summaries of the data collection tools, procedures, recall periods, sample sizes, and participant demographics.
3.3. Methodological Quality
The methodological quality assessment of 14 studies is available in Supplementary Material II Table S9. All studies were evaluated using the OSQE spreadsheet for cross-sectional studies, as it was the most appropriate for all study designs, despite two studies being reported as cohort [28,29] and one as case-control [20]. Only six studies achieved a score above 65%, indicating high quality (Supplementary Material II Table S10). Common deficiencies across the studies included the representativeness of the sample (21.4%), assessment of the independent variable (21.4%), declaration of conflict of interest (50%), control for confounders (57.1%), reporting of results following a protocol (100%), reporting on missing data (7.1%), analysis of effect modifiers (21.4%) and calculation of sample size (85.7%). Notably, all studies received full scores for reporting. Recall periods for pain, back pain (BP) and/ LBP were only clearly stated and/or understandable in seven studies [20,26,27,28,29,30].
The results of the Critical Appraisal Checklist for Prevalence Studies [16] can be found in Supplementary Material II Table S11. Two studies were excluded as prevalence studies; the Lewis and Baldwin [21] study did not have an adequate sample size for precise results, and Lewis and Kennerley [22] did not have an appropriate sample to represent the target population. Of the remaining seven studies, three [26,27,33] were evaluated as high-quality prevalence studies and the remaining four [23,24,25,26,27,28,29,30,31,32,33,34,35] as low-quality prevalence studies. Sample sizes and confidence limits for sample proportions of prevalence studies can be found in Supplementary Material II Table S12.
3.4. Demographic and Anthropometric Characteristics of the Sample
Most of the samples were dominated by female athletes (77% female average among all papers), except for 4 papers [21,26,28,32] (56.2% average) where the female and male samples were very even and one paper with an all-female sample [22]. In most of the studies, apart from two regarding child EA (CEA) [28,29] (mean age 14.5 years), and one that included populations of all ages [33] (mean age 33.6 years), the sample included adult EA ranging from 18 to over 70 years of age. Seven papers did not report on height, weight, and BMI of EA [20,21,22,23,30,31,33]. Two papers reported on height [27,32], weight [27,32] and BMI [32] of female and male EA. Four papers reported on average height, weight, and BMI of all participants [24,26,28,29]. Kraft et al. [25] only presented data on average weight and BMI with a cut-off value. Cejudo et al. [28,29] presented in both papers the body fat percentage (BF%) average value for female and male athletes.
3.5. Equestrian Sports
3.5.1. Discipline
There are six different equestrian disciplines (ED) recognized by the FEI, and at least 50 more recognized nationally and/or internationally by different Federations. The three Olympic ED are Dressage, Show Jumping and Eventing. The heterogeneity of ED is visible in the selection of papers in this review, as is shown in Figure 2. The ED most represented in the papers and by the number of participants is Dressage, followed by Show Jumping and Eventing (Table 1). It is important to note that in some studies, participants could report practicing more than one discipline at a time.
3.5.2. Level of Sport
Comparing the level of sport was hindered by inconsistent classification systems across the studies. Some studies categorized riders by status without providing clear definitions, while others used competition levels or simply defined athletes as competitive or non-competitive, as shown in Table 2.
3.5.3. Sport Practice
Measuring exposure to sports practice is crucial in these studies. For injuries, risk factors, or pain, exposure is generally quantified by the duration during which athletes are at risk. Understanding this workload, including the number of years spent riding and the time spent riding per week or per day, is of utmost importance. All studies, apart from three [21,22,23], had information on the time of equestrian sport practice (in years). One of the studies that did not provide data on years spent riding provided a statistical analysis with this variable [23]. Only eight of the studies [20,25,26,27,28,29,30,33] had data on equestrian sports practice weekly or daily.
3.5.4. Equestrian Related Activities
Of all fourteen papers included in this review, nine [20,24,27,28,29,30,32,33] did not provide any information on daily practices in the yard and equestrian sports secondary activities (mucking out, stable yard chores, and other activities inherent with keeping horses). Three [22,23,25] mentioned in the description of the questionnaire asking if participants needed to perform other intensive activities associated with keeping horses and what factors contributed to increased levels of pain (e.g., yard work), but did not present any data or analysis for this variable.
3.6. Other Sporting Activities
Four studies [26,27,30,31] collected information regarding practices in other sporting activities and reported that 79% [31], 91% [30] and 55.9 % [26] exercised or practiced other sports, and 35% [27] had a physical training program for EA. In two studies, 34.2% of equestrians [31] and 25% of competitive showjumpers [23] used an exercise program to manage/ treat pain felt.
3.7. Anatomic Location and Nature of Injury
Pilato et al. [30] wrote a paper about injury history in collegiate EA. They reported different types of injuries (fracture, pain/arthritis, sprain, disk injury and others), and injuries to the spine (40.96% in the lumbar, 34.94% in the thoracic). 6.85% of the participants suffered a fracture to the lumbar spine. Kraft et al. [25] used MRI of the lumbar spine to look for possible disk degeneration. All remaining studies [20,21,22,23,24,25,26,27,28,29,30,31,32,33] focused on pain in different bodily locations (Figure 3).
In a study about Eventing riders [21], 96% of the participants reported competing with pain. Ferrante et al. [27] also reported some different musculoskeletal disorders [scoliosis, fractures, and others]. 57% of the riders who experienced pain in Lewis & Kennerly’s [22] study felt that pain was not associated with an old injury resulting from a fall. Three studies reported on chronic pain [22,23,31] and chronic LBP (CLBP) [27], with an incidence of 83% [31], 62% [22], 67% [23] and 23.9 % [27].
3.8. Tools and Methods for Measurement of LBP
Tools and methods used to measure LBP (frequency, location, severity, and disability) are represented in Figure 4. The SF-MPQ is a tool used to measure the intensity of pain; it includes the present pain intensity (PPI) index and the VAS. The ODI is used to measure disability and quality of life impairment for adults with LBP. NMQ is used to compare low back, neck, shoulder and general complaints, especially musculoskeletal complaints, in epidemiological studies. NRS and VAS are used to measure pain intensity. PSEQ is used for people with chronic pain to rate self-efficacy beliefs. The RMDQ is used to evaluate LBP-related disability.
3.9. Lower Back Pain
Figure 5 shows LBP prevalence within sample populations with different recall periods, and Figure 6 shows the LBP prevalence in equestrians—with confidence limits.
Four studies measured LBP prevalence with a one-year recall period ranging from 61.7% to 74.3% in prevalence studies and 30.95% to 74.3% when considering all studies. Seven studies measured LBP point prevalence; it ranged from 27.9% to 87.9% in all studies. Ferrante et al. [27] also measured LBP prevalence with a recall period of a lifetime (91.6%), 6-months (64.8%), one month (46.2%) and CLBP (23.9%) defined as LBP that which was present for most days in the last three months. The point prevalence within the study population of LBP in the two studies was 51.6% [21] and 56% [22].
Of all studies, only four provided a definition for LBP. Duarte et al. [26] defined LBP as pain, discomfort, or numbness in the lower back area. Ferrante et al. [27] defined LBP as pain and discomfort localized below the costal margin and above the inferior gluteal folds, with or without referred leg pain. Cejudo et al. [28,29] gave the same definition for LBP in both studies, as pain in the lower back that lasted for more than one week or missed training due to LBP in the previous 12 months. The period of 1 week for LBP was chosen to exclude muscle soreness. Pilato et al. [30] reported the number of episodes: 15.07% of the collegiate EA had one episode, 2.74% complained of 2 episodes, and 15.07% had more than 2 episodes of pain/ arthritis in the lumbar spine. Hobbs et al. [24] categorized participants with lumbar pain by posture type, and the most frequent posture types of participants with LBP were normal, kyphotic/lordotic and swayback. In Kraft et al. [25], the study EA had a significantly higher intensity of LBP than controls; the prevalence of LBP in the control group was 33%.
3.10. Duration and Frequency of Symptoms
Only five studies published information on the duration and/or frequency of symptoms. 54% of the participants in the Lewis et al. study [31] experienced pain (regardless of location and intensity) for over 6 years. A study on LBP in Italian EA [27] reported that participants who experienced LBP during their lifetime had an average of 15 episodes, and participants with LBP in the last year had an average of 5 episodes. The average length of episodes (regardless of time prevalence) was 3 days. Pilato et al. [30] divided injury frequency into one, two, or more than two episodes and presented data on spine and pelvis injury frequency; the type of injury with a higher number of responses of 2 or more episodes was pain/ arthritis located in the thoracic spine, followed by lumbar spine and cervical spine. The median LBP duration in a study of competitive show jumpers [23] was 2 to 3 years. Kraft et al. [33] reported data on the frequency of participants’ BP: 59.3% had BP occasionally, 25.2% daily, and 15.6% never had BP.
3.11. Consequences of Pain
The main consequence of pain [21,22,23,31], LBP [26] and CLBP [27] is limitation in performance whilst riding 72.7% [27,31], 85% [23], 63.1% [26] or competing 55% [21], 59% [22]. Lewis & Kennerly [22] found a statistically significant association between those experiencing pain and the perceptions of pain negatively affecting performance. The rider’s perception of how pain affects performance is reported in four studies [21,22,23,31]. Common effects felt by EA are postural asymmetry, limited and reduced ROM, irritability, earlier onset of fatigue, lack of concentration and anxiety. A study about Italian EA found that CLBP was associated with time loss in the sport (p<0.001), medication consumption (p<0.001) and restriction in participation (p<0.001). Hobbs et al. [24] stated that pain avoidance during riding could increase the prevalence of postural defects and muscle imbalances in higher-level riders. Furthermore, Cejudo et al. [28] results suggest that LBP impacts trunk proprioception and stability in CEA.
3.11.1. Levels of Pain, Severity, and Levels of Disability
Eight studies reported on the level of pain experienced by the participants based on results of the VAS [20,21,23,25,31,33], NRS [27] and ODI [32] (question one of the ODI questionnaire). Levels of pain experienced are represented in Figure 7. Most equestrians in these studies felt mild and moderate levels of pain in general, as well as LBP and mild BP. Kraft et al. [25] found significant differences in the intensity of LBP between riders and controls. Deckers et al. [20] and Ferrante et al. [27] pain intensity levels are for all athletes with pain in all recall periods—lifetime, one-year, one month, chronic—the remaining papers measured pain levels in present LBP.
Five studies measured disability caused by BP [20], LBP [25,26,27,32] and CLBP [27]. 26.4% of the respondents in the Ferrante et al. [27] survey had a disability in daily living activities, and athletes with CLBP had higher values of disability than those with LBP. These authors did not find any correlations between the severity of pain and self-efficacy in participants with LBP. Levels of disability ranged from no disability [20,25,32], minimal disability [20,25,32] and moderate disability [32]. Duarte et al. [26] used a cut-off value to determine functionality or dysfunctionality in RMDQ results. Of the participants with LBP, 49.5% had dysfunctionality; nevertheless, the RMDS mean score was 5.39—higher than the cut-off value of ≥ 4 for dysfunctionality. Two [23,31] studies mentioned in their methodology using the ODI to measure the impact of pain on equestrians’ general life and well-being, but the results of the ODI could not be found by the review team.
3.11.2. Time Loss
In Lewis et al.’s [31] survey, a total of 42% of participants reported that pain or injury had stopped them from riding at some point in life. Time off riding due to pain ranged from a few days to 15 years and even prevented some from returning to riding permanently. Another survey [27] concluded that 28.5 % of EA with LBP or CLBP had suspended sporting activities and that athletes with CLBP suspended sporting activities more frequently. In a study on competitive showjumpers [23], 15% reported that pain had prevented them from riding; time off ranged from one day periodically to one year.
3.11.3. Pain Management Techniques
The pain management techniques reported in studies were medication, consultation with a physician and various types of therapies (e.g., physical therapy, therapy, osteopathy, massage). Equestrians with pain who used medication were 75% [31], 96% [21], and 37.2% [27]. EA that used over-the-counter medication were 51.1% [31], 93% [21], 67% [23] and 51.4% [22]. EA using medication with medical prescription were 23.9% [31], 3% [21], 9% [23] and 16.2% [22]. In a study on collegiate EA, 16.44% regularly used pain medication. Of the equestrians who had pain and sought treatment to help manage it, 33% [32], 36.7% [27] and 49.6% [33] had visited a physician. The most common therapies used by equestrians with pain were physical therapy: 47.7% [31], 38.5% [32], 61.69% [27], 19% [21], 47% [23] and 18.9% [22] and massage 12% [32] and 29% [23].
3.12. Risk Factors, Associations and Contributing Factors for LBP
Tables S13, S14, S15, and S16 (Supplementary Material III) report data on risk factors, associations, and contributing factors for pain, BP, and LBP. Variables with statistically significant associations were classified as “risk factors”, those without significant associations were classified as “not risk factors”, while those without significant statistical analysis were considered “contributing factors” or “not contributing factors”. The data is categorized into population characteristics (Tables S13 and S15) and exposure characteristics (Tables S14 and S16). Due to the variability in data analysis, population characteristics and reporting methods, it was not possible to combine findings for most variables.
Two studies [26,27] found that sex was not a risk factor for the one-year prevalence of LBP [26], LBP incidence over a lifetime or one-year period [27], CLBP incidence [27], or LBP-related disability and functionality issues [26]. However, Puszczałowska-Lizis et al. [32] reported that women had a higher risk of experiencing pain in the lumbar back pain compared to men. Regarding anthropometric characteristics, height [27,28,29], weight [27,28,29], and BMI [25,26,27,28,29] were not identified as risk or contributing factors for one-year LBP incidence [26,27,28,29], CLBP [27], dysfunctionality due to LBP [26], or disc degeneration disease [25]. However, Duarte et al. [26] observed that higher BMI scores were significantly correlated with increased disability scores. Ferrante et al. [27] identified weight as a substantial risk factor for lifetime LBP prevalence. Only two studies investigated BF% and yielded opposing conclusions despite having similar populations and methodologies. One study found no correlation between BF% and LBP [29], while the other identified BF% as a prominent risk factor for LBP in CEA, with a cutoff value of BF% > 23% [28]. Two high-quality studies provided somewhat contradictory results concerning age as a risk factor. Ferrante et al. [27] found that younger age was a risk factor for LBP with both lifetime and one-year incidence. In contrast, Duarte et al. [26] found that older age was a risk factor for LBP-related dysfunctionality. No significant associations were found between age and CLBP [27], disability scores [26], LBP in CEA [28,29], or one-year LBP incidence [26]. Kraft et al. [25], using MRI imaging, concluded that incipient disc degeneration was not a risk factor for LBP point prevalence and found no relationship between trunk/leg-length coefficient and disc degeneration disease. Engaging in sports other than equestrian activities did not pose a risk factor for lifetime [27] or one-year [26,27] LBP incidence, nor for LBP-related disability [26]. Two studies on CEA populations [28,29], which had similar characteristics, found significant asymmetries in range of motion (ROM) (HAD-HF, HF-KF) [28], (HAB-HF) [29], (HE, HAB, HIR) [28,29] (more information in Table S13, Supplementary Material IV] and trunk muscle endurance (ISBE)[28] between dominant and non-dominant limbs in all participants, regardless of LBP incidence. Nonetheless, these studies determined that higher values in ROM (HTR) [28], lower values in ROM (HAD-HF, KF) [29], and lower trunk muscle endurance (ISBE, ISBE_ND) [28] were risk factors for LBP incidence, with cutoff values of HAD-HF ≤ 26º, KF ≤ 128º, and ISBE ≤ 65s.
Practicing equestrian sports professionally, rather than as a hobby, was identified as a strong risk factor for LBP incidence, disability, and dysfunctionality caused by LBP [26]. Additionally, 43% of the equestrian population [26] considered riding a contributing factor to the intensity of pain experienced. In contrast, Kraft et al. [25] found that being an equestrian athlete did not pose a risk for T2-weighted signal alterations of the lumbar spine (disc degeneration), and Duarte et al. [26] did not find a significant correlation between LBP prevalence and the level of equestrian sports practiced, whether professionally or as a hobby. Equestrian discipline was not a risk or contributing factor for LBP prevalence [26], intensity, disability, disc degeneration disease [25], or CLBP incidence [27]. However, Kraft et al. [25] noted that practicing dressage might contribute to T2-weighted signal alterations in the lumbar spine. Ferrante et al. [27] found a significant relationship between equestrian discipline and lifetime LBP prevalence, but this result should be interpreted cautiously due to the small sample sizes in some disciplines and discipline characteristics. No correlations were found between the level of riding (as indicated by sport license) and LBP or CLBP incidence [27].
Workload was a significant risk factor for LBP [26] and CLBP [27] incidence when it reached 5 to 6 hours/week [27], exceeded 7 hours/week [26], or surpassed 13 hours/week [27]. Other studies did not find correlations between workload and point [25], lifetime [27] or one-year LBP incidence [27,28,29], LBP intensity [25], or LBP-related disability [26]. The duration of equestrian sports practice (in years) was not identified as a risk or contributing factor for LBP incidence [26,27], or LBP-related disability [26].
One high-quality study found that performing stable duties was a major risk factor for LBP incidence, though it did not affect functionality [26]. Specifically, stable duties like mucking out appeared to be contributing factors to higher disability scores and LBP intensity. Grooming activities and lunging horses also contributed to LBP intensity in 27% and 26% of equestrians [26].
4. Discussion
Equestrian sports science is a growing field that frequently relies on experiential learning and tradition rather than focusing on scientific knowledge [7]. Additionally, the field has mainly concentrated on the horse, with significant attention to the rider developing only in the past two decades [7]. In 2021, a research team published a systematic review on Olympic sport research that supports this statement. Out of 50 Olympic sports, equestrian sports rank among those with the fewest publications and citations, with only eight other sports having a lower rate than Equestrianism [35]. This paper also shows that Equestrianism is one of the 14 sports with the biggest gap between the date of its Olympic debut (1900) [36] and the date of the first scientific publication (around 1986) [35]. Physiology and injuries account for around 75% of the research topics in equestrian sports; the remaining topics, performance, training and testing, biomechanics, and psychology, account for 25% of the research [35]. The limited research in equestrian sports was also felt by the research team of the present review, with only 14 studies included. A search on the EBSCO database showed that the number of publications regarding equestrians has increased about 150% in the last 20 years, when compared with the 100 years before, suggesting growing awareness and interest in this area of research. However, in the present review, 8 studies (47%) were of low quality, which could impact the reliability of the findings. The assessment of methodological quality helps ensure transparency in evidence synthesis and strengthens the certainty of the review’s findings. The primary purpose of assessing methodological quality is to identify potential risks of bias, which may arise from poor reporting and various design features that are influenced by the research question [37].
ES are one of the few sports where women and men compete against each other regardless of sex, and at the Olympic level, it is the only entirely mixed sport [38]. Historically, the world of equestrian sports was masculine, but a change began in 1952 when the Olympic Games opened classes for women [39]. The sample of equestrians in the present review was mainly female (77%), which could lead to the belief that more women practice ES than men. The sex distribution could vary depending on the country, equestrian discipline, and competition level. For example, when at a leisure level, women are dominant; however, at an Olympic level, mostly men appear [38]. The sample in the present review is very dispersed in these characteristics; apart from skill level, the sample in the highest skill levels is smaller than what could explain these results. Another unique characteristic of ES is the fact that EA often have notably long careers, with children beginning highly competitive pony divisions as early as ages 5 and 6 [8] and riders competing at the Olympic level well into their 60s and 70s [40]. As a result, equestrianism is classified as an “early start-late specialization” sport according to the Long-Term Athlete Development model [12]. The overall sample of the present review covers this considerable age distribution. Nevertheless the distribution of under-age equestrians is underrepresented. There are around 58 equestrian disciplines [41] recognized by different national or international federations across the globe. The Fédération Équestre Internationale [FEI] recognizes 7 of these [42], and only 3 (Dressage, Showjumping and Eventing) reach the Olympic level of competition [43] and one in the Paralympic [44]. In the present review, the majority of the sample practices one of the Olympic equestrian disciplines. The distribution of people practicing different equestrian disciplines worldwide is yet to be studied. There are 136 National federations affiliated with the FEI [45], and in 2021, 78.7% of athletes were registered in Showjumping, Dressage and Eventing [46]. This figure suggests that these are the prominent disciplines in the equestrian world. Furthermore, equestrians frequently ride more than one horse and compete in more than one discipline at all skill levels—in a study about elite equestrian riders, 38% had competed successfully at an Olympic level in more than one discipline [47]. These characteristics (sex, age, and discipline) of the review sample listed above should be accounted for in the interpretation of the review results.
In the present review, some data and variables were hard to compare because of the lack of definition and methodological heterogeneity. Firstly, rider status and skill level; this variable does not solely rely on competition level or affiliation status within an equestrian federation. Williams and Tabor [48] proposed a detailed taxonomy of rider status categories for equestrian sports, with clear definitions including variables such as hours of sport, competition level and proficiency level. Using definitions like the ones suggested by Williams and Tabor [48], or clearly defining the sample regarding the variables mentioned above could help categorize rider’s skill level in the future. Alternatively, authors should clarify the EA’s affiliation status, as it may vary depending on the specific federation. Competition level should also be defined according to discipline, national federation, or international federation levels (e.g., a Showjumping rider can be competing at a national level in 0.90 meters or 1.40 meters; merely stating “competitive rider national level” does not fully explain the level of competition). In the present review the categorization of skill level and competition level was not possible due to many factors, such as the lack of definitions, explanations of status used and use of heterogenic samples, and subsequent lack of stratification in the results.
The correct assessment of exposure is fundamental to quantify injury and illness risk in sports [49]. The selection of exposure measures is largely determined by sport-specific and contextual factors, along with the types of health problems being investigated [49]. Different types of training should, if possible, be recorded and reported separately [49], especially in ES, where the training routines of horse-rider combinations tend to be holistic with only a smaller portion of discipline-specific training sessions. For injuries, exposure is typically quantified as the time athletes are at risk of injury [49] (e.g., hours riding per day or per week, number of horses ridden, type of horse ridden—e.g., young horse or schoolmaster). Furthermore, other exposure variables characteristic of equestrianism should be taken into consideration, such as grooming activities and stable management tasks (e.g., mucking out or feeding), as most riders perform them regularly. No standardized tools specific to equestrian sports exist. The development of such tools is of utmost importance for the advancement of the Equestrian sciences field.
The prevalence of LBP in equestrians is higher than in the general population [1] across all recall periods—lifetime, one-year, and point. The lifetime prevalence of LBP in EA was measured in only one high-quality study [27], which is higher than the pooled prevalence for athletes [2,6]. One-year LBP prevalence in equestrians, reported by all prevalence studies, is higher than the pooled one-year prevalence in athletes [2,6], yet lower than the prevalence range for horse-riding athletes reported by Wilson et al. [6]. Regarding point prevalence of LBP in equestrians, based on both high- and low-quality studies, it is generally higher than the pooled point prevalence in athletes [2,6], except for one low-quality study [24] where the point prevalence is lower than the pooled values in athletes [6]. Given this, although the prevalence of LBP is high in athlete populations—particularly since athletes are less likely to have comorbidities compared to the general population [6]—it generally appears to be even higher among equestrians. Similarly, this pertains to CLBP prevalence being higher in EA [27] in comparison to the general population [1] with different physical activity levels—low, moderate, and high [50]. Additionally, incidence could not be established since studies did not report a minimum symptom period or whether LBP episodes were recurrent or not. In the present review, 57.1% of the studies—high and low-quality—used validated tools or at least clear definitions to identify LBP. Furthermore, as only 28.6% of the studies provided a definition of LBP, attention must be given to the definition of BP since variations in definitions can result in different prevalence estimates [2]. Wilson et al. [6] highlighted an urgency to create a definition of LBP for athletes—for use in research. Additionally, in the present review, the team noted that the terms BP and LBP were used interchangeably at times. The same was noted in other reviews [6].
It has been determined that a prominent risk factor for LBP is a previous LBP episode [6], that is, a history of LBP. The present review’s findings cannot support this conclusion; only 35.7% of studies published data on the duration or frequency of symptoms, and this variable was not comparable due to methodological heterogeneity. The reported levels of pain in equestrians ranged from none to severe, yet most pain was mild and moderate, a finding in line with adolescent athletes [51], elite athletes [52,53] and non-athletes [52] population with LBP. Research has proven that intensity and disability caused by LBP are correlated [54]. The most common levels of disability caused by LBP in equestrians were no disability and minimal disability, which seems to be similar in the athlete population [53]. On the other hand, EA [26] seem to be more prone to dysfunctionality than elite athletes [53]. The disability results could be lower than expected due to the lack of sensitivity of the tools used in the assessment of disability in athletes—in their sports and exercise activities [55]—athletes could have limitations to their athletic performance and yet have little or no disability in their daily activities [53]. A systematic review of instruments used to assess BP in athletes [56] published in 2023 suggested that future research on BP in athletes should use the Athlete Disability Index [53].
The results of the present review show that more equestrians tend to use medication to manage pain than other non-pharmacological therapies. Pain is commonly self-managed by athletes using over-the-counter pain medications or supplements, suggesting that information specifically aimed at athletes on the safe and efficacious use of pain medications is necessary [57]. Managing pain in elite athletes must balance the tension between ignoring or masking pain and recognizing its protective role in the presence of injury [57]. The mission of the World Anti-Doping Agency is to promote clean sport, and to support this goal, understanding the prevalence of LBP among equestrians is crucial. This knowledge can help evaluate treatment strategies to ensure that EA have access to therapists and other pain management methods, reducing the reliance on self-medication [22].
Living, training, and competing in pain can carry significant consequences. Most EA in pain—general, in the back or in the lower back—feel limitations in their performance riding and competing. Literature has shown that LBP and BP reduce athletic performance in training and competition [58,59,60,61]. Moreover, performance is not limited to sports. A study characterizing injuries suffered by mounted and non-mounted police officers [62] concluded that the most common injuries in mounted police officers were to the lower back and musculoskeletal in nature. Given their responsibility to protect the public, a decline in police officers’ performance could lead to serious injury or even death for themselves, their fellow officers, or members of the community they serve [Orr et al. 2017 & Simas et al. 2022 cited in [62]]. Other consequences of LBP are effects on participation [6]—in training and competition, high costs of treatment, decreased quality of life [61] and functional impairment [6]. Furthermore, it is known that asymmetry has an impact on equestrian performance [12]. Significant asymmetries of ROM and ISBE have been detected in EA [28], and pain avoidance in riding can increase the prevalence of asymmetry [24]. Further research focusing on LBP and asymmetry in EA is needed to help understand if asymmetry is a consequence of pain or if pain is a consequence of underlying asymmetries. A systematic review and meta-analysis on postural asymmetries and LBP concluded that lumbopelvic mechanisms may be altered in individuals with LBP, yet no definitive conclusions could be drawn [63].
As in the present review, results regarding the risk anthropometric parameters pose to LBP tend to be inconsistent and inconclusive, especially in the athletic population. In the general population, LBP can be experienced at any age, but prevalence and incidence are higher in older individuals [64]. However, Shiri et al. [65] found that LBP slightly declined with increasing age, while lumbar radicular pain increased with age. In sports, the evidence was insufficient and inconsistent, making it impossible to establish any associations between age and LBP [2,6,66]. The same seems to be true for sex. In the general population, LBP and lumbar radicular pain affect more women [64,65], yet in sports, evidence is inconsistent [2,6,66]. In the present review, there is strong evidence indicating that height is not a risk factor for LBP in the general population [65] and athletes [66]. Weight, BMI, and BF% seem to be consistent risk factors for LBP across the literature [6,65,66,67]. In EA, there was inconsistent evidence to demonstrate an increased risk. Other associations, such as the practice of other sporting activities (differing from the main sport) and disc degeneration in athletes and EA were also inconsistent [6,66,68]. Altered lumbar ROM—flexion and extension—have been considered strong risk factors for LBP [66]. In the present review, altered ROM have been considered predictive factors for LBP in CEA, yet it is not possible to compare these findings due to assessment heterogeneity.
Considering all this information, it can be assumed that the higher prevalence of LBP in equestrians is more closely related to sport-specific variables than to the anthropometric characteristics of the riders. In the present work, there is strong evidence that the type of equestrian discipline does not significantly impact LBP. While disciplines differ in nature and biomechanical demands on both horse and rider, the daily work of the equine and equestrian athlete is similar across them. Training sessions often overlap, sharing common characteristics, and the widely accepted correct rider position remains consistent across all disciplines, varying only with specific training or tasks. Competition level, skill level, years of sport and workload are exposure variables that correlate—an athlete at a higher skill and competition level naturally has more experience coming from more years and a higher workload in the sport. Although there is strong evidence that years of exposure to sport and high volume of training are risk factors for LBP prevalence [6], other authors could not find evidence for these associations [2,66]. This inconsistency is also reflected in the present review, where findings for these variables—competition level, skill level, years of sport and workload—were inconsistent. However, this may be attributed to poor assessment stemming from the lack of standardized tools for measuring exposure in equestrian sports. Future research on EA should focus on developing and validating survey tools specifically designed for this population.
Horse-riding is one of the sports with the highest prevalence of LBP in elite athletes [6], implying that the functional characteristics of equestrian sports may be a key factor in the high prevalence of LBP. Horse riding appears to generate whole-body vibrations [69], which in turn increases the risk of LBP [70]. Moreover, the present review indicated that activities related to the maintenance and management of the equine partner appear to increase the risk of LBP. Literature has found that bent and twisted back positions—common in some of these activities—create harmful stress loads [71] and increase the risk of musculoskeletal problems [72]. Additionally, heavy workloads, repeated lifting, and the accumulation of stress from flexed, rotated, and awkward lumbar spine positions were identified as moderate to strong risk factors for LBP [73]. Future research should make a concerted effort to include, rather than overlook, the off-horse workloads inherent in equestrian sports.
No definitive risk factors for LBP in EA have been identified yet, highlighting the need for further scientific research on this topic. To advance our understanding, it is crucial to focus on the following areas:
- Study Quality: Conducting higher-quality studies is essential to provide more substantial evidence regarding which variables pose risk factors for LBP and which do not.
- Research Tools: There is a pressing need to develop standardized questionnaires that address key questions, enabling researchers to better understand the prevalence of LBP in EA and the factors contributing to its existence.
Improving these aspects will help clarify the underlying causes of LBP in this population and inform more effective prevention and treatment strategies.
5. Limitations
This systematic review has several limitations that should be acknowledged. First, the review process was not blinded, which could introduce bias, as reviewers were aware of study authors and affiliations. This issue is particularly pertinent given that one of the included studies shares the same main author as this review. To minimize potential bias, the quality assessment for all studies, including this one, was also conducted by a reviewer not involved with the article in question. Another limitation lies in the tools used to assess study quality and prevalence, which were originally developed for medical and health studies. These tools may lack the sensitivity required to accurately evaluate research specific to athlete populations, potentially affecting the reliability of the quality assessments. Additionally, the interchangeable use of the terms “back pain” and “lower back pain” in some studies complicates data interpretation, as these terms were sometimes conflated. During the full-text screening and data extraction, judgments had to be made regarding whether the studies specifically addressed LBP, introducing a degree of subjectivity. Furthermore, there was a challenge with the definition of “point prevalence,” as several studies did not clearly report the specific time window in which athletes were asked about their pain. In many instances, the review team had to infer that the reported prevalence referred to point prevalence based on the context, but this was not explicitly stated. This assumption may have led to inconsistencies in the reported prevalence estimates. Lastly, the review was limited to peer-reviewed articles, excluding other sources like abstracts, reports, and theses. Despite these limitations, the review provides valuable insights into the prevalence of LBP in EA and highlights the necessity for further, more precise research in this area.
6. Conclusions
This systematic review underscores the heightened prevalence of LBP among equestrian athletes compared to the general population and other athletic groups. While some evidence points to sport-specific factors—such as the physical demands of riding and associated tasks—as potential contributors to this increased prevalence, definitive risk factors remain elusive due to methodological inconsistencies and a lack of standardized assessment tools. The findings highlight the need for higher-quality research focused on the unique characteristics of equestrian sports. Future studies should prioritize the development and validation of specific tools to better assess risk factors for LBP in this population, ensuring that equestrian athletes receive tailored interventions that address both their on- and off-horse activities. By improving research quality and focusing on sport-specific variables, the equestrian community can better understand and mitigate the risks of LBP, ultimately enhancing athlete well-being and performance.
Supplementary Materials
The following supporting information can be downloaded at the website of this paper posted on Preprints.org, Supplementary materials I—Table S1: Search strategy performed in all databases, number of articles found in each search; Table S2: Key words selected regarding population & exposure, and outcome of interest; Table S3: Summary of data items collected from included studies; Table S4: Study design features (n=14); Table S5: Study outcomes (n=14); Table S6: Sample details of included studies; Table S7: Data collection tools, dissemination procedure and sample size with details; Table S8: Detailed data collection tools of included studies; Figure S1: Number of publications per period. Supplementary materials II—Table S9: Detailed information of OSQE tool—cross-sectional studies, with comments and explanation; Table S10: Quality score of all included studies and quality taxonomy; Table S11: JBI critical appraisal checklist for included studies reporting prevalence data; Table S12: Confidence intervals of LBP prevalence. Supplementary materials III—Table S13: Population characteristics (demographic and anthropometric) that do not pose a risk or do not contribute to pain; Table S14: Exposure characteristics (related with Equestrianism) that do not pose a risk or do not contribute to pain; Table S15: Population characteristics (demographic and anthropometric) that pose a risk or contribute to pain. Table S16: Exposure characteristics (related with Equestrianism) that pose a risk or contribute to pain.
Author Contributions
Conceptualization, C.D. A.R. and J.P.S.; literature search and study selection, R.S. and O.F.; data extraction, C.D. and O.F.; data analysis and interpretation, C.D., R.S. and J.P.S.; writing—original draft preparation, C.D.; writing—review and editing, C.D. and A.R.; supervision, A.R., J.P.S., R.S. and O.F.; project administration, A.R.; funding acquisition, A.R. All authors have read and agreed to the published version of the manuscript.
Data Availability Statement
The raw data supporting the conclusions of this article will be made available by the authors upon request.
Acknowledgments
The research team would like to extend their sincere gratitude to Elisabeth Fraser-Hitch for her meticulous proofreading of this work. Her expertise not only in technical terminology but also in ensuring grammatical accuracy and clarity has greatly enhanced the quality of the manuscript. Her contributions have ensured that the English language throughout the review is precise and professionally presented.
Conflicts of Interest
The authors declare no conflicts of interest related to the publication of this systematic review. While one of the included studies shares the same main author as this review, all efforts were made to minimize bias. The quality assessment for all studies, including the one authored by a member of this review team, was independently conducted by another reviewer who was not involved with the respective study. Additionally, no external funding or influences affected the outcomes or interpretations presented in this review.
References
- Hoy, D.; Bain, C.; Williams, G.; March, L.; Brooks, P.; Blyth, F.; Woolf, A.; Vos, T.; Buchbinder, R. A systematic review of the global prevalence of low back pain. Arthritis rheum 2021, 64, 2028-2037. [CrossRef]
- Trompeter, K.; Fett, D.; Platen, P. Prevalence of Back Pain in Sports: A Systematic Review of the Literature. Sports Med 2017, 47, 1183-1207. [CrossRef]
- Huang, R.; Ning, J.; Chuter, V.H.; Taylor, J.B.; Christophe, D.; Meng, Z.; Jiang, L. Exercise alone and exercise combined with education both prevent episodes of low back pain and related absenteeism: systematic review and network meta-analysis of randomised controlled trials [RCTs] aimed at preventing back pain. Br J Sports Med 2020, 54, 766-770. [CrossRef]
- Heneweer, H.; Picavet, H.; Staes, F.; Kiers, H.; Vanhees, L. Physical fitness, rather than self-reported physical activities, is more strongly associated with low back pain: evidence from a working population. Eur Spine J 2012, 21, 1265-1272. [CrossRef]
- Quinn, S.; Bird, S. Influence of saddle type upon the incidence of lower back pain in equestrian riders. Br J Sports Med 1996, 30, 140-144. [CrossRef]
- Wilson, F.; Ardern, C.L.; Hartvigsen, J.; Dane, K.; Trompeter, K.; Trease, L.; Vinther, A.; Gissane, C.; McDonnell, S.J.; Carneiro, J.P.; et al. Prevalence and risk factors for back pain in sports: a systematic review with meta-analysis. Br J Sports Med 2021, 55, 601-607. [CrossRef]
- Williams, J. Performance analysis in equestrian sport. Comp Exerc Physiol 2013, 9, 67-77. [CrossRef]
- Pugh, T.J.; Bolin, D. Overuse Injuries in Equestrian Athletes. Curr Sports Med Rep 2004, 3, 297-303. [CrossRef]
- Dumbell, L.C.; Rowe, L.; Douglas, J.L. Demographic profiling of British Olympic equestrian athletes in the twenty-first century. Sport Soc 2018, 21, 1337-1350. [CrossRef]
- Haan, D. A Review of the Appropriateness of Existing Micro- and Meso-level Models of Athlete Development within Equestrian Sport. Int J Hum Mov Sports Sci 2017, 5, 1-8. [CrossRef]
- Hoy, D.; Brooks, P.; Blyth, F.; Buchbinder, R. The epidemiology of low back pain. Best Prat Res Clin Rheumatol 2010, 24, 769-781. [CrossRef]
- Lewis, V.; Douglas, J.L.; Edwards, T.; Dumbell, L. A preliminary study investigating functional movement screen test scores in female collegiate age horse-riders. Comparative Exercise Physiology 2019, 15, 105-112. [CrossRef]
- Page, M.J.; McKenzie, J.E.; Bossuyt, P.M.; Boutron, I.; Hoffmann, T.C.; Mulrow, C.D.; Shamseer, L.; Tetzlaff, J.M; Akl, E.A.; Brennan, S.E.; et al. The PRISMA 2020 statement: an updated guideline for reporting systematic reviews. BMJ 2021, 372. [CrossRef]
- Carlson, M.D.; Morrison, R.S. Study Design, Precision, and Validity in Observational Studies. J Palliat Med 2009, 12, 77-82. [CrossRef]
- Drukker, M.; Weltens, I.; van Hooijdonk, C.; Vandenberk, E.; Bak, M. Development of a methodological quality criteria list for observational studies: the observational study quality evaluation. Front Res Metr Anal 2021, 6675071. [CrossRef]
- Munn, Z.; Moola, S.; Lisy, K.; Riitano, D.; Tufanaru, C. Chapter 5: Systematic reviews of prevalence and incidence. In JBI Manual for evidence Synthesis; Aromataris, E., Munn, Z. Eds.; JBI: South Australia, 2020, 177-217. [CrossRef]
- Corporation, Microsoft. Microsoft Excel (Version 2021). Available online: https://www.microsoft.com.
- Naing, L.; Nordin, R.; Rahman, H.; Naing, Y. Sample size calculation for prevalence studies using Scalex and ScalaR calculators. BMC Med Res Methodol 2022, 22, 1-8. [CrossRef]
- Epitools Epidemiological Calculators. (Ausvet) Available online: Sergeant, ESG: https://epitools.ausvet.com.au/ciproportion (accessed on 24 August 2024).
- Deckers, I.; De Bruyne, C.; Roussel, N.A.; Truijen, S.; Minguet, P.; Lewis, V.; Wilkins, C.; Van Breda, E. Assessing the sport-specific and functional characteristics of back pain in horse riders. Comp Exerc Physiol 2021, 17, 7-15. [CrossRef]
- Lewis, V.; Baldwin, K. A preliminary study to investigate the prevalence of pain in international event riders during competition, in the United Kingdom. Comp Exerc Physiol 2018, 14, 173-181. [CrossRef]
- Lewis, V.; Kennerley, R. A preliminary study to investigate the prevalence of pain in elite dressage riders during competition in the United Kingdom. Comp Exerc Physiol 2017, 13, 259-263. [CrossRef]
- Lewis, V.; Dumbell, L.; Magnoni, F. A Preliminary Study to Investigate the Prevalence of Pain in Competitive Showjumping Equestrian Athletes. J Phys Fitness Med Treat Sports 2018, 4. [CrossRef]
- Hobbs, S. J.; Baxter, J.; Louise, B.; Laura-Ann, R.; Jonathan, S.; Hilary, C. M. Posture, Flexibility and Grip Strength in Horse Riders. J Hum Kinet 2014, 42, 113-125. [CrossRef]
- Kraft, C.N.; Peter, P.H.; Ute, B.; Mei, Y.; Oliver, D.; Christian, L.; Makus, F.V. Magnetic Resonance Imaging Findings of the Lumbar Spine in Elite Horseback Riders: Correlations With Back Pain, Body Mass Index, Trunk/Leg-Length Coefficient, and Riding Discipline. Am J Sports Med 2009, 37, 2205-2213. [CrossRef]
- Duarte, C.; Santos, R.; Fernandes, O.; Raimundo, A. Prevalence of Lower Back Pain in Portuguese Equestrian Riders. Sports 2024, 12, 207. [CrossRef]
- Ferrante, M.; Bonetti, F.; Quattrini, F.M.; Mezzetti, M.; Demarie, S. Low Back Pain, and Associated Factors among Italian Equestrian Athletes: a Cross-Sectional Study. MLTJ 2021, 11, 344. [CrossRef]
- Cejudo, A.; Ginés-Díaz, A.; Rodrígues-Ferrán, O.; Santonja-Medina, F.; Sainz De Baranda, P. Trunk Lateral Flexor Endurance and Body Fat: Predictive Risk Factors for Low Back Pain in Child Equestrian Athletes. Children 2020, 7, 172. [CrossRef]
- Cejudo, A.; Ginés-Días, A.; Sainz De Baranda, P. Asymmetry and Tightness of Lower Limb Muscles in Equestrian Athletes: Are They Predictors for Back Pain? Symmetry 2020, 12, 1679. [CrossRef]
- Pilato, M.; Henry, T.; Malavase, D. Injury History in the Collegiate Equestrian Athlete: Part I: Mechanism of Injury, Demographic Data and Spinal Injury. JSMAHS 2017, 2, 3. [CrossRef]
- Lewis, V.; Nicol, Z.; Dumbell, L.; Cameron, L. A Study Investigating Prevalence of Pain in UK Horse Riders over Thirty-Five Years Old. Int J Equine Sci 2023, 2, 9-18.
- Puszczałowska-Lizis, E.; Szymański, D.; Pietrzak, P.; Wilczyński, M. Incidence of back pain in people practicing amateur horse riding. Fizjoterapia polska 2022, 22. [CrossRef]
- Kraft, C.; Urban, N.; Ilg, A.; Wallny, T.; Scharfstädt, A.; Jäger, M.; Pennekamp, P. Einfluss der Reitdisziplin und -intensität auf die Inzidenz von Rückenschmerzen bei Reitsportlern. Influence of the riding discipline and riding intensity on the incidence of back pain in competitive horseback riders, Sportverletzung Sportschaden: Organ der Gesellschaft fur Orthopadisch-Traumatologische Sportmedizin 2007, 21, 29-33. [CrossRef]
- Jensen, M.; Chen, C.; Brugger, A. Interpretation of visual analog scale ratings and change scores: a reanalysis of two clinical trials of postoperative pain. J Pain 2003, 4, 407-414. [CrossRef]
- Millet, G.; Brocherie, F.; Burtscher, J. Olympic Sports Science—Bibliometric Analysis of All Summer and Winter Olympic Sports Research. Front Sports Act Living 2021, 3, 772140. [CrossRef]
- Olympic Equestrian—History. Available online: https://olympics.com/en/paris-2024/sports/equestrian (accessed on 20 August 2024).
- Gebrye, T.; Fatoye, F.; Mbada, C.; Hakimi, Z. A scoping review on quality assessment tools used in systematic reviews and meta-analysis of real-world studies. Rheumatol Int 2023, 43, 1573-1581. [CrossRef]
- Arachtingi, D. Foster the Gender Equality in the context of horse-riding. An Olympic Value which reveals a path from domination to emancipation. Diagoras Int Acad J Olympic Stud 2020, 4, 60-74.
- Plymoth, B. Gender in equestrian sports: an issue of difference and equality. Sport Soc 2012, 15, 335-348. [CrossRef]
- de Haan, D.; Henry, I.; Sotiriadou, P. Evaluating the place of equestrian sport in the Long-Term Athlete Development (LTAD) and the Sport Policy factors that Lead to International Sporting Success (SPLISS) models. In Proceedings of the SPLISS conference. Melbourne, Australia, 2015.
- Cleary, K. Joyful Equestrian. Available online: https://www.joyfulequestrian.com/horse-disciplines/?utm_content=cmp-true (accessed on 21 August 2024).
- Disciplines. Available online: https://www.fei.org/disciplines (accessed on 21 August 2024).
- Paris 2024—Sports—Equestrian. Available online: https://olympics.com/en/paris-2024/sports/equestrian (accessed on 21 August 2024).
- Para Equestrian. Available online: https://olympics.com/en/paris-2024/paralympic-games/sports/para-equestrian (accessed on 21 August 2024).
- National Federations. Available online: https://inside.fei.org/fei/about-fei/structure/national-federations (accessed on 21 August 2024).
- FEI Facts and Figures. Available online: https://inside.fei.org/fei/about-fei/publications/fei-annual-report/2021/feifactsandfigures/ (accessed on 21 August 2024).
- Lamperd, W.; Clarke, D.; Wolframm, I.; Williams, J. What makes an elite equestrian rider? Comp Exerc Physiol 2016, 12, 105-118. [CrossRef]
- Williams, J.; Tabor, G. Rider impacts on equitation. Appl Anim Behav Sci 2017, 190, 28-42. [CrossRef]
- Bahr, R.; Clarsen, B.; Derman, W.; Dvorak, J.; Emery, C.A.; Finch, C.F.; Hägglund, M.; Junge, A.; Kemp, S.; Khan, K.M; et al. International Olympic Committee consensus statement: methods for recording and reporting of epidemiological data on injury and illness in sport 2020 (including STROBE Extension for Sport Injury and Illness Surveillance (STROBE-SIIS)). Orthop J Sports Med 2020, 8. [CrossRef]
- Heneweer, H.; Vanhees, L.; Picavet, H. Physical activity and low back pain: A U-shaped relation? Pain 2009, 143, 21-25. [CrossRef]
- Schmidt, C.; Zwingenberger, S.; Walther, A.; Reuter, U.; Kasten, P.; Seifert, J.; Günther, K.P.; Steiehler, M. Prevalence of Low Back Pain in Adolescent Athletes—an Epidemiological Investigation. Int J Spots Med 2014, 35, 684-689. [CrossRef]
- Catalá, M.; Schroll, A.; Laube, G.; Arampatzis, A. Muscle Strength and Neuromuscular Control in Low-Back Pain: Elite Athletes Versus General Population. Front Neurosci 2018, 12. [CrossRef]
- Noormohammadpour, P.; Khezri, A.H.; Farahbakhsh, F.; Mansournia, M.A.; Smuck, M.; Kordi, R. Reliability and Validity of Athletes Disability Index Questionnaire. Clin J Sport Med 2018, 28, 159-167. [CrossRef]
- Shafshak, T.S.; Elnemr, R. The visual analogue scale versus numerical rating scale in measuring pain severity and predicting disability in low back pain. JCR J Clin Rheumatol 2021, 27, 282-285. [CrossRef]
- Zamani, E.; Kordi, R.; Nourian, R.; Noorian, N.; Memari, A.H.; Shariati, M. Low back pain functional disability in athletes; conceptualization and initial development of a questionnaire. Asian J Spots Med 2014, 5. [CrossRef]
- Azevedo, V.D.; Silva, R.F.; Borges, S.; Fernandes, M.; Miñana-Signes, V.; Monfort-Pañego, M.; Noll, P.R.E.S.; Noll, M. Instruments for assessing back pain in athletes: A systematic review. Plos one 2023, 18. [CrossRef]
- Hainline, B.; Derman, W.; Vernec, A.; Budgett, R.; Deie, M.; Dvořák, J.; Harle, C.; Herring, S.A.; McNamee, M.; Meeuwisse, W.; et al. International Olympic Committee consensus statement on pain management in elite athletes. Br J Sports Med 2017, 51, 1245-1258. [CrossRef]
- Noormohammadpour, P.; Rostami, P.; Mansournia, M.; Farahbakhsh, F.; Pourgharib Shahi, M.H. Kordi, R. Low back pain status of female university students in relation to different sport activities. Eur Spine J 2016, 25, 1196-1203. [CrossRef]
- Wernli, K.; Tan, J.; O’Sullivan, P.; Smith, A.; Campbell, A,; Kent, P. Does movement change when low back pain changes? A systematic review. J Orthop Sports Phys Ther 2020, 50, 664-670. [CrossRef]
- Nadler, S.; Moley, P.; Malanga, G.; Rubbani, M.; Prybicien, M.; Feinberg, J.H. Functional deficits in athletes with a history of low back pain: a pilot study. Arch Phys Med Rehabil 2002, 83, 1753-1758. [CrossRef]
- Mortazavi, J.; Zebardast, J.; Mirzashahi, B. Low back pain in athletes. Asian J Sports Med 2015, 6. [CrossRef]
- Orr, R.; Canetti, E.; Pope, R.; Lockie, R.; Dawes, J.; Schram, B. Characterization of Injuries Suffered by Mounted and Non-Mounted Police Officers. Int J Environ Res Public Health 2023, 20, 1144. [CrossRef]
- Sugavanam, T.; Sannasi, R.; Anand, P.; Ashwin Javia, P. Postural asymmetry in low back pain–a systematic review and meta-analysis of observational studies. Disabil Rehabil 2024, 1-18. [CrossRef]
- Low back pain. Available on: https://www.who.int/news-room/fact-sheets/detail/low-back-pain#:~:text=LBP%20can%20be%20experienced%20at%20any%20age%2C%20and,years.%20LBP%20is%20more%20prevalent%20in%20women%20%282%29. (accessed on 21 August 2024).
- Shiri, R.; Falah-Hassani, K.; Heliövaara, M.; Solovieva, S.; Amiro, S.; Lallukka, T.; Burdorf, A.; Husgafvel-Pursiainen, K.; Vikari-Juntura, E. Risk factors for low back pain: a population-based longitudinal study. Arthritis Care Res 2019, 71, 290-299. [CrossRef]
- Moradi, V.; Memari, A.; Shayestehfar, M.; Kordi, R. Low Back Pain in Athletes Is Associated with General and Sport Specific Risk Factors: A Comprehensive Review of Longitudinal Studies. Rehabil Res Pract 2015, 2015, 850184. [CrossRef]
- Walsh, T.P.; Arnold, J.B.; Evans, A.M.; Yaxley, A.; Damarell, R.; Shanahan, E.M. The association between body fat and musculoskeletal pain: a systematic review and meta-analysis. BMC Musculoskelet Disord 2018, 19, 1-13. [CrossRef]
- Papagelopoulos, P.; Boscainos, P.; Giannakopoulos, P.; Zoubos, A. Degenerative Spondyloarthropathy of the Cervical and Lumbar Spine in Jockeys. Orthopedics 2001, 24, 561-564. [CrossRef]
- Zeng, X.; Trask, C.; Kociolek, A.M. Whole-body vibration exposure of occupational horseback riding in agriculture: A ranching example. Am J Ind Med 2017, 60, 215-220. [CrossRef]
- Burstrom, L.; Nilsson, T.; Wahlstrom, J. Whole-body vibration and the risk of low back pain and sciatica: a systematic review and meta-analysis. Int Arch Occup Environ Health 2015, 88, 403-418. [CrossRef]
- Löfqvist, L.; Pinzke, S. Working with Horses: An OWAS Work Task Analysis. J Agric Saf Health 2011, 17, 3-14. [CrossRef]
- Löfqvist, L.; Osvalder, A.L.; Bligård, L.A.; Pinzke, S. An analytical ergonomic risk evaluation of body postures during daily. Work 2015, 51, 667-682. [CrossRef]
- Heneweer, H.; Staes, F.; Aufdemkampe, G.; van Rijn, M.; Vanhees, L. Physical activity, and low back pain: a systematic review of recent literature. Eur Spine J 2011, 20, 826-845. [CrossRef]
Figure 1.
Study selection process.
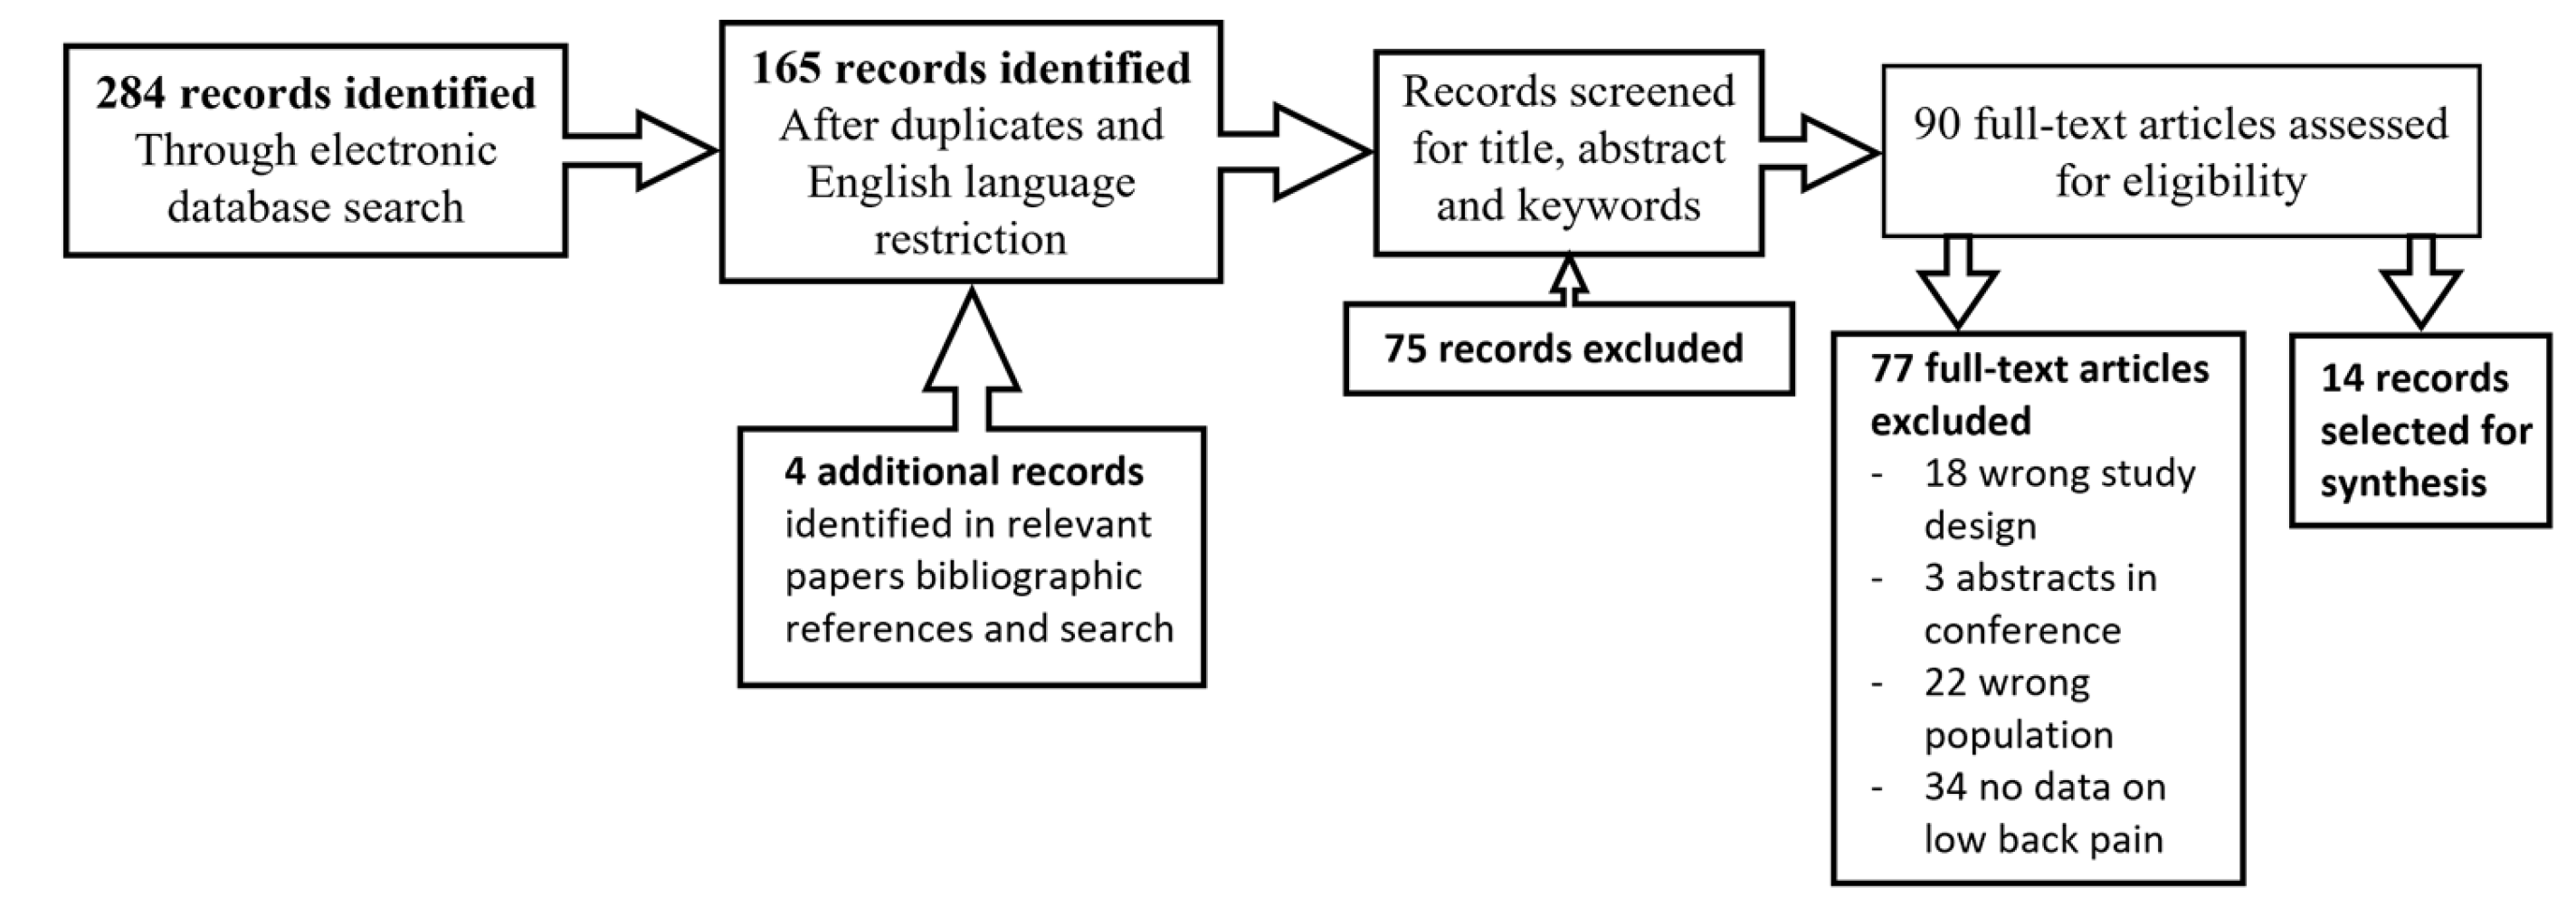
Figure 2.
Equestrian disciplines represented in the studies and number of studies with population practicing each discipline. NC—Non-competitive. More details in Supplementary Material I Table S6.
Figure 2.
Equestrian disciplines represented in the studies and number of studies with population practicing each discipline. NC—Non-competitive. More details in Supplementary Material I Table S6.
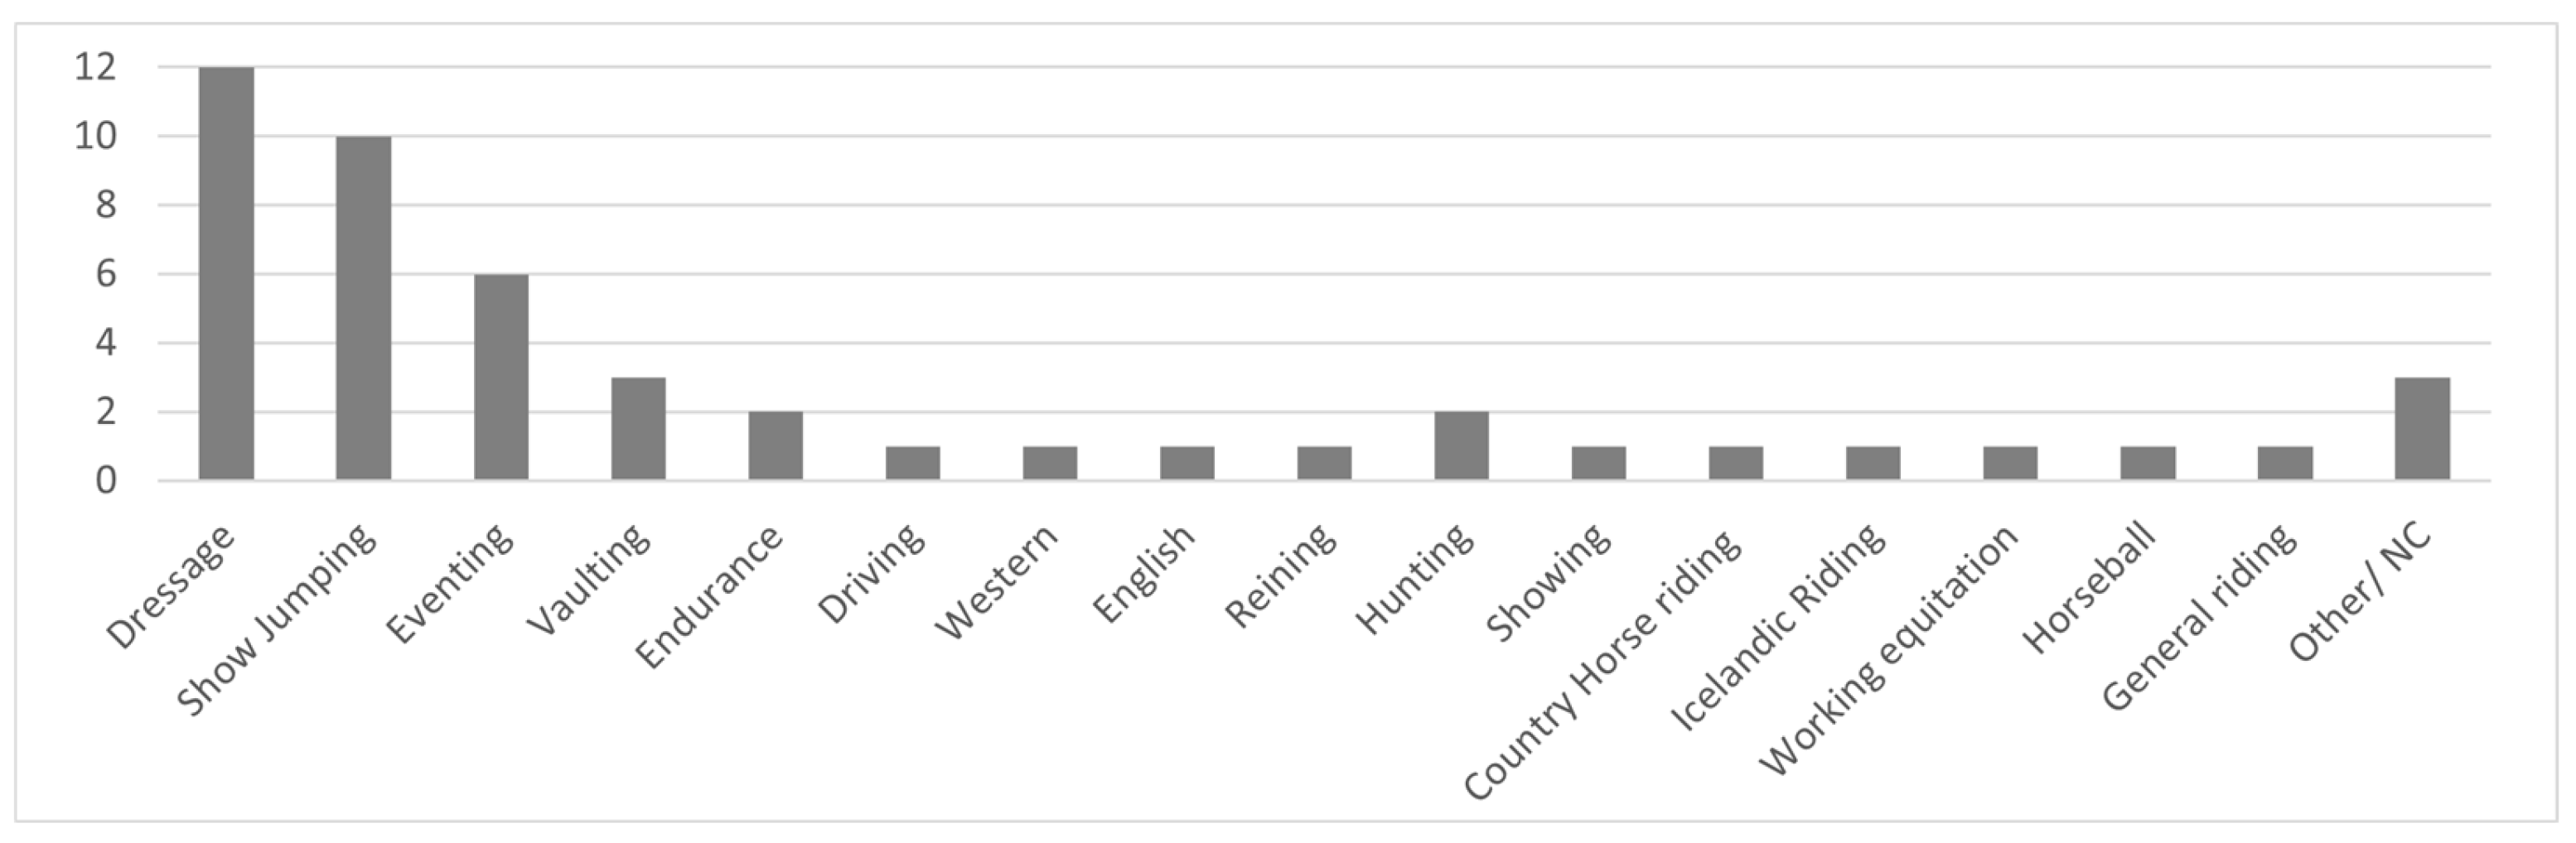
Figure 3.
Number of studies reporting on pain in different trunk and body locations. Upper back [20,21,23,30,31,32,33]; Mid-back [20,24,30,32]; Lower back [20,21,22,23,24,25,26,27,28,29,30,31,32,33]; All back [20,22,32,33]; Other [21,22,23,24,31].
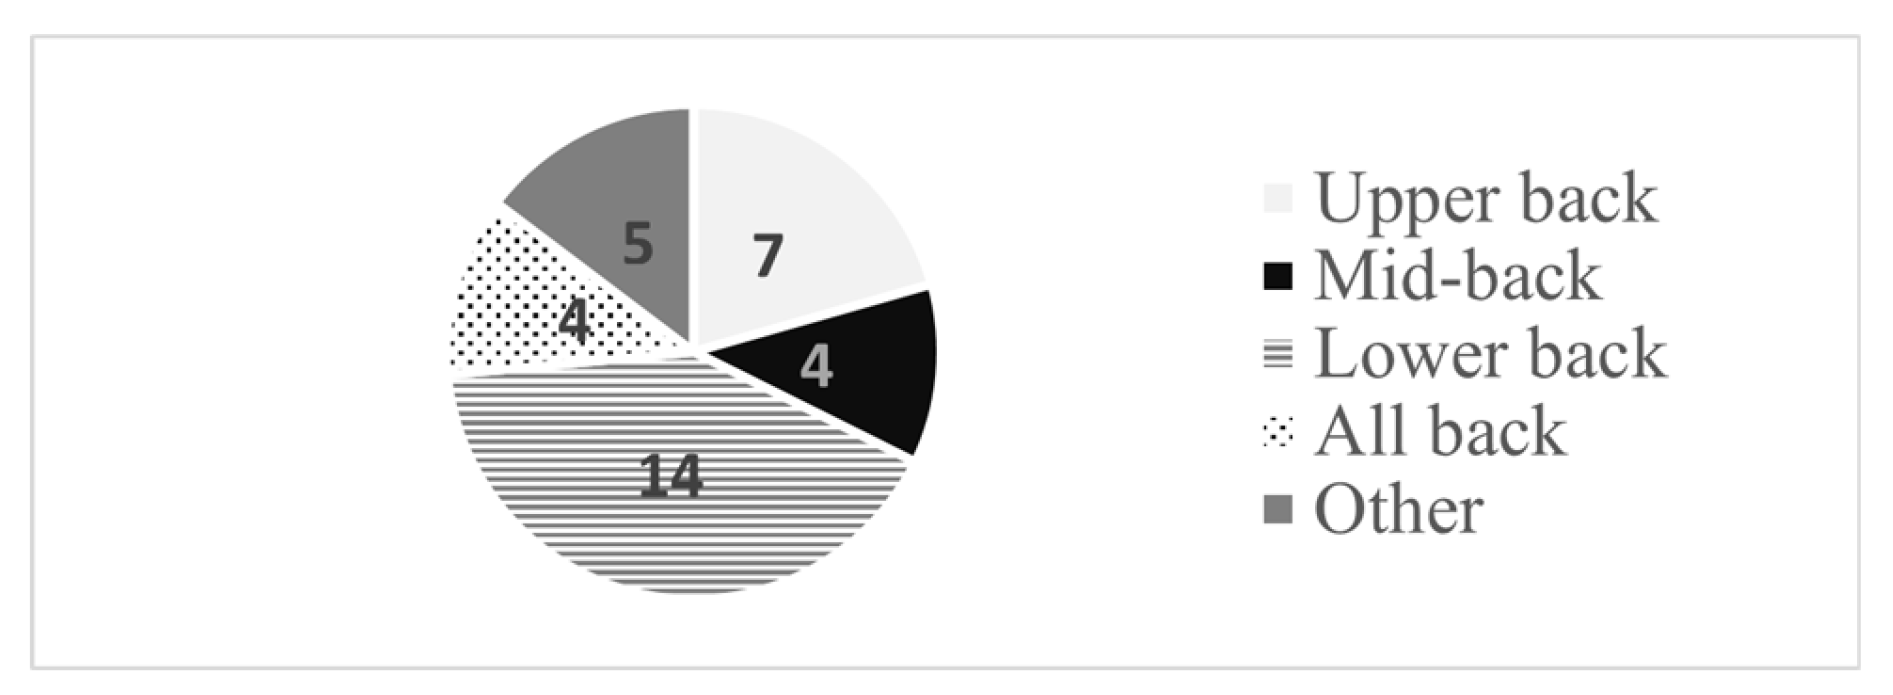
Figure 4.
SF-MPQ—Short Form McGill Pain Questionnaire [21,23,31]; ODI—Oswestry Disability Index (or the Oswestry Low Back Pain Disability Questionnaire) [20,25,31,32]; NSQ—Not standardized questionnaire tool [20,22,24,26,27,28,29,30,32,33]; NMQ—Nordic Musculoskeletal Questionnaire [27]; NRS—Numeric Rating Scale [27] for severity of pain; PSEQ—Pain Self-efficacy Questionnaire [27] only for those reporting CLBP; VAS—Visual Analog Scale [25,33] to measure intensity of pain; RMDQ—Roland Morris Disability Questionnaire [26];.
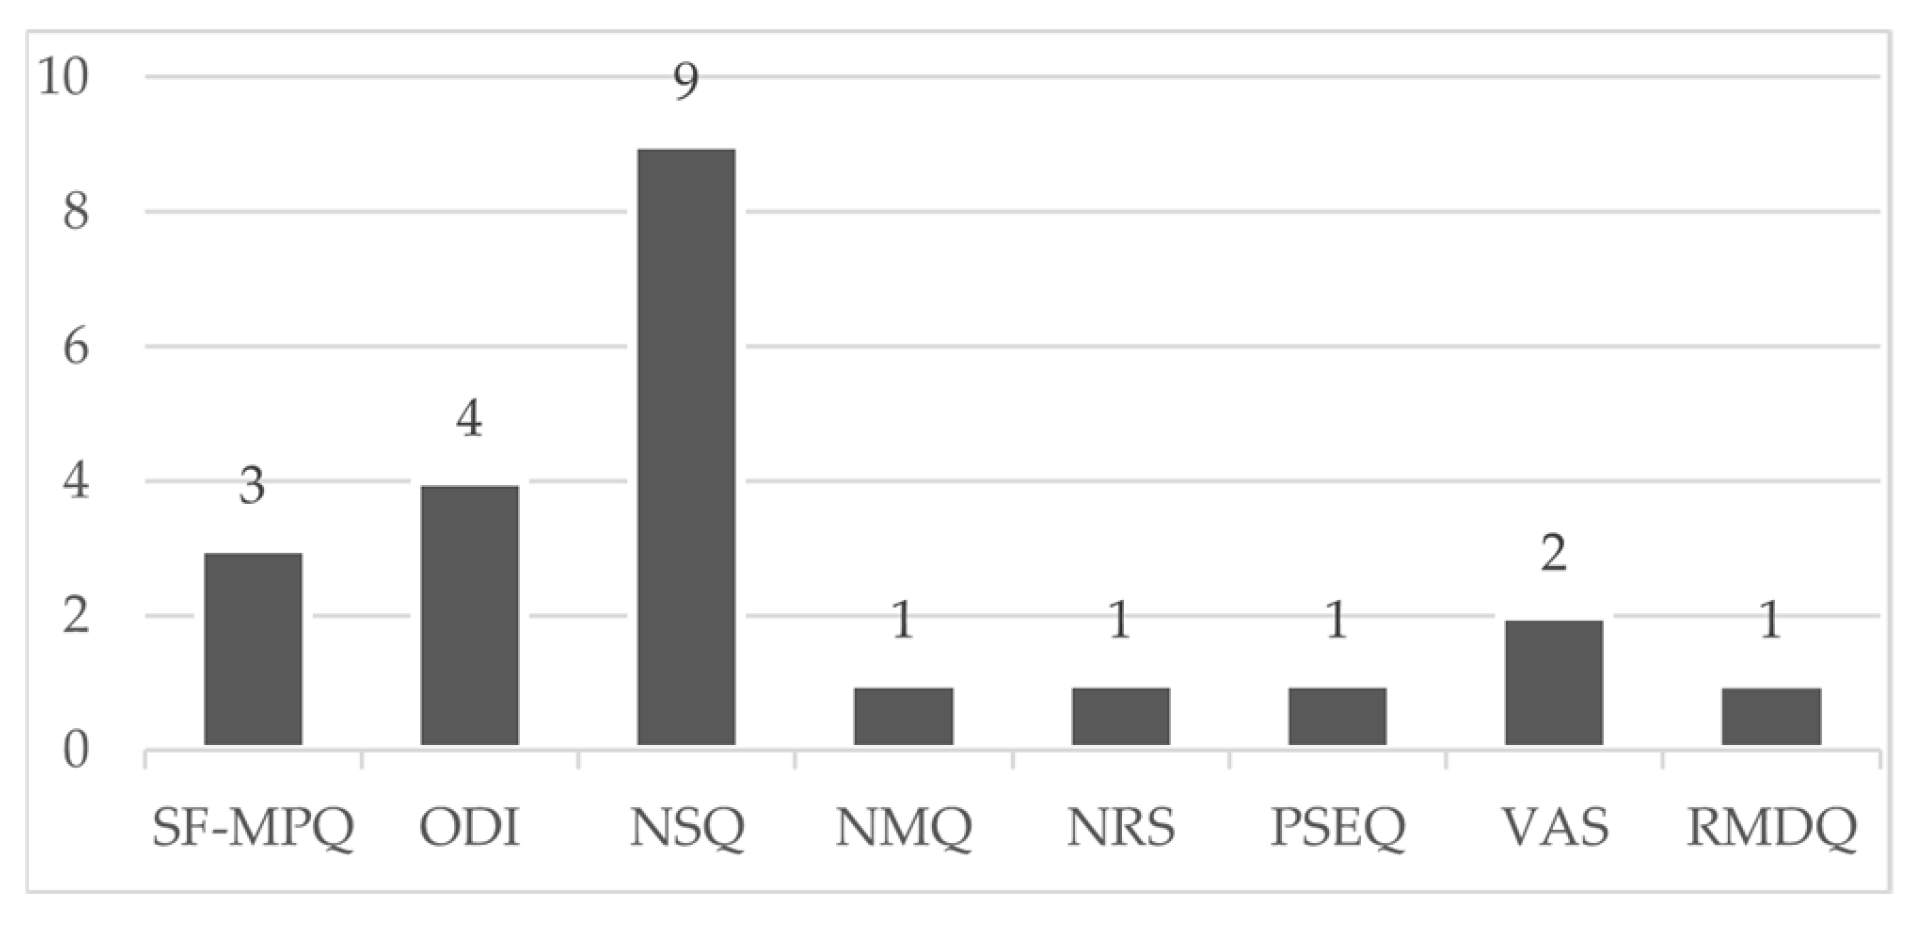
Figure 5.
Prevalence of LBP within study population, results of included studies divided into different recall periods.
Figure 5.
Prevalence of LBP within study population, results of included studies divided into different recall periods.
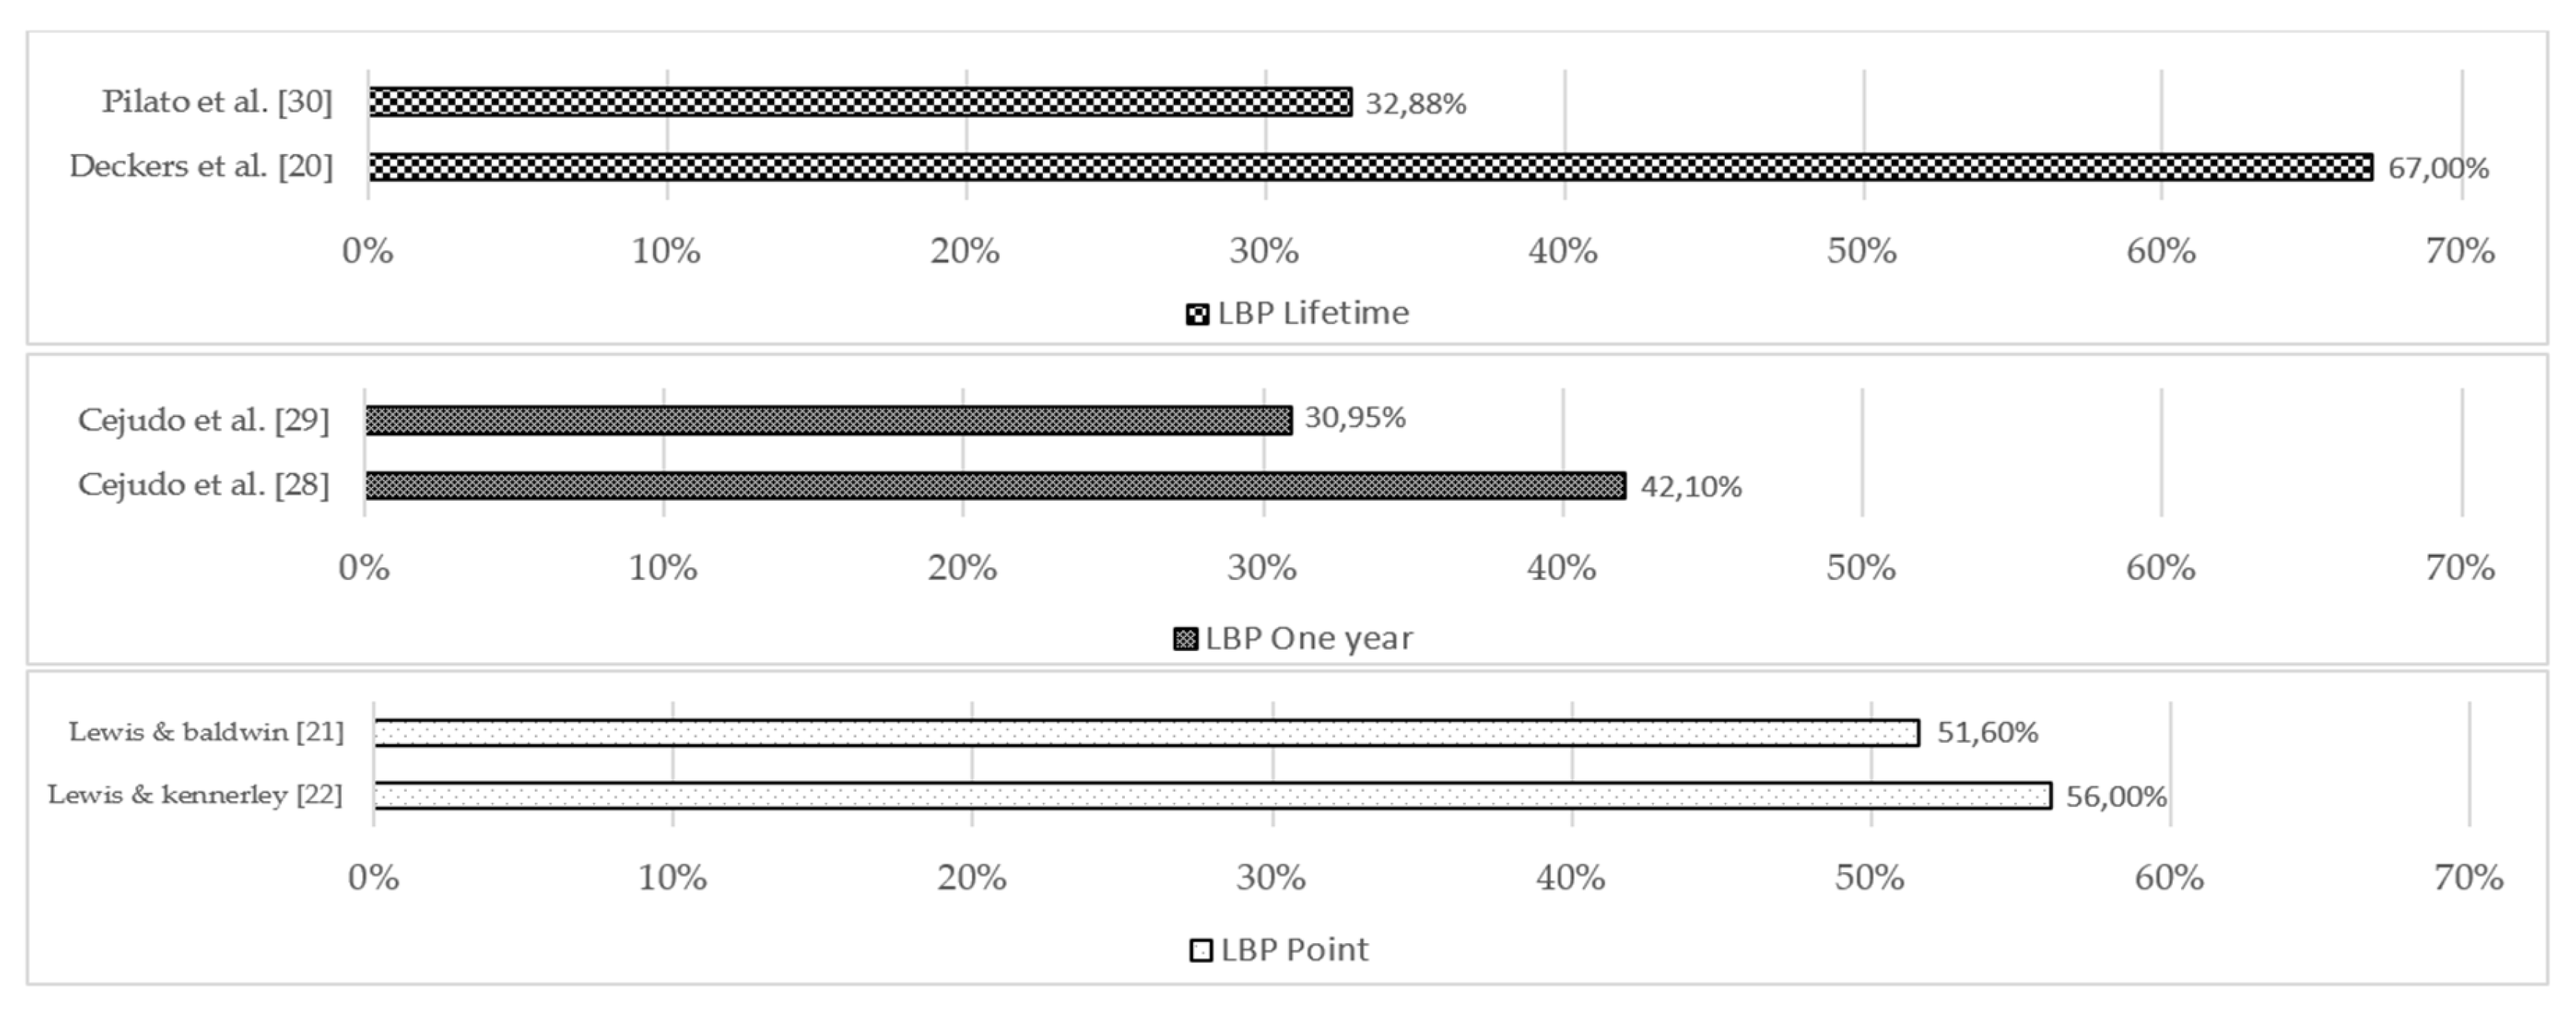
Figure 6.
Prevalence, with confidence limits, of LBP in EA, results of included prevalence studies, divided in different recall periods. When not provided, confidence limits were calculated by the review team; more details are in Table S12, Supplementary material II.
Figure 6.
Prevalence, with confidence limits, of LBP in EA, results of included prevalence studies, divided in different recall periods. When not provided, confidence limits were calculated by the review team; more details are in Table S12, Supplementary material II.
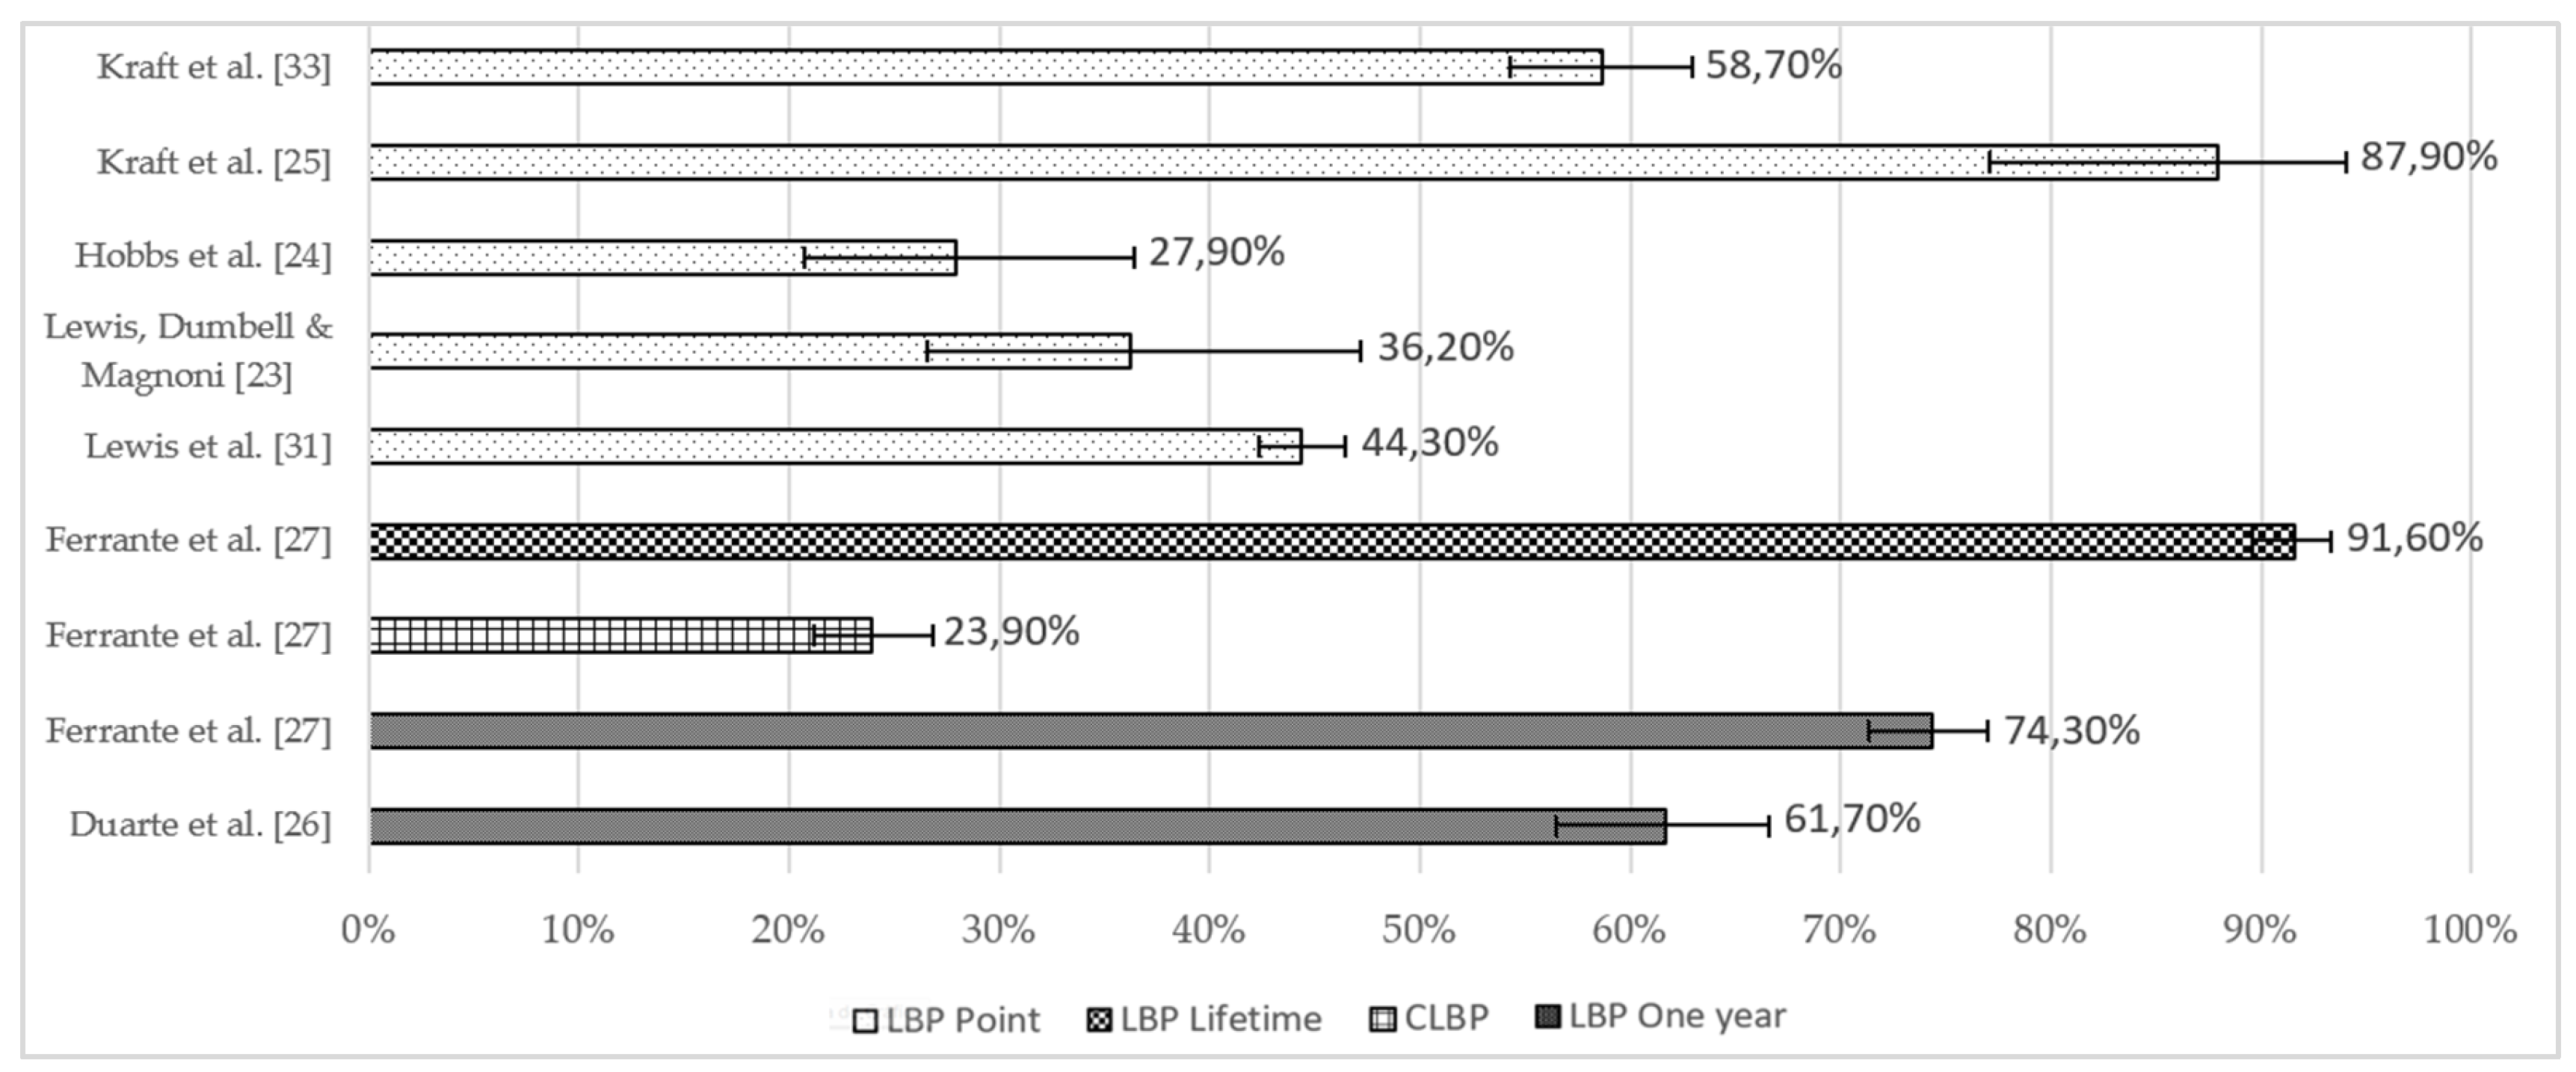
Figure 7.
Levels of pain felt by equestrians based on VAS ratings [34]. Location of pain: LBP—[23,31,32,2527]; BP—[20,33]; Pain in general—[21]. *Values of intensity of pain given as a quantitative variable (median with standard deviation above and below); ** Values of intensity of pain given as a qualitative variable.
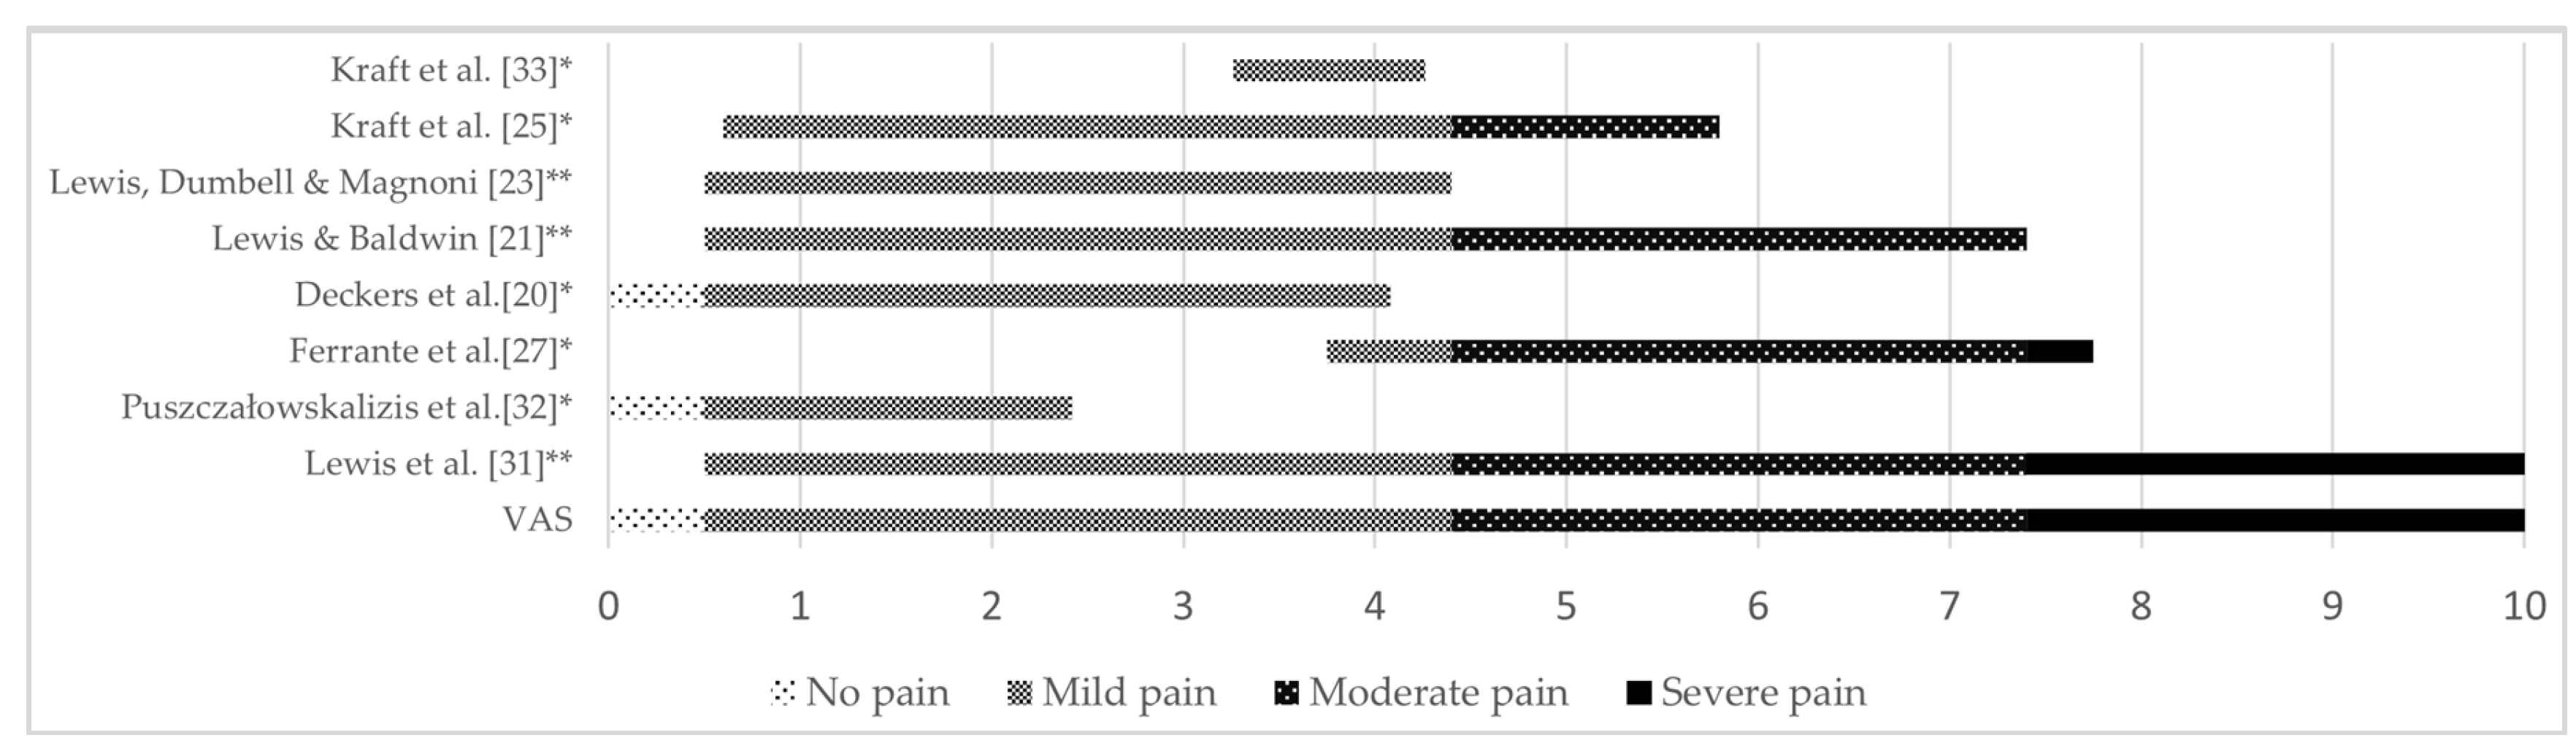

Table 1.
Number and percentage of papers and participants represented in each equestrian Olympic discipline.
Table 1.
Number and percentage of papers and participants represented in each equestrian Olympic discipline.
| Papers (N, %) | Participants (N, %) | |
|---|---|---|
| Dressage | 12, 85.7 | 2310, 51 |
| Show Jumping | 10, 71.4 | 1996, 44.1 |
| Eventing | 6, 42.9 | 644, 14.2 |
Table 2.
Rider status, level of competition and competition status of participants in each study.
| Rider status | Level of competition | Competitive/ non-competitive | |
|---|---|---|---|
| Deckers et al. [20] | Professional & Amateur | National | Competitive |
| Lewis & Baldwin. [21] | - | International | Competitive |
| Lewis & Kennerley. [22] | Elite | International | Competitive |
| Lewis, Dumbell & Magnoni. [23] | Recreational, Amateur & Professional | Competitive | |
| Hobbs et al. [24] | - | - | Competitive |
| Kraft et al. [25] | Elite | National/ International/ Olympic | Competitive |
| Duarte et al. [26] | Hobby & Profession | - | - |
| Ferrante et al. [27] | - | Sport license * | Competitive/ non-competitive |
| Cejudo et al. [28] | - | - | Competitive |
| Cejudo et al. [29] | - | - | Competitive |
| Pilato et al. [30] | - | Intercollegiate | Competitive |
| Lewis et al. [31] | Leisure, Amateur & Professional | - | Competitive/ non-competitive |
| Puszczałowska-lizis et al. [32] | Amateur | - | - |
| Kraft et al. [33] | - | Performance classes ** | Competitive |
*As defined by the Italian National Equestrian Federation. **As defined by the German equestrian federation.
Disclaimer/Publisher’s Note: The statements, opinions and data contained in all publications are solely those of the individual author(s) and contributor(s) and not of MDPI and/or the editor(s). MDPI and/or the editor(s) disclaim responsibility for any injury to people or property resulting from any ideas, methods, instructions or products referred to in the content. |
© 2024 by the authors. Licensee MDPI, Basel, Switzerland. This article is an open access article distributed under the terms and conditions of the Creative Commons Attribution (CC BY) license (http://creativecommons.org/licenses/by/4.0/).
Copyright: This open access article is published under a Creative Commons CC BY 4.0 license, which permit the free download, distribution, and reuse, provided that the author and preprint are cited in any reuse.


