Submitted:
04 October 2024
Posted:
07 October 2024
Read the latest preprint version here
Abstract
Epidermal Growth Factor Receptor (EGFR) expression is an important aspect in the non-small cell lung cancer (NSCLC) diagnosis and treatment. Therefore, it becomes important to identify factors that may influence EGFR level. There are reports suggesting that one of the positive EGFR gene transcription regulators may be Special AT-rich Binding Protein 1 (SATB1), but so far these ob-servations have not been confirmed in NSCLC.
The main aim of the present study was to investigate the possible links between the EGFR and SATB1 expression on both protein and mRNA levels in NSCLC clinical samples, and to correlate the obtained results with the clinical-pathological data of the patients. Additionally, we analysed the relationships between the expression levels of EGFR and the known tumour promoters, in-cluding Ki67 proliferative antigen and EMT-promoting transcription factors - SLUG, SNAIL, and Twist1.
We demonstrated that EGFR expression in NSCLC was positively correlated both with the SATB1 level and with the expression of EMT-promoting proteins. Moreover, we were the first to analyse EGFR expression exclusively in NSCLC cancer cells without the interference caused by respiratory epithelium and tumour stroma. Our analysis revealed that the prognostic significance of EGFR expression was dependent on tumour histology and differed significantly between the AC and LSCC samples.
Keywords:
SATB1
; EGFR
; NSCLC
; AC
; LSCC
; non-small cell lung carcinoma
; lung adenocarcinoma
; lung squamous cell carcinoma
; epithelial growth factor receptor
1. Introduction
For over 75 years, cancer has been the second most common cause of death in the US [1]. Although, thanks to improved prevention and better healthcare, rates of cancer-related mortality have decreased over the past 30 years [1]. Malignant tumours are still responsible for approximately 10 million deaths every year [2,3]. That means that around one in six deaths worldwide is related to cancer [2,3,4].
Globally, the most frequently diagnosed cancer is lung carcinoma, which is also the leading cause of cancer-related mortality [2]. According to the World Health Organization (WHO) guidelines from 2015, lung cancers can be divided into four main groups, based on their morphological, biological, and molecular features [5,6]. The main lung cancer subtypes distinguished are adenocarcinomas (ACs), squamous cell lung carcinomas (LSCCs), large cell carcinomas (LCCs), and neuroendocrine tumours [5]. ACs, LSCCs and LCCs together are often classified as non-small cell lung cancers (NSCLCs). Although NSCLC is not included in the official histological classification, the term is commonly used in clinical nomencluature, and tumors classified as NSCLCs comprise almost 90% of all lung cancer cases. [7]. This study will focus on NSCLCs exclusively, with particular attention to AC and LSCC subtypes.. Due to its relatively low incidence (about % of all lung cases (7)) and high heterogenecity, LCC will not be included.
Although smoking cigarettes is commonly thought to be the main factor associated with lung cancer development, it has been demonstrated that 12% of people diagnosed with lung cancer were never-smokers [8]. In these patients, the dominant lung cancer subtype is AC [9]. ACs originate from lung alveolar cells [10], and are usually located on the lung periphery [5]. In contrast, LSCC occurrence is strongly associated with tobacco smoking [5]. These tumours are derived from respiratory epithelial cells, and are located mostly in the primary and secondary bronchi, in the central part of the lung [5,9].
Carcinogenesis is usually a long-drawn, multistep process. It is estimated that 10-20 mutations in specific genes, occurring in the right order, are required for complete neoplastic transformation of bronchial epithelial cells [11]. Not all of these mutations are crucial for tumour progression. The most important ones, whose presence determines oncogenic transformation of the cells, are called driver mutations [12]. Lung carcinogenesis is induced mainly by chemical factors, like the components of tobacco smoke, asbestos, or air pollution, and can take many years to complete [11]. After the induction, genetic alterations accumulate gradually, resulting in the development of invasive tumour cells. Due to high heterogeneity and complexity of NSCLC tumours, it is difficult to clearly identify the driver mutations underlying lung cancer pathogenesis [8,13]. Genes that undergo mutations differ significantly depending on the histological type of the tumour. In AC, mutations occur usually in EGFR, KRAS, BRAF, HER2, ALK, ROS1, RET, NTRK1 and NRK1 genes [5,9]. In LSCC, the frequency of the mutations is very high, 3 to 10 times higher than in other neoplasms - this is primarily a result of the exposure of the bronchial epithelium to tobacco smoke [5]. Characteristic features of LSCC tumours are chromosomal amplification and increased copy number of certain genes, such as SOX2, TP63, EGFR and FGFR1 [6]. Often detected are also mutations of TP53, CDKN2A, PTEN, PIK3CA, KEAP1, MLL2, HLA-A, NFE2L2, NOTCH1 and RB1 genes [5,9].
Unfortunately, the lack of a uniform mechanism of NSCLC progression makes it difficult to develop standardized treatment protocols [8]. For years, surgical treatment was considered the method of choice for localized NSCLC tumours [14,15]. However, it can be used only when the cancer is detected on an early, localized stage (I or II) [15]. In the US, more than 65% of men diagnosed with lung cancer are in the stage III or IV of the disease, with present local or distant metastases [16]. This is due to the lack of widely available and inexpensive diagnostic methods, enabling early NSCLC detection. Although it has been shown that tests based on combined microRNA detection and tomography are highly effective in diagnosing early (I/II) NSCLC stages, these methods are still too complicated and expensive to be widely used, even in developed countries [8].
In the most current cancer approach, we are slowly transitioning from universal treatments, including chemotherapy and radiotherapy, to the more specialized ones such as immunotherapy or targeted therapies. Commonly used, standard cancer treatments usually cause multiple side effects and are characterized by high toxicity to normal cells, especially fast-dividing ones. For that reason, personalized cancer therapies, adjusted for specific molecular type of the tumour and patient-specific gene expression patterns, are becoming an area of interest for an increasing number of researchers and clinicians.
The targeted drugs most widely used in NSCLC therapy are EGFR (Epidermal Growth Factor Receptor) tyrosine kinase inhibitors (EGFR-TKIs). EGFR is a transmembrane protein that can be activated by ligands belonging to the EGF (Epidermal Growth Factor) family [17]. EGFR activation leads to receptor dimerization, followed by tyrosine kinase-mediated signal transduction via RAS/RAF/MAPK, PI3K/AKT, or JAK/STAT pathways. This results in increased proliferation and migration of cells, and their resistance to apoptosis [18]. EGFR is expressed in about 50% of NSCLC cases [19], but not all EGFR-positive tumours are eligible for EGFR-TKI treatment. The best response to EGFR-TKIs has been observed in patients with “activating” or “sensitizing” mutations in the EGFR kinase domain [15,18,20]. These mutations comprise exon 19 deletions and Leu858Arg substitution in exon 21 [19], and result in the constitutive, ligand-independent activation of the receptor.
Therapy with EGFR TKIs, although effective, has significant limitations. It can only be used in a limited group of patients with a specific molecular subtype of the tumour, and after a maximum of two years all of them develop resistance to first--generation EGFR-TKIs (Erlotinib and Gefitinib). The resistance is usually caused by secondary EGFR mutations [18] – mainly by T790M substitution [5]. Second-generation EGFR TKIs (Afatinib and Dacomitinib) can overcome the resistance, but they interact with all the EGFR family receptors, including wild-type EGFR in skin and gastrointestinal organs. This results in serious side effects and dose-dependent toxicity, making the therapy burdensome [18,21]. In 2014, a novel, irreversible EGFR-TKI was described [21]. AZD9291 (Osimertinib) not only overcomes T790M-mediated resistance in NSCLC tumours, but also penetrates central nervous system lesions, reducing the risk of CNS progression [21,22]. Unfortunately, most patients eventually develop Osimertinib resistance [22,23]. The underlying mechanisms are heterogeneous and include EGFR C797S substitution, bypass signalling pathways activation, and phenotypic change – a shift towards small-cell histology [21,23,24].
In its official guidelines, the American Society of Clinical Oncology recommends EGFR-TKIs treatment only for the patients harboring sensitizing mutations [25]. However, according to the recent reports, a positive response to EGFR-TKIs occurs also in patients with high levels of wild-type EGFR [26,27]. Taking this into account, it becomes important to identify factors that may serve as EGFR expression regulators, because of its potential as new molecular markers or targets for novel therapies. It is known that the EGFR gene transcription can be regulated by Sp1 and c-Jun proteins [28]. However, there are reports suggesting that another EGFR transcription regulator may be SATB1 [29].
SATB1 (Special AT-rich Binding Protein 1) is a nuclear matrix protein, often called a “global transcription factor”. It organizes DNA into tertiary structures by binding to specific genome sequences named BURs (base-unpairing regions) [30,31]. By recruiting additional transcription factors and chromatin modifying enzymes, SATB1 simultaneously regulates the expression of whole sets of genes – even those located on distant chromosomes [32]. Physiologically, SATB1 is involved in the proliferation, differentiation, and migration of cells, and regulates the expression of different sets in a tissue-specific manner [10]. In cancer cells, its presence was associated with an aggressive phenotype and resistance to apoptosis [29,33]. Furthermore, SATB1 has been proven to be involved in the epithelial-mesenchymal transition process, and therefore contribute to cancer spread [34,35,36]. SATB1 overexpression has been demonstrated to have a negative prognostic significance in breast, gastrointestinal, ovarian and prostate cancers [37,38,39,40].
In NSCLC, the role of SATB1 expression has been observed to be strictly dependent on the tumour histology. In AC, elevated SATB1 level was associated with a poor degree of tumour differentiation [33,41]. In LSCC in turn, a reverse relationship has been noticed - SATB1 expression was negatively correlated with the tumour grade [41]. In NSCLC samples, SATB1 level was found to be associated with the expression of the proliferative marker Ki67 [41] and EMT-promoting transcription factors [42]. Moreover, SATB1 expression has been demonstrated to be a positive prognostic factor for NSCLC and LSCC patients [10,42]. In AC, its prognostic significance has not been confirmed.
It is known that there are positive associations between SATB1 level and EGFR expression. In 2008, Han et al. demonstrated that in breast cancer cells, SATB1 upregulates the expression of EGFR and other genes involved in EGF signalling [29]. In glioblastoma cell lines, SATB1 knockdown negatively influenced the expression levels of EGFR and other proto-oncogenes [43]. Similar effect of SATB1 knockdown was noticed also in colon cancer cell lines [44]. However, there are no reports available about SATB1/EGFR relationships in NSCLC. The aim of the presented study was to investigate the possible links between SATB1 and EGFR levels in NSCLC clinical samples, and to correlate the obtained results with the clinical-pathological data of the patients.
2. Results
EGFR Expression Was Significantly Higher in LSCC Comparing to AC Tumours
To assess EGFR protein levels in the analysed clinical samples, IHC staining was performed. EGFR expression was observed in the nuclei, cytoplasm, and membranes of cancer cells (Figure 1 A-C), and in the non-malignant lung epithelium (Figure 1 D). No EGFR staining was detected in the tumour stroma, non-malignant lung alveoli (Figure 1 E), or in the infiltrating lymphocytes (Figure 1 F).
We noticed nuclear EGFR expression (score>3) in 90 from 239 (37.66%) of the analysed NSCLC samples. Further statistical analysis revealed that the mean EGFR N score values were significantly higher in LSCC than in AC tumours (3.53±0.84 vs. 3.11±0.99; P<0.001; Figure 2 A). No additional associations between EGFR N expression and clinical-pathological data of the patients were observed (Table S1).
EGFR was expressed in the cytoplasm of cancer cells in 139 from 239 (58.16%) cases. As in the case of EGFR N expression, EGFR C scores were significantly higher in LSCC compared to AC samples (4.56±1.36 vs. 3.66±1.17; P<0.001; Figure 2 B). Moreover, in AC tumours analysed separately, we observed association between EGFR C expression and the tumour grade – the expression was significantly higher in G3 tumours in comparison to G1, G2 ones (3.88±1.22 vs. 3.45±1.08; P=0.03; Figure 2 D; Table S2).
There Were No Relationships between EGFR mRNA Expression and Clinical-Pathological Data of the Patients
EGFR mRNA expression was assessed using CISH technique. This method made it possible to investigate the EGFR mRNA level specifically in cancer cells, with no interference caused by EGFR expression in the respiratory epithelium. EGFR mRNA was detected in 88/239 (36.82%) of the analysed specimens (Figure 3 A). We observed no association between the number of EGFR mRNA copies per cancer cell and clinical-pathological data of the patients (Table S4).
Expression of SATB1 mRNA Increased with Patients’ Age
We observed SATB1 mRNA expression in 51/239 (21.34%) of the investigated NSCLC cases (Figure 3 B). The further analysis of the obtained results revealed a significant link between SATB1 mRNA expression and the patients’ age. The number of SATB1 mRNA copies per cancer cell was significantly higher in patients over the age of 65 compared to those aged 65 and less. Described relationship was present in the whole NSCLC cohort (0.13±0.44 vs. 0.51±0.88; P<0.001; Figure 4 A), and in the AC subtype analysed separately (0.09±0.34 vs. 0.46±0.79; P<0.001; Figure 4 B). In the LSCC subtype, the differences were on the verge of statistical significance (0.20±0.58 vs. 0.59±1.01; P=0.06). No other associations between the SATB1 mRNA level and clinical-pathological data of the patients were noticed.
The Prognostic Significance of EGFR mRNA Expression Depended on Tumour Histology
To determine the impact of EGFR expression on patients’ survival, Kaplan-Meier’s survival curves were compared using the log-rank (Mantel-Cox) test. The results obtained revealed that EGFR mRNA expression showed no association with patients’ survival in the whole NSCLC cohort. However, statistically significant differences in survival curves were observed in AC and LSCC subtypes analysed separately. In AC tumours, high EGFR mRNA expression (>0.24 mRNA copies/cell) was associated with significantly better patients’ survival (p=0.015; Figure 5 A), whereas in LSCC tumours high EGFR mRNA levels (>0.05 mRNA copies/cell) were correlated with poor prognosis (p=0.046; Figure 5 B).
SATB1 mRNA Expression Was Associated with Better Prognosis for NSCLC Patients
To determine the impact of SATB1 expression on patients’ survival, Kaplan-Meier’s survival curves were compared using the log-rank (Mantel-Cox) test. The results obtained revealed that high SATB1 mRNA expression (more than 2 SATB1 mRNA copies per cancer cell) was associated with a significantly better patients’ prognosis (p=0.012; Figure 5 C). Additionally, we observed a trend towards improved survival in AC patients with SATB1 expression higher than 1 mRNA copy per cancer cell (p=0.062).
In LSCC, Membranous EGFR Expression Was Not Associated with the Level of Any of the Analysed Proteins
The expression of EGFR observed in the membranes of cancer cells only slightly correlated with the expression of the other analysed factors. The correlation between EGFR M level and SATB1 expression was present only in the whole NSCLC cohort (R=0.166; p≤0.001), just like the correlation with SLUG N level (R=0.184; p≤0.001). There was also a weak positive correlation between EGFR M immunostaining and Ki67 expression, observed both in the whole NSCLC cohort and AC subtype (Table 3), and a weak correlation between EGFR M and SNAIL in AC subgroup (Table 3). We observed no significant associations between EGFR M level and the expression of any of the analysed proteins in the LSCC subgroup.
3. Discussion
The importance of EGFR expression in NSCLC result not only from the oncogenic function of this receptor, but also from its role as a significant therapeutic target. EGFR-TKIs are most widely used targeted drugs in lung cancer treatment and often prove to be e the most effective form of treatment for patients with advanced, non-operational tumours. Although effective, therapy with EGFR-TKIs has some serious limitations. First, only the patients with specific EGFR mutations are sensitiv to EGFR inhibition. Second, over time, all develop resistance to EGFR-TKIs. For these reasons, there is an ongoing search for proteins that could potentially regulate EGFR expression and serve as targets for new therapies. We decided to investigate the relationship between the expression of EGFR and SATB1 protein – a potent transcriptional regulator with a known ability to influence EGFR transcription in breast cancer and glioblastoma. We also analysed associations between EGFR level and the expression of EMT-promoting factors SNAIL, SLUG, and Twist1.
We observed EGFR expression in the nuclei, cytoplasm, and membranes of cancer cells. This may seem surprising because EGFR is commonly thought to be a strictly membranous protein. However, the possibility of its nuclear translocation has been known for over 30 years – nuclear EGFR expression was firstobserved in human adrenocortical carcinoma in 1990 [45]. Since then, nuclear EGFR staining has been described in a wide variety of samples, including both normal tissues and malignant tumours [46]. In the cell nucleus, EGFR functions as a transcriptional co-activator, influencing the expression of several oncogenes related to cell proliferation, angiogenesis, and therapy resistance [46,47]. Nuclear EGFR has been described as a negative prognostic factor in numerous tumours, including breast, ovary, oropharynx, and laryngeal cancers [46,48].
In NSCLC, nuclear EGFR expression was previously observed both in AC and LSCC tumours [47,49]. In our research, we noticed significantly higher EGFR N scores in LSCC compared to AC samples. This is in good agreement with Traynor et al., who also reported a higher percentage of cells expressing EGFR N in LSCC when compared to AC specimens [49]. However, they observed an association between EGFR N expression and a higher stage of the disease, whereas our results showed no significant relationship between EGFR N level and patients’ clinical-pathological data. We have also observed no impact of EGFR N expression on patients’ survival. Traynor et al., on the contrary, revealed that EGFR N overexpression was associated with a shorter overall survival of the patients [49]. On the other hand, Wang et al. in their study on AC tumours found that EGFR N expression was significantly associated with the recurrence risk, but not with mortality [47]. These discrepancies are probably due to the differences in the analysed patient cohorts – our study included NSCLC patients regardless of the stage of the disease, while Traynor et al.’s study group consisted of early stage NSCLC tumours, and Wang et al. analysed only AC samples.
In our study, we observed elevated EGFR expression in the cytoplasm of LSCC cells when compared to AC samples. Cytoplasmic EGFR (EGFR C) expression was previously observed in numerous malignancies, including rectal, glottic, pancreatic, and head and neck cancers [50,51,52,53]. In NSCLC, cytoplasmic EGFR staining was observed by several researchers [54,55], but was usually not analysed or analysed together with the membranous EGFR staining as a “total EGFR”. We suppose that EGFR detected in cancer cells’ cytoplasm are soluble EGFR isoforms. It is known that cells are able to produce soluble forms of EGFR (sEGFR), which contain only the extracellular ligand-binding domain but lack the ability to activate the intracellular signalling cascade [56]. These isoforms can be generated by alternative splicing of the EGFR mRNA or by “ectodomain shedding” – the proteolytic cleavage of a transmembrane protein [56]. Soluble EGFR isoforms were detected in the cytoplasm of normal and cancer cells, and in various biological fluids [57]. Unfortunately, their exact biological function remains unclear. It has been found that sEGFR present in the plasma of NSCLC patients is a positive prognostic factor [58,59], probably due to its anti-proliferative properties [60]. However, it has been demonstrated that sEGFR detected directly in NSCLC cells differs from the isoforms present in healthy tissues and plasma [57]. This may suggest that cancer-specific sEGFR has different functions than sEGFR detected in normal cells. In our research, we noticed that cytoplasmic EGFR level in AC samples was associated with tumour grade. This allows us to assume that sEGFR expression in AC cells’ cytoplasm may play a tumour-promoting role.
It has been shown that membranous EGFR expression, although common in NSCLC, has no prognostic value [61,62]. Our results seem to confirm these findings: we had not observed any significant association between EGFR M expression and patients’ survival. However, there was a difference in EGFR M expression in relation to tumour histology: mean EGFR M scores were significantly higher in LSCC compared to those in AC tumours. Our observations are in line with previous results [62,63,64,65,66] and support the findings that EGFR M expression was higher in LSCC than in lung tumours with non-squamous histology.
A unique feature of our study was the analysis of EGFR mRNA expression exclusively in tumour cells with the use of mRNA-based chromogenic in situ hybridization (CISH). Usually, when the gene expression is analysed using RealTime PCR or similar methods, the tissue must be homogenised to isolate the mRNA. As a result, the analysed sample contains a mixture of mRNA from cancer cells and other tissues, such as normal pneumocytes or respiratory epithelium. The use of the CISH method creates the possibility to analyse mRNA expression in the selected cell type, without the interference from the surrounding tissues. Post-hoc analysis of our results revealed significant associations between EGFR mRNA gene expression and patients’ survival. Interestingly, these associations were strictly dependent on tumour histology. In AC, elevated EGFR expression had a positive prognostic significance, whereas in LSCC reverse relationship was observed – high EGFR expression was associated with reduced patients’ survival. Although there are numerous studies analysing relationships between EGFR protein level and clinical-pathological data of NSCLC patients, reports on the EGFR mRNA expression are rather sparse. Our analysis of the AC and LSCC datasets collected in GEPIA [67] and OncoDB [68] gene expression databases revealed no associations between EGFR expression and overall patients’ survival. Moreover, the lack of prognostic significance of EGFR expression was reported also by Yan et al. after the analysis of four NSCLC datasets collected in Oncomine database [69]. Such contradictory results are probably caused by methodological differences between the experiments. Gene expression databases usually contain data from microarray expression studies, whereas our results were obtained using CISH and subsequent digital image analysis.
Besides EGFR, we examined also SATB1 mRNA level in NSCLC cells. Our analysis revealed that SATB1 expression both in AC samples and in the whole NSCLC cohort was significantly associated with patients’ age. SATB1 is already known to be one of the factors regulating the aging process and cellular senescence. However, we are the first to reveal its associations with patients’ age in cancer samples. SATB1 has been shown to play an anti-aging role in human and mouse neurons [70,71,72]. In mouse hypothalamus, SATB1 mRNA expression increased with lifespan [72]. It has been demonstrated that in keratinocytes, SATB1 protects cells from senescence, and that its expression can be regulated by miR-21 and miR-191 microRNAs [73,74]. In our previous study, analysing SATB1 expression in NSCLC samples, we did not observe any relationship between SATB1 protein level and patients’ age [41]. It can be hypothesized that SATB1 expression increases with patients’ age, but its translation into protein is suppressed by miRNA. Furthermore, we observed a positive prognostic significance of SATB1 mRNA expression in NSCLC cells, what stands in line with the previous findings by Selinger et al. [10], and with our own results regarding SATB1 protein expression in NSCLC [41].
The most important finding of our study was that nuclear EGFR expression correlated positively with SATB1 level in NSCLC samples. To date, SATB1 has been shown to upregulate EGFR expression in breast cancer cells (29). In glioblastoma and colorectal cancer cell lines, SATB1 knockdown was demonstrated to decrease EGFR levels [43,44]. However, little is known about the potential SATB1/EGFR relationships in lung cancer cells. We are the first to show a positive correlation between the expression of these proteins in clinical samples. Interestingly, the observed correlations were strongest for the EGFR expressed in cell nuclei. That may suggest a possible regulatory loop between EGFR N and SATB1, or the role of SATB1 in EGFR nuclear translocation. It was recently demonstrated that nuclear translocation of EGFR requires Akt-mediated phosphorylation at Ser-229 [75]. It is known that SATB1, on the one hand, can be activated by Akt-mediated phosphorylation [76], on the other – has the ability to activate PI3K/Akt pathway [76]. It could be then hypothesized that SATB1 contributes to nuclear EGFR localization by activating the PI3K/Akt pathway. Moreover, EGFR is also one of the PI3K/Akt pathway mediators [18], therefore it could theoretically activate SATB1 and protects it from degradation [76]. Further research is needed to investigate this complex network of interdependencies.
Besides the EGFR/SATB1 correlations, we observed also positive relationships between the EGFR level and the expression of EMT-promoting transcription factors, especially SLUG N. The role of EGFR as a factor contributing to EMT was described in numerous cancers. In liver cancer, EGFR was shown to mediate EMT through Akt/GSK-3β/SNAIL pathway activation [76]. In breast cancer cells, EGFR inhibition reversed EMT by SNAIL and Twist1 downregulation [77]. In salivary adenoid cystic carcinoma, EGFR was shown to contribute to EMT by SNAIL and SLUG stabilization [78]. Moreover, EGFR is a known stimulator of SLUG-mediated reepithelialisation during wound healing [78]. It was also observed that EMT is one of the mechanism contributing to acquired EGFR-TKI resistance, but the exact mechanisms remain unknown [79,80]. However, to the best of our knowledge, we are the first to observe the positive correlations between EGFR and SLUG, SNAIL, and Twist1 expression in NSCLC clinical samples. These findings support the role of EGFR as a promoter of EMT in cancer cells..
4. Materials and Methods
Patient Cohort
The present study was approved by the Bioethics Commission at the Wroclaw Medical University in Poland, approval no. 632/2017. A total of 239 NSCLC samples were collected from patients treated in the Lower Silesian Centre of Lung Diseases in Wroclaw during the years 2007-2016. The study group consisted of 149 adenocarcinomas (ACs) and 90 squamous cell carcinomas (LSCCs). For each sample, formalin-fixed paraffin-embedded (FFPE) tissue blocks were prepared. Histological types of the tumours were assessed using the World Health Organization Classification [5] by two independent pathologists, and additionally confirmed by immunohistochemical staining for the marker proteins TTF-1 (Thyroid Transcription Factor-1; AC marker) and p63 (LSCC marker). The pTNM classification was made according to the recommendations of the International Association for the Study of Lung Cancer (IASLC) [81]. The clinical, pathological and survival data were obtained from the hospital archives and are listed in Table 5 and Table 6.
Tissue Microarrays (TMAs)
Tissue microarrays (TMAs) were prepared as previously described [42].
Immunohistochemistry (IHC)
Immunohistochemical reactions were performed on 4-µm-thick paraffin sections using DAKO Autostainer Link48 (Dako; Agilent Technologies, Inc.). First, the slides were deparaffinized in xylene, and rehydrated in decreasing ethanol concentrations (99,8%, 96%, 70%). In order to unmask the antigens, the sections were treated with Proteinase K for 5 minutes at RT. Next, the sections were incubated in EnVision FLEX Peroxidase-Blocking Reagent (5 min at RT) to block the activity of endogenous peroxidase. Afterwards, primary antibodies directed against EGFR (1:50; cat. no. M7239; Clone E30; Dako; Agilent Technologies, Inc.) were applied for 20 min at RT. After washing the sections with EnVision FLEX Wash Buffer, EnVision FLEX/HRP secondary antibodies were applied (20 min, RT). After that, the substrate for peroxidase, 3,3’-diaminobenzidine (DAB), was applied and the sections were incubated for 10 min at RT. Finally, all the specimens were counterstained with FLEX Hematoxylin for 7 min at RT, dehydrated in graded ethanol concentrations (70%, 96%, 99,8%) and xylene, and mounted in Dako Mounting Medium using Coverslipper (Dako; Agilent Technologies, Inc.). All of the reagents used were obtained from Dako (Agilent Technologies).
Evaluation of the IHC Stainings
IHC slides were scanned with the Pannoramic MIDI II (3DHistech) histological scanner and evaluated using the QuantCenter (3DHistech) software. Clusters of cancer cells were distinguished from the other cellular components using PatternQuant software module. Then, MembraneQuant IVD-approved module was used to determine the percentage of positive cells and the staining intensity among the selected tissue compartments only. Membranous expression of EGFR was assessed using the scale ranging from 0 to 3, based on the percentage of positive cells and the reaction intensity (Table 7). Expression of SATB1 and EMT-related proteins (SNAIL, SLUG, Twist1, N-cadherin, and E-cadherin) were evaluated as previously described [41,42].
Chromogenic In Situ Hybridization (CISH)
All of the CISH reagents were components of the ViewRNA™ Tissue Core Kit (Invitrogen, Waltham, MA, USA), unless stated otherwise. CISH was performed on 4-µm thick paraffin sections cut from the TMAs. To deparaffinise the sections, Histo-Clear (National Diagnostics, Atlanta, GA, USA) was used. After the deparaffinization, the slides were washed twice with 100% ethanol and allowed to dry. Then, the slides were immersed in 1x Pretreatment Solution and incubated for 10 minutes in 95°C. To increase the target’s accessibility, protease digestion (20 min, 40°C) was performed. Finally, the sections were fixed for 5 minutes with the 10% solution of the neutral buffered formalin (Sigma-Aldrich, Saint Louis, MO, USA) in PBS (Sigma-Aldrich) and stored overnight at 4°C, immersed in PBS.
The next day, target probe sets were hybridized. The probes used are listed in the Table 8. 18S ribosomal RNA was used as an endogenous control, to ensure the RNA integrity. The robes were prepared according to the manufacturer’s instructions, then the slides were placed in the DAKO Hybridizer (Agilent, Santa Clara, CA, USA) and hybridization was carried out for 2 hours at 40°C. Subsequently, sections were washed thoroughly in Wash Buffer. After that, the Label Probe 1 – AP hybridization (15 min, 40°C ) and Fast Red staining (30 min, RT) were performed. Finally, all the sections were counterstained with Gill’s Hematoxylin No. 1 (Sigma-Aldrich) for 5 minutes at room temperature, allowed to dry, and mounted with ADVANTAGE Mounting Medium (Innovex Biosciences, Richmond, CA, USA).
Evaluation of the CISH Slides
Obtained CISH slides were scanned with the Pannoramic MIDI II scanner and subjected to further digital analysis. To precisely count red dots representing specific mRNA molecules, QuPath [82] software was used. First, the specimens were pre-segmented using a pixel classifier. Then, cancer cells were identified and counted. Finally, individual red dots were counted using an experimental “Subcellular detection” algorithm. Dot clusters were digitally separated into individual particles. The final result is given as the average number of specific mRNA molecules/cancer cell. Our methodology was based on the QuPath analysis guidelines published on the ACD website [83].
Statistical Analysis
The obtained results were analysed using Prism 8.0 (GraphPad Software, La Jolla, CA, USA) and Statistica 13 (StatSoft, Krakow, Poland) statistical software. Shapiro-Wilk test was utilized to determine whether the sample data were normally distributed. To compare the groups of data, a non-parametric Mann-Whitney U test was used. Correlations between the analysed parameters were verified using Spearman’s rank correlation test. Survival times were determined by the Kaplan-Meier method, and the significance of the differences was determined by a log-rank test. All the results were considered statistically significant when the p<0.05.
5. Conclusions
In our work we demonstrated that EGFR expression in non-small cell lung cancer cells was positively associated both with SATB1 level and the expression levels of the EMT-promoting transcription factors. Moreover, we established the role of SATB1 as a positive prognostic factor in NSCLC. We also for the first time analysed EGFR expression exclusively in NSCLC cancer cells without the interference caused by respiratory epithelium and tumour stroma. Our analysis revealed that the prognostic significance of EGFR expression was dependent on tumour histology and differed significantly between AC and LSCC samples.
Supplementary Materials
The following supporting information can be downloaded at the website of this paper posted on Preprints.org., Table S1. Nuclear EGFR expression and clinical-pathological data of NSCLC patients. Table S2. Cytoplasmic EGFR expression and clinical-pathological data of NSCLC patients. Table S3. Membranous EGFR expression and clinical-pathological data of NSCLC patients. Table S4. EGFR mRNA expression and clinical-pathological data of NSCLC patients. Table S5. SATB1 mRNA expression and clinical-pathological data of NSCLC patients.
Author Contributions
Conceptualization, Natalia Glatzel-Plucinska and Piotr Dziegiel; Data curation, Natalia Glatzel-Plucinska and Mateusz Olbromski; Funding acquisition, Natalia Glatzel-Plucinska; Investigation, Natalia Glatzel-Plucinska and Aleksandra Piotrowska; Methodology, Natalia Glatzel-Plucinska and Aleksandra Piotrowska; Resources, Adam Rzechonek; Supervision, Marzenna Podhorska-Okolow and Piotr Dziegiel; Writing – original draft, Natalia Glatzel-Plucinska; Writing – review & editing, Mateusz Olbromski, Adam Rzechonek, Marzenna Podhorska-Okolow and Piotr Dziegiel.
Funding
The work was supported by the National Science Centre, Poland, under research project „The impact of the SATB1 expression on the EGFR level, and the progression of non-small cell lung cancers”, no UMO-2017/25/N/NZ5/01651.
Institutional Review Board Statement
The present study was approved by the Bioethics Commission at the Wroclaw Medical University in Poland, approval no. 632/2017.
Informed Consent Statement
The study was conducted on archival clinical material collected during planned surgical procedures. Patient consent to participate was not required. The manuscript does not contain any personal information about identifiable living patients, therefore patient consent for publication was not necessary.
Data Availability Statement
The original contributions presented in the study are included in the article/supplementary material, further inquiries can be directed to the corresponding author.
Acknowledgments
Not applicable.
Conflicts of Interest
The authors declare no conflicts of interest.
References
- National Center for Health Statistics. National Vital Statistics System, Mortality.
- Ferlay, J.; Ervik, M.; Lam, F.; Laversanne, M.; Colombet, M.; Mery, L.; Pineros, M.; Znaor, A.; Soerjomataram, I.; Bray, F. Cancer Today (Version 1.1). Available online: https://gco.iarc.who.int/today.
- Roser, M.; Ritchie, H. Cancer. Available online: https://ourworldindata.org/cancer.
- Ritchie, H.; Mathieu, E. How Many People Die and How Many Are Born Each Year? Available online: https://ourworldindata.org/births-and-deaths.
- Travis, W.D.; Brambilla, E.; Burke, A.P.; Marx, A.; Nicholson, A.G. WHO Classification of Tumours of the Lung, Pleura, Thymus and Heart; Lyon, France, 2015. [Google Scholar]
- Travis, W.D.; Brambilla, E.; Nicholson, A.G.; Yatabe, Y.; Austin, J.H.M.; Beasley, M.B.; Chirieac, L.R.; Dacic, S.; Duhig, E.; Flieder, D.B.; et al. The 2015 World Health Organization Classification of Lung Tumors: Impact of Genetic, Clinical and Radiologic Advances Since the 2004 Classification. J. Thorac. Oncol. 2015, 10, 1243–1260. [Google Scholar] [CrossRef] [PubMed]
- Zhang, Y.; Vaccarella, S.; Morgan, E.; Li, M.; Etxeberria, J.; Chokunonga, E.; Manraj, S.S.; Kamate, B.; Omonisi, A.; Bray, F. Global Variations in Lung Cancer Incidence by Histological Subtype in 2020: A Population-Based Study. Lancet Oncol. 2023, 24, 1206–1218. [Google Scholar] [CrossRef] [PubMed]
- Rodak, O.; Peris-Díaz, M.D.; Olbromski, M.; Podhorska-Okołów, M.; Dzięgiel, P. Current Landscape of Non-Small Cell Lung Cancer: Epidemiology, Histological Classification, Targeted Therapies, and Immunotherapy. Cancers (Basel). 2021, 13, 4705. [Google Scholar] [CrossRef] [PubMed]
- Stewart, B.W.; Wild, C.P. World Cancer Report 2014; International Agency for Research on Cancer: Lyon, France, 2014. [Google Scholar]
- Selinger, C.I.; Cooper, W.a.; Al-Sohaily, S.; Mladenova, D.N.; Pangon, L.; Kennedy, C.W.; McCaughan, B.C.; Stirzaker, C.; Kohonen-Corish, M.R.J. Loss of Special AT-Rich Binding Protein 1 Expression Is a Marker of Poor Survival in Lung Cancer. J. Thorac. Oncol. 2011, 6, 1179–1189. [Google Scholar] [CrossRef]
- Kołodziej, J.; Marciniak, M. Rak Płuca; I.; Termedia Wydawnictwa Medyczne: Poznań, 2010; ISBN 978-83-62183-31-9. [Google Scholar]
- Ostroverkhova, D.; Przytycka, T.M.; Panchenko, A.R. Cancer Driver Mutations: Predictions and Reality. Trends Mol. Med. 2023, 29, 554–566. [Google Scholar] [CrossRef]
- Chevallier, M.; Borgeaud, M.; Addeo, A.; Friedlaender, A. Oncogenic Driver Mutations in Non-Small Cell Lung Cancer: Past, Present and Future. World J. Clin. Oncol. 2021, 12, 217. [Google Scholar] [CrossRef]
- Jassem, J.; Drosik, K.; Dziaduszko, R.; Kordek, R.; Kozielski, J.; Kowalski, D.; Krzakowski, M.; Nikliński, J.; Olszewski, W.; Orłowski, T.; et al. Systemowe Leczenie Niedrobnokomórkowego Raka Płuc i Złośliwego Międzybłoniaka Opłucnej: Uaktualnione Zalecenia Oparte Na Wynikach Wiarygodnych Badań Klinicznych. Nowotwory. J. Oncol. 2007, 57, 71–78. [Google Scholar]
- Hirsch, F.R.; Scagliotti, G.V.; Mulshine, J.L.; Kwon, R.; Curran, W.J.; Wu, Y.-L.; Paz-Ares, L. Lung Cancer: Current Therapies and New Targeted Treatments. Lancet 2016, 389, 299–311. [Google Scholar] [CrossRef]
- Meza, R.; Meernik, C.; Jeon, J.; Cote, M.L. Lung Cancer Incidence Trends by Gender, Race and Histology in the United States, 1973-2010. PLoS One 2015, 10, e0121323. [Google Scholar] [CrossRef]
- Normanno, N.; De Luca, A.; Bianco, C.; Strizzi, L.; Mancino, M.; Maiello, M.R.; Carotenuto, A.; De Feo, G.; Caponigro, F.; Salomon, D.S. Epidermal Growth Factor Receptor (EGFR) Signaling in Cancer. Gene 2006, 366, 2–16. [Google Scholar] [CrossRef]
- Wang, X.; Goldstein, D.; Crowe, P.J.; Yang, J.-L. Next-Generation EGFR/HER Tyrosine Kinase Inhibitors for the Treatment of Patients with Non-Small-Cell Lung Cancer Harboring EGFR Mutations: A Review of the Evidence. Onco. Targets. Ther. 2016, 9, 5461–5473. [Google Scholar] [CrossRef] [PubMed]
- da Cunha Santos, G.; Shepherd, F.A.; Tsao, M.S. EGFR Mutations and Lung Cancer. Annu. Rev. Pathol. Mech. Dis. 2011, 6, 49–69. [Google Scholar] [CrossRef] [PubMed]
- Zappa, C.; Mousa, S.A. Non-Small Cell Lung Cancer: Current Treatment and Future Advances. Transl. Lung Cancer Res. 2016, 5, 288–300. [Google Scholar] [CrossRef] [PubMed]
- Araki, T.; Kanda, S.; Horinouchi, H.; Ohe, Y. Current Treatment Strategies for EGFR-Mutated Non-Small Cell Lung Cancer: From First Line to beyond Osimertinib Resistance. Jpn. J. Clin. Oncol. 2023, 53, 547–561. [Google Scholar] [CrossRef]
- Cross, D.A.E.; Ashton, S.E.; Ghiorghiu, S.; Eberlein, C.; Nebhan, C.A.; Spitzler, P.J.; Orme, J.P.; Finlay, M.R.V.; Ward, R.A.; Mellor, M.J.; et al. AZD9291, an Irreversible EGFR TKI, Overcomes T790M-Mediated Resistance to EGFR Inhibitors in Lung Cancer. Cancer Discov. 2014, 4, 1046–1061. [Google Scholar] [CrossRef]
- Oxnard, G.R.; Hu, Y.; Mileham, K.F.; Husain, H.; Costa, D.B.; Tracy, P.; Feeney, N.; Sholl, L.M.; Dahlberg, S.E.; Redig, A.J.; et al. Assessment of Resistance Mechanisms and Clinical Implications in Patients With EGFR T790M–Positive Lung Cancer and Acquired Resistance to Osimertinib. JAMA Oncol. 2018, 4, 1527–1534. [Google Scholar] [CrossRef]
- Tan, A.C.; Tan, D.S.W. Targeted Therapies for Lung Cancer Patients With Oncogenic Driver Molecular Alterations. J. Clin. Oncol. 2022, 40, 611–625. [Google Scholar] [CrossRef]
- Keedy, V.L.; Temin, S.; Somerfield, M.R.; Beasley, M.B.; Johnson, D.H.; McShane, L.M.; Milton, D.T.; Strawn, J.R.; Wakelee, H.A.; Giaccone, G. American Society of Clinical Oncology Provisional Clinical Opinion: Epidermal Growth Factor Receptor (EGFR) Mutation Testing for Patients with Advanced Non-Small-Cell Lung Cancer Considering First-Line EGFR Tyrosine Kinase Inhibitor Therapy. J. Clin. Oncol. 2011, 29, 2121–2127. [Google Scholar] [CrossRef]
- Wang, F.; Fu, S.; Shao, Q.; Zhou, Y.-B.; Zhang, X.; Zhang, X.; Xue, C.; Lin, J.-G.; Huang, L.-X.; Zhang, L.; et al. High EGFR Copy Number Predicts Benefits from Tyrosine Kinase Inhibitor Treatment for Non-Small Cell Lung Cancer Patients with Wild-Type EGFR. J. Transl. Med. 2013, 11, 90. [Google Scholar] [CrossRef]
- Xu, N.; Fang, W.; Mu, L.; Tang, Y.; Gao, L.; Ren, S.; Cao, D.; Zhou, L.; Zhang, A.; Liu, D.; et al. Overexpression of Wildtype EGFR Is Tumorigenic and Denotes a Therapeutic Target in Non-Small Cell Lung Cancer. Oncotarget 2016, 7, 3884–3896. [Google Scholar] [CrossRef]
- Brandt, B.; Meyer-Staeckling, S.; Schmidt, H.; Agelopoulos, K.; Buerger, H. Mechanisms of Egfr Gene Transcription Modulation: Relationship to Cancer Risk and Therapy Response. Clin. Cancer Res. 2006, 12, 7252–7260. [Google Scholar] [CrossRef] [PubMed]
- Han, H.-J.; Russo, J.; Kohwi, Y.; Kohwi-Shigematsu, T. SATB1 Reprogrammes Gene Expression to Promote Breast Tumour Growth and Metastasis. Nature 2008, 452, 187–193. [Google Scholar] [CrossRef] [PubMed]
- Kohwi-Shigematsu, T.; Kohwi, Y.; Takahashi, K.; Richards, H.W.; Ayers, S.D.; Han, H.-J.; Cai, S. SATB1-Mediated Functional Packaging of Chromatin into Loops. Methods 2012, 58, 243–254. [Google Scholar] [CrossRef] [PubMed]
- Galande, S.; Purbey, P.K.; Notani, D.; Kumar, P.P. The Third Dimension of Gene Regulation: Organization of Dynamic Chromatin Loopscape by SATB1. Curr. Opin. Genet. Dev. 2007, 17, 408–414. [Google Scholar] [CrossRef] [PubMed]
- Kohwi-Shigematsu, T.; Poterlowicz, K.; Ordinario, E.; Han, H.-J.; Botchkarev, V.A.; Kohwi, Y. Genome Organizing Function of SATB1 in Tumor Progression. Semin. Cancer Biol. 2013, 23, 72–79. [Google Scholar] [CrossRef]
- Huang, B.O.; Zhou, H.; Wang, S.; Lang, X.P.; Wang, X. Effect of Silencing SATB1 on Proliferation, Invasion and Apoptosis of A549 Human Lung Adenocarcinoma Cells. Oncol. Lett. 2016, 12, 3818–3824. [Google Scholar] [CrossRef]
- Wan, F.; Cheng, C.; Wang, Z.; Xiao, X.; Zeng, H.; Xing, S.; Chen, X.; Wang, J.; Li, S.; Zhang, Y.; et al. SATB1 Overexpression Regulates the Development and Progression in Bladder Cancer through EMT. PLoS One 2015, 10, 1–20. [Google Scholar] [CrossRef]
- Li, Q.-Q.; Chen, Z.-Q.; Cao, X.-X.; Xu, J.-W.J.-D.J.-W.J.-D.J.-W.; Xu, J.-W.J.-D.J.-W.J.-D.J.-W.; Chen, Y.-Y.; Wang, W.-J.; Chen, Q.; Tang, F.; Liu, X.-P.; et al. Involvement of NF-ΚB/MiR-448 Regulatory Feedback Loop in Chemotherapy-Induced Epithelial-Mesenchymal Transition of Breast Cancer Cells. Cell Death Differ. 2011, 18, 16–25. [Google Scholar] [CrossRef]
- Lv, J.H.; Wang, F.; Shen, M.H.; Wang, X.; Zhou, X.J.; Zhou, X.J.; Yanfen-Wang; Shen, M.H.; Wang, X.; Zhou, X.J.; et al. SATB1 Expression Is Correlated with Betha-Catenin Associated Epithelial-Mesenchymal Transition in Colorectal Cancer. Cancer Biol. Ther. 2016, 17, 254–261. [CrossRef]
- Hanker, L.C.; Karn, T.; Mavrova-Risteska, L.; Ruckhäberle, E.; Gaetje, R.; Holtrich, U.; Kaufmann, M.; Rody, A.; Wiegratz, I. SATB1 Gene Expression and Breast Cancer Prognosis. The Breast 2011, 20, 309–313. [Google Scholar] [CrossRef]
- Zhang, Y.; Tian, X.; Ji, H.; Guan, X.; Xu, W.; Dong, B.; Zhao, M.; Wei, M.; Ye, C.; Sun, Y.; et al. Expression of SATB1 Promotes the Growth and Metastasis of Colorectal Cancer. PLoS One 2014, 9, e100413. [Google Scholar] [CrossRef] [PubMed]
- Shukla, S.; Sharma, H.; Abbas, A.; MacLennan, G.T.; Fu, P.; Danielpour, D.; Gupta, S. Upregulation of SATB1 Is Associated with Prostate Cancer Aggressiveness and Disease Progression. PLoS One 2013, 8, e53527. [Google Scholar] [CrossRef] [PubMed]
- Nodin, B.; Hedner, C.; Uhlén, M.; Jirström, K. Expression of the Global Regulator SATB1 Is an Independent Factor of Poor Prognosis in High Grade Epithelial Ovarian Cancer. J. Ovarian Res. 2012, 5, 24. [Google Scholar] [CrossRef]
- Glatzel-Plucinska, N.; Piotrowska, A.; Grzegrzolka, J.; Olbromski, M.; Rzechonek, A.; Dziegiel, P.; Podhorska-Okolow, M. SATB1 Level Correlates with Ki-67 Expression and Is a Positive Prognostic Factor in Non-Small Cell Lung Carcinoma. Anticancer Res. 2018, 38, 723–736. [Google Scholar] [CrossRef] [PubMed]
- Glatzel-Plucinska, N.; Piotrowska, A.; Rzechonek, A.; Podhorska-Okolow, M.; Dziegiel, P. SATB1 Protein Is Associated with the Epithelial-Mesenchymal Transition Process in Non-Small Cell Lung Cancers. Oncol. Rep. 2021, 45, 1–18. [Google Scholar] [CrossRef] [PubMed]
- Frömberg, A.; Rabe, M.; Oppermann, H.; Gaunitz, F.; Aigner, A. Analysis of Cellular and Molecular Antitumor Effects upon Inhibition of SATB1 in Glioblastoma Cells. BMC Cancer 2017, 17, 3. [Google Scholar] [CrossRef] [PubMed]
- Frömberg, A.; Rabe, M.; Aigner, A. Multiple Effects of the Special AT-Rich Binding Protein 1 (SATB1) in Colon Carcinoma. Int. J. cancer 2014, 135, 2537–2546. [Google Scholar] [CrossRef]
- Kamio, T.; Shigematsu, K.; Sou, H.; Kawai, K.; Tsuchiyama, H. Immunohistochemical Expression of Epidermal Growth Factor Receptors in Human Adrenocortical Carcinoma. Hum. Pathol. 1990, 21, 277–282. [Google Scholar] [CrossRef]
- Brand, T.M.; Iida, M.; Li, C.; Wheeler, D.L. The Nuclear Epidermal Growth Factor Receptor Signaling Network and Its Role in Cancer. Discov. Med. 2011, 12, 419–432. [Google Scholar]
- Wang, J.L.; Fang, C.L.; Tzeng, Y.T.; Hsu, H.L.; Lin, S.E.; Yu, M.C.; Bai, K.J.; Wang, L.S.; Liu, H.E. Prognostic Value of Localization of Epidermal Growth Factor Receptor in Lung Adenocarcinoma. J. Biomed. Sci. 2018, 25, 1–8. [Google Scholar] [CrossRef]
- Marijić, B.; Braut, T.; Babarović, E.; Krstulja, M.; Maržić, D.; Avirović, M.; Kujundžić, M.; Hadžisejdić, I. Nuclear EGFR Expression Is Associated with Poor Survival in Laryngeal Carcinoma. Appl. Immunohistochem. Mol. Morphol. 2021, 29, 576–584. [Google Scholar] [CrossRef] [PubMed]
- Traynor, A.M.; Weigel, T.L.; Oettel, K.R.; Yang, D.T.; Zhang, C.; Kim, K.; Salgia, R.; Iida, M.; Brand, T.M.; Hoang, T.; et al. Nuclear EGFR Protein Expression Predicts Poor Survival in Early Stage Non-Small Cell Lung Cancer. Lung Cancer 2013, 81, 138–141. [Google Scholar] [CrossRef] [PubMed]
- Yang, C.C.; Lin, L.C.; Lin, Y.W.; Tian, Y.F.; Lin, C.Y.; Sheu, M.J.; Li, C.F.; Tai, M.H. Higher Nuclear EGFR Expression Is a Better Predictor of Survival in Rectal Cancer Patients Following Neoadjuvant Chemoradiotherapy than Cytoplasmic EGFR Expression. Oncol. Lett. 2019, 17, 1551. [Google Scholar] [CrossRef] [PubMed]
- Braut, T.; Krstulja, M.; Rukavina, K.M.; Jonjić, N.; Kujundžić, M.; Manestar, I.D.; Katunarić, M.; Manestar, D. Cytoplasmic EGFR Staining and Gene Amplification in Glottic Cancer: A Better Indicator of EGFR-Driven Signaling? Appl. Immunohistochem. Mol. Morphol. 2014, 22, 674–680. [Google Scholar] [CrossRef]
- Saloura, V.; Vougiouklakis, T.; Zewde, M.; Deng, X.; Kiyotani, K.; Park, J.H.; Matsuo, Y.; Lingen, M.; Suzuki, T.; Dohmae, N.; et al. WHSC1L1-Mediated EGFR Mono-Methylation Enhances the Cytoplasmic and Nuclear Oncogenic Activity of EGFR in Head and Neck Cancer. Sci. Rep. 2017, 7, 40664. [Google Scholar] [CrossRef]
- Ueda, S.; Ogata, S.; Tsuda, H.; Kawarabayashi, N.; Kimura, M.; Sugiura, Y.; Tamai, S.; Matsubara, O.; Hatsuse, K.; Mochizuki, H. The Correlation Between Cytoplasmic Overexpression of Epidermal Growth Factor Receptor and Tumor Aggressiveness. Poor Prognosis in Patients With Pancreatic Ductal Adenocarcinoma. J. Neuroendocr. Tumous Pancreat. Dis. Sci. 2004, 29, e1–e8. [Google Scholar]
- Tsao, A.S.; Ming Tang, X.; Sabloff, B.; Lianchun, X.; Shigematsu, H.; Roth, J.; Spitz, M.; Ki Hong, W.; Gazdar, A.; Wistuba, I. Clinicopathologic Characteristics of the EGFR Gene Mutation in Non–Small Cell Lung Cancer. J. Thorac. Oncol. 2006, 1, 231–239. [Google Scholar] [CrossRef]
- Italiano, A.; Burel Vandenbos, F.; Otto, J. Mouroux, D.; Fontaine, D.; Marcy, P.-Y.; Cardot, N.; Thyss, A.; Pedeutour, F. Comparison of the Epidermal Growth Factor Receptor Gene and Protein in Primary Non-Small-Cell-Lung Cancer and Metastatic Sites: Implications for Treatment with EGFR-Inhibitors. Ann. Oncol. 2006, 17, 981–985. [Google Scholar] [CrossRef]
- Maramotti, S.; Paci, M.; Manzotti, G.; Rapicetta, C.; Gugnoni, M.; Galeone, C.; Cesario, A.; Lococo, F. Soluble Epidermal Growth Factor Receptors (SEGFRs) in Cancer: Biological Aspects and Clinical Relevance. Int. J. Mol. Sci. 2016, 17, 593. [Google Scholar] [CrossRef]
- Maramotti, S.; Paci, M.; Miccichè, F.; Ciarrocchi, A.; Cavazza, A.; De Bortoli, M.; Vaghi, E.; Formisano, D.; Canovi, L.; Sgarbi, G.; et al. Soluble Epidermal Growth Factor Receptor Isoforms in Non-Small Cell Lung Cancer Tissue and in Blood. Lung Cancer 2012, 76, 332–338. [Google Scholar] [CrossRef]
- Jantus-Lewintre, E.; Sirera, R.; Cabrera, A.; Blasco, A.; Caballero, C.; Iranzo, V.; Rosell, R.; Camps, C. Analysis of the Prognostic Value of Soluble Epidermal Growth Factor Receptor Plasma Concentration in Advanced Non–Small-Cell Lung Cancer Patients. Clin. Lung Cancer 2011, 12, 320–327. [Google Scholar] [CrossRef] [PubMed]
- Ye, P.; Zhao, J.; Wang, S.; Ming Kong, F. The Plasma Level of Soluble Epidermal Growth Factor Receptor (EGFR) and Overall Survival (OS) in Non-Small-Cell Lung Cancer (NSCLC) Patients. J. Clin. Oncol. 2015, 33, e19091. [Google Scholar] [CrossRef]
- Lococo, F.; Paci, M.; Rapicetta, C.; Rossi, T.; Sancisi, V.; Braglia, L.; Cavuto, S.; Bisagni, A.; Bongarzone, I.; Noonan, D.M.; et al. Preliminary Evidence on the Diagnostic and Molecular Role of Circulating Soluble EGFR in Non-Small Cell Lung Cancer. Int. J. Mol. Sci. 2015, 16, 19612–19630. [Google Scholar] [CrossRef] [PubMed]
- Meert, A.-P.; Martin, B.; Delmotte, P.; Berghmans, T.; Lafitte, J.-J.; Mascaux, C.; Paesmans, M.; Steels, E.; Verdebout, J.-M.; Sculier, J.-P. The Role of EGF-R Expression on Patient Survival in Lung Cancer: A Systematic Review with Meta-Analysis. Eur. Respir. J. 2002, 20, 975–981. [Google Scholar] [CrossRef] [PubMed]
- Nakamura, H.; Kawasaki, N.; Taguchi, M.; Kabasawa, K. Survival Impact of Epidermal Growth Factor Receptor Overexpression in Patients with Non-small Cell Lung Cancer: A Meta-analysis. Thorax 2006, 61, 140–145. [Google Scholar] [CrossRef]
- Cengiz Seyhan, E.; Altin, S.; Cetinkaya, E.; Sokucu, S.; Abali, H.; Buyukpinarbasili, N.; Fener, N. Prognostic Value of Epidermal Growth Factor Receptor Expression in Operable Non-Small Cell Lung Carcinoma. Multidiscip. Respir. Med. 2010, 5, 305–311. [Google Scholar] [CrossRef]
- Fontanini, G.; Vignati, S.; Bigini, D.; Mussi, A.; Lucchi, H.; Angeletti, A.; Pingitore, R.; Pepe, S.; Basolo, F.; Bevilacqua, G. Epidermal Growth Factor Receptor (EGFr) Expression in Non-Small Cell Lung Carcinomas Correlates with Metastatic Involvement of Hilar and Mediastinal Lymph Nodes in the Squamous Subtype. Eur. J. Cancer 1995, 31A, 178–183. [Google Scholar] [CrossRef]
- Gately, K.; Forde, L.; Cuffe, S.; Cummins, R.; Kay, E.W.; Feuerhake, F.; O’Byrne, K.J. High Coexpression of Both EGFR and IGF1R Correlates with Poor Patient Prognosis in Resected Non-Small-Cell Lung Cancer. Clin. Lung Cancer 2014, 15, 58–66. [Google Scholar] [CrossRef]
- Hirsch, F.R.; Varella-Garcia, M.; Bunn, P.A., Jr.; Di Maria, M.V.; Veve, R.; Bremmes, R.M.; Baron, A.E.; Zeng, C.; Franklin, W.A. Epidermal Growth Factor Receptor in Non-Small-Cell Lung Carcinomas: Correlation between Gene Copy Number and Protein Expression and Impact on Prognosis. J. Clin. Oncol. 2003, 21, 3798–3807. [Google Scholar] [CrossRef]
- Tang, Z.; Li, C.; Kang, B.; Gao, G.; Li, C.; Zhang, Z. GEPIA: A Web Server for Cancer and Normal Gene Expression Profiling and Interactive Analyses. Nucleic Acids Res. 2017, 45, W98–W102. [Google Scholar] [CrossRef]
- Tang, G.; Cho, M.; Wang, X. OncoDB: An Interactive Online Database for Analysis of Gene Expression and Viral Infection in Cancer. Nucleic Acids Res. 2022, 50, D1334–D1339. [Google Scholar] [CrossRef] [PubMed]
- Yan, G.; Saeed, M.E.M.; Foersch, S.; Schneider, J.; Roth, W.; Efferth, T. Relationship between EGFR Expression and Subcellular Localization with Cancer Development and Clinical Outcome. Oncotarget 2019, 10, 1918–1931. [Google Scholar] [CrossRef] [PubMed]
- Russo, T.; Kollisnyk, B.; Aswathy, B.S.; Wan Kim, T.; Martin, J.; Plessis-Belair, J.; Ni, J.; Pearson, J.A.; Park, E.J.; Sher, R.B.; et al. The SATB1-MIR22-GBA Axis Mediates Glucocerebroside Accumulation Inducing a Cellular Senescence-like Phenotype in Dopaminergic Neurons, 2023.
- Riessland, M.; Kolisnyk, B.; Wan Kim, T.; Cheng, J.; Ni, J.; Pearson, J.A.; Park, E.J.; Dam, K.; Acehan, D.; Ramos-Espiritu, L.S.; et al. Loss of SATB1 Induces P21-Dependent Cellular Senescence in Post-Mitotic Dopaminergic Neurons. Cell Stem Cell 2019, 25, 514–530. [Google Scholar] [CrossRef] [PubMed]
- Zhang, M.; Poplawski, M.; Yen, K.; Cheng, H.; Bloss, E.; Zhu, X.; Patel, H.; Mobbs, C.V. Role of CBP and SATB-1 in Aging, Dietary Restriction, and Insulin-like Signaling. PLoS Biol. 2009, 7, e1000245. [Google Scholar] [CrossRef]
- Ahmed, M.I.; Pickup, M.E.; Rimmer, A.G.; Alam, M.; Mardaryev, A.N.; Poterlowicz, K.; Botchkareva, N.V.; Botchkarev, V.A. Interplay of MicroRNA-21 and SATB1 in Epidermal Keratinocytes during Skin Aging. J Invest Dermatol 2020, 139, 2538–2542. [Google Scholar] [CrossRef]
- Lena, A.M.; Mancini, M.; Rivetti di Val Cervo, P.; Saintigny, G.; Mahé, C.; Melino, G.; Candi, E.; Mahe, C.; Melino, G.; Candi, E. MicroRNA-191 Triggers Keratinocytes Senescence by SATB1 and CDK6 Downregulation. Biochem Biophys Res Commun 2012, 423, 1763–1768. [Google Scholar] [CrossRef]
- Huang, W.-C.; Chen, Y.-J.; Li, L.-Y.; Wei, Y.-L.; Hsu, S.-C.; Tsai, S.-L.; Chiu, P.-C.; Huang, W.-P.; Wang, Y.-N.; Chen, C.-H.; et al. Nuclear Translocation of Epidermal Growth Factor Receptor by Akt-Dependent Phosphorylation Enhances Breast Cancer-Resistant Protein Expression in Gefitinib-Resistant Cells. J. Biol. Chem. 2011, 286, 20558–20568. [Google Scholar] [CrossRef]
- Chen, B.; Xue, Z.; Yang, G.; Shi, B.; Yang, B.; Yan, Y.; Wang, X.; Han, D.; Huang, Y.; Dong, W. Akt-Signal Integration Is Involved in the Differentiation of Embryonal Carcinoma Cells. PLoS One 2013, 8, e64877. [Google Scholar] [CrossRef]
- Takeda, T.; Tsubaki, M.; Matsuda, T.; Kimura, A.; Jinushi, M.; Obana, T.; Takegami, M.; Nishida, S. EGFR Inhibition Reverses Epithelial-mesenchymal Transition, and Decreases Tamoxifen Resistance via Snail and Twist Downregulation in Breast Cancer Cells. Oncol. Rep. 2022, 47, 1–13. [Google Scholar] [CrossRef]
- Kusewitt, D.F.; Choi, C.; Newkirk, K.M.; Leroy, P.; Li, Y.; Chavez, M.G.; Hudson, L.G. Slug/Snai2 Is a Downstream Mediator of Epidermal Growth Factor Receptor-Stimulated Reepithelialization. J. Invest. Dermatol. 2009, 129, 491–495. [Google Scholar] [CrossRef]
- Bronte, G.; Bravaccini, S.; Bronte, E.; Burgio, M.A.; Rolfo, C.; Delmonte, A.; Crinò, L. Epithelial-to-Mesenchymal Transition in the Context of Epidermal Growth Factor Receptor Inhibition in Non-Small-Cell Lung Cancer. Biol. Rev. 2018, 93, 1735–1746. [Google Scholar] [CrossRef] [PubMed]
- Jakobsen, K.R.; Demuth, C.; Sorensen, B.S.; Nielsen, A.L. The Role of Epithelial to Mesenchymal Transition in Resistance to Epidermal Growth Factor Receptor Tyrosine Kinase Inhibitors in Non-Small Cell Lung Cancer. Transl. lung cancer Res. 2016, 5, 172–182. [Google Scholar] [CrossRef] [PubMed]
- International Association for the Study of Lung Cancer. Staging Manual in Thoracic Oncology, 2nd ed.; 2016; ISBN 978-0-9832958-6-0. [Google Scholar]
- Bankhead, P.; Loughrey, M.B.; Fernández, J.A.; Dombrowski, Y.; McArt, D.G.; Dunne, P.D.; McQuaid, S.; Gray, R.T.; Murray, L.J.; Coleman, H.G.; et al. QuPath: Open Source Software for Digital Pathology Image Analysis. Sci. Rep. 2017, 7, 1–7. [Google Scholar] [CrossRef] [PubMed]
- ACD. Technical Notes. 2020; pp. 1–26. [Google Scholar]
Figure 1.
Immunohistochemical staining for EGFR expression in non-small cell lung cancer specimens and non-malignant lung tissues. EGFR was expressed in the nuclei (A), cytoplasm (B), and membranes (C) of cancer cells. EGFR expression was also observed in the basal layer of non-malignant respiratory epithelium (D). There was no EGFR expression in the non-malignant lung pneumocytes (E) or infiltrating lymphocytes (F).
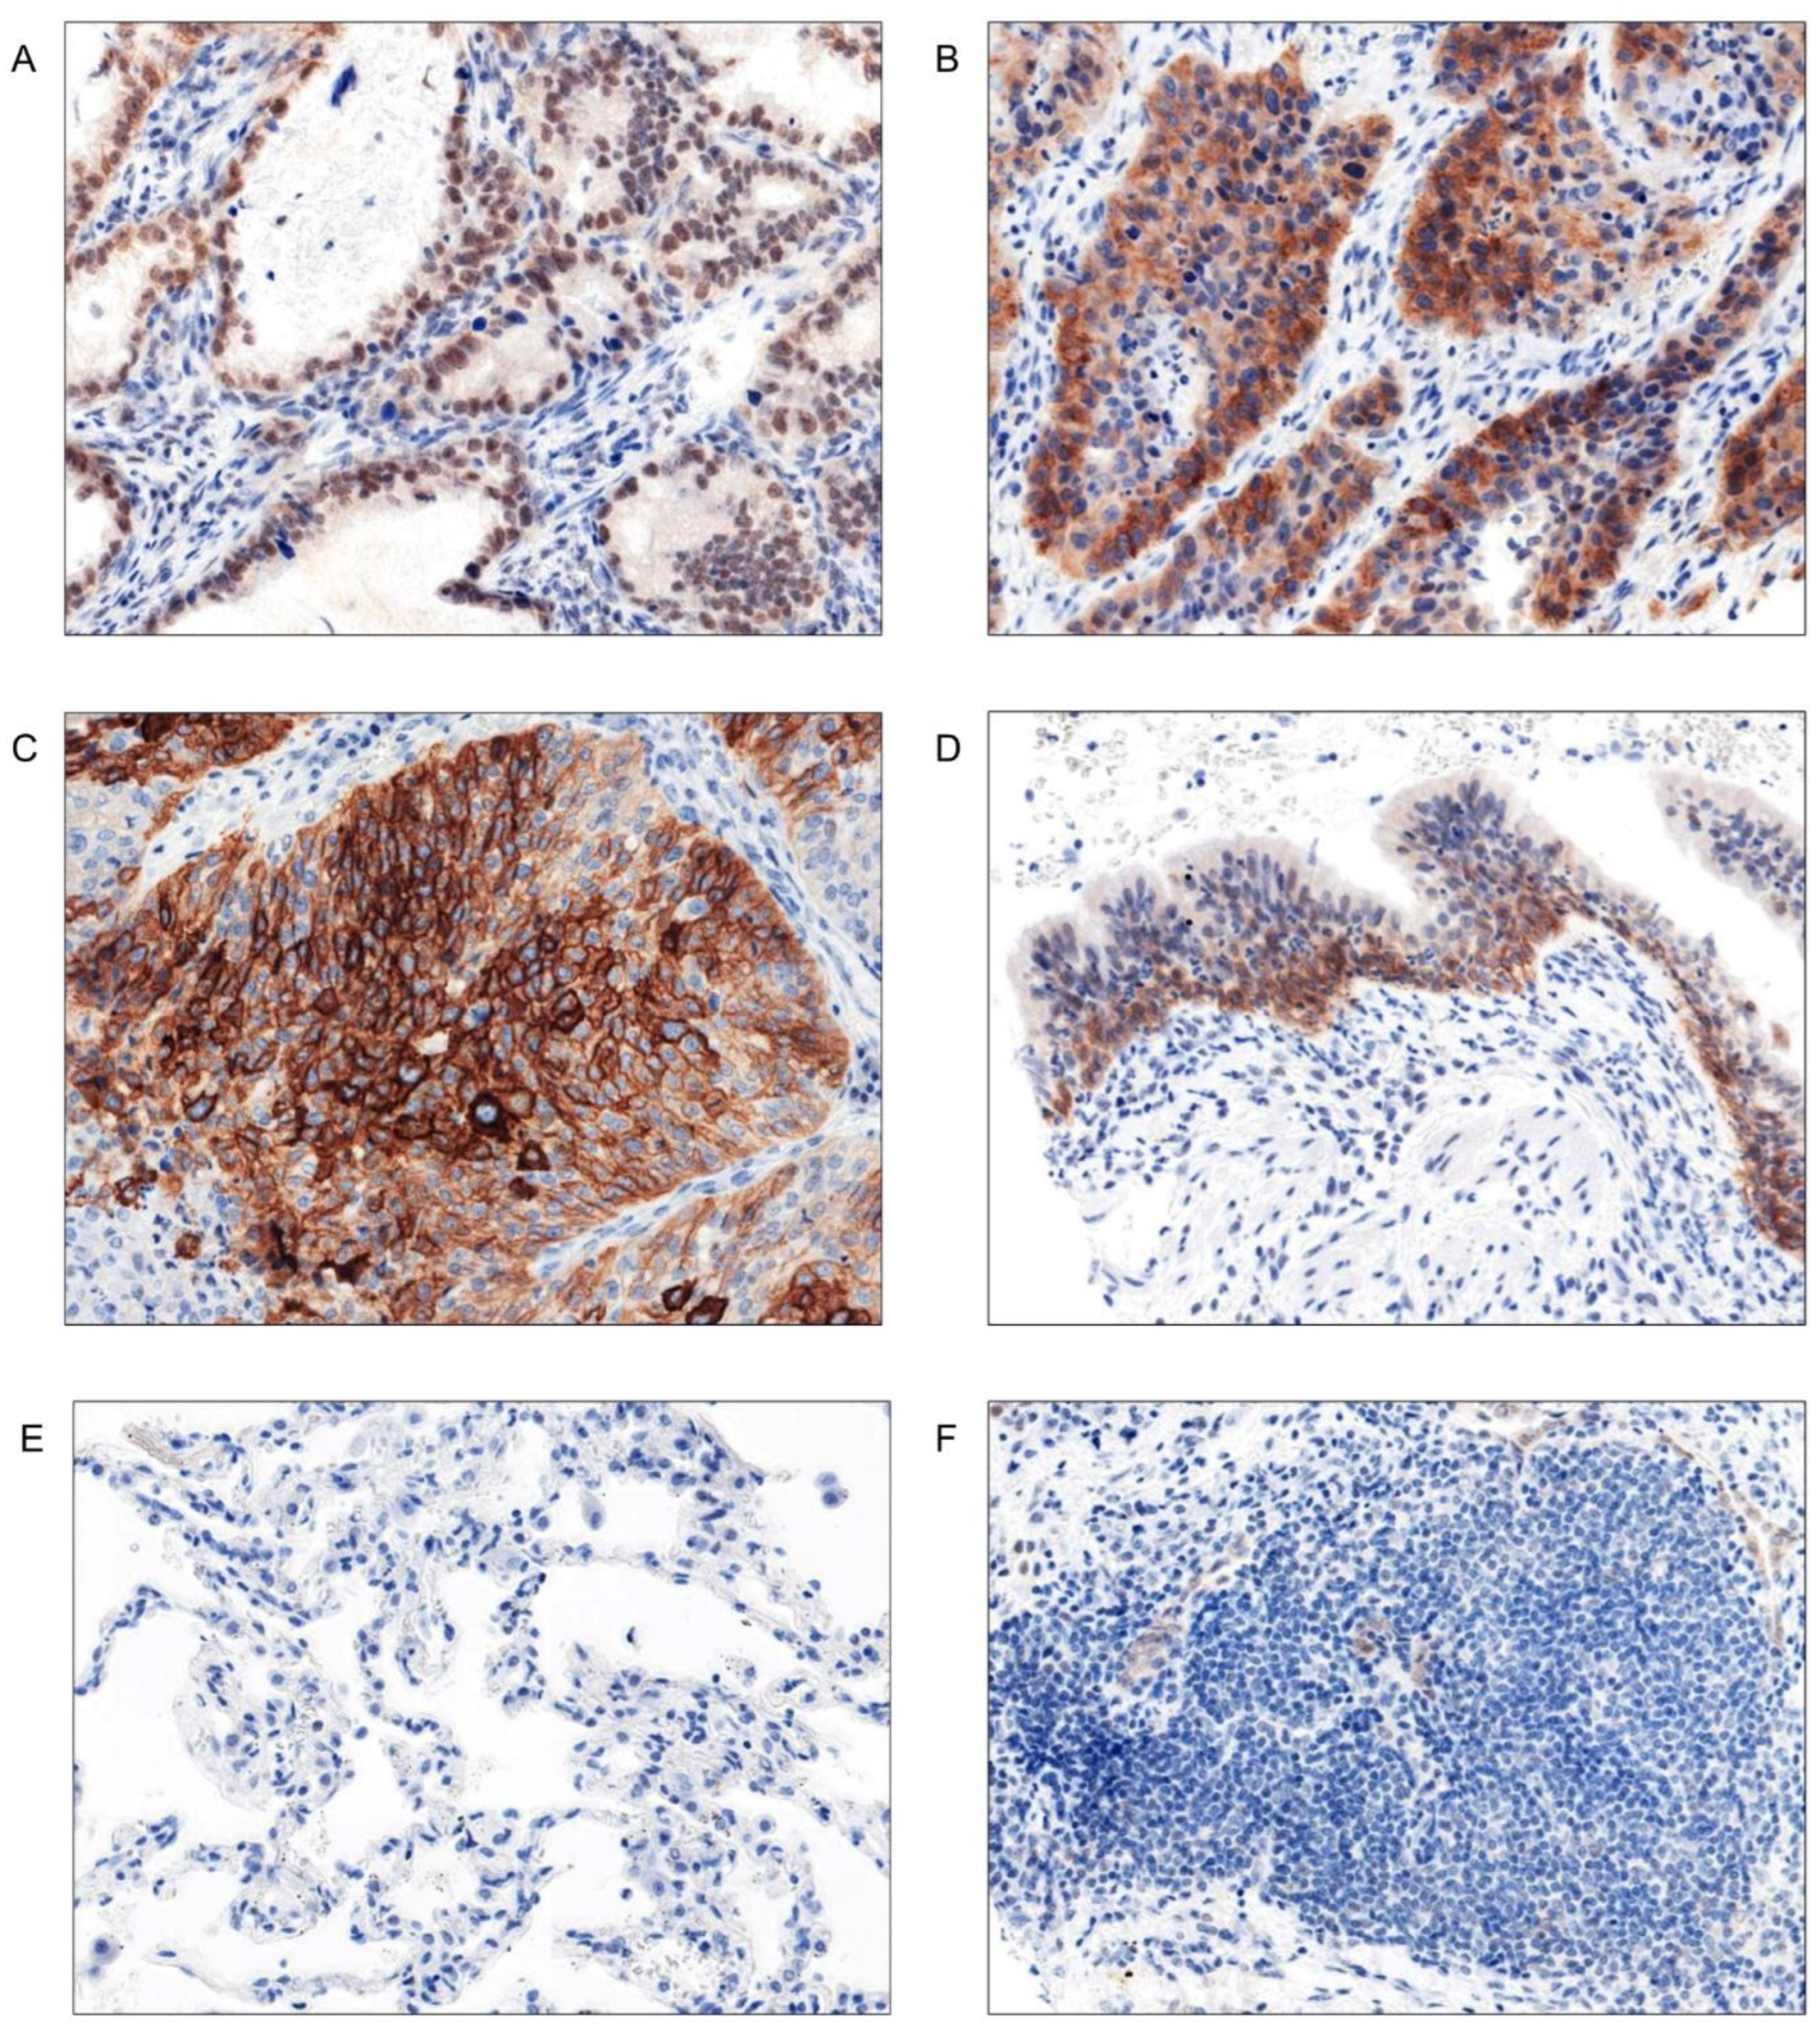
Figure 2.
EGFR protein expression in non-small cell lung cancer specimens. Immunohistochemical staining for EGFR protein, followed by digital analysis of obtained slides, revealed that EGFR expression was significantly higher in the nuclei (A), cytoplasm (B), and membranes (C) of LSCC cells when compared to AC samples. Moreover, in AC specimens we observed an association between EGFR expression and tumour grade – EGFR scores were significantly higher in G3 compare to G1 and G2 tumours combined (D). AC - adenocarcinoma; LSCC - squamous cell carcinoma; * - p≤0.05; *** - p≤0.001.
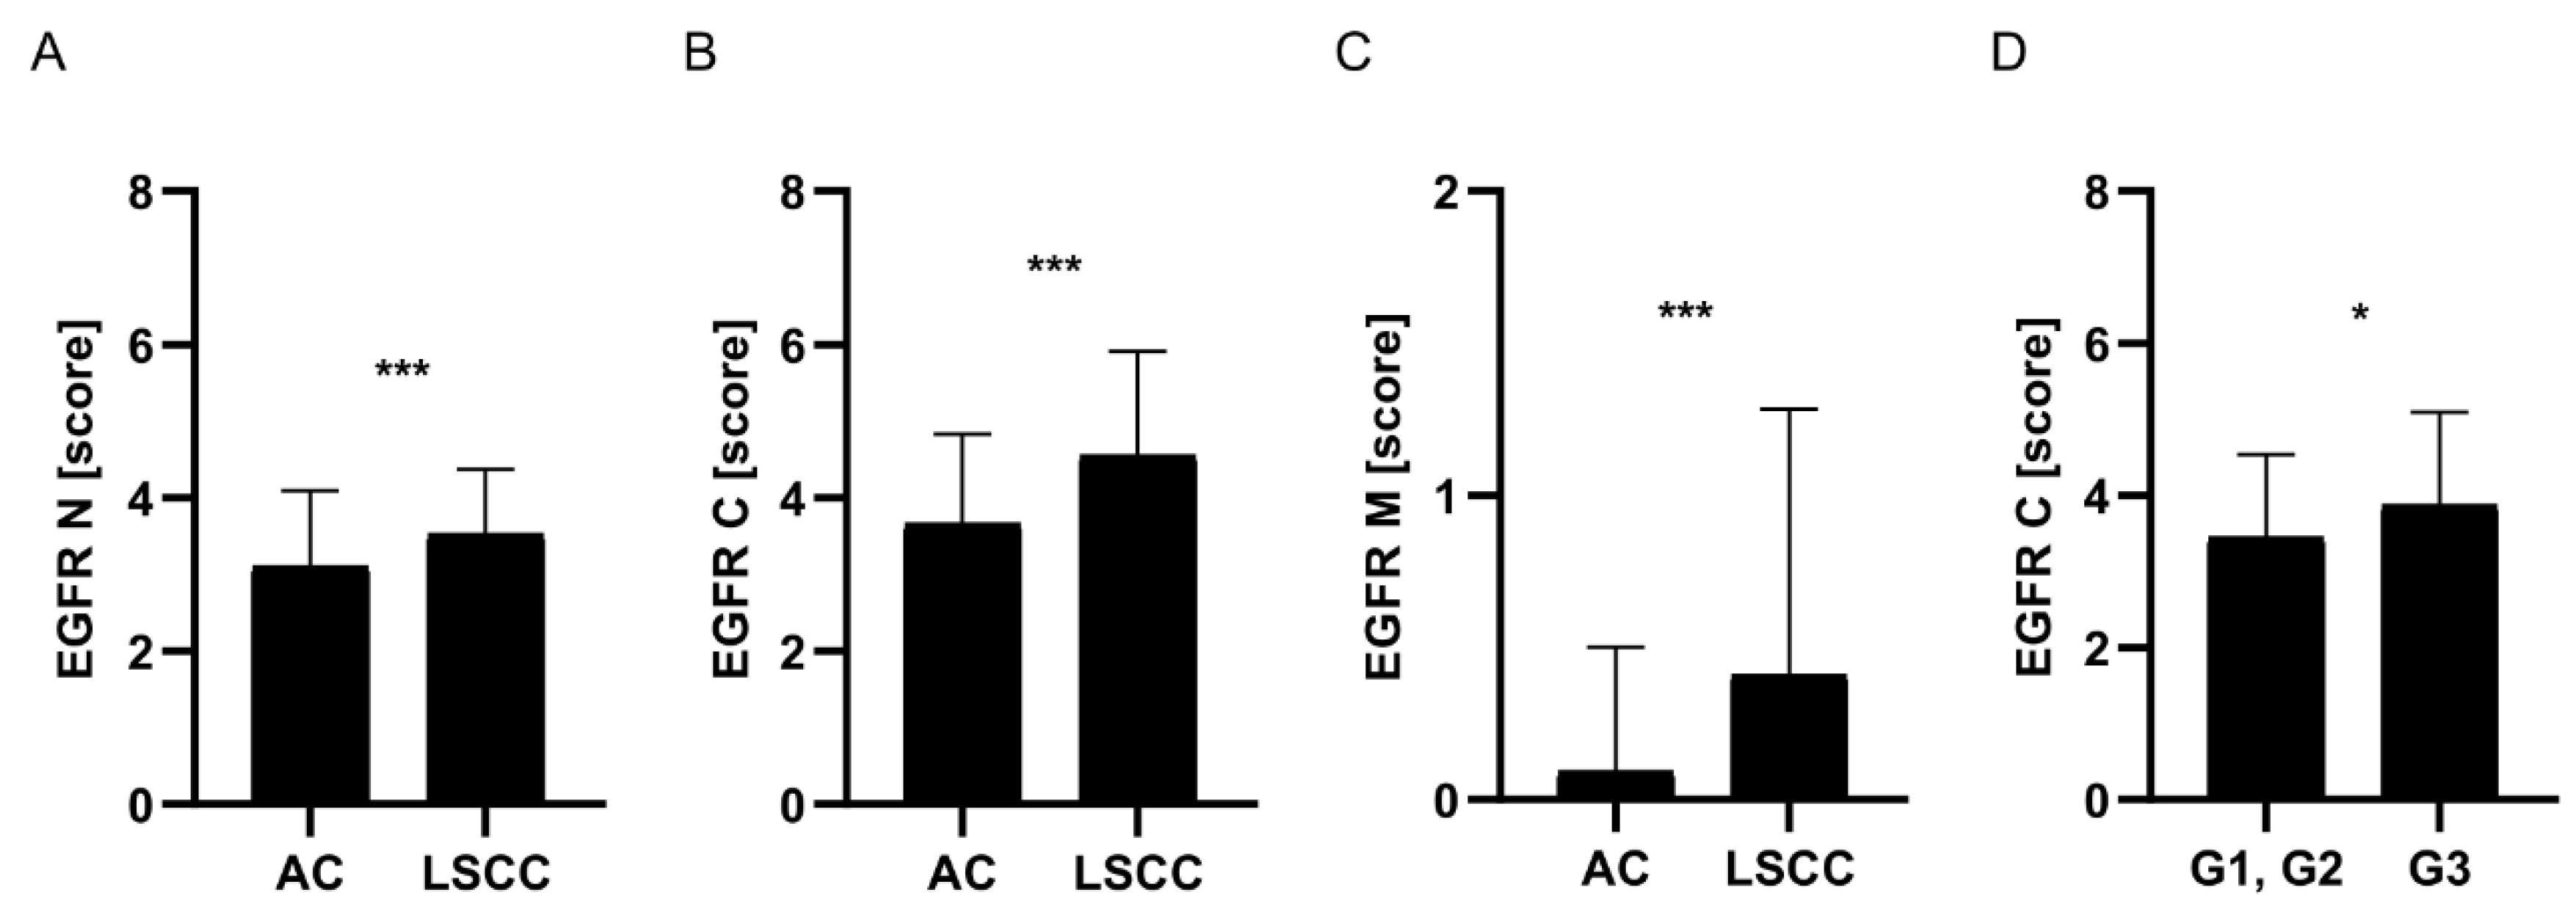
Figure 3.
EGFR mRNA (A), SATB1 mRNA (B), and 18S RNA (C) expression in non-small cell lung cancer cells, assessed using CISH technique. Each red dot represents a target RNA molecule.
Figure 3.
EGFR mRNA (A), SATB1 mRNA (B), and 18S RNA (C) expression in non-small cell lung cancer cells, assessed using CISH technique. Each red dot represents a target RNA molecule.
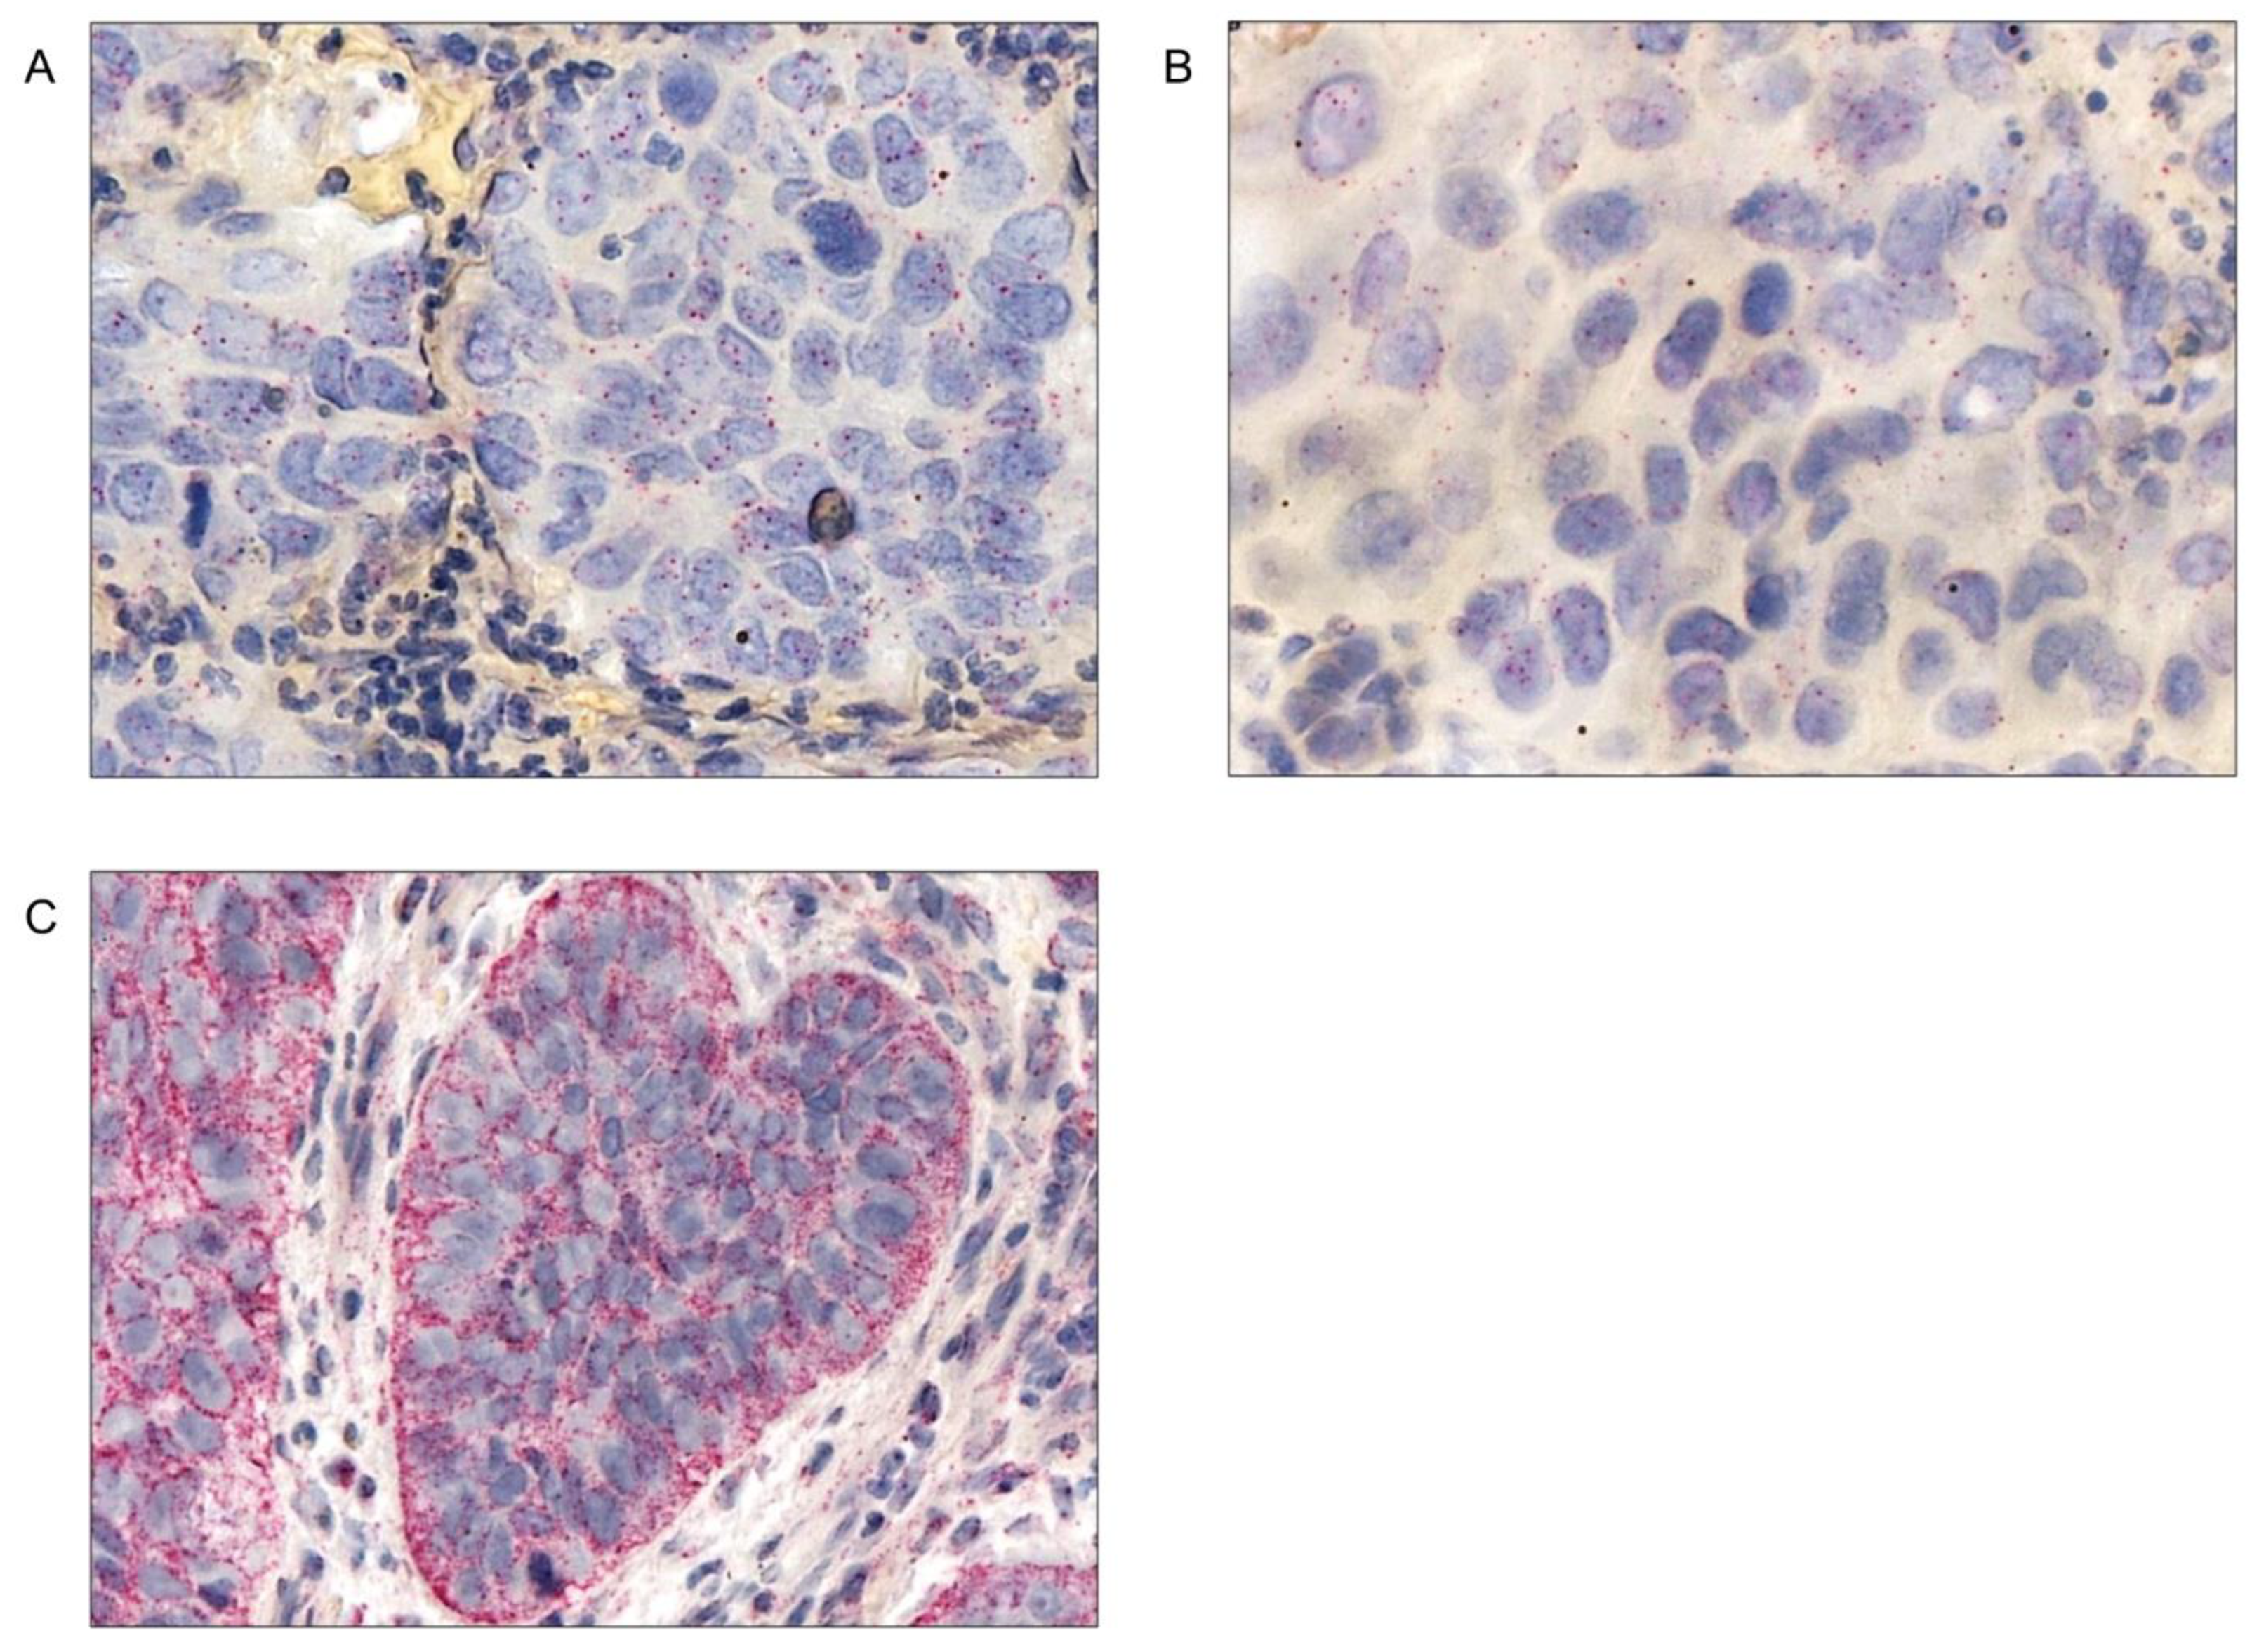
Figure 4.
SATB1 mRNA expression was associated with patients age. After performing CISH assays, followed by digital analysis of SATB1 mRNA expression in lung cancer cells, we observed that SATB1 mRNA level was significantly higher in patients over the age of 65 compared to those aged 65 and younger. This relationship was present both in the whole NSCLC cohort (A) and in the AC subtype analysed separately (B). NSCLC – non-small cell lung carcinoma; AC - adenocarcinoma; *** - P≤0.001.
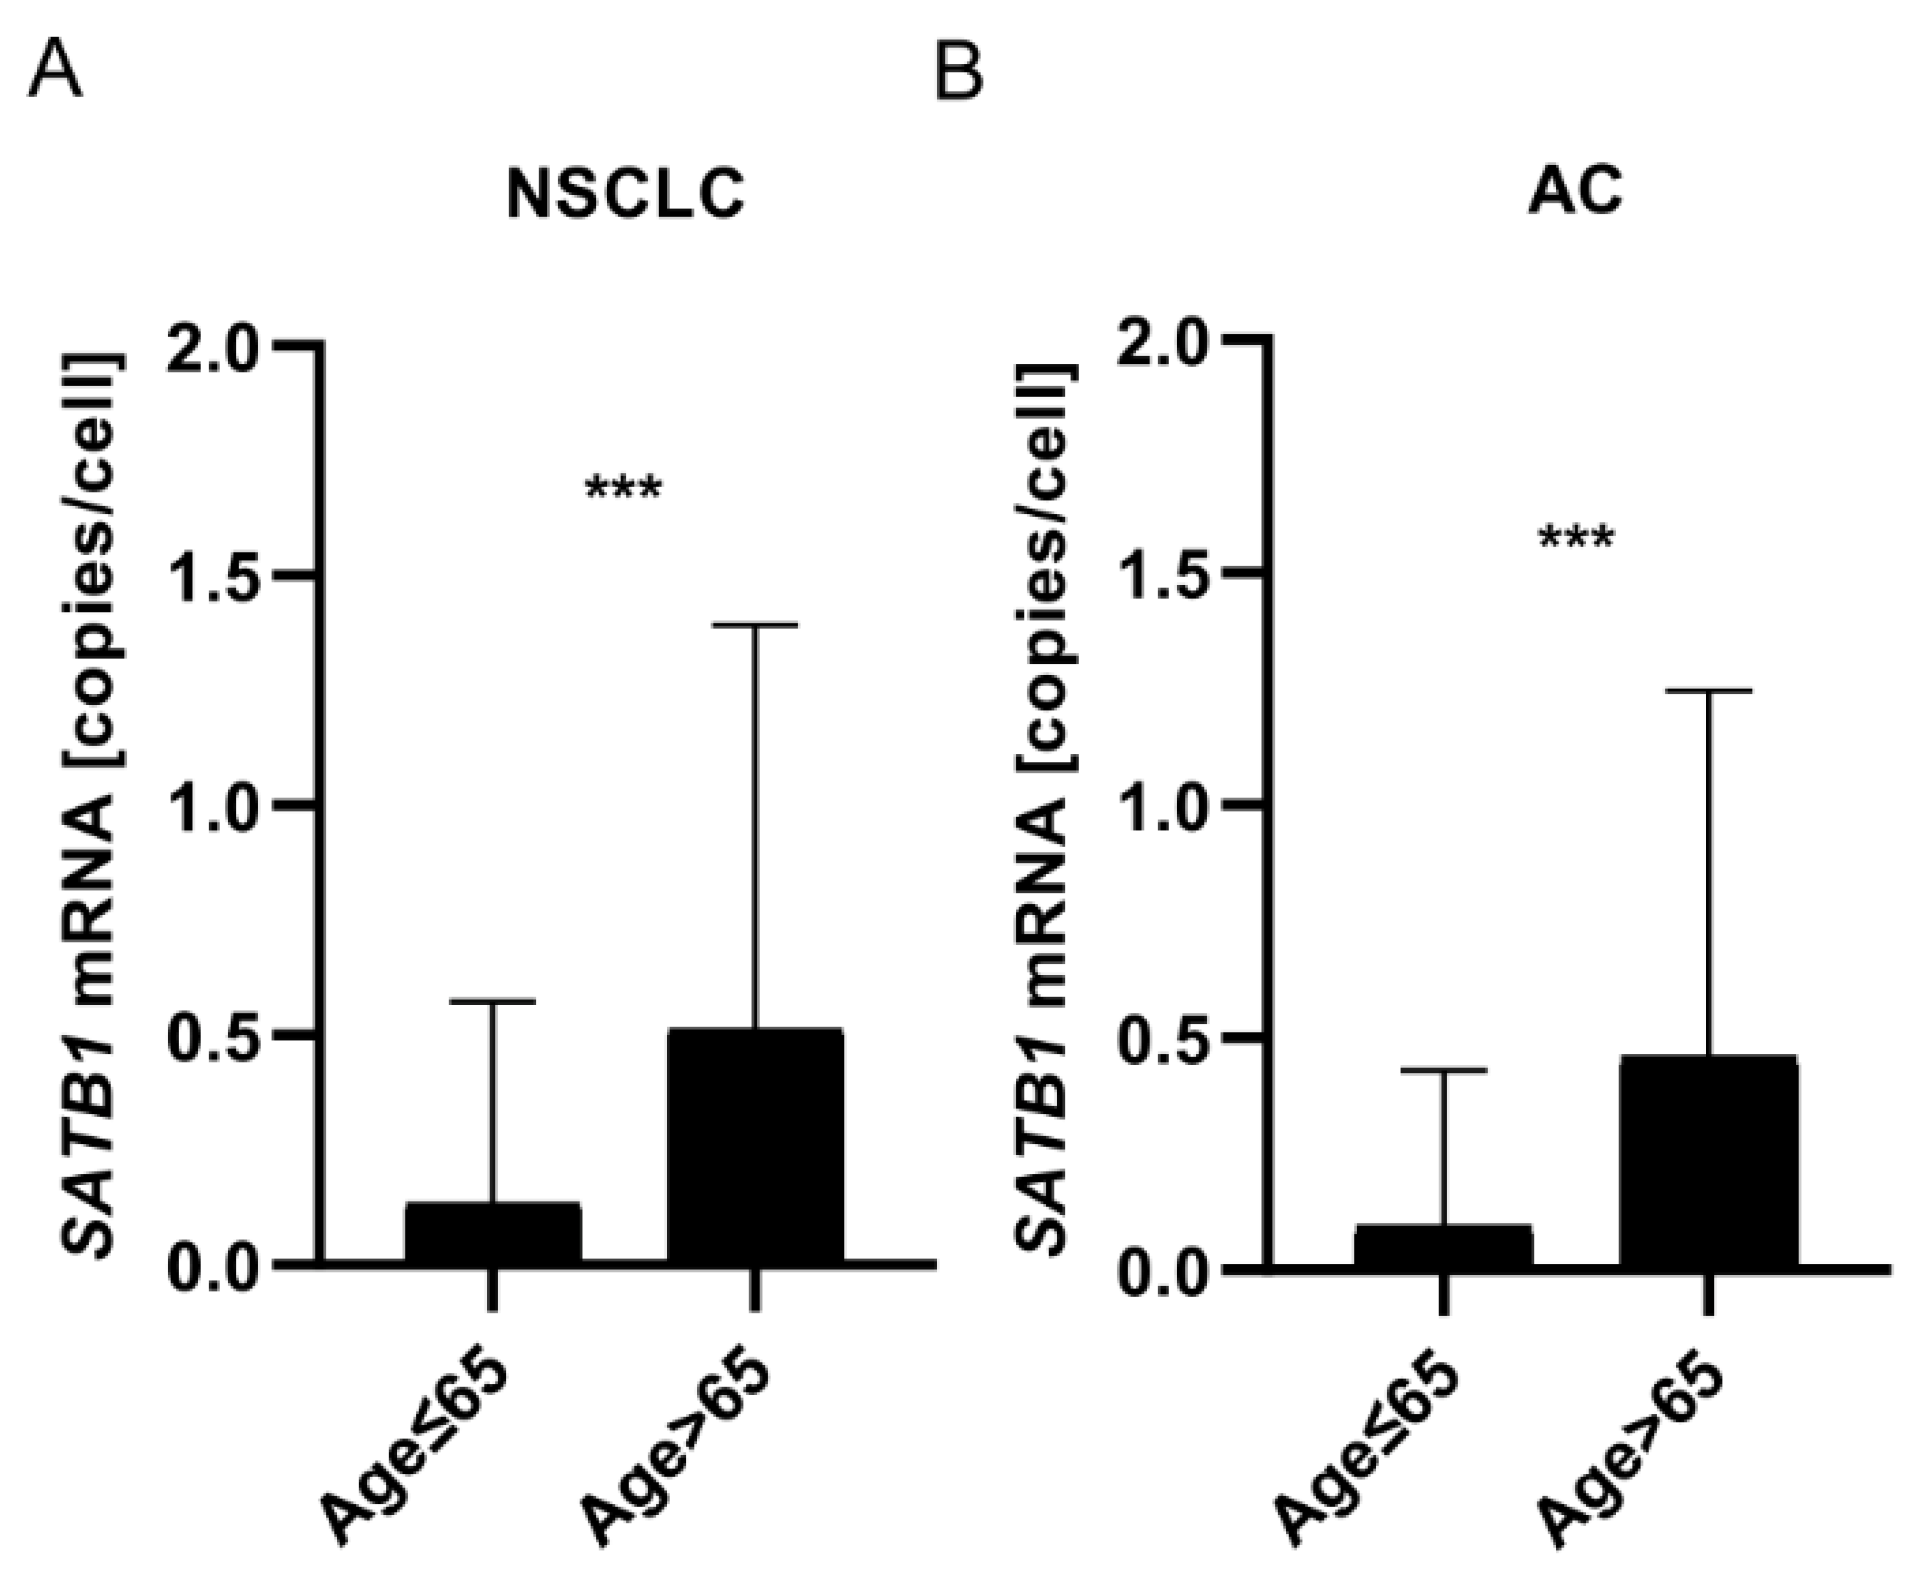
Figure 5.
Prognostic significance of EGFR mRNA expression in non-small cell lung cancer specimens was dependent on the tumour histology. EGFR mRNA expression analysis in lung cancer cells revealed that high EGFR mRNA copy number (>0.24 copies/cell) was a positive prognostic factor for AC patients (A). On the contrary, for LSCC patients, prognosis was significantly better when EGFR mRNA copy number was low (≤0.05 mRNA copies/cell) (B). High SATB1 mRNA expression (more than 2 mRNA copies/cell) was also associated with significantly better patients’ prognosis (C). NSCLC – non-small cell lung carcinoma; AC - adenocarcinoma; LSCC – squamous cell carcinoma.
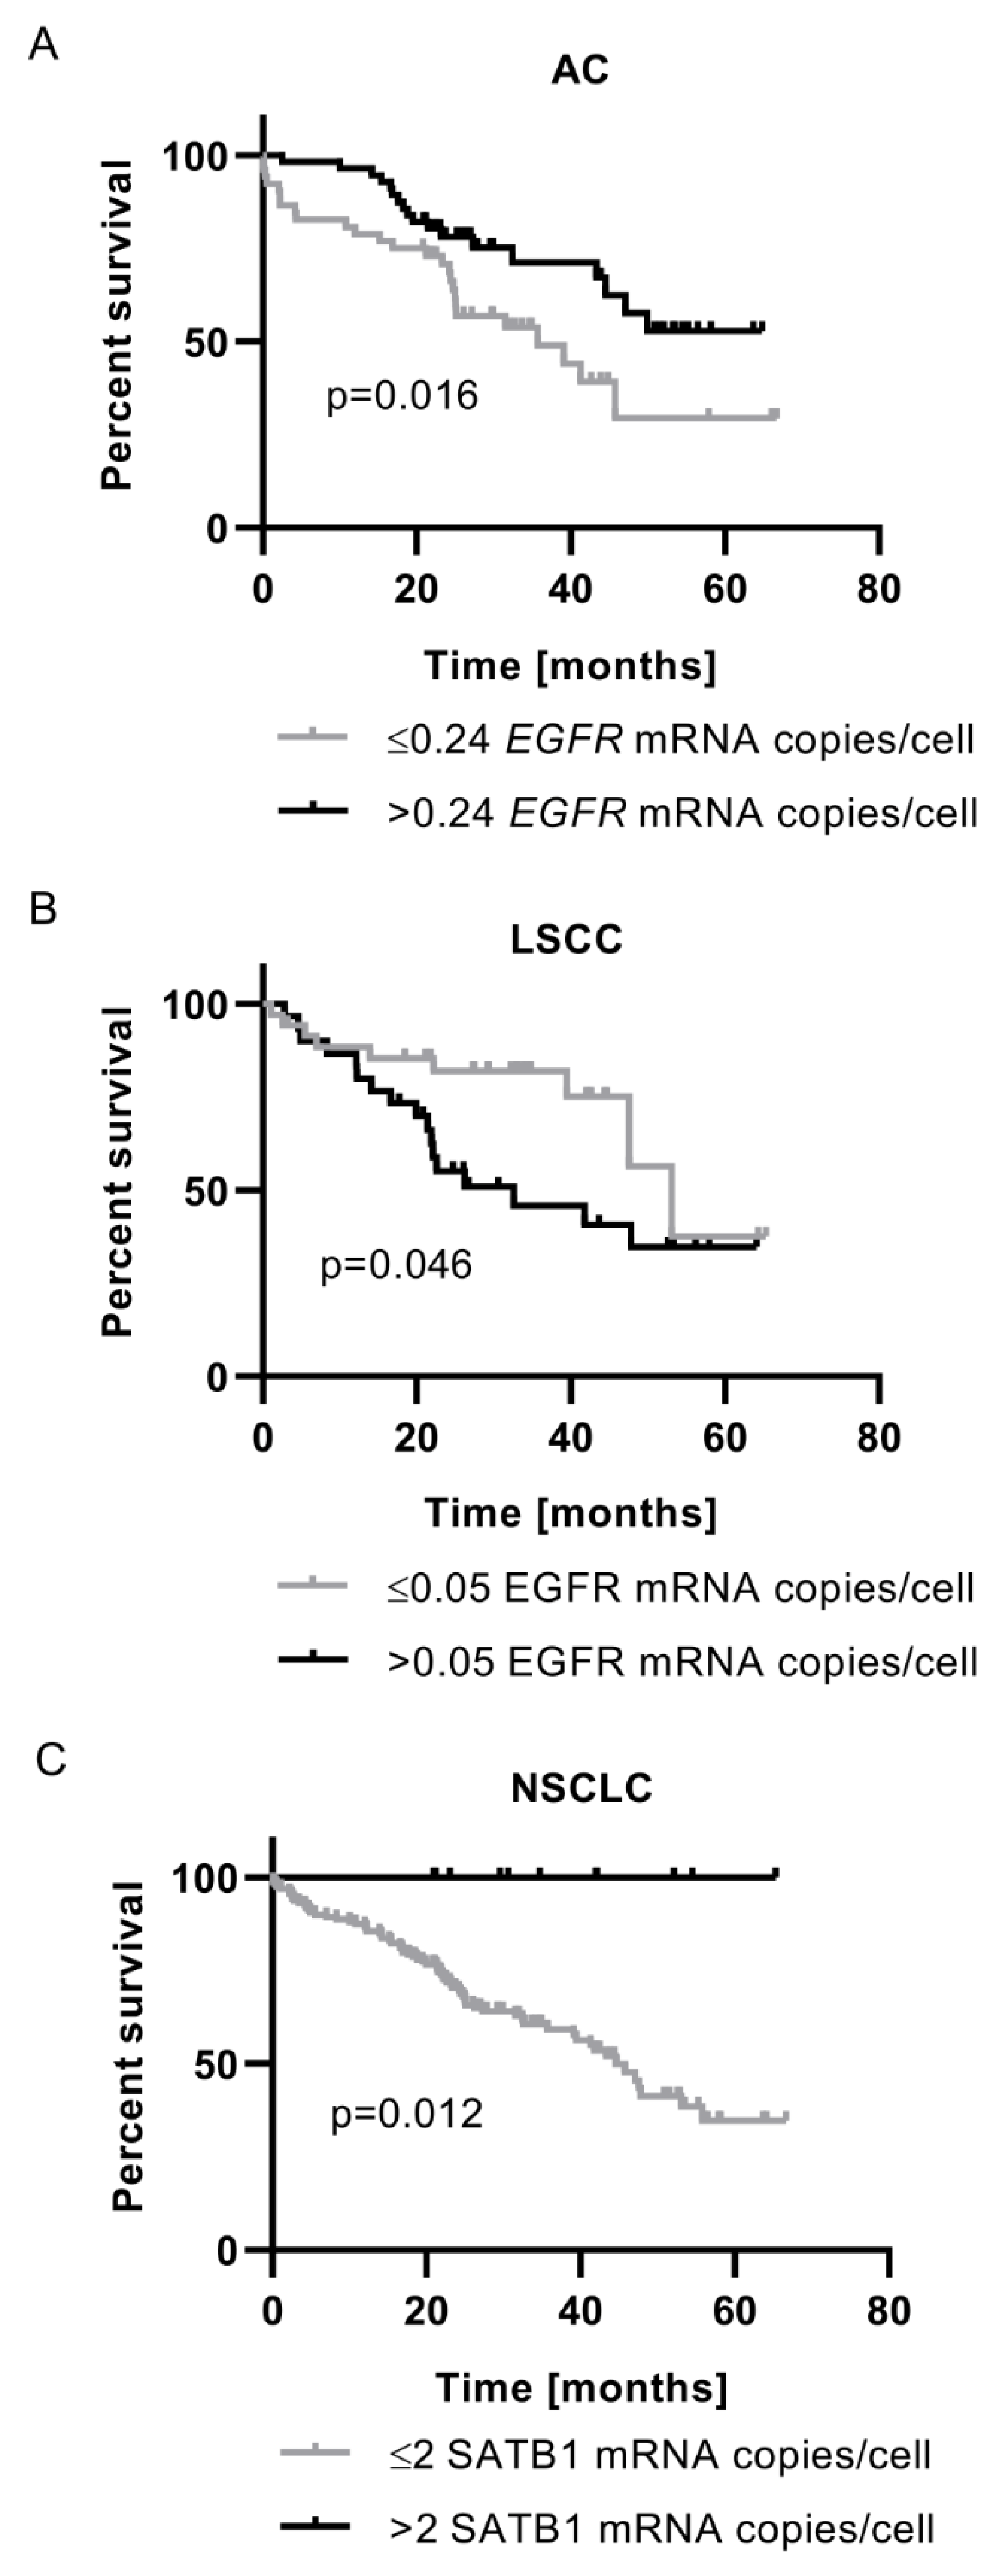
Figure 6.
Correlations between the expression levels of EGFR, SATB1, and SLUG proteins in non-small cell lung cancer specimens. EGFR expression in cancer cells nuclei positively correlated with SATB1 level in NSCLC (A), AC (B), and LSCC (C) samples. Moreover, nuclear EGFR scores correlated positively also with nuclear SLUG level in NSCLC (D), AC (E), and LSCC (F) specimens. NSCLC – non-small cell lung carcinoma; AC - adenocarcinoma; LSCC – squamous cell carcinoma.
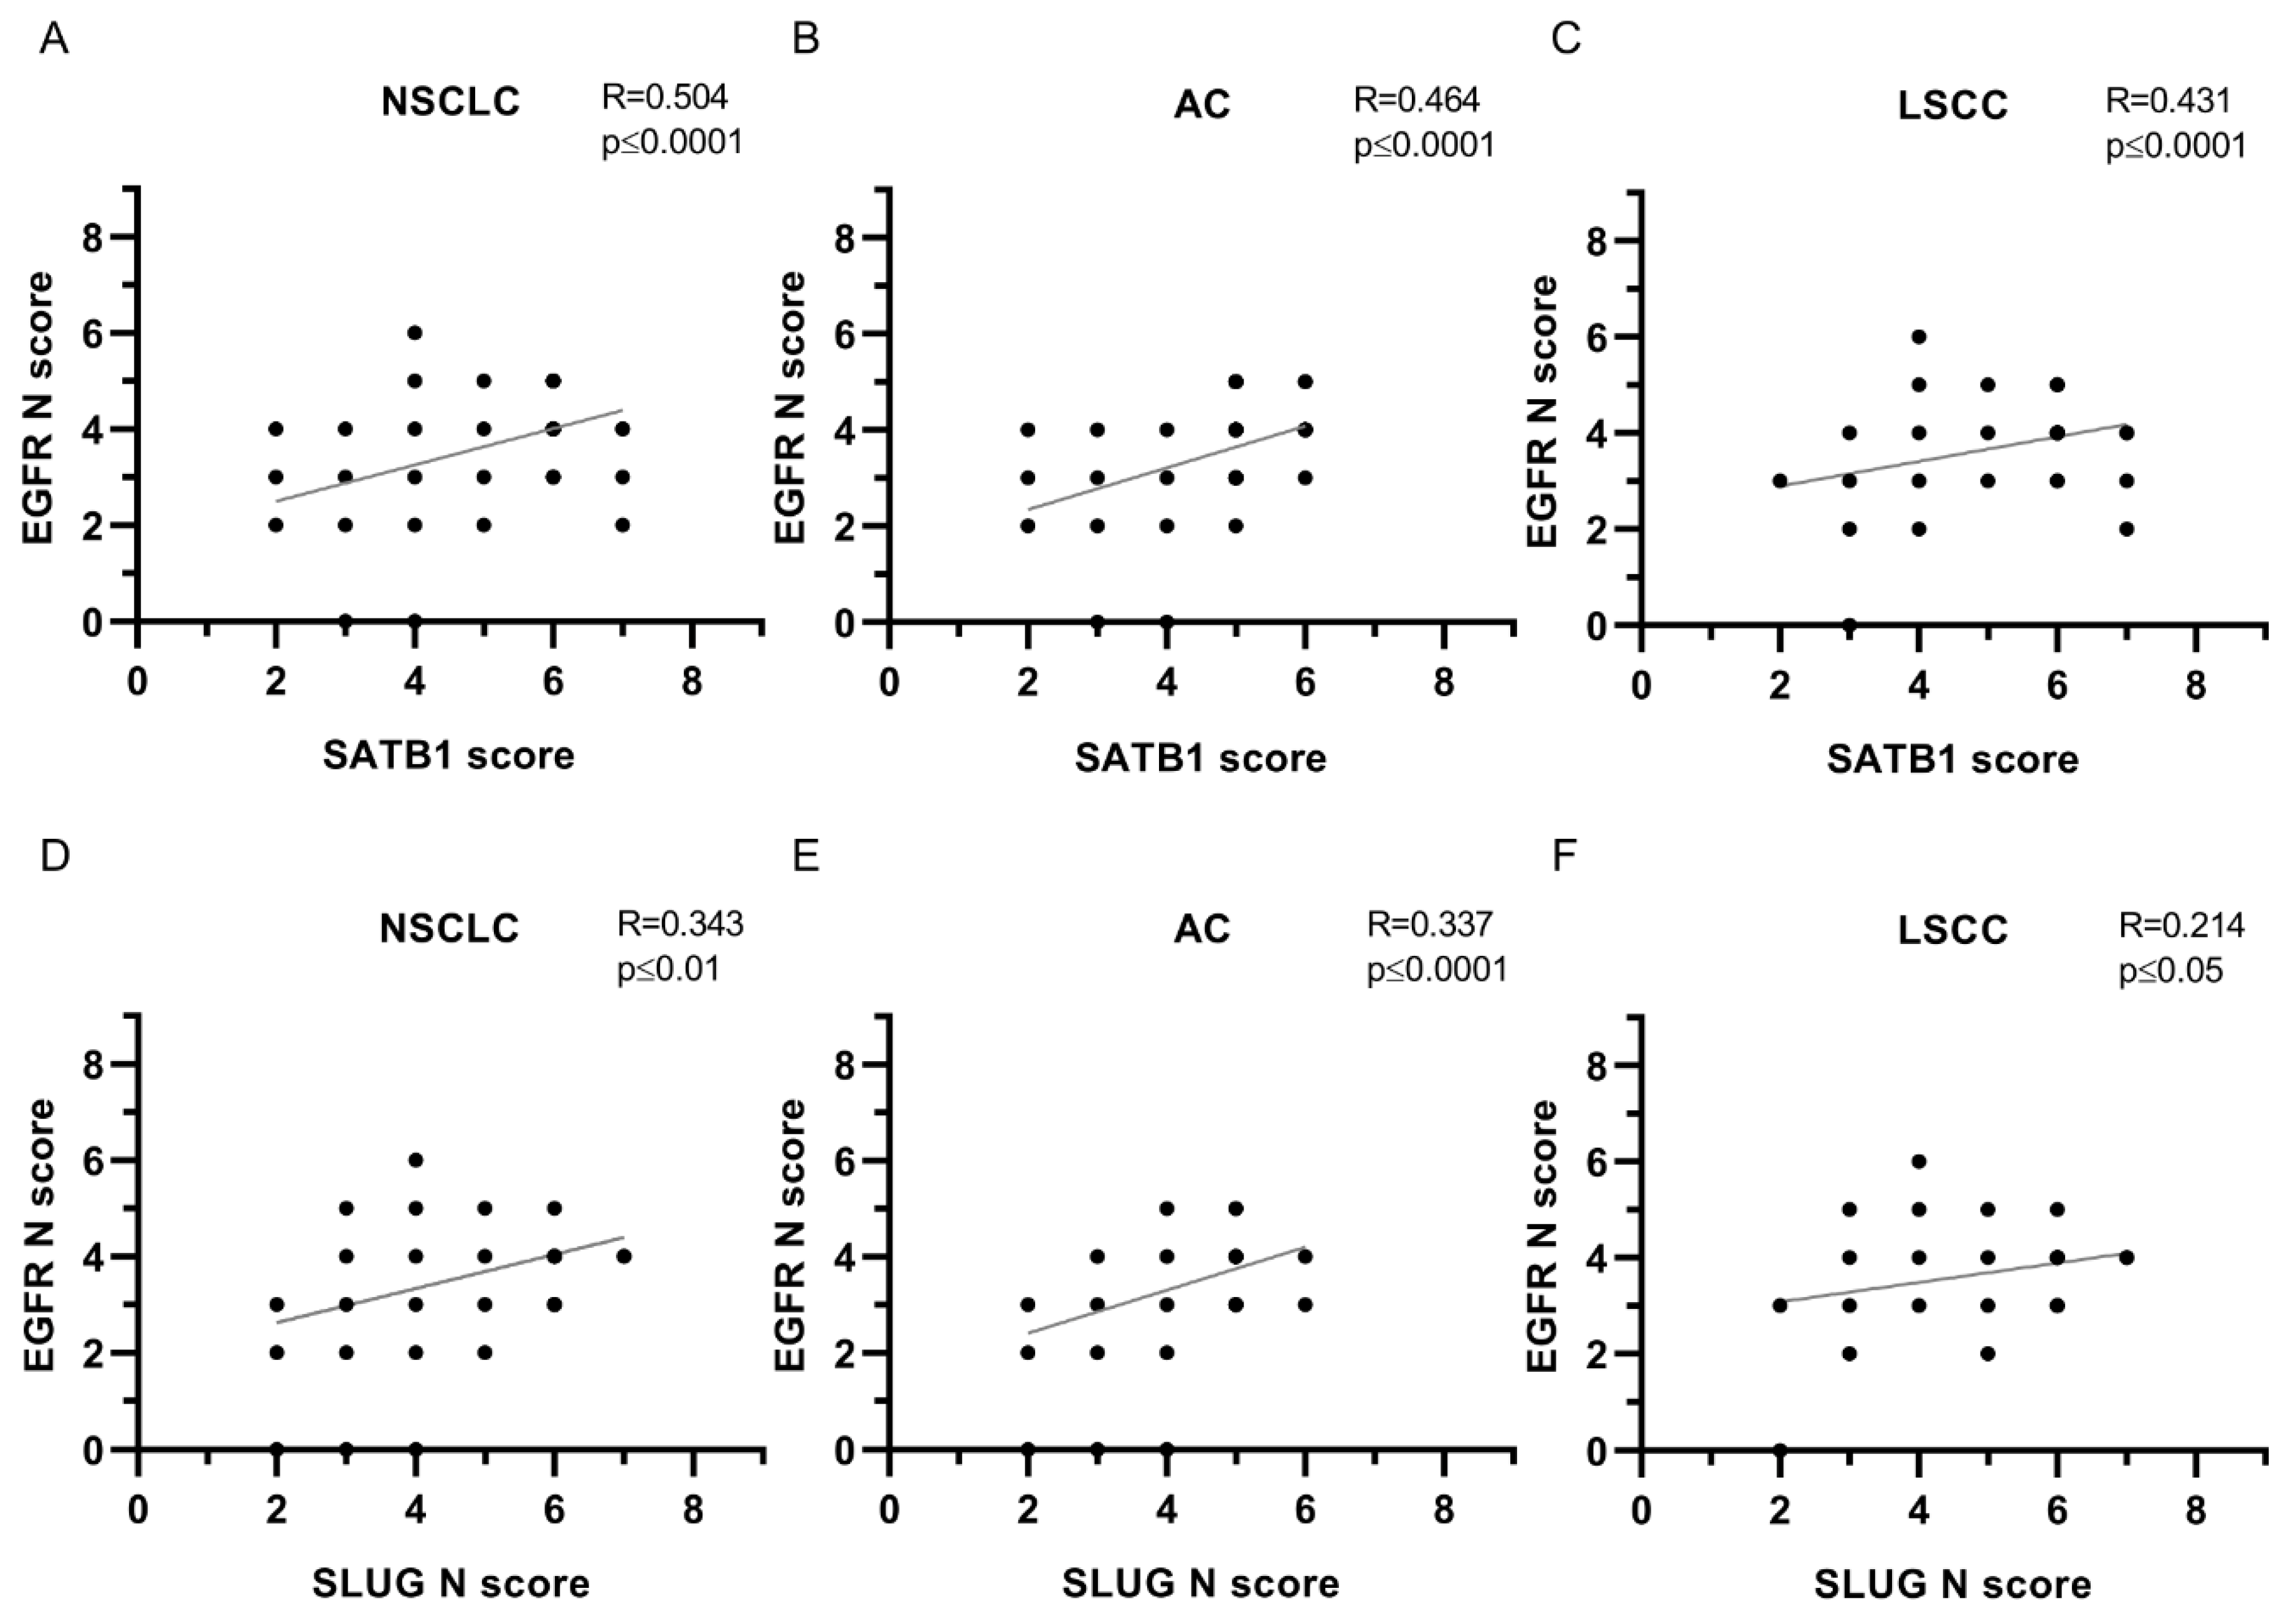
Figure 7.
Correlations between the expression levels of EGFR, SATB1, and EMT-promoting proteins in non-small cell lung cancer specimens. EGFR expression in cancer cells cytoplasm positively correlated with SATB1 level in NSCLC (A), AC (D), and LSCC (G). Moreover, cytoplasmic EGFR scores correlated positively with nuclear SLUG level in NSCLC (B) and LSCC (H). We observed also positive correlations between EGFR C score and Twist1 score (C, F), EGFR C score and SNAIL score (E), and EGFR C score and SLUG C score (I). NSCLC – non-small cell lung carcinoma; AC - adenocarcinoma; LSCC – squamous cell carcinoma.
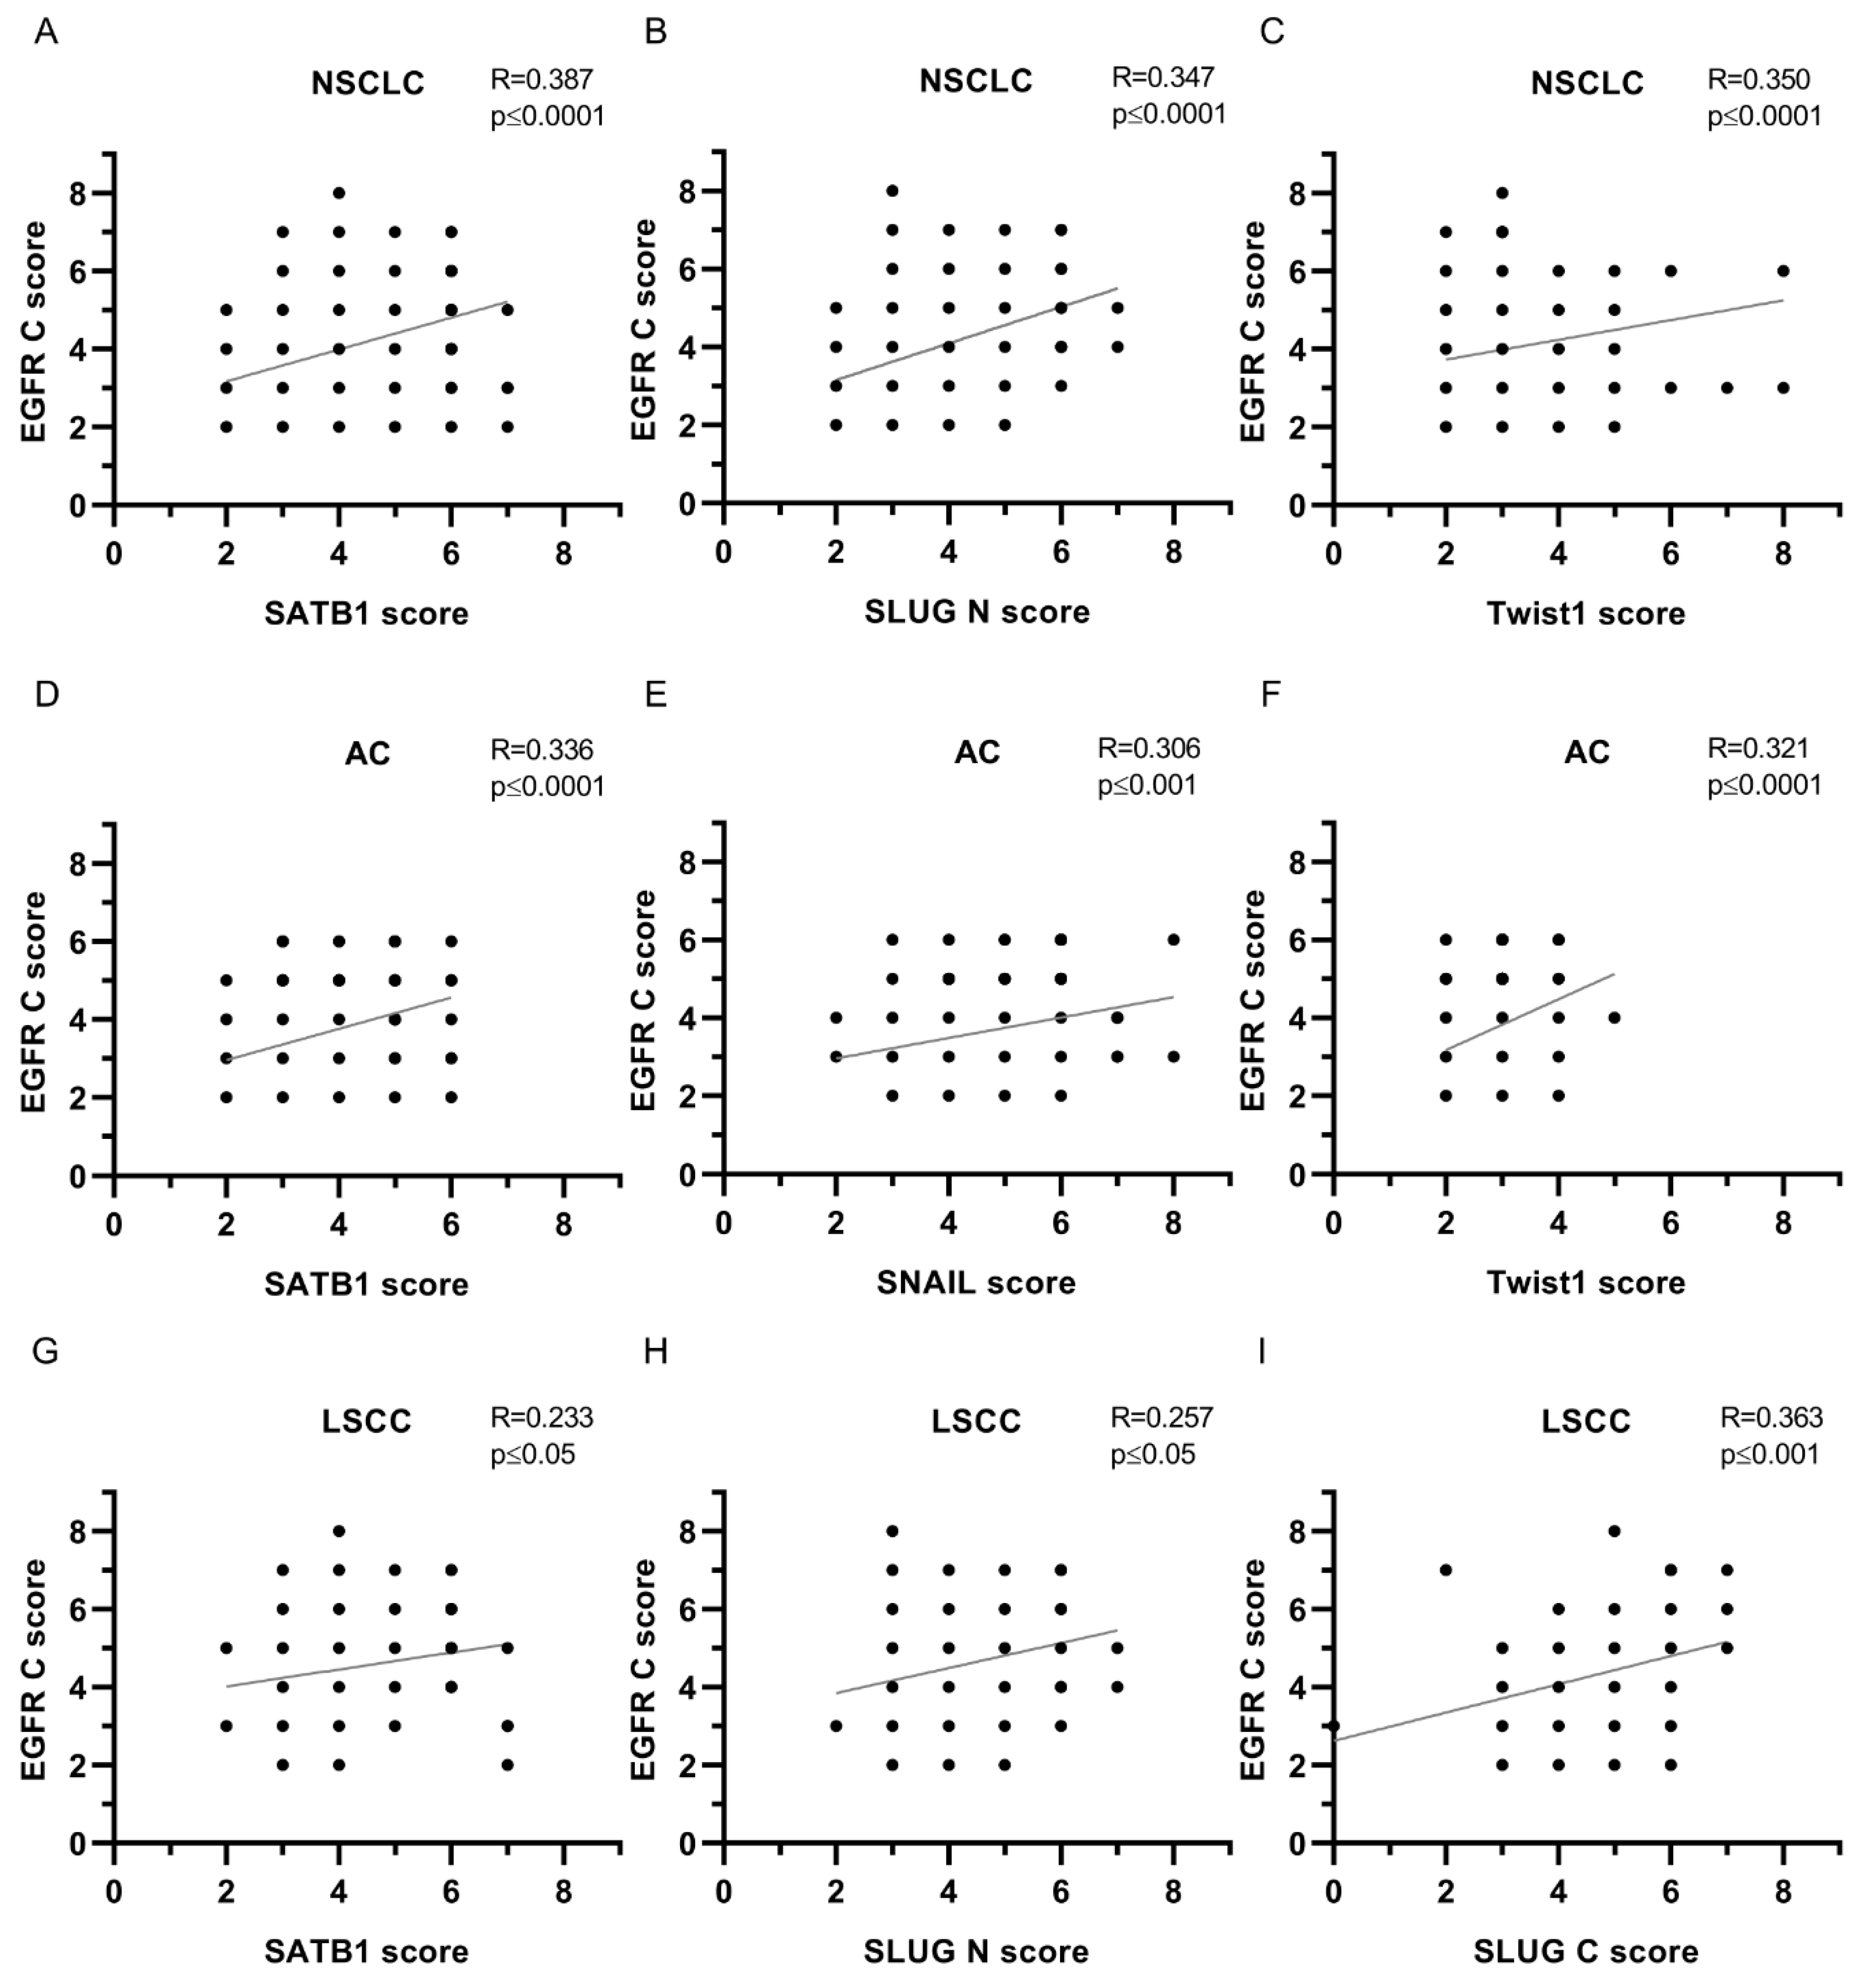

Table 1.
Correlations between the nuclear expression of EGFR and expression of SATB1, Ki67, E-cadherin, N-cadherin, SNAIL, SLUG , and Twist1 proteins. Significant P-values are given in bold. Ns – non-significant; * - p≤0.05; ** - p≤0.01; *** - p≤0.001; **** - p≤0.0001.
Table 1.
Correlations between the nuclear expression of EGFR and expression of SATB1, Ki67, E-cadherin, N-cadherin, SNAIL, SLUG , and Twist1 proteins. Significant P-values are given in bold. Ns – non-significant; * - p≤0.05; ** - p≤0.01; *** - p≤0.001; **** - p≤0.0001.
| EGFR N | ||||||
|---|---|---|---|---|---|---|
| Protein | NSCLC | AC | LSCC | |||
| Spearman’s R | P-value | Spearman’s R | P-value | Spearman’s R | P-value | |
| SATB1 | 0.504 | **** | 0.464 | **** | 0.431 | **** |
| Ki67 | 0.206 | *** | 0.106 | ns | 0.186 | ns |
| E-cadherin | 0.043 | ns | 0.004 | ns | 0.088 | ns |
| N-cadherin | 0.035 | ns | -0.013 | ns | 0.052 | ns |
| SNAIL | 0.129 | * | 0.205 | * | -0.086 | ns |
| SLUG N | 0.343 | ** | 0.337 | **** | 0.214 | * |
| SLUG C | 0.173 | **** | 0.227 | ** | 0.160 | ns |
| Twist1 | 0.249 | *** | 0.156 | ns | 0.241 | * |
Table 2.
Correlations between the cytoplasmic expression of EGFR and expression of SATB1, Ki67, E-cadherin, N-cadherin, SNAIL, SLUG , and Twist1 proteins. Significant P-values are given in bold. Ns – non-significant; * - p≤0.05; ** - p≤0.01; *** - p≤0.001; **** - p≤0.0001.
Table 2.
Correlations between the cytoplasmic expression of EGFR and expression of SATB1, Ki67, E-cadherin, N-cadherin, SNAIL, SLUG , and Twist1 proteins. Significant P-values are given in bold. Ns – non-significant; * - p≤0.05; ** - p≤0.01; *** - p≤0.001; **** - p≤0.0001.
| EGFR C | ||||||
|---|---|---|---|---|---|---|
| Protein | NSCLC | AC | LSCC | |||
| Spearman’s R | P-value | Spearman’s R | P-value | Spearman’s R | P-value | |
| SATB1 | 0.387 | **** | 0.336 | **** | 0.233 | * |
| Ki67 | 0.217 | *** | 0.084 | ns | 0.117 | ns |
| E-cadherin | 0.071 | ns | 0.015 | ns | 0.132 | ns |
| N-cadherin | 0.039 | ns | -0.138 | ns | 0.118 | ns |
| SNAIL | 0.220 | *** | 0.306 | *** | 0.008 | ns |
| SLUG N | 0.347 | **** | 0.248 | ** | 0.257 | * |
| SLUG C | 0.226 | *** | 0.203 | * | 0.363 | *** |
| Twist1 | 0.350 | **** | 0.321 | **** | 0.151 | ns |
Table 3.
Correlations between the membranous expression of EGFR and expression of SATB1, Ki67, E-cadherin, N-cadherin, SNAIL, SLUG , and Twist1 proteins. Significant P-values are given in bold. Ns – non-significant; * - p≤0.05; ** - p≤0.01; *** - p≤0.001; **** - p≤0.0001.
Table 3.
Correlations between the membranous expression of EGFR and expression of SATB1, Ki67, E-cadherin, N-cadherin, SNAIL, SLUG , and Twist1 proteins. Significant P-values are given in bold. Ns – non-significant; * - p≤0.05; ** - p≤0.01; *** - p≤0.001; **** - p≤0.0001.
| EGFR M | ||||||
|---|---|---|---|---|---|---|
| Protein | NSCLC | AC | LSCC | |||
| Spearman’s R | P-value | Spearman’s R | P-value | Spearman’s R | P-value | |
| SATB1 | 0.166 | ** | 0.044 | ns | 0.137 | ns |
| Ki67 | 0.186 | ** | 0.206 | * | 0.027 | ns |
| E-cadherin | 0.065 | ns | 0.053 | ns | 0.053 | ns |
| N-cadherin | 0.093 | ns | 0.072 | ns | 0.065 | ns |
| SNAIL | 0.093 | ns | 0.204 | * | -0.031 | ns |
| SLUG N | 0.184 | ** | 0.102 | ns | 0.135 | ns |
| SLUG C | 0.080 | ns | 0.063 | ns | 0.142 | ns |
| Twist1 | 0.075 | ns | 0.009 | ns | -0.041 | ns |
Table 4.
Correlations between the expression of EGFR mRNA and expression of SATB1, Ki67, E-cadherin, N-cadherin, SNAIL, SLUG , and Twist1 proteins. Significant P-values are given in bold. Ns – non-significant; * - p≤0.05; ** - p≤0.01; *** - p≤0.001; **** - p≤0.0001.
Table 4.
Correlations between the expression of EGFR mRNA and expression of SATB1, Ki67, E-cadherin, N-cadherin, SNAIL, SLUG , and Twist1 proteins. Significant P-values are given in bold. Ns – non-significant; * - p≤0.05; ** - p≤0.01; *** - p≤0.001; **** - p≤0.0001.
| EGFR mRNA | ||||||
|---|---|---|---|---|---|---|
| Protein | NSCLC | AC | LSCC | |||
| Spearman’s R | P-value | Spearman’s R | P-value | Spearman’s R | P-value | |
| EGFR N | -0.196 | ** | -0.345 | *** | 0.094 | ns |
| EGFR C | -0.195 | ** | -0.260 | ** | -0.088 | ns |
| EGFR M | -0.081 | ns | 0.008 | ns | -0.149 | ns |
| SATB1mRNA | -0.078 | ns | -0.226 | ns | -0.092 | ns |
| SATB1 | -0.131 | ns | -0.170 | ns | -0.073 | ns |
| Ki67 | -0.021 | ns | 0.075 | ns | -0.153 | ns |
| E-cadherin | -0.011 | ns | 0.054 | ns | -0.180 | ns |
| N-cadherin | -0.128 | ns | -0.079 | ns | -0.165 | ns |
| SNAIL | -0.185 | * | -0.133 | ns | -0.283 | * |
| SLUG N | -0.251 | *** | -0.247 | ** | -0.260 | * |
| SLUG C | -0.118 | ns | -0.076 | ns | -0.188 | ns |
| Twist1 | -0.183 | * | -0.280 | ** | -0.048 | ns |
Table 5.
Clinical-pathological data of the patients. IHC studies.
| Parameters | All cases (N=239) n (%) |
AC (N=149) n (%) |
LSCC (N=90) n (%) |
|---|---|---|---|
| Gender | |||
| Male | 144 (60.2) | 85 (57.0) | 59 (65.6) |
| Female | 95 (39.8) | 64 (43.0) | 31 (34.4) |
| Age | |||
| Mean | 66.21±7.69 | 65.84±8.16 | 66.83±6.84 |
| Range | 44-84 | 44-84 | 44-82 |
| Malignancy grade | |||
| G1 | 3 (1.3) | 3 (2.0) | 0 (0.0) |
| G2 | 149 (62.3) | 72 (48.3) | 77 (85.6) |
| G3 | 87 (36.4) | 74 (49.7) | 13 (14.4) |
| Tumour size | |||
| pT1 | 75 (31.4) | 56 (37.6) | 19 (21.1) |
| pT2 | 122 (51.0) | 65 (43.6) | 57 (63.3) |
| pT3 | 23 (9.6) | 11 (7.4) | 12 (13.3) |
| pT4 | 5 (2.1) | 4 (2.7) | 1 (1.1) |
| No data | 23 (9.6) | 13 (8.7) | 1 (1.1) |
| Lymph nodes | |||
| pN0 | 144 (60.2) | 82 (55.0) | 62 (68.9) |
| pN1 | 40 (16.7) | 23 (15.4) | 17 (18.9) |
| pN2 | 41 (17.2) | 31 (20.8) | 10 (11.1) |
| No data | 14 (5.9) | 13 (8.7) | 1 (1.1) |
| Stage | |||
| I | 102 (42.7) | 64 (43.0) | 38 (42.2) |
| II | 76 (31.8) | 36 (24.2) | 40 (44.4) |
| III | 45 (18.8) | 34 (22.8) | 11 (12.2) |
| IV | 2 (0.83) | 2 (1.3) | 0 (0.0) |
| No data | 14 (5.9) | 13 (8.7) | 1 (1.1) |
| Overall survival | |||
| Deaths | 94 (39.3) | 62 (41.6) | 32 (35.6) |
| Alive | 144 (60.3) | 86 (57.7) | 58 (64.4) |
| No data | 1 (0.42) | 1 (0.67) | 0 (0.0) |
AC, adenocarcinoma; LSCC, squamous cell carcinoma. Age is expressed in years, all other data are expressed as n (%).
Table 6.
Clinical-pathological data of the patients. CISH studies.
| Parameters | All cases (N=170) n (%) |
AC (N=104) n (%) |
LSCC (N=66) n (%) |
|---|---|---|---|
| Gender | |||
| Male | 104 (61.18) | 58 (55.77) | 46 (69.70) |
| Female | 66 (38.82) | 46 (44.23) | 20 (30.30) |
| Age | |||
| Mean | 66.21±7.42 | 65.70±7.93 | 67.03±6.49 |
| Range | 44-82 | 44-82 | 52-82 |
| Malignancy grade | |||
| G1 | 1 (0.59) | 1 (0.96) | 0 (0.0) |
| G2 | 105 (61.76) | 49 (47.11) | 56 (84.85) |
| G3 | 64 (37.65) | 54 (51.92) | 10 (15.15) |
| Tumour size | |||
| pT1 | 51 (30.00) | 36 (34.61) | 15 (22.73) |
| pT2 | 87 (51.18) | 47 (45.19) | 40 (60.61) |
| pT3 | 16 (9.41) | 6 (5.77) | 10 (15.15) |
| pT4 | 5 (2.94) | 4 (3.85) | 1 (1.51) |
| No data | 11 (6.47) | 11 (10.58) | 0 (0.0) |
| Lymph nodes | |||
| pN0 | 105 (61.76) | 58 (55.77) | 47 (71.21) |
| pN1 | 23 (13.53) | 12 (11.54) | 11 (16.67) |
| pN2 | 31 (18.24) | 23 (22.11) | 8 (12.12) |
| No data | 11 (6.47) | 11 (10.58) | 0 (0.0) |
| Stage | |||
| I | 70 (41.18) | 45 (43.27) | 25 (37.88) |
| II | 53 (31.18) | 21 (20.19) | 32 (48.48) |
| III | 34 (20.00) | 25 (24.03) | 9 (13.64) |
| IV | 2 (1.18) | 2 (1.92) | 0 (0.0) |
| No data | 11 (6.47) | 11 (10.58) | 0 (0.0) |
| Overall survival | |||
| Deaths | 100 (58.82) | 42 (40.38) | 39 (59.09) |
| Alive | 69 (40.59) | 61 (58.65) | 27 (40.91) |
| No data | 1 (0.59) | 1 (0.96) | 0 (0.0) |
AC, adenocarcinoma; LSCC, squamous cell carcinoma. Age is expressed in years, all other data are expressed as n (%).
Table 7.
Scoring system used for the evaluation of membranous stainings.
| Score | Percentage of the positive cells and intensity of the staining |
|---|---|
| 0 | No staining is observed or staining is observed in <10% of the tumour cells |
| 1 | A faint membrane staining is observed in >10% of the tumour cells |
| 2 | A weak or moderate, complete membrane staining is observed in >10% of the tumour cells |
| 3 | A strong, complete membrane staining is observed in >10% of the tumour cells |
Table 8.
Probes used for the CISH reactions.
| Target molecule | Gene name | Probe number |
|---|---|---|
| mRNA for EGFR protein | EGFR | VA1-11736-VT (Thermo Fisher Scientific) |
| mRNA for SATB1 protein | SATB1 | VA1-13726-VT (Thermo Fisher Scientific) |
| 18S ribosomal RNA | 555RN18S1 | VA1-3020734-VT (Thermo Fisher Scientific) |
Disclaimer/Publisher’s Note: The statements, opinions and data contained in all publications are solely those of the individual author(s) and contributor(s) and not of MDPI and/or the editor(s). MDPI and/or the editor(s) disclaim responsibility for any injury to people or property resulting from any ideas, methods, instructions or products referred to in the content. |
© 2024 by the authors. Licensee MDPI, Basel, Switzerland. This article is an open access article distributed under the terms and conditions of the Creative Commons Attribution (CC BY) license (http://creativecommons.org/licenses/by/4.0/).
Copyright: This open access article is published under a Creative Commons CC BY 4.0 license, which permit the free download, distribution, and reuse, provided that the author and preprint are cited in any reuse.


