Submitted:
10 December 2024
Posted:
11 December 2024
You are already at the latest version
Abstract
Epidermal Growth Factor Receptor (EGFR) expression is an important aspect in the non-small cell lung cancer (NSCLC) diagnosis and treatment. Therefore, it becomes important to identify factors that may influence EGFR level. There are reports suggesting that one of the positive EGFR gene transcription regulators may be Special AT-rich Binding Protein 1 (SATB1), but so far these observations have not been confirmed in NSCLC. Aim of the study: The main aim of the present study was to investigate the possible links between the EGFR and SATB1 expression on both protein and mRNA levels in NSCLC clinical samples and to correlate the obtained results with the clinical-pathological data of the patients. Additionally, we analyzed the relationships between the expression levels of EGFR and the known tumor promoters, including Ki67 prolif-erative antigen and EMT-promoting transcription factors (SLUG, SNAIL, and Twist1). Materials and methods: The study was conducted on 239 NSCLC clinical samples. The methods used included immunohistochemistry and chromogenic in situ hybridization (CISH). Results and conclusions: We demonstrated that EGFR expression in NSCLC was positively associated both with the SATB1 level and with the expression of EMT-promoting proteins. Moreover, we were the first to analyze EGFR expression exclusively in NSCLC cancer cells without the interference caused by respiratory epithelium and tumor stroma. Our analysis revealed that the prognostic significance of EGFR expression was dependent on tumor histology and differed significantly between the AC and LSCC samples.
Keywords:
1. Introduction
4. Materials and Methods
Patient Cohort
Tissue Microarrays (TMAs)
Immunohistochemistry (IHC)
Evaluation of the IHC Stainings
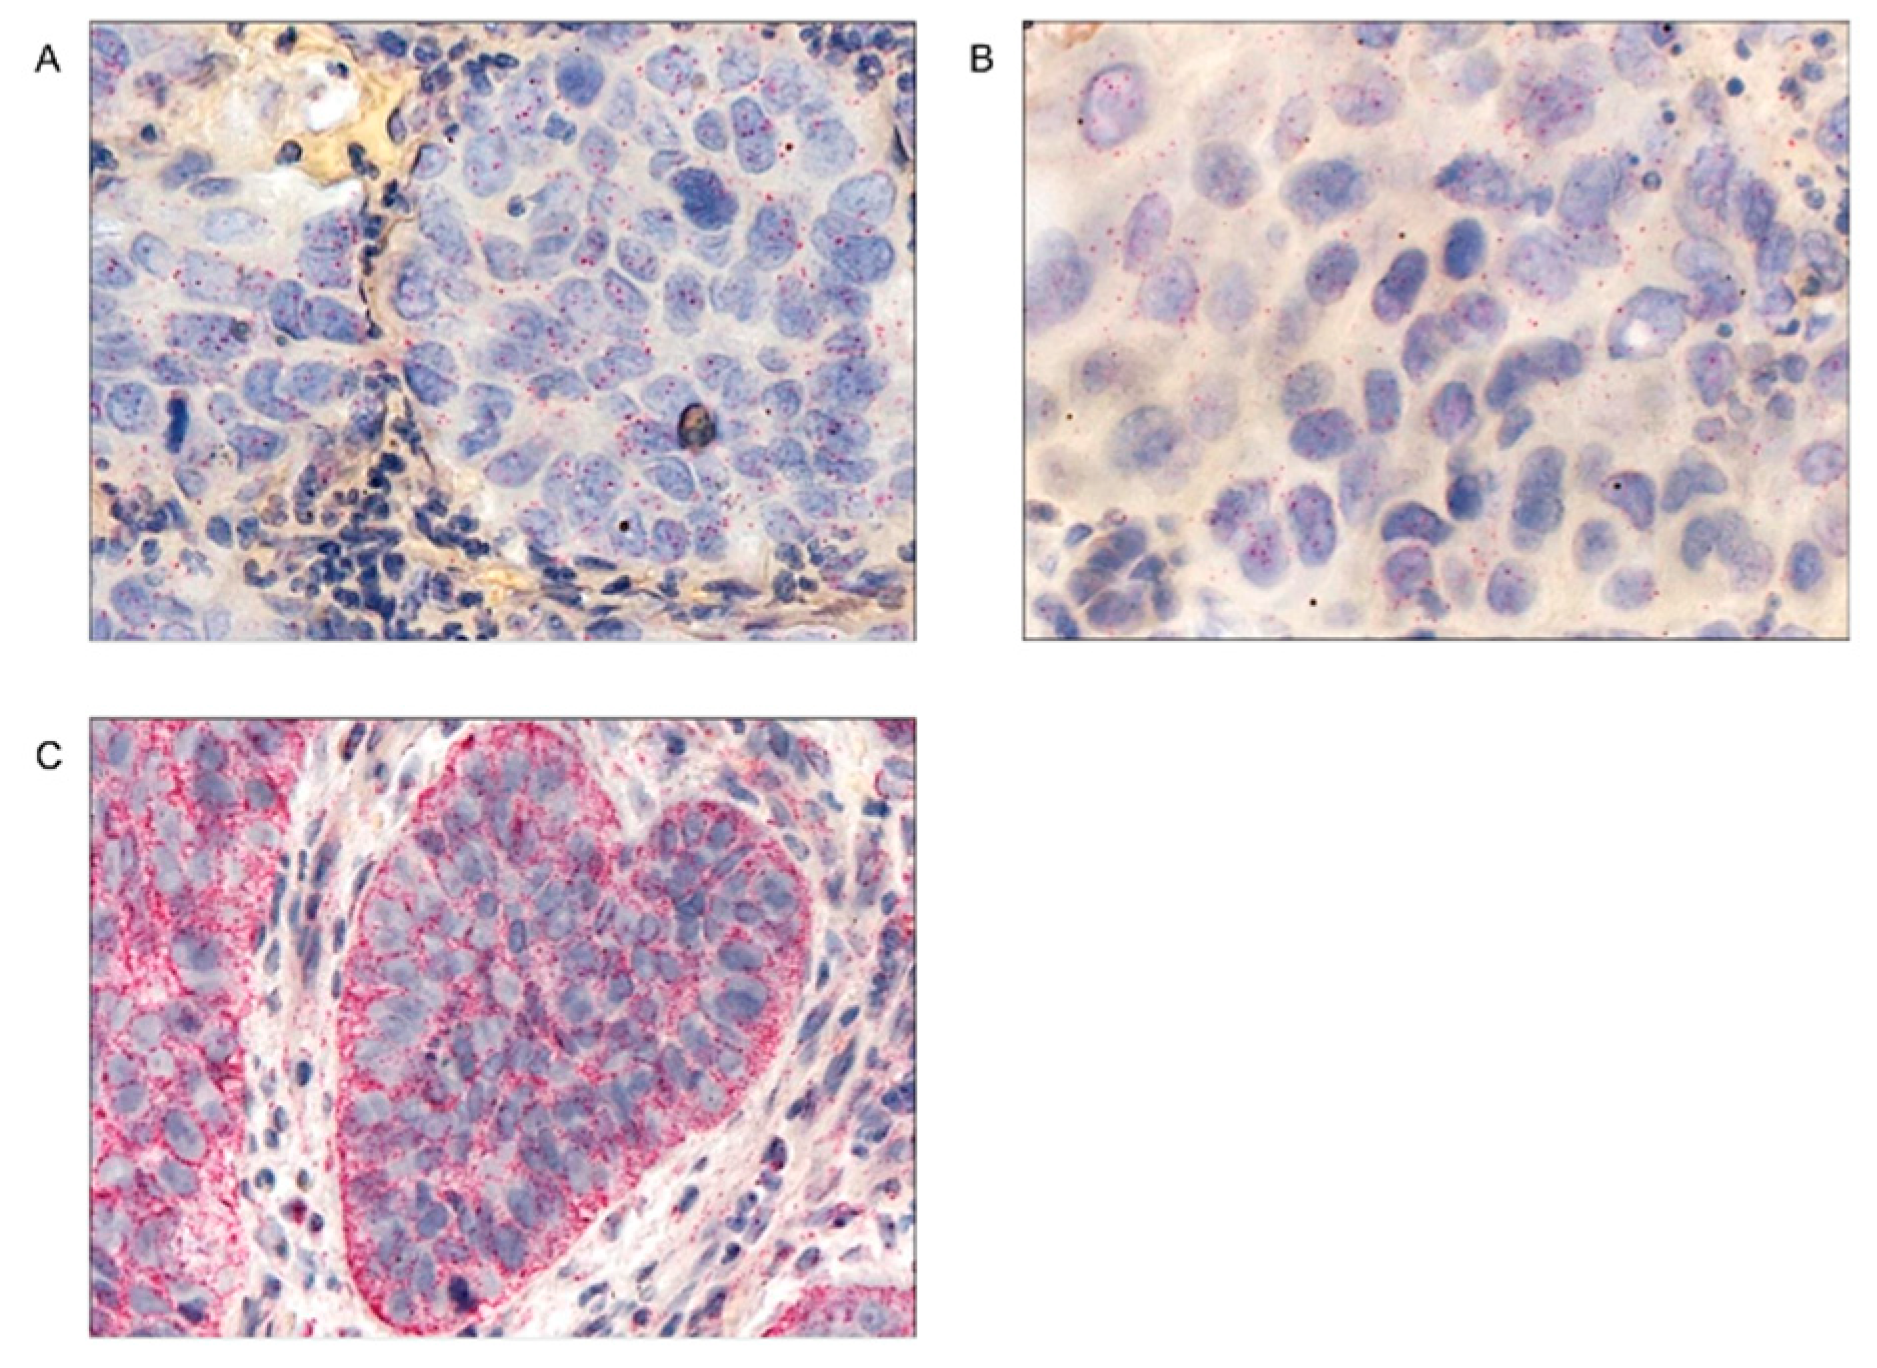
Chromogenic In Situ Hybridization (CISH)
Evaluation of the CISH Slides
Statistical Analysis
2. Results
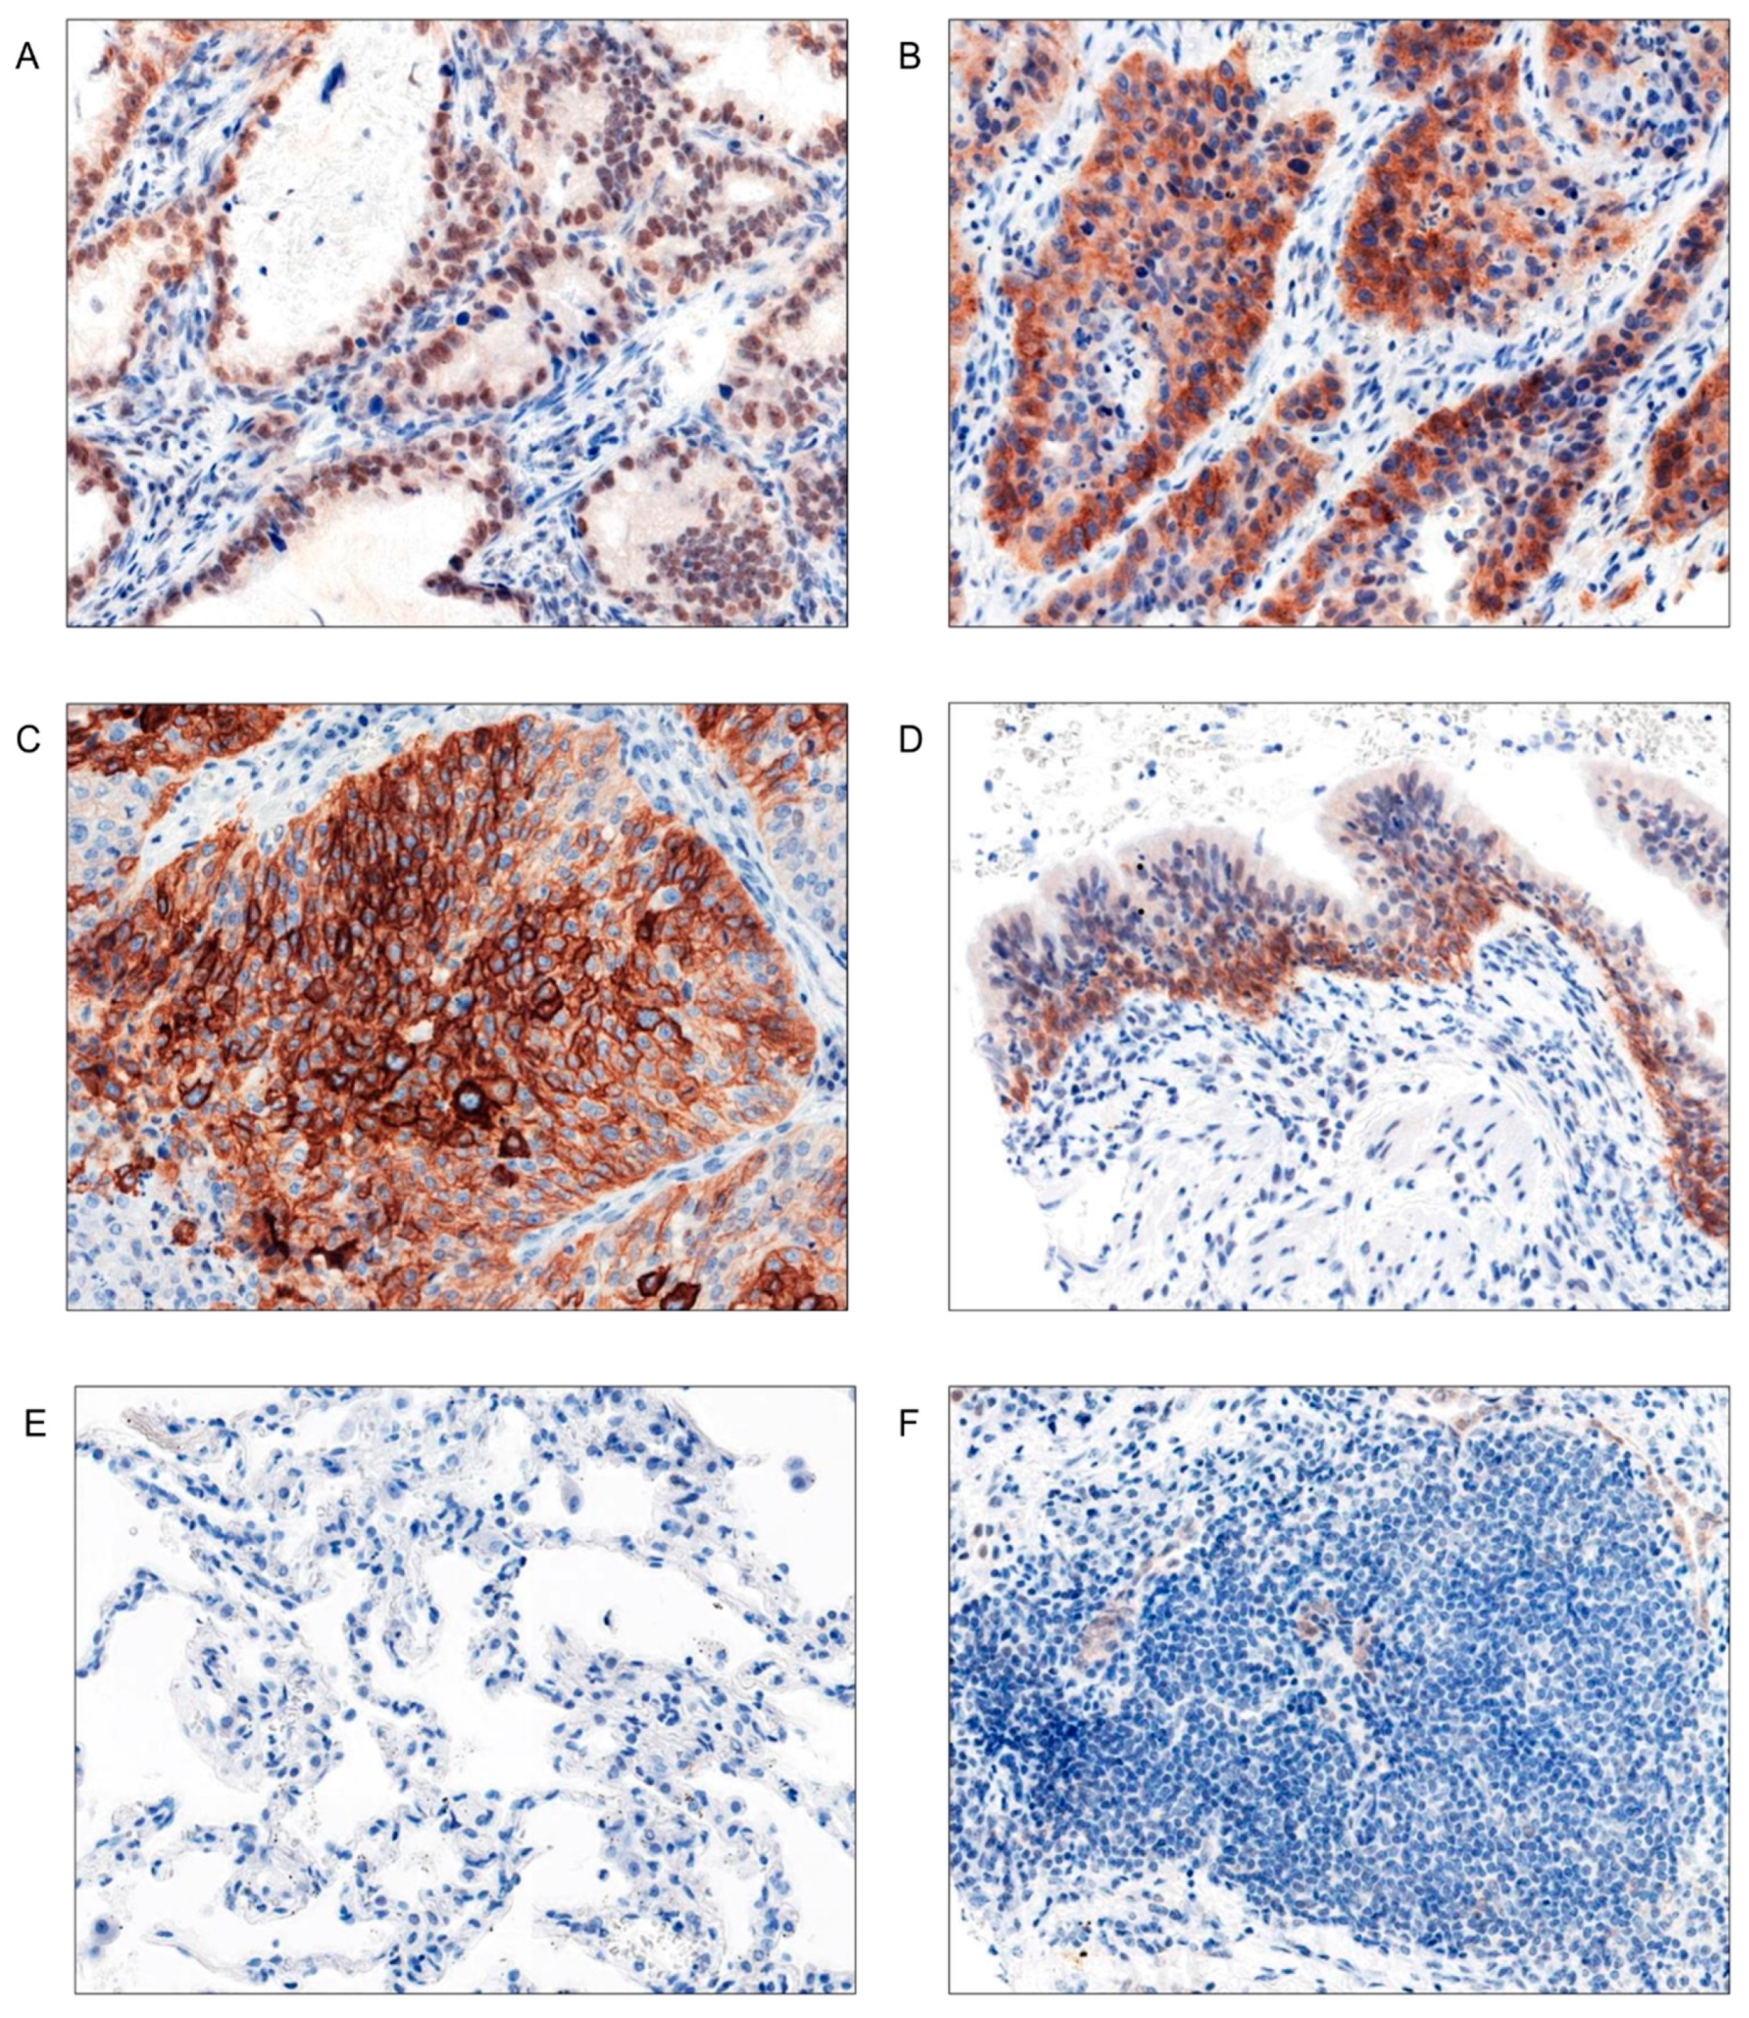
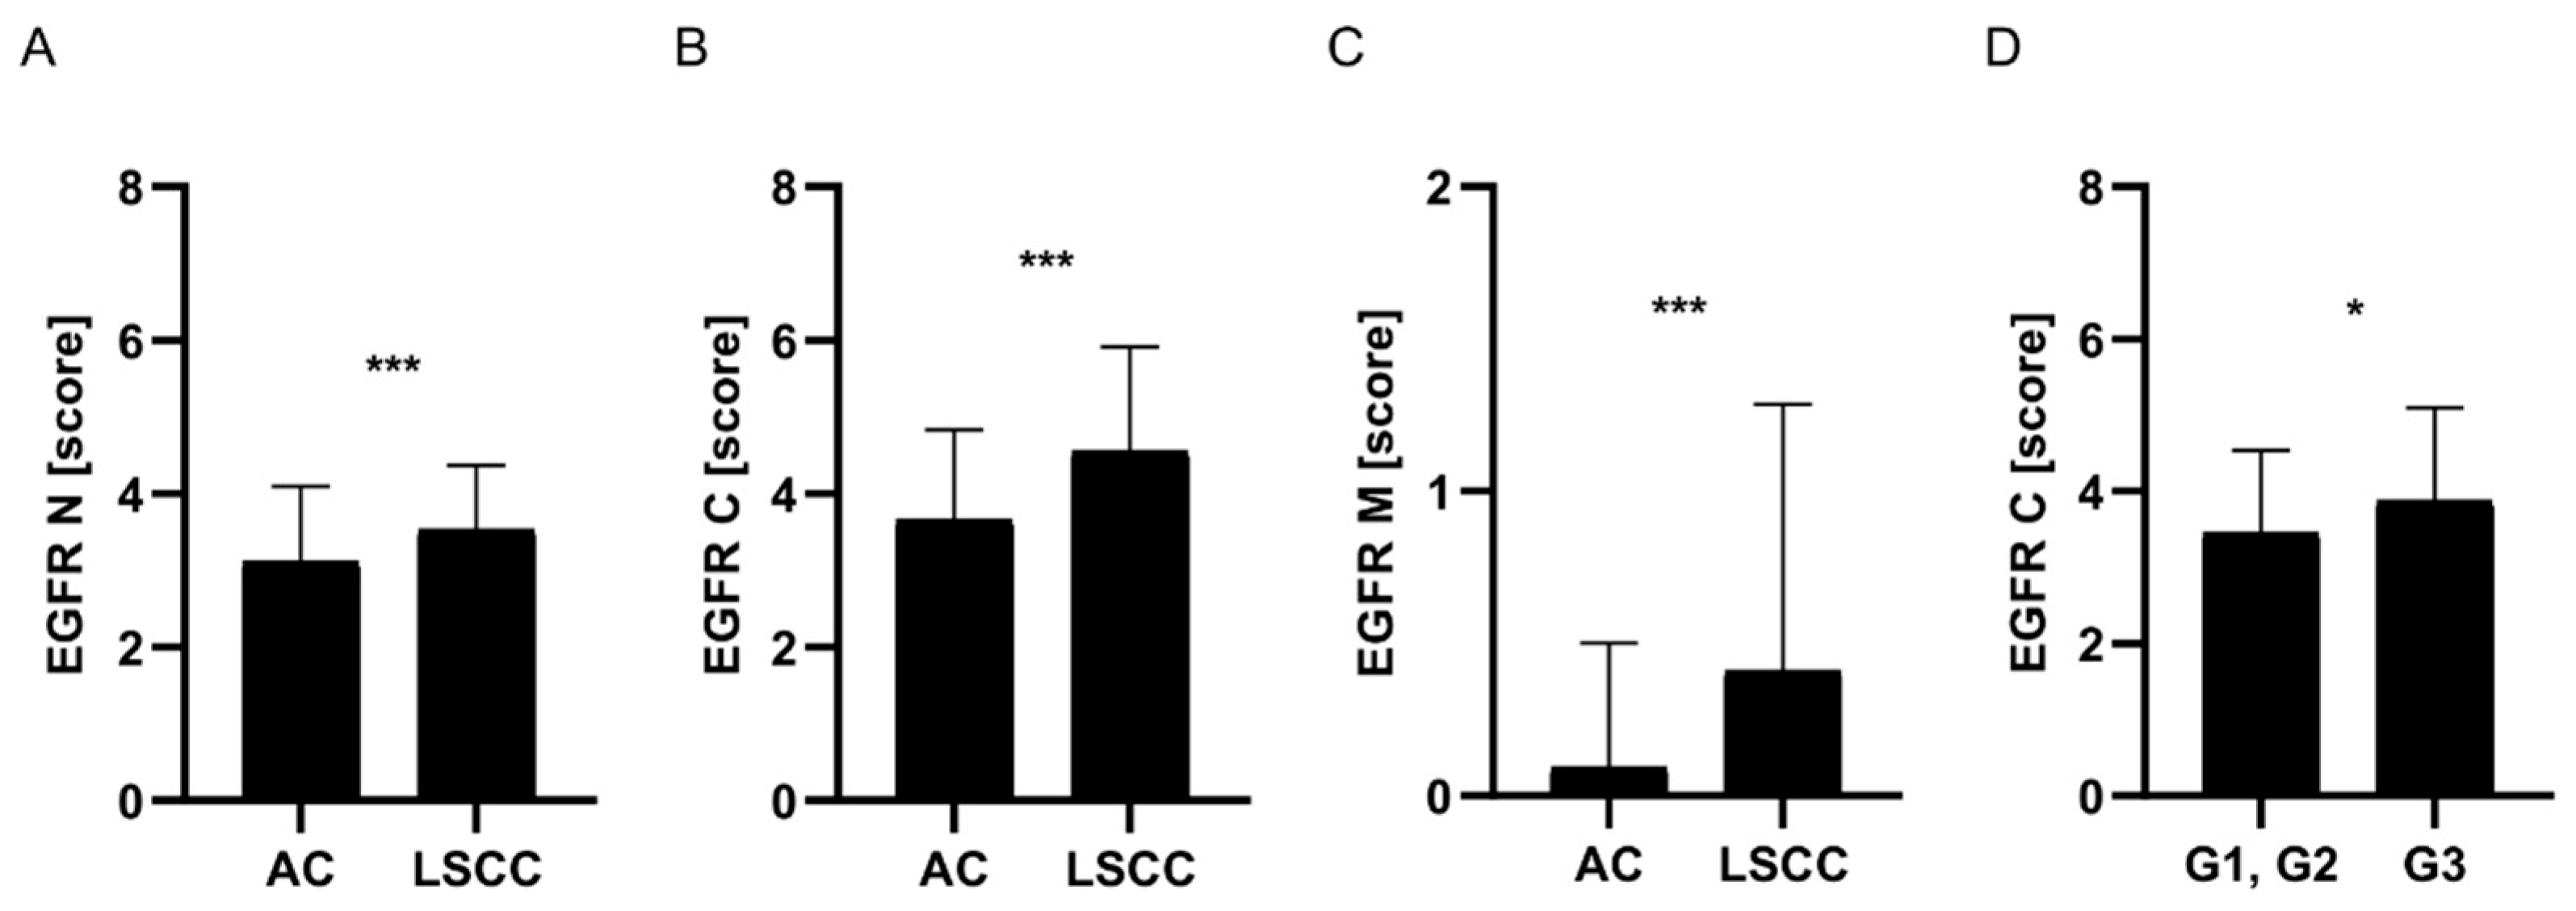
EGFR Protein Expression Was Significantly Higher in LSCC Compared to AC Tumors
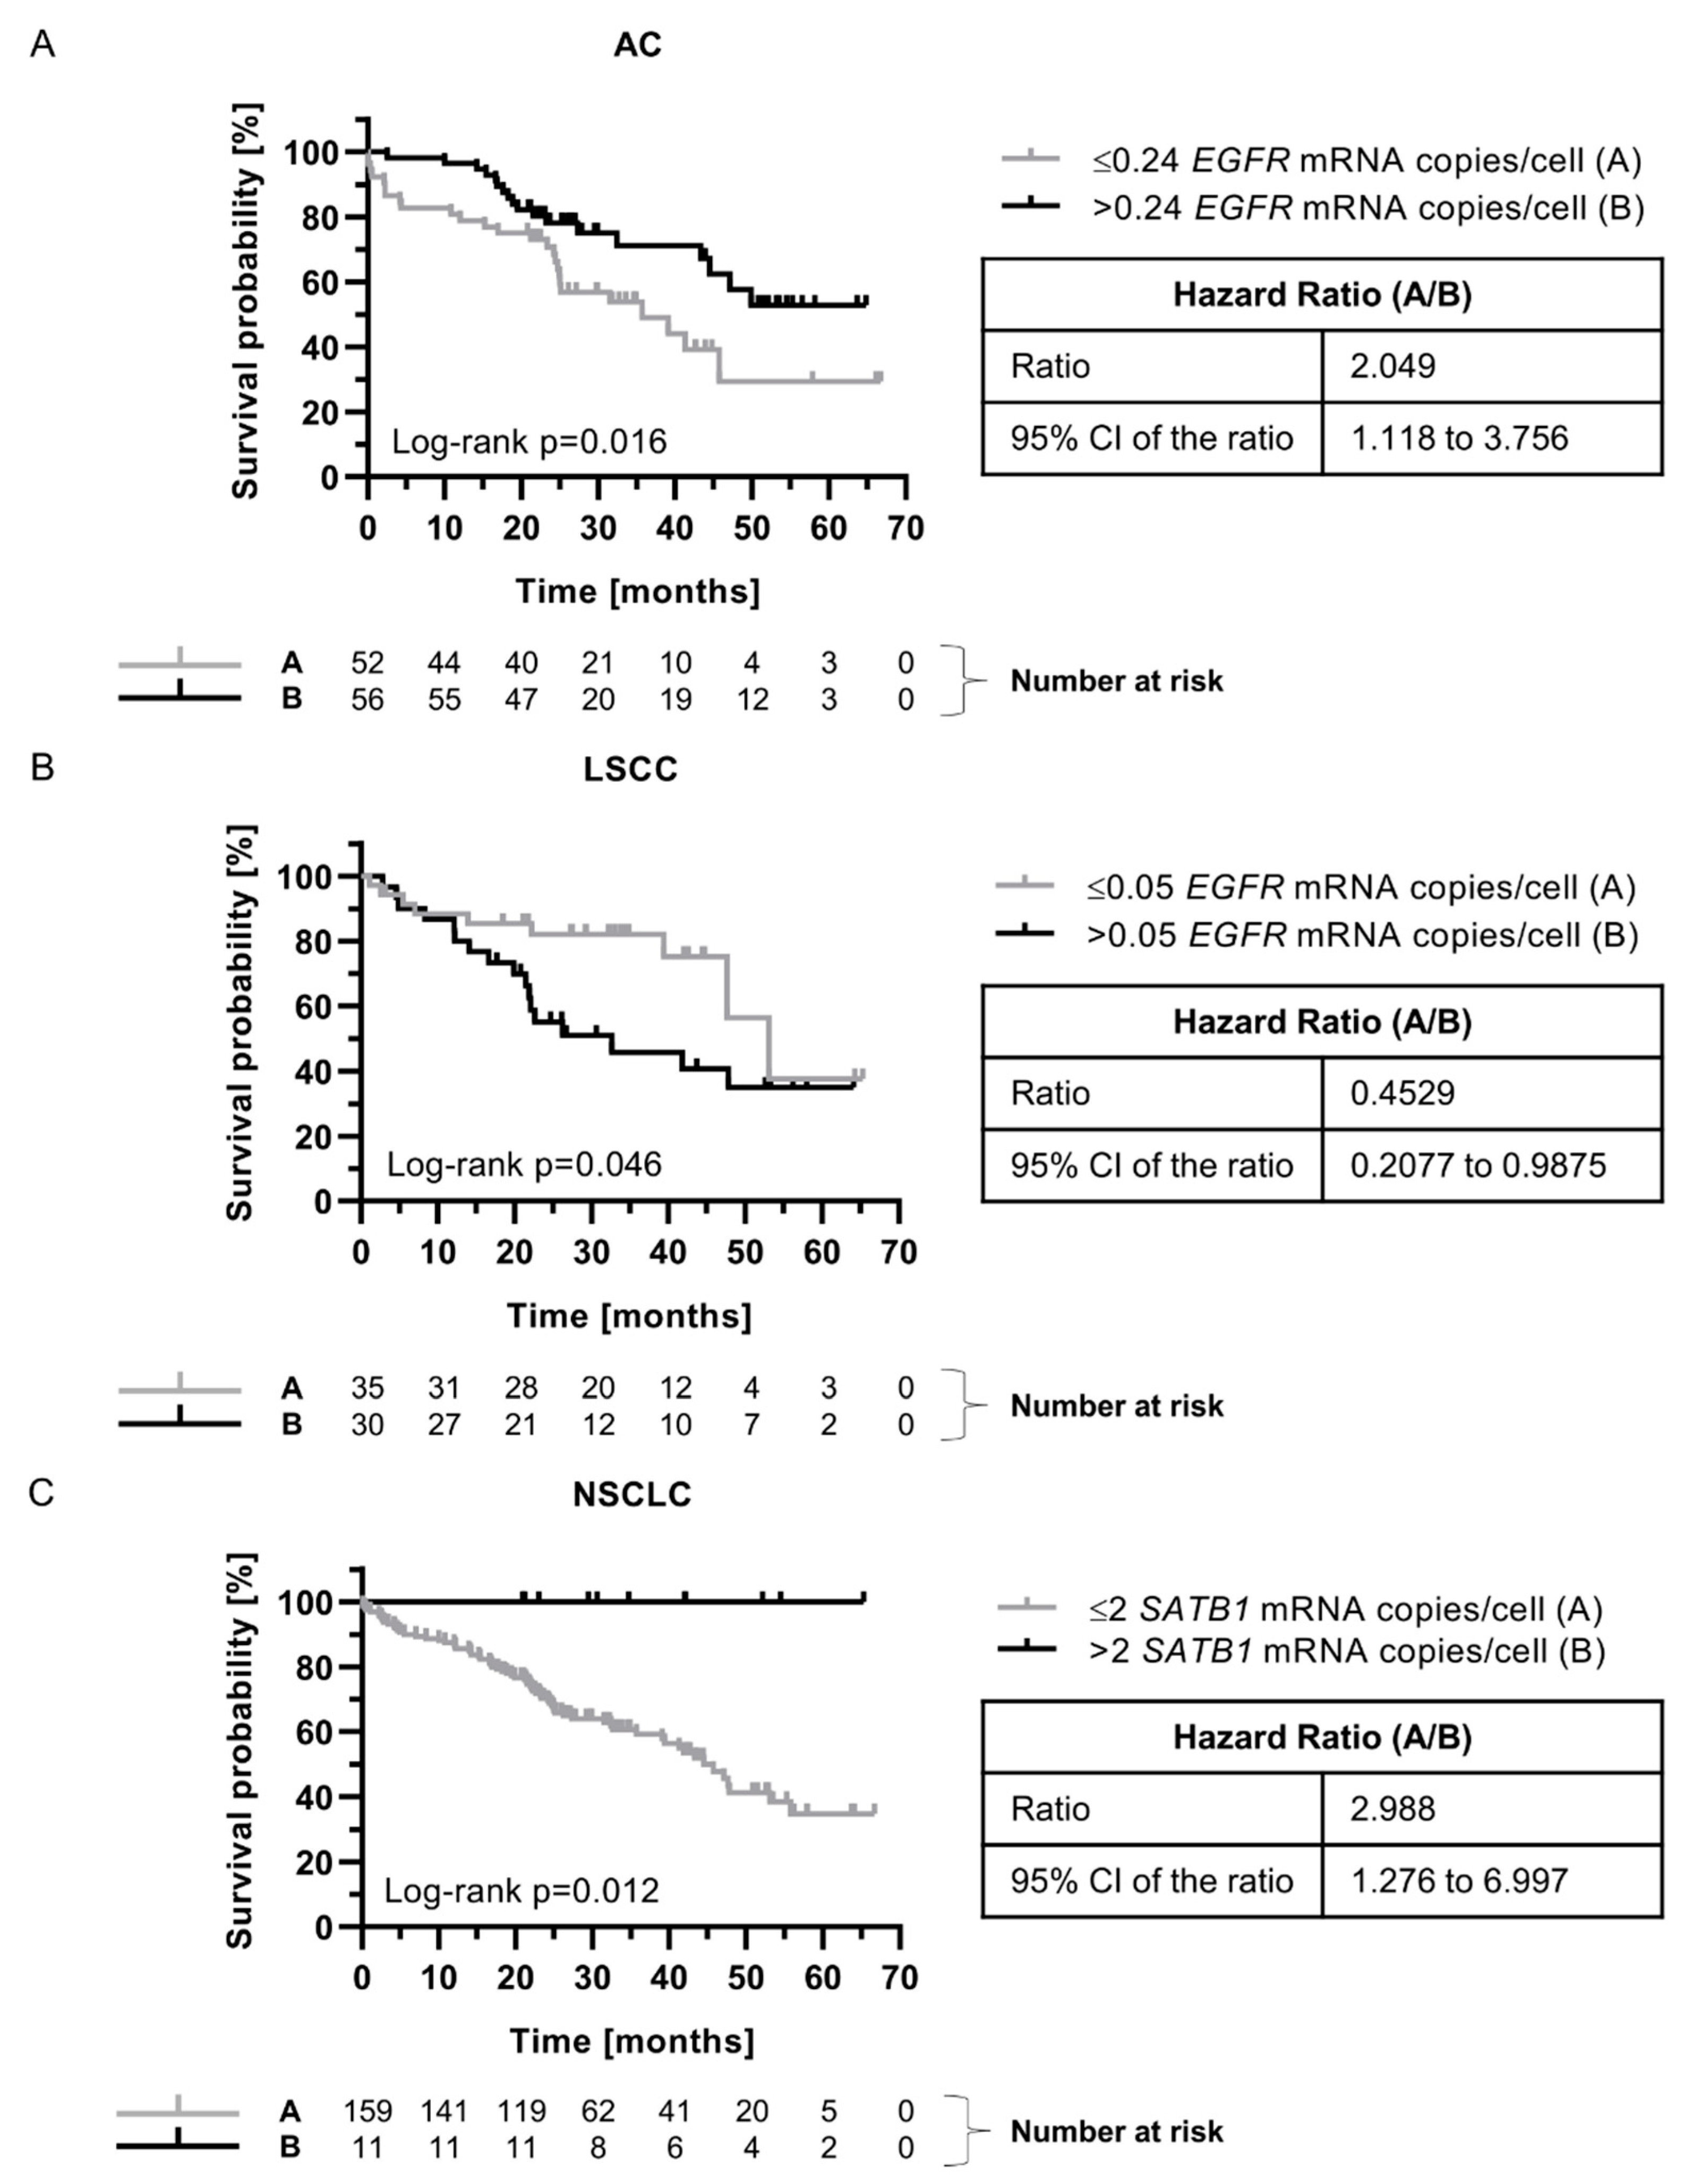
The Prognostic Significance of EGFR mRNA Expression Depended on Tumor Histology
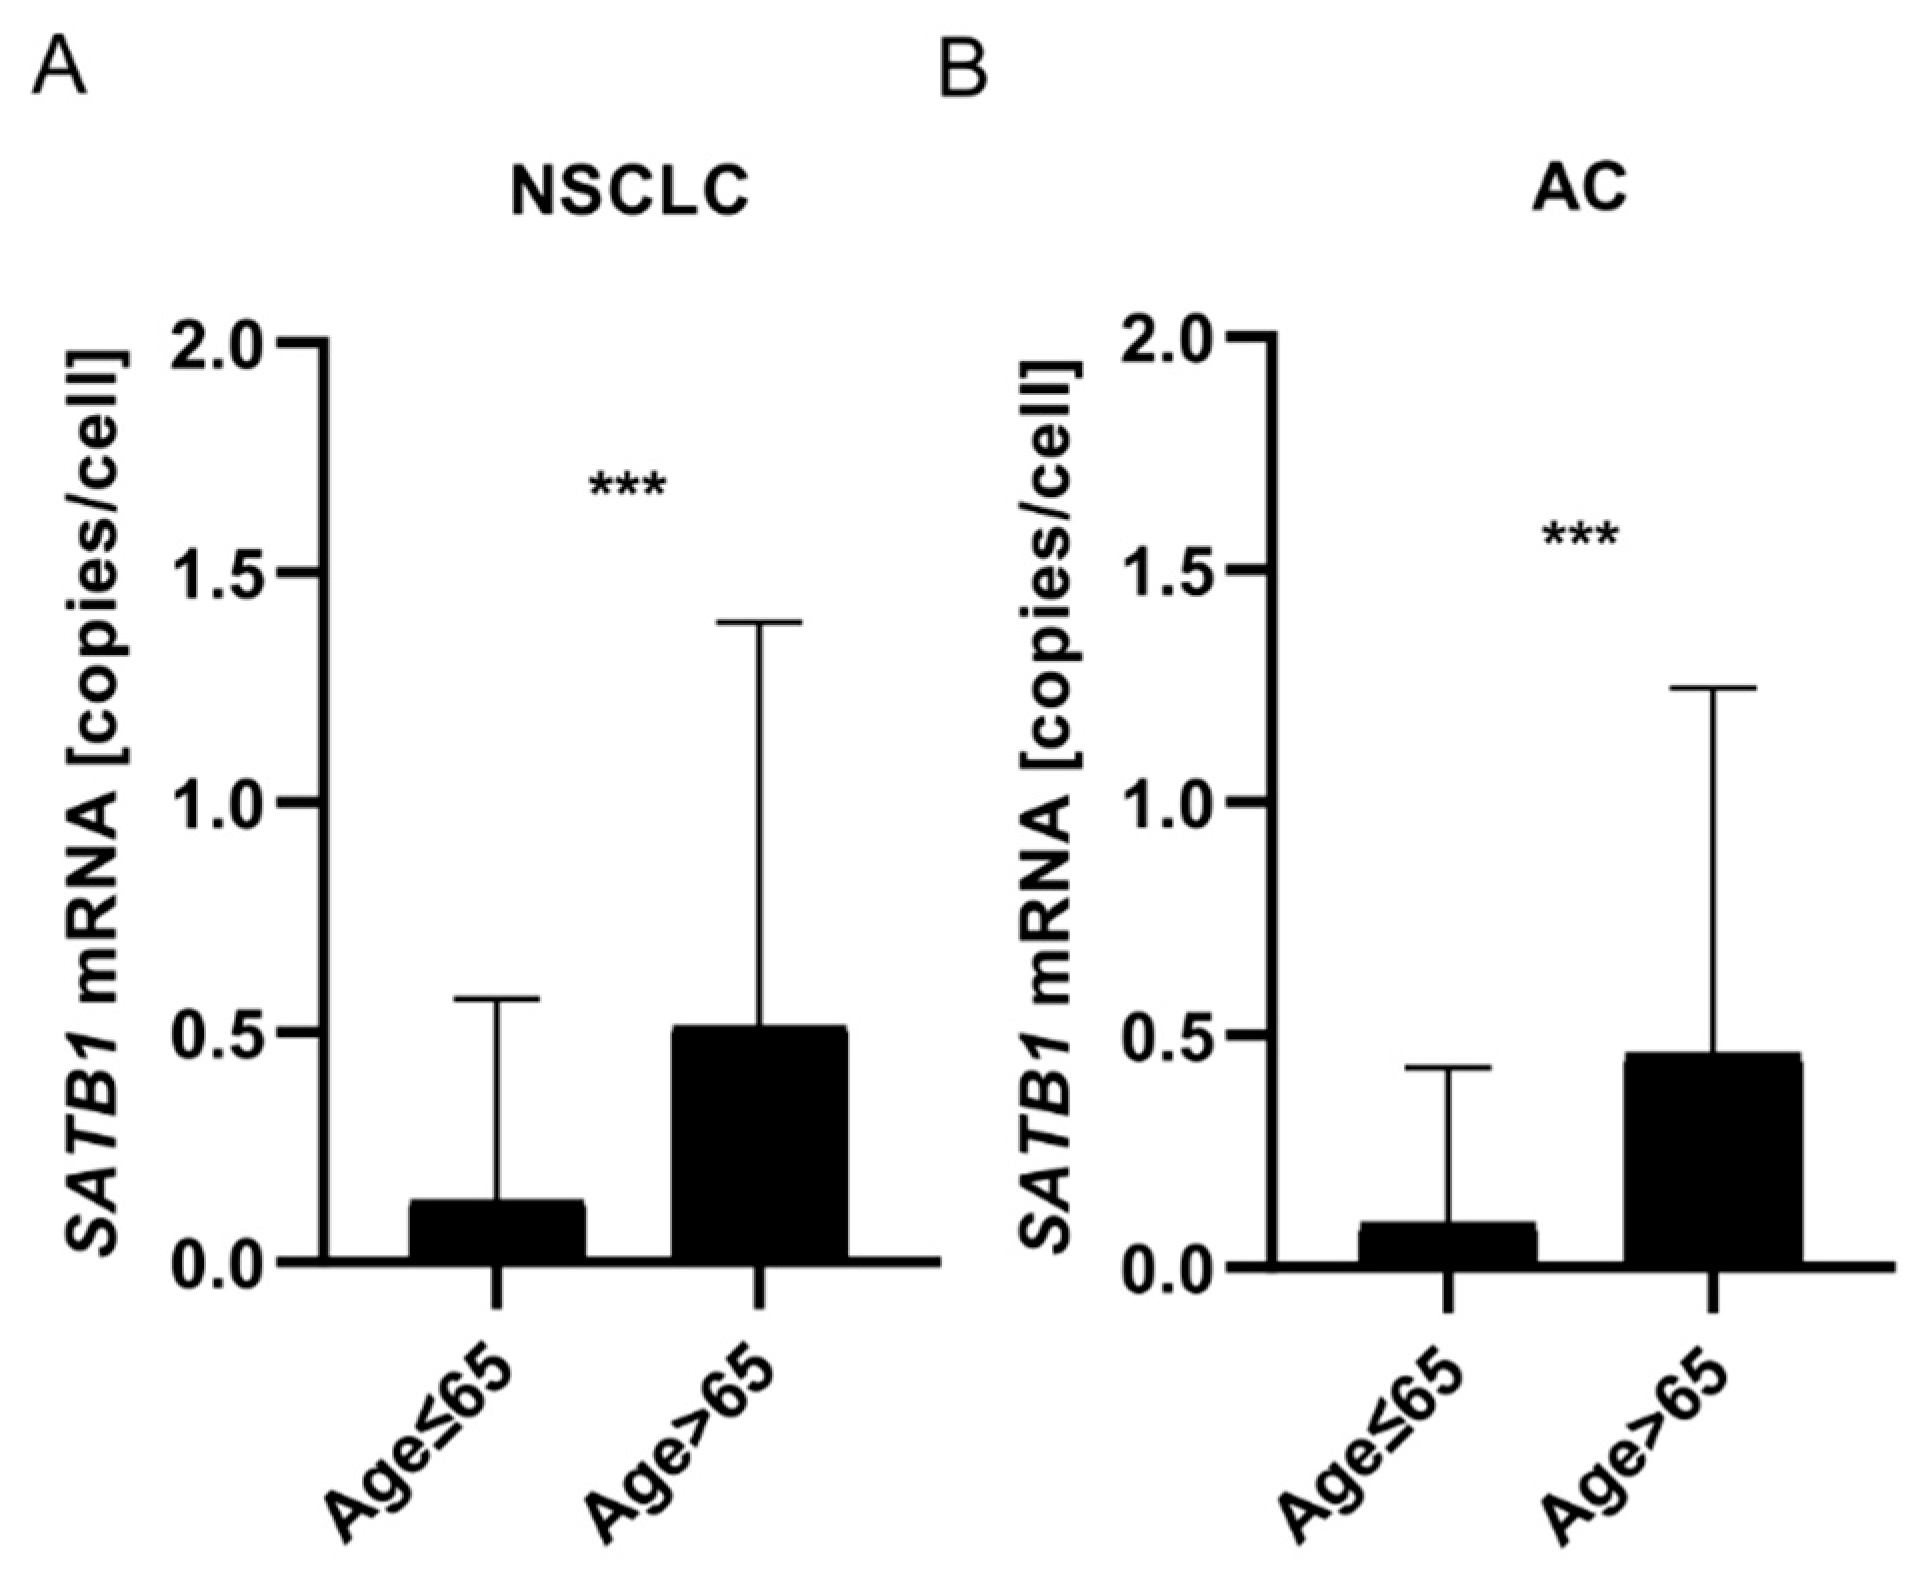
Expression of SATB1 mRNA Increased with Patients’ Age
SATB1 mRNA Expression Was Associated with Better Prognosis for NSCLC Patients
EGFR mRNA Expression Was Negatively Associated with the Level of EGFR Protein and EMT-Promoting Transcription Factors
3. Discussion
5. Conclusions
Supplementary Materials
Author Contributions
Funding
Institutional Review Board Statement
Informed Consent Statement
Data Availability Statement
Acknowledgments
Conflicts of Interest
References
- Ferlay J, Ervik M, Lam F, et al. Cancer Today (version 1.1). Global Cancer Observatory.
- Niemira M, Collin F, Szalkowska A, et al. Molecular signature of subtypes of non-small-cell lung cancer by large-scale transcriptional profiling: Identification of key modules and genes by weighted gene co-expression network analysis (WGCNA). Cancers (Basel) 2020; 12. [CrossRef]
- Zhang Y, Vaccarella S, Morgan E, et al. Global variations in lung cancer incidence by histological subtype in 2020: a population-based study. Lancet Oncol 2023; 24: 1206-1218.
- Levantini E, Maroni G, Del Re M, et al. EGFR signaling pathway as therapeutic target in human cancers. Semin Cancer Biol 2022; 85: 253-275. [CrossRef]
- Karlsen EA, Kahler S, Tefay J, et al. Epidermal growth factor receptor expression and resistance patterns to targeted therapy in non-small cell lung cancer: A review. Cells 2021; 10. [CrossRef]
- Kalemkerian GP, Narula N, Kennedy EB, et al. Molecular testing guideline for the selection of patients with lung cancer for treatment with targeted tyrosine kinase inhibitors: American society of clinical oncology endorsement of the college of American pathologists/ international association for the. J Clin Oncol 2018; 36: 911-919.
- Wang F, Fu S, Shao Q, et al. High EGFR copy number predicts benefits from tyrosine kinase inhibitor treatment for non-small cell lung cancer patients with wild-type EGFR. J Transl Med 2013; 11: 90. [CrossRef]
- Xu N, Fang W, Mu L, et al. Overexpression of wildtype EGFR is tumorigenic and denotes a therapeutic target in non-small cell lung cancer. Oncotarget 2016; 7: 3884-3896. [CrossRef]
- Brandt B, Meyer-Staeckling S, Schmidt H, et al. Mechanisms of egfr Gene Transcription Modulation: Relationship to Cancer Risk and Therapy Response. Clin Cancer Res 2006; 12.
- Han H-J, Russo J, Kohwi Y, et al. SATB1 reprogrammes gene expression to promote breast tumour growth and metastasis. Nature 2008; 452: 187-193. [CrossRef]
- Frömberg A, Engeland K, Aigner A. The Special AT-rich Sequence Binding Protein 1 (SATB1) and its role in solid tumors. Cancer Lett 2018; 417: 96-111. [CrossRef]
- Glatzel-Plucinska N, Piotrowska A, Dziegiel P, et al. The Role of SATB1 in Tumour Progression and Metastasis. Vol 20. MDPI AG; 2019. [CrossRef]
- Wang, Shengjie; Zeng, Junjie; Xiao, Rui; Xu, Guoxing; Liu, Gang; Xiong, Disheng; Ye, Yongzhi; Chen, Borong; Wang, Haibin; Luo, Qi; Huang Z. Poor prognosis and SATB1 overexpression in solid tumours: a meta-analysis. Cancer Manag Res 2018; 10: 1471-1478.
- Huang BO, Zhou H, Wang S, et al. Effect of silencing SATB1 on proliferation, invasion and apoptosis of A549 human lung adenocarcinoma cells. Oncol Lett 2016; 12: 3818-3824. [CrossRef]
- Glatzel-Plucinska N, Piotrowska A, Grzegrzolka J, et al. SATB1 Level Correlates with Ki-67 Expression and Is a Positive Prognostic Factor in Non-small Cell Lung Carcinoma. Anticancer Res 2018; 38: 723-736. [CrossRef]
- Glatzel-Plucinska N, Piotrowska A, Rzechonek A, et al. SATB1 protein is associated with the epithelial-mesenchymal transition process in non-small cell lung cancers. Oncol Rep 2021; 45: 1-18. [CrossRef]
- Selinger CI, Cooper W a, Al-Sohaily S, et al. Loss of special AT-rich binding protein 1 expression is a marker of poor survival in lung cancer. J Thorac Oncol 2011; 6: 1179-1189. [CrossRef]
- Frömberg A, Rabe M, Oppermann H, et al. Analysis of cellular and molecular antitumor effects upon inhibition of SATB1 in glioblastoma cells. BMC Cancer 2017; 17: 3. [CrossRef]
- Frömberg A, Rabe M, Aigner A. Multiple effects of the special AT-rich binding protein 1 (SATB1) in colon carcinoma. Int J cancer 2014; 135: 2537-2546. [CrossRef]
- Bankhead P, Loughrey MB, Fernández JA, et al. QuPath: Open source software for digital pathology image analysis. Sci Rep 2017; 7: 1-7. [CrossRef]
- ACD. Using QuPath to analyze RNAscopeTM, BaseScopeTM and miRNAscopeTM images. Tech Notes 2020: 1-26.
- Kamio T, Shigematsu K, Sou H, et al. Immunohistochemical expression of epidermal growth factor receptors in human adrenocortical carcinoma. Hum Pathol 1990; 21: 277-282. [CrossRef]
- Nie L, Wang Y-N, Hsu J-M, et al. Nuclear export signal mutation of epidermal growth factor receptor enhances malignant phenotypes of cancer cells. Am J Cancer Res 2023; 13: 1209-1239.
- Atwell B, Chalasani P, Schroeder J. Nuclear epidermal growth factor receptor as a therapeutic target. Explor Target Anti-tumor Ther 2023; 4: 616-629. [CrossRef]
- Wang JL, Fang CL, Tzeng YT, et al. Prognostic value of localization of epidermal growth factor receptor in lung adenocarcinoma. J Biomed Sci 2018; 25: 1-8. [CrossRef]
- Traynor AM, Weigel TL, Oettel KR, et al. Nuclear EGFR protein expression predicts poor survival in early stage non-small cell lung cancer. Lung Cancer 2013; 81: 138-141. [CrossRef]
- Nichita, Mirela Marcela; Giurcaneanu, Calin; Mihai, Mara Madalina; Ghiugulescu, Mihaela; Beiu, Cristina; Negoita, Silvius Ioan; Popa LG. The immunoexpression of epidermal growth factor receptor in cutaneous squamous cell carcinoma. Rom J Morphol Embryol 2021; 62: 201-208. [CrossRef]
- Yang CC, Lin LC, Lin YW, et al. Higher nuclear EGFR expression is a better predictor of survival in rectal cancer patients following neoadjuvant chemoradiotherapy than cytoplasmic EGFR expression. Oncol Lett 2019; 17: 1551. [CrossRef]
- Saloura V, Vougiouklakis T, Zewde M, et al. WHSC1L1-mediated EGFR mono-methylation enhances the cytoplasmic and nuclear oncogenic activity of EGFR in head and neck cancer. Sci Rep 2017; 7: 40664. [CrossRef]
- Tsao AS, Ming Tang X, Sabloff B, et al. Clinicopathologic Characteristics of the EGFR Gene Mutation in Non–small Cell Lung Cancer. J Thorac Oncol 2006; 1: 231-239. [CrossRef]
- Italiano A, Burel Vandenbos F, Otto J., et al. Comparison of the epidermal growth factor receptor gene and protein in primary non-small-cell-lung cancer and metastatic sites: implications for treatment with EGFR-inhibitors. Ann Oncol 2006; 17: 981-985. [CrossRef]
- Maramotti S, Paci M, Manzotti G, et al. Soluble Epidermal Growth Factor Receptors (sEGFRs) in Cancer: Biological Aspects and Clinical Relevance. Int J Mol Sci 2016; 17. [CrossRef]
- Jantus-Lewintre E, Sirera R, Cabrera A, et al. Analysis of the Prognostic Value of Soluble Epidermal Growth Factor Receptor Plasma Concentration in Advanced Non–Small-Cell Lung Cancer Patients. Clin Lung Cancer 2011; 12: 320-327. [CrossRef]
- Ye P, Zhao J, Wang S, et al. The plasma level of soluble epidermal growth factor Receptor (EGFR) and overall survival (OS) in non-small-cell lung cancer (NSCLC) patients. J Clin Oncol 2015; 33. [CrossRef]
- Lococo F, Paci M, Rapicetta C, et al. Preliminary evidence on the diagnostic and molecular role of circulating soluble EGFR in non-small cell lung cancer. Int J Mol Sci 2015; 16: 19612-19630. [CrossRef]
- Meert A-P, Martin B, Delmotte P, et al. The role of EGF-R expression on patient survival in lung cancer: a systematic review with meta-analysis. Eur Respir J 2002; 20: 975-981. [CrossRef]
- Nakamura H, Kawasaki N, Taguchi M, et al. Survival impact of epidermal growth factor receptor overexpression in patients with non-small cell lung cancer: a meta-analysis. Thorax 2006; 61: 140-145. [CrossRef]
- Cengiz Seyhan E, Altin S, Cetinkaya E, et al. Prognostic value of epidermal growth factor receptor expression in operable non-small cell lung carcinoma. Multidiscip Respir Med 2010; 5: 305-311. [CrossRef]
- Gately K, Forde L, Cuffe S, et al. High coexpression of both EGFR and IGF1R correlates with poor patient prognosis in resected non-small-cell lung cancer. Clin Lung Cancer 2014; 15: 58-66. [CrossRef]
- Tang Z, Li C, Kang B, et al. GEPIA: a web server for cancer and normal gene expression profiling and interactive analyses. Nucleic Acids Res 2017; 45: W98-W102. [CrossRef]
- Tang G, Cho M, Wang X. OncoDB: an interactive online database for analysis of gene expression and viral infection in cancer. Nucleic Acids Res 2022; 50: D1334-D1339. [CrossRef]
- Yan G, Saeed MEM, Foersch S, et al. Relationship between EGFR expression and subcellular localization with cancer development and clinical outcome. Oncotarget 2019; 10: 1918-1931. [CrossRef]
- Russo T, Kollisnyk B, Aswathy BS, et al. The SATB1-MIR22-GBA Axis Mediates Glucocerebroside Accumulation Inducing a Cellular Senescence-like Phenotype in Dopaminergic Neurons.; 2023. [CrossRef]
- Riessland M, Kolisnyk B, Wan Kim T, et al. Loss of SATB1 induces p21-dependent cellular senescence in post-mitotic dopaminergic neurons. Cell Stem Cell 2019; 25: 514-530. [CrossRef]
- Ahmed MI, Pickup ME, Rimmer AG, et al. Interplay of MicroRNA-21 and SATB1 in Epidermal Keratinocytes during Skin Aging. J Invest Dermatol 2020; 139: 2538-2542. [CrossRef]
- Lena AM, Mancini M, Rivetti di Val Cervo P, et al. MicroRNA-191 triggers keratinocytes senescence by SATB1 and CDK6 downregulation. Biochem Biophys Res Commun 2012; 423: 1763-1768. [CrossRef]
- Li Q-Q, Chen Z-Q, Cao X-X, et al. Involvement of NF-κB/miR-448 regulatory feedback loop in chemotherapy-induced epithelial-mesenchymal transition of breast cancer cells. Cell Death Differ 2011; 18: 16-25.
- Huang W-C, Chen Y-J, Li L-Y, et al. Nuclear Translocation of Epidermal Growth Factor Receptor by Akt-dependent Phosphorylation Enhances Breast Cancer-resistant Protein Expression in Gefitinib-resistant Cells. J Biol Chem 2011; 286: 20558-20568. [CrossRef]
- Chen B, Xue Z, Yang G, et al. Akt-Signal Integration Is Involved in the Differentiation of Embryonal Carcinoma Cells. PLoS One 2013; 8. [CrossRef]
- Wang X, Goldstein D, Crowe PJ, et al. Next-generation EGFR/HER tyrosine kinase inhibitors for the treatment of patients with non-small-cell lung cancer harboring EGFR mutations: a review of the evidence. Onco Targets Ther 2016; 9: 5461-5473. [CrossRef]
- Takeda T, Tsubaki M, Matsuda T, et al. EGFR inhibition reverses epithelial-mesenchymal transition, and decreases tamoxifen resistance via Snail and Twist downregulation in breast cancer cells. Oncol Rep 2022; 47: 1-13. [CrossRef]
- Kusewitt DF, Choi C, Newkirk KM, et al. Slug/Snai2 is a downstream mediator of epidermal growth factor receptor-stimulated reepithelialization. J Invest Dermatol 2009; 129: 491-495. [CrossRef]
- Bronte G, Bravaccini S, Bronte E, et al. Epithelial-to-mesenchymal transition in the context of epidermal growth factor receptor inhibition in non-small-cell lung cancer. Biol Rev 2018; 93: 1735-1746.
- Jakobsen KR, Demuth C, Sorensen BS, et al. The role of epithelial to mesenchymal transition in resistance to epidermal growth factor receptor tyrosine kinase inhibitors in non-small cell lung cancer. Transl lung cancer Res 2016; 5: 172-182. [CrossRef]

| Parameters |
All cases (N=239) n (%) |
AC (N=149) n (%) |
LSCC (N=90) n (%) |
|
| Gender | Male | 144 (60.2) | 85 (57.0) | 59 (65.6) |
| Female | 95 (39.8) | 64 (43.0) | 31 (34.4) | |
| Age (years) | Median | 66 | 65 | 66 |
| Range | 44-84 | 44-84 | 44-82 | |
| Malignancy grade | G1 | 3 (1.3) | 3 (2.0) | 0 (0.0) |
| G2 | 149 (62.3) | 72 (48.3) | 77 (85.6) | |
| G3 | 87 (36.4) | 74 (49.7) | 13 (14.4) | |
| Tumor size | pT1 | 75 (31.4) | 56 (37.6) | 19 (21.1) |
| pT2 | 122 (51.0) | 65 (43.6) | 57 (63.3) | |
| pT3 | 23 (9.6) | 11 (7.4) | 12 (13.3) | |
| pT4 | 5 (2.1) | 4 (2.7) | 1 (1.1) | |
| No data | 23 (9.6) | 13 (8.7) | 1 (1.1) | |
| Lymph nodes | pN0 | 144 (60.2) | 82 (55.0) | 62 (68.9) |
| pN1 | 40 (16.7) | 23 (15.4) | 17 (18.9) | |
| pN2 | 41 (17.2) | 31 (20.8) | 10 (11.1) | |
| No data | 14 (5.9) | 13 (8.7) | 1 (1.1) | |
| Stage | I | 102 (42.7) | 64 (43.0) | 38 (42.2) |
| II | 76 (31.8) | 36 (24.2) | 40 (44.4) | |
| III | 45 (18.8) | 34 (22.8) | 11 (12.2) | |
| IV | 2 (0.83) | 2 (1.3) | 0 (0.0) | |
| No data | 14 (5.9) | 13 (8.7) | 1 (1.1) | |
| Overall survival | Deaths | 94 (39.3) | 62 (41.6) | 32 (35.6) |
| Alive | 144 (60.3) | 86 (57.7) | 58 (64.4) | |
| No data | 1 (0.42) | 1 (0.67) | 0 (0.0) | |
| Parameters |
All cases (N=170) n (%) |
AC (N=104) n (%) |
LSCC (N=66) n (%) |
|
| Gender | Male | 104 (61.18) | 58 (55.77) | 46 (69.70) |
| Female | 66 (38.82) | 46 (44.23) | 20 (30.30) | |
| Age (years) | Median | 66 | 66 | 66 |
| Range | 44-82 | 44-82 | 52-82 | |
| Malignancy grade | G1 | 1 (0.59) | 1 (0.96) | 0 (0.0) |
| G2 | 105 (61.76) | 49 (47.11) | 56 (84.85) | |
| G3 | 64 (37.65) | 54 (51.92) | 10 (15.15) | |
| Tumor size | pT1 | 51 (30.00) | 36 (34.61) | 15 (22.73) |
| pT2 | 87 (51.18) | 47 (45.19) | 40 (60.61) | |
| pT3 | 16 (9.41) | 6 (5.77) | 10 (15.15) | |
| pT4 | 5 (2.94) | 4 (3.85) | 1 (1.51) | |
| No data | 11 (6.47) | 11 (10.58) | 0 (0.0) | |
| Lymph nodes | pN0 | 105 (61.76) | 58 (55.77) | 47 (71.21) |
| pN1 | 23 (13.53) | 12 (11.54) | 11 (16.67) | |
| pN2 | 31 (18.24) | 23 (22.11) | 8 (12.12) | |
| No data | 11 (6.47) | 11 (10.58) | 0 (0.0) | |
| Stage | I | 70 (41.18) | 45 (43.27) | 25 (37.88) |
| II | 53 (31.18) | 21 (20.19) | 32 (48.48) | |
| III | 34 (20.00) | 25 (24.03) | 9 (13.64) | |
| IV | 2 (1.18) | 2 (1.92) | 0 (0.0) | |
| No data | 11 (6.47) | 11 (10.58) | 0 (0.0) | |
| Overall survival | Deaths | 100 (58.82) | 42 (40.38) | 39 (59.09) |
| Alive | 69 (40.59) | 61 (58.65) | 27 (40.91) | |
| No data | 1 (0.59) | 1 (0.96) | 0 (0.0) | |
| Score | Percentage of the positive cells and intensity of the staining |
| 0 | No staining is observed or staining is observed in <10% of the tumor cells |
| 1 | A faint membrane staining is observed in >10% of the tumor cells |
| 2 | A weak or moderate, complete membrane staining is observed in >10% of the tumor cells |
| 3 | A strong, complete membrane staining is observed in >10% of the tumor cells |
| Target molecule | Gene name | Probe number |
| mRNA for EGFR protein | EGFR | VA1-11736-VT (Thermo Fisher Scientific) |
| mRNA for SATB1 protein | SATB1 | VA1-13726-VT (Thermo Fisher Scientific) |
| 18S ribosomal RNA | 555RN18S1 | VA1-3020734-VT (Thermo Fisher Scientific) |
| EGFR N | ||||||
| Protein | NSCLC | AC | LSCC | |||
| Spearman’s R | P-value | Spearman’s R | P-value | Spearman’s R | P-value | |
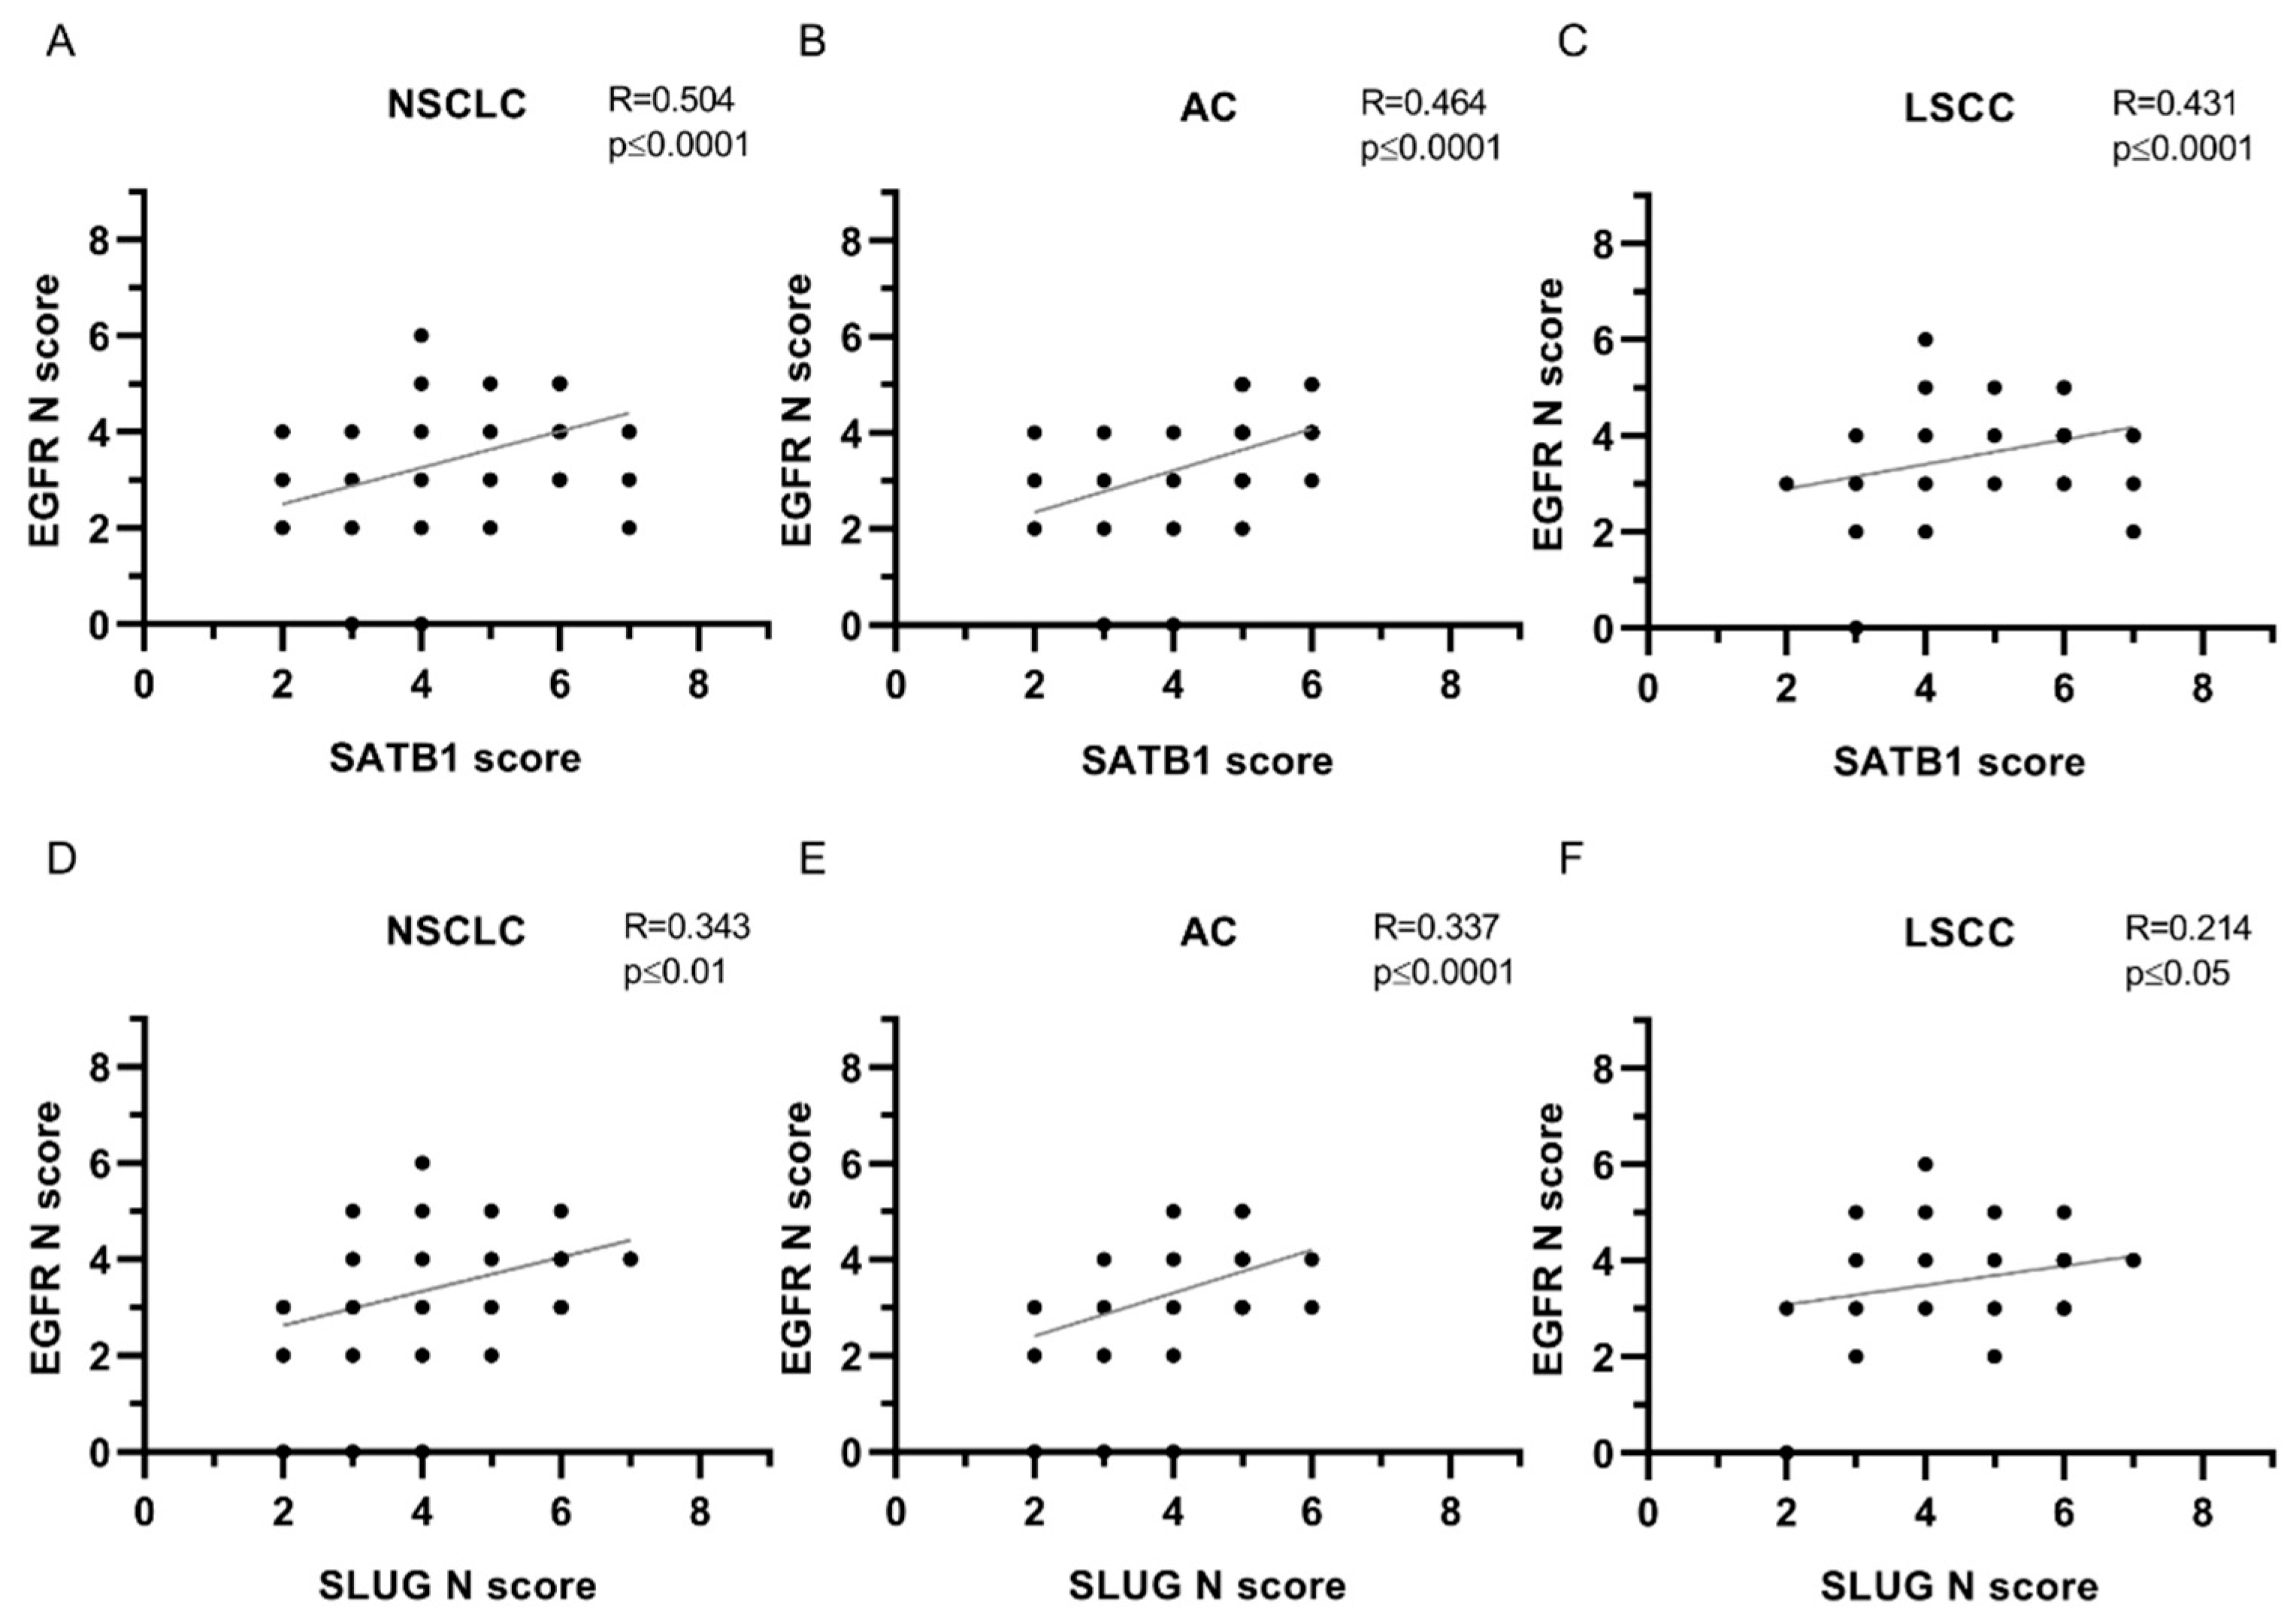
| SATB1 | 0.504 | **** | 0.464 | **** | 0.431 | **** |
| Ki67 | 0.206 | *** | 0.106 | ns | 0.186 | ns |
| E-cadherin | 0.043 | ns | 0.004 | ns | 0.088 | ns |
| N-cadherin | 0.035 | ns | -0.013 | ns | 0.052 | ns |
| SNAIL | 0.129 | * | 0.205 | * | -0.086 | ns |
| SLUG N | 0.343 | ** | 0.337 | **** | 0.214 | * |
| SLUG C | 0.173 | **** | 0.227 | ** | 0.160 | ns |
| Twist1 | 0.249 | *** | 0.156 | ns | 0.241 | * |
| EGFR C | ||||||
| Protein | NSCLC | AC | LSCC | |||
| Spearman’s R | P-value | Spearman’s R | P-value | Spearman’s R | P-value | |
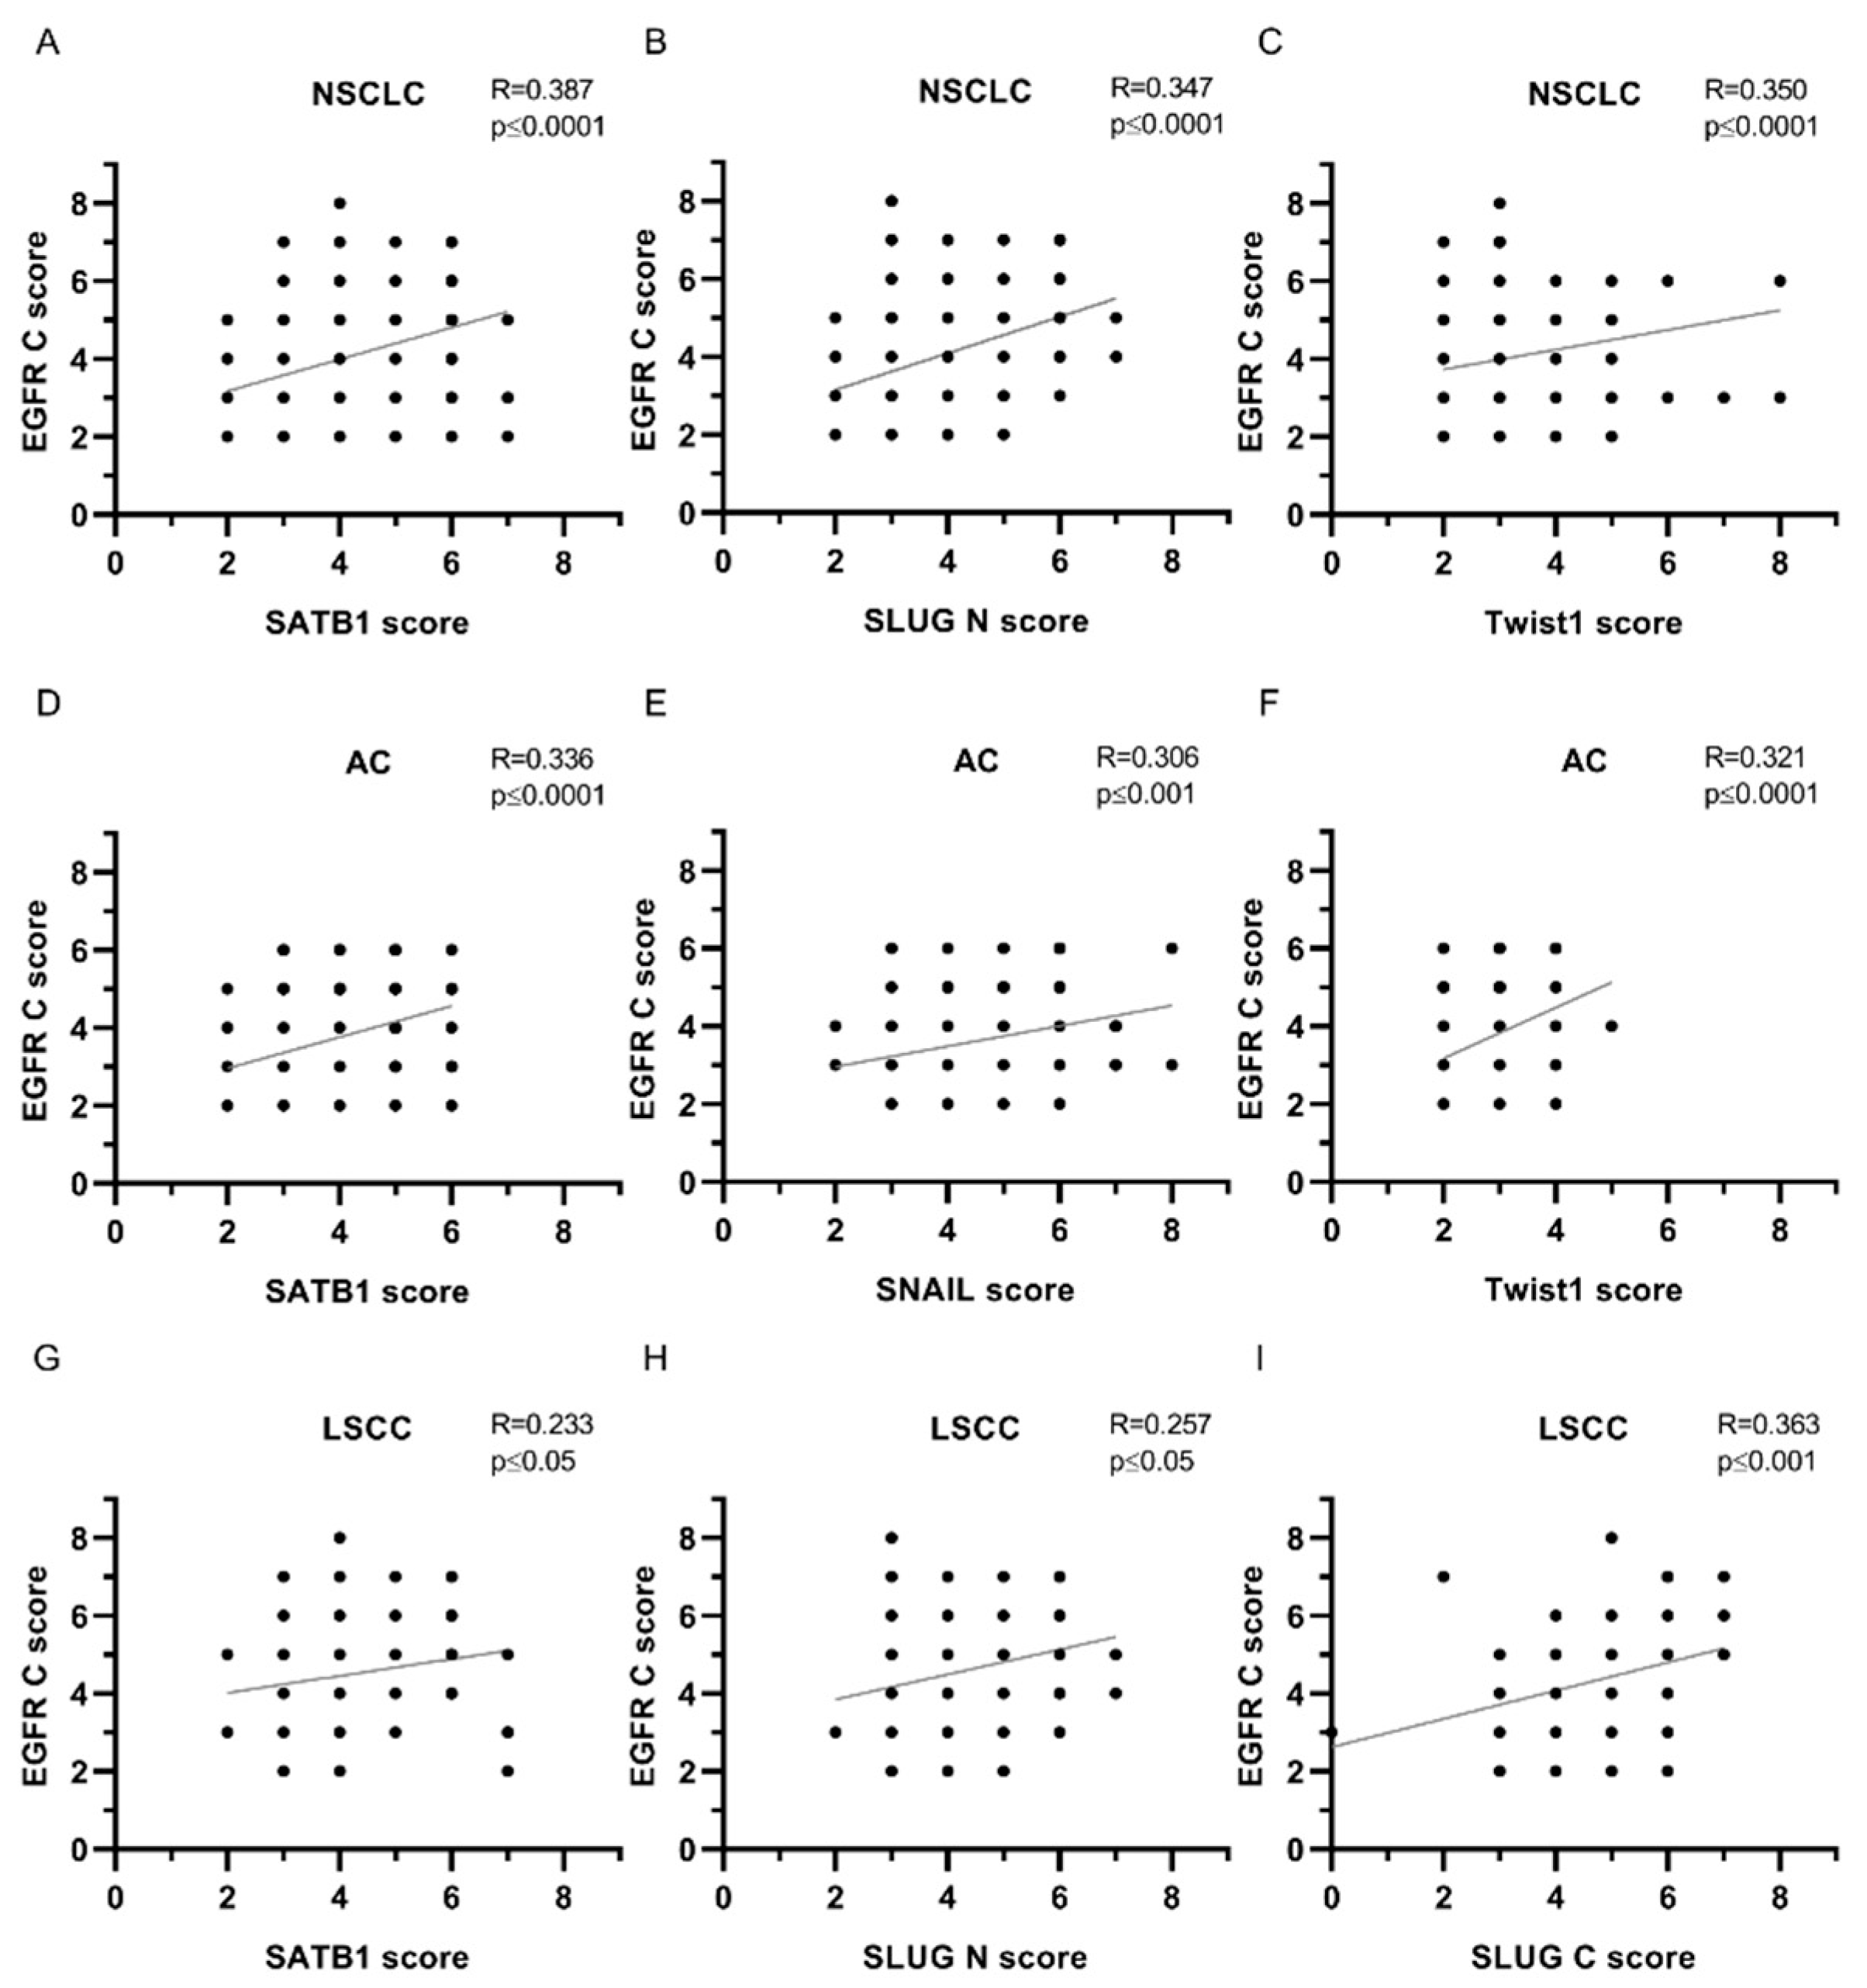
| SATB1 | 0.387 | **** | 0.336 | **** | 0.233 | * |
| Ki67 | 0.217 | *** | 0.084 | ns | 0.117 | ns |
| E-cadherin | 0.071 | ns | 0.015 | ns | 0.132 | ns |
| N-cadherin | 0.039 | ns | -0.138 | ns | 0.118 | ns |
| SNAIL | 0.220 | *** | 0.306 | *** | 0.008 | ns |
| SLUG N | 0.347 | **** | 0.248 | ** | 0.257 | * |
| SLUG C | 0.226 | *** | 0.203 | * | 0.363 | *** |
| Twist1 | 0.350 | **** | 0.321 | **** | 0.151 | ns |
| EGFR M | ||||||
| Protein | NSCLC | AC | LSCC | |||
| Spearman’s R | P-value | Spearman’s R | P-value | Spearman’s R | P-value | |
| SATB1 | 0.166 | ** | 0.044 | ns | 0.137 | ns |
| Ki67 | 0.186 | ** | 0.206 | * | 0.027 | ns |
| E-cadherin | 0.065 | ns | 0.053 | ns | 0.053 | ns |
| N-cadherin | 0.093 | ns | 0.072 | ns | 0.065 | ns |
| SNAIL | 0.093 | ns | 0.204 | * | -0.031 | ns |
| SLUG N | 0.184 | ** | 0.102 | ns | 0.135 | ns |
| SLUG C | 0.080 | ns | 0.063 | ns | 0.142 | ns |
| Twist1 | 0.075 | ns | 0.009 | ns | -0.041 | ns |
| EGFRmRNA | ||||||
| Protein | NSCLC | AC | LSCC | |||
| Spearman’s R | P-value | Spearman’s R | P-value | Spearman’s R | P-value | |
| EGFR N | -0.196 | ** | -0.345 | *** | 0.094 | ns |
| EGFR C | -0.195 | ** | -0.260 | ** | -0.088 | ns |
| EGFR M | -0.081 | ns | 0.008 | ns | -0.149 | ns |
| SATB1mRNA | -0.078 | ns | -0.226 | ns | -0.092 | ns |
| SATB1 | -0.131 | ns | -0.170 | ns | -0.073 | ns |
| Ki67 | -0.021 | ns | 0.075 | ns | -0.153 | ns |
| E-cadherin | -0.011 | ns | 0.054 | ns | -0.180 | ns |
| N-cadherin | -0.128 | ns | -0.079 | ns | -0.165 | ns |
| SNAIL | -0.185 | * | -0.133 | ns | -0.283 | * |
| SLUG N | -0.251 | *** | -0.247 | ** | -0.260 | * |
| SLUG C | -0.118 | ns | -0.076 | ns | -0.188 | ns |
| Twist1 | -0.183 | * | -0.280 | ** | -0.048 | ns |
Disclaimer/Publisher’s Note: The statements, opinions and data contained in all publications are solely those of the individual author(s) and contributor(s) and not of MDPI and/or the editor(s). MDPI and/or the editor(s) disclaim responsibility for any injury to people or property resulting from any ideas, methods, instructions or products referred to in the content. |
© 2024 by the authors. Licensee MDPI, Basel, Switzerland. This article is an open access article distributed under the terms and conditions of the Creative Commons Attribution (CC BY) license (http://creativecommons.org/licenses/by/4.0/).


