Submitted:
04 October 2024
Posted:
07 October 2024
You are already at the latest version
Abstract
Spectroscopic techniques have emerged as crucial tools in the field of malaria research, offering immense potential for improved diagnosis and enhanced understanding of the disease. This re-view article pays tribute to the pioneering contributions of Professor Henry Mantsch in the realm of clinical biospectroscopy, by comprehensively exploring the diverse applications of spectro-scopic methods in malaria research. From the identification of reliable biomarkers to the devel-opment of innovative diagnostic approaches, spectroscopic techniques spanning the ultraviolet to far-infrared regions have played a pivotal role in advancing our knowledge of malaria. This re-view will highlight the multifaceted ways in which spectroscopy has contributed to the field, with a particular emphasis on its impact on diagnostic advancements and drug research. By leverag-ing the minimally invasive and highly accurate nature of spectroscopic techniques, researchers have made significant strides in improving the detection and monitoring of malaria parasites. These advancements hold the promise of enhancing patient outcomes and aiding in the global ef-forts towards the eradication of this devastating disease.
Keywords:
malaria
; hemozoin
; spectroscopy
; infrared
; Raman spectroscopy
; near-infrared
; SERS
; TERS
; UV/Visible
; photoacoustic
; AFM-IR
; antimalarial
1. Introduction
The Malaria remains a formidable global health challenge, with an estimated 249 million cases in 2022, a 55% increase from pre-COVID-19 levels [1]. To effectively combat this disease, there is a critical need for affordable and highly sensitive diagnostic tests that can identify asymptomatic carriers [2]. Nucleic acid amplification tests, such as Polymerase Chain Reaction (PCR) assays, are highly sensitive methods for detecting low-density malaria infections. However, their use is limited to well-equipped laboratory settings due to their complexity [2].
In response to the need for more accessible diagnostic tools, ultrasensitive Rapid Diagnostic Tests (uRDTs) have been developed. These tests, which detect proteins like Histidine-Rich Protein 2 (HRP2), have shown promise in laboratory conditions, following the same principles as conventional Rapid Diagnostic Tests (cRDTs) [3]. However, the sensitivity and specificity of these uRDTs are still lower compared to the gold standard PCR assays. In a recent meta-analysis, the Alere™ Ultra-sensitive Malaria Ag P. falciparum RDT had a sensitivity of 72.1% for symptomatic patients, higher than the 67.4% sensitivity reported for cRDTs in the same field conditions [3]. Yet, these values remain well below the 95% sensitivity achieved by PCR assays [3].
To strengthen the fight against malaria, continued research and development are critical. Improving the performance of malaria diagnostic tests is essential, bringing them closer to the accuracy of laboratory-based molecular tests while maintaining the affordability and portability that are crucial for widespread deployment, especially in resource-limited settings. In this context, spectroscopic approaches offer a viable alternative as point-of-care tests in remote villages and resource-poor clinical settings. These spectroscopic techniques can also play a role in developing new drugs and understanding the mechanisms of drug interaction, along with monitoring the therapeutic effects of drugs by quantifying parasitemia - a capability currently lacking in rapid diagnostic tests (RDTs). By enhancing the accuracy, affordability, and accessibility of malaria diagnostics, we can bolster the tools available to combat this devastating disease, particularly in the most vulnerable communities.
The use of spectroscopic techniques for disease diagnosis was eloquently summarized by Professor Henry Mantsch, who stated that "changes in tissue biochemistry must precede any morphological or symptomatic manifestations, thus allowing spectroscopic diagnosis at an earlier stage of the disease" [4]. This principle has been instrumental in the fight against malaria, where spectroscopic methods have provided a minimally-invasive and accurate approach to detecting and monitoring the disease. These diagnostic tools span a range of spectroscopic modalities, including Fourier transform infrared (FTIR), near-infrared (NIR), Raman, surface enhanced Raman scattering (SERS) tip enhanced Raman scattering (TERS), atomic force microscopy-infrared (AFM-IR), ultraviolet/visible (UV/Vis) and photoacoustic spectroscopy.
Infrared spectroscopy has shown great promise in malaria diagnosis, as it can detect specific biomarkers associated with Plasmodium-infected red blood cells. These biomarkers include lipids, proteins, and hemozoin, a by-product of the malaria parasite's hemoglobin digestion. Raman spectroscopic approaches have relied on detecting hemozoin but other markers including proteins and lipids can also be detected using Raman spectroscopy. Near-infrared spectroscopy, on the other hand, leverages the unique optical properties of hemozoin and lipids to differentiate between infected and uninfected red blood cells using the overtone and combination bands of these biomarkers. UV/Visible spectroscopy has been employed to detect changes in the optical absorption spectra of blood samples, which can be correlated with the presence and density of malaria parasites.
The advantages of spectroscopic approaches for malaria diagnosis are numerous. These techniques are minimally invasive, requiring only a small blood sample, and can provide rapid, objective results without the need for skilled personnel. Moreover, they have the potential to detect asymptomatic infections, which are crucial for interrupting disease transmission. Importantly, spectroscopic methods can also quantify parasitemia levels, enabling healthcare providers to monitor the efficacy of antimalarial drug treatments. The field of spectroscopy-based malaria diagnostics has seen remarkable advancements with the development of miniaturized chip-based spectrometers [5,6]. These compact devices integrate multiple spectroscopic functions onto a single electronic chip, enabling greater affordability and portability compared to traditional bulky spectrometers. The integration of microelectromechanical systems (MEMS) and complementary metal-oxide-semiconductor (CMOS) technology has been pivotal in realizing this compact and versatile design, allowing for the seamless incorporation of spectroscopic capabilities into smaller, more accessible platforms. This technological progress has significantly expanded the applications of clinical spectroscopy, empowering healthcare professionals and researchers with powerful analytical tools that can be readily deployed in various clinical settings.
While spectroscopic techniques have shown promising results in laboratory settings, their translation to the clinic and point-of-care settings is not without limitations. Factors such as sample preparation, environmental interference, and variations in individual physiology can affect the accuracy and reliability of these methods. Addressing these challenges through continued research and development is essential for a broader adoption of spectroscopic approaches in the field. This review will provide an overview of the application of optical spectroscopy techniques in the diagnosis and research of malaria. The review will highlight the key spectroscopic biomarkers that have been identified for the detection of malaria infection before delineating the diverse range of spectroscopic methods that have been utilized in malaria research, including FTIR, Raman, SERS, NIR, AFM/IR, photothermal imaging, TERS photoacoustic and UV/Vis spectroscopy. For each technique, the review will discuss how spectroscopic signatures have contributed to advancing our understanding of malaria, from disease diagnosis to investigating drug interactions and mechanisms of action. Additionally, the review will address the barriers that have hindered the translation of these spectroscopic approaches from the research lab to clinical practice. Finally, the review will speculate on future applications and potential of optical spectroscopy in advancing malaria research and improving disease management. Overall, this review aims to provide a comprehensive survey of the role optical spectroscopy has played, and continues to play, in the fight against the global health challenge of malaria.
2. Life cycle of the parasite
The life cycle of the malaria parasite involves both a sexual and an asexual phase (Figure 1). Most current diagnostic techniques have focused on detecting markers of the erythrocytic (red blood cell) stage of the parasite's life cycle in peripheral blood. However, the future may see the exploration of alternative, non-invasive sample types such as saliva, breath, urine, and stool as potential targets for malaria diagnosis. These non-blood-based approaches could detect markers of infection without the need to identify circulating parasites in the peripheral blood.
3. Spectral biomarkers for malaria
3.1. Hemozoin
3.1.1. Discovery of hemozoin and malaria infection
Hemozoin, also known as malaria pigment, is a dark brown/black molecule that results from the catabolization of hemoglobin by the malaria parasite. For a detailed review on the molecular analysis of hemozoin, the reader is referred to a recent in-depth review by Rathi et al. [8] that comprehensively examines the structure, function, and biosynthesis of this important malaria pigment. Johann Friedrich Meckel, a German pathologist, made early observations of the malaria pigment in 1847. He noticed this dark pigment in the organs of individuals who had died of pernicious fever, often found in the spleen, liver, brain, or kidneys on autopsy. Meckel associated this pigment accumulation with the presence of malaria in the blood. [9] In 1871, Meckel's observations were later confirmed by two scientists - Rudolf Virchow in Germany and Maxime Cornu in France. However, their findings were not widely recognized at the time as they were unpublished. [9] In 1879, Philipp Friedrich Hermann Klencke, a German scientist, was also recognized for his early observations of the malaria parasite. [10] However, due to the lack of publication and differences in his drawings compared to later photomicrographs, his contributions were not widely acknowledged. [9] The ground-breaking discovery of the malaria parasite is credited to Alphonse Lavéran in 1880. [11] Lavéran's understanding of the significance of his discovery and its potential impact on the treatment and transmission of malaria earned him the Nobel Prize in Physiology or Medicine in 1907. While there was some debate over the priority of the discovery, Lavéran's work is considered the most significant in understanding and identifying the malaria parasite. [9]
3.1.1. Organisms producing hemozoin
Human malaria parasites, including P. falciparum, P. vivax, P. malariae, P. ovale, and P. knowlesi, all produce hemozoin during their life cycles. Hemozoin formation has also been documented in the New World monkey malaria parasite P. brasilianum, the rodent malaria parasite P. yoelii, and the avian malaria parasite P. gallinaceum. [12] Beyond the Plasmodium genus, hemozoin has been identified in another protozoan parasite that infects birds, Hemoproteus columbae. Interestingly, the unrelated human parasitic worms Schistosoma mansoni [13] and Echinostoma trivolvis also dispose of heme through hemozoin production, though E. trivolvis only forms the pigment when residing in its intermediate snail host. Even insects, such as kissing bugs of the genus Rhodnius, excrete excess heme as hemozoin in their faeces. [12] So, while hemozoin is closely associated with and vital to the lifecycle of the malaria parasite, trace amounts may occasionally be detected in a few other severe infectious or hematological conditions, though it remains a uniquely defining feature of Plasmodium infections.
3.1.2. Hemozoin location in humans
For P. falciparum infection, infected red blood cells (RBCs) containing trophozoites and schizonts are often absent from the peripheral circulation especially at low levels of infection. [14] However, at high levels of infection trophozoites have been reported in peripheral blood. [15] The low number of schizonts and trophozoites in peripheral blood is due to a process called sequestration, where the infected RBCs adhere to the endothelium of blood vessels, particularly in the venules. [14] The infected RBCs develop electron-dense structures on their membrane, known as knobs, which facilitate their attachment to the venular endothelium. By sequestering in the vasculature, the mature parasites (trophozoites and schizonts) can evade destruction in the spleen. Importantly, the sequestered parasites can continue to release new merozoites, which can then invade uninfected RBCs, thereby perpetuating the asexual cycle of the parasite. [14] This sequestration of P. falciparum-infected RBCs in the vasculature presents a potential opportunity for non-invasive diagnostic approaches. The stationary, sequestered cells containing hemozoin-rich trophozoites and schizonts could serve as targets for spectroscopic detection, such as NIR or Raman spectroscopy. Late-stage rings and mature stage IV-V gametocytes, which are found in peripheral blood, do contain hemozoin. [16] The female gametocyte is characterized by a centralized accumulation of the hemozoin pigment. The hemozoin granules are condensed and localized within the centre of the female gametocyte. In contrast, the hemozoin pigment in the male gametocyte is dispersed throughout the infected red blood cell, rather than being concentrated in the center. [16] Hemozoin is also found in leukocytes, including neutrophils [15,17] and monocytes. [17] While schizonts and trophozoites are not common in peripheral blood, other cell types including late-stage rings, gametocytes and leukocytes still make hemozoin an attractive marker for spectroscopy-based diagnosis.
3.1.3. Crystal structure
Hemozoin, is a crystalline pigment that has a well-characterized molecular and crystal structure. At the molecular level, hemozoin is a dimer of heme (ferriprotoporphyrin IX) molecules, where each heme molecule consists of a central ferric (Fe3+) iron atom coordinated to a porphyrin ring and various side chains. Synchrotron X-ray fluorescence powder diffraction data indicated that the heme molecules are linked together through a reciprocal coordination bond between the central iron atom of one heme and a carboxylate group of the propionate side chain of the adjacent heme. [18] The Fe–O bond distance converged to a value of 1.886(2) Å, which was found to be consistent with other high spin ferric porphyrins. [18] These hemozoin dimers then crystallize into a unique monoclinic crystal structure, with the heme dimers arranged in stacks and held together through hydrogen bonding and π-π stacking interactions between the porphyrin rings, as well as Van der Waals interactions between the alkyl side chains (Figure 2). The resulting hemozoin crystals typically range in size from 0.2 to 1.0 μm in length and exhibit a characteristic needle-like or rod-shaped morphology with a hexagonal cross-section. This unique crystal structure allows the malaria parasite to sequester the potentially toxic heme molecules, preventing them from causing oxidative damage to the parasite's cellular components, and the presence of hemozoin crystals in the blood of infected individuals serves as a diagnostic marker for malaria.
3.1.4. Raman spectroscopy of hemozoin
Raman spectroscopy is a powerful tool for the analysis of hemozoin, as it can provide detailed information about the molecular structure and vibrational modes of this important biomolecule. When analyzing hemozoin using Raman spectroscopy, several distinct and characteristic bands are observed in the spectrum. Excitation of hemozoin with a laser wavelength in the Soret band region (e.g., 406 nm) results in a significant enhancement of the Raman signal, a phenomenon known as type-A resonance Raman scattering (or Frank-Condon Scattering), due to the π→π* electronic transitions of the porphyrin, [20] which is in resonance with the excitation wavelength, allowing for the detection of very low concentrations of hemozoin and making it a highly sensitive technique for the identification and quantification of this biomolecule. The Raman bands observed in this region are primarily associated with the porphyrin ring vibrations, such as the intense ν4 mode at around 1375 cm−1, which corresponds to the C-N stretching of the porphyrin macrocycle. Excitation of hemozoin in the near-infrared region, such as with a 785 or 830 nm laser, also results in enhanced Raman scattering, attributed to the presence of the central iron atom in the heme group, which can undergo charge-transfer transitions with the porphyrin macrocycle in this wavelength range. Dramatic enhancement of certain Raman modes when irradiating β-hematin and hemin (the precursor to hemozoin) with 780 nm and 830 nm laser excitation wavelengths is observed (Figure 3). Specifically, the A1g modes at 1570, 1371, 795, 677, and 344 cm-1, the ring breathing modes in the 850-650 cm-1 range, and the out-of-plane modes including iron-ligand modes in the 400-200 cm-1 range were significantly enhanced. This enhancement was more pronounced in beta-hematin compared to hemin. The absorbance spectra recorded during the transformation of hemin to beta-hematin showed a red-shift of the Soret and Q (0-1) bands, which has been interpreted as resulting from excitonic coupling due to porphyrin aggregation. Additionally, a small broad electronic transition observed at 867 nm was assigned to a z-polarized charge-transfer transition dxz → eg(π*).
The extraordinary band enhancement observed when exciting beta-hematin with near-infrared wavelengths, compared to hemin, can be explained by the theory of aggregate-enhanced Raman scattering. This occurs due to intermolecular excitonic interactions between the porphyrinic units, leading to a superposition of electronic transitions that result in enhanced Raman scattering. Hemozoin pigment, like other haem pigments, produces intense overtone tones when excited with green laser light. [21] Enhancement with the 514.5 and 532 nm excitation laser lines, which are in close proximity to the vibronic Qv band of the visible spectrum of hemoporphyrins, enables the C–Term enhancement mechanism to dominate, which occurs between forbidden electronic transitions which are prohibited at the equilibrium geometry of the molecule. [21] The enhanced Raman scattering observed in both the Soret band and near-infrared regions is a characteristic feature of hemozoin and allows for its sensitive and selective detection in complex biological samples, such as those obtained from malaria-infected individuals, making Raman spectroscopy a valuable technique for the diagnosis and study of malaria.
3.1.5. FTIR spectroscopy of hemozoin
The FTIR spectra of β-hematin and hemozoin is shown in Figure 4. Slater et al. [22,23] were the first to report the infrared (IR) spectrum of hemozoin and β-hematin. They identified two distinct absorption bands in the hemozoin spectrum at 1664 cm-1 and 1211 cm-1, which were absent in the spectra of free heme (hematin) and heme complexes (hemin). By comparing the hemozoin spectrum to other iron-carboxylate containing compounds, Slater et al. [23] proposed that the heme units in hemozoin are coordinated in a unidentate fashion, where one of the carboxylate C-O bonds exhibits double-bond character, resulting in a C=O stretching vibration between 1700 and 1600 cm-1. The strong absorption at 1211 cm-1 was also attributed to the C-O stretching of an axial carboxylate ligand, based on studies of metalloporphyrin compounds with O-methyl groups, which showed similar C-O stretching bands in the 1270-1080 cm-1 region. [23] These distinct spectroscopic signatures of hemozoin, compared to the heme precursors, provided a valuable IR-based marker that could potentially be exploited for the development of diagnostic tools for malaria infection. The unique IR absorption features highlighted the structural differences between the crystalline hemozoin and the soluble heme species, which have important implications for understanding the biochemistry of malaria parasites.
3.1.6. UV/Visible spectroscopy of hemozoin
Hemin exhibits a distinct Soret band (or B band) that is resolved into two bands at 363 nm (S′) and 385 nm (S), along with Q bands at 495 nm, 521 nm, 550 nm (very weak), and 612 nm.In contrast, the Soret band of β-hematin collapses into a single broad band centered at 389 nm, along with a Q band at 649 nm, when observed at low pH. This distinction helps to discriminate β-hematin from hematin and hemin. Other bands observed in the absorbance spectrum of β-hematin include bands at 513 nm and 550 nm. [20] The absorbance spectrum of β-hematin at low pH exhibits characteristics consistent with those reported by Bohle et al.. [24] Their study, using a potassium bromide pellet technique, revealed distinct spectral bands at 406 nm, 510 nm, 538 nm, and 644 nm. [24] These findings align closely with our observed spectrum, providing corroborative evidence for the spectral properties of β-hematin under acidic conditions. [20] They also reported a band at 580 nm that is not observed in the solution spectra reported here. [24] The 649 nm band is characteristic of hemin aggregates, as determined by micro-spectrophotometry [25] and photoacoustic spectroscopy. [26] This band sequentially shifts (640 nm, 645 nm, 649 nm) as the pH decreases. Figure 5 shows representative spectra of the conversion of hemin to β-hematin. The decrease in pH causes broadening and reduced intensity of the Soret band in β-hematin, attributed to aggregation and precipitation. An apparent red-shift occurs from 363 nm to 389 nm, though accurate maxima determination is difficult due to the broad nature of the band at low pH. Red-shifts in both Soret and Q-bands indicate excitonic coupling from porphyrin aggregation. Interestingly, a small, broad band centered around 867 nm is observed in both hemin and β-hematin. [20] This band slightly red-shifts as the reaction progresses and appears less intense in β-hematin compared to hemin, likely due to β-hematin precipitation. This previously unreported band is tentatively assigned to a charge transfer (CT) transition, specifically band I (dxz → eg(π*)). [20] These spectral changes provide insight into the formation and characteristics of β-hematin, offering valuable information about the molecular processes involved in its synthesis and structure.
3.1.8. NIR spectroscopy of hemozoin
The near-infrared (NIR) spectra of hemozoin standard purchased from Invivogen and hemozoin extracted from infected red blood cells, along with synthetic β-hematin, are presented in Figure 6A-C. The spectra do not show much consistency, indicating a lot of impurities. Notably, the spectrum of hemozoin isolated from infected red blood cells (Figure 6B) exhibits slight differences in the 1960 nm - 2500 nm region compared to the hemozoin purchased from Invivogen. Specifically, four intense bands are observed at 1975 nm, 2055 nm, 2133 nm, and 2228 nm in the extracted hemozoin, whereas the synthetic β-hematin (Figure 6C) shows a single intense peak at 2216 nm. [5] These additional bands in the extracted hemozoin sample are tentatively assigned to ν(CH3/CH2) vibrations, possibly originating from residual hemoglobin left behind during the isolation process. The experimental NIR wavelength values are based on the second derivative spectra, providing enhanced spectral resolution and allowing for the identification of these subtle differences between the natural and synthetic forms of the pigment possibly resulting from impurities. [5]
3.2. Lipids
The role of lipids in the formation of hemozoin, a by-product of the malaria parasite's digestion of host hemoglobin, has been the subject of investigation. Bendrat et al. [27] suggested that this process is mediated by lipids, as they observed that an acetonitrile extract of P. falciparum promoted the formation of beta-hematin, a synthetic analogue of hemozoin. Further evidence supporting the involvement of lipids in hemozoin formation comes from the dramatic increase in lipid content within P. falciparum-infected erythrocytes [28,29,30,31] and observations of hemozoin localization in close proximity to neutral lipid bodies (NLBs). [30,32] Specifically, the parasites synthesize and package triacylglycerol (TAG) and diacylglycerol (DAG) into NLBs in a stage-specific manner within the digestive vacuole (DV). [30,33,34] These lipids are barely detectable in uninfected erythrocytes. [28,35] However, the precise function of NLBs during parasite growth remains unclear. It has been hypothesised that NLBs may serve as a depot of lipid intermediates generated during the digestion of phospholipids, [33] or alternatively as a source of lipids that can be mobilized to supply the growing parasite with fatty acids and acylglycerols for membrane generation. [34] Importantly, the specific composition of the P. falciparum NLB lipid blend, identified by mass spectrometry, has been shown to be sufficient for mediating hemozoin formation. [32] This lipid blend consists of a 4:2:1:1:1 ratio of the monoglycerides monostearoylglycerol (MSG) and monopalmitoylglycerol (MPG), and the diglycerides 1,3-dioleoylglycerol (DOG), 1,3-dipalmitoylglycerol (DPG), and 1,3-dilinoleoylglycerol (DLG). [32] Research has revealed some fascinating insights into the formation of β-hematin in the presence of lipids. Egan et al. [36] discovered that β-hematin can rapidly form under conditions that closely mimic the physiological environment, particularly in the presence of interfaces between octanol/water, pentanol/water, and lipid/water. Molecular dynamics simulations have provided further elucidation of this process. These simulations have shown that a precursor to the hemozoin dimer can spontaneously form in the absence of the competing hydrogen bonds that are typically present in water. This suggests that beta-hematin likely self-assembles near a lipid/water interface within the living organism (in vivo) as confirmed by Raman spectroscopy. [36]
The ability of β-hematin to form so readily under these realistic conditions is a significant finding. It sheds light on the mechanisms underlying the production of this important biological substance and highlights the importance of examining these processes in the context of relevant interfaces and environmental factors. Further research in this direction could yield valuable insights into the physiological relevance and potential applications of β-hematin.
FTIR synchrotron spectra recorded of single cells from the different phases of the erythrocytic life cycle show the continuous increase in lipid components as the cells progress from being uninfected to the ring, schizont and trophozoite stages. [31] Figure 7 shows synchrotron FTIR spectra of single uninfected red blood cells compared with ring, trophozoite and schizont stages cells. The ester carbonyl band from triglyceride fatty acids at 1742 cm-1 increases through the different stages and is barely discernible in uninfected cells. Bands at 2922 cm-1, 2852 cm-1, assigned to the νasym(CH2 acyl chain lipids) and νsym(CH2 acyl chain lipids), respectively, increase as the parasite matures from its early ring stage to the trophozoite and finally to the schizont stage. [15] The Principal Component Analysis (PCA) enabled discrimination between uninfected, ring, trophozoite and schizont stages on a PC1 versus PC2 Scores plot. [31] Raman spectroscopy was employed to differentiate between P. falciparum and P. vivax on a PCA 2D scores plot. The PCA performed in the CH stretching region 3100-2800 cm-1 showed a clear clustering of the two species, indicating that the lipidomic component can be used to distinguish species of sp. using Raman spectroscopy. This finding is crucial for informing appropriate drug treatment strategies against different species. [37]
3.3. Nucleic acids
The Plasmodium genome is a circular, AT-rich DNA molecule of approximately 23 megabases, containing around 5,400 genes. [38] Compared to the genomes of free-living eukaryotic microorganisms, the genome of the intracellular malaria parasite Plasmodium encodes a smaller number of enzymes and transporters. However, a substantial proportion of the Plasmodium genome is dedicated to genes involved in immune evasion mechanisms and host-parasite interactions. [38] During the blood stage of the Plasmodium life cycle, the parasite's DNA content or the number of daughter cells can increase dramatically within a single round of replication. On average, studies have documented a 20-fold to 30-fold rise in DNA content or daughter cell number over the course of one proliferative cycle. [39,40] This large amount of Plasmodium DNA inside the host red blood cell can be detected and used for diagnosis of malaria infection. In addition to the DNA within infected red blood cells, Plasmodium parasites also release DNA fragments into the host's bloodstream. These cell-free, circulating Plasmodium DNA molecules can be detected in the modiumma or serum of infected individuals. [40] The presence and quantification of circulating malaria DNA in plasma has emerged as a valuable biomarker for the diagnosis, monitoring, and management of malaria. [41] Circulating Plasmodium DNA can be detected even in low-density infections or in cases where the parasites are sequestered in the deep vasculature, making it a more sensitive method compared to traditional microscopy. Analysis of circulating malaria DNA has also provided insights into parasite dynamics, drug resistance, and the genetic diversity of sp. during infection.
In terms of RNA, malaria parasites exhibit some unique genomic features when compared to other eukaryotic organisms. Most notably, the Plasmodium genome lacks the long, tandemly repeated arrays of ribosomal RNA (rRNA) genes that are characteristic of many other eukaryotes. [38] Instead, Plasmodium parasites contain multiple single 18S-5.8S-28S rRNA units distributed across different chromosomes. [38] Furthermore, the expression of these rRNA units is tightly regulated throughout the various stages of the Plasmodium life cycle. [38] This results in the selective expression of different sets of rRNAs at different points during the parasite's development. This developmental regulation of rRNA gene expression contrasts with the more uniform rRNA profiles seen in many other eukaryotic organisms. [38]
Vibrational spectroscopic techniques, such as Fourier-transform infrared (FTIR) and Raman spectroscopy, have faced challenges in the direct detection of DNA within malaria-infected cells. In an early FTIR spectroscopy study investigating single infected rings, trophozoites, and schizonts, no clear DNA phosphodiester bands were identified at the expected wavenumber values of ~1240 cm-1 and ~1080 cm-1, corresponding to the asymmetric and symmetric PO2- vibrations, respectively. [31] Similarly, Raman spectroscopy studies did not detect the characteristic Raman bands at 813 cm-1 or 840 cm-1 that would be anticipated for RNA or DNA. [42] The apparent lack of detectable DNA/RNA signals in these vibrational spectra suggests that the parasite DNA may be present at levels below the sensitivity threshold of these techniques. Another potential explanation for this observation lies in the conformational dependence of the DNA molar extinction coefficient. When DNA is in the dried, A-DNA conformation, the molar extinction coefficient is significantly lower compared to the hydrated, B-DNA state. This is likely due to the more ordered arrangement of the phosphodiester groups in B-DNA, in contrast to the less organized structure of A-DNA. Specifically, in the case of FTIR spectra of DNA, the symmetric PO2- vibration is approximately 3 times less absorbing in the A-DNA form compared to the B-DNA form, and the asymmetric PO2- band is shifted from ~1240 cm-1 in the A-form to ~1220 cm-1 in the B-form. [43] These conformational-dependent changes in the DNA FTIR spectrum may explain the apparent lack of detectable DNA signals in FTIR analyses of dried, malaria-infected red blood cells, as the less IR-active A-DNA conformation predominates under those conditions.
3.4. Proteins
3.4.1. FTIR spectroscopy of proteins
The FTIR spectra of uninfected red blood cells is dominated by the alpha-helical protein hemoglobin. Red blood cells contain a remarkably high concentration of hemoglobin, comprising approximately 95% of the total cytosolic proteins within these cells. [55] This hemoglobin is present at a concentration of 5 millimolar (mM) inside the red blood cell. [55] The percentage of hemoglobin in different stages of malaria parasites (rings, trophozoites, and schizonts) varies as the parasite develops within the red blood cell. In the early ring stage, the parasite has consumed relatively little hemoglobin, with approximately 0-20% of the host cell hemoglobin digested. The trophozoite stage is the most active feeding stage, during which about 60-80% of the host cell hemoglobin is typically digested. [55] By the late schizont stage, most of the hemoglobin has been consumed, with approximately 80-100% of the host cell hemoglobin digested. These percentages are approximate and can vary depending on the specific sp. and individual parasites.
FTIR spectra of both infected and uninfected red blood cells at all stages are dominated by strong amide bands appearing at 1650 cm-1 and 1544 cm-1 assigned to the amide I mode (ν(C=O) + ν(C-N) + δ(NH2)) and amide II mode (ν(C-N) + δ(NH2) + ν(C-C) + ν(C=O)), respectively, and a weaker band at ~1300 cm-1 assigned to the amide III mode ((ν(C-N) + δ(CH2) + δ(NH2) +δ(C-C-N) + δ(C-O)). Other bands including the band at 1450 cm-1 and ~3300 cm-1 are assigned to the carboxylate group of amino acid side chains and the amide A mode (N-H stretching) from the peptide functional group. The amide I mode is very sensitive to protein conformational change and the profile can be used to predict the relative contribution of alpha helical, β-pleated sheet, random coil and other protein conformational motifs. [56] The amide I and II band profile has been shown to change radically between the different stages of the malaria parasite especially after performing a second derivative. [31] However, in our field trial using ATR-FTIR technology the amide I and II region was found not to be particularly useful in diagnosing infected from uninfected patients and instead the region between 3000-2700 cm-1 and 1200-900 cm-1 proved to better in terms of sensitivity and specificity for diagnosing patients with malaria infection. [57]
3.4.2. Raman spectroscopy of proteins
Raman spectroscopy provides valuable information about protein structure and composition through characteristic vibrational bands. Besides the amide modes mentioned above in the context of FTIR, Raman also shows bands from aromatic amino acid side chains which result in distinct bands from phenylalanine, which shows a sharp peak near 1000 cm⁻¹, tyrosine exhibits a doublet at approximately 830 and 850 cm⁻¹, and tryptophan displays bands at about 760 and 1340 cm⁻¹. The S-S stretching vibration of disulfide bonds appears around 500-550 cm⁻¹. C-H stretching vibrations from aliphatic amino acids are observed in the 2800-3000 cm⁻¹ region. The band near 1450 cm⁻¹ is attributed to CH₂ and CH₃ deformations. Additionally, the region between 500-800 cm⁻¹ contains various skeletal vibrations that can provide information about protein conformation. These Raman bands collectively offer insights into protein secondary structure, side chain environments, and overall conformation, making Raman spectroscopy a powerful tool for protein analysis.
3.4.3. UV/Visible spectroscopy of proteins
The UV/Visible spectrum of proteins is characterized by several key absorption bands that provide valuable information about their structure and composition. The primary absorption band in the UV region, known as the peptide bond absorption, occurs around 190-230 nm and is due to the n→π* and π→π* transitions of the peptide bond. This band is present in all proteins and is sensitive to secondary structure. The far-UV region (180-240 nm) is particularly useful for analyzing protein secondary structure, with α-helices showing a characteristic double minimum at 208 and 222 nm, and β-sheets displaying a single minimum near 215 nm. In the near-UV region (250-300 nm), absorption is primarily due to aromatic amino acid side chains: phenylalanine absorbs weakly near 257 nm, tyrosine shows a peak around 274 nm, and tryptophan exhibits the strongest absorption with a maximum near 280 nm. The exact positions and intensities of these aromatic peaks can provide information about the local environment and tertiary structure of the protein. Disulfide bonds (cystine) contribute a weak absorption band around 260 nm. Some proteins containing metal ions or other chromophores may show additional absorption bands in the visible region, such as the heme group in hemoglobin and myoglobin, which gives rise to the Soret band around 400 nm and Q-bands between 500-600 nm. Flavoproteins typically show absorption bands in the 350-500 nm range. The overall shape and intensity of the UV/Visible spectrum can be used to estimate protein concentration, purity, and to monitor conformational changes. It is worth noting that the exact positions and intensities of these bands can vary depending on the specific protein, its environment, and any modifications or ligands present.
3.4.4. Near infrared spectroscopy of proteins
NIR spectroscopy has been widely used to investigate protein structures, folding patterns in polypeptides, and amino acid composition. [58] The primary functional groups for Near-Infrared (NIR) spectroscopic analysis in protein studies are the amides and C-H modes. NIR absorption bands related to proteins, particularly amides, are thoroughly detailed in the review by Salzer. [59] The 1500-1530 nm region includes the NH stretching first overtone, while the 2050-2060 nm region pertains to the NH-stretching combination bands. Additionally, absorption bands within the 2148 to 2200 nm wavelength range are valuable for constructing calibration and prediction models in protein research. [59,60]
Around the early 2000s, more compact, rapid, and user-friendly spectrometers equipped with state-of-the-art software began to emerge. Miniaturization of NIR devices has significantly reduced the high capital costs associated with traditional large NIR instruments. Over the past decade, there have been substantial advancements in instrument miniaturization, including those designed for use in non-traditional environments. [61,62] Miniaturized NIR instruments are now being utilized by the military for security surveillance, farmers for rapid analysis of agricultural produce and pest control, and in pharmacies for drug screening. Additionally, NIR handheld instruments have shown strong potential for disease diagnosis, though this area has not yet been fully explored. [63]
4. Application of spectroscopy for the detection and analysis of malaria parasites and related metabolites
4.1. Raman spectroscopy
Raman spectroscopy is a technique that identifies the chemical fingerprints of molecules based on their vibrational modes, resulting from inelastic scattering, also known as the Raman effect. This method is rapid, label-free, non-destructive, and highly specific, requiring little to no sample preparation, making it particularly suitable for the analysis of biological samples. Raman confocal microscopy is capable of providing sub-micron spatial and spectral resolution down to subcellular components, enabling the detection of single malarial infected cells. [64]
4.1.1. Resonance Raman Spectroscopy
Resonance Raman spectroscopy results in the enhancement of the specific vibrational modes as the excitation wavelength used for Raman coincides with the electronic transition. [65] Ong et al. [66] were the first to compare the Resonance Raman spectroscopy of rodent normal erythrocytes and P. berghei infected erythrocytes using 488 nm laser, which revealed a shift in peak from 747 to 754 cm-1 in uninfected to infected erythrocytes attributed to the pyrrole breathing mode. They also indicated that the Fe in hemozoin in ferric state due to presence of oxidation state band occurring at 1371 cm-1. [66] Hemozoin showed unusual enhancement at 780 nm due to the excitonic coupling in stacked porphyrin moieties as compared to poor enhancement by hemoglobin thereby enabling Raman imaging of hemozoin within the food vacuole of P. falciparum trophozoites. [67] Resonance Raman mapping has also been utilised along with multivariate analysis to understand the heme species distribution within the erythrocytes infected with P. falciparum. Unsupervised Hierarchical Cluster Analysis (UHCA) was utilised to study the spatial distribution of heme as either hemozoin or hemoglobin. Wood et al. [68] combined Resonance Raman spectroscopy with partial dark-field microscopy to identify parasites in RBCs. Figure 8 shows the comparison of the dark field images with the Raman maps along with UHCA maps in the range of 1700-1300 cm-1 clearly indicating the bright spots in dark-field image correlating with the hemozoin cluster.
4.1.2. Raman acoustic levitation spectroscopy (RALS)
Several other modalities and functionalities have been combined with Raman microscopy to study malarial parasites. An acoustic levitator was combined with a Raman spectrophotometer to perform Raman acoustic levitation spectroscopy (RALS) on normal RBCs and P. falciparum trophozoites (Figure 9 ). A 5 µl of suspension containing RBCs was levitated to monitor the dynamics of heme in RBCs and was used to detect hemozoin in the malarial infected cells improving the signal-to-noise ratio of hemozoin due to the concentrating effect of water evaporation in the levitator. [69]
4.1.3. Raman spectroscopy coupled to quantitative phase microscopy (QPM)
A novel multimodal microscopy system integrating a confocal Raman microscope and quantitative phase microscopy (QPM) provided was used to study normal and P. falciparum infected RBCs. [70] The distribution of hemoglobin in normal red blood cells (RBCs) was analysed using confocal Raman spectroscopy and correlated with sample thickness to elucidate cellular morphology. A similar approach was subsequently applied to study the hemozoin content in P. falciparum-infected RBCs. [70] A new system involving a fibre array-based spectral translator coupled with a laser illumination system was used for Raman hyperspectral imaging to study early ring-staged P. falciparum infected RBCs providing improved spectral and spatial resolution compared to tuneable filter Raman imaging. [71]
4.1.4. Raman analysis of malaria analytes in serum, plasma, and blood samples
Raman spectroscopy has been utilised for studying the presence of malarial parasites in serum and blood samples. Serum and plasma samples also provide a valuable means for early-stage detection of malarial parasites, even at parasitemia levels as low as 0.2%, due to the inherent low heme background. [42] Hobro et al. [42] studied the malaria disease progression from 0-7 days in blood and plasma samples of mice using Raman spectroscopy and PCA analysis. They analysed heme, hemoglobin and hemozoin Raman spectra of blood by looking at the notable differences in three regions: 1100-1200 cm-1 attributed to pyrrole half-ring asymmetric stretching, 1300-1450 cm-1 for C-N stretching of porphyrin ring and 1515-1650 cm-1 for C-C vibrations. In plasma samples, PC2 scores increased with Plasmodium infection and with small positive peaks at ~ 1628 and 1671 cm-1 correlating to hemozoin and large positive bands at ∼2888, 2915 and 2928 cm-1 showing the lipid changes in plasma related to malarial infection. [42] Raman spectroscopy was used to study the early ring staged P. falciparum infected RBCs in 10 patients (5 malaria infected and 5 healthy volunteers) by looking at the I1130/I1075 and I2930/I2850 intensity ratio to study alterations in erythrocytes membrane and changes in the structure of membrane lipids and proteins. [72] A rapid diagnostic method was developed to discriminate between 130 patients’ sera which includes healthy controls, malaria and dengue-infected patients using Raman spectroscopy and supervised principal components linear discriminant analysis (PC-LDA) methods. The major spectral peaks of molecules studied were creatinine, bilirubin, amino acids (Tyr, Trp, Asn, Glu, Pro, and Phe), protoporphyrin IX, and cell-free DNA. [73] RBCs of 10 patients were analysed to discriminate between P. falciparum and P. vivax infection using Raman spectroscopy and PCA. Aspartic acid (Asp) vibrations at 1385cm-1 and Glutamine (Gln) band at 1587 cm-1 were indicative of P. falciparum infection whereas Tryptophan (Trp) bands at 1361 and 1544 cm-1 were indicative of P. vivax infection. [37]
4.1.5. Raman analysis of Malaria parasites in Tissues
In terms of organs, malaria mainly infects the brain, spleen, and liver. A few studies have utilized Raman spectroscopic analysis to investigate malaria-infected brain tissue in mice. [74] [75] Hackett et al. [74] used multi-modal approach incorporating Fourier transform infrared microscopy (FTIRM), particle-induced x-ray emission (PIXE) spectroscopy, X-ray fluorescence microscopy (XFM) and resonance Raman spectroscopy to study the biochemical alterations occurring at the cellular and subcellular level within the cerebellum tissue of murine cerebral malaria (CM). They combined resonance Raman spectroscopy and XFM to study the tissues surrounding the microhemorrhage to identify the elevation in the non-heme Fe. [74] Another study on mouse spleens infected with P. berghei employed Raman imaging to differentiate between infected and non-infected tissue sections. PCA results revealed a clear distinction between infected and non-infected spleen tissues, attributed to the increase in accumulation of hemozoin in the spleen with key peaks occurring at 1370, 1529, 1588, and 1628 cm−1. [75] Raman imaging on the macrophage response to the hemozoin pigment was investigated to understand the biochemical changes in the macrophages upon hemozoin uptake in a timescale of five hours. PCA scores images were used to explain the biochemical changes in the macrophages after three- and five-hour timescale where most of PC1 component and negative component of PC3 was attributed to hemozoin bands. The study also identified the localization of hemozoin within the phagosomes and lysosomes of macrophages. However, the investigation of hemozoin degradation was not feasible within the timescales of the study. [76]
4.1.6. Surface Enhanced Raman Spectroscopy (SERS)
Raman spectroscopy has emerged as a popular tool to detect and study Hemozoin and other biomarkers. [67] However, Raman scattering is weak in nature and thus not suitable to detect biomarkers in quantities meaningful to diagnostics. [77] Surface Enhanced Raman Spectroscopy (SERS) is a technique that improves sensitivity of Raman scattering by attaching plasmonic nanomaterial to the analyte of interest. Under carefully engineered conditions, intense bands appear from trace amounts of analyte that are too weak to appear in an ordinary Raman spectrum. The plasmonic nanostructures amplify the localised electric field of incoming radiation and increase scattering intensities exponentially. [78] This technique is used to detect changes in cell membrane due to malarial infection.
SERS spectra of ring stage infected RBCs show a characteristic Raman band at 1599 cm-1, which is absent in healthy RBCs. In contrast, the trophozoite and schizont stages exhibit identical SERS bands, featuring a characteristic peak at Δν = 723 cm-1. [79] The vibrational features of hemozoin 754 cm−1, 1120 cm−1, 1551 cm−1, 1570 cm−1, and 1628 cm−1 can be observed in the SERS spectra of hemozoin and infected RBCs. The bands common between hemozoin and healthy RBCs are 1120 cm-1, 1570 cm-1 and 748 cm-1 could be attributed to haemoglobin in the cells. [80] Plasmodium schizonts are easily observed under a microscope due to their larger size and distinct morphology, while the smaller size and subtle appearance of ring stage parasites makes them more challenging to detect. However, Giemsa stained parasites can be readily observed in both stages. [80]
The Graphium weiskei butterfly wings (Figure 10A) feature a unique nanostructure that can be utilized for biosensing applications. A schematic cross-sectional view of a gold-coated wing (10B) reveals typical chitinous conical protrusion dimensions and spacings, as observed in scanning electron microscopy (SEM) images. SEM analysis of the wings shows chitinous nano-structured conical arrays (Figures 10 C-F), both after deposition with P. falciparum-infected red blood cell (RBC) lysate (Figures 10C and 10D) and in control wings without lysate deposition (Figures 10E and 10F). SER spectra were obtained for various concentrations of malarial-infected RBC lysate, including 0.0005% (Figure 10G), 0.005% (Figure 10H), and a 0% control (Figure 10I). For comparison, a conventional Raman spectrum of hemozoin at 785 nm is also presented (Figure 10J). These findings demonstrate the potential of butterfly wing nanostructures as sensitive biosensors for malaria detection.
4.1.7. Magnetic field assisted SERS
Infected RBCs have a higher ratio of paramagnetic Fe2+ ions compared to healthy RBCs and there is detectable change in magnetic properties. This property has long been used to test malarial infection. [83] Paramagnetism of β-hematin (equivalent marker of Hemozoin) is also exploited by using magnetic field induced aggregation that leads to better sensitivity in SERS technique.
Ultrasensitive detection of β-hematin was demonstrated with tuned core-shell thickness of Iron Oxide core and silver shell [82,83] coupled with magnetic field enrichment of hemozoin. A study performed by Liu et al. [84] demonstrates SERS combined with resonant wavelength detection of β-hematin of 5 x 10⁻⁹ M or equivalent to 30 parasites/ µL.
Commonly used SERS substrates, Silver NPs (AgNPs) provide low sensitivity of 500 parasites/µL. [85] To improve this, Chen et al. [85] demonstrated two ways of incorporating plasmonic component in the infected blood sample; synthesized silver nanoparticles mixed with lysed blood samples led to a more consistent signal enhancement whereas silver nanoparticles synthesized directly in P. falciparum parasites showed higher sensitivity to malarial parasites owing to greater adsorption of hemozoin on silver nanoparticles. Recently, nanostructured gold (AuNS) was used to obtain SERS from 0.1 parasites/ µL from infected blood samples of 25 patients. [86] In another study to ease point-of-care detection, microfluidic chamber was interfaced with contact activated AgNP synthesis. The detection limit for this method was 125 parasites/µL. [87] Table 1 summarizes the types of SERS approaches applied to detect malaria and their respective sensitivities.
4.2. Attenuated Total Reflectance-Fourier Transform Infrared (ATR-FTIR)
ATR-FTIR spectroscopy is a variant of FTIR spectroscopy that utilises a high refractive index internal reflection element (such as diamond, silicon, germanium, or ZnSe). Infrared light is directed between this element and the sample at an angle greater than the critical angle, resulting in total internal reflection. The evanescent wave generated at the interface interacts with the sample, providing valuable spectral information. ATR-FTIR is non-destructive and requires minimal sample preparation, allowing for rapid analysis of biological samples like blood. Additionally, it can detect subtle biochemical changes associated with malaria infection by providing detailed molecular fingerprints (Table 2). This capability makes it a promising tool for early-stage malaria detection, potentially reducing reliance on more time-consuming, reagent-based diagnostic methods.
ATR-FTIR spectroscopy has emerged as a rapid and cost-effective method for screening and diagnosing infectious diseases. The first study on its application for malaria diagnosis was conducted by Khoshmanesh et al. [7] in 2014. Their work demonstrated the ability of ATR-FTIR spectroscopy, coupled with chemometric analysis, to detect and quantify different stages of malaria parasites in infected erythrocytes. They reported significant spectral differences between the various stages of parasite development within red blood cells (RBCs) and achieved a limit of detection (LOD) of 0.00001%, which translates to <1 parasite/µL of blood and is comparable to the gold standard of detection by PCR. This pioneering study opened the door for future developments in ATR-FTIR-based malaria diagnostics.
Despite its advantages, such as minimal sample preparation and rapid analysis, challenges remain, particularly when analyzing clinical samples. Factors like biological variability and sample pre-processing, which are hard to replicate in laboratory settings, can impact accuracy. For instance, anticoagulants used to prevent blood clotting can interfere with key spectral bands. Martin et al. [90] studied the effects of common anticoagulants - Sodium Citrate, Potassium Ethylenediaminetetraacetic acid (EDTA) and lithium heparin on ATR-FTIR spectra for malaria diagnosis. Sodium citrate exhibits strong absorption at 1572 cm⁻¹ due to carboxylate groups, EDTA at 1618 cm⁻¹ for its carboxylate groups, and heparin contributes bands at 1146 and 1036 cm⁻¹ (carbohydrates), 1438 and 1420 cm⁻¹ (secondary amines), and 1628 cm⁻¹ (sulfonated amine). These bands, falling within the fingerprint region, can obscure key biological signals, complicating detection. However, heparin had the least spectral interference, allowing successful calibration (R² = 0.92) in samples with parasitaemia levels up to 0.1%.
Another source of variability in samples comes from metabolic changes, which can significantly impact the spectra, especially when analyzing whole blood. While whole blood is easier to work with, serum components can heavily influence the spectral data. In 2017, Roy et al. [91] conducted a study that demonstrated the ability of ATR-FTIR to correctly identify 98% of parasitaemia samples with densities above 0.5% (~25,000 parasites/µL). This was the first multianalyte diagnostic study using ATR-FTIR, where they simultaneously predicted levels of parasitaemia, urea, and glucose. The researchers spiked whole blood with Plasmodium cultures and prepared 132 specimens with varying amounts of P. falciparum parasites, glucose, and urea by creating multiple aliquots. Remarkably, only 5 µL of isolated RBCs was sufficient to cover the ATR crystal, highlighting the technique’s efficiency in sample usage. In 2019, Mwanga et al. [92] used ATR-FTIR on dried blood spots collected in the field, coupling it with machine learning algorithms to differentiate between positive and negative cases and identify the parasite species, which is discussed under “Clinical field trials of ATR-FTIR spectroscopy”.
4.3. Focal plane array Fourier transform infrared (FPA-FTIR) imaging spectroscopy
FTIR can be combined with a focal plane array (FPA) detector to simultaneously acquire 16,384 spectra, generating hyperspectral infrared images composed of 128 x 128 pixels. By producing spatially resolved spectral data, it has been effectively used to diagnose malaria in red blood cells at the single-cell level and to investigate the structures of infected red blood cells. Perez-Guaita et al. [93] used a 25x Cassegrain objective to achieve a 0.66 µm2 pixel size, an effective 1.4 µm2 spatial resolution, and investigated thin-layer RBCs on glass slides. Using a supervised leave-one-out PLS-DA cross validation approach, they achieved success with 88 % specificity and 87 % sensitivity in distinguishing malaria-infected from control RBCs. [93] Bands at 3300 cm-1, 2952 cm-1, and 2870 cm-1 were the most significant contributors to the observed separation, corresponding to asymmetric and symmetrical CH3 stretching vibrations and Amide A bands, respectively. Furthermore, a change in the lipid to protein ratio, was attributed to the consumption of hemoglobin within the erythrocyte. [93] Figure 1 shows a 3D representation of infected and healthy RBCs that closely resembled their visible images. Partial least squares discriminant analysis (PLS-DA) performed on these cells showed bands at 2914 cm-1, 3150 cm-1, 3028 cm-1, and 3300 cm-1 were significant in achieving 81% specificity and 83% sensitivity in distinguishing trophozoite vacuoles from cell cytoplasm. [93]
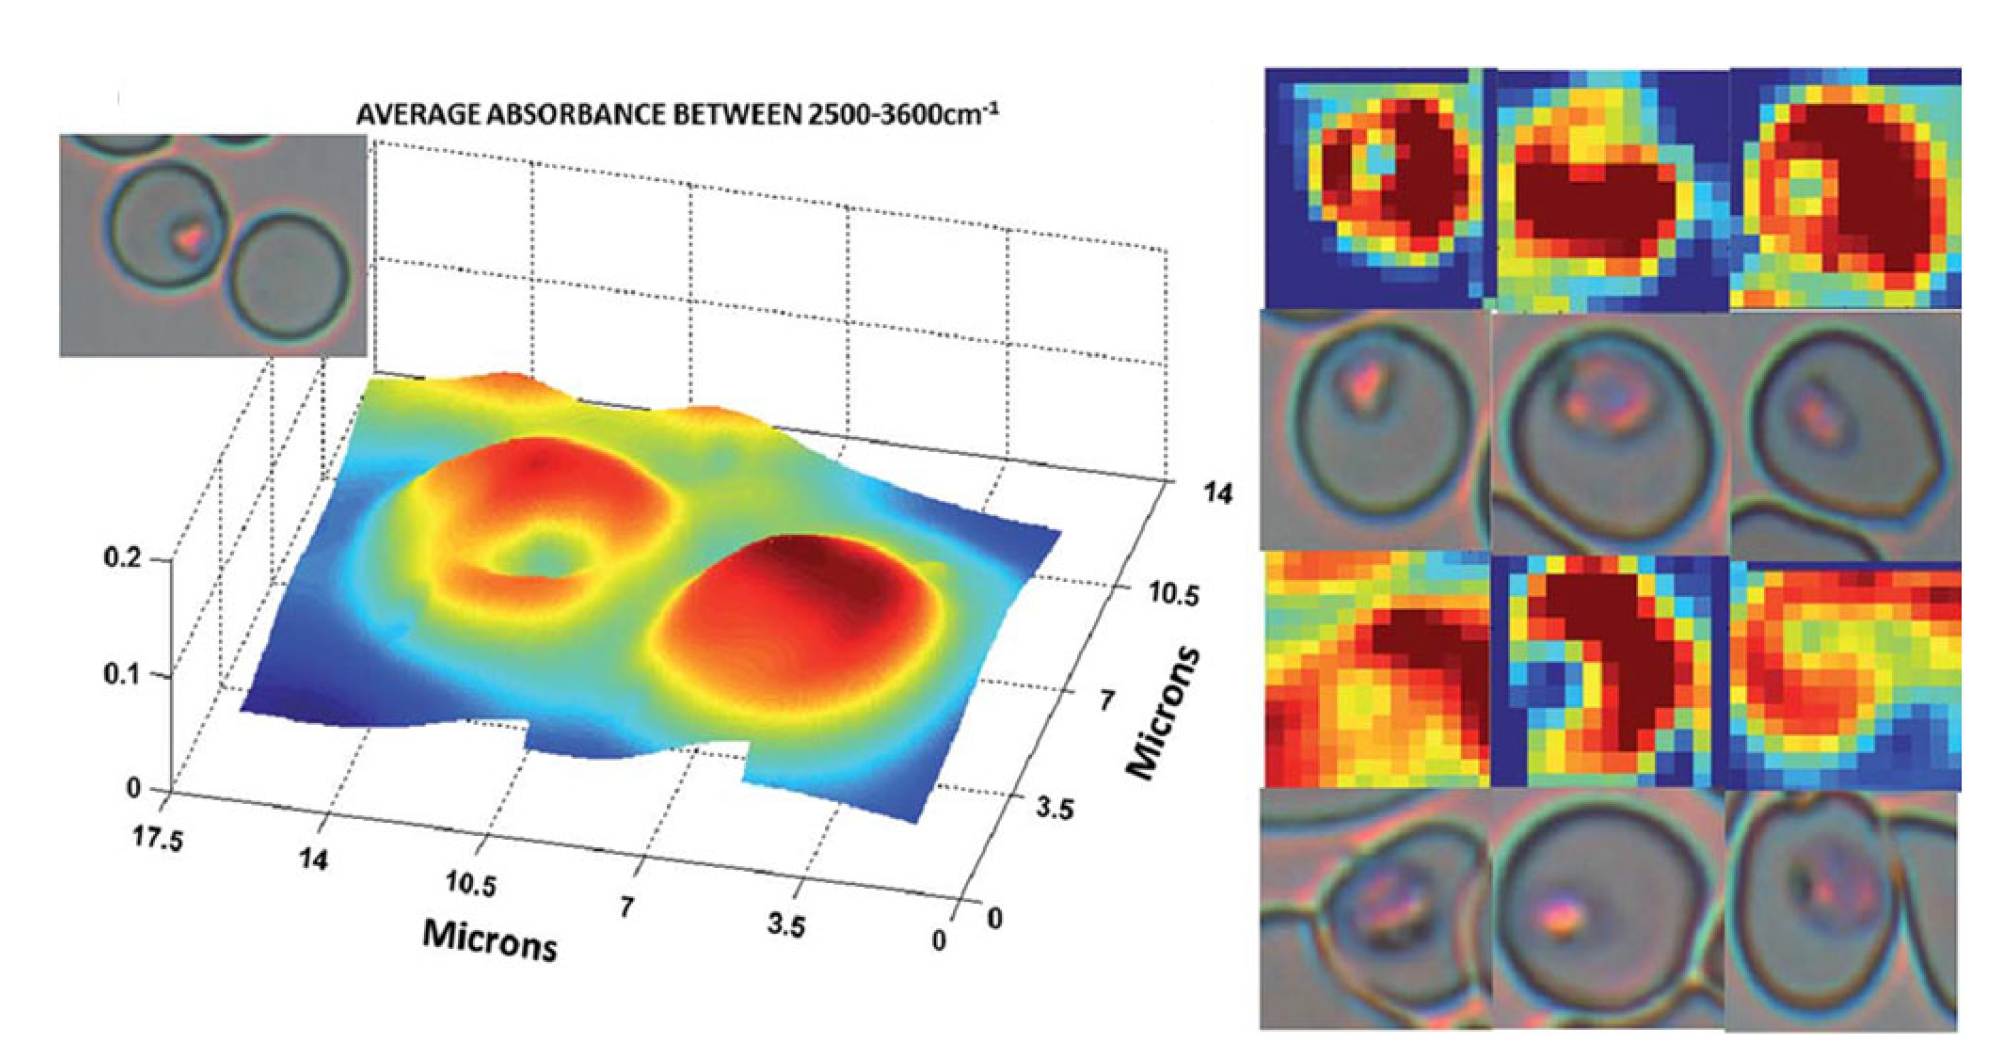
Figure 11.
Infrared images of trophozoites inside infected erythrocytes. A. 3D representation of an infected and an uninfected cell. B. False-colour images of 6 erythrocytes infected with trophozoites and their visible images. Colour scale corresponding to the integration area underneath each spectrum (pixel). Reproduced with permission from the Royal Society of Chemistry. [93].
However, when similar FPA-FTIR experiments were conducted using a 15x objective on CaF2 slides and unsupervised hierarchical cluster analysis, the results were not replicated. For this magnification the spectra were dominated by bands attributed to hemoglobin, and were not representative of hemozoin or the signature lipid and DNA bands expected to be seen with bacteria. [94] Furthermore, Banas et al. [95], using 1800 cm-1 – 1000 cm-1 region and a 15x objective, were unable to separate infected from control RBCs using principal component analysis, highlighting the importance of highly resolved data points and peak selection when using infrared imaging modalities. [95]
With its non-destructive and label-free imaging approach, FPA-FTIR can also be used to investigate pathologies within tissues. Cerebral malaria is one of the most severe complications from malaria infection, with a mortality rate of 15%-20% even after treatment, and is hallmarked by symptoms of altered consciousness and convulsions that can lead to comas and death, often in young children with developing immune systems. [96,97] Pathologies of encephalopathy, endothelial activation, and damage to the blood-brain-barrier are often observed post-mortem, and are major contributing factors in fatal cases. [96] FPA-FTIR has successfully been used to contribute to the growing body of knowledge of cerebral malaria pathogenesis and how neurological symptoms manifest. Hackett et al. [98] used murine models of cerebral malaria to show heightened lactate levels and protein aggregates at haemorrhage sites within the brain, using bands at 1742 cm-1, 1566 cm-1, 1625 cm-1, and 1127 cm-1 to demonstrate lipid, α-helix proteins, β-pleated sheet proteins, and lactate, respectively. 1742 cm-1 decreased in white matter at the sites of haemorrhage, alongside an increase in 1656 cm-1, 1627 cm-1, and 1127 cm-1, corresponding to increased α-helical and β-pleated sheet structures colocalised with an increase in lactate concentration. Adjacent to sites of haemorrhage, decreased α-helical content was observed alongside an increase in lactate and β-pleated sheet structures in the granular layer of the cerebellum. [98]
The same group also found crystalline creatine microdeposits within the granular and molecular layers of the cerebellum. Using FPA-FTIR imaging, Hackett et al. [99] employed the lipid carbonyl band at 1742 cm-1 and the organophosphate band at 1087 cm-1 to isolate the white matter, granular, and molecular layers of the cerebellum and, using multivariate K-means clustering analysis, found creatine microdeposits throughout the granular and molecule tissue layers due to the signature 1402 cm-1 band of creatine. These deposits could not be observed in traditional H&E staining methods performed after FPA-FTIR imaging, thereby demonstrating the unique advantage of chemical mapping over traditional staining methods. [99]
4.4. Synchrotron FTIR spectroscopy
A synchrotron is a particle accelerator that produces a high-energy beam of charged particles, usually electrons. As they follow a circular path, they emit synchrotron radiation, that is a highly intense and focused beam of electromagnetic radiation that spans from the range of X-rays, passing through visible and reaching the far-infrared. Synchrotron provides a much brighter and intense source of infrared light which gives better signal-to-noise ratio and enables the detection of weaker signals. The pulsed nature allows for time-resolved studies that make it possible to observe dynamic processes in real-time. With the objective of a brighter source, also in malaria, synchrotron light has been used.
Pioneering studies in 2009 were performed at the Australian Synchrotron to discriminate the different erythrocytic lifecycle stages of the malaria parasite in erythrocytes. Webster et al. [31] applied synchrotron infrared spectroscopy to acquire single-point spectra from single red blood cells and compared the spectra from different stages of the infection (schizont, trophozoite, ring). Major differences were found in the C-H stretching region and the ester carbonyl band. Excellent discrimination was achieved between infected and control cells using an artificial neural network.
Wood et al. [100] used the IRENI synchrotron to illuminate the Focal Plane Array detector and increase its signal and the speed at which the spectra is acquired, since with a FPA in each acquisition 4096 spectra are saved for each tile. In this work, the different stages of cells were possible to discriminate by using Hierarchical Cluster Analysis.
Even though the limit in spatial resolution due to diffraction limitations is now being overcome with recent advances in technology like the far field Optical Photothermal Infrared (O-PTIR) instrument and by the near field technology like AFM-IR, the results presented here are still milestones in the search for understanding malaria infection and the stages of the infected red blood cells by pushing the limit in the technique’s capabilities. A recent study compared FTIR, AFM-IR and O-PTIR to distinguish P. falciparum infected erythrocytes as discussed below. [95]
4.5. Optical photothermal infrared (O-PTIR) imaging
Typical IR microspectroscopic techniques covered previously are restricted by their diffraction limited optical components, and thus have an achievable spatial resolution on the order of microns in the mid-IR spectral regions. [101] Although these spatial resolutions are sufficient for analysing, for example, the chemical composition of whole single infected and healthy erythrocytes, obtaining chemical information of subcellular components is beyond reach of these techniques. The Plasmodium parasite and its associated digestive vacuole (an important therapeutic target) [102,103] is typically much smaller than the achievable spatial resolution of IR microscopes. [104,105,106] Hence, to investigate the interaction of the parasite with the host or potential therapeutic treatments using IR spectroscopy would be heavily benefited by a smaller achievable spatial resolution. Optical-Photothermal Infrared spectroscopy (O-PTIR) is a technique with the ability to meet these needs, with an achievable spatial resolution of about 500 nm. [107] Furthermore, unlike the diffraction limited IR microscopes, this spatial resolution is achievable across the entire mid-IR range that is accessible to these instruments. To achieve this greater spatial resolution, O-PTIR instruments introduce a monochromatic visible laser light collinear with the incident IR beam. The IR beam induces a photothermal effect in the sample that modulates the reflection and scattering of the visible light. The photothermal effect is proportional to the absorption of IR light by the sample, therefore, the measurement of the intensity of the collected visible light is proportional to the IR absorption, producing an O-PTIR spectrum that is analogous to a typical IR spectrum (Figure 12). [108] A much smaller spatial resolution is now achievable, since it is determined by the diffraction limit of the visible light’s wavelength and optics. Nevertheless, this technique has only been made available very recently, and its applications to malaria research is severely limited with only a single study published thus far. Banas et al. [95] investigated the use of O-PTIR for the characterisation of P. falciparum infected erythrocytes and compared it against data obtained with an FTIR microscope equipped with a FPA detector. Initially, the authors perform a simple comparison of the techniques by mapping a single healthy erythrocyte. The spectra collected using the FTIR microscope lacked contrast across the map, while the spectra collected with O-PTIR are clearly heterogeneous, revealing the intracellular chemical and morphological variability of the erythrocyte owed to the technique’s submicron spatial resolution. Next, they investigated whether either technique exhibited an advantage in discerning between healthy and P. falciparum infected erythrocytes by performing PCA on datasets containing spectra collected from these groups. The first three principal components (PCs, 67.4% explained variance) of the dataset collected with a FTIR microscope, there was no evident clustering or separation of the healthy and infected cells, suggesting this technique's inability to identify infected cells. In contrast, the data collected with O-PTIR displayed a clear separation of the classes along the first PC (55.9% explained variance). Peaks represented in the loadings plot of this PC could be directly related to the presence of hemozoin, particularly from the peak around 1720 - 1708 cm-1 arising from H-bonded carboxylate groups. This clear separation of the healthy and infected erythrocytes in the O-PTIR data demonstrates the advantages that the greater spatial resolution of this technique provides. Despite the current lack of reported studies employing this technique, there is unmistakable potential for future promising discoveries that could be made in malaria research with its utilisation.
4.6. Near infrared spectroscopy
Near-infrared (NIR) spectroscopy has seen considerable progress since its discovery in the 18th century by Frederick W. Herschel, who initially observed that NIR radiation is absorbed by matter. This method generally employs photon energies between 1.65 eV and 4.96 eV, spanning a wide wavelength range from 750 nm to 2500 nm (0.75 μm to 0.25 μm). [110] Molecules absorb NIR radiation when the frequency of the radiation matches the intrinsic vibrational frequencies associated with mainly overtone and combination bands. Due to anharmonicity, multiple transitions occur between various vibrational energy states (where Δv=±1, ±2, ±3, etc.). These multilevel energy transitions are the basis for near-infrared overtones, which appear as integral multiples of the fundamental absorption frequencies. [111,112]
In the electromagnetic spectrum, NIR overtones are found between 780 nm and 2000 nm, depending on the mass of atoms and the bond strength. In polyatomic molecules, different vibrational modes can combine to cause simultaneous energy changes, resulting in combination bands that typically occur between 1900 nm and 2500 nm. [111,112] NIR spectra mainly display significant X–H chemical vibrations (C–H, O–H, N–H, and S–H). [113]. One major challenge with the use of this technique is that the individual bands in NIR measurement are not well-resolved compared to mid-infrared bands due to nearly all participating molecules absorbing NIR energy across the entire wavelength region. This makes it challenging to establish a usable baseline for simple quantitative methods like peak-height or peak-area analysis. However, new methods have been developed to address background interferences and poor spectral resolution, which have been thoroughly reviewed. [109,111,113,114,115,116,117]

| Band (cm-1) | Assignment | Molecules |
|---|---|---|
| 3600-3500 | amide A, ν(N-H) | proteins |
| 3490 | ν3, νasOH | water |
| 3277 | ν1, νsOH | water |
| 2956 | νasCH3 | lipids/proteins |
| 2922 | νasCH2 | lipids, RBC, parasite |
| 2874 | νsCH3 | lipids/proteins, RBC |
| 2852 | νsCH2 | lipids, parasite |
| 1740 | ν(C=O) ester carbonyl | lipids |
| 1715 | B-DNA base pairing vibration (νC=O and νC=N) | DNA, parasite |
| 1708 | A-DNA base pairing vibration (νC=O and νC=N) | DNA, parasite |
| 1660, 1710 | ν(C=O) | hemozoin |
| 1660-1630 | amide I | proteins (α-helix, β-pleated), parasite, RBC |
| 1642 | ν2, δ(H2O) | water |
| 1578 | ν(C=N) | imidazoles in nucleic acids, parasite |
| 1545-1530 | amide II | proteins, parasite, RBC |
| 1457 | δasCH3 | proteins/lipids |
| 1450 | δ(CH2) | lipids |
| 1425 | B-DNA | B-DNA deoxyribose, parasite |
| 1400 | νCOO2 of fatty acids and amino acid side chains | lipids/proteins, RBC |
| 1300-1250 | amide III | Proteins |
| 1244 | νasPO2 | RNA |
| 1240, 1225, 1215 | A-DNA, B-DNA, Z-DNA, νasPO4- | DNA, parasite |
| 1208 | ν(C-O) | hemozoin |
| 1185 | B-DNA | B-DNA deoxyribose, parasite |
| 1080 | DNA, νsPO4- | DNA, parasite |
| 1038 | ν(C=O) | RNA ribose, parasite |
| 1200-900 | νsC-O, νsC-C | carbohydrates |
Around the early 2000s, more compact, rapid, and user-friendly spectrometers equipped with state-of-the-art software began to emerge (Figure 13). Miniaturization of NIR devices has significantly reduced the high capital costs associated with traditional large NIR instruments. Over the past decade, there have been substantial advancements in instrument miniaturization, including those designed for use in non-traditional environments. [62,118] Miniaturized NIR instruments are now being utilized by the military for security surveillance, farmers for rapid analysis of agricultural produce and pest control, and in pharmacies for drug screening. Additionally, NIR handheld instruments have shown strong potential for disease diagnosis, though this area has not yet been fully explored. [63]
Over the years, the use of near-infrared techniques for disease detection has seen remarkable advancements. A review study conducted by Sakudo et al. [120] in 2016 identified at least 116 scientific papers reporting significant success in diagnosing various chronic diseases using near-infrared technologies. However, only a few of these studies focussed on the analysis of biofluids. Domján et al. [121] utilized near-infrared (NIR) spectroscopy to detect proteins and lipids in whole blood and serum using multivariate data analysis. Helb et al. [122] detected vaporized hemozoin using an NIR laser in a theragnostic procedure on malaria-infected mice. Maia et al. [123] investigated malaria infection rates in mosquito populations using a portable NIRS spectrometer, achieving a 95% detection rate of sporozoite-stage P. falciparum infections in African mosquitoes. Da et al. [124] used portable NIRS to detect P. falciparum in laboratory-reared and naturally infected wild mosquitoes. However, their report indicated that the detection of malaria infection is limited to specific homogeneous groups of mosquitoes, reducing the effectiveness of NIRS in identifying malaria within these mosquitoes.
Ong et al. [125] applied NIRS to predict the age of mosquitoes subjected to different conditions. They observed that models trained on laboratory-reared mosquitoes could predict their age with moderate accuracy but failed to do so for field-derived mosquitoes due to significant spectral variations. It was concluded that pre-processing and improving the regression framework could enhance predictions, but environmental differences still pose challenges. The study highlights the need for further research to improve age prediction techniques and understand factors affecting mosquito absorbance before applying NIRS in the field. Fernandes et al. [126] applied portable NIRS to detect Zika virus in Aedes aegypti mosquitos non-invasively. Their results showed that NIRS is 18 times faster and 110 times cheaper than traditional RT-qPCR, making it a promising method for guiding vector control efforts. Garcia et al. [127] noninvasively detected Aedes aegypti mosquitoes co-infected with Zika and Dengue viruses.
Another study undertaken by Some et al. [128] examined the effectiveness of pyrethrum spray, a commercially available insecticide in Burkina Faso, for eliminating mosquitoes. They showed that NIRS demonstrated comparable accuracy (90-92%) in distinguishing between An. gambiae and An. coluzzii mosquitoes, regardless of the method used for killing them. This accuracy remained steady for mosquitoes killed with chloroform, though it dropped slightly to 80% when ethanol was used as a preservative. Additionally, NIRS effectively identified infected versus uninfected mosquitoes, with a minor reduction in accuracy for both laboratory-reared and wild-caught samples. Lambert et al. [129] also applied portable NIRS to monitor the age of Anopheles gambiae s.s., Anopheles arabiensis and Aedes aegypti mosquitoes. Similarly, Santos et al. [130] applied near and mid-infrared spectra collected from female Aedes aegypti mosquitoes infected and uninfected with dengue and developed chemometric models to distinguish between the spectra of each group. In the context of non-invasive application to malaria diagnosis, Sikulu-Lord et al. [131] applied miniaturized NIRS to detect malaria parasites both in vitro, using diluted infected red blood cells from P. falciparum cultures, and in vivo, from mice infected with P. berghei, by analyzing blood spots on slides and non-invasively scanning the feet, groin and ears (Figure 14). In vitro tests identified low-density P. falciparum with 96% sensitivity and accuracy, while in vivo scans on mice demonstrated comparable sensitivity (94%) and specificity (86%).
Adegoke et al. [5] applied a miniaturized NIR spectrometer to detect and quantify malaria infection, their findings highlight the technique's ability to distinguish between infected and uninfected red blood cells (RBCs) even at low levels of parasitemia, indicating its potential as an affordable and rapid diagnostic tool for malaria in remote areas. By analyzing specific overtone and combination bands, the spectra of lipids, hemoglobin, hemozoin, and β-hematin were identified. Principal component analysis effectively separated the infected from the uninfected RBCs, while partial least-squares regression analysis provided a strong prediction of parasitemia, with root-mean-square error values of 0.446% and 0.001% for the higher and lower parasitemia models, respectively (Figure 15).
In another study, [132] an innovative method for diagnosing malaria by combining electronic ultraviolet-visible (UV/Vis) spectroscopy with NIR spectroscopy was introduced for the first time. This approach was applied to detect extremely low-level wet ring-stage infected paraites in whole blood. The results demonstrated that by combining the whole wavelength range, higher accuracy for classifying parasitemia classes is possible compared to using either UV/Vis or NIR wavelength range interpedently. Additionally, partial least-squares regression (PLS-R) analysis demonstrated that the extended spectral range offered superior quantification sensitivity, with an R² value of 0.898, compared to UV/Vis and NIR alone, which had R² values of 0.806 and 0.556, respectively. This extended wavelength range proved effective in accurately detecting and quantifying P. falciparum at various stages of infection, outperforming the analysis of independent spectral regions.
4.7. UV-Visible spectroscopy
The Ultraviolet-visible (UV/Vis) technique involves electronic transitions that alter the electronic state of molecules by exciting electrons from lower to higher energy levels. Light induces a series of electronic transitions from the highest occupied molecular orbital (HOMO) to the lowest unoccupied molecular orbital (LUMO). The UV/vis technique is used to accurately measure protein and nucleic acid concentrations by analyzing their absorption spectra. In the far-UV and near-UV ranges, proteins absorb light at specific wavelengths, with notable absorption by aromatic amino acids and hemoglobin. Protein absorption spectra vary based on their environment, providing insights into protein conformational changes. These variations are useful for identifying chromophores and monitoring structural changes in proteins, which can aid in disease diagnosis and prognosis. Hemoglobin, present in red blood cells, absorbs light within the visible spectrum, especially at 416 nm (Soret band) and at doublet peaks around 540 and 575 nm. Briehl and Hobbs [133,134] demonstrated that variations in the observed spectra of the protein within the 260–300 nm range indicate changes in the environment or interactions (or both) of the chromophoric groups, such as tyrosine, tryptophan, and phenylalanine (Table 3), allowing for chromophore identification. In general, these differences in protein absorption have proven to be highly valuable for tracking conformational changes in proteins, as well as for disease diagnosis and prognosis.
Serebrennikova et al. [135] acquired a typical ultraviolet-visible spectrum of the malaria parasite P. falciparum extracted from infected red blood cells, highlighting absorption bands associated with hemozoin at 650 nm and the guanine and cytidine content of the parasite's DNA at 263 nm Frosch et al. [136] reported that the selective resonance enhancement of morphology-sensitive Raman modes of hemozoin is driven by absorption bands in the UV-VIS-NIR spectrum. Recently, Adegoke et al. [6] applied visible micro-spectrophotometry and machine learning to identify and quantify the life cycle stages of asexual blood-stage malaria parasites at the single-cell level. With high accuracy, Principal Component Analysis and Support Vector Machine Analysis effectively discriminated between different parasite stages (Figure 16). This method eliminates the need for drying and fixation, enhancing the accuracy of malaria diagnosis. The approach shows promise for improving monitoring and recovery processes in malaria treatment. [6]
4.8. Multimodal Spectroscopy
Multimodal spectroscopy (MMS) combines multiple spectroscopic techniques, such as IR and Raman, to analyze the same sample, offering a more comprehensive understanding of its chemistry by integrating complementary data from each modality. [137,138] Independent models of each technique are developed first to assess data quality, but a true MMS approach merges these models to enhance predictive accuracy. [138,139] While IR and Raman spectroscopy are particularly effective as they provide overlapping yet distinct information, combining other modalities like Mid-IR with NIR or UV/Vis can also be beneficial. Despite its advantages, MMS presents challenges such as logistical issues, data handling complexity, and increased computational demands. [109] These challenges can be mitigated with advanced instrumentation, which enable simultaneous or sequential measurements across different modalities. Additionally, adapting existing instruments with improved data processing protocols, such as wavenumber correction, normalization, and image co-registration, can facilitate effective MMS modelling and data fusion.
In the context of malaria diagnosis, there are MMS research combining IR and Raman imaging to study red blood cells (RBCs) infected with P. falciparum malaria parasites. [94] Perez Guaita et al. [94] reported that detecting hemozoin-associated bands was not possible using each imaging method separately (Figure 17). Raman spectroscopy helped identify the precise pixels of hemozoin within the trophozoite, which then enabled the identification of FTIR spectral characteristics of the trophozoite. [94] The study also employed this MMS technique on Micrasterias, a type of desmid microalgae, where statistical heterospectroscopy (SHY) was used to link bands across different modalities, effectively distinguishing between overlapping lipid and carbohydrate bands.
In another study, [132] an innovative method for diagnosing malaria by combining electronic ultraviolet-visible (UV/Vis) spectroscopy with near-infrared (NIR) spectroscopy was introduced for the first time. This approach was applied to extremely low-level wet ring-stage infected whole blood. By combining the whole wavelength range, higher accuracy for classifying parasitemia classes is possible compared to using their peculiar wavelength range. Additionally, partial least-squares regression (PLS-R) analysis demonstrated that the extended spectral range offered superior quantification sensitivity, with an R² value of 0.898, compared to UV/Vis and NIR alone, which had R² values of 0.806 and 0.556, respectively. This extended wavelength range proved effective in accurately detecting and quantifying P. falciparum at various stages of infection, outperforming the analysis of individual spectral components (Figure 18).
4.9. Photoacoustic spectroscopy
Photoacoustic (PA) also called Optoacoustic is a novel technique that relies on the generation and time-resolved detection of optoacoustic (thermoelastic) waves produced in tissue by short optical pulses of the order of nanosecond or intensity modulated continuous wave laser light that generate ultrasonic pressure waves in the tissue. [140] The effect involves the conversion of the absorbed optical energy to thermal energy that provokes a temperature increase and thermoelastic expansion in the affected region. A transient pressure wave is generated and it propagates through the sample. [141] This approach allows for detailed probing of tissues and individual blood vessels, offering high optical contrast and ultrasound spatial resolution. Since photoacoustic waves carry information about the optical and thermophysical properties of tissues, their detection and analysis facilitate highly accurate and specific measurements of physiological variables.
An initial intent to diagnose malaria with PA, was done by Samson et al. [142] by trying to detect hemozoin. Hemozoin and hemoglobin are the major chromophores involved in malaria infected blood. If hemozoin would be detectable, then PA can be used as a mode to identify in blood the infection. For this study, since hemozoin is difficult to purify, a synthetic analogue β-hematin was used to examine the potentiality and sensitivity of the technique. β-hematin was analyzed not only with photoacoustic spectroscopy but also with UV/Vis spectroscopy as well as TEM and FTIR. The FTIR spectra showed distinctive peaks at 1661 cm-1 and 1206 cm-1 which are also seen in hemozoin and therefore confirming that it is a good analogue and that it is detectable with PA. Furthermore, Samson et al. [142] also saw that prolonged irradiation altered the physical and optical properties of β-hematin resulting in increased absorption at shorter wavelengths. Nevertheless, the PA absorption spectra in this study mimicked the UV/Vis spectra which confirmed the accuracy and potential of this method.
Another interesting approach that was used to detect malaria is photoacoustic flow cytometry (PAFC) which is based on irradiating circulating targets with short laser pulses followed by time-resolved detection of laser-induced acoustic waves (PA signals) with an ultrasound transducer. In vivo PAFC combines sensitivity and spectral specificity of optical spectroscopy with spatial resolution and depth penetration of ultrasound techniques using pulsed and continuous wave lasers as sources for the generation of photacoustics. [143] Menyaev et al. [143] show how PAFC is a potential technique for detection of malaria and explored how sensitivity at the same flow rate improves in arteries compared to veins in mice. On the other hand, they were able to detect a level of 0.00000001% within 20 seconds and the potential to improve still 100 times more in humans. This was possible because when estimating the amount of red blood cells (RBCs) that flows through an artery and the events identified is what allows such a high detectability. On the other hand, Cai and colleagues [144] demonstrated how by applying PAFC integrated with fluorescence provided real-time simultaneous detection of single infected RBCs detecting malaria on ear arteries of mice.
On the other hand, a very smart approach from Lukianova-Hleb et al. [26] showed in their work that it is possible to detect malaria transdermal without the need of withdrawing blood from the subject. The authors discovered that with high optical absorbance combined with the nanosize of hemozoin, a vapor nanobubble can be generated around the hemozoin in response to a short, safe near-infrared picosecond laser pulse. A picosecond pulse localizes the released heat to a nano-volume around a nanoparticle and evaporates liquid around the hemozoin in an explosive manner, creating and expanding and collapsing transient vapor bubbles of submicron size in the malaria parasite. The method can detect the infection as low as 0.00034% in animals without any reagents or withdrawal of blood with no false-positive signals. Following this previous study Lukianova-Hleb [145] and some of the authors continued the research into a human prototype that gave very positive and promising results. They were able to prove with one infected subject and the comparison with 5 healthy volunteers, that the diagnosis is possible. Furthermore, they estimated the cost of a battery-powered device the size of a shoebox is US$15,000, which potentially could test 200,000 persons per year, without any additional costs.
4.10. Photoacoustic Imaging (PAI)
Photoacoustic imaging uses the advantages of both optics and ultrasound. Therefore, has a versatile optical absorption contrast but exploiting the low scattering of ultrasound to overcome the barriers imposed by optical diffusion. [146] A pulse of light gets absorbed by the tissue heating up the optical absorption zone. The temperature increase induces a thermoelastic expansion of the interested molecule causing ultrasound waves to propagate outwards. These waves are detected by an ultrasound transducer and reconstructed into an image that maps the original optical energy absorption. Photoacoustic imaging benefits from the tunability of the image contrast by selecting the excitation laser wavelength, with the ability to image many molecules independently using the same system. [147] By combining optics and acoustics, this system has the advantage of the pure optical and ultrasound imaging systems, that is a high-resolution, high-frame rate and strong contrast and sensitivity with non-ionizing radiation. But also, due to weak acoustic attenuation of the biological tissues, the imaging depth is usually greater than pure optical systems. [147]
The performance of the photoacoustic imaging system is intricately linked to its configuration, with different variants optimized for specific imaging requirements. Based on the desired balance between imaging depth and spatial resolution, three main configurations are commonly employed: optical resolution photoacoustic microscopy (OR-PAM), acoustic resolution photoacoustic microscopy (AR-PAM), and photoacoustic computed tomography (PACT). OR-PAM offers superior spatial resolution at the expense of imaging depth, making it ideal for superficial structures. AR-PAM provides a compromise between resolution and depth, suitable for imaging several millimetres into tissue. PACT, on the other hand, enables deep tissue imaging with scalable resolution, making it versatile for a range of applications from small animal imaging to human studies. Lateral resolution ranges from 2.6 µm (OR-PAM), [148] 45-590 µm (AR-PAM) [149] and 100-720 µm (PACT). [150] Instead depth goes from 1.2 mm (OR-PAM), [148] 3-10.3 mm (AR-PAM) [149] and 10- 70 mm (PACT). [150] OR-PAM provides the best imaging resolution, but images are limited to a 1mm of depth with an axial resolution of tens of micros. AR-PAM uses a wide-field optical excitation, and it is based on diffusive photons, which allows greater penetrations depths, but then axial resolution is limited by the focused detection of high-frequency acoustic signals. PACT utilizes wide-field optical excitation in the diffusive regime but with low-frequency array transducers or arrays and inverse reconstruction algorithms providing a 2D-3D imaging at the submillimeter level. [147] More details on the specific methods and a detailed description can be found in other references. [149,151,152,153,154]
Even though PAI might be a promising technique, its use on malaria diagnostics may be limited by the signal of hemozoin that is only produced when the parasite has matured to the merozoite stage which happens when it is in the liver and therefore be useful only when the infection has been onset. Nevertheless, new technology around photoacoustic is being developed that has the potential to discover new facts about the disease. An interesting technique is the one proposed by Pleitez et al. [155], where they have developed a mid-infrared optoacoustic microscopy (MiROM) using the acoustic detection of optical absorption and using Mid-infrared sensing as a positive-contrast imaging modality. By using acoustic detection of optical absorption, MiROM converts Mid-IR sensing into a positive-contrast imaging modality with negligible photodamage and high sensitivity. This new technique could be used by focusing the attention on the lipid Mid-IR spectral region to identify RBCs infected on the ring state which has been shown previously to have a spectral signature on the CH stretching region (3000-2800 cm-1).
A limitation which still needs to be overcome is the development of portable devices that can be adapted to the malaria diagnosis, since its main need is in countries with low resources. In conclusion, these researchers show that there is good potential for developing a malaria diagnostic tool fast, with good sensitivity and specificity, but portability and affordability are still issues to be dealt with.
4.11. Atomic Force Microscopy - Infrared (AFM-IR) Spectroscopy
AFM-IR spectroscopy is an advanced technique that combines the high spatial resolution of atomic force microscopy with the chemical specificity of infrared spectroscopy using the indirect method based on the effect of thermal expansion. AFM-IR enables the high-resolution mapping of subcellular structures in P. falciparum-infected RBCs at different stages of development. [156] This approach enabled the creation of compositional maps for subcellular structures within the parasites. These structures included the food vacuole (FV), lipid inclusions, and the nucleus. The mapping was based on the intensity of specific infrared marker bands corresponding to hemozoin (Hz), hemoglobin (Hb), lipids, and DNA (Figure 19).
Imaging identified distinct topographic changes in infected cells, particularly a semispherical protrusion associated with the trophozoite stage, where hemoglobin is degraded, and hemozoin is deposited. AFM-IR spectra confirmed the presence of Hz in the protrusion, characterized by specific infrared bands at 1708 cm⁻¹ and 1207 cm⁻¹, indicative of Hz, while bands at 1540 cm⁻¹ were associated with hemoglobin outside the protrusion. Additionally, the study found higher concentration of lipids within the infected cell's food vacuole compared to uninfected cells, with principal component analysis highlighting a higher ratio of CH₂ to CH₃, suggesting a lipid-rich environment around Hz.
The AFM-IR method was directly compared to O-PTIR by Banas et al.. [95] Despite differences in signal generation methods, the study demonstrated that both techniques produce comparable IR absorption spectra. The study further explored the application of AFM-IR for analyzing individual red blood cells (RBCs) infected with P. falciparum. By fixing the wavenumber to specific absorbance bands, such as amide I (~1660 cm⁻¹) and C=O stretching in lipids (~1740 cm⁻¹), AFM-IR provided detailed chemical imaging and topography of infected cells. The study also noted that the spatial resolution of AFM-IR (~40 nm) offers a significant advantage for locating regions of interest for further spectral analysis, which is critical for understanding the dynamic biochemistry within infected cells. Additionally, AFM-IR identified stiffness differences within the cells, with hemozoin-rich areas being stiffer, highlighting the technique's potential for detailed mechanical and chemical characterization of single cells.
4.12. Tip Enhanced Raman Spectroscopy (TERS)
Another spectroscopic technique that uses a scanning probe of AFM for enhancing the signal is tip-enhanced Raman spectroscopy (TERS). It enables an inverted Raman microscope to achieve high-resolution chemical imaging that can detect specific biomolecular signatures of malaria parasites at very low concentrations. Wood et al. [157] studied TERS, to investigate Hz crystals from red blood cells infected with P. falciparum trophozoites. In this application, the cell was first embedded in resin and then sectioned, allowing spectra to be recorded only from crystals protruding from the sectioned cell. By carefully targeting the edge of hemozoin crystals, the researchers were able to record TERS spectra that are free from the fluorescence interference often encountered in far-field measurements. The study showcases the first TERS spectra of hemozoin in such cells, revealing characteristic bands related to the heme macrocycle and providing insights into the oxidation state of the central iron atom (Figure 20).
In addition to capturing high-resolution images of hemozoin crystals within the digestive vacuole of the parasite, the study also explored the reproducibility of TERS measurements across different samples and tips. PCA was applied to the TERS spectra, demonstrating that while there is some variance in the spectral data, the main spectral features of hemozoin were consistently observed. The research highlights the potential of TERS for investigating drug interactions with hemozoin, particularly the binding of quinoline-based antimalarials to the crystal edges.
4.13. Other non-invasive approaches
To date, there have been no spectroscopic studies focused on diagnosing malaria using non-invasive approaches such as breath, urine, and saliva analysis. While some studies have employed gas chromatography (GC) for breath analysis, Fourier-Transform Infrared (FTIR) spectroscopy offers several advantages. Unlike GC, Gas FTIR spectroscopy can detect rapid changes in sample concentrations during transient events, capturing data on a second-by-second basis or even faster. Moreover, FTIR data collection does not require the use of impingers, chemical derivatization, or diffusers.
Most gas analyzers require users to have calibration gases on hand for daily recalibration to account for changes in instrument response. In contrast, FTIR calibrations remain consistently stable and accurate over time without the need for recalibration. This stability is achieved because performing a new background scan compensates for any instrumental drift in the final absorbance spectrum.
Berna et al. [158] studied the breath of malaria-infected patients using GC-MS and found elevated levels of 14 volatile organic compounds spanning multiple organic chemical classes. Similarly, Schaber et al. [159] reported elevated breath levels of α-pinene and 3-carene in infected patients. These biomarkers could potentially be detected with great sensitivity using gas FTIR.
For saliva and urine studies, the most popular target antigens detected by Rapid Diagnostic Tests (RDTs) are Plasmodium histidine-rich protein 2 (PfHRP2) and P. falciparum lactate dehydrogenase (pLDH) protein. [160] As both are proteins, they are potentially excellent candidates for FTIR analysis.
The advantages of FTIR suggest that biomarkers could be detected with much better sensitivity than other currently available techniques, potentially offering a major advancement in malaria testing. The non-invasive nature of these approaches, combined with the high sensitivity and rapid analysis capabilities of FTIR, could significantly improve malaria diagnosis and monitoring, especially in resource-limited settings.
5. Clinical field trials of ATR-FTIR spectroscopy
Henry Mantsch was vociferous in promoting biospectroscopy into medicine with development of a widely implemented point-of-care (PoC) spectroscopic disease diagnostic being a major aim. Malaria diagnosis by IR spectroscopy shows great promise is this respect. Laboratory experiments with mid-IR spectroscopy using spiked red blood cells [7,91] had demonstrated potential for detection of parasitemia at levels somewhere between the limits of light microscopy and PCR detection, as well as being sensitive to different stages in the malaria parasite life cycle. [31]Indeed, the need for a cheap, rapid and accurate spectroscopic test with the potential to detect parasitemia at levels necessary to detect asymptomatic carriers in mass screening efforts in low-income settings has made IR spectroscopy-based testing very attractive. This has led to date to two pilot field trials designed to test this notion, published concurrently in the Malaria Journal. [57,92]
Both trials were similar employing portable FTIR ATR spectrometers to measure extracted red blood cell (RBC) fractions isolated from clinical samples obtained using venipuncture. The studies differed in terms of sampling strategy. The Heraud et al. [57] study obtained samples at regional hospitals in Northeast Thailand from patient presenting with symptoms consistent with malaria infection. Whereas, in the Mwanga et al. [92] samples were obtained in a cross-sectional malaria parasite prevalence survey in south-eastern Tanzania, with subjects included regardless of the perceived state of their health. The patient sample size was similar in both studies with Mwanga et al. [92] considering 296 and Heraud et al. [57] 318 patients. Neither of the studies was point-of-care, with both measuring stored samples. In the Heraud et al. [57] study methanol-fixed RBCs were stored and measured subsequently by placing an aliquot of the fixed cell slurry on the ATR crystal that was then dried by air stream and measured. Mwanga et al. [92] placed a drop of the RBC extract on Whatman filter paper with the dried sample spot pressed down onto the ATR crystal with the instrument anvil.
Analysis was similar in overall approach for both studies with the use of PCR as the gold standard, however details differed. Heraud et al. [57] employed quality testing of spectra using water vapour and signal to noise ratio as testing criteria as well as examining similarity of individual spectra to the model as a basis for accepting or rejecting spectra, whereas Mwanga et al. [92] appeared to not quality test spectra at all. Heraud et al. [57] tested the effects of spectral pre-processing and spectral regions on classification model performance, emphasising the need for the incorporation of pre-processing into a spectroscopy-based malaria diagnostic, conceiving a system where quality testing, pre-processing and classification would utilise “cloud-based” algorithms and demonstrated the ability of their measurement system to receive and send data from a remote computer. By contrast, Mwanga et al. [92] used an arbitrarily chosen pre-processing scheme.
Classification modelling approaches were similar in both studies with data split 70:30 and 80:20 into calibration and validation sets, for Heraud et al. [57] and Mwanga et al. [92], respectively. Prospective validation of calibration models was not done in either study. Heraud et al. [57] compared Support Vector Machine (SVM) and Partial Least Squares Discriminant Analysis (PLS-DA) classification modelling, finding SVM performed slightly better with 92% sensitivity (3 false negatives out of 39 true positives) and 97% specificity (2 false positives out of 57 true negatives) and an area under the receiver operation curve (AUROC) of 0.98. Whereas Mwanga et al. [92] compared k-nearest neighbours (KNN), logistic regression (LR), (SVM), naïve Bayes (NB), XGBoost (XGB), random forest (RF), and Multilayer perceptron (MLP), finding LR performed slightly better than the other approaches with a sensitivity of 92% (2 false negatives out of set of 28 true positives) and specificity of 93% (2 false positives out of a set of 24 true negatives). Mwanga et al. [92] did not state AUROC performance. One reason for the much smaller validation set in the Mwanga et al. [92] study was that it only included patients with monospecific infection (P. falciparum). When mixed infections (P. falciparum plus P. ovale) were included, the sensitivity dropped to 82% and specificity to 91%. Unlike the study of Mwanga et al. [92], Heraud et al. [57] employed positive malaria samples infected by both P. falciparum, P. vivax and mixed infections (P. falciparum, n=58; P. vivax, n=77; P. falciparum/ P. vivax, n=16) in both calibration and validation sets. Comparison of classification performance between the two studies are summarised in Table 4.
The advantage of PLS-DA modelling as described by Heraud et al. [57] was the ability to examine regression loadings explicitly and hence determine the spectral regions most heavily weighted for classifying malaria positive and negative spectra. This is shown in Figure 21.
Analysis of the Partial Least Squares Discriminant Analysis (PLS-DA) loadings reveals a striking pattern: the most significant positive weightings for malaria-infected samples are predominantly associated with lipid-related spectral bands. Specifically, the CH3/CH2 bending modes (~1370 cm-1 and 1450 cm-1) and CH2 stretching modes (~2850 cm-1 and 2920 cm-1) show particularly strong correlations with malarial infection (Figure 21). This pronounced lipid signature in the spectral data suggests a potential biochemical marker for malaria infection, likely reflecting the parasite's impact on host cell lipid metabolism or its own lipid-rich structures. This is consistent with the increase in lipid absorbance observed in malaria spiked RBC samples in all life stages compared with controls. [31] By contrast, the spectral regions most heavily weighted for malaria positive and negative samples with the Logistic Regression modelling employed by Mwanga et al. [92] are harder to determine with any precision with only single wavenumber values influencing model prediction provided . Contrary to what one would presume to be logical, and remaining unexplained, wavenumbers 1729 cm-1 and 1730 cm-1, presumably relating to lipid ester carbonyl absorbance, were those most strongly determining the classification of non-infected control samples in the LR modelling.
Little information could be gained about the differences between infected and non-infected samples from the average spectra presented by Mwanga et al. [92] which were dominated by intense bands from cellulose. The spectral contamination from the cellulose background was intense across the entire fingerprint region and potentially could obscure bands related to malaria parasitemia. It is likely to be difficult to fully account for the spectral contamination by spectral pre-processing, a less than perfect situation in terms of modelling accuracy, limiting the usefulness of this sampling approach, compared to the Heraud et al. [57] study where fixed aliquots of RBCs were measured directly. The very small sample volume probed by ATR FTIR spectroscopy may also be a factor limiting detection sensitivity in both these studies. Other techniques that by their nature measure larger sample volumes such as IR transflection [161]and NIR spectroscopy [5] would be expected to have lower detection limits by probing larger cell volumes, thus proving superior to ATR methods for the development of a reliable malaria field diagnostic. These alternative approaches also have the potential to use smaller handheld devices better suited to point-of-care measurements in the field than the still rather cumbersome ATR spectrometers used in these studies. The ease of use of these handheld devices for use by minimally trained users would certainly be enhanced by employing remote “Cloud-computing” to handle spectral quality control, pre-processing, modelling and return of the diagnostic result to the user as advocated by Heraud et al. [57].
6. Pathway and obstacles to translation
In addition to improvements in measurement technologies, further scope for improvement of the diagnostic concept may lie in reducing the blood sample volume for the measurement. The two field studies relied on venepuncture for sampling however only a small quantity of the blood sample was used for spectroscopy. Development of less invasive methods are required, especially to compete with existing technology such as rapid antigen testing used as a comparison diagnostic in both studies. Given the very small measurement volumes that are probed by spectroscopic methods it should be possible to engineer a more refined sample processing technology that could work with finger-prick volumes of blood and provide direct presentation of the processed sample to the measurement device. This development is essential for making the diagnostic more rapid, easier to use and e improving measurement consistency. A potentially ground-breaking approach in malaria diagnostics would be the in vivo detection of parasitemia using Near-Infrared (NIR) spectroscopy, where NIR light is transmitted directly through the patient's skin. While this non-invasive method is theoretically feasible, it currently faces significant practical challenges. The primary hurdle is the high detection limit, which surpasses the sensitivity required for accurate diagnosis of low-level parasitemia. This limitation stems from factors such as signal attenuation by skin and other tissues, the complex optical properties of blood, and the relatively low concentration of parasites in peripheral circulation during early stages of infection. Despite these current constraints, ongoing advancements in NIR technology, signal processing algorithms, and our understanding of malaria pathophysiology may eventually overcome these barriers, making this non-invasive approach a reality in future malaria diagnostics. How many patient spectra are needed to develop classification models powerful enough to accurately diagnose malaria prospectively?
Heraud et al. [57] attempted to estimate empirically the size of the calibration set necessary to achieve optimal modelling accuracy by using field data from their trial with classification performance being monitored by cross validation using successive PLS-DA models with increasing number of samples in the calibration data sets (up to n = 200; using 20 replicates in each case). Classification error was observed to decrease exponentially with sample size (n), with extrapolation of the trend line predicting very low error rate at n = 500. A “cloud” based diagnostic would enhance the opportunity to improve classification power in real time by enabling the updating of models on a continuous basis as new spectra were acquired.
Apart from having adequate sample size in the calibration set, the need to control for environmental variables is paramount for developing a reliable spectroscopy-based diagnostics. Unlike genetic testing such as PCR, it can be argued that phenotypic testing such as spectroscopy-based diagnostics is more vulnerable to perturbation by environmental variables. For example, the study by Martin et al. [90] demonstrated that the use of different anticoagulant tubes could affect the detection and quantification of malaria parasitemia in human red blood cells by ATR-FTIR spectroscopy. This underscores the need to develop standardised methods and protocols that attempt to minimise and control for as many of these environmental variables as possible. An advantage of a spectroscopy-based diagnostic compared to PCR testing, for example, is that other important diagnostic information apart from the presence of parasitemia might be gleaned from the single sample spectrum using multiple classification models applied in parallel. Examples are the determination of blood chemistry such as glucose, urea and haemoglobin levels [91] or diagnosis of other key indicators such as Glucose-6 Phosphate Dehydrogenase deficiency, [162] in addition to the malaria diagnosis, making the test more valuable to the practitioner in deciding the best course of treatment.
7. Application of spectroscopy to monitor drug interactions
Vibrational spectroscopy including techniques like FTIR and Raman spectroscopy, offers a powerful tool for monitoring drug interactions in malaria-infected red blood cells. These non-destructive methods allow for real-time analysis of biochemical changes at the molecular level, enabling researchers to observe how antimalarial drugs affect the parasite's metabolism and the host cell environment. This approach provides insights into the mode of action of drugs, parasite resistance mechanisms, and the overall biochemical impact of the treatment. Furthermore, combining these spectroscopic techniques with advanced chemometric modelling enhances the ability to discriminate between healthy and infected cells, facilitating high-throughput drug screening and personalized therapeutic strategies against malaria.
Many antimalarial drugs exhibit strong Raman scattering, making this technique highly suitable for (i) conducting structural studies both in the presence and absence of metabolites, and (ii) detecting and quantifying these drugs under various conditions. [163] Many studies have investigated the significance of complex formation between antimalarial drugs such as chloroquine and ferriprotoporphyrin IX Fe(III)PPIX in solution. [164] For instance, Frosch et al. [165] reported the presence of a non-covalent interaction in the electronic ground state of the drug–target complex using polarization-resolved resonance Raman spectroscopy. They suggested that the non-covalent interaction of chloroquine with hematin induces a change in the excited-state geometry along specific ground-state normal coordinates. In another study by the same team, the Density Functional Theory (DFT) calculations were used to perform the mode assignment, which indicated that the protonation states of CQ significantly affect its molecular geometry, vibrational modes, and molecular orbitals. These alterations are crucial for its π–π interactions with haemozoin. [166] Furthermore, the team has performed a number of investigations to elucidate the structure of antimalarial drugs such as halafantine, [167] the antiplasmodial naphthylisoquinoline alkaloid dioncophylline A, [168,169] quinine in cinchona bark, [166] and mefloquine [170] using Raman spectroscopy and DFT calculations.
Webster et al. [31] utilized resonance Raman spectroscopy to monitor the effects of chloroquine (CQ) treatment on cultures of falciparum trophozoites. This vibrational spectroscopic study is the first of its kind to investigate the effect of drug treatment on single P. falciparum-infected red blood cells. PCA reveals that the intensity of the A1g modes; 1570, 1376, 796, 678 cm−1 and the B1g modes: 1552, 751 cm−1 is reduced in CQ treated cells compared to the untreated controls. The exact mechanism by which CQ exerts its antimalarial effects remains not fully elucidated. Theories have suggested that the CQ binds to ferriprotoporphyrin IX (FPIX) to form the FPIX–CQ complex and can lead to parasite cell autodigestion. Kozicki et al. [171] investigated and compared the CQ-treated and untreated cultured falciparum-infected human red blood cells (iRBCs) using attenuated total reflection (ATR-FTIR) and Raman spectroscopy. The intensities of bands correspond to biochemical moieties such as proteins, lipids, nucleic acids and carbohydrates were changed in response to CQ treatment. The ATR-FTIR analysis reveals an increase in the CH stretching bands within the 3100–2800 cm⁻¹ range in CQ-treated iRBCs, indicating a higher concentration of saturated lipids. The PCA showed a characteristic of ferric heme band at 1379 cm−1 due to high oxygenated hemoglobin concentration in the CQ-treated iRBCs. Recently, Wolf et al. [172] manifested the significance of quinoline chloroquine – hematin interaction in solution using an advanced, highly parallelized Raman difference spectroscopy setup. A shift of (-1.12 ± 0.05) cm⁻¹ was observed in the core-size marker band ν(CαCm)asym peak position of the 1:1 chloroquine-hematin mixture compared to pure hematin. Additionally, the oxidation-state marker band ν(pyrrole half-ring)sym showed a shift of (+0.93 ± 0.13) cm⁻¹. This is consistent with the results from DFT calculations. The study has provided significant insights to the antimalarial action of CQ.
These findings demonstrate the capability of vibrational spectroscopy to capture molecular-level changes induced by drug binding and metabolism. However, a multimodal spectroscopic approach, combining both Raman and FTIR techniques, would provide more comprehensive insights by offering complementary information on the molecular structure, biochemical environment, and interaction dynamics. Furthermore, integrating computational chemistry tools such as DFT and molecular dynamics simulations can enhance the interpretation of spectral data, helping to elucidate the underlying mechanisms of drug action and resistance at the atomic level. This holistic approach holds promise for optimizing antimalarial drug design and improving our understanding of their interactions with both the parasite and the host cell.
8. Conclusions
The application of spectroscopic techniques in malaria research represents a paradigm shift in our approach to disease diagnosis, management, and drug development. As we stand at the crossroads of technological innovation and global health challenges, these advanced spectroscopic methods offer a glimpse into a future where rapid, accurate, and minimally invasive diagnostics could revolutionize malaria control efforts. Moreover, spectroscopy plays a crucial role in the development and evaluation of new antimalarial drugs. By providing detailed molecular insights into drug-parasite interactions, it enables researchers to design more effective compounds and optimize their efficacy against resistant strains.
The work pioneered by Professor Henry Mantsch and furthered by numerous researchers has laid a foundation for translating laboratory successes into real-world applications. Spectroscopic techniques, such as Raman and infrared spectroscopy, offer powerful tools for assessing the effectiveness of antimalarials. These methods can monitor drug uptake, metabolism, and distribution within infected cells, providing valuable information on drug action mechanisms and potential resistance development.
However, the journey from bench to bedside is fraught with challenges. The variability in field conditions, the need for standardization, and the complexities of biological systems all pose significant hurdles. Yet, these very challenges present opportunities for interdisciplinary collaboration and innovation. The integration of spectroscopic techniques with emerging technologies such as artificial intelligence and cloud computing could potentially overcome current limitations and usher in a new era of personalized malaria management and tailored drug therapies.
As we look to the future, we must ask ourselves: How can we harness the full potential of spectroscopic techniques to not only diagnose but also predict and prevent malaria outbreaks? How can we leverage these technologies to accelerate the discovery and development of novel antimalarial compounds? What role will these technologies play in the broader context of global health equity and disease eradication efforts? The answers to these questions may well determine the course of malaria control and treatment in the coming decades.
Ultimately, the true measure of success for these spectroscopic approaches will not be in their technical sophistication, but in their ability to make a tangible difference in the lives of those most affected by malaria. This includes not only improving diagnostics but also facilitating the development of more effective and accessible antimalarial drugs. As we continue to push the boundaries of what is possible with spectroscopy, we must remain focused on the end goal: a world free from the burden of malaria. The path forward requires not only scientific ingenuity but also a commitment to translating these promising technologies into accessible, affordable, and effective tools for communities around the globe, encompassing both diagnostic capabilities and enhanced therapeutic interventions.
Funding
This research received no external funding.
Conflicts of Interest
The authors declare no conflicts of interest.
References
- Venkatesan, P. The 2023 WHO World malaria report. Lancet Microbe 2024, 5, e214. [Google Scholar] [CrossRef] [PubMed]
- Abebaw, A.; Aschale, Y.; Kebede, T.; Hailu, A. The prevalence of symptomatic and asymptomatic malaria and its associated factors in Debre Elias district communities, Northwest Ethiopia. Malar J 2022, 21, 167. [Google Scholar] [CrossRef] [PubMed]
- Danwang, C.; Kirakoya-Samadoulougou, F.; Samadoulougou, S. Assessing field performance of ultrasensitive rapid diagnostic tests for malaria: a systematic review and meta-analysis. Malar J 2021, 20, 245. [Google Scholar] [CrossRef]
- Mantsch, H.; Jackson, M. Molecular spectroscopy in biodiagnostics (from Hippocrates to Herschel and beyond). Journal of Molecular Structure 1995, 347, 187–206. [Google Scholar] [CrossRef]
- Adegoke, J.A.; Kochan, K.; Heraud, P.; Wood, B.R. A Near-Infrared "Matchbox Size" Spectrometer to Detect and Quantify Malaria Parasitemia. Anal Chem 2021, 93, 5451–5458. [Google Scholar] [CrossRef]
- Adegoke, J.A.; Raper, H.; Gassner, C.; Heraud, P.; Wood, B.R. Visible microspectrophotometry coupled with machine learning to discriminate the erythrocytic life cycle stages of P. falciparum malaria parasites in functional single cells. Analyst 2022, 147, 2662–2670. [Google Scholar] [CrossRef]
- Khoshmanesh, A.; Dixon, M.W.; Kenny, S.; Tilley, L.; McNaughton, D.; Wood, B.R. Detection and quantification of early-stage malaria parasites in laboratory infected erythrocytes by attenuated total reflectance infrared spectroscopy and multivariate analysis. Anal Chem 2014, 86, 4379–4386. [Google Scholar] [CrossRef]
- Rathi, A.; Chowdhry, Z.; Patel, A.; Zuo, S.; Veettil, T.C.P.; Adegoke, J.A.; Heidari, H.; Wood, B.R.; Bhallamudi, V.P.; Peng, W.K. Hemozoin in malaria eradication—from material science, technology to field test. NPG Asia Materials 2023, 15, 70. [Google Scholar] [CrossRef]
- Drouin, E.; Hautecoeur, P.; Markus, M. Who was the first to visualize the malaria parasite? Parasit Vectors 2024, 17, 184. [Google Scholar] [CrossRef]
- Klencke, P.F.H. Neue physiologische Abhandlungen auf selbständige Beobachtungen gegründet für Aerzte und Naturforscher; Leipzig, 1843; Volume VIII.
- Lavéran, A. Note sur un nouveau parasite trouvé dans le sang de plusieurs malades atteints de fièvre palustre. Bull Acad Méd. 1880, 1880, 1235–1236. [Google Scholar]
- Egan, T.J. Hemozoin Biophysics and Drug Target. Encylopedia of Malaria 2013, 1–11. [Google Scholar] [CrossRef]
- Xiao, S.H.; Sun, J. Schistosoma hemozoin and its possible roles. Int J Parasitol 2017, 47, 171–183. [Google Scholar] [CrossRef] [PubMed]
- Schmidt, J.A.; Udeinya, I.J.; Leech, J.H.; Hay, R.J.; Aikawa, M.; Barnwell, J.; Green, I.; Miller, L.H. Plasmodium falciparum malaria. An amelanotic melanoma cell line bears receptors for the knob ligand on infected erythrocytes. J Clin Invest 1982, 70, 379–386. [Google Scholar] [CrossRef] [PubMed]
- Qadir, H.; Baig, M.M.; Ojla, M.D.; Aisha, M.; Adil, A. Malarial Pigment Hemozoin in Neutrophils: A Manifestation of Severe Malaria. Turk J Haematol 2023, 40, 137–138. [Google Scholar] [CrossRef] [PubMed]
- Dixon, M.W.; Thompson, J.; Gardiner, D.L.; Trenholme, K.R. Sex in Plasmodium: a sign of commitment. Trends Parasitol 2008, 24, 168–175. [Google Scholar] [CrossRef]
- Birhanu, M.; Asres, Y.; Adissu, W.; Yemane, T.; Zemene, E.; Gedefaw, L. Hematological Parameters and Hemozoin-Containing Leukocytes and Their Association with Disease Severity among Malaria Infected Children: A Cross-Sectional Study at Pawe General Hospital, Northwest Ethiopia. Interdiscip Perspect Infect Dis 2017, 2017, 8965729. [Google Scholar] [CrossRef]
- Pagola, S.; Stephens, P.W.; Bohle, D.S.; Kosar, A.D.; Madsen, S.K. The structure of malaria pigment beta-haematin. Nature 2000, 404, 307–310. [Google Scholar] [CrossRef]
- Solomonov, I.; Osipova, M.; Feldman, Y.; Baehtz, C.; Kjaer, K.; Robinson, I.K.; Webster, G.T.; McNaughton, D.; Wood, B.R.; Weissbuch, I.; et al. Crystal nucleation, growth, and morphology of the synthetic malaria pigment beta-hematin and the effect thereon by quinoline additives: the malaria pigment as a target of various antimalarial drugs. J Am Chem Soc 2007, 129, 2615–2627. [Google Scholar] [CrossRef]
- Wood, B.R.; Langford, S.J.; Cooke, B.M.; Lim, J.; Glenister, F.K.; Duriska, M.; Unthank, J.K.; McNaughton, D. Resonance Raman spectroscopy reveals new insight into the electronic structure of beta-hematin and malaria pigment. J Am Chem Soc 2004, 126, 9233–9239. [Google Scholar] [CrossRef]
- Marzec, K.M.; Perez-Guaita, D.; de Veij, M.; McNaughton, D.; Baranska, M.; Dixon, M.W.A.; Tilley, L.; Wood, B.R. Red Blood Cells Polarize Green Laser Light Revealing Hemoglobin′s Enhanced Non-Fundamental Raman Modes. ChemPhysChem 2014, 15, 3963–3968. [Google Scholar] [CrossRef]
- Slater, A.F. Malaria pigment. Exp Parasitol 1992, 74, 362–365. [Google Scholar] [CrossRef] [PubMed]
- Slater, A.F.; Swiggard, W.J.; Orton, B.R.; Flitter, W.D.; Goldberg, D.E.; Cerami, A.; Henderson, G.B. An iron-carboxylate bond links the heme units of malaria pigment. Proc Natl Acad Sci U S A 1991, 88, 325–329. [Google Scholar] [CrossRef] [PubMed]
- Bohle, D.S.; Conklin, B.J.; Cox, D.; Madsen, S.K.; Paulson, S.; Stephens, P.W.; Yee, G.T. Structural and Spectroscopic Studies of beta-Hematin (the Heme Coordination Polymer in Malaria Pigment). In Inorganic and Organometallic Polymers II: AdVanced Materials and Intermediates; ACS Symposium Series, Wisian-Neilson, P., Allcock, H.R., Wynne, K.J., Eds.; American Chemical Society: Washington, DC, 1994; Volume 572, pp. 497–515. [Google Scholar]
- Morselt, A.F.; Glastra, A.; James, J. Microspectrophotometric analysis of malarial pigment. Exp Parasitol 1973, 33, 17–22. [Google Scholar] [CrossRef]
- Lukianova-Hleb, E.Y.; Campbell, K.M.; Constantinou, P.E.; Braam, J.; Olson, J.S.; Ware, R.E.; Sullivan, D.J., Jr.; Lapotko, D.O. Hemozoin-generated vapor nanobubbles for transdermal reagent- and needle-free detection of malaria. Proc Natl Acad Sci U S A 2014, 111, 900–905. [Google Scholar] [CrossRef]
- Bendrat, K.; Berger, B.J.; Cerami, A. Haem polymerization in malaria. Nature 1995, 378, 138–139. [Google Scholar] [CrossRef]
- Ancelin, M.L.; Vial, H.J. Saturable and non-saturable components of choline transport in Plasmodium-infected mammalian erythrocytes: possible role of experimental conditions. Biochem J 1992, 283 Pt 2, 619–621. [Google Scholar] [CrossRef]
- Holz, G.G. Lipids and the malarial parasite. Bull World Health Organ 1977, 55, 237–248. [Google Scholar]
- Vielemeyer, O.; McIntosh, M.T.; Joiner, K.A.; Coppens, I. Neutral lipid synthesis and storage in the intraerythrocytic stages of Plasmodium falciparum. Mol Biochem Parasitol 2004, 135, 197–209. [Google Scholar] [CrossRef]
- Webster, G.T.; de Villiers, K.A.; Egan, T.J.; Deed, S.; Tilley, L.; Tobin, M.J.; Bambery, K.R.; McNaughton, D.; Wood, B.R. Discriminating the intraerythrocytic lifecycle stages of the malaria parasite using synchrotron FT-IR microspectroscopy and an artificial neural network. Anal Chem 2009, 81, 2516–2524. [Google Scholar] [CrossRef]
- Pisciotta, J.M.; Coppens, I.; Tripathi, A.K.; Scholl, P.F.; Shuman, J.; Bajad, S.; Shulaev, V.; Sullivan, D.J., Jr. The role of neutral lipid nanospheres in Plasmodium falciparum haem crystallization. Biochem J 2007, 402, 197–204. [Google Scholar] [CrossRef]
- Palacpac, N.M.; Hiramine, Y.; Seto, S.; Hiramatsu, R.; Horii, T.; Mitamura, T. Evidence that Plasmodium falciparum diacylglycerol acyltransferase is essential for intraerythrocytic proliferation. Biochem Biophys Res Commun 2004, 321, 1062–1068. [Google Scholar] [CrossRef] [PubMed]
- Jackson, K.E.; Klonis, N.; Ferguson, D.J.; Adisa, A.; Dogovski, C.; Tilley, L. Food vacuole-associated lipid bodies and heterogeneous lipid environments in the malaria parasite, Plasmodium falciparum. Mol Microbiol 2004, 54, 109–122. [Google Scholar] [CrossRef] [PubMed]
- Nawabi, P.; Lykidis, A.; Ji, D.; Haldar, K. Neutral-lipid analysis reveals elevation of acylglycerols and lack of cholesterol esters in Plasmodium falciparum-infected erythrocytes. Eukaryot Cell 2003, 2, 1128–1131. [Google Scholar] [CrossRef] [PubMed]
- Egan, T.J.; Chen, J.Y.; de Villiers, K.A.; Mabotha, T.E.; Naidoo, K.J.; Ncokazi, K.K.; Langford, S.J.; McNaughton, D.; Pandiancherri, S.; Wood, B.R. Haemozoin (beta-haematin) biomineralization occurs by self-assembly near the lipid/water interface. FEBS Lett 2006, 580, 5105–5110. [Google Scholar] [CrossRef]
- Birczyńska-Zych, M.; Czepiel, J.; Łabanowska, M.; Kraińska, M.; Biesiada, G.; Moskal, P.; Kozicki, M.; Garlicki, A.; Wesełucha-Birczyńska, A. Could Raman spectroscopy distinguish between P. falciparum and P. vivax Infection? Clinical Spectroscopy 2021, 3, 100015. [Google Scholar] [CrossRef]
- Gardner, M.J.; Hall, N.; Fung, E.; White, O.; Berriman, M.; Hyman, R.W.; Carlton, J.M.; Pain, A.; Nelson, K.E.; Bowman, S.; et al. Genome sequence of the human malaria parasite Plasmodium falciparum. Nature 2002, 419, 498–511. [Google Scholar] [CrossRef]
- Ganter, M.; Goldberg, J.M.; Dvorin, J.D.; Paulo, J.A.; King, J.G.; Tripathi, A.K.; Paul, A.S.; Yang, J.; Coppens, I.; Jiang, R.H.; et al. Plasmodium falciparum CRK4 directs continuous rounds of DNA replication during schizogony. Nat Microbiol 2017, 2, 17017. [Google Scholar] [CrossRef]
- Machado, M.; Steinke, S.; Ganter, M. Plasmodium Reproduction, Cell Size, and Transcription: How to Cope With Increasing DNA Content? Front Cell Infect Microbiol 2021, 11, 660679. [Google Scholar] [CrossRef]
- Sambe, B.S.; Diagne, A.; Diatta, H.A.M.; Gaba, F.M.; Sarr, I.; Diatta, A.S.; Diaw, S.O.M.; Sané, R.; Diouf, B.; Vigan-Womas, I.; et al. Molecular detection and quantification of Plasmodium vivax DNA in blood pellet and plasma samples from patients in Senegal. Frontiers in Parasitology 2023, 2. [Google Scholar] [CrossRef]
- Hobro, A.J.; Konishi, A.; Coban, C.; Smith, N.I. Raman spectroscopic analysis of malaria disease progression via blood and plasma samples. Analyst 2013, 138, 3927–3933. [Google Scholar] [CrossRef]
- Wood, B.R. The importance of hydration and DNA conformation in interpreting infrared spectra of cells and tissues. Chem Soc Rev 2016, 45, 1980–1998. [Google Scholar] [CrossRef] [PubMed]
- Reuterswärd, P.; Bergström, S.; Orikiiriza, J.; Lindquist, E.; Bergström, S.; Andersson Svahn, H.; Ayoglu, B.; Uhlén, M.; Wahlgren, M.; Normark, J.; et al. Levels of human proteins in plasma associated with acute paediatric malaria. Malaria Journal 2018, 17, 426. [Google Scholar] [CrossRef] [PubMed]
- Ikegbunam, M.; Maurer, M.; Abone, H.; Ezeagwuna, D.; Sandri, T.L.; Esimone, C.; Ojurongbe, O.; Woldearegai, T.G.; Kreidenweiss, A.; Held, J.; et al. Evaluating Malaria Rapid Diagnostic Tests and Microscopy for Detecting Plasmodium Infection and Status of Plasmodium falciparum Histidine-Rich Protein 2/3 Gene Deletions in Southeastern Nigeria. Am J Trop Med Hyg 2024, 110, 902–909. [Google Scholar] [CrossRef]
- Kojom Foko, L.P.; Eboumbou Moukoko, C.E.; Jakhan, J.; Narang, G.; Hawadak, J.; Kouemo Motse, F.D.; Pande, V.; Singh, V. Deletions of Histidine-Rich Protein 2/3 Genes in Natural Plasmodium falciparum Populations from Cameroon and India: Role of Asymptomatic and Submicroscopic Infections. Am J Trop Med Hyg 2024, 110, 1100–1109. [Google Scholar] [CrossRef]
- Oyegoke, O.O.; Akoniyon, O.P.; Maharaj, L.; Adewumi, T.S.; Malgwi, S.A.; Aderoju, S.A.; Fatoba, A.J.; Adeleke, M.A.; Maharaj, R.; Okpeku, M. Molecular detection of sub-microscopic infections and Plasmodium falciparum histidine-rich protein-2 and 3 gene deletions in pre-elimination settings of South Africa. Sci Rep 2024, 14, 16024. [Google Scholar] [CrossRef]
- Ranjan, P.; Ghoshal, U.; Prakash, S.; Pandey, A.; Shukla, R. Genetic variability of histidine-rich protein 2 repeat sequences: Misleading factor in true determination of Plasmodium falciparum in different population. Indian J Med Microbiol 2024, 49, 100616. [Google Scholar] [CrossRef]
- Schreidah, C.; Giesbrecht, D.; Gashema, P.; Young, N.W.; Munyaneza, T.; Muvunyi, C.M.; Thwai, K.; Mazarati, J.B.; Bailey, J.A.; Juliano, J.J.; et al. Expansion of artemisinin partial resistance mutations and lack of histidine rich protein-2 and -3 deletions in Plasmodium falciparum infections from Rukara, Rwanda. Malar J 2024, 23, 150. [Google Scholar] [CrossRef]
- Xu, S.; Tang, J. Biological threats to global malaria elimination II Deletion in the malaria rapid diagnostic test target Plasmodium falciparum histidine-rich protein 2/3 genes. Zhongguo Xue Xi Chong Bing Fang Zhi Za Zhi 2024, 36, 239–242. [Google Scholar] [CrossRef]
- Bachman, C.M.; Cate, D.M.; Grant, B.; Burkot, S.; Mulondo, J.; Hsieh, H.V.; Chamai, M.; Odongo, B.; Olwoch, P.; Nalubega, M.; et al. A Novel Malaria Lateral Flow Assay for Detecting Plasmodium falciparum Lactate Dehydrogenase in Busia, Uganda. Am J Trop Med Hyg 2022, 106, 850–852. [Google Scholar] [CrossRef]
- Feleke, S.M.; Gidey, B.; Mohammed, H.; Nega, D.; Dillu, D.; Haile, M.; Solomon, H.; Parr, J.B.; Tollera, G.; Tasew, G.; et al. Field performance of Plasmodium falciparum lactate dehydrogenase rapid diagnostic tests during a large histidine-rich protein 2 deletion survey in Ethiopia. Malar J 2022, 21, 236. [Google Scholar] [CrossRef]
- Tan, A.F.; Sakam, S.S.B.; Rajahram, G.S.; William, T.; Abd Rachman Isnadi, M.F.; Daim, S.; Barber, B.E.; Kho, S.; Sutherland, C.J.; Anstey, N.M.; et al. Diagnostic accuracy and limit of detection of ten malaria parasite lactate dehydrogenase-based rapid tests for Plasmodium knowlesi and P. falciparum. Front Cell Infect Microbiol 2022, 12, 1023219. [Google Scholar] [CrossRef] [PubMed]
- Saxena, N.; Pandey, V.C.; Dutta, G.P.; Ghatak, S. Levels of FDP-aldolase enzyme activity in Plasmodium knowlesi parasitized monkey erythrocytes. Indian J Exp Biol 1986, 24, 502–504. [Google Scholar]
- Francis, S.E.; Sullivan, D.J., Jr.; Goldberg, D.E. Hemoglobin metabolism in the malaria parasite Plasmodium falciparum. Annu Rev Microbiol 1997, 51, 97–123. [Google Scholar] [CrossRef] [PubMed]
- Wang, Y.; Boysen, R.I.; Wood, B.R.; Kansiz, M.; McNaughton, D.; Hearn, M.T. Determination of the secondary structure of proteins in different environments by FTIR-ATR spectroscopy and PLS regression. Biopolymers 2008, 89, 895–905. [Google Scholar] [CrossRef] [PubMed]
- Heraud, P.; Chatchawal, P.; Wongwattanakul, M.; Tippayawat, P.; Doerig, C.; Jearanaikoon, P.; Perez-Guaita, D.; Wood, B.R. Infrared spectroscopy coupled to cloud-based data management as a tool to diagnose malaria: a pilot study in a malaria-endemic country. Malar J 2019, 18, 348. [Google Scholar] [CrossRef]
- Elliott, A.; Ambrose, E.J. Evidence of chain folding in polypeptides and proteins. Discussions of the Faraday Society 1950, 9, 246–251. [Google Scholar] [CrossRef]
- Salzer, R. Practical Guide to Interpretive Near-Infrared Spectroscopy. By Jerry Workman, Jr. and Lois Weyer. Angewandte Chemie International Edition 2008, 47, 4628–4629. [Google Scholar] [CrossRef]
- Miyazawa, M.; Sonoyama, M. Second Derivative near Infrared Studies on the Structural Characterisation of Proteins. Journal of Near Infrared Spectroscopy 1998, 6, A253–A257. [Google Scholar] [CrossRef]
- Beć, K.B.; Huck, C.W. Breakthrough Potential in Near-Infrared Spectroscopy: Spectra Simulation. A Review of Recent Developments. Front Chem 2019, 7, 48. [Google Scholar] [CrossRef]
- Beć, K.B.; Grabska, J.; Huck, C.W. Principles and Applications of Miniaturized Near-Infrared (NIR) Spectrometers. Chemistry – A European Journal 2021, 27, 1514–1532. [Google Scholar] [CrossRef]
- Antila, J.; Tuohiniemi, M.; Rissanen, A.; Kantojärvi, U.; Lahti, M.; Viherkanto, K.; Kaarre, M.; Malinen, J. MEMS- and MOEMS-Based Near-Infrared Spectrometers. In Encyclopedia of Analytical Chemistry; 2014; pp. 1-36.
- Wood, B.R.; McNaughton, D. Resonance Raman spectroscopy in malaria research. Expert Review of Proteomics 2006, 3, 525–544. [Google Scholar] [CrossRef] [PubMed]
- Luthra, A.; Denisov, I.G.; Sligar, S.G. Spectroscopic features of cytochrome P450 reaction intermediates. Archives of Biochemistry and Biophysics 2011, 507, 26–35. [Google Scholar] [CrossRef]
- Ong, C.W.; Shen, Z.X.; Ang, K.K.H.; Kara, U.A.K.; Tang, S.H. Ong, C.W.; Shen, Z.X.; Ang, K.K.H.; Kara, U.A.K.; Tang, S.H. Resonance Raman Microspectroscopy of Normal Erythrocytes and Plasmodium Berghei-Infected Erythrocytes. http://dx.doi.org/10.1366/0003702991947874 1999, 53, 1097-1101. [CrossRef]
- Wood, B.R.; Langford, S.J.; Cooke, B.M.; Glenister, F.K.; Lim, J.; McNaughton, D. Raman imaging of hemozoin within the food vacuole of Plasmodium falciparum trophozoites. FEBS Letters 2003, 554, 247–252. [Google Scholar] [CrossRef]
- Wood, B.R.; Hermelink, A.; Lasch, P.; Bambery, K.R.; Webster, G.T.; Khiavi, M.A.; Cooke, B.M.; Deed, S.; Naumann, D.; McNaughton, D. Resonance Raman microscopy in combination with partial dark-field microscopy lights up a new path in malaria diagnostics. Analyst 2009, 134, 1119–1125. [Google Scholar] [CrossRef]
- Puskar, L.; Tuckermann, R.; Frosch, T.; Popp, J.; Ly, V.; McNaughton, D.; Wood, B.R. Raman acoustic levitation spectroscopy of red blood cells and Plasmodium falciparum trophozoites. Lab on a Chip 2007, 7, 1125–1131. [Google Scholar] [CrossRef]
- Kang, J.W.; Lue, N.; Kong, C.-R.; Barman, I.; Dingari, N.C.; Goldfless, S.J.; Niles, J.C.; Dasari, R.R.; Feld, M.S.; Choi, W.; et al. Combined confocal Raman and quantitative phase microscopy system for biomedical diagnosis. Biomedical Optics Express, Vol. 2, Issue 9, pp. 2484-2492 2011, 2, 2484–2492. [Google Scholar] [CrossRef]
- Brückner, M.; Becker, K.; Popp, J.; Frosch, T. Fiber array based hyperspectral Raman imaging for chemical selective analysis of malaria-infected red blood cells. Analytica Chimica Acta 2015, 894, 76–84. [Google Scholar] [CrossRef]
- Kozicki, M.; Czepiel, J.; Biesiada, G.; Nowak, P.; Garlicki, A.; Wesełucha-Birczyńska, A. The ring-stage of Plasmodium falciparum observed in RBCs of hospitalized malaria patients. Analyst 2015, 140, 8007–8016. [Google Scholar] [CrossRef]
- Patel, S.K.; Rajora, N.; Kumar, S.; Sahu, A.; Kochar, S.K.; Krishna, C.M.; Srivastava, S. Rapid Discrimination of Malaria- and Dengue-Infected Patients Sera Using Raman Spectroscopy. Analytical Chemistry 2019, 91, 7054–7062. [Google Scholar] [CrossRef]
- Hackett, M.J.; Aitken, J.B.; El-Assaad, F.; McQuillan, J.A.; Carter, E.A.; Ball, H.J.; Tobin, M.J.; Paterson, D.; De Jonge, M.D.; Siegele, R.; et al. Neuroscience: Mechanisms of murine cerebral malaria: Multimodal imaging of altered cerebral metabolism and protein oxidation at hemorrhage sites. Science Advances 2015, 1. [Google Scholar] [CrossRef]
- Frame, L.; Brewer, J.; Lee, R.; Faulds, K.; Graham, D. Development of a label-free Raman imaging technique for differentiation of malaria parasite infected from non-infected tissue. Analyst 2017, 143, 157–163. [Google Scholar] [CrossRef] [PubMed]
- Hobro, A.J.; Pavillon, N.; Fujita, K.; Ozkan, M.; Coban, C.; Smith, N.I. Label-free Raman imaging of the macrophage response to the malaria pigment hemozoin. Analyst 2015, 140, 2350–2359. [Google Scholar] [CrossRef] [PubMed]
- Gardiner, D.J. Introduction to Raman Scattering. In Practical Raman Spectroscopy; Gardiner, D.J., Graves, P.R., Eds.; Springer Berlin Heidelberg: Berlin, Heidelberg, 1989; pp. 1–12. [Google Scholar]
- Bell, S.E.J.; Charron, G.; Cortés, E.; Kneipp, J.; de la Chapelle, M.L.; Langer, J.; Procházka, M.; Tran, V.; Schlücker, S. Towards Reliable and Quantitative Surface-Enhanced Raman Scattering (SERS): From Key Parameters to Good Analytical Practice. Angewandte Chemie International Edition 2020, 59, 5454–5462. [Google Scholar] [CrossRef] [PubMed]
- Chen, F.; Flaherty, B.R.; Cohen, C.E.; Peterson, D.S.; Zhao, Y. Direct detection of malaria infected red blood cells by surface enhanced Raman spectroscopy. Nanomedicine 2016, 12, 1445–1451. [Google Scholar] [CrossRef] [PubMed]
- Chen, K.; Perlaki, C.; Xiong, A.; Preiser, P.; Liu, Q. Review of Surface Enhanced Raman Spectroscopy for Malaria Diagnosis and a New Approach for the Detection of Single Parasites in the Ring Stage. IEEE Journal of Selected Topics in Quantum Electronics 2016, 22, 179–187. [Google Scholar] [CrossRef]
- Garrett, N.L.; Sekine, R.; Dixon, M.W.; Tilley, L.; Bambery, K.R.; Wood, B.R. Bio-sensing with butterfly wings: naturally occurring nano-structures for SERS-based malaria parasite detection. Phys Chem Chem Phys 2015, 17, 21164–21168. [Google Scholar] [CrossRef]
- Radziuk, D.; Moehwald, H. Highly effective hot spots for SERS signatures of live fibroblasts. Nanoscale 2014, 6, 6115–6126. [Google Scholar] [CrossRef]
- Heidelberger, M.; Prout, C.; Hindle, J.A.; Rose, A.S. Studies in Human Malaria1: III. An Attempt at Vaccination of Paretics Against Blood-Borne Infection with Pl. Vivax. The Journal of Immunology 1946, 53, 109–112. [Google Scholar] [CrossRef]
- Liu, Q.; Yuen, C.; Chen, K.; Ju, J.; Xiong, A.; Preiser, P. Surface enhanced Raman spectroscopy for malaria diagnosis and intradermal measurements; SPIE: 2018; Volume 10509.
- Chen, K.; Yuen, C.; Aniweh, Y.; Preiser, P.; Liu, Q. Towards ultrasensitive malaria diagnosis using surface enhanced Raman spectroscopy. Sci Rep 2016, 6, 20177. [Google Scholar] [CrossRef]
- Wang, W.; Dong, R.-l.; Gu, D.; He, J.-a.; Yi, P.; Kong, S.-K.; Ho, H.-P.; Loo, J.; Wang, W.; Wang, Q. Antibody-free rapid diagnosis of malaria in whole blood with surface-enhanced Raman Spectroscopy using Nanostructured Gold Substrate. Advances in Medical Sciences 2020, 65, 86–92. [Google Scholar] [CrossRef]
- Yuen, C.; Gao, X.; Yong, J.J.M.; Prakash, P.; Shobana, C.R.; Kaushalya, P.A.T.; Luo, Y.; Bai, Y.; Yang, C.; Preiser, P.R.; et al. Towards malaria field diagnosis based on surface-enhanced Raman scattering with on-chip sample preparation and near-analyte nanoparticle synthesis. Sensors and Actuators B: Chemical 2021, 343, 130162. [Google Scholar] [CrossRef]
- Yuen, C.; Liu, Q. Optimization of Fe3O4@Ag nanoshells in magnetic field-enriched surface-enhanced resonance Raman scattering for malaria diagnosis. Analyst 2013, 138, 6494–6500. [Google Scholar] [CrossRef] [PubMed]
- Chen, K.; Perlaki, C.; Xiong, A.; Preiser, P.; Liu, Q. Review of Surface Enhanced Raman Spectroscopy for Malaria Diagnosis and a New Approach for the Detection of Single Parasites in the Ring Stage. Ieee Journal of Selected Topics in Quantum Electronics 2016, 22. [Google Scholar] [CrossRef]
- Martin, M.; Perez-Guaita, D.; Andrew, D.W.; Richards, J.S.; Wood, B.R.; Heraud, P. The effect of common anticoagulants in detection and quantification of malaria parasitemia in human red blood cells by ATR-FTIR spectroscopy. Analyst 2017, 142, 1192–1199. [Google Scholar] [CrossRef]
- Roy, S.; Perez-Guaita, D.; Andrew, D.W.; Richards, J.S.; McNaughton, D.; Heraud, P.; Wood, B.R. Simultaneous ATR-FTIR Based Determination of Malaria Parasitemia, Glucose and Urea in Whole Blood Dried onto a Glass Slide. Anal Chem 2017, 89, 5238–5245. [Google Scholar] [CrossRef]
- Mwanga, E.P.; Minja, E.G.; Mrimi, E.; Jimenez, M.G.; Swai, J.K.; Abbasi, S.; Ngowo, H.S.; Siria, D.J.; Mapua, S.; Stica, C.; et al. Detection of malaria parasites in dried human blood spots using mid-infrared spectroscopy and logistic regression analysis. Malar J 2019, 18, 341. [Google Scholar] [CrossRef]
- Perez-Guaita, D.; Perez-Guaita, D.; Andrew, D.; Heraud, P.; Beeson, J.; Anderson, D.; Richards, J.; Wood, B.R. High resolution FTIR imaging provides automated discrimination and detection of single malaria parasite infected erythrocytes on glass. Faraday discussions. 2016, 187, 341–352. [Google Scholar] [CrossRef]
- Perez-Guaita, D.; Kochan, K.; Martin, M.; Andrew, D.W.; Heraud, P.; Richards, J.S.; Wood, B.R. Multimodal vibrational imaging of cells. Vibrational Spectroscopy 2017, 91, 46–58. [Google Scholar] [CrossRef]
- Banas, A.M.; Banas, K.; Chu, T.T.T.; Naidu, R.; Hutchinson, P.E.; Agrawal, R.; Lo, M.K.F.; Kansiz, M.; Roy, A.; Chandramohanadas, R.; et al. Comparing infrared spectroscopic methods for the characterization of Plasmodium falciparum-infected human erythrocytes. Commun Chem 2021, 4, 129. [Google Scholar] [CrossRef]
- Idro, R.; Jenkins, N.E.; Newton, C.R.J.C. Pathogenesis, clinical features, and neurological outcome of cerebral malaria. The Lancet Neurology 2005, 4, 827–840. [Google Scholar] [CrossRef]
- Dvorin, J.D. Getting Your Head around Cerebral Malaria. Cell Host & Microbe 2017, 22, 586–588. [Google Scholar] [CrossRef] [PubMed]
- Hackett, M.J.; Aitken, J.B.; El-Assaad, F.; McQuillan, J.A.; Carter, E.A.; Ball, H.J.; Tobin, M.J.; Paterson, D.; De Jonge, M.D.; Siegele, R.; et al. Mechanisms of murine cerebral malaria: Multimodal imaging of altered cerebral metabolism and protein oxidation at hemorrhage sites. Science Advances 2015, 1, e1500911. [Google Scholar] [CrossRef] [PubMed]
- Hackett, M.J.; Lee, J.; El-Assaad, F.; McQuillan, J.A.; Carter, E.A.; Grau, G.E.; Hunt, N.H.; Lay, P.A. FTIR Imaging of Brain Tissue Reveals Crystalline Creatine Deposits Are an ex Vivo Marker of Localized Ischemia during Murine Cerebral Malaria: General Implications for Disease Neurochemistry. ACS Chemical Neuroscience 2012, 3, 1017–1024. [Google Scholar] [CrossRef] [PubMed]
- Wood, B.R.; Bambery, K.R.; Dixon, M.W.A.; Tilley, L.; Nasse, M.J.; Mattson, E.; Hirschmugl, C.J. Diagnosing malaria infected cells at the single cell level using focal plane array Fourier transform infrared imaging spectroscopy. The Analyst 2014, 139, 4769–4774. [Google Scholar] [CrossRef]
- Lasch, P.; Naumann, D. Spatial resolution in infrared microspectroscopic imaging of tissues. Biochimica et Biophysica Acta (BBA) - Biomembranes 2006, 1758, 814–829. [Google Scholar] [CrossRef]
- Edgar, R.C.S.; Counihan, N.A.; McGowan, S.; de Koning-Ward, T.F. Methods Used to Investigate the Plasmodium falciparum Digestive Vacuole. Front Cell Infect Microbiol 2021, 11, 829823. [Google Scholar] [CrossRef]
- Shibeshi, M.A.; Kifle, Z.D.; Atnafie, S.A. Antimalarial Drug Resistance and Novel Targets for Antimalarial Drug Discovery. Infect Drug Resist 2020, 13, 4047–4060. [Google Scholar] [CrossRef]
- Matz, J.M. Plasmodium’s bottomless pit: properties and functions of the malaria parasite's digestive vacuole. Trends in Parasitology 2022, 38, 525–543. [Google Scholar] [CrossRef]
- Noland, G.S.; Briones, N.; Sullivan, D.J. The shape and size of hemozoin crystals distinguishes diverse Plasmodium species. Molecular and Biochemical Parasitology 2003, 130, 91–99. [Google Scholar] [CrossRef]
- Bannister, L.H.; Hopkins, J.M.; Margos, G.; Dluzewski, A.R.; Mitchell, G.H. Three-Dimensional Ultrastructure of the Ring Stage ofPlasmodium falciparum: Evidence for Export Pathways. Microscopy and Microanalysis 2004, 10, 551–562. [Google Scholar] [CrossRef]
- Kansiz, M.; Prater, C.; Dillon, E.; Lo, M.; Anderson, J.; Marcott, C.; Demissie, A.; Chen, Y.; Kunkel, G. Optical Photothermal Infrared Microspectroscopy with Simultaneous Raman – A New Non-Contact Failure Analysis Technique for Identification of <10 μm Organic Contamination in the Hard Drive and other Electronics Industries. Microscopy Today 2020, 28, 26–36. [Google Scholar] [CrossRef] [PubMed]
- Reffner, J. Advances in infrared microspectroscopy and mapping molecular chemical composition at submicrometer spatial resolution. Spectroscopy (Santa Monica) 2018, 33, 12–17. [Google Scholar]
- Mclean, A.; Veettil, T.C.P.; Giergiel, M.; Wood, B.R. Evolution of Vibrational Biospectroscopy: Multimodal techniques and Miniaturisation supported by Machine Learning. Vibrational Spectroscopy 2024, 103708. [Google Scholar] [CrossRef]
- Manley, M. Near-infrared spectroscopy and hyperspectral imaging: non-destructive analysis of biological materials. Chem Soc Rev 2014, 43, 8200–8214. [Google Scholar] [CrossRef]
- Blanco, M.; Villarroya, I. NIR spectroscopy: a rapid-response analytical tool. TrAC Trends in Analytical Chemistry 2002, 21, 240–250. [Google Scholar] [CrossRef]
- Reich, G. Near-infrared spectroscopy and imaging: basic principles and pharmaceutical applications. Adv Drug Deliv Rev 2005, 57, 1109–1143. [Google Scholar] [CrossRef]
- Schwanninger, M.; Rodrigues, J.C.; Fackler, K. A Review of Band Assignments in near Infrared Spectra of Wood and Wood Components. Journal of Near Infrared Spectroscopy 2011, 19, 287–308. [Google Scholar] [CrossRef]
- Huck, C.W.; Ozaki, Y.; Huck-Pezzei, V.A. Critical Review Upon the Role and Potential of Fluorescence and Near-Infrared Imaging and Absorption Spectroscopy in Cancer Related Cells, Serum, Saliva, Urine and Tissue Analysis. Current medicinal chemistry 2016, 23, 3052–3077. [Google Scholar] [CrossRef]
- Manley, M. Near-infrared spectroscopy and hyperspectral imaging: non-destructive analysis of biological materials. Chemical Society Reviews 2014, 43, 8200–8214. [Google Scholar] [CrossRef]
- Reich, G. Near-infrared spectroscopy and imaging: Basic principles and pharmaceutical applications. Advanced Drug Delivery Reviews 2005, 57, 1109–1143. [Google Scholar] [CrossRef]
- Ozaki, Y. Near-infrared spectroscopy--its versatility in analytical chemistry. Anal Sci 2012, 28, 545–563. [Google Scholar] [CrossRef] [PubMed]
- Beć, K.B.; Huck, C.W. Breakthrough Potential in Near-Infrared Spectroscopy: Spectra Simulation. A Review of Recent Developments.
- Beć, K.B.; Grabska, J.; Huck, C.W. The essential role of omni-capable research laboratories in advancing analytical spectroscopy. NIR news 2019, 30, 30–34. [Google Scholar] [CrossRef]
- Sakudo, A. Near-infrared spectroscopy for medical applications: Current status and future perspectives. Clin Chim Acta 2016, 455, 181–188. [Google Scholar] [CrossRef] [PubMed]
- Domján, G.; Kaffka, K.J.; Jákó, J.M.; Vályi-Nagy, I.T. Rapid Analysis of Whole Blood and Blood Serum Using near Infrared Spectroscopy. Journal of Near Infrared Spectroscopy 1994, 2, 67–78. [Google Scholar] [CrossRef]
- Lukianova-Hleb, E.Y.; Lapotko, D.O. Malaria theranostics using hemozoin-generated vapor nanobubbles. Theranostics 2014, 4, 761–769. [Google Scholar] [CrossRef]
- Maia, M.F.; Kapulu, M.; Muthui, M.; Wagah, M.G.; Ferguson, H.M.; Dowell, F.E.; Baldini, F.; Ranford-Cartwright, L. Detection of Plasmodium falciparum infected Anopheles gambiae using near-infrared spectroscopy. Malar J 2019, 18, 85. [Google Scholar] [CrossRef]
- Da, D.F.; McCabe, R.; Some, B.M.; Esperanca, P.M.; Sala, K.A.; Blight, J.; Blagborough, A.M.; Dowell, F.; Yerbanga, S.R.; Lefevre, T.; et al. Detection of Plasmodium falciparum in laboratory-reared and naturally infected wild mosquitoes using near-infrared spectroscopy. Sci Rep 2021, 11, 10289. [Google Scholar] [CrossRef]
- Ong, O.T.W.; Kho, E.A.; Esperança, P.M.; Freebairn, C.; Dowell, F.E.; Devine, G.J.; Churcher, T.S. Ability of near-infrared spectroscopy and chemometrics to predict the age of mosquitoes reared under different conditions. Parasites & Vectors 2020, 13, 160. [Google Scholar] [CrossRef]
- Fernandes, J.N.; Dos Santos, L.M.B.; Chouin-Carneiro, T.; Pavan, M.G.; Garcia, G.A.; David, M.R.; Beier, J.C.; Dowell, F.E.; Maciel-de-Freitas, R.; Sikulu-Lord, M.T. Rapid, noninvasive detection of Zika virus in Aedes aegypti mosquitoes by near-infrared spectroscopy. Sci Adv 2018, 4, eaat0496. [Google Scholar] [CrossRef]
- Garcia, G.A.; Lord, A.R.; Santos, L.M.B.; Kariyawasam, T.N.; David, M.R.; Couto-Lima, D.; Tátila-Ferreira, A.; Pavan, M.G.; Sikulu-Lord, M.T.; Maciel-de-Freitas, R. Rapid and Non-Invasive Detection of Aedes aegypti Co-Infected with Zika and Dengue Viruses Using Near Infrared Spectroscopy. Viruses 2022, 15. [Google Scholar] [CrossRef]
- Some, B.M.; Da, D.F.; McCabe, R.; Djegbe, N.D.C.; Pare, L.I.G.; Werme, K.; Mouline, K.; Lefevre, T.; Ouedraogo, A.G.; Churcher, T.S.; et al. Adapting field-mosquito collection techniques in a perspective of near-infrared spectroscopy implementation. Parasit Vectors 2022, 15, 338. [Google Scholar] [CrossRef] [PubMed]
- Lambert, B.; Sikulu-Lord, M.T.; Mayagaya, V.S.; Devine, G.; Dowell, F.; Churcher, T.S. Monitoring the Age of Mosquito Populations Using Near-Infrared Spectroscopy. Sci Rep 2018, 8, 5274. [Google Scholar] [CrossRef] [PubMed]
- Santos, M.C.D.; Viana, J.L.S.; Monteiro, J.D.; Freire, R.C.M.; Freitas, D.L.D.; Câmara, I.M.; da Silva, G.J.S.; Gama, R.A.; Araújo, J.M.G.; Lima, K.M.G. Infrared spectroscopy (NIRS and ATR-FTIR) together with multivariate classification for non-destructive differentiation between female mosquitoes of Aedes aegypti recently infected with dengue vs. uninfected females. Acta Tropica 2022, 235, 106633. [Google Scholar] [CrossRef] [PubMed]
- Sikulu-Lord, M.T.; Edstein, M.D.; Goh, B.; Lord, A.R.; Travis, J.A.; Dowell, F.E.; Birrell, G.W.; Chavchich, M. Rapid and non-invasive detection of malaria parasites using near-infrared spectroscopy and machine learning. PLoS One 2024, 19, e0289232. [Google Scholar] [CrossRef]
- Adegoke, J.A.; De Paoli, A.; Afara, I.O.; Kochan, K.; Creek, D.J.; Heraud, P.; Wood, B.R. Ultraviolet/Visible and Near-Infrared Dual Spectroscopic Method for Detection and Quantification of Low-Level Malaria Parasitemia in Whole Blood. Anal Chem 2021, 93, 13302–13310. [Google Scholar] [CrossRef]
- Briehl, R.W.; Hobbs, J.F. Ultraviolet Difference Spectra in Human Hemoglobin: I. DIFFERENCE SPECTRA IN HEMOGLOBIN A AND THEIR RELATION TO THE FUNCTION OF HEMOGLOBIN. Journal of Biological Chemistry 1970, 245, 544–554. [Google Scholar] [CrossRef]
- Briehl, R.W.; Ranney, H.M. Ultraviolet Difference Spectra in Human Hemoglobin: II. DIFFERENCE SPECTRA IN ISOLATED SUBUNITS OF HEMOGLOBIN. Journal of Biological Chemistry 1970, 245, 555–558. [Google Scholar] [CrossRef]
- Serebrennikova, Y.M.; Patel, J.; Garcia-Rubio, L.H. Interpretation of the ultraviolet-visible spectra of malaria parasite Plasmodium falciparum. Appl. Opt. 2010, 49, 180–188. [Google Scholar] [CrossRef]
- Frosch, T.; Koncarevic, S.; Becker, K.; Popp, J. Morphology-sensitive Raman modes of the malaria pigment hemozoin. Analyst 2009, 134, 1126–1132. [Google Scholar] [CrossRef]
- Queral-Beltran, A.; Marín-García, M.; Lacorte, S.; Tauler, R. Multivariate curve resolution of incomplete and partly trilinear multiblock datasets. Chemometrics and Intelligent Laboratory Systems 2024, 247, 105081. [Google Scholar] [CrossRef]
- Scepanovic, O.R.; Volynskaya, Z.; Kong, C.R.; Galindo, L.H.; Dasari, R.R.; Feld, M.S. A multimodal spectroscopy system for real-time disease diagnosis. Rev Sci Instrum 2009, 80, 043103. [Google Scholar] [CrossRef] [PubMed]
- Szymoński, K.; Chmura, Ł.; Lipiec, E.; Adamek, D. Vibrational spectroscopy - are we close to finding a solution for early pancreatic cancer diagnosis? World J Gastroenterol 2023, 29, 96–109. [Google Scholar] [CrossRef] [PubMed]
- Gardiner, D.J., Graves, P.R., Eds.Sensitivity of photoacoustic microscopy. [CrossRef]
- Memeu, D.M.; Sallorey, A.M.; Maina, C.; Kinyua, D.M. Review of Photoacoustic Malaria Diagnostic Techniques. Open Journal of Clinical Diagnostics 2021, 11, 59–75. [Google Scholar] [CrossRef]
- Samson, E.B.; Goldschmidt, B.S.; Whiteside, P.J.; Sudduth, A.S.; Custer, J.R.; Beerntsen, B.; Viator, J.A. Photoacoustic spectroscopy of β-hematin. J Opt 2012, 14. [Google Scholar] [CrossRef]
- Menyaev, Y.A.; Carey, K.A.; Nedosekin, D.A.; Sarimollaoglu, M.; Galanzha, E.I.; Stumhofer, J.S.; Zharov, V.P. Preclinical photoacoustic models: application for ultrasensitive single cell malaria diagnosis in large vein and artery. Biomed Opt Express 2016, 7, 3643–3658. [Google Scholar] [CrossRef]
- Cai, C.; Carey, K.A.; Nedosekin, D.A.; Menyaev, Y.A.; Sarimollaoglu, M.; Galanzha, E.I.; Stumhofer, J.S.; Zharov, V.P. In vivo photoacoustic flow cytometry for early malaria diagnosis. Cytometry A 2016, 89, 531–542. [Google Scholar] [CrossRef]
- Lukianova-Hleb, E.; Bezek, S.; Szigeti, R.; Khodarev, A.; Kelley, T.; Hurrell, A.; Berba, M.; Kumar, N.; D'Alessandro, U.; Lapotko, D. Transdermal Diagnosis of Malaria Using Vapor Nanobubbles. Emerg Infect Dis 2015, 21, 1122–1127. [Google Scholar] [CrossRef]
- Dean-Ben, X.L.; Gottschalk, S.; Mc Larney, B.; Shoham, S.; Razansky, D. Advanced optoacoustic methods for multiscale imaging of in vivo dynamics. Chem Soc Rev 2017, 46, 2158–2198. [Google Scholar] [CrossRef]
- Veverka, M.; Menozzi, L.; Yao, J. The sound of blood: photoacoustic imaging in blood analysis. Med Nov Technol Devices 2023, 18. [Google Scholar] [CrossRef]
- Hu, S.; Wang, V. , Lihong. Optical-Resolution Photoacoustic Microscopy: Auscultation of Biological Systems at the Cellular Level. Biophysical Journal 2013, 105, 841–847. [Google Scholar] [CrossRef]
- Park, S.; Lee, C.; Kim, J.; Kim, C. Acoustic resolution photoacoustic microscopy. Biomedical Engineering Letters 2014, 4, 213–222. [Google Scholar] [CrossRef]
- Zhou, Y.; Yao, J.; Wang, L.V. Tutorial on photoacoustic tomography. Journal of Biomedical Optics 2016, 21, 061007. [Google Scholar] [CrossRef] [PubMed]
- Periyasamy, V.; Das, N.; Sharma, A.; Pramanik, M. 1064 nm acoustic resolution photoacoustic microscopy. Journal of Biophotonics 2019, 12, e201800357. [Google Scholar] [CrossRef]
- Tian, C.; Zhang, C.; Zhang, H.; Xie, D.; Jin, Y. Spatial resolution in photoacoustic computed tomography. Reports on Progress in Physics 2021, 84, 036701. [Google Scholar] [CrossRef]
- Moothanchery, M.; Bi, R.; Kim, J.Y.; Jeon, S.; Kim, C.; Olivo, M. Optical resolution photoacoustic microscopy based on multimode fibers. Biomedical Optics Express 2018, 9, 1190. [Google Scholar] [CrossRef]
- Liu, W.; Yao, J. Photoacoustic microscopy: principles and biomedical applications. Biomedical Engineering Letters 2018, 8, 203–213. [Google Scholar] [CrossRef]
- Pleitez, M.A.; Khan, A.A.; Soldà, A.; Chmyrov, A.; Reber, J.; Gasparin, F.; Seeger, M.R.; Schätz, B.; Herzig, S.; Scheideler, M.; et al. Label-free metabolic imaging by mid-infrared optoacoustic microscopy in living cells. Nat Biotechnol 2020, 38, 293–296. [Google Scholar] [CrossRef]
- Perez-Guaita, D.; Kochan, K.; Batty, M.; Doerig, C.; Garcia-Bustos, J.; Espinoza, S.; McNaughton, D.; Heraud, P.; Wood, B.R. Multispectral Atomic Force Microscopy-Infrared Nano-Imaging of Malaria Infected Red Blood Cells. Analytical Chemistry 2018, 90, 3140–3148. [Google Scholar] [CrossRef]
- Wood, B.R.; Bailo, E.; Khiavi, M.A.; Tilley, L.; Deed, S.; Deckert-Gaudig, T.; McNaughton, D.; Deckert, V. Tip-Enhanced Raman Scattering (TERS) from Hemozoin Crystals within a Sectioned Erythrocyte. Nano Letters 2011, 11, 1868–1873. [Google Scholar] [CrossRef]
- Berna, A.Z.; Wang, X.R.; Bollinger, L.B.; Banda, J.; Mawindo, P.; Evanoff, T.; Culbertson, D.L.; Seydel, K.; John, A.R.O. Breath Biomarkers of Pediatric Malaria: Reproducibility and Response to Antimalarial Therapy. Journal of Infectious Diseases 2024. [Google Scholar] [CrossRef]
- Schaber, C.L.; Katta, N.; Bollinger, L.B.; Mwale, M.; Mlotha-Mitole, R.; Trehan, I.; Raman, B.; John, A.R.O. Breathprinting Reveals Malaria-Associated Biomarkers and Mosquito Attractants. Journal of Infectious Diseases 2018, 217, 1553–1560. [Google Scholar] [CrossRef] [PubMed]
- Chai, H.C.; Chua, K.H. Urine and Saliva: Relevant Specimens for Malaria Diagnosis? Diagnostics 2022, 12. [Google Scholar] [CrossRef] [PubMed]
- Wood, B.R.; Kochan, K.; Bedolla, D.E.; Salazar-Quiroz, N.; Grimley, S.L.; Perez-Guaita, D.; Baker, M.J.; Vongsvivut, J.; Tobin, M.J.; Bambery, K.R.; et al. Infrared Based Saliva Screening Test for COVID-19. Angewandte Chemie International Edition 2021, 60, 17102–17107. [Google Scholar] [CrossRef] [PubMed]
- Martin, M.; Wongwattanakul, M.; Khemtonglang, N.; Kiatchoosakun, P.; Heraud, P.; Jearanaikoon, P.; Wood, B.R. Identification of Glucose-6 Phosphate Dehydrogenase Deficient Patients Using Attenuated Total Reflection Fourier Transform Infrared Spectroscopy Using Partial Least Squares Discriminant Analysis in Aqueous Blood Samples. Appl Spectrosc 2023, 77, 513–520. [Google Scholar] [CrossRef] [PubMed]
- Perez-Guaita, D.; Marzec, K.M.; Hudson, A.; Evans, C.; Chernenko, T.; Matthäus, C.; Miljkovic, M.; Diem, M.; Heraud, P.; Richards, J.S.; et al. Parasites under the Spotlight: Applications of Vibrational Spectroscopy to Malaria Research. Chem Rev 2018, 118, 5330–5358. [Google Scholar] [CrossRef]
- Egan, T.J. Interactions of quinoline antimalarials with hematin in solution. J Inorg Biochem 2006, 100, 916–926. [Google Scholar] [CrossRef]
- Frosch, T.; Küstner, B.; Schlücker, S.; Szeghalmi, A.; Schmitt, M.; Kiefer, W.; Popp, J. In vitro polarization-resolved resonance Raman studies of the interaction of hematin with the antimalarial drug chloroquine. Journal of Raman Spectroscopy 2004, 35, 819–821. [Google Scholar] [CrossRef]
- Frosch, T.; Schmitt, M.; Bringmann, G.; Kiefer, W.; Popp, J. Structural Analysis of the Anti-Malaria Active Agent Chloroquine under Physiological Conditions. The Journal of Physical Chemistry B 2007, 111, 1815–1822. [Google Scholar] [CrossRef]
- Frosch, T.; Popp, J. Structural analysis of the antimalarial drug halofantrine by means of Raman spectroscopy and density functional theory calculations. J Biomed Opt 2010, 15, 041516. [Google Scholar] [CrossRef]
- Frosch, T.; Schmitt, M.; Schenzel, K.; Faber, J.H.; Bringmann, G.; Kiefer, W.; Popp, J. In vivo localization and identification of the antiplasmodial alkaloid dioncophylline A in the tropical liana Triphyophyllum peltatum by a combination of fluorescence, near infrared Fourier transform Raman microscopy, and density functional theory calculations. Biopolymers 2006, 82, 295–300. [Google Scholar] [CrossRef]
- Frosch, T.; Schmitt, M.; Noll, T.; Bringmann, G.; Schenzel, K.; Popp, J. Ultrasensitive in situ Tracing of the Alkaloid Dioncophylline A in the Tropical Liana Triphyophyllum peltatum by Applying Deep-UV Resonance Raman Microscopy. Analytical Chemistry 2007, 79, 986–993. [Google Scholar] [CrossRef] [PubMed]
- Frosch, T.; Schmitt, M.; Popp, J. Raman spectroscopic investigation of the antimalarial agent mefloquine. Anal Bioanal Chem 2007, 387, 1749–1757. [Google Scholar] [CrossRef] [PubMed]
- Kozicki, M.; Creek, D.J.; Sexton, A.; Morahan, B.J.; Wesełucha-Birczyńska, A.; Wood, B.R. An attenuated total reflection (ATR) and Raman spectroscopic investigation into the effects of chloroquine on Plasmodium falciparum-infected red blood cells. Analyst 2015, 140, 2236–2246. [Google Scholar] [CrossRef] [PubMed]
- Wolf, S.; Domes, R.; Domes, C.; Frosch, T. Spectrally Resolved and Highly Parallelized Raman Difference Spectroscopy for the Analysis of Drug–Target Interactions between the Antimalarial Drug Chloroquine and Hematin. Analytical Chemistry 2024, 96, 3345–3353. [Google Scholar] [CrossRef]
Figure 1.
Asexual and sexual phases of the malaria parasite in RBC. After sporozoites enter the bloodstream, they travel to the liver, where they invade hepatocytes and develop into schizonts, each containing thousands of merozoites. These merozoites are then released and invade erythrocytes, initiating the intraerythrocytic asexual phase. During this phase, the parasites grow and divide within the food vacuole, progressing through three distinct morphological stages: ring, trophozoite, and schizont. When schizonts rupture, they release merozoites, continuing the erythrocytic cycle. Some merozoites, instead of replicating, differentiate into male and female gametocytes capable of transmission to mosquitoes. The digestion of hemoglobin by the parasite leads to the accumulation of Hz. In the circulation, only ring-stage parasites and late-stage gametocytes are observed. Reproduced with permission from the Royal Society of Chemistry. [7]
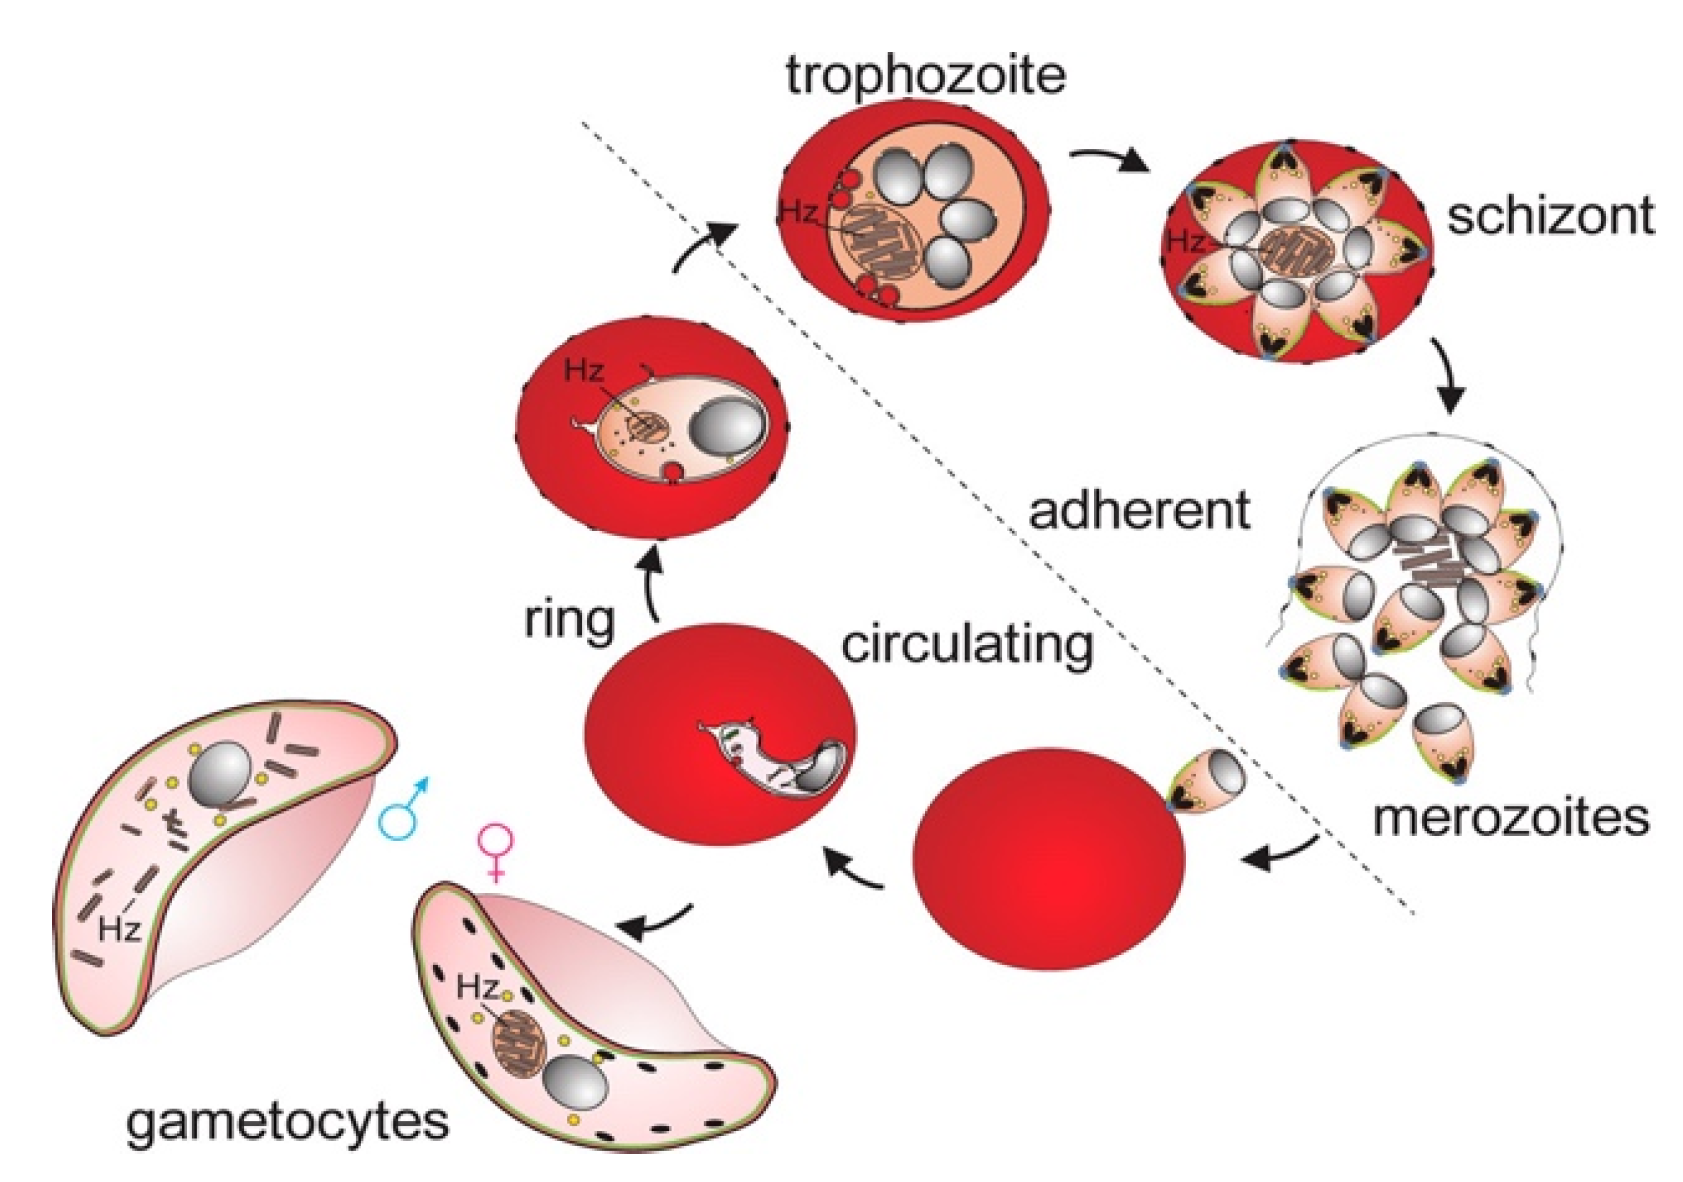
Figure 2.
Hematin and β-hematin structure. (A) Schematic representation of hematin, the monomeric precursor of β-hematin. (B) Structure and packing arrangement of β-hematin (synthetic malaria pigment) viewed along the c-axis. Some (h,k,l) planes are indicated. Reprinted with permission from the American Chemical Society. [19]
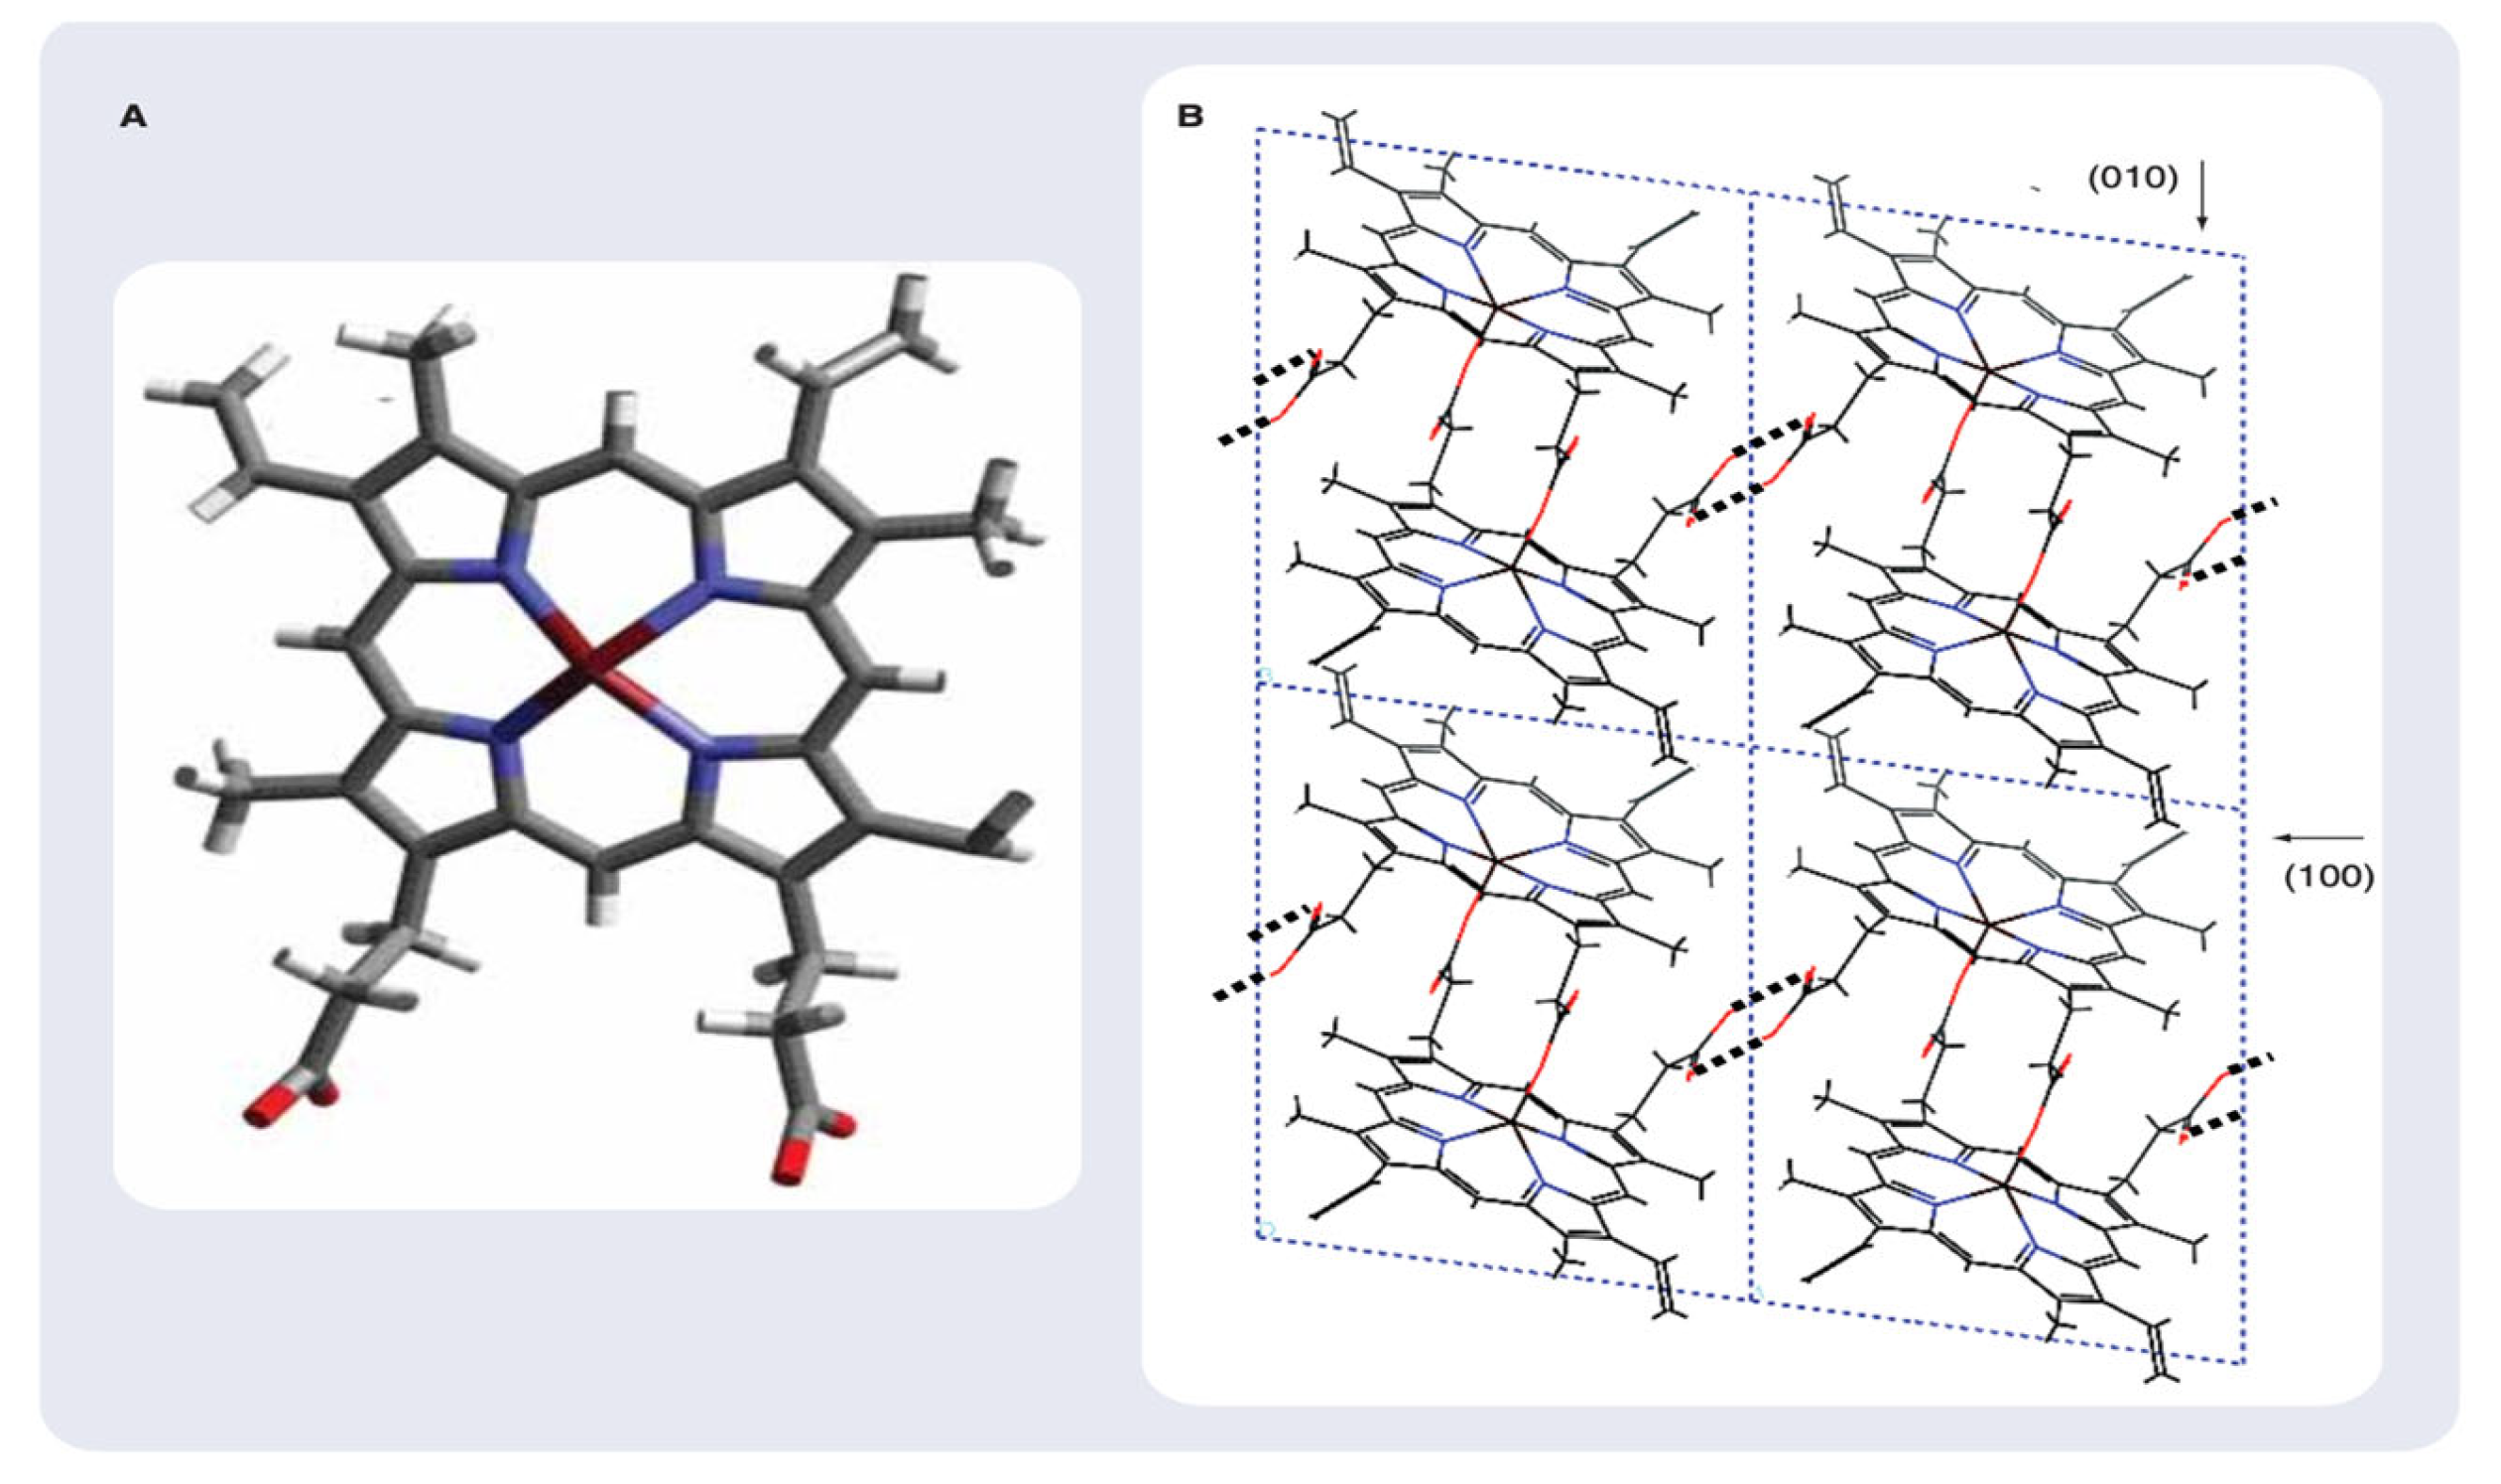
Figure 3.
Raman excitation wavelength measurements recorded of β-hematin. The asterisks highlight the bands enhanced relative to the other excitation wavelengths at 830 nm. Reproduced with permission from the American Chemical Society. [20]
Figure 3.
Raman excitation wavelength measurements recorded of β-hematin. The asterisks highlight the bands enhanced relative to the other excitation wavelengths at 830 nm. Reproduced with permission from the American Chemical Society. [20]
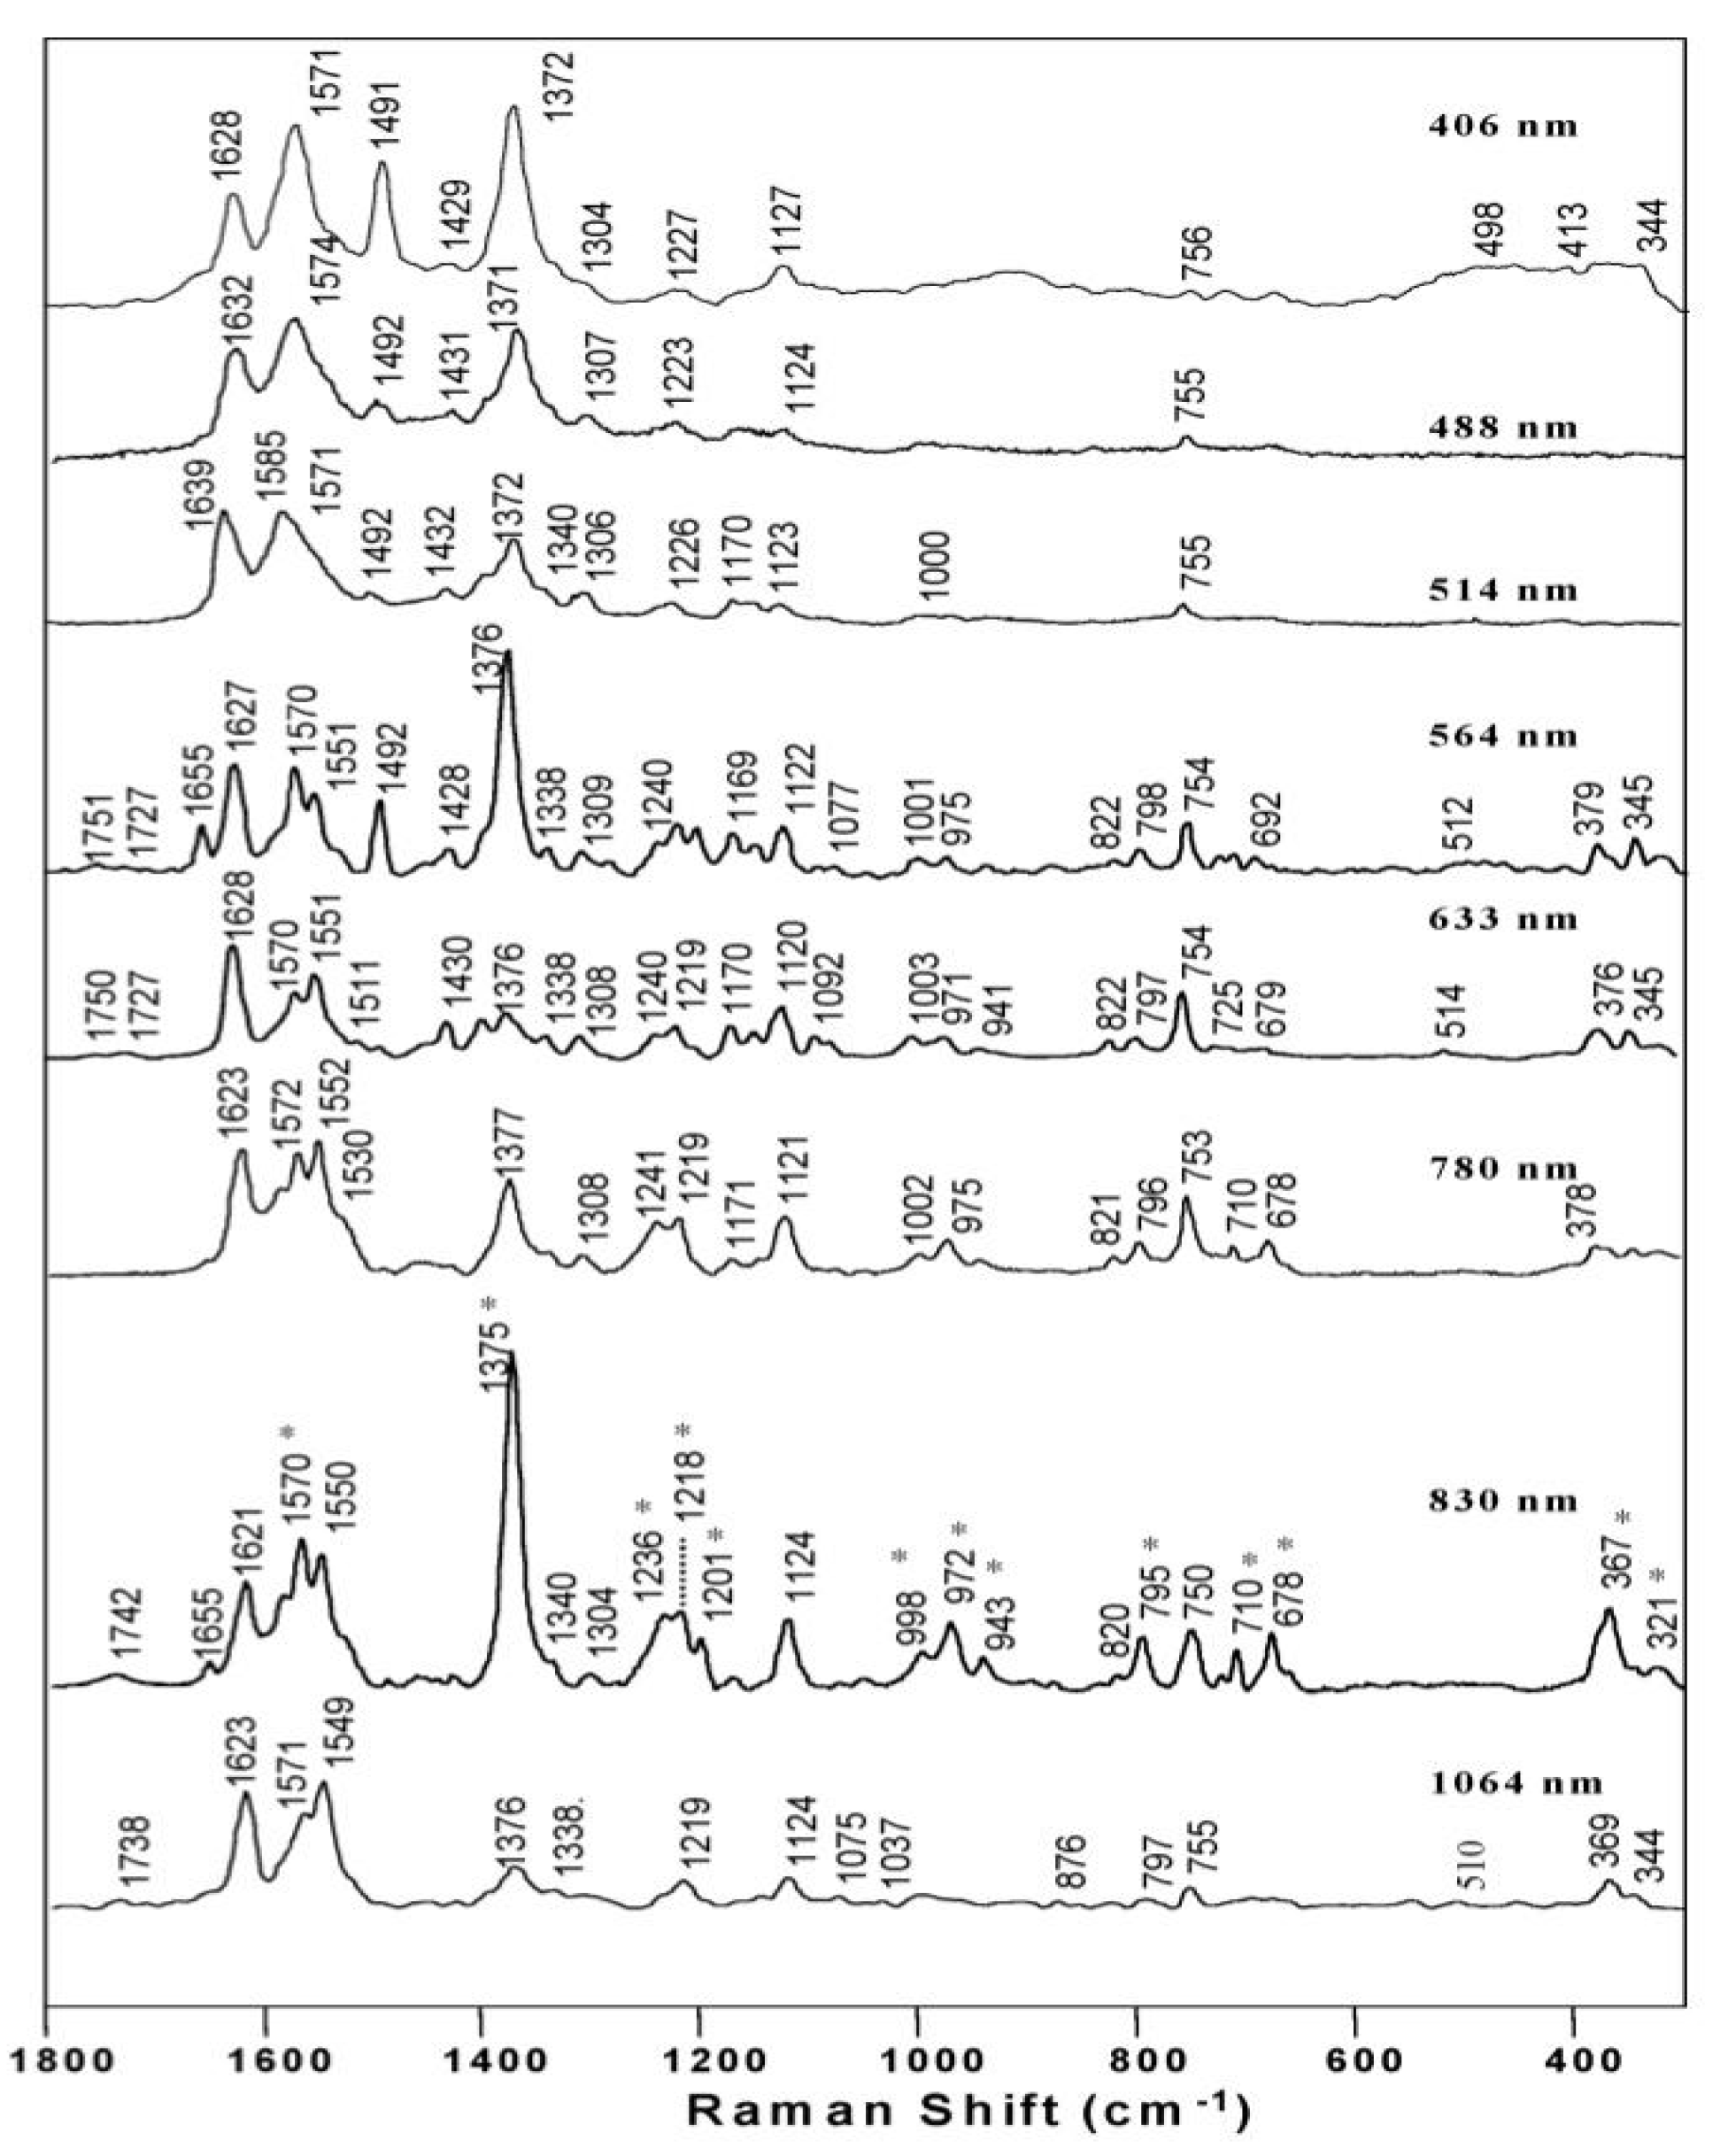
Figure 4.
FTIR spectrum of β-hematin. B. FTIR spectrum of hemozoin extracted from malaria trophozoites. Reproduced with permission from the American Chemical Society. [20].
Figure 4.
FTIR spectrum of β-hematin. B. FTIR spectrum of hemozoin extracted from malaria trophozoites. Reproduced with permission from the American Chemical Society. [20].
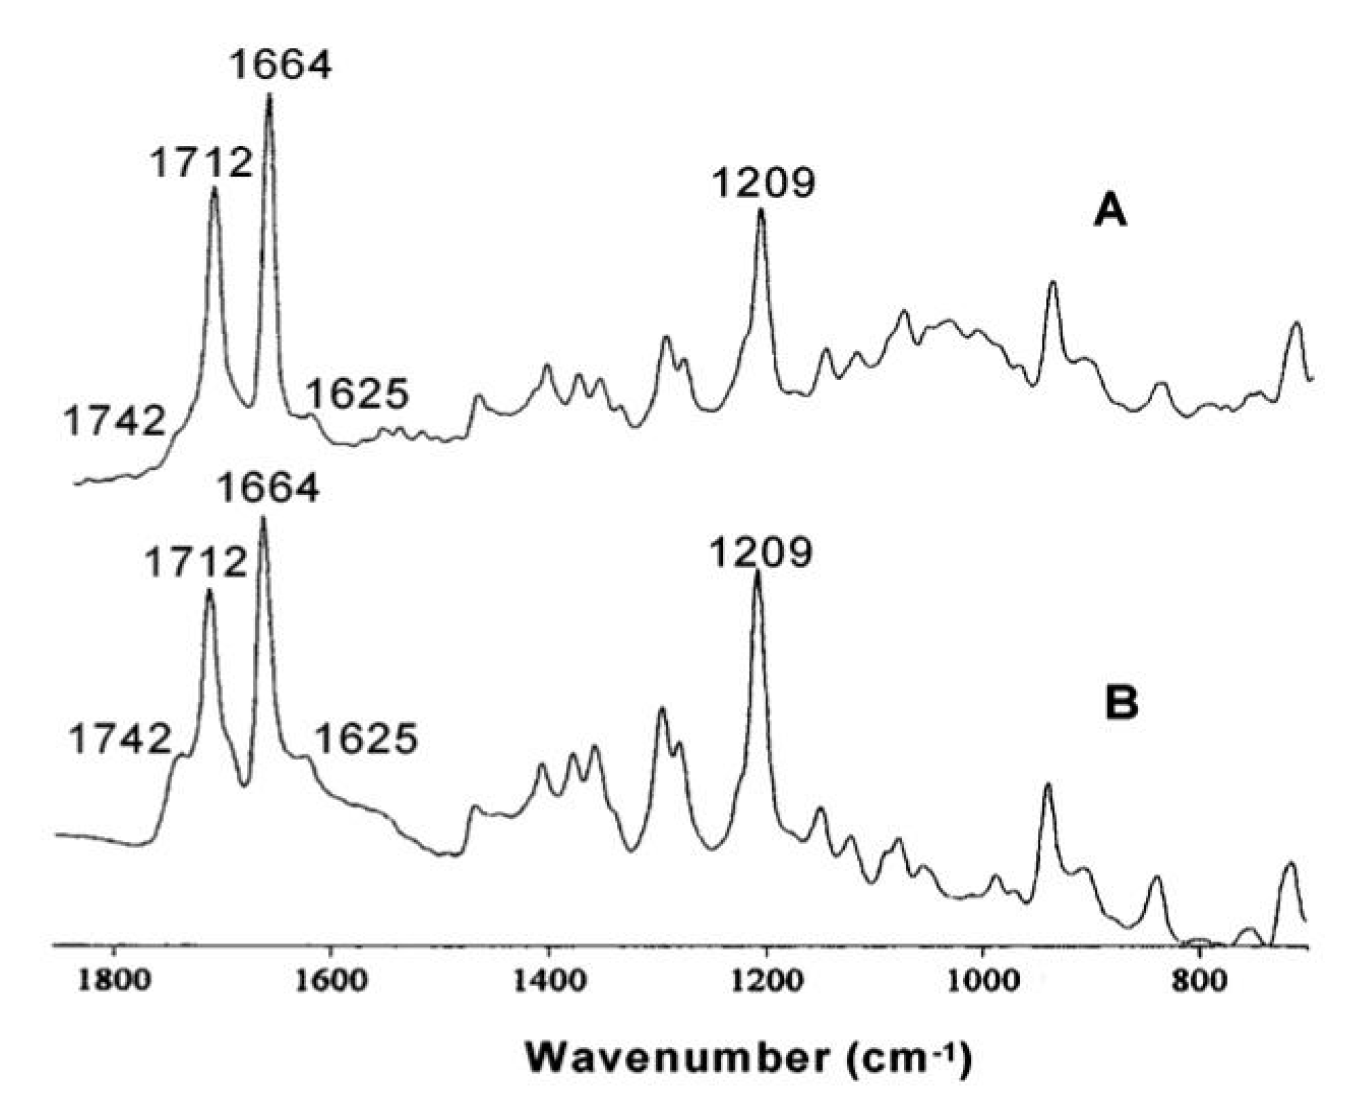
Figure 5.
Absorbance spectra recorded during the acidification of hemin to form β-hematin. Reproduced with permission from the American Chemical Society. [20].
Figure 5.
Absorbance spectra recorded during the acidification of hemin to form β-hematin. Reproduced with permission from the American Chemical Society. [20].
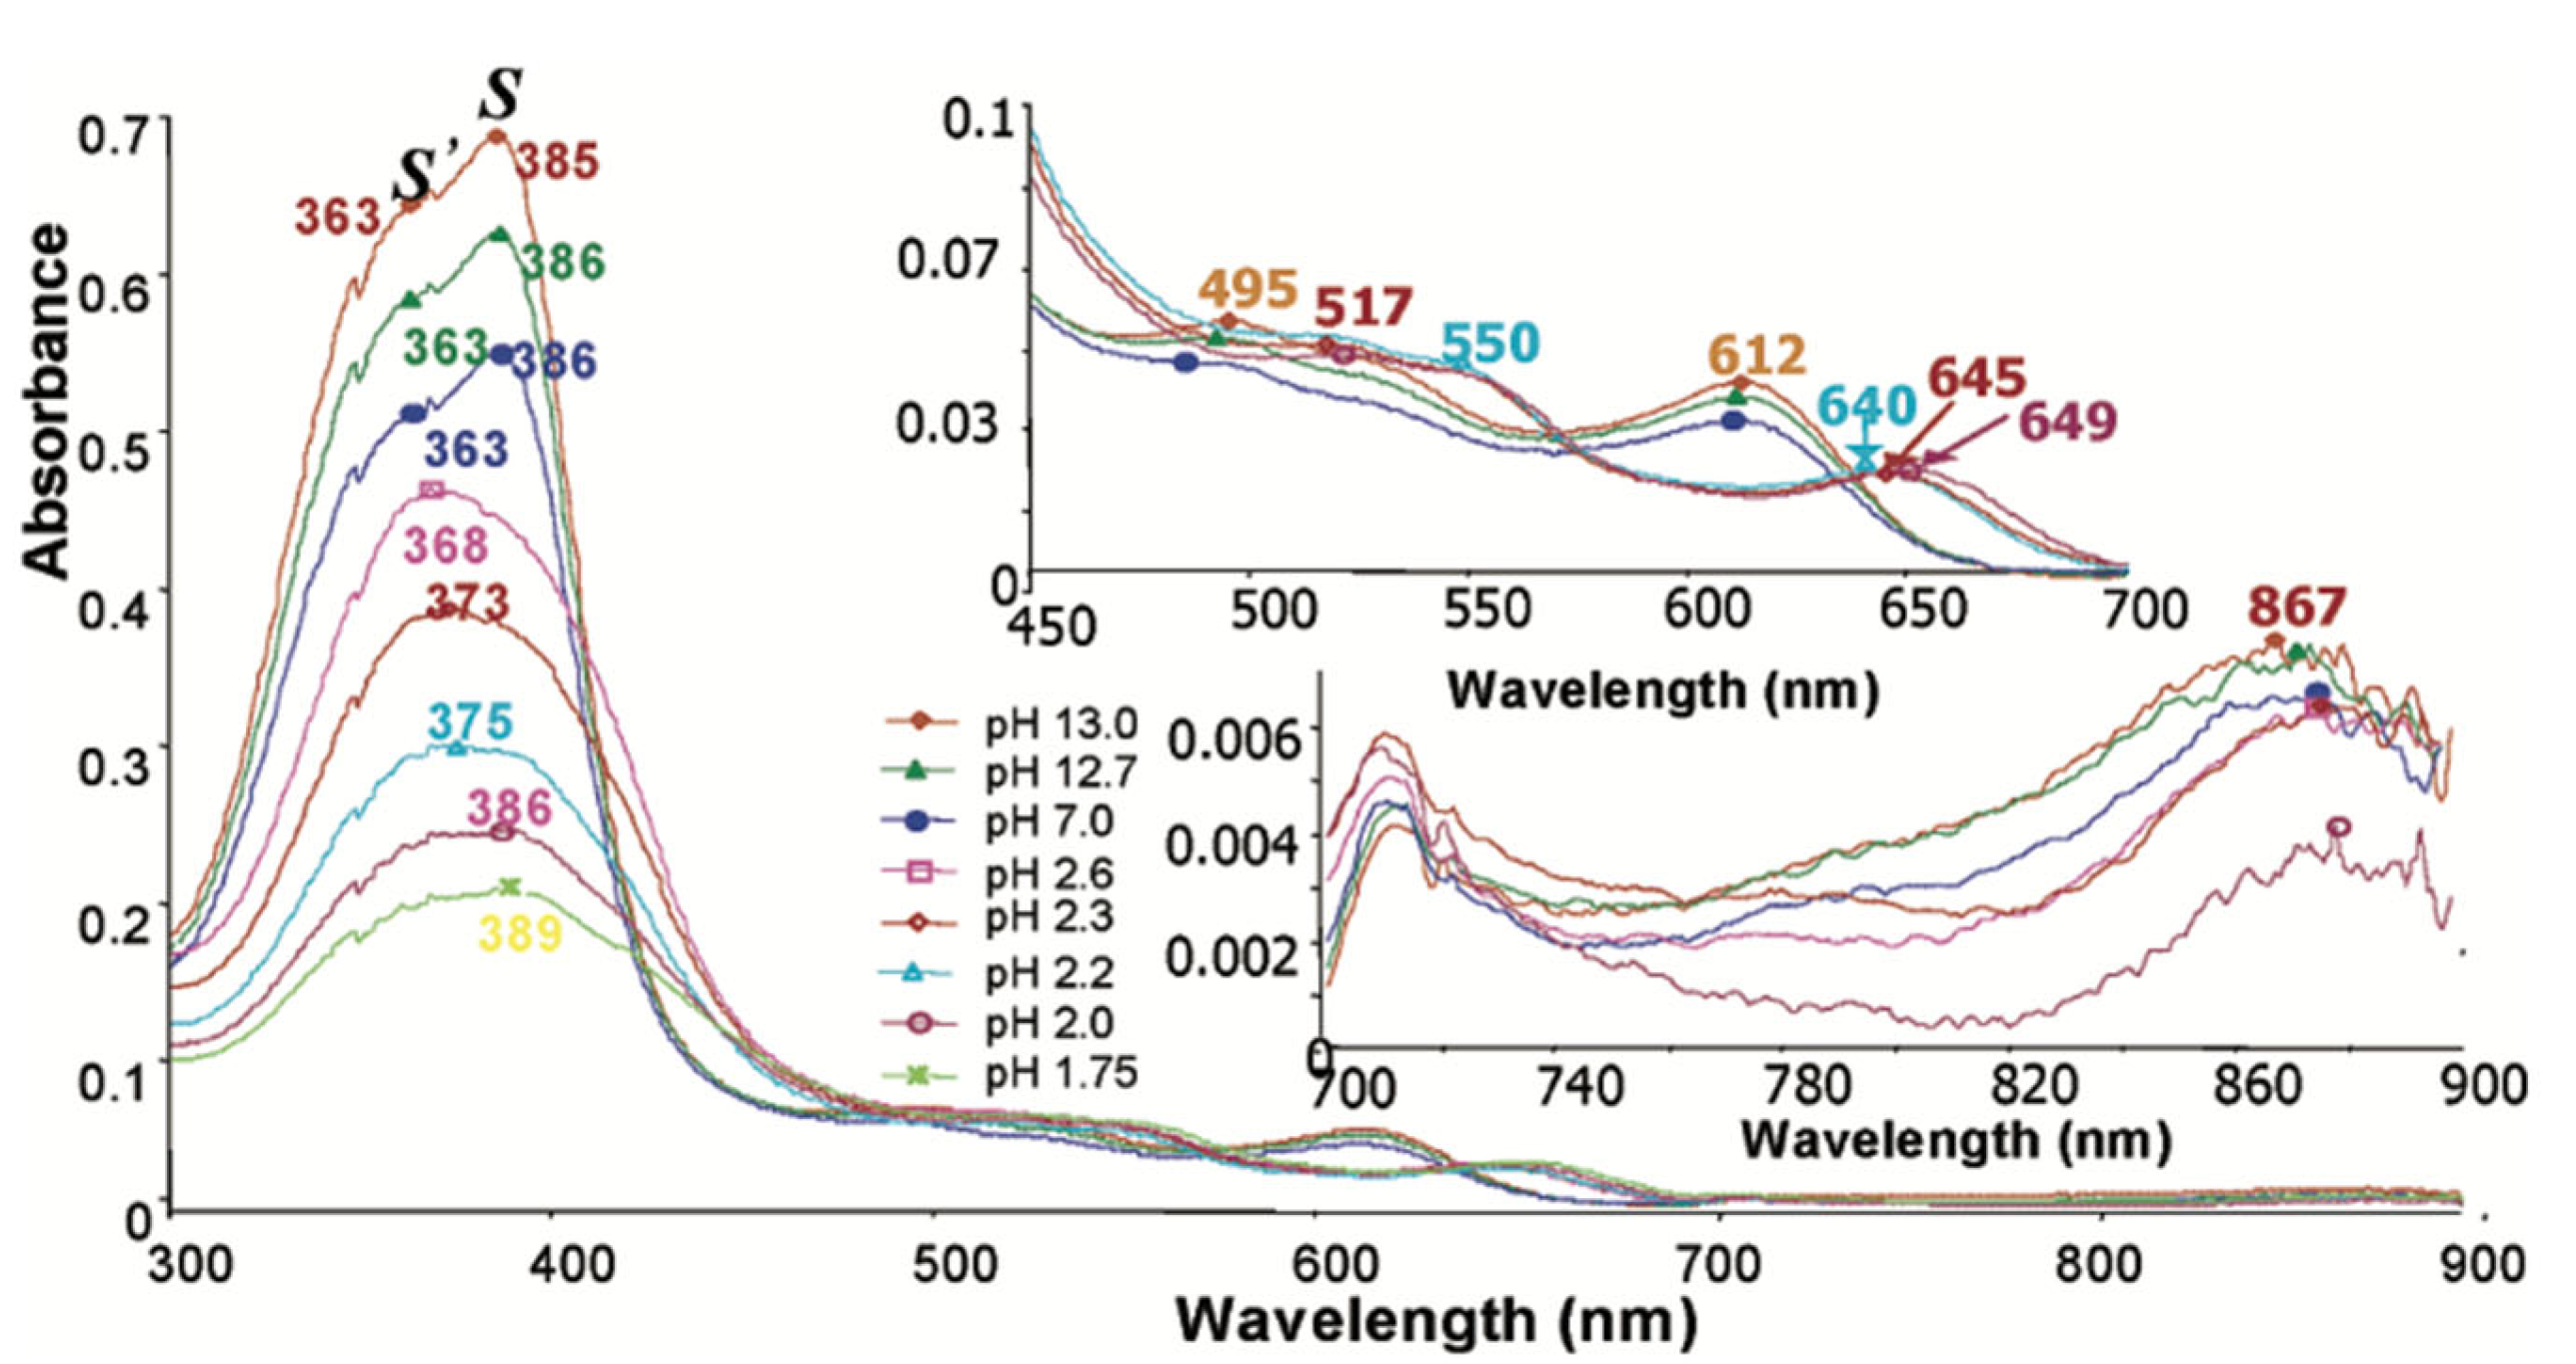
Figure 6.
Representative second derivative spectra, a) β-hematin, b) dry hemozoin isolated from infected red blood cells, c) dry crystalline hemozoin purchased from Invivogen. Reproduced with permission from the American Chemical Society. [5].
Figure 6.
Representative second derivative spectra, a) β-hematin, b) dry hemozoin isolated from infected red blood cells, c) dry crystalline hemozoin purchased from Invivogen. Reproduced with permission from the American Chemical Society. [5].
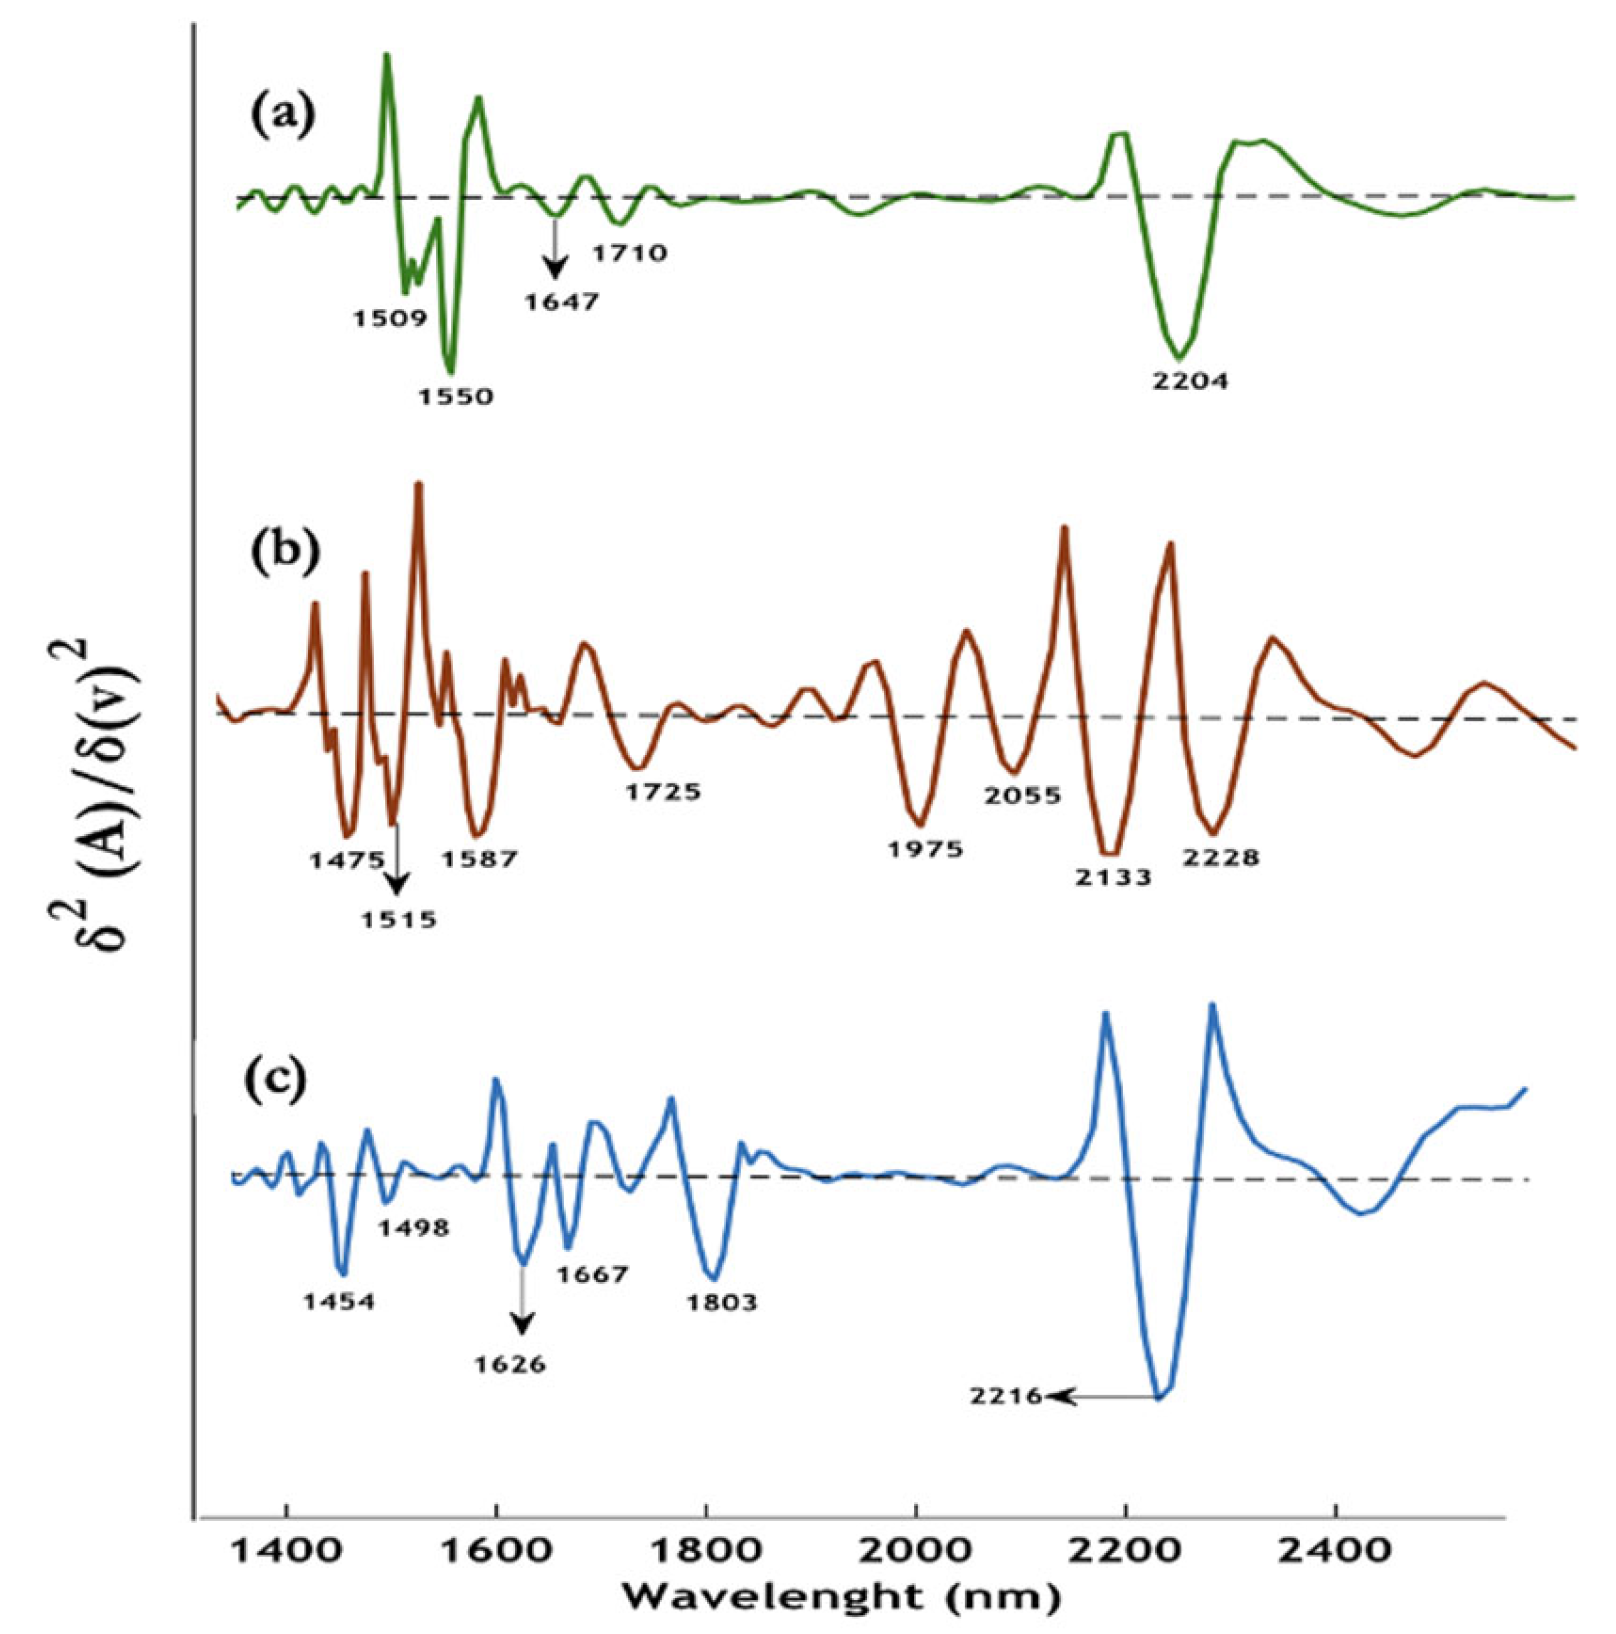
Figure 7.
FTIR averaged normalized spectra of the C-H stretching region and fingerprint region from the Australian Synchrotron of RBCs (control) and the three stages of the parasitic life cycle (ring, trophozoite, and schizont) within a fixed RBC. Standard deviation spectra are shown below each spectrum for both spectral regions. Reproduced with permission from the American Chemical Society. [31].
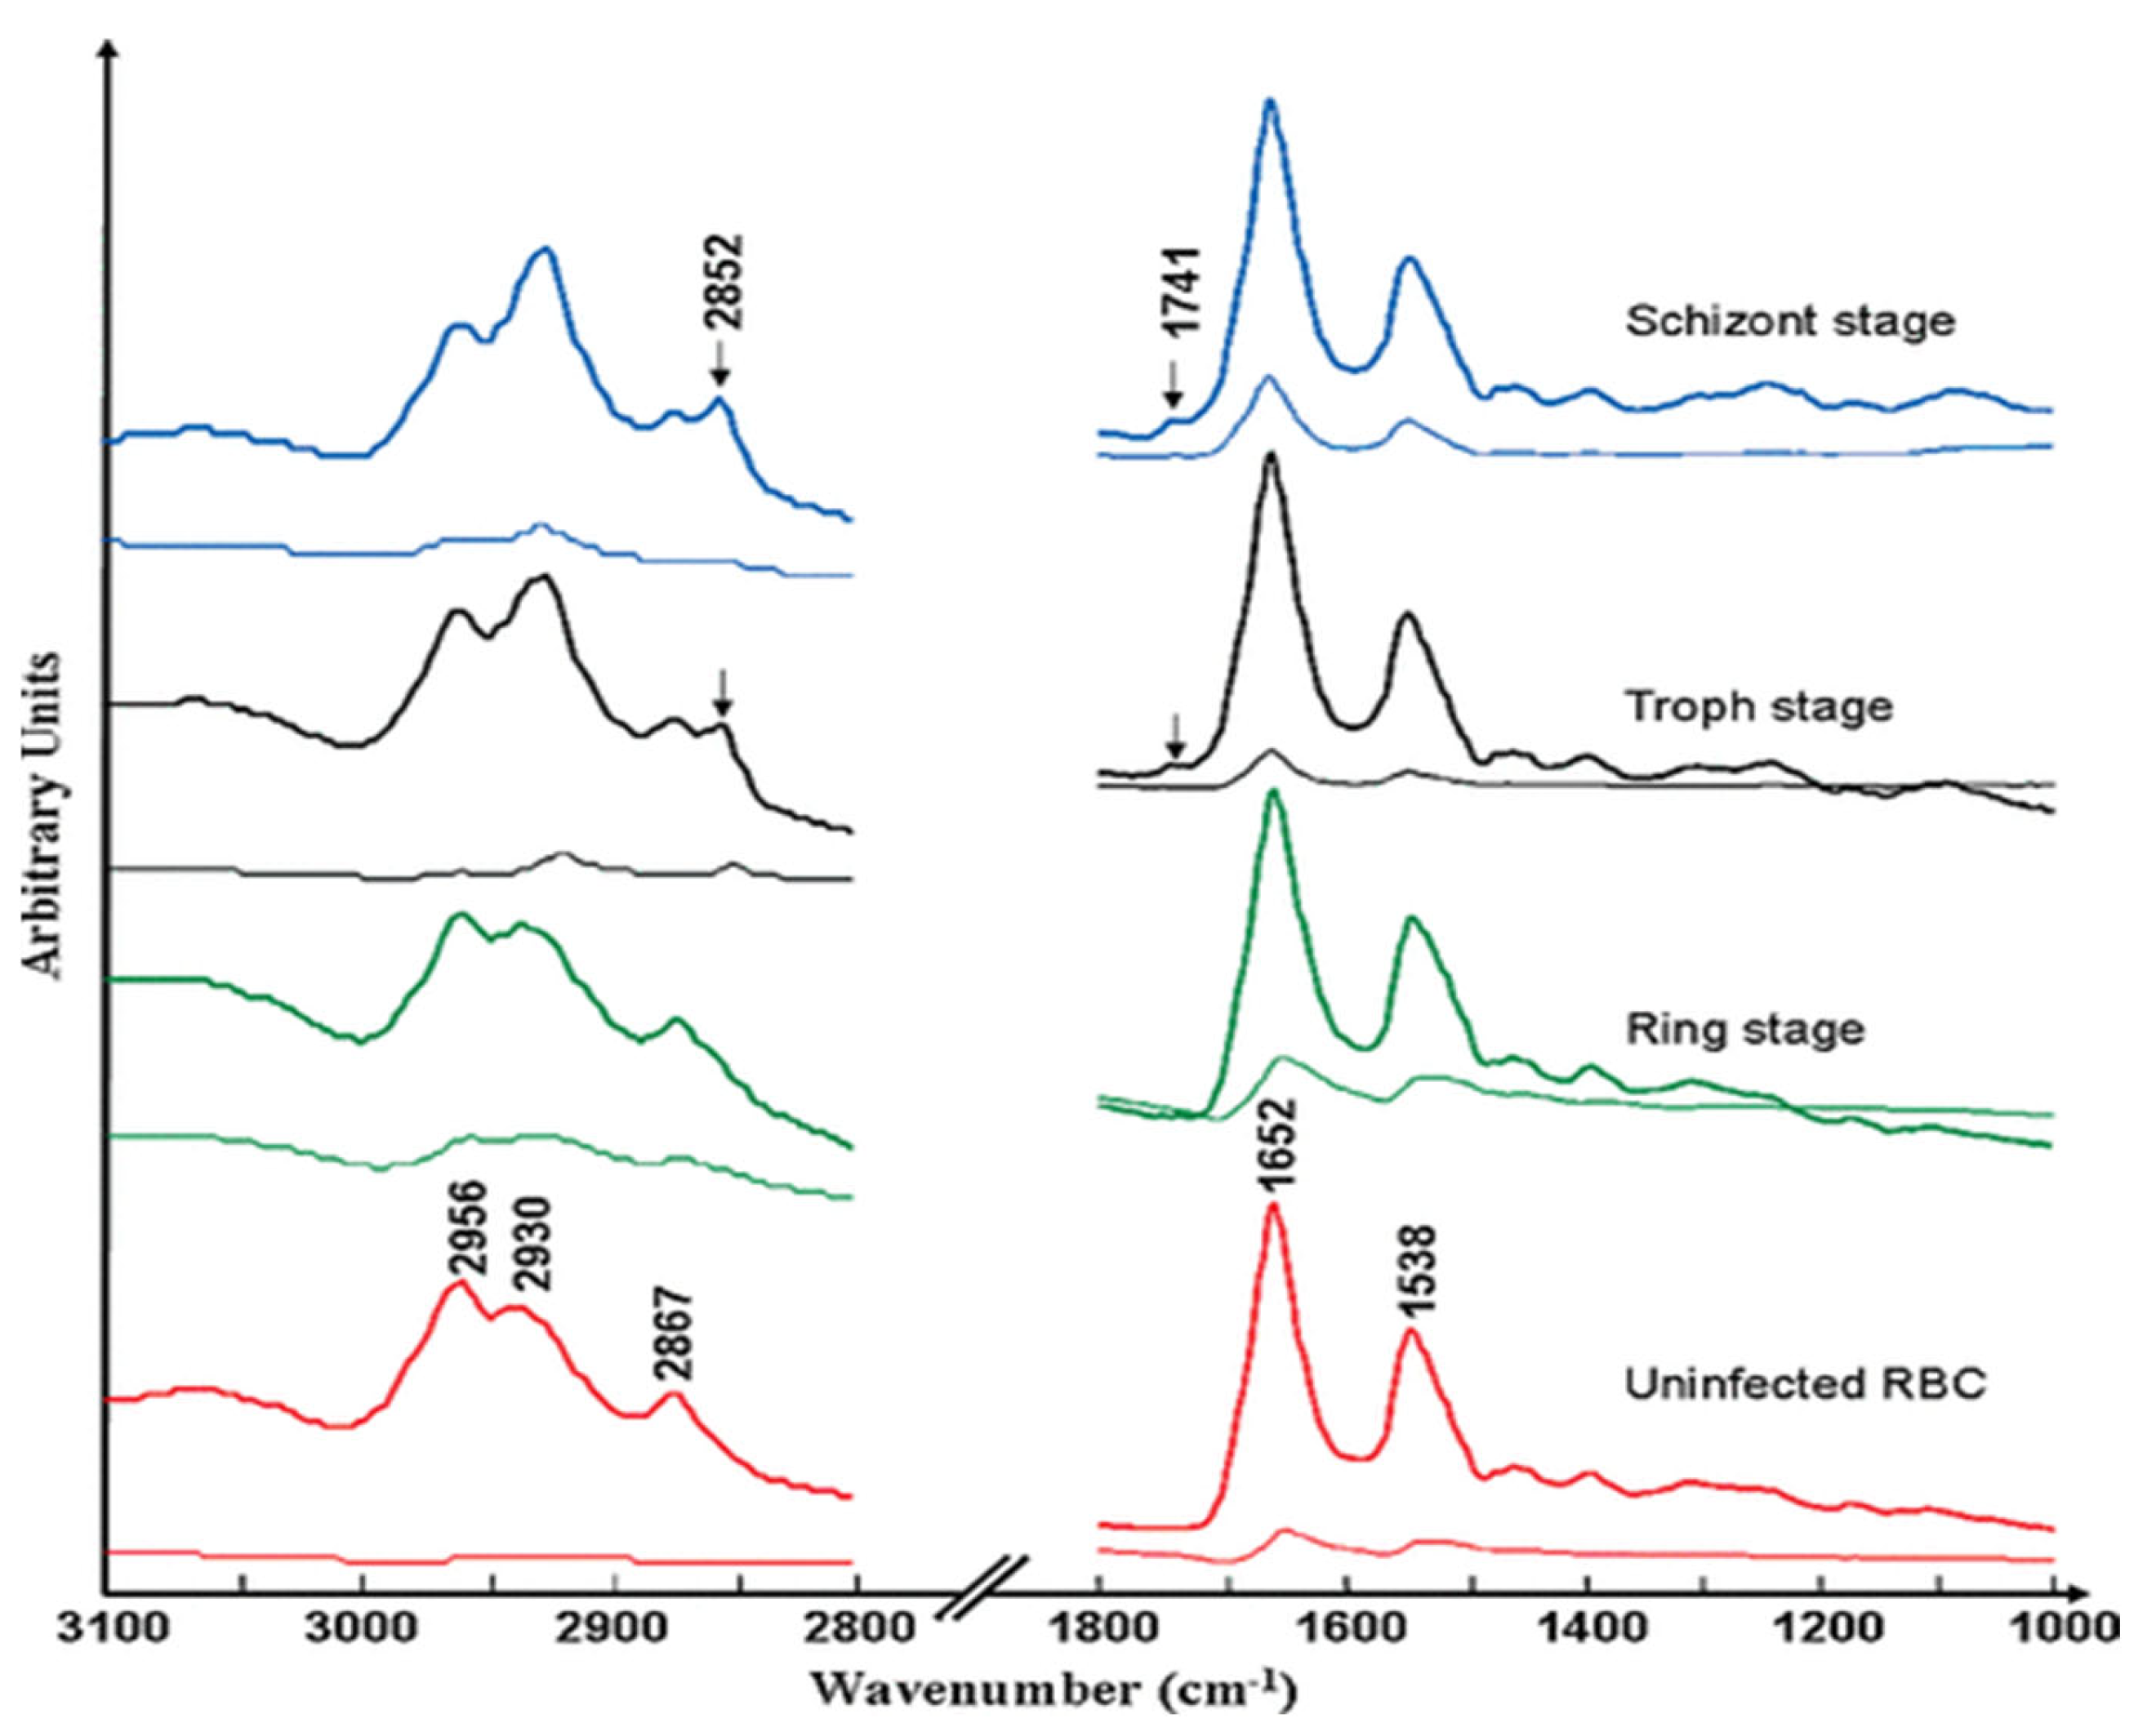
Figure 8.
(A) Visible image of the thick film of malaria infected RBCs. (B) Partial dark-field effect visible micrograph highlighting the trophozoites. (C) Chemical map of the area outlined by the red square (ROI) in (B), generated by integrating the region between 1680 and 1620 cm−1, with lighter colors indicating hemozoin deposits within the trophozoites. (D) UHCA of ROI using D-values algorithm in the range of 1700-1300 cm-1 revealing two clusters: Blue cluster- hemozoin and red cluster-hemoglobin. (E) UHCA of ROI showing five clusters where the pink cluster spectrum is like hemozoin in the late-stage trophozoites, while green and grey clusters represent a mix of haemoglobin and hemozoin. The light blue cluster corresponds well with the haemoglobin present within RBCs along with red cluster present as submicron dots (300 nm) corresponding to the hemozoin throughout the stages of P. falciparum life cycle. (F) Mean spectra corresponding to each cluster shown in (E). Reproduced with permission from the Royal Society of Chemistry. [68].
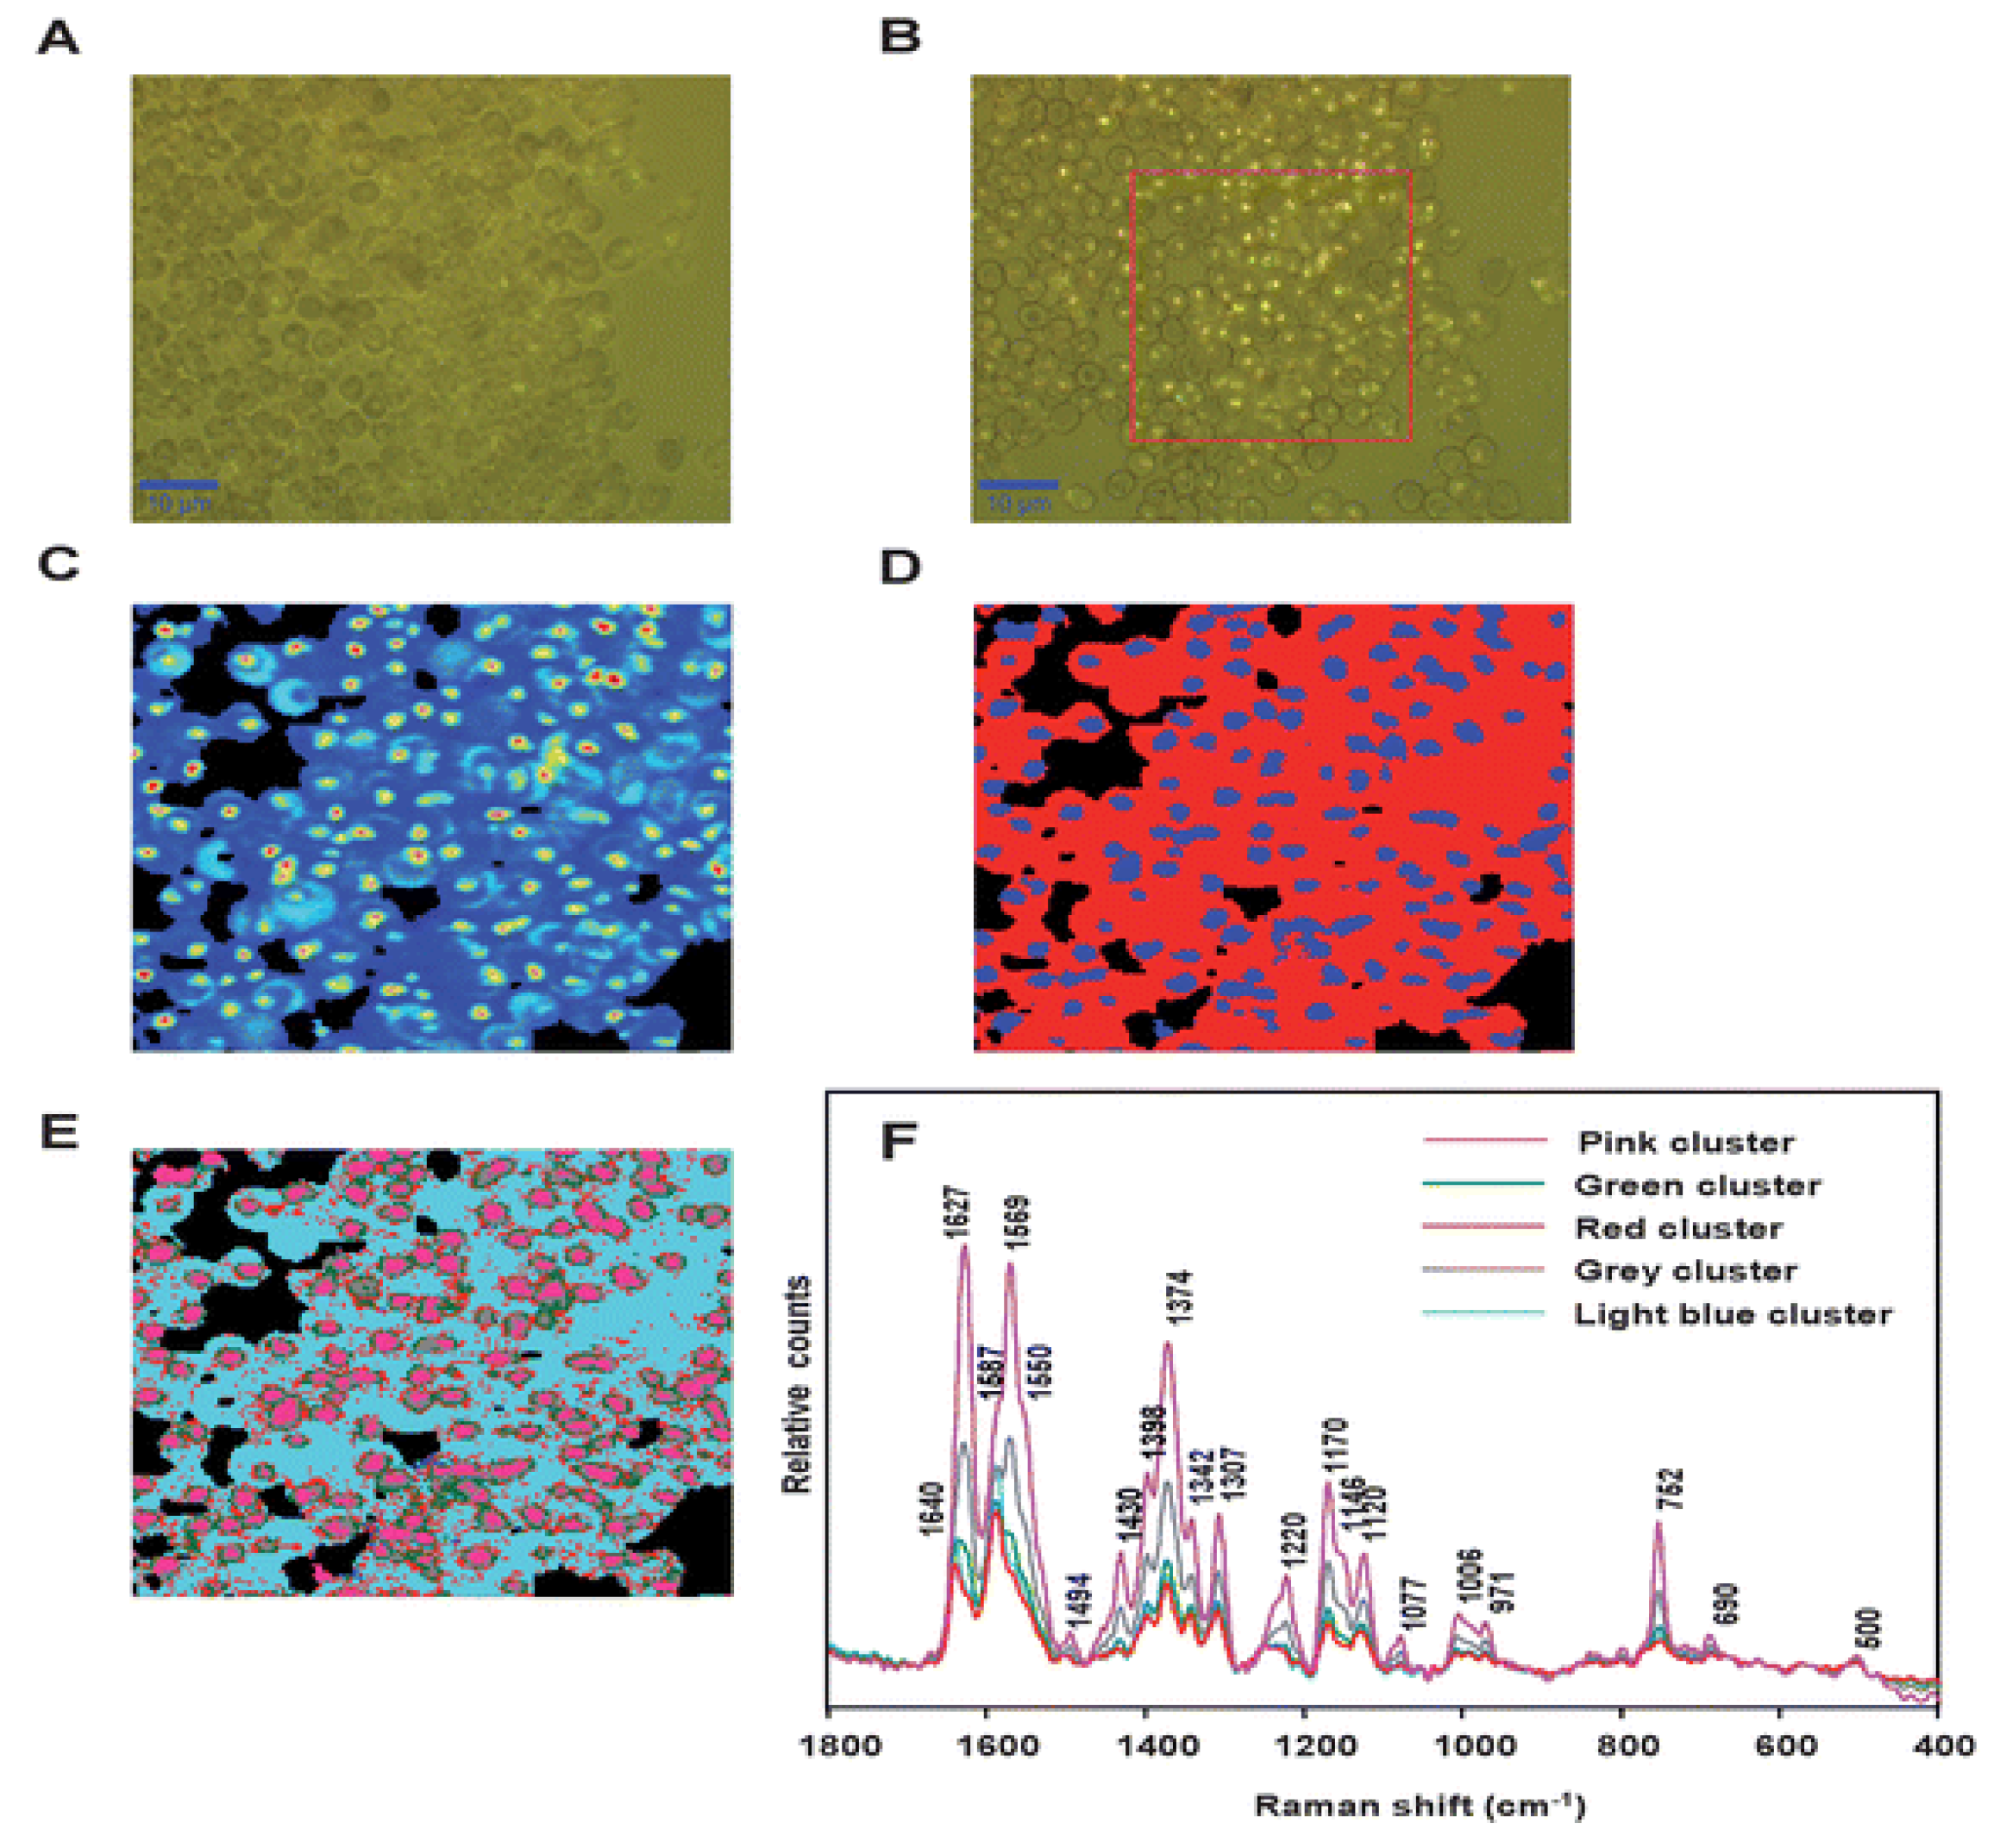
Figure 9.
Raman Acoustic Levitation Spectroscopy (RALS) A. A droplet of isolated red blood cells levitated using a piezo electric transducer and reflective plate. B. Schematic showing acoustic levitator coupled to a Raman microscope using a right-angled adaptor. C. Spectra of trophozoite lysate from lysed red blood cells (top) and micro-Raman spectrum of hemozoin. Reproduced with permission from the Royal Society of Chemistry. [69].
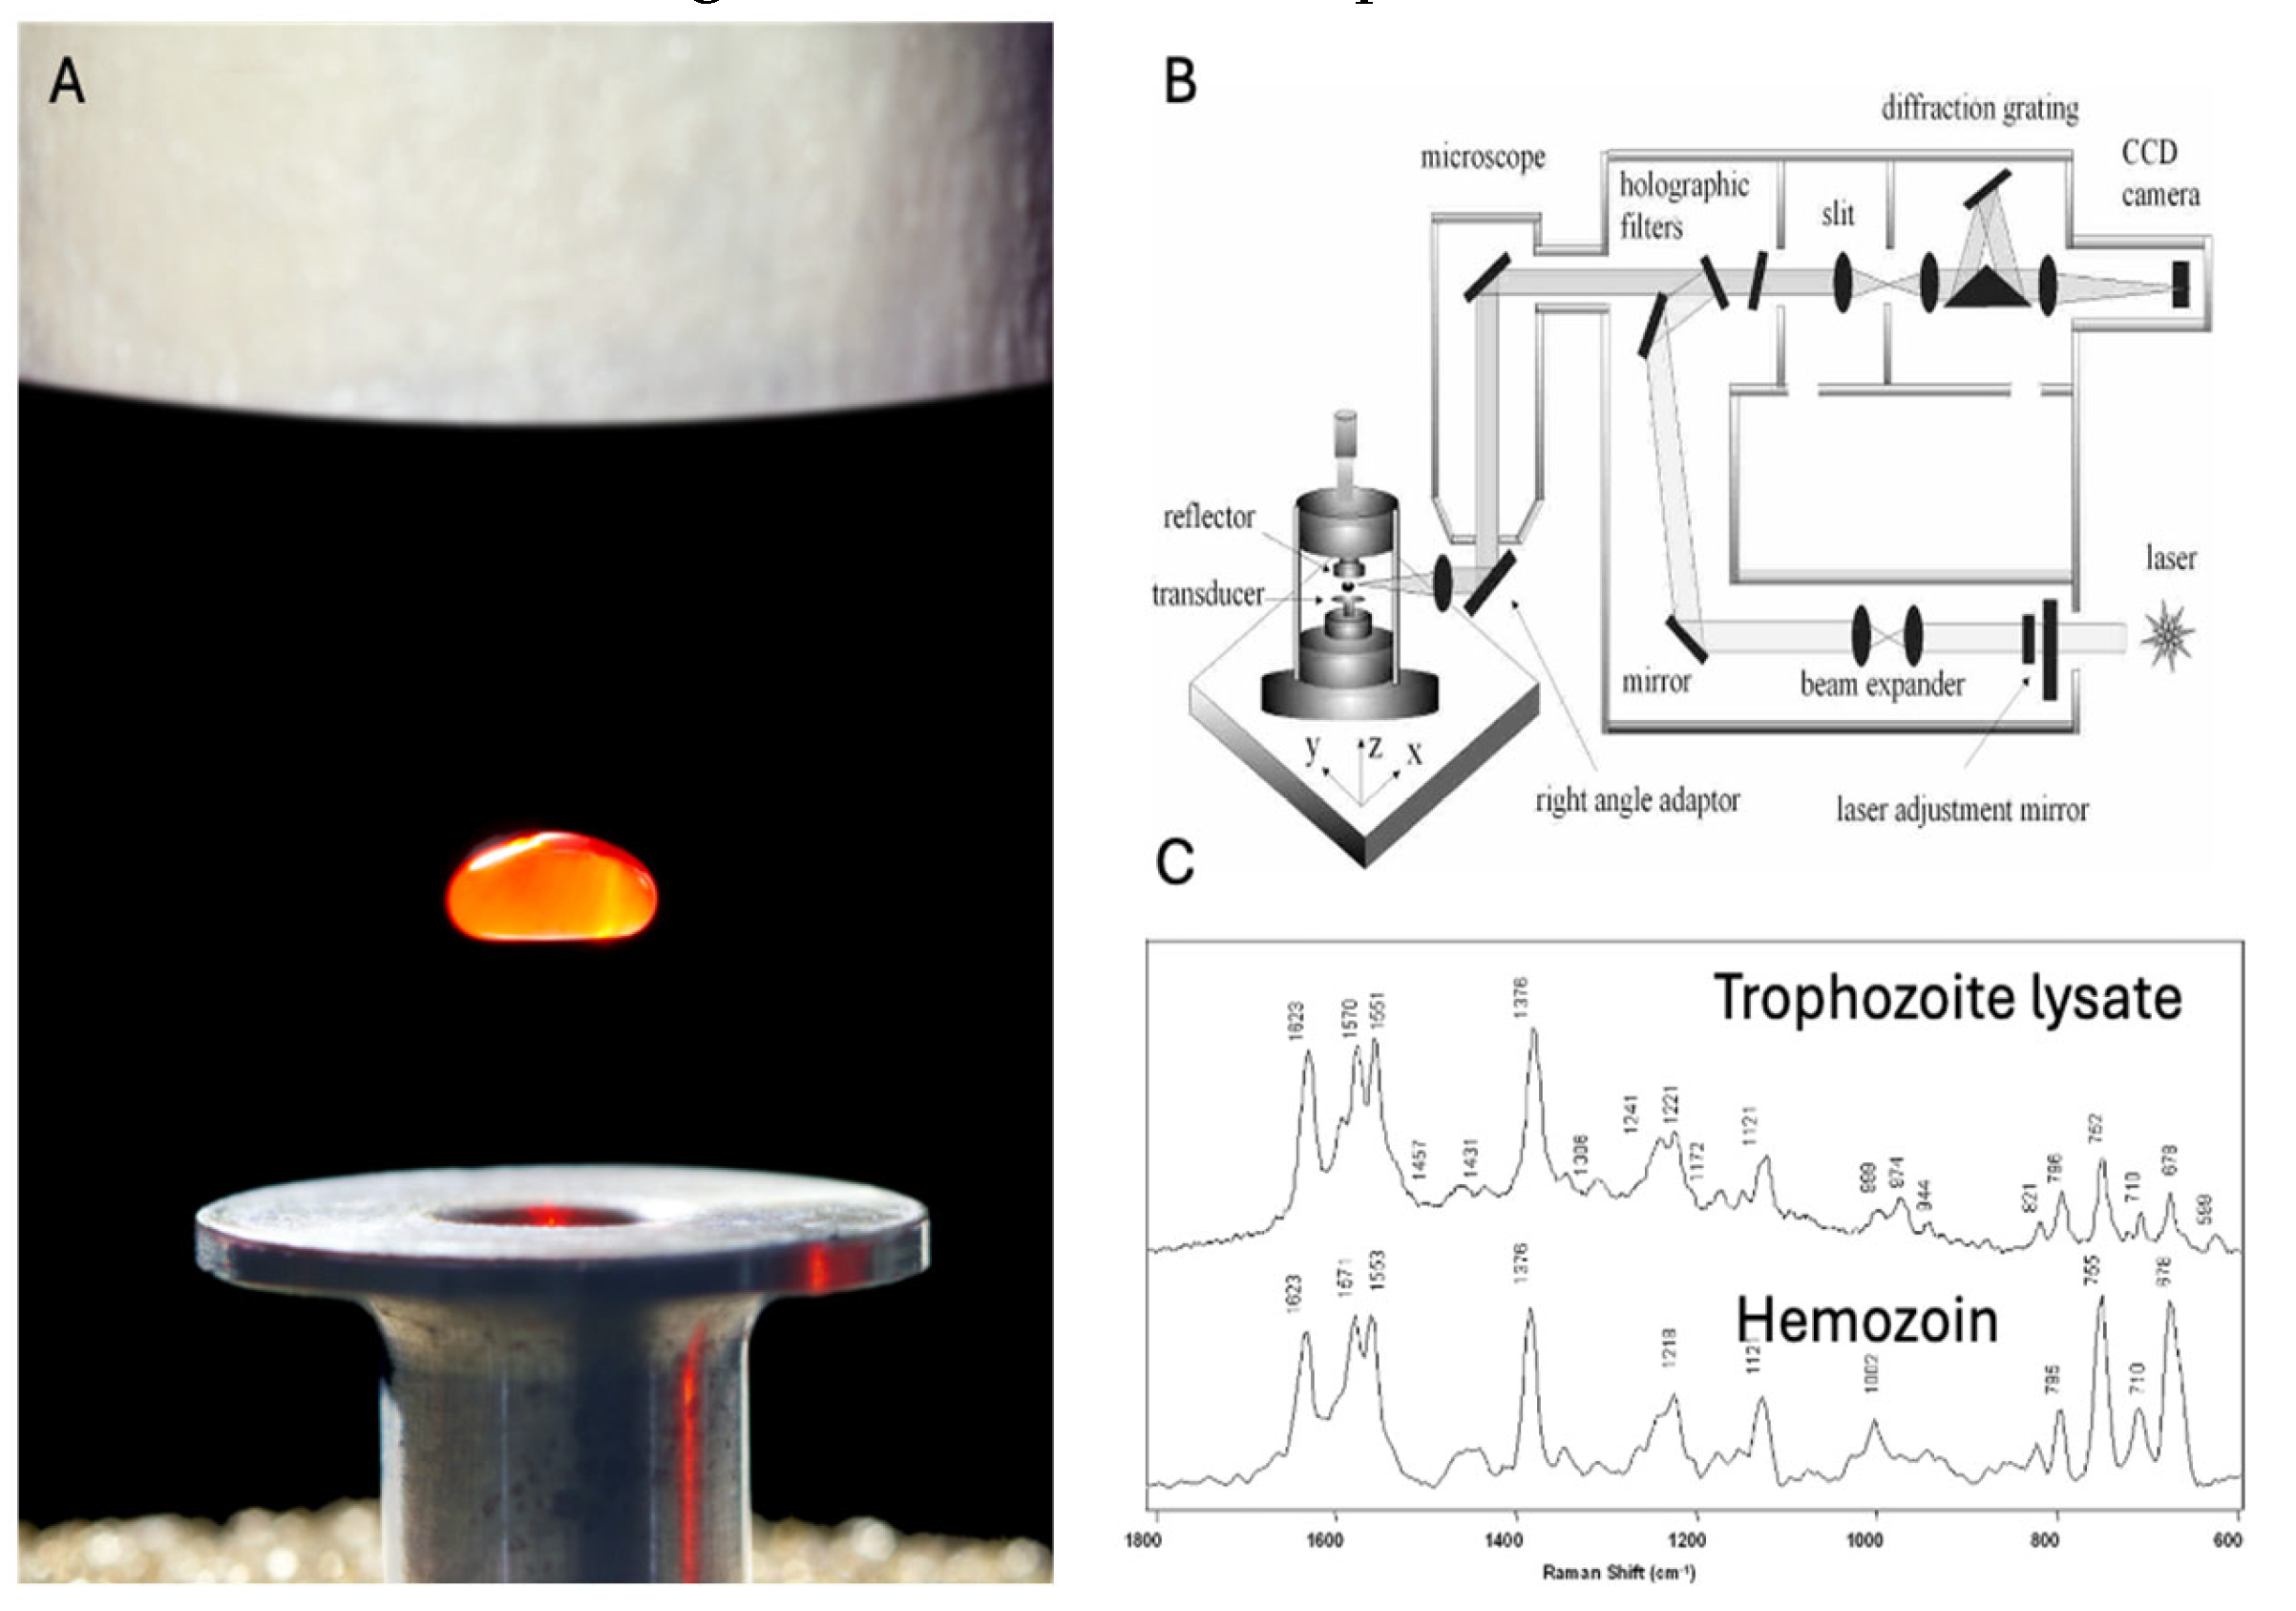
Figure 10.
A.Graphium weiskei butterfly wings. B. Schematic cross-sectional view of a gold-coated wing showing typical chitinous conical protrusion dimensions and spacings based on SEM images. C-F. SEM images of chitinous nano-structured conical arrays found on the wings of the G. weiskei butterfly. (C and D) SEM images acquired after deposition with P. falciparum-infected RBC lysate. E and F Control butterfly wings without lysate deposition. G, H, I SERS spectra of 0.0005%, 0.005% and 0% (control) malarial-infected RBC lysate, respectively. J. Conventional Raman spectrum of hemozoin at 785 nm. Reproduced with permission from the Royal Society of Chemistry. [81].
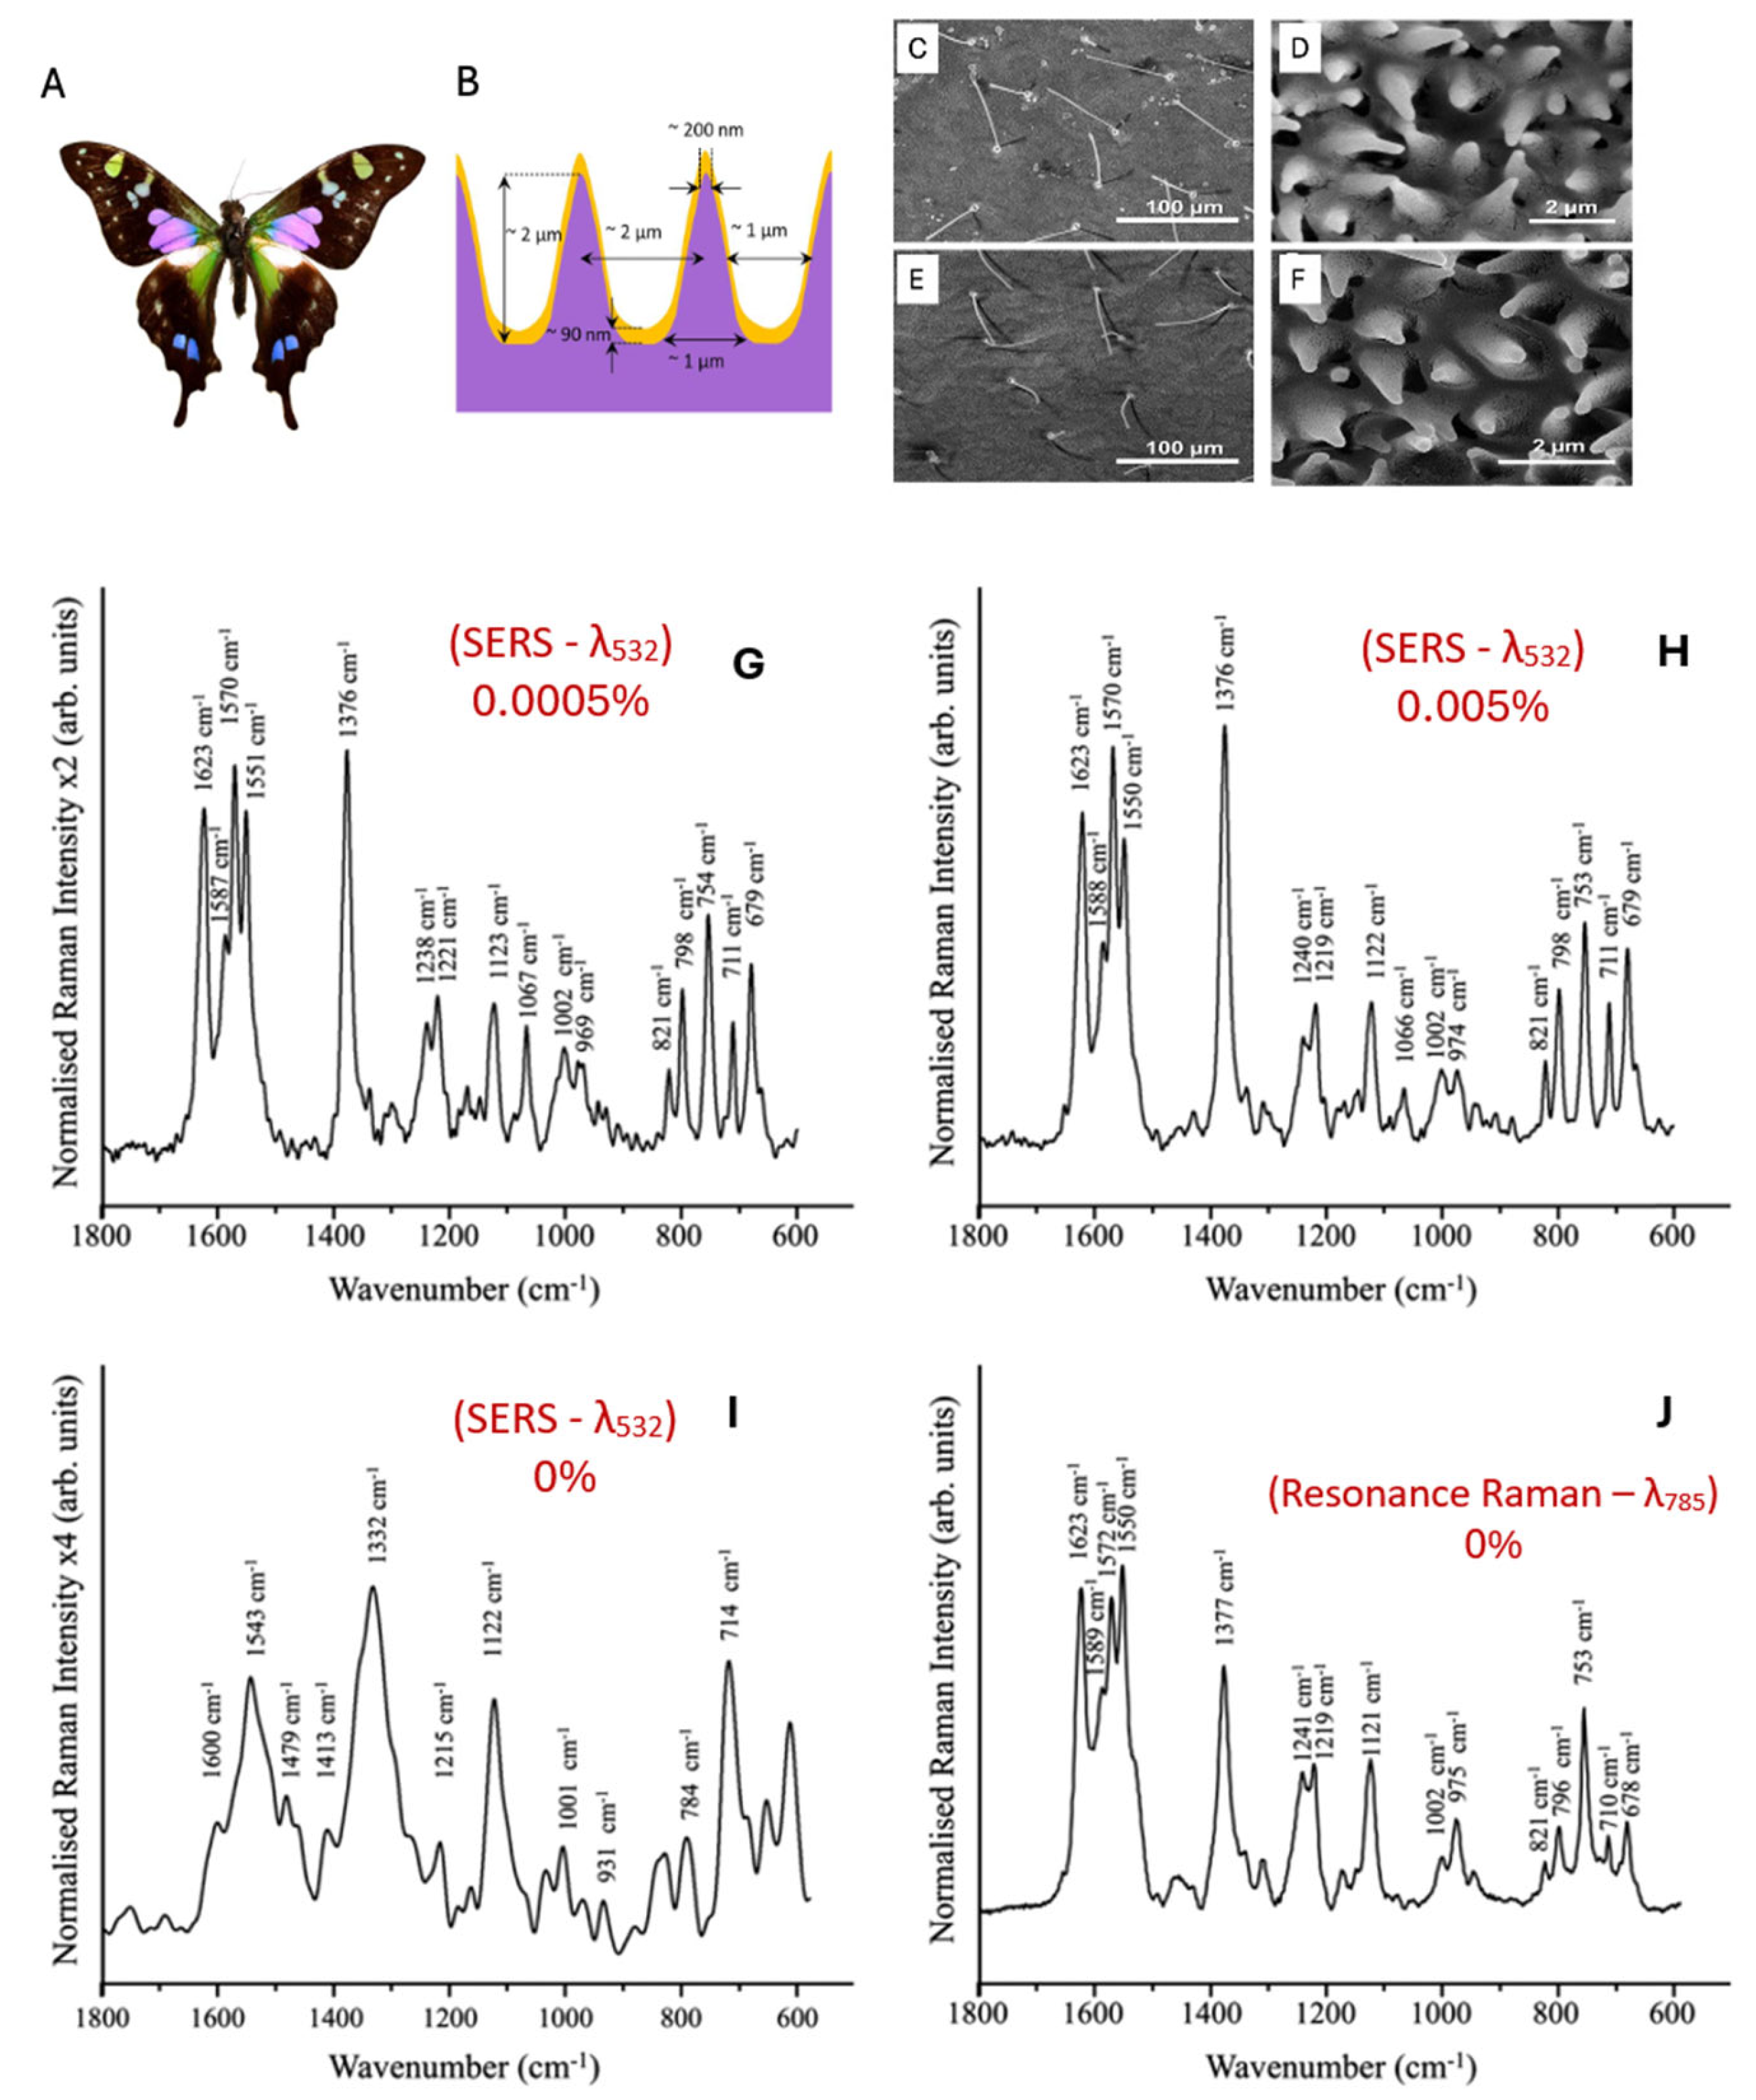
Figure 12.
A. Diagram of the instrumentation and operation of an O-PTIR microscope. This Figure is from an open access article distributed under the terms of the Creative Commons CC-BY license. [109].
Figure 12.
A. Diagram of the instrumentation and operation of an O-PTIR microscope. This Figure is from an open access article distributed under the terms of the Creative Commons CC-BY license. [109].
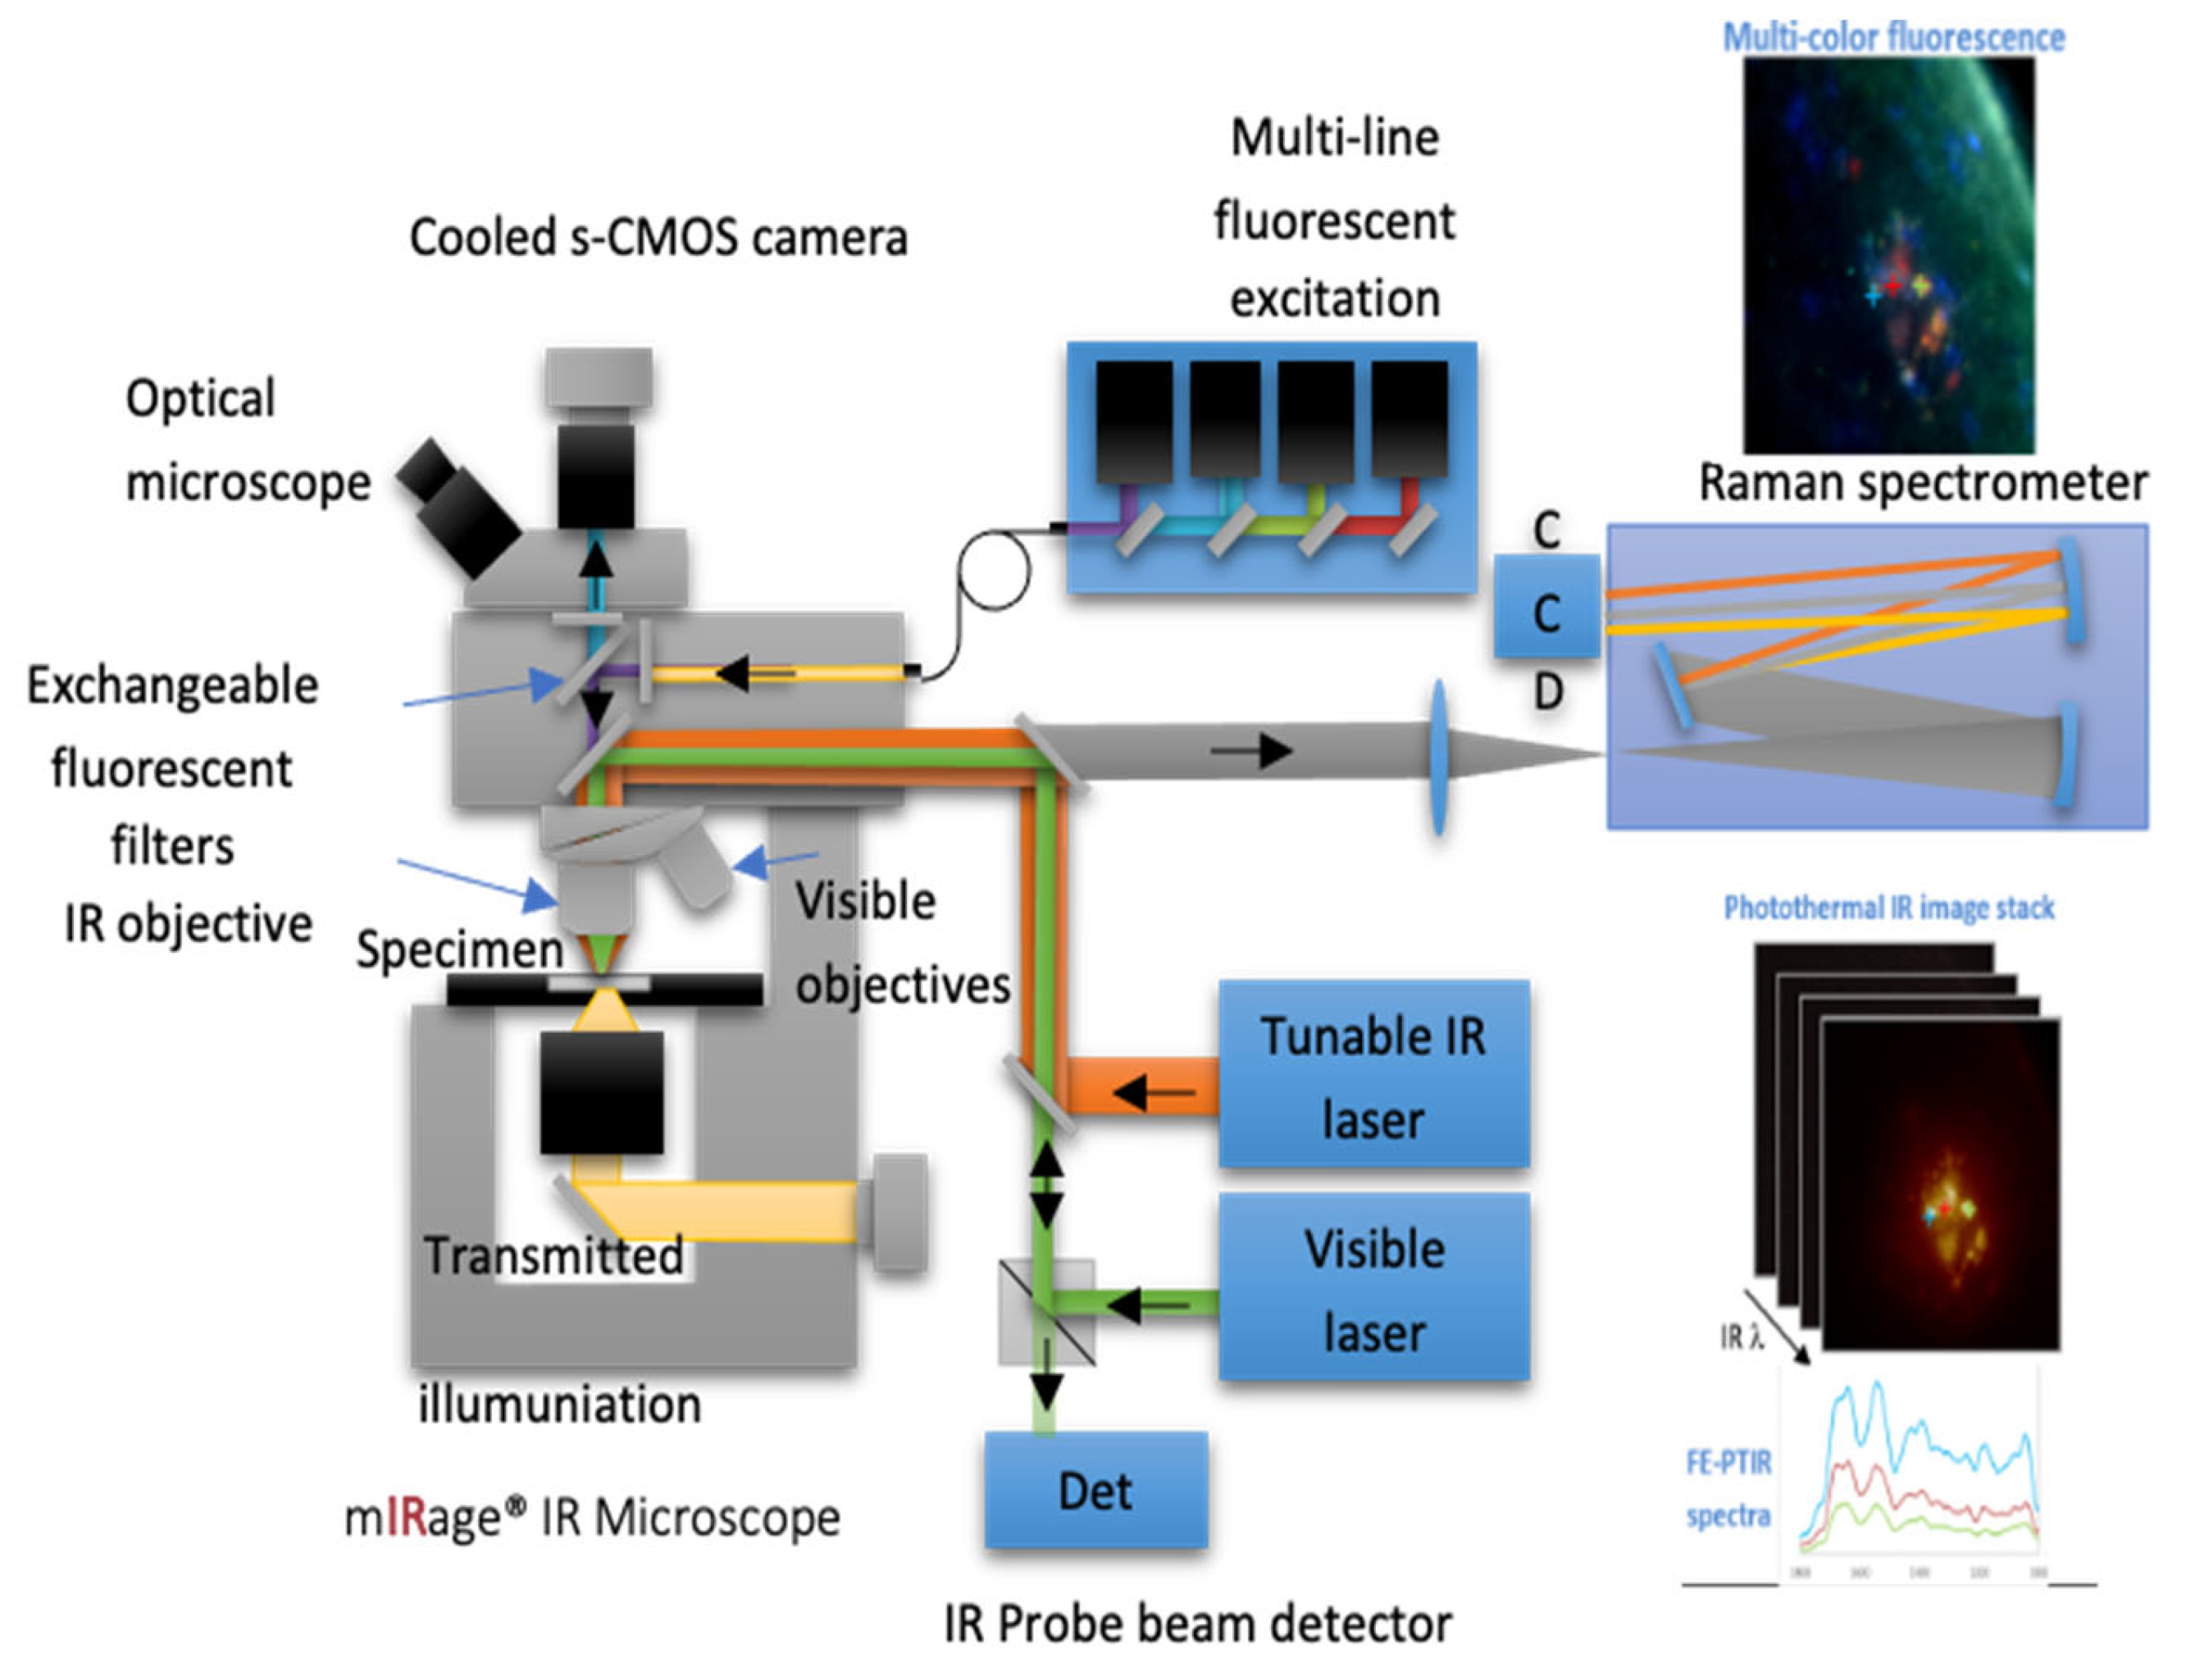
Figure 13.
Trends in miniaturization of near infrared spectrometers. This article containing this Figure is distributed under the terms of the Creative Commons Attribution-Non-commercial 4.0 License. [119].
Figure 13.
Trends in miniaturization of near infrared spectrometers. This article containing this Figure is distributed under the terms of the Creative Commons Attribution-Non-commercial 4.0 License. [119].
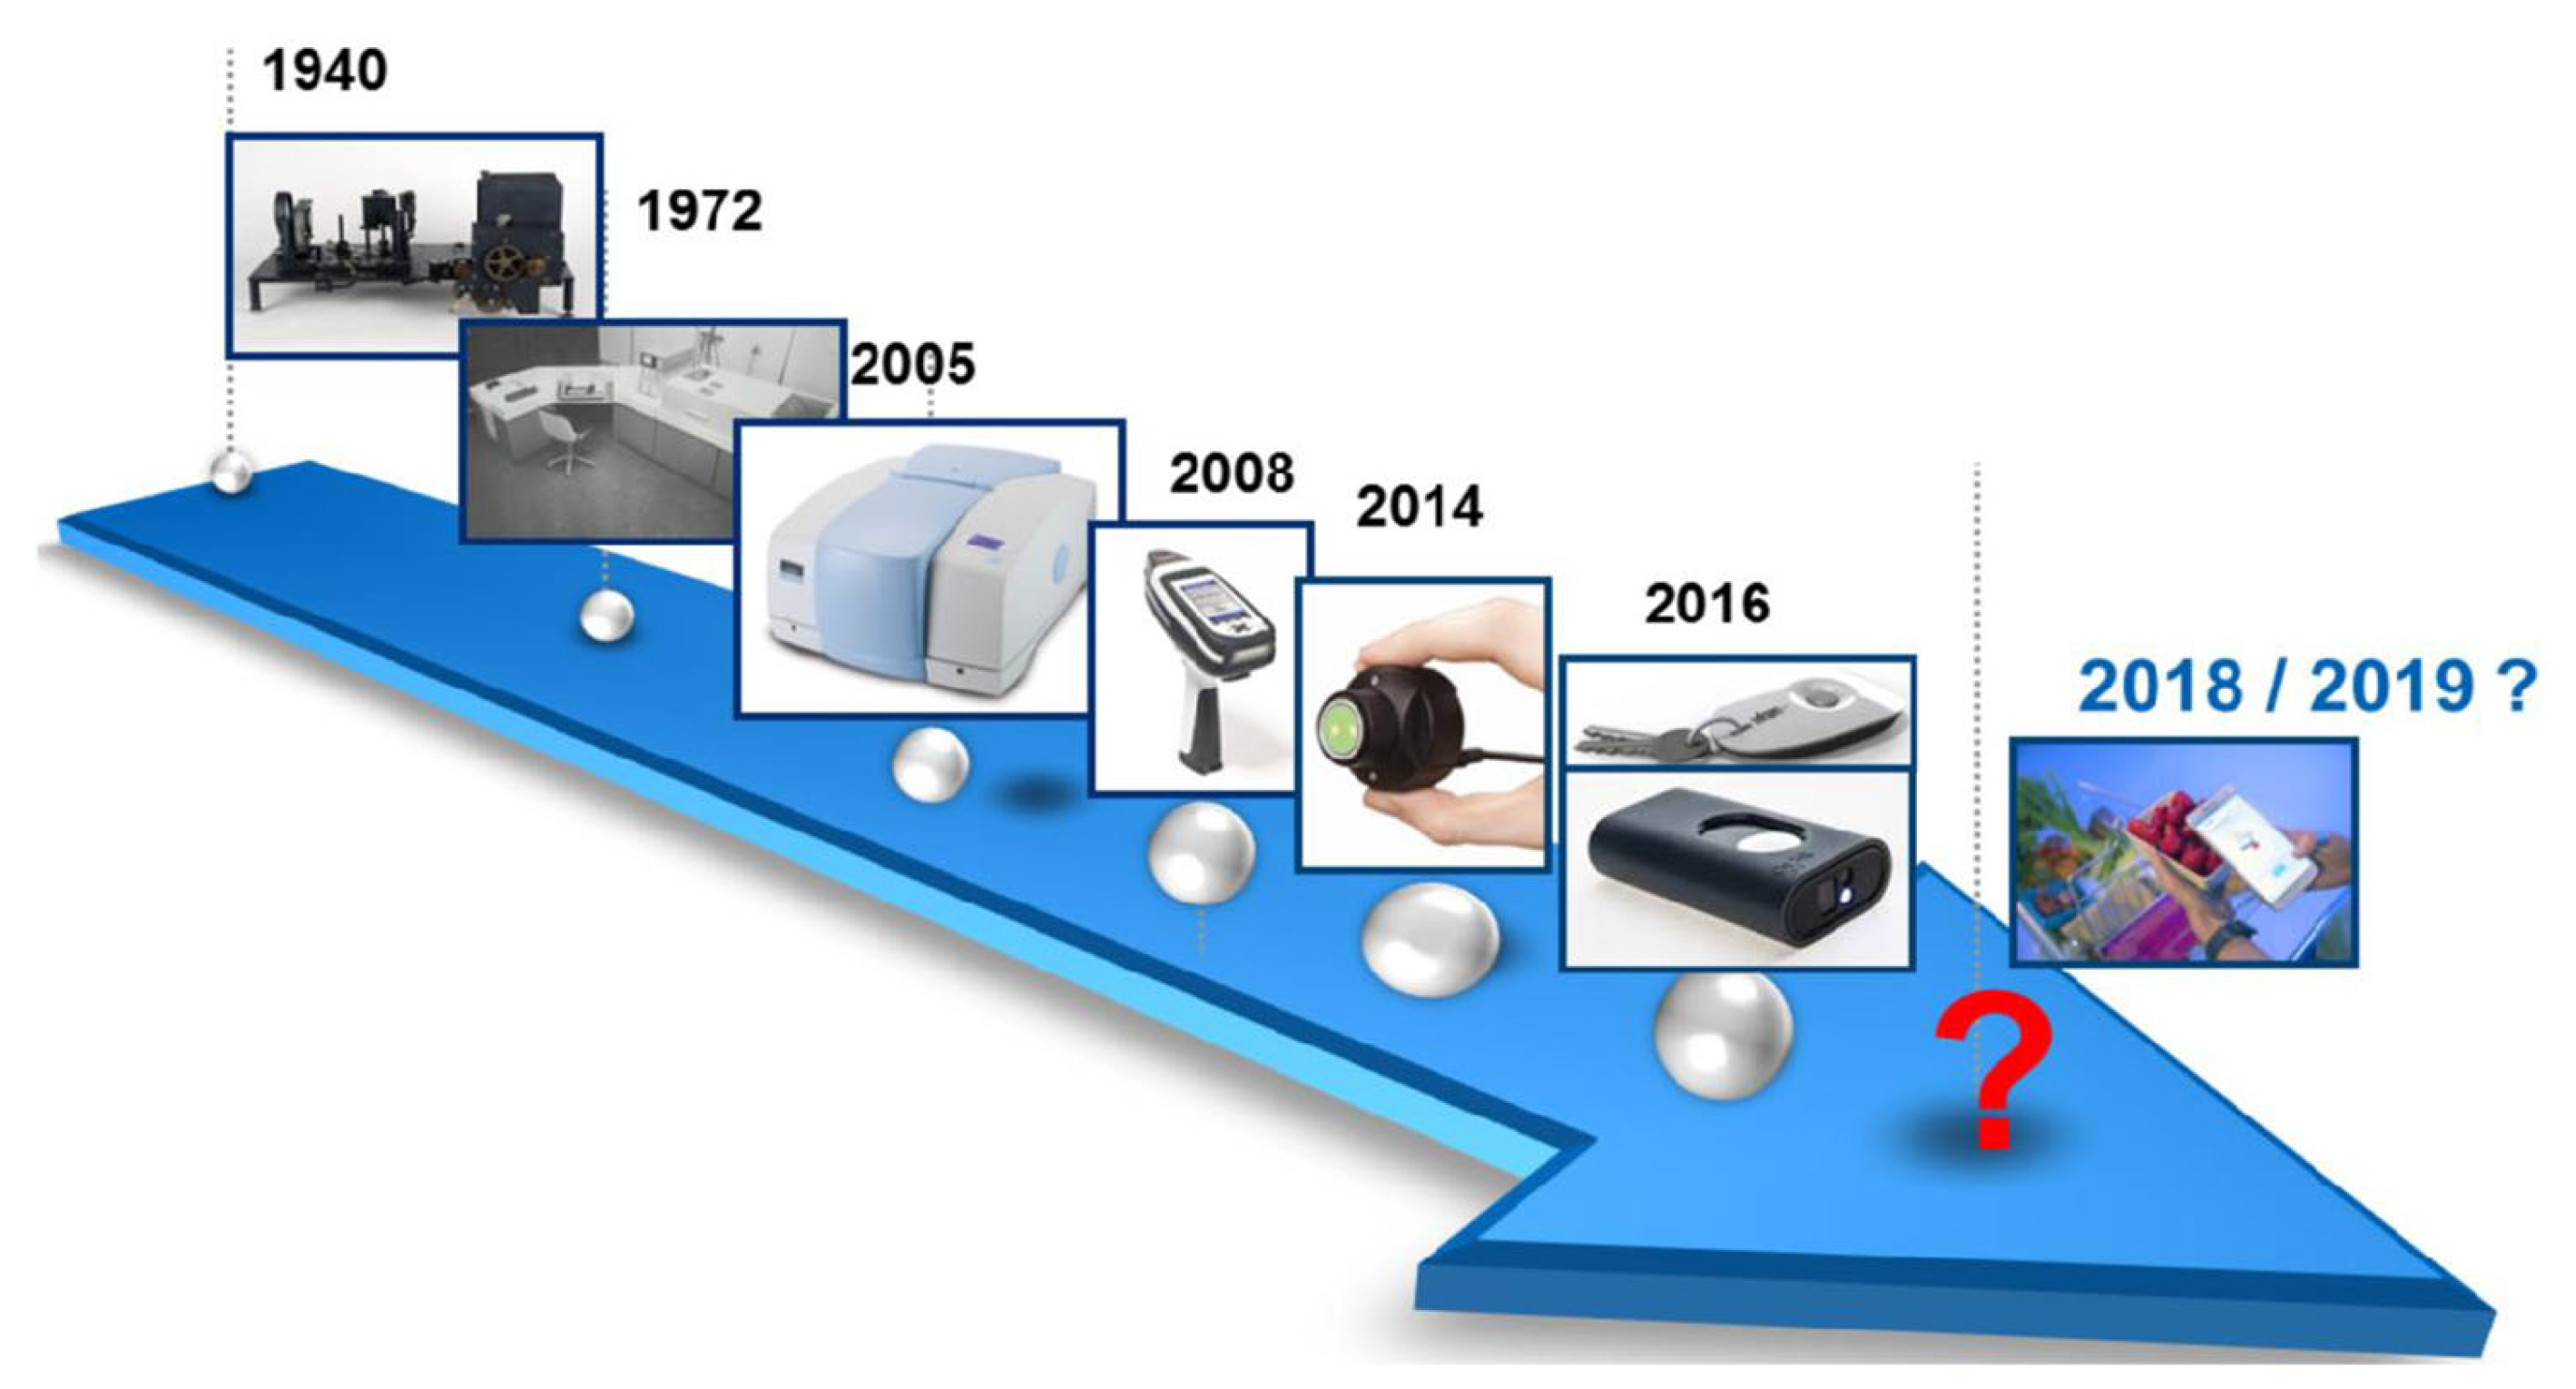
Figure 14.
Scanning of mice and blood spots using NIRS. Panel A and B illustrate how mice were held and non-invasively scanned. Panel C illustrates scanning of dry blood spots on the slides. Panel D shows the resultant raw spectral signatures from various body parts of a mouse and spectral signatures from blood spots. The Figure is from an open access article distributed under the terms of the Creative Commons Attribution License. [131].
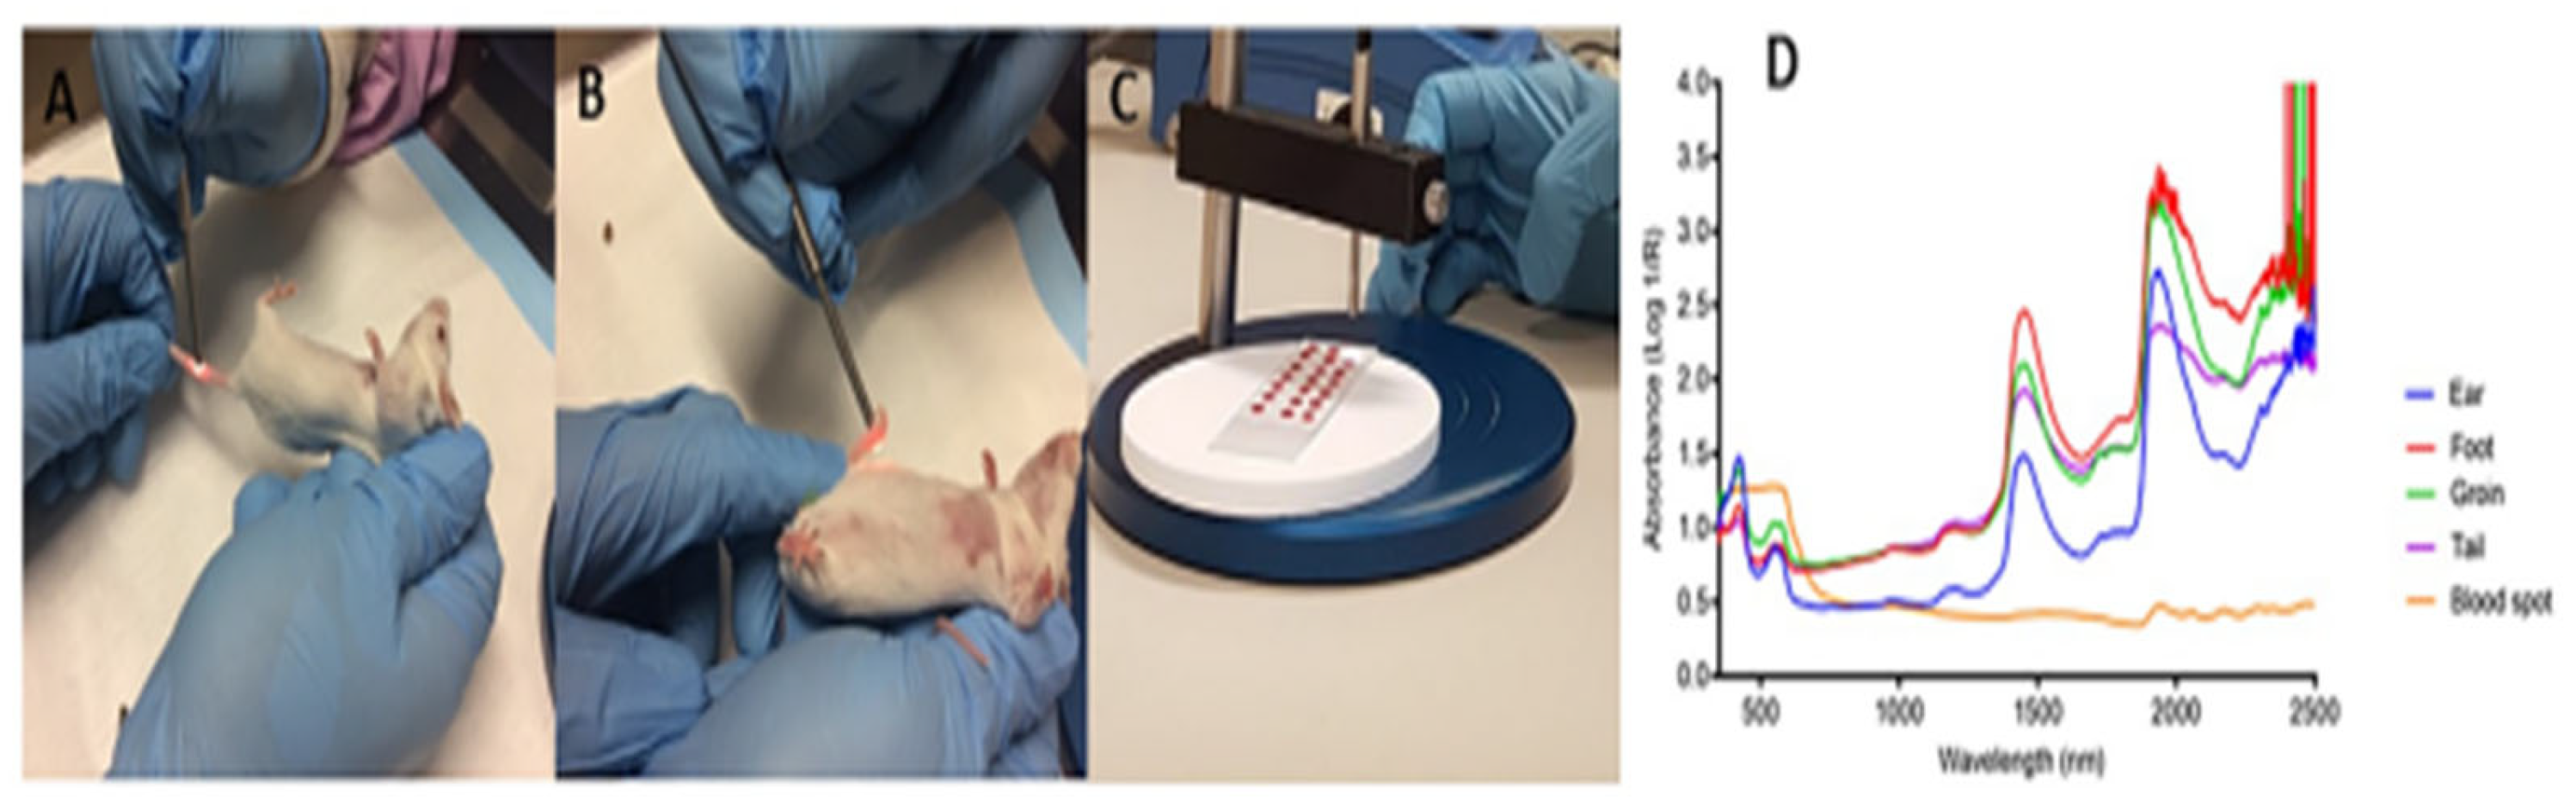
Figure 15.
Partial least-squares regression plots for malaria-diluted samples ranging from A. 6% to 0.00001%. B. 0.1% to 0.00001% where the actual parasitemia plotted on the x-axis and the predicted parasitemia on the y-axis. C. PCA Score plots (PC1 vs. PC2) for 6% to 0.00001% range. D. Comparison between control samples and those with the lowest parasitemia (0.000001%). Reproduced with permission from the American Chemical Society. [5].
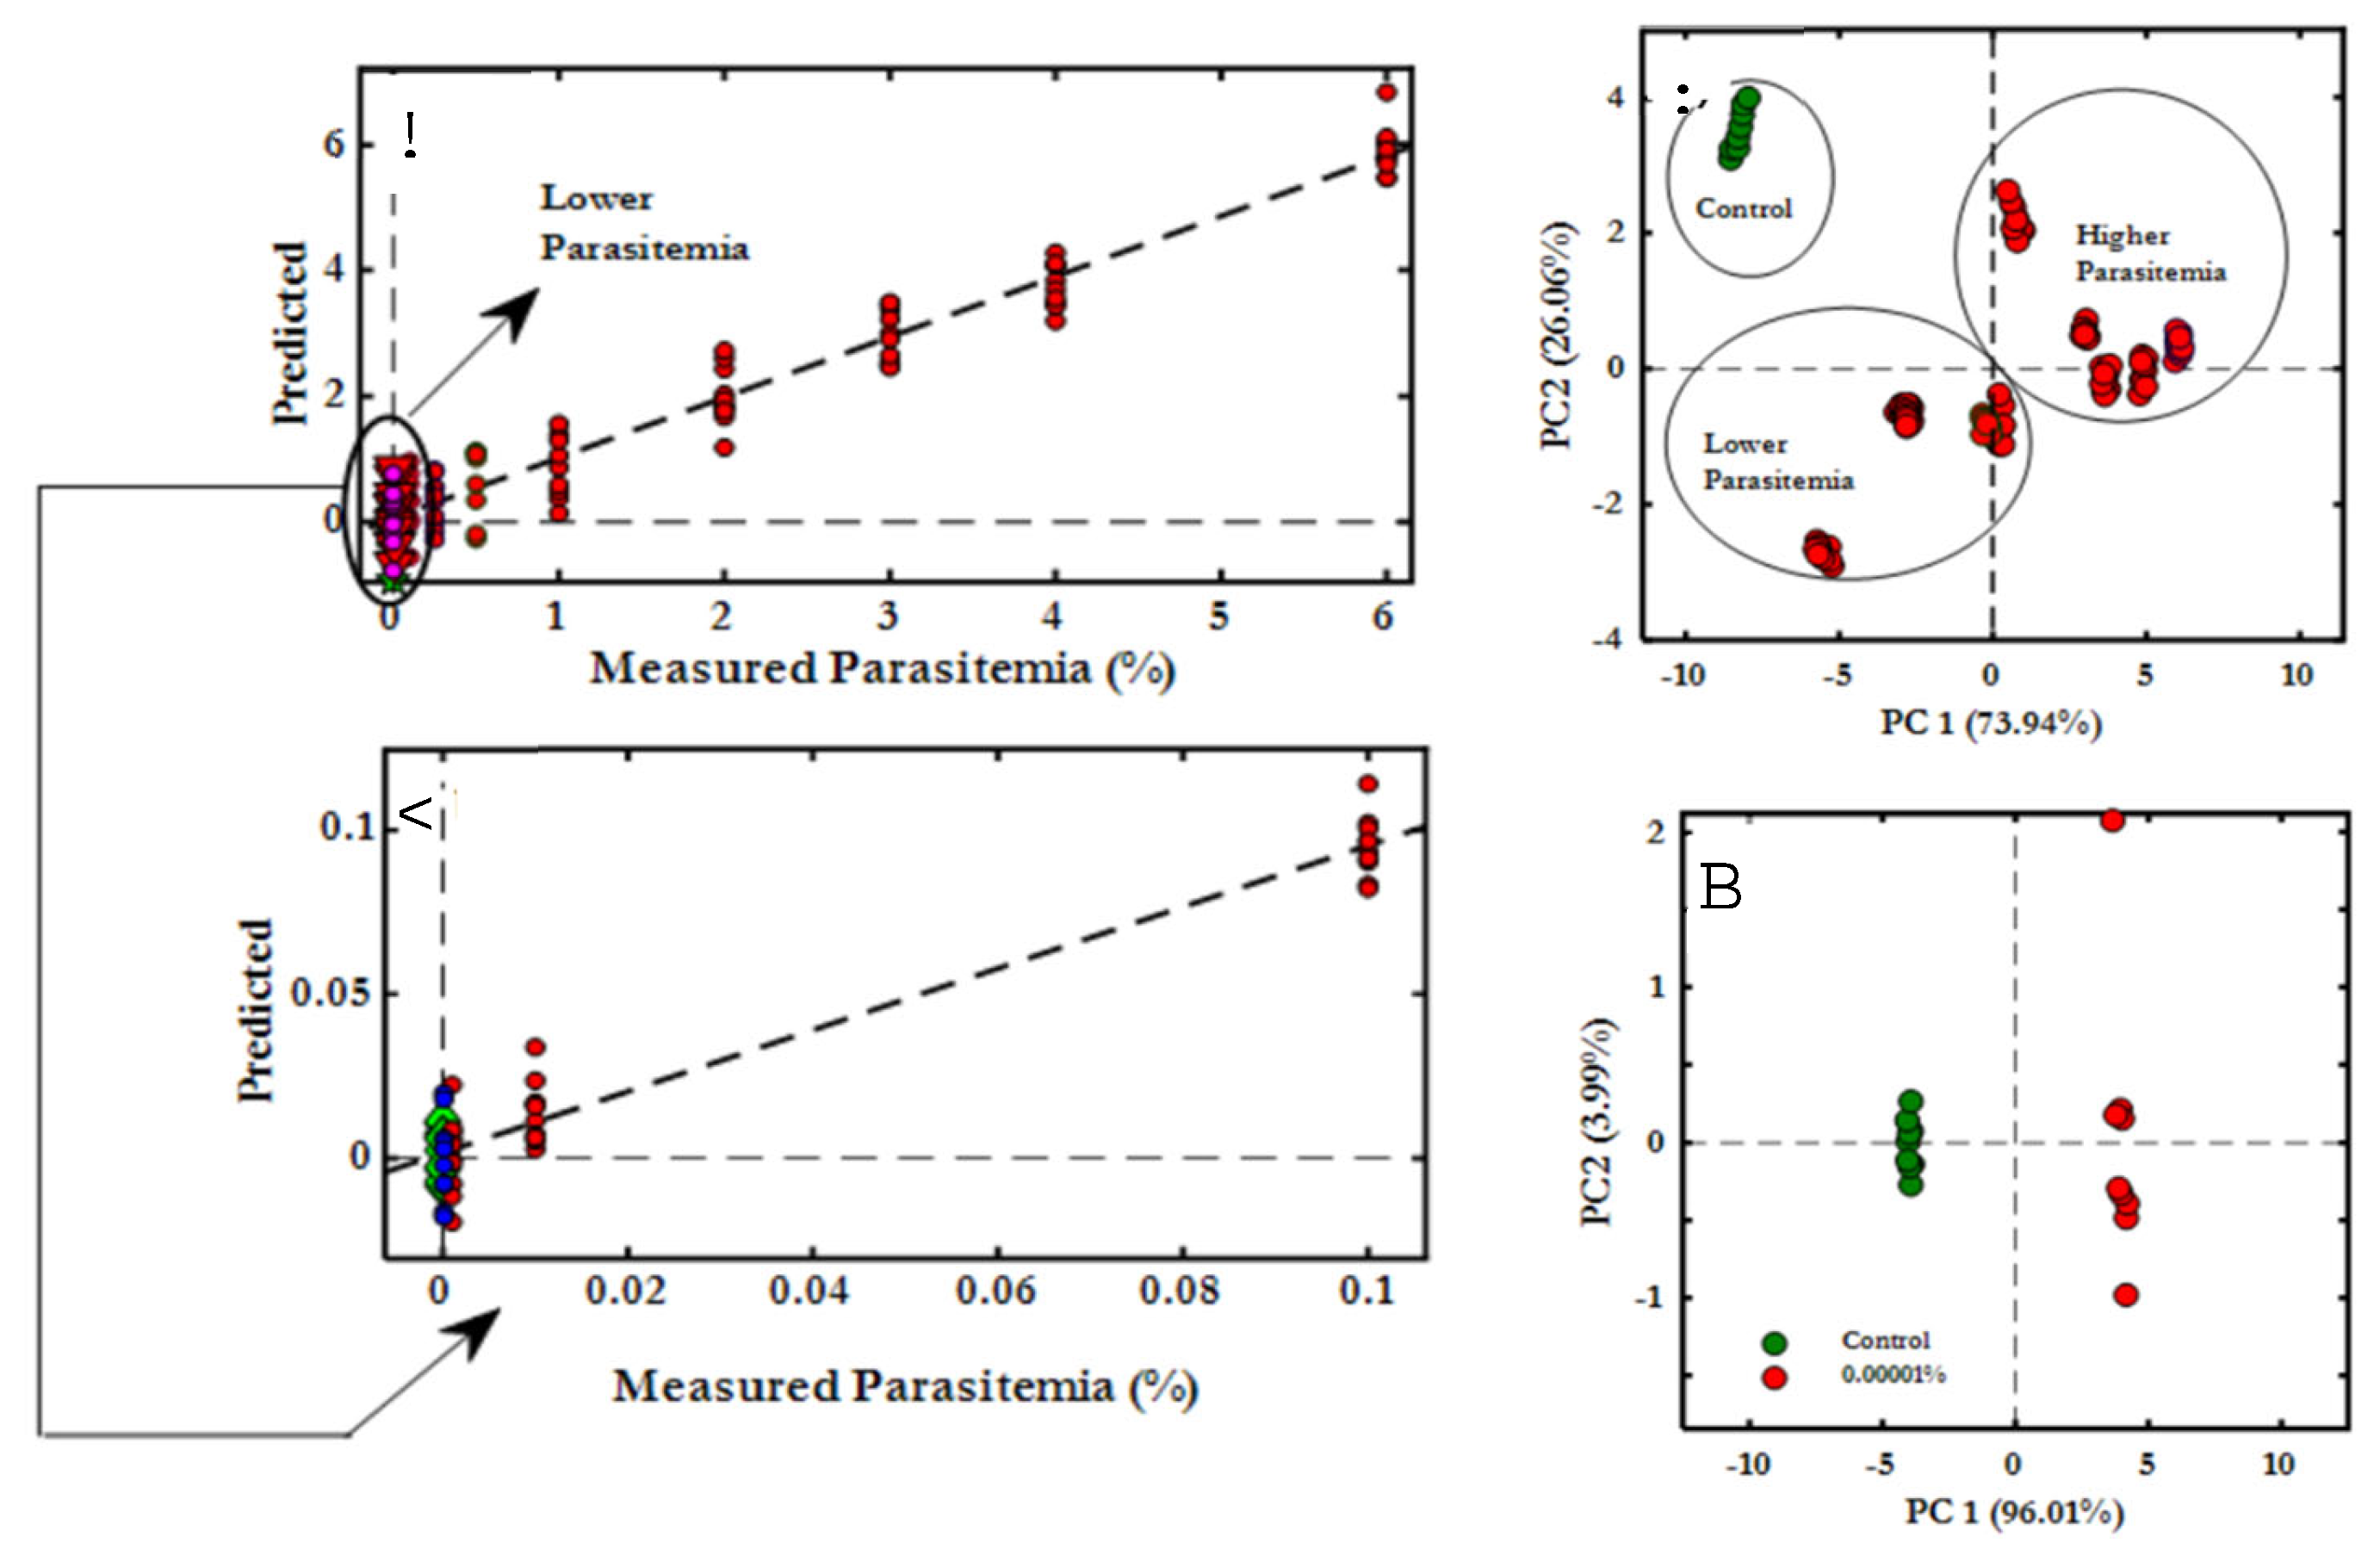
Figure 17.
Analysis of IR and Raman spectra from a single isolated red blood cell (RBC). For the IR analysis: A. An Unsupervised Hierarchical Cluster Analysis (UHCA) cluster image was generated, and B. shows a visible image of a Giemsa-stained cell. For the Raman analysis: C. presents the UHCA cluster image, and (D-E) the average spectra for each cluster were displayed for the IR and Raman analysis respectfully while F. displays the integration map of the Raman band for hemozoin, in the range of 1629–1599 cm⁻¹, using baselines set at 1585–1575 cm⁻¹ and 1652–1643 cm⁻¹. The Raman spectra provided precise localization of hemozoin bands, which was not possible to identify directly in the IR spectra of the RBC. Reproduced with permission from the American Chemical Society. [94].
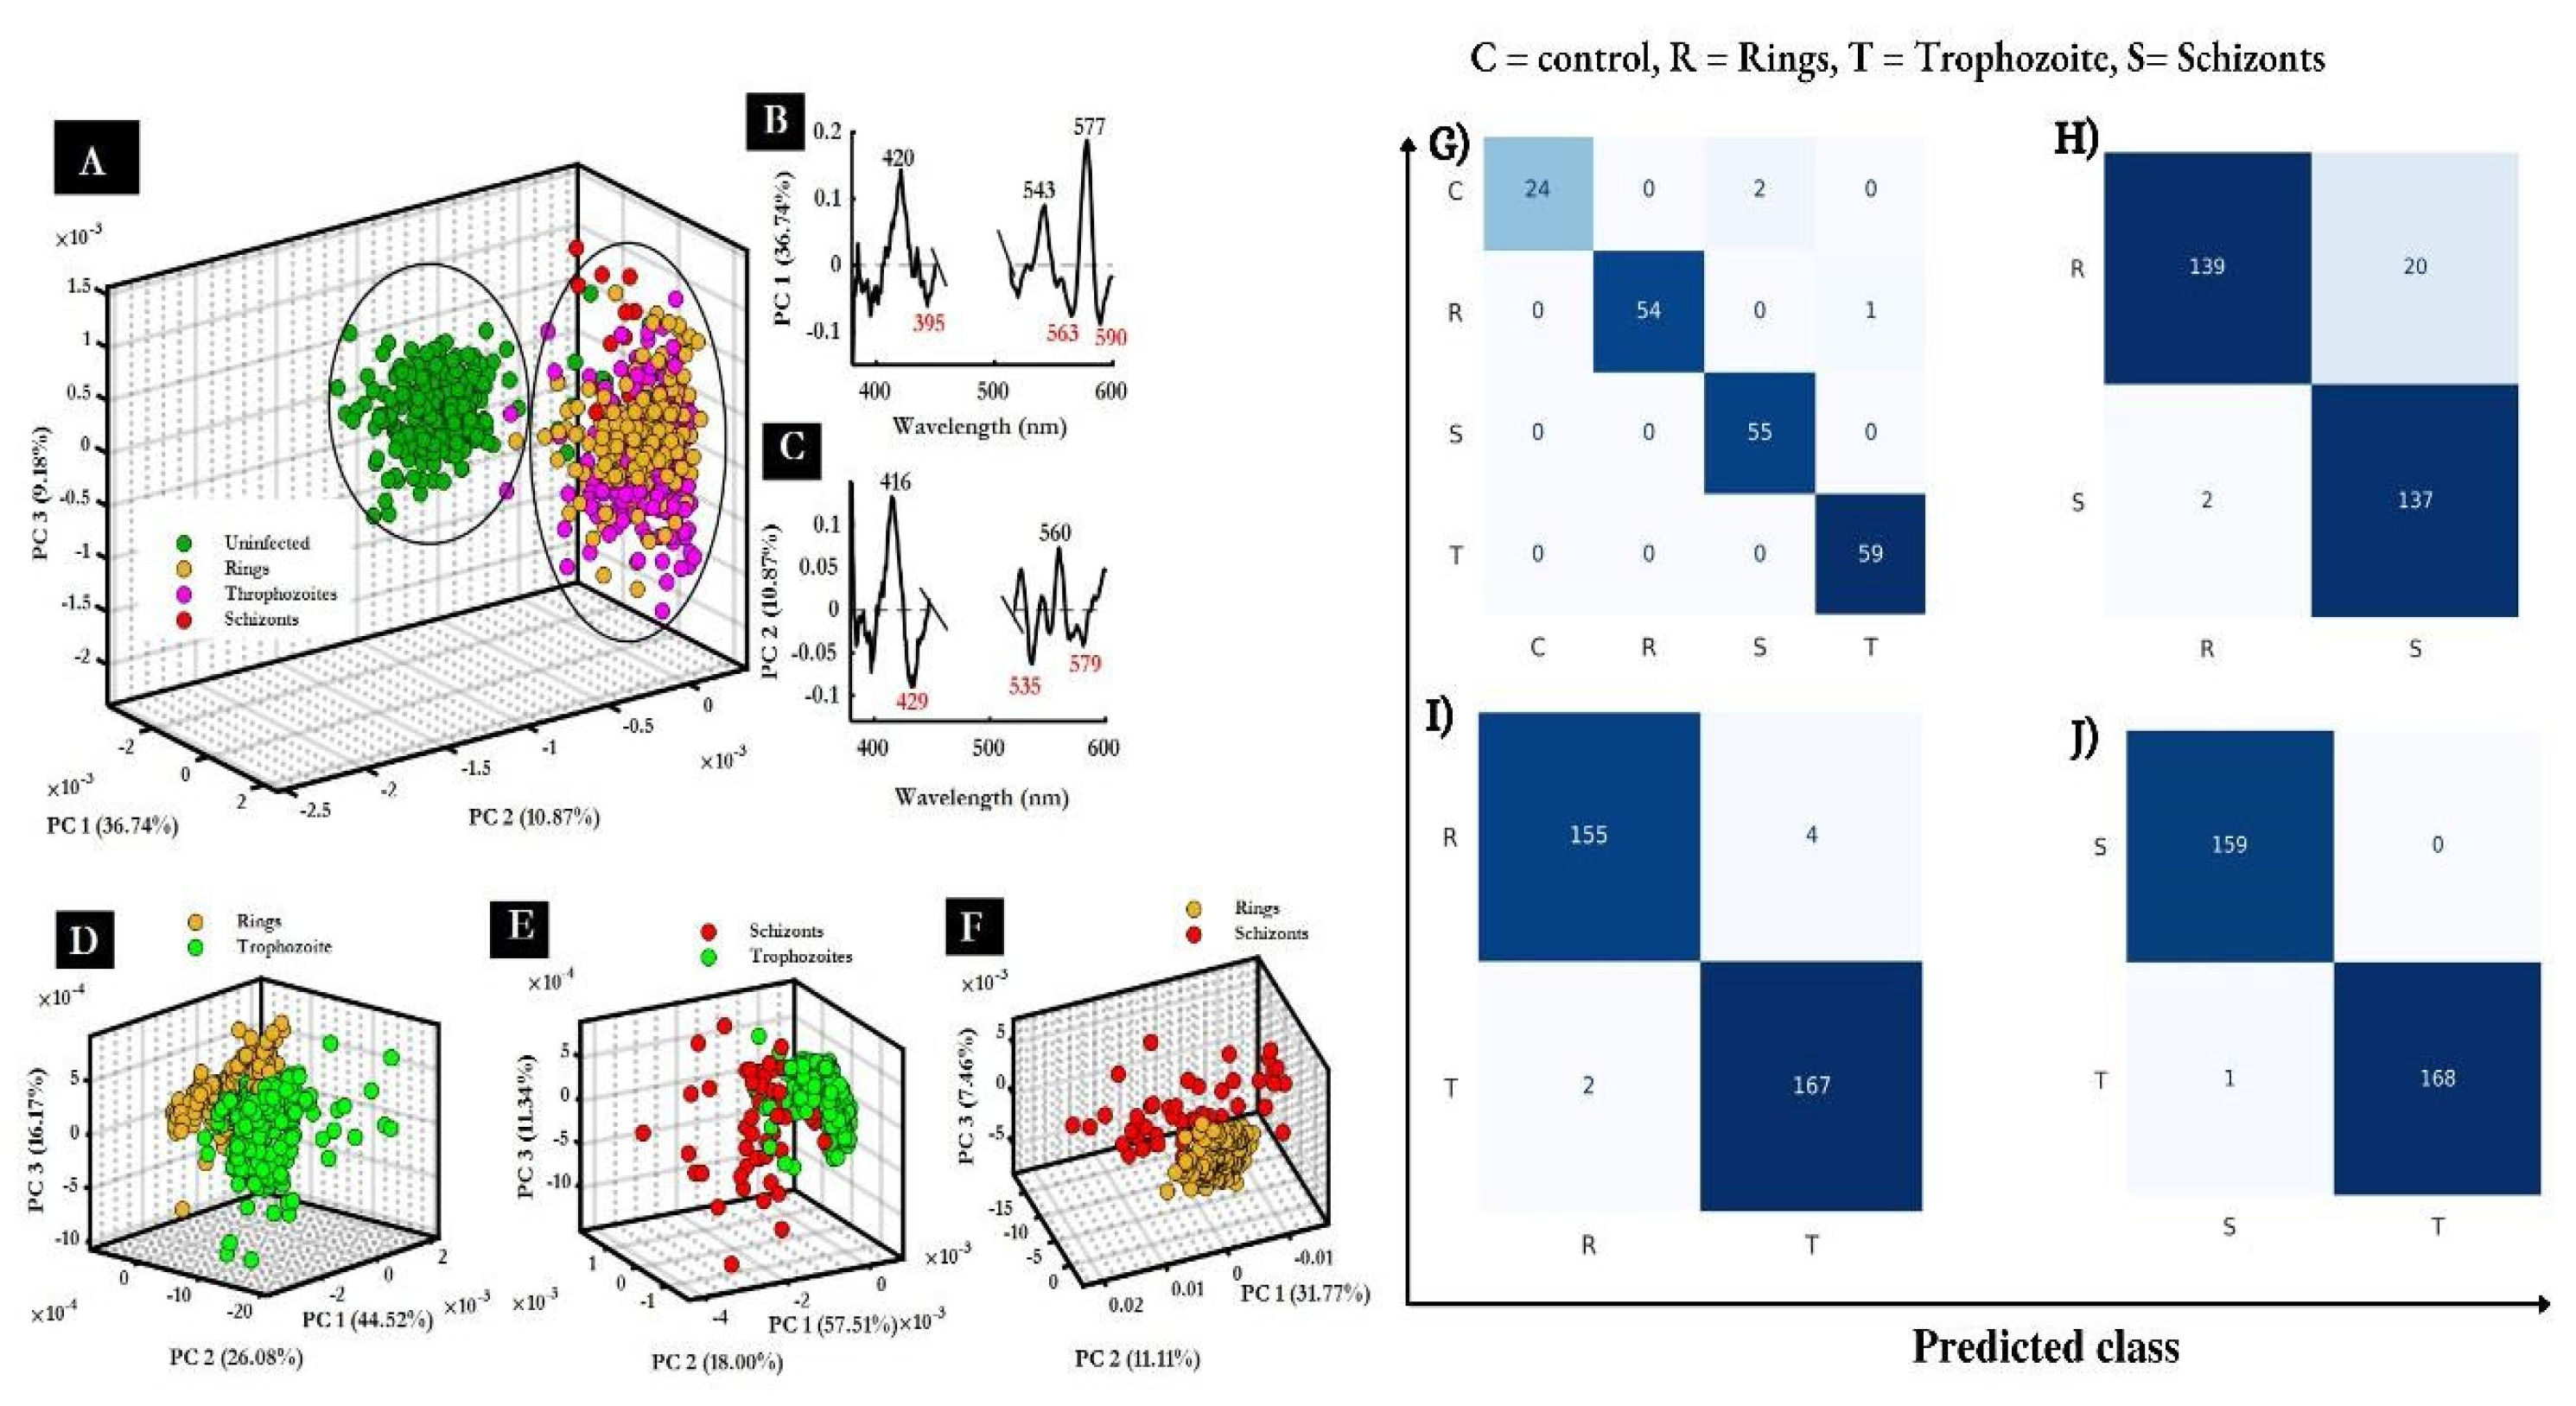
Figure 18.
A-C. PLS-R results for WB samples spiked with R-staged parasites. PLS-R scores plots for the higher parasitemia models (1–0.25%) are shown for: A. the lower wavelength range (200–700 nm), B. the higher wavelength range (1000–2500 nm), and C. the entire wavelength range (200–2500 nm). D. The PLS regression vector for the lower parasitemia models highlights key marker bands associated with both infected and control aqueous blood. Reproduced with permission from the American Chemical Society. [132].
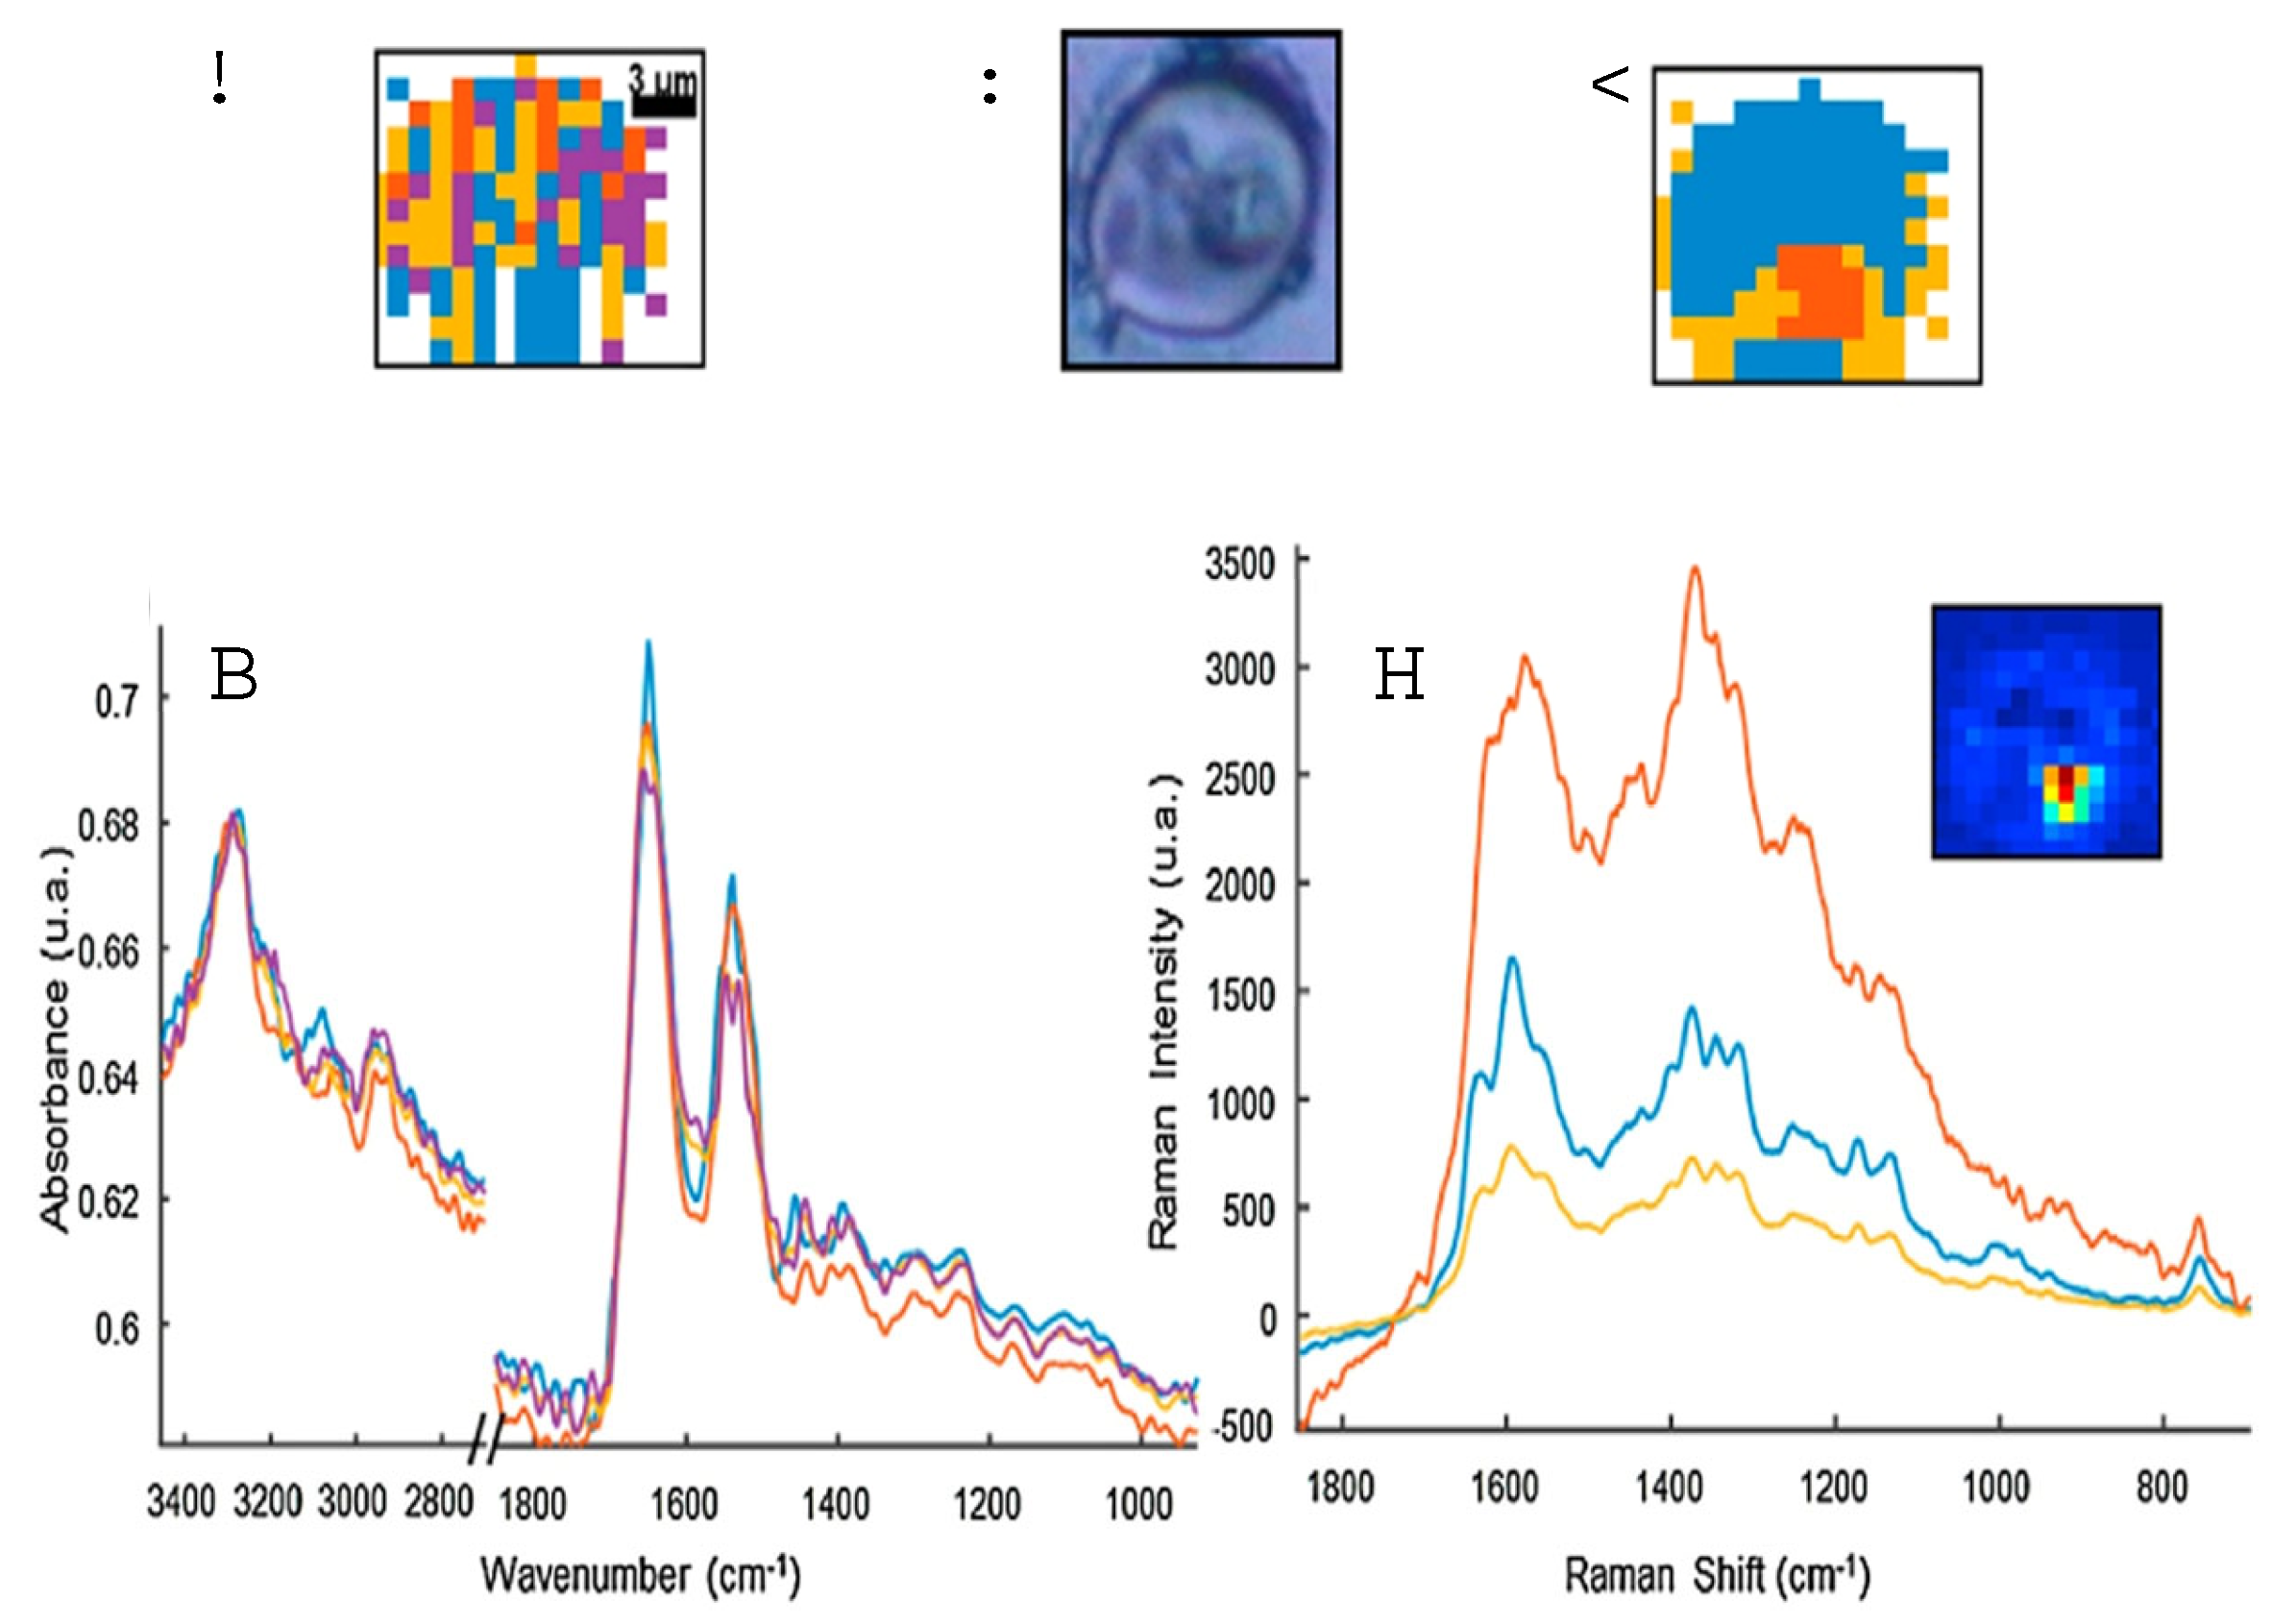
Figure 19.
AFM-IR imaging of a P. falciparum trophozoite inside a red blood cell. (a) AFM topography. (b) AFM deflection map showing the location of the points where spectra were measured, inside (blue) and outside (red) of the protrusion. (c, d) Spectra measured from the signal of the IR intensity peak (V) showing different bands for the red and blue spots in the 1450−950 and 1800−1450 cm−1 regions, respectively. (e, f) IR peak maps obtained at 1207 and 1660 cm−1, respectively. (g, h) Score and loading plots from the PCA applied to the 3100−2800 cm−1 region.Replicated from. [156].
Figure 20.
A-C. AFM images recorded of sectioned cells prior to TERS acquisition. A. A 30 x 30 μm AFM image recorded of a population of infected red blood cells showing a potential cell target highlighted by the blue square. B. A high-resolution image of the cell highlighted in (A) showing hemozoin crystals aligned in the digestive vacuole. C. An even higher resolution AFM image of the digestive vacuole of the parasite showing single crystals of hemozoin that can be selectively targeted with the TERS active tip. D. TERS spectrum recorded of the edge of a hemozoin crystal. The spectrum was recorded with a laser power of 600 μW and exposure time of 5 s. E. After recording a spectrum, the tip was retracted by several micrometers and a further spectrum recorded to ensure the tip had not been contaminated by the sample. F. Surface-enhanced Raman spectrum recorded of β-hematin prepared using SERS active Ag-particles. Spectra were recorded using a 532 nm laser and 10 s acquisition time. G. Resonance Raman spectrum of β-hematin recorded at 532 nm with 10 s acquisition time. Reproduced with permission from the American Chemical Society [157].
Figure 16.
The image illustrates PCA applied to visible spectra of single cells. A. A 3D Scores plot for various RBC samples (control, rings, trophozoites, schizonts), demonstrating clear separation of control RBCs from infected cells along PC 2. B. The PC1 loadings plot, highlighting significant positive and negative loadings. C. The PC2 loadings plot. D. A 3D Scores plot comparing RBCs infected with rings (R) and trophozoites (T). E. Schizonts (S) and trophozoites (T). F. Rings (R) and schizonts (S). (G-J). presents the computed confusion matrices (CM) that illustrate the accuracy of the SVM models developed in this study. G. shows multiclass models including datasets from control, rings, schizonts, and trophozoites. Panels (B–D) display binary classifications comparing infected classes with the control: (B) Control vs. trophozoites, (C) Control vs. rings, and (D) Control vs. schizonts. The numbers in each class indicate the spectra count used for testing. Reproduced with permission from the American Chemical Society. [6].
Figure 21.
A Partial least squares discriminant analysis (PLS-DA) prediction plot showing the classification of either malaria positive (< 0.5) or negative (> 0.5); spectra colour-coded malaria positive (red) or negative (green) by PCR. b Same as in a) except support vector machine (SVM) learning is used for the classification. c Receiver operating characteristic (ROC) curves showing the diagnostic of the PLS-DA and SVM classification. d ROC curve for data where samples were assigned positive- and negative, based on PCR versus randomized models. e Average spectra over the three spectral ranges used for PLS-DA classification. Superimposed is a colour code showing the regression loadings for malaria positive (“warm colours”) or negative (“cool colours”) classification for each absorbance value. This Figure is from an open access article published by Biomedical Central (BMC). [57].
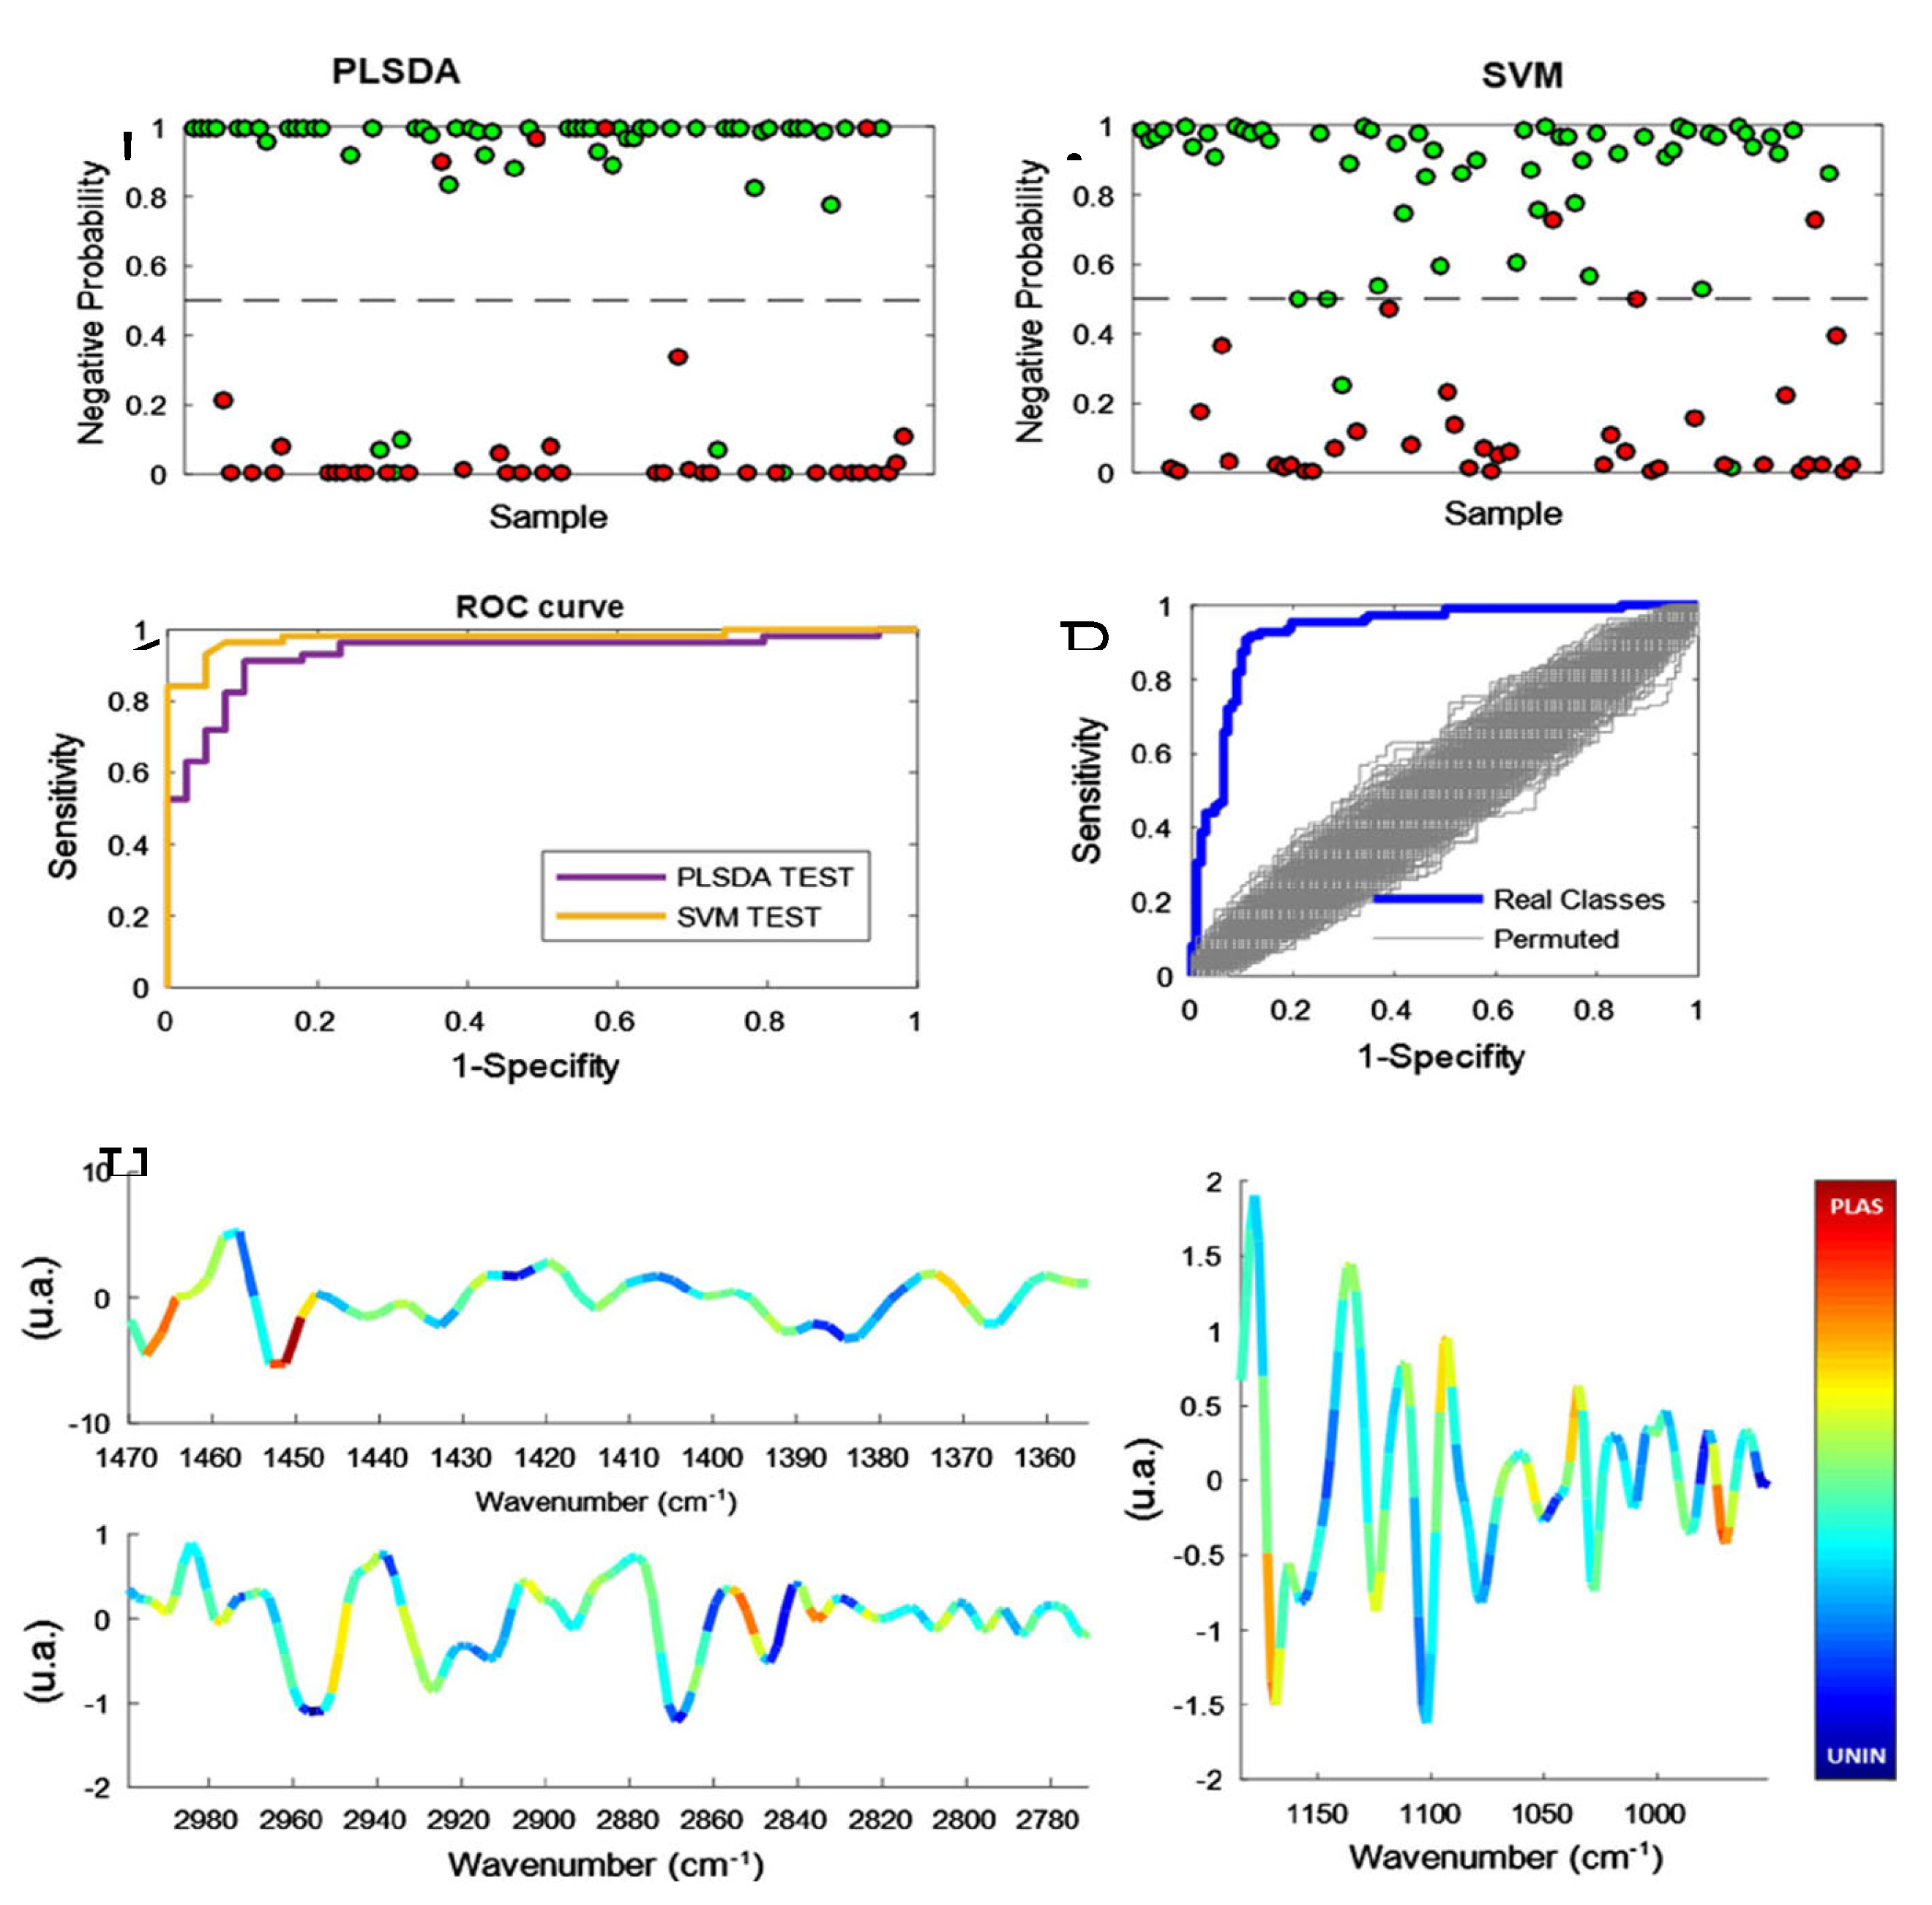
Table 1.
Summary of SERS based methods to detect malarial parasites.
| Mode of detection | sensitivity | Methods | Citation |
| SERS – AgNP | 500 parasites/ µL (0.01% parasitemia level) |
silver nanoparticles were synthesized separately and then mixed with lysed blood | [85] |
| SERS – AgNP | 2.5 parasites/ µL (0.00005% parasitemia level) |
silver nanoparticles were synthesized directly inside the parasites of P. falciparum | [85] |
| SERS - AgNP | 1 parasite | AgNPs were synthesized inside P. falciparum. Giemsa stain was used to identify single parasite. | [89] |
| SERS -AgNP | 125 parasites/ µL (0.0025 % parasitemia) |
SERS-active silver nanoparticles are synthesized on site near hemozoin on a chip platform | [85] |
Table 3.
Absorption bands of DNA and protein macromolecules in the ultraviolet-visible region. [133,134].
| Molecules | Absorption Bands (nm) |
| Protein Macromolecules (Amino acids) | |
| Tryptophan | 280 |
| Tyrosine | 275 |
| Phenylalanine | 258 |
| Haem group from RBCs | |
| Oxyhemoglobin | 416 |
| Oxyhemoglobin doublet | 540 |
| Oxyhemoglobin doublet | 575 |
| DNA nucleobases and chromophoric groups | |
| Guanine | 253 |
| Cytidine | 271 |
| Polymeric DNA and RNA | 260 |
Table 4.
Comparison of the classification performance of spectroscopy-based models in the studies of Heraud et al. [57] and Mwanga et al. [92].
| STUDY | SENSITIVITY | SPECIFICITY | CALIBRATION SET | VALIDATION SET |
| Heraud et al. , 2019 | 92 | 97 | Ntotal=232 Npositive=112 Nnegative=110 |
Ntotal=96 Npositive=39 Nnegatve=57 |
| Mwanga et al. , 2019 P. falciparum only |
92a | 93a | Ntotal=208 Npositive=86 Nnegative=122 |
Ntotal=52 Npositive=28 Nnegative=24 |
| Mwanga et al. , 2019 including P. falciparum and P. ovale mixed infection |
82b | 91b | Not Stated | Not stated |
1 For the study of Mwanga et al. the superscript a refers to modelling where only monospecific P. falciparum infections were included.; the superscript b refers to modelling where 9 samples with mixed P.falciparum/P. ovale infections were included in the modelling. In the study of Heraud et. al. samples with P. falciparum, P. vivax and mixed P. falciparum/P. vivax were used in the modelling (see text for breakdown of numbers).
Disclaimer/Publisher’s Note: The statements, opinions and data contained in all publications are solely those of the individual author(s) and contributor(s) and not of MDPI and/or the editor(s). MDPI and/or the editor(s) disclaim responsibility for any injury to people or property resulting from any ideas, methods, instructions or products referred to in the content. |
© 2024 by the authors. Licensee MDPI, Basel, Switzerland. This article is an open access article distributed under the terms and conditions of the Creative Commons Attribution (CC BY) license (http://creativecommons.org/licenses/by/4.0/).
Copyright: This open access article is published under a Creative Commons CC BY 4.0 license, which permit the free download, distribution, and reuse, provided that the author and preprint are cited in any reuse.


