Submitted:
02 October 2024
Posted:
03 October 2024
You are already at the latest version
Abstract
Hydrogen is a clean-burning fuel with water as its only by-product, yet its widespread adoption is hampered by logistical challenges. Liquid organic hydrogen carriers, such as alcohols from sustainable sources, can be converted to hydrogen through aqueous phase reforming (APR), a promising technology that bypasses the energy-intensive vaporization of feedstocks. However, the hydrothermal conditions of APR pose significant challenges to catalyst stability, which is crucial for its industrial deployment. This review focuses on the stability of catalysts in APR, particularly in sustaining hydrogen production over extended durations or multiple reaction cycles. Additionally, we explore the potential of ultrasound-assisted APR, where sonolysis enables hydrogen production without external heating. Although the technological readiness of ultrasound-assisted APR currently trails behind thermal APR, the development of catalysts optimized for ultrasound use may unlock new possibilities in the efficient hydrogen production from alcohols.
Keywords:
hydrogen
; aqueous phase reforming
; stability
; ultrasound
; alcohols
1. Introduction
Hydrogen, as a sustainable fuel, holds much promise as its combustion produces solely water, an environmentally benign product. However, it is well-documented that its key limitations for widespread uses include its low volumetric energy density due to its standard state being a gas, which is related to the logistic issues that are associated with transporting H2.
Alcohols that can be derived from biomass are promising candidates as liquid organic hydrogen carriers. Reforming of alcohols allow hydrogen to be produced by reacting the alcohols and water over a catalyst (Equation 1). While the majority of the world hydrogen is produced by steam reforming, the feedstock is natural gas which is considered as a non-renewable resource.1
Steam reforming (SR) is performed below the saturated vapor pressure of water-alcohol mixture, such that water is in its gaseous phase in the reactor. SR of alcohol such as methanol and ethanol are mature technologies that have been applied on an industrial scale.2 Nickel as a cost effective active metal in SR of alcohols such as methanol, ethanol and glycerol have been the focus of reviews.[3,4] Coke deposition is recognized as a main contributor to the deactivation of catalyst in SR, Sharma et al. has extensively discussed this in the context of ethanol SR.5 Achomo et al. provided a holistic review on methanol SR which touched on thermodynamic, kinetic, catalysts (mainly Cu and Pd-based), and reactor aspects.6 Yang et al. discusses the development of catalytic systems for methanol SR with a focus on energy-mass conversion, highlighting advancements in catalyst durability, carbon deposition resistance, and sintering resistance through material modification, additives, and structural optimization.7 Sorption enhanced steam reforming has been explored as a means to capture the CO2 formed during the reaction.[8,9,10] The reviews listed in this paragraph are by no means an exhaustive list of reviews on the SR of alcohols, the readers are referred to the citation in these reviews to find those that preceded or cited them.
The focus of this review will be on aqueous phase reforming (APR) of alcohols with heterogeneous catalysts. APR involves the use of pressure above the saturated vapor pressure of the liquid to keep it in its liquid phase during the reforming reaction. This has been applied both in heterogeneous and homogeneous catalysis.[11,12,13] The commonly cited advantages of APR include allowing the reaction to be performed at a much lower temperature, and less energy intensive relative to SR as there is no need to vaporize the reactants. The ability to use a lower temperature is realized with feedstock such as ethanol and glycerol which is generally performed at a much higher temperature in SR than APR.[3,4] For methanol, SR and APR reaction temperature is generally comparable. The omission of the requirement for feedstock vaporization in APR enables it to be highly versatile with regards to choice of feedstocks. Higher boiling points or non-volatile feedstocks such as sugars, polyols, cellulose and amino acids have been explored.[14,15] Complex aqueous mixture such as wastewater streams and glycerol from biodiesel production are sustainability relevant feedstock which APR can potentially find industrial applications. In addition, aqueous inorganic base can be used in APR to capture the CO2 formed in situ and modify the reaction profile.
The calculated saturated vapor pressure of model alcohols at common composition and temperature that are relevant to the APR reactions in this review is given in Table 1.[16,17] Three different temperatures, and two different weight percentage in water for each alcohol were considered. Due to the higher vapor pressure of methanol and ethanol, performing the APR at 250°C with high alcohol content will require a much higher pressure than ethylene glycol and glycerol. However, it is important to note that when a carrier gas is used, as in the case of a fixed-bed reactor, the relative feed rate between the gas and liquid will influence the amount of liquid present during the continuous flow operation. Similarly, in a batch reactor, the ratio of headspace volume to liquid volume will determine whether the saturated vapor pressure can be reached, affecting the distribution of feedstock between the vapor and liquid phases.
A catalyst’s stability over extended duration is highly relevant in an industry setting. One of the recommended metrics of stability for industry – catalyst consumption (kg-cat per tons-product) – 18 has an ideal value for catalyst consumption is less than 0.1, which implies in this case, that for 1 g of catalyst, 10 kg (or about 5 kilomoles) of H2 has to be produced. The hydrothermal condition which a catalyst is subjected to in APR poses high stress on its stability.19 Mechanisms for catalyst’s deactivation during a hydrothermal reaction are summarized in Figure 1, with the exception of poisoning most of them are of relevance to APR. For a detailed discussion, on these deactivation mechanisms, the reader is referred to the work of authoritative reviews in the literature.[20,21,22] and the references cited therein.
The objective of this review is to provide a semi-quantitative overview of stability in the aqueous phase reforming of alcohols. Since hydrogen production is the focus of this review, activity will be measured in units of mmol-H2/g-cat/h whenever possible, and stability will be defined as the ability of the catalyst to maintain the activity on stream (in a fixed bed reactor) or upon recycling (in a batch reactor).
To avoid complications arising from complex aqueous mixtures, we will focus our discussion on model alcohols such as methanol, ethanol, ethylene glycol, and glycerol (Figure 2), except when strong stability data is available. These feedstocks, except ethanol, are commonly used in literature when investigating the activity and stability of metals on a support. Among these model alcohols, glycerol is the most complex for aqueous phase reforming (APR); theoretically, it can produce seven molecules of hydrogen per molecule of glycerol. However, catalysts and reaction conditions determine the experimental distribution of the various products listed in Figure 2. Methanol and ethylene glycol can theoretically produce three and five molecules of hydrogen per molecule, respectively. Ethanol, the least reported feedstock for APR, can produce only two molecules of hydrogen per molecule, as the methane formed cannot be reformed under APR reaction conditions.
The water-gas shift (WGS) reaction (Figure 2) is generally accepted as the process that generates CO2 and hydrogen from CO and water in APR. The WGS reaction becomes thermodynamically more favourable as the temperature decreases.[23] It removes CO during the aqueous phase reforming (APR), resulting in a very low level of CO in the gaseous product. This is one of the advantages of APR, as the low level of CO, together with high pressure, make the effluent amenable to further purification for fuel cell applications.[24] However, the reduction of CO or CO2 to methane can negatively impact hydrogen production. These side reactions become significant when metals such as Ni, Co, Ru, and Fe, which are highly active in methanation, are present, leading to the formation of a significant amount of CH4.[25]
The Dumesic group, pioneers in aqueous phase reforming (APR), extensively reported on the APR of glycerol. Their review discussed APR from the perspectives of thermodynamics and kinetics.[14] Due to the promising nature of APR for hydrogen production, numerous reviews have been published over the years, each offering a different approach. Chen et al. reviewed APR focusing on biomass-derived alcohols and emphasized on Pt and Ni-based catalysts.[26] Coronado et al. extensively reviewed the catalytic APR of oxygenated hydrocarbons from biorefinery water fractions, highlighting Pt-based and Ni-based catalysts, operational challenges, and optimization strategies for hydrogen production efficiency.[27] Review from Vaidya and Lopez-Sanchez emphasized on recent advances in catalyst development and the potential for efficient hydrogen production with reduced CO levels.[28] Pipitone et al. conducted a comprehensive review of catalysts in APR from 2014-2020, providing crucial information on how various parameters in catalyst synthesis influence APR outcomes.[29] Azizan et al. addressed challenges in catalyst design and reactor engineering that must be overcome to make APR an industrially relevant process.[30] Tian et al. discussed APR through different classes of feedstocks that can be derived from biomass.[31] Lastly, Joshi and Vaidya discussed advances in catalyst design, reactor engineering, thermodynamics, and kinetics of APR, as well as the coupling of different processes to APR, and provided various relevant techno-economic and life-cycle analysis examples.[15] These reviews collectively offer a detailed overview of the current state and future perspectives in APR technology, serving as valuable references for researchers and practitioners in the field.
In addition to the relatively well-studied thermal aqueous phase reforming, the use of ultrasound has emerged as an activation method to achieve ambient condition reforming of alcohols. Ultrasound induces acoustic cavitation, involving the formation, growth, and collapse of gas bubbles. This process can create localized environments with extreme temperatures and pressures that last for sub-microsecond durations. Consequently, the reactions that occur are typically non-equilibrium and strongly depend on the gaseous content present during acoustic cavitation. More details will be provided in Section 2.7.
2. Discussion
Our discussion on thermal aqueous phase reforming (APR) of alcohols will be organized by supports that are used in the APR catalysts. Under conditions relevant to aqueous phase reforming, the choice of support for a heterogeneous catalyst is rather limited (Figure 3). Carbon-based materials, ZrO2, and TiO2 are among those with excellent hydrothermal stability.[32] In contrast, silica- and alumina-based supports are best avoided due to their limited hydrothermal stability. Commonly cited mechanisms of deactivation in APR includes leaching of active metals, sintering, support phase transition and carbon deposition.
Pertinent to our discussion on support, Dumesic and co-workers evaluated platinum supported on a wide range of materials, including Al2O3, carbon, CeO2, SiO2, SiO2-Al2O3, TiO2, and ZnO.[33] They observed that supports like SiO2 and CeO2 tend to dissolve or disintegrate in the reforming environment, making them less suitable for prolonged use. This was evidenced by the detection of Si and Ce traces in the reactor effluent from the Pt/SiO2 and Pt/CeO2 catalysts, respectively, after only 6 hours on stream at 210°C (483 K), as analyzed by Inductively Coupled Plasma Atomic Absorption Spectroscopy (ICP-AAS).
In contrast, Al2O3 demonstrated superior resistance to leaching, with less than 1 ppm of Al found after 24 hours on stream at 225°C (498 K), indicating a lower rate of dissolution compared to SiO2. However, alumina is known to undergo phase transformation in a hydrothermal environment. It was reported that, at 200°C, γ-Al2O3 undergoes a phase transition to hydrated boehmite in 10 hours,[34,35] resulting in significant losses of surface area and Lewis acidic sites
2.1. Al2O3 as Support
2.1.1. Al2O3 Supported Catalysts
Given the amble precedent of γ-Al2O3 as a support for steam reforming of methanol and ethanol, the use of γ-Al2O3 in aqueous phase reforming (APR) of alcohols is equally prominently featured. γ-Al2O3 supported Pt and Ni have been tested as catalysts by various groups, often as catalysts to benchmark the performances of catalysts developed by these groups. The APR of methanol resulted in gaseous products that usually comprises of CO2, CH4, CO and H2, as such it is common for the researchers to report the specific hydrogen production rate. The performance of various Al2O3 supported Pt, Ni and Cu catalysts in APR of methanol is given in Table 2.
In one of the seminal works on the aqueous phase reforming of oxygenated hydrocarbons, Cortright and Dumesic reported the use of Al2O3 nanofibers supported Pt-based catalysts.[36] Methanol was amongst the oxygenated hydrocarbons tested. Impressively, they reported that the catalyst is stable on stream of at least a week with 24 hours averaged specific hydrogen production rate of 40 mmol-H2/g-cat/h (Table 2, Entry 1). Li et al. demonstrated that Pt/Al2O3 is stable, in terms of hydrogen production rate, for 20 hours on stream (Entry 2). The performance of Pt/Al2O3 in batch reactors are generally reported to be much higher than those performed in a flow reactor (Entry 3 and 4 vs. 1 and 2). However, Pt/Al2O3 was found to have exceptionally low activity when the APR of methanol was performed in the presence of NaOH (Entry 5).[37] This could be due to the inherent instability of Al2O3 under strongly basic hydrothermal conditions.[38]
Catalyst deactivation is ubiquitous in the APR of oxygenated hydrocarbons, especially for Ni and Co based catalysts, and it still poses significant challenges for achieving industrial application of APR. Wen et al. reported the stability of various transition metals supported on Al2O3 in the APR of glycerol by measuring the specific rate of hydrogen production on stream for up to 4 hours (Figure 4).[42] Pt/Al2O3 was found to be the most active and the most stable catalyst, followed by Cu/Al2O3 which shows about 20% drop-in activity over the 4 hours on stream. The least stable catalysts are nickel and cobalt support on Al2O3. Characterization of the spent catalysts revealed the loss of active sites as the cause for the loss of activity in Ni and Co catalysts. They attributed this to the crystallization of support, sintering of the metal particles and carbon deposition which occurs throughout the course of the reaction.
In another detailed study, Doukkali et al. examined spent γ-Al2O3 supported Ni, Pt, and Ni-Pt catalysts and revealed significant changes in the textural properties of the catalysts after the APR of glycerol.[43] The authors attributed the deactivation primarily to the formation of the boehmite phase (γ-AlOOH) from the support. This resulted in unfavourable changes in textural properties, such as surface area, porosity, and metal dispersion. The leaching of active metals was found to play an insignificant role in the deactivation process. However, the authors noted that catalysts synthesized via incipient wetness impregnation exhibited greater resistance to deactivation compared to those prepared by the sol-gel method, despite the latter showing higher initial glycerol conversion and gas conversion rates.[44] They ascribed this to the stability of the support due to its preparation method. Thus, modifying Al2O3 is an avenue explored by various research groups to prepare durable catalysts for the APR of alcohols.
This concept was exemplified in the work of Liu et al., who reported that incorporating ZnO into a series of Ni-xCu/Al2O3 catalysts (where x denotes the weight percentage of Cu) greatly improved the catalysts' stability in methanol APR.[45] The bimetallic Ni and Cu catalysts demonstrated improved performance compared to both Ni/Al2O3 and Cu/Al2O3 (Table 3, Entry 1 and 2 vs. 3 and 4). Additionally, the methane production ratio was drastically reduced from 7.3% to 0.35% compared to Ni/Al2O3. As for stability, the control catalyst Ni-8Cu/Al2O3 exhibited an activity loss of about 75% after a 72-hour stability test, while that of ZnO-Ni-8Cu/Al2O3 was only 35% over the same duration (Entry 1 vs. 2). The presence of ZnO improves catalyst stability by inhibiting the phase transformation of the support to the boehmite phase. X-ray photoelectron spectroscopy (XPS) analysis indicated that there were no significant changes in the oxidation states of the surface Ni and Cu particles and no carbon deposition on the spent catalysts' surface.
Kalekar and Vaidya reported the APR of glycerol, sorbitol and xylitol catalyzed by Ru/Al2O3.[46] The catalyst has moderate activities of 2.5-3.5 mmol-H2/g-cat/h at 225°C. Textural properties of the spent catalyst remained similar to the fresh catalysts (see footnotes e in Table 3). Specific surface area decreased to 195 m2/g, pore volume decreased to 0.61 cm3/g and mean pore diameter decreased to 12 nm. However, the catalysts experienced a 18-24% loss in activity after 28 h time on stream.
2.1.2. Catalysts Supported on Modified Alumina and Hydrotalcite Related
γ-Al2O3 is known to be undergone chemical weathering under hydrothermal condition to form crystalline boehmite (γ-AlOOH) which can adversely affect its textural properties.[47,48] Inorganic dopants such as cations of Mg, Zr and Ni have been shown to improve the resistance of modified alumina to chemical weathering.[49] In this section, we will discuss some examples of modified alumina as supports for the aqueous phase reforming of alcohols.
Modified alumina, such as cobalt aluminate and nickel aluminate, are reported as supports or catalysts for the aqueous phase reforming (APR) of methanol and glycerol. Cobalt aluminate (Co[x]Al[y], where x and y indicate the relative amount of Co or Al) is notable for its hydrophobic nature, low surface acidity, and exceptional thermal, mechanical, and pH stability,[50] making it a logical choice as a support for catalysts in the APR of alcohols. Additionally, spinel mixed metal oxides like NiAl2O4 are recognized for enhancing the stability of catalysts under hydrothermal conditions.[51,52]
Reynoso et al. have conducted extensive studies on using cobalt aluminate as catalysts or as a support for Pt in the aqueous phase reforming (APR) of glycerol. While cobalt aluminate reduced at 600°C (0.625CoAl-600) is active in the APR of glycerol, its stability under these conditions is found to be insufficient, with a 48% reduction in the hydrogen production rate after 30 hours on stream (Table 4, Entry 1).[53] However, Pt supported on 0.625CoAl, prepared by wet impregnation, remains stable on stream for 100 hours (Entry 2).[54] It is important to note that this stability test was conducted under a very low flow rate (WHSV = 0.68 h-1), thereby resulting in a very low hydrogen production rate. In a separate study, they also examined the effects of various process parameters on glycerol APR using 0.3 wt.% Pt/0.625CoAl.[55] They found that while decreasing contact time by increasing WHSV resulted in a higher H2 production rate (Entry 3), but overall conversion of glycerol to gases decreases.
Deactivation of cobalt aluminate during APR of glycerol is investigated by extensive characterization of the spent catalyst.[53] Reynoso et al. reported that the specific surface area and pore volume of the spent catalysts notably increased after use, while the average pore size decreased. This increase in specific surface area was more pronounced in samples with a lower Co/Al ratio, suggesting involvement of aluminum-based compounds. X-ray diffraction (XRD) analysis showed that FCC metallic cobalt was present in all spent catalysts, and sintering increased the cobalt crystallite size, particularly in Co3O4 samples. H2-TPR analysis indicated re-oxidation of cobalt during the APR process, which contributed to the catalyst deactivation. The formation of CoO and gibbsite was also observed, indicating strong oxidizing conditions. Additionally, Raman spectroscopy revealed the presence of both defect/amorphous and graphitic carbon on the catalyst surfaces, with a higher proportion of graphitic carbon, which is associated with deactivation.
Lv et al. reported the aqueous phase reforming (APR) of methanol using cobalt aluminate-supported Pt catalysts.[41] They emphasized the development of a series of Pt/Co_xAl (x = Co/Al ratio) catalysts derived from calcined layered double hydroxides. The study found that the catalysts' performance strongly depends on the Co/Al ratio and the calcination temperature. Notably, the Pt/Co_2Al catalyst calcined at 700°C (Co_2Al-c700) exhibited exceptional activity and low CO selectivity (Table 4, Entry 4). The interactions between Pt and the support, coupled with abundant oxygen vacancies, were proposed to enhance catalytic performance. Furthermore, they revealed that both Pt and metallic Co are active in methanol decomposition, while water activation on the support facilitates the conversion of intermediate formate species into CO2 and H2. The stability of the optimal catalyst was evaluated through ten recycling rounds, during which they observed a decrease in the hydrogen production rate by about 9%, but negligible changes in CO selectivity. Through detailed XPS analysis they found that the amount of surface Co0 and Co2+ increases after ten cycles, while the amount of Co3+ on the surface decreased from 27.7% to 19.3%. In addition, increased in adsorbed oxygen species and possibility oxygen vacancies were observed. Leaching of Pt was not observed, while ppm level of Co and Al were found in the liquid after ten cycles.
2.1.3. Nickel Aluminate
Morales-Marín et al. reported the use of Nickel Aluminate as catalysts for the APR of glycerol.56 They found that catalysts synthesized by reducing the calcined Nickel aluminate at 700°C or 850°C gave the best performance. The glycerol conversion and NiAl2O4 reduced at 850°C were found to decrease by 47% after 50 hours on stream. Hydrogen yield, however, remained more stable throughout the 50 hour on stream. The loss in specific hydrogen production rate is approximately 12 and 13%, respectively. (Table 5, Entry 1) Characterization of the spent catalyst revealed that with increasing time on stream (TOS), the Ni particle sizes increased (fresh: 11.6 nm, 2 h: 41.5 nm, 50 h: 44.1 nm). Similarly, leaching of Ni increased with increasing TOS (2 h: 0.19%, 50 h: 5.4%). They observed a drastic decrease in exposed Ni area after two hours TOS, from 3.47 m2/g in the fresh catalyst to 0.23 m2/g in the spent catalyst. They postulated that this is due to the formation of core-shell particles under the APR condition.43
Li et al. reported the application of Pt on NiAl2O4 in the APR of methanol (Table 5, Entry 2).39 The catalyst was found to lose about 10% of methanol conversion to gas after 600 hours time on stream. This work probably represents the longest on-stream test reported in APR thus far. We note that information on the gases selectivity was absent thus it is difficult to assess if hydrogen selectivity remained the same after 600 hours on stream. Characterization of the spent catalysts by XRD revealed the formation of NiO, and TGA analysis show that additional 3% by weight in materials on the catalysts that can be lost when heated.
2.1.4. SiO2-Al2O3
SiO2 as a support has limited hydrothermal stability due to its dissolution at elevated temperatures and changes in textural properties.[35,57] However, it was found that the addition of aluminium improves the hydrothermal stability of the silica-based material. This finding is reflected in the APR reaction discussed below.
Dumesic and co-workers reported that 0.75 wt.% Pt/SiO2 lost more than 20% of its activity in the APR of ethylene glycol over 24 hours.33 However, they noted that 0.79 wt.% Pt/SiO2-Al2O3 did not experience the same issue. In their report, 0.79 wt.% Pt/SiO2-Al2O3 has a much higher H2 TOF of 4.6 min-1 compared to 0.75 wt.% Pt/SiO2, which is at 0.7 min-1. Although it is lower than Pt/Al2O3 (H2 TOF of 7 min-1) under the same reaction condition.
Wen et al. reported that a 5.1 wt.% Pt/HUSY (SiO2/Al2O3 = 4.8) catalyst shows no observable deactivation in the aqueous-phase reforming (APR) of glycerol for about 4 hours on stream (Figure 5).42 The average hydrogen production rate over this 4-hour period is 19.7 ± 1.7 mmol-H2/g-cat/h. Additionally, Pt/HUSY maintained a higher metal surface area of 13.3 m²/g in the spent catalyst compared to 0.4 m²/g in Pt/SiO2 and 7.2 m²/g in Pt/Al2O3 after the glycerol APR.
The use of commercially available 65 wt.% Ni/SiO2-Al2O3 in the APR of glycerol from biodiesel waste is reported by Seretis and Tsiakaras.59 However, no information on stability is available.
2.2. CeO2 as Support
2.2.1. CeO2 Supported Catalysts
CeO2 possesses oxygen vacancies that can be tuned via the preparation method. These oxygen vacancies can enhance the dispersion of noble metals through strong metal-support interactions and facilitate the water-gas shift reaction, which is responsible for generating hydrogen from the CO formed in APR. However, CeO2-supported Ni or Pt-based catalysts are generally not reported to have high stability under hydrothermal conditions. Early work by Dumesic and co-workers on APR of ethylene glycol highlights the potential for dissolution of CeO2 over extended periods under APR condition. They found that Pt/CeO2 not only exhibited low H2 turnover frequency but it also experienced significant deactivation with more than 20% loss in activity over 24 hours.33 Ciftci et al. reported similar findings for APR of glycerol with 2.7 wt.%Pt/CeO2.60
Wu et al. reported the APR of glycerol, which is directly derived from biodiesel byproducts, using mesoporous Ni-Cu/CeO2 catalysts for hydrogen production.61 The inclusion of copper in the catalysts enhances the water-gas shift reaction and suppresses methane formation, thereby improving hydrogen yield by reducing the amount of CO formed from 6.1% to 2.7%, and methane from 1.4% to 0.12% (Table 6, Entry 1 and 2). Additionally, the study suggests that adding CaO helps to adsorb the CO2 formed, further reducing the amount of CO formed to 0.61% (Entry 3). The research also examines the impact of reaction temperature and CaO addition on APR performance, revealing that higher temperatures increase hydrogen production but do not affect selectivity. The catalysts demonstrated stable performance over 50 cycles, showing only about a 14% reduction in their initial hydrogen production rate. CO2 and CO contents of the gaseous product increases with the loss of H2 production rate. This stability underscores their potential for sustainable hydrogen production from biodiesel byproducts.
Lu et al. reported three ceria catalysts prepared via a photochemical reduction method.62 They suggested that this method prevents the aggregation and migration of active metal particles that typically occur during thermal reduction at high temperatures, thus ensuring a high dispersion of the active metals. The lanthanum-modified catalyst - PtLa/CeO2 - exhibited both a higher initial hydrogen production rate and greater stability compared to Pt/CeO2-HT, which is hydrothermally prepared CeO2. Notably, the latter demonstrated an 87% reduction in hydrogen production rate after five cycles (Table 7, Entry 1 vs. 2). The authors observed that Pt/CeO2-HT underwent unfavourable morphological changes leading to significant leaching of Pt, a process they attributed to catalyst deactivation during the recycling experiments. They credited the stability of PtLa/CeO2 to lanthanum's role in reducing Pt leaching through stronger metal-support interactions, and to the increase in oxygen vacancies that accelerates CO removal from the CeO2 surface. Without these modifications, CO would likely lead to the formation of carbonates of cerium, compromising the structural integrity of the support.
2.2.2. Low Temperature Aqueous reforming (<150°C)
Proton Exchange membrane (PEM) fuel cell operates at temperatures of 80-90°C, as such it will be advantageous for the aqueous phase reforming (APR) of alcohols to produce hydrogen at similar operating temperature of the fuel cell.[63] As it enhances the overall system efficiency by minimizing the energy losses associated with cooling or heating the hydrogen stream to match the fuel cell's operating temperature. This thermal compatibility reduces the complexity and cost of system design, making the integration more straightforward and efficient. In addition, operating at similar temperatures allows for better thermal management within the fuel cell system, which is crucial for maintaining optimal performance and longevity of the fuel cells. It also reduces the risk of thermal gradients that could potentially damage the fuel cell components.
Homogeneous catalysts, such as the Ruthenium complex reported by Beller and co-workers, are highly active and can produce hydrogen at a turnover frequency of 2670 h⁻¹ at 90°C in the presence of a strong base or caustic aqueous phase reforming.[64] Pt supported on a tailor-made CeO2 support has demonstrated similar efficiency in proof-of-concept studies. However, heterogeneous catalysts offer the advantage of easier separation from reaction mixtures compared to homogeneous catalysts, making them more practical for industrial applications. In this section, we will focus on studies that utilized CeO2 as a support to demonstrate the feasibility of low-temperature APR of methanol with heterogeneous catalysts.
Zhang et al. developed a catalyst for the APR of methanol, employing a novel approach by combining Pt single-atoms with frustrated Lewis pairs (FLPs) on a porous nanorod CeO2 support (Pt1/PN-CeO2).[65] This dual-active site strategy enables efficient hydrogen production from methanol at a low temperature of 135°C while significantly reducing the formation of carbon monoxide by-products. Despite the Pt1/PN-CeO2 catalyst achieving a modest hydrogen production rate of 3.7 mmol-H2/g-cat/h at 135°C (Table 8, Entry 1), it shows a significant improvement over Pt on Al2O3, TiO2, and carbon supports, which produced hydrogen at a negligible rate (0.02-0.1 mmol-H2/g-cat/h) at the same temperature (Entry 2-4). However, despite the low reaction temperature, the catalyst experienced a 20% reduction in hydrogen production rate after 10 one-hour cycles. However, the CO levels were consistently maintained below 0.03%. This decline in activity was attributed by the authors to the mobility of peripheral Pt atoms, which led to the sintering of the Pt active sites.
In contrast, Chen et al. reported on a Pt1/PN-CeO2 catalyst,[66] synthesized using a modified ascorbic acid-assisted reduction route.[67] This catalyst demonstrated stability (measured by methanol conversion) for at least 110 hours on stream at 300°C, despite an initial decrease in activity attributed to the leaching of Pt. However, since the reaction was conducted at an initial pressure of 1 atm, the reactants' phase deviates from that typically observed in aqueous phase reforming (APR) and is therefore not included in our tabulation.
Guo et al. presents a significant advancement in hydrogen generation from aqueous-phase reforming of methanol (APRM) with KOH at low temperatures.[68] By increasing the loading of Pt nanoparticles from 0.36 wt.% to 1 wt.% and utilizing porous nanorods of CeO2 with abundant oxygen vacancies as support (Pt/PN-CeO2), the study achieves efficient hydrogen production at 90°C, with an impressive rate of 73.4 mmol-H2/g-cat/h (Table 8, Entry 5). The presence of oxygen vacancies not only enhances the electronic density of the supported Pt nanoparticles, facilitating methanol activation, but also promotes water activation. The efficacy of this approach was further demonstrated by performing the APR of methanol at 60°C, where hydrogen production continued at a rate of 2.8 mmol-H2/g-cat/h. Remarkably, at this low temperature, no CO formation was detected. Despite the reduced reaction temperature of 60°C, a 22% decrease in the specific hydrogen production rate was observed.
2.3. ZrO2 as Support
2.3.1. ZrO2 Supported Catalysts
Goplan reported that ZrO2 membranes show the most resilient to hydrothermal induced sintering amongst the ceramic tested.[69] However, both tetragonal and monoclinic ZrO2 were both reported to lose surface area when subjected to hydrothermal reaction at 250°C for 10 h.[70] This low specific surface area could affect the performance of a heterogeneous catalyst.[71]
Amongst the catalysts studied in the APR of methanol, Strekrova et al. reported that 9.4 wt.% Ni/ZrO2 demonstrated a respectable 60 mmol-H2/g-cat/h under continuous flow operation (Table 9, Entry 1).[72] They reported a 18% loss in specific hydrogen production rate, together with increased in CO selectivity, after 12 h TOS. Minimal changes in textural properties were observed in the spent catalysts, but there was significant sintering in the spent catalyst – the particle sizes from 12.7 nm in NiO of the fresh catalyst to 47.6 nm in Ni of the spent catalysts. They explored various mixed oxides of La, Ce and Zr to further improve the activity and stability of the approximately 10 wt.% Nickel based catalysts which will be discussed in the next section.
Contreras et al. studied three catalysts with Mo2C supported on ZrO2 for the APR of ethanol.[73] They found that the optimal catalyst is the one with β-Mo2C supported on monoclinic ZrO2 or m-ZrO2. The other two catalysts: β-Mo2C/t-ZrO2 and α-MoC/m-ZrO2, displayed very low selectivity towards H2. Nevertheless, their optimal catalysts lost 41% of its initial activity after four cycles of ethanol APR (Table 9, Entry 2). XPS revealed no significant changed in textual properties between the fresh and spent catalysts. However, the distribution of Mo/Zr and Mo/C exhibited significant changes. They attributed the deactivation to the disappearance of oxycarbide species on the catalyst’s surface after the reaction as observed from the XPS spectrum of the spent catalysts.
2.3.2. Mixed oxides of ZrO2
Given the potential hydrothermal instability of CeO2 as a support due to its deactivation via the formation of CeCo3OH,[74] various groups have tried to rectify this by combining various oxides with the goal of obtaining a more stable aqueous phase reforming catalyst (APR).
Larimi et al. reported on the APR of glycerol using Pt0.05CexZr0.95-XO2 ternary solid solution catalysts, with a focus on the influence of the cerium/zirconium ratio on catalyst performance.[75] The Pt0.05Ce0.475Zr0.475O2 catalyst achieved optimal performance, showing the highest glycerol conversion (99.8%), carbon to gas conversion (95%), hydrogen yield (93%), and selectivity for hydrogen (98%). This enhanced performance is attributed to factors such as the Pt oxidation state, active metal dispersion, surface area, and particle size, all of which are governed by the Ce to Zr ratio. Significantly, this catalyst also demonstrated remarkable stability, maintaining a high activity rate of 91 mmol-H2/g-cat/h for at least 50 hours of continuous operation without deactivation (Table 10, Entry 1). In addition, the Pt0.05Ce0.475Zr0.475O2 was found to demonstrate the same stability profile at various weighted hour space velocities (0.12h-1 to 3.6h-1). The spent catalysts do not manifest any sintering of Pt nanoparticles as their sizes remain about 5.3 nm in both the fresh and spent catalysts. Detailed XPS analysis suggested that incorporating Pt into the ceria-zirconia matrix prevents Pt segregation under APR conditions.
Strekrov et al. reported on the APR of methanol using nickel-supported catalysts on mixed oxide supports, specifically zirconium, cerium, and lanthanum oxides, to the hydrogen production efficiency and stability.[72] Their study reveals that nickel catalysts supported on combinations of cerium and zirconium oxides exhibited superior performance compared to those supported solely on CeO2 or ZrO2. Among the tested catalysts, the 9.3 wt.% Ni/25Ce-Zr catalyst was the most active, achieving a hydrogen production rate of 151 mmol/g-cat/h (Table 10, Entry 3). Further improvements in stability were observed when lanthanum was incorporated into the support. The most stable catalyst, containing 9 wt.% Ni/10La-Zr, experienced only an 8% loss in hydrogen production rate after 12 hours of time on stream (TOS), recording a rate of 118 mmol-H2/g-cat/h (Table 10, Entry 4). The authors attributed this activity loss primarily to the sintering of Ni particles. It is important to note, however, that the comparison was made between NiO particles in the fresh catalysts and Ni in the spent catalysts. The support metal particles remained virtually unchanged after 12 hours TOS. Leaching of Ni for Ni/25Ce-ZrO2 and Ni/10La-ZrO2 were almost negligible while Ni/17Ce-5La-ZrO2 lost about 0.8% of its Ni content after 12 hours on stream.
Bastan et al. studied on the aqueous phase reforming (APR) of glycerol, with a focus on producing alkanes using various 10 wt.% Ni/CeXZr1-xO2 catalysts synthesized by coprecipitation.[76] In contrast to the nickel catalyst supported on Ce0.25-Zr0.75O2, which was synthesized by incipient wetness impregnation of the support, their 10 wt.% Ni/Ce0.3Zr0.7O2 catalysts maintained alkane selectivity over six cycles of 25 hours each. However, since the impact of time on stream on hydrogen production rate was not discussed—given it was not the focus of their work—a direct comparison of stability is not feasible.
2.4. Other Oxides
2.4.1. TiO2 Related
TiO2 is the only common oxide that is predicted to be hydrothermally stable over a large pH window at 200°C.[21] However, its application as a support in aqueous phase reforming (APR) of alcohols are relevantly scant.
In the APR of ethylene glycol reported by Shabaker et al., Pt/TiO2 was found to have superior turnover frequency compared to common supports such as SiO2, ZrO2, SiO2-Al2O3, Al2O3, ZnO and carbon.[33] They commented that no significant loss in activity was observed after 24 hour on stream. However, they noted the potential for TiO2 to degrade via sintering and phase transformation will result in a loss of surface area. We note that the work of Lin et al. was cited.[69] This work explored the hydrothermal stability of at temperatures of beyond 450°C and at one atmospheric pressure, thus it might have limited relevance to APR of alcohols. In the work of Ellilott et al., rutile phase TiO2 was shown to demonstrate good hydrothermal stability and low coke formation.[77]
Detailed studies on the stability of TiO2 as a support for the aqueous phase reforming (APR) of alcohols are scarce. Lin et al. reported the APR of methanol catalyzed by Pt/TiO2 and Ni/TiO2 at 190°C and 240°C, respectively.[40,78] Pt/TiO2 exhibited a modest specific hydrogen production rate of 15 mmol-H2/g-cat/h and produced a very low amount of CO (0.02 mol% of the H2 produced).[13] In contrast, Ni/TiO2 achieved a decent specific hydrogen production rate of 21 mmol-H2/g-cat/h but suffered from high selectivity to CO (16.6 mol% of the H2 produced).[46] Since these catalysts were not the primary focus of their studies, the authors did not explore their stability.
Nozawa et al. investigated various noble metals supported on P25 TiO2 in the APR of ethanol, with selected results compiled in Figure 6.[79,80] For monometallic catalysts, Rh/TiO2 was found to be the most active catalyst in the APR of ethanol, although it produced a large amount of CH4 (33 mol. %). The activity of Rh/TiO2 could be further improved by adding an equimolar amount of Re, but the amount of CH4 in the gaseous product remained high (32 mol. %). Ir-Re/TiO2, while slightly less active in terms of hydrogen production rate, produced significantly less CH4 (5.8 mol. %). However, as these results were obtained in a batch reactor without recycling the spent catalysts, extracting reliable stability information is challenging.
Zhao et al. reported Pt and Ru supported on TiO2 as catalysts for the APR of ethanol.[81] The APR reactions were performed in a batch reactor. They found that at low Ru loading of 0.5 wt.% the selectivity of ethanol APR towards CH4 decreases significantly. The optimal catalyst was reported to be 1 wt.% Ru – 2 wt.% Pt/TiO2 with a hydrogen production rate of 294 mmol-H2/g-cat/h for the freshly reduced catalyst. The purity of hydrogen is about 65% with 13.4 mol.% CO2 and 17.7 mol.% CH4. CO was not detected by the authors. Stability in terms of hydrogen production rate cannot be extracted, but there is a notable decrease in ethanol conversion for one of the reported catalysts after 1 h.
Cifti et al. reported bimetallic Pt and Re supported on TiO2 in the APR of glycerol.[60] The bimetallic Pt-Re/TiO2 has a turnover frequency of 345 h-1 which is 2.3 times that of Pt/TiO2. However, Pt-Re/TiO2 seems to be less selective towards H2. They observed a decrease in H2 to CO2 ratio over the course of 380 minutes.
2.4.2. MgO Hypotalcite and Related Support
Hypotalcites or double layered hydroxide generally consists of a divalent cation (Mg2+, Mn2+, Fe2+, Cu2+, Zn2+, Ca2+), a trivalent cation (Al3+, Fe3+, Ga3+) balanced by anions such as chloride or carbonate.[82] These have been extensively studied in steam reforming to capture CO2 reversibly, or sorption enhanced steam reforming (SESR).[8,10] In steam reforming of ethanol and glycerol, the group of Vaidya have reported the use of hypotalcites-related support to achieve low selectivity for CO.[83,84,85]
Huang et al. reported the aqueous phase reforming (APR) of methanol over La-promoted Ni-based hydrotalcite catalysts to produce hydrogen.[86] La-promoted hydrotalcite catalyst, 5La-NiMgAl, exhibited a superior APR reactivity compared to the unpromoted one (0La-NiMgAl). The 5La-NiMgAl catalyst exhibited remarkable stability, retaining 80% of its activity, while 0La-NiMgAl retained only 28% over the same period, as shown in Table 11 (Entry 1 vs. 2).
The authors attributed this increased stability to two main factors. First, there was a 12% reduction in nickel leaching in the 5La-NiMgAl compared to the La-NiMgAl, resulting in more catalytically active metal remaining in the catalyst. Second, there was an increase in the concentration of medium-strength basic sites (refer to Table 11, Footnotes b and c), due to the introduction of La. This is critical in maintaining the structural integrity of the catalyst by forming LaCO3OH, which adsorbs CO2 and prevents the structural breakdown of the catalyst during the reaction process.
Manfro et al. synthesized a series of Ni-Cu hydrotalcite-like catalysts for the APR of glycerol.[87] They found that Ni5Cu (Table 11, Entry 3) demonstrated an enhanced rate of hydrogen production compared to the NiMg catalyst (Entry 4). Specifically, Ni5Cu achieved a hydrogen production rate of 10 mmol-H2/g-cat/h, although this rate is considered modest given that the reaction was performed at 250°C (Entry 3 vs. 4). The introduction of Cu resulted in a drastic decrease in Ni particle size sizes (refer to Table 11, Footnotes e and f). However, the authors revealed an increase in the size of nickel particles in both the NiMg and Ni5CuMg catalysts after 6 hours of time on stream (TOS) compared to their freshly reduced counterparts, but no deactivation of the catalysts was observed after 6 hours of time on TOS.
Cruz et al. reported the APR of ethanol using nickel catalysts derived from hydrotalcite precursors (Ni, Mg and Al).[88] The study highlights the preparation of these catalysts with varying nickel content and their substantial activities and selectivities in hydrogen production. The optimal catalyst 20NiHTC consists of 16.5 wt.% NiO, 51.3 wt.% MgO, and 21 wt.% Al2O3. It achieves an ethanol conversion of 70%, hydrogen selectivity of 78% and less than 1% CO at 230°C. The authors reported a BET specific surface area of 286 m2/g, pore volume of 0.694 cm3/g, and Ni particle size of 8nm for this catalyst. However, we did not include this in Table 11 due to difficulty in obtaining hydrogen production rate and stability.
2.5. Carbon Supported Catalysts
It has been advocated by several groups that common support such as SiO2 and CeO2 potentially dissolves or degrades under hypothermal condition.[89] Dusmesic suggested that due to the hydrophobic nature of carbon, it might demonstrate hydrothermal stability. This point is echoed by Wang and co-workers which investigated the APR of glycerol using Pt-Re/AC catalysts.[90]
2.5.1. Activated Carbon
Pt supported on activated carbon (AC) generally has low activity in the APR of alcohols. However, Shabaker et al. reported that Pt supported on Norit® SX 1G exhibited similar performance to Pt/TiO2 and Pt/Al2O3 in the APR of ethylene glycol.[33]
Various Pt/AC catalysts have demonstrated stability for 4-25 hours on stream, as reported by different research groups. For example, Wen et al. reported that a 4.2% Pt/AC catalyst achieved a hydrogen production rate of 18 mmol-H2/g-cat/h during a 4-hour run at 230°C in the APR of glycerol (Table 12, Entry 1).[42] Additionally, Kim's group found that a 7 wt.% Pt/AC catalyst remained stable for 25 hours on stream and exhibited an activity of 38 mmol-H2/g-cat/h at 250°C for the APR of ethylene glycol (Table 12, Entry 2).[91] Furthermore, they reported that bimetallic catalysts based on Pt and Fe enhance the activity of activated carbon-supported catalysts in the APR of ethylene glycol (Table 12, Entry 3).[92] Specifically, the Pt-Fe/AC catalyst maintained a hydrogen production rate of 97 mmol-H2/g-cat/h for 90 hours on stream at 250°C.
Some notable works on enhancing the activity of activated carbon support catalysts are given below. As they did not present data on stability, we will not include them in Table 12.
Beside bimetallic Pt and Fe, King et al. reported the synergy between Pt and Re in the APR of glycerol at 225°C.[93] The H2 turnover frequency in 3 wt.% Pt and 3 wt.% Re supported on AC is about 12 times that of 3 wt.% Pt supported on the same AC. However, the hydrogen selectivity decreased with increasing rhenium content. Cifti et al. reported similar findings in the APR of glycerol.[60]
Wang et al. reported the use of KMnO4 treatment on AC to increase its hydrophilicity. The modified PtMnK/AC catalyst exhibited an increased in hydrogen yield in the APR of methanol compared to Pt/AC, with the former producing a H2 yield of 51% while the latter producing a H2 yield of 23%.[94]
Cu supported on activated carbon has a very low activity in the APR of methanol, its activity was reported to be about 9.7 mmol-H2/g-cat/h.[95] It was found to suffer from severe sintering of Cu particles, an increase from 6.4 nm in the freshly reduced catalyst to 127 nm after subjected to 1.25 h of methanol APR.[95]
2.5.2. Ordered Mesoporous Carbon Support
The high specific surface area and hydrothermal stability of carbon make it an attractive choice as a support for the aqueous phase reforming (APR) of alcohols. However, concerns have been raised about unfavourable textural properties, such as irregular pore distribution in activated carbon (AC), which can hinder the mass transfer of alcohols during the APR reaction.[91] To address these issues, Kim's group has extensively reported on the use of ordered mesoporous carbon, which will be discussed below.
Earlier work by the group of Kim disclosed various Pt catalysts supported on mesoporous carbon synthesized via a hard template. Their earliest work disclosed the use of rod-like ordered mesoporous carbon (CMK-3) as support for Pt in the APR of ethylene glycol.[91] They varied the loading of Pt from 1 to 10 wt.% and found that 7 wt.% Pt loading is the optimal. 7 wt.% Pt/CMK-3 was able to produce hydrogen at 91 mmol/g-cat/h for 25 hours on stream (Table 13, Entry 1) without deactivation being observed. The low-angle powder XRD peaks for the catalyst before and after the reaction suggested that the structural integrity of the ordered mesoporous carbon is maintained. However, slight degradation in micropore structures of CMK-3 was deduced from a reduced in surface area and pore volume after the reaction.
By varying the mesoporous silica hard templates from SBA-15 to KIT-6, a related hollow-type framework ordered mesoporous carbon CMK 9 can be synthesized. CMK-9 was studied in a separate work by the same group.[96] The catalyst 7 wt.% Pt/CMK-9 demonstrated the highest hydrogen production rate at 152 mmol-H2/g-cat/h for 25 hours on stream (Table 13, Entry 2). Negligible aggregation of Pt particle is observed after the reaction, as opposed to Pt/CMK-3 which particle sizes increased from 1.8 nm to 7 nm. The 3D structure of CMK9 is proposed to improve the stability by providing a larger surface area (SBET of CMK = 1717 m2/g vs. SBET of CMK-3= 770 m2/g) to achieve better dispersion and prevent particle aggregation.
In a separate report by the Kim’s group, they reported that bimetallic Pt and Fe supported on CMK-9 improved the hydrogen production rate by 44% in the APR of ethylene glycol (Table 13, Entry 3 vs. 4).[92] The catalyst was found to be stable on stream for 90 hours.
Using silica with interconnected pores as a hard template, Park et al. reported the use of three-dimensionally bimodal mesoporous carbon (3D-BMC-X, where X denotes the polymerization time of the carbon precursor) as a support in the APR of ethylene glycol (Table 13, Entry 5).[97] The performance and stability of this material in the APR of ethylene glycol are comparable to those of other previously discussed ordered mesoporous carbons. Thermogravimetric and BET analyses of the spent catalysts revealed that the integrity of the support was maintained, and no Pt leaching was observed.
2.5.3. Biomass-derived Carbon Support
Gai et al. reported the synthesis of Ni nanoparticles supported on nitrogen-doped hydrochar (HC) with a unique thistle-like architecture for the APR of methanol.[98] The HC was synthesized through the hydrothermal carbonization of glucose, urea, and polyacrylate sodium (PAAS). One of the best catalysts, 2.2 wt.% Ni/HC-N1-S1 (where N1 refers to the mass of nitrogen doping via urea and S1 refers to the mass of PAAS used), was subjected to 10 recycling experiments. The freshly reduced catalyst exhibited a hydrogen production rate of 355 mmol/g-cat/h. After ten recycling cycles, a 16% decrease in the hydrogen production rate was observed (Table 14, Entry 1). Ni leaching into the solution was excluded as a source of activity loss. However, slight aggregation of Ni nanoparticles was noted, with sizes increasing from 5.7 nm to 6.9 nm after 10 cycles of methanol APR. Additionally, Raman spectroscopy suggested that the deposition of amorphous carbon could contribute to the observed loss in activity.
Chitosan, derived from the basic treatment of Chitin from the shells of Crustacean, has been used by the group of Wang to synthesize N-doped carbon support Cu[95] or Ni catalysts[100] for the APR of methanol. Some of these works are highlighted in the ensuing paragraphs.
Zheng et al. reported that Cu nanoparticles encapsulated in a carbon matrix derived from chitosan, synthesized by a sol-gel method, exhibited remarkable stability in the APR of methanol.[95] The catalyst, Cu@NC-200, carbonized at 200°C under nitrogen, was found to be optimal. It maintained a hydrogen production rate of 34 mmol/g-cat/h during 200 hours of continuous operation in the APR of methanol at 210°C (Table 14, Entry 2). Transmission Electron Microscopy (TEM) analysis of the fresh and spent catalysts revealed no agglomeration of Cu nanoparticles, which remained predominantly between 5.7 and 5.8 nm.
Wu et al. reported the use of chitosan and glucose to encapsulate Cu nanoparticles.[99] The optimal catalyst, Cu@CS19-G1-300, was synthesized with a mass ratio of 19:1 for chitosan to D-glucose. The precursor was pyrolyzed at 300°C, which was found to be the optimal temperature. At higher temperatures, the size of the Cu nanoparticles increased due to thermally induced aggregation. The stability of the catalyst in methanol APR at 210°C was tested over five consecutive cycles, showing no significant decrease in H₂ production rate; the activity fluctuated between 131 and 136 mmol-H₂/g-cat/h (Table 14, Entry 3). Cu nanoparticle sizes remained close to 11.5 nm before and after the APR of methanol. XPS analysis revealed an increase in the amount of Cu⁰ after the reaction, at the expense of Cu⁺. They proposed that glucose enhances the reduction and dispersion of Cu species, leading to abundant Cu⁺/Cu⁰ interface sites that improve catalytic activity and stability.
Xiao et al. reported the use Ni nanoparticles encapsulated by a nitrogen-doped carbon framework (Ni@NC) which is derived from chitosan in the APR of methanol.[100] They reported that the hydrogen production rate of the freshly reduced catalyst is greatly enhanced by more than 6 times in the presence of KOH (Table 14, Entry 4). The catalyst lost about 4% of its initial hydrogen production rate after 9 cycles of an hour each. Comparison of the X-ray diffraction (XRD) before and after methanol APR revealed no observable change in Ni particles’ sizes, they remained at approximate 9 nm. In the absence of KOH, Ni@CN produced a large amount of CO (32.3%) in the APR of methanol. This was reduced to 0.3% when the methanol APR was performed in 0.86M aqueous solution of KOH. They proposed that KOH reacted with CO to form potassium formate (KHCO2), thereby preventing the poisoning of Ni by CO.
Li et al. reported carbon encapsulated Cu catalyst in the APR of methanol.[101] The catalyst was prepared by the citric acid assisted sol-gel technique with L-valine. They found that the pyrolysis temperature has a significant influence on the Cu particle sizes. The optimal catalyst Cu@Ca-Val-300 is pyrolyzed at 300°C has a Cu particle size of 14.3±3.8 nm from TEM analysis. When the APR of methanol was performed in a batch setup, the hydrogen production rate was 97 mmol-H2/g-cat/h at a reaction temperature of 180°C. In a fixed bed reactor, the activity is reduced to 3 mmol-H2/g-cat/h at the same reaction temperature (Table 14, Entry 5). The activity was found to increase for the first 90 hours on stream before it stabilizes at 3 mmol-H2/g-cat/h for another 110 hours on stream.
Chen et al. reported Cu nanoparticles encapsulated by N-doped carbon.[102] The N-doped carbon framework was derived from the pyrolysis of precursor from the sol-gel synthesis of polyvinylpyrrolidone (PVP) and Cu nitrate. The optimal catalyst, Cu@NGC-600, has a high Cu loading of 68 wt.% and Cu particle sizes of 11.8 nm. The freshly reduced catalyst a remarkable 166 mmol-H2/g-cat/h at 190°C. As no stability data was provided, this catalyst is not included in Table 14.
2.5.4. Carbon Encapsulated Metal Oxide Support
Zheng et al. reported the use of an N-doped carbon-encapsulated Cu/ZnO catalyst, labelled as Cu/ZnO@NC, for the aqueous phase reforming (APR) of methanol in the presence of KOH.[103] The carbon encapsulation improved the hydrophilicity of the catalyst, measured by the contact angle of water on the catalyst's surface, which correlated with the rate of hydrogen production via methanol APR. The encapsulation also significantly enhanced the hydrothermal stability of the catalyst. In comparison to the control catalyst, Cu/ZnO, which lost 81% of its initial activity, Cu/ZnO@NC only lost 17% of its initial activity (Table 15, Entry 1 vs. 2). Analysis of the fresh and spent catalysts revealed significant aggregation of Cu nanoparticles in the absence of carbon encapsulation. The Cu particle sizes in Cu/ZnO increased from 4.5 nm to 47.2 nm, while those in Cu/ZnO@NC increased from 3.8 nm to 7.8 nm. Some leaching of Cu possibly occurred as the mass content in both catalysts decreased by 2-5% after the reactions. XRD analysis showed that ZnO in Cu/ZnO is hydrothermally transformed to β-Zn(OH)₂, whereas in Cu/ZnO@NC, the support remained intact.
The same group reported carbon encapsulated Cu/Al2O3-ZnO in the APR of methanol.[104] The carbon source was Sesbania powder (SP). The resulting catalyst has petal-like hollow morphology. The carbon encapsulated catalyst, Cu-SP/Al2O3-ZnO, demonstrated enhanced hydrogen production rate compared to the commercial Cu/ZnO/Al2O3 catalyst (Table 15, Entry 3 vs. 4). While it exhibited less activity loss after five cycles of methanol APR relative to Cu/ZnO/Al2O3, it did lose 44% of its initial activity (Entry 4). Cu-SP/Al2O3-ZnO experienced a 5.1 wt.% loss in Cu after the reaction, which is much lower than the 27.6 wt.% loss of Cu in Cu/ZnO/Al2O3. Aggregation of Cu nanoparticles were observed in both catalysts, but it was less severe in Cu-SP/Al2O3-ZnO (fresh: 11.3 nm, spent: 13.6 nm) than in Cu/ZnO/Al2O3 (fresh: 15 nm, spent: 31 nm).
2.5.5. Carbon Nanotubes/Fibre
Van Haasterecht et al. reported on the aqueous-phase reforming (APR) of ethylene glycol (EG) using Pt or Ni supported on carbon nanofibers (CNF).[105] Using a catalyst from their previous work (5 wt.% Pt/CNF),[106] they demonstrated that Pt/CNF exhibited both high performance and stability in the APR of EG. The hydrogen production rate of Pt/CNF reached 39.6 mmol-H2/g-cat/h at 230°C, with no significant loss in activity observed after over 50 hours on stream (Table 16, Entry 1).
They found that the stability of Ni/CNF increased significantly when the APR of EG was performed with KOH. In the absence of KOH, the hydrogen production rate of Ni/CNF peaked at 12 mmol-H2/g-cat/h after 2 hours on stream, with about 92% of this activity lost by the 50-hour mark (Table 16, Entry 2). However, when KOH was added to the APR of EG, the activity increased to 25.5 mmol-H2/g-cat/h and was maintained for 50 hours on stream.
Comparative analysis between the freshly reduced and spent Ni/CNF revealed that the aggregation of Ni particles and the leaching of Ni into the solution were significantly suppressed when the APR of EG was conducted in the presence of KOH. The authors attributed the increased in stability primarily to the suppression of Ni particle aggregation. While Ni particle sizes increased from 8 nm to 58 nm without KOH, the increase was less drastic with KOH (12 nm in the spent catalyst). Leaching of Ni into the solution was minimal in both cases, with less than 0.3 wt.% loss of Ni via leaching.
Pioneering work by Haller's group established the high performance of both single- and multi-walled carbon nanotubes supported Pt and Pt-Co catalysts in the APR of ethylene glycol.[107,108,109,110] The APR stability of carbon nanotube-supported catalysts was subsequently explored by other groups and will be discussed below.
Building on the precedent of Cu-Ni alloy as a superior catalyst compared to Ni alone in the steam reforming of methanol, Rahman reported on the use of bimetallic Cu and Ni supported on multi-walled carbon nanotubes (MWNT) as catalysts for the aqueous-phase reforming (APR) of glycerol.[111] They found that the MWNT-supported Ni catalyst (12Ni/MWNT) lost all its activity after 75 hours on stream. In contrast, the catalyst with both Cu and Ni (1Cu-12Ni/MWNT) remained stable for 110 hours (Table 16, Entry 3 vs. 4). They observed that the crystalline particle sizes of Ni in 12Ni/MWNT increased from 15.8 nm to 21.7 nm after 110 hours on stream, while the particle size of Ni in 1Cu-12Ni/MWNT showed a smaller increase, from 9.8 nm to 11.3 nm. Besides improving the stability of the catalyst under APR conditions, 1Cu-12Ni/MWNT exhibited a higher H2 yield and lower CH4 and CO yields compared to 12Ni/MWNT.
He et al. reported on the use of bimetallic Pt and Ni supported on multi-walled carbon nanotubes as catalysts for the APR of glycerol in the presence of CaO.[112] The hydrogen production rate of the freshly reduced catalyst nearly doubled, from 9.1 to 18 mmol-H2/g-cat/h, when CaO was added to the reactor (Table 16, Entry 5). The addition of CaO also significantly reduced CH4 formation, from 40.4% to 0.21%, and concurrently increased H2 selectivity, from 33.2% to 59.4%. This improvement is attributed to CaO facilitating the water-gas shift reaction and inhibiting methanation through in-situ CO2 sorption via carbonation, thereby enhancing H2 selectivity and reducing CH4 formation. However, the authors noted that CaO caused the deactivation of the catalyst, which can be regenerated by pyrolysis at 750°C. In a five-cycle stability test, the optimal catalyst, 5Pt-1.5Ni/MWNT, lost 26% of its initial activity.
Tang et al. reported the APR of glycerol with porous carbon nanofibers (PCNF) supported Ni catalysts.[113] The PCNF was fabricated via electrospinning technique. The encapsulation of Ni nanoparticles within porous carbon nanofibers (Ni@PCNF) further improved catalyst stability, leading to high-purity hydrogen production (93%) with minimal byproducts such as CH4 and CO. However, as we are unable to extract stability data from their work, it is not included in Table 16.
2.6. Molybdenum Carbide or Sulfide
Atomically dispersed Ni and Pt on α-Mo2C are prominently featured as catalysts with high activities for the aqueous phase reforming (APR) of methanol.[40,78] These catalysts achieved some of the highest specific hydrogen production rates for methanol APR in the literature. 2 wt.% Pt/α-Mo2C produced hydrogen at a rate of 467 mmol/g-cat/h at 190°C. However, after 11 cycles of methanol APR, it lost 33% of its initial activity (Table 17, Entry 1). The authors attributed this loss in activity to catalyst loss due to batch reactor stirring, which caused some of the catalyst to be dislodged, and the accumulation of CO2 in the liquid. Similarly, at the same loading, Ni/α-Mo2C exhibited a hydrogen production rate of 626 mmol/g-cat/h at 240°C (Table 17, Entry 2) and experienced a similar degree of deactivation, losing 33% of its initial activity after 10 cycles of methanol APR.
Liu et al. reported on the performance of a MoS2 nanosheet-supported Pt catalyst in the APR of methanol under basic conditions.[37] The number of layers in the MoS2 nanosheet can be controlled by the temperature and duration of the hydrothermal synthesis, with a nanosheet of 6 layers identified as the optimal support. At a 0.2 wt.% Pt loading, the Pt/MoS2 catalyst achieved a hydrogen production rate of 11.5 mmol-H2/g-cat/h (Table 17, Entry 3). In contrast, bulk MoS2 with the same Pt loading showed only 58% of the performance of the nanosheet-supported catalyst. The catalyst lost 24% of its initial activity after four cycles of methanol APR. From TEM analysis, they attributed the deactivation to the aggregation of Pt nanoparticles.
2.7. Ultrasonic
The ability of ultrasound to induce the decomposition of water and aqueous alcohols has been extensively studied and documented in the literature. The sonolysis of alcohols has been thoroughly examined by Dehane et al.[114] Therefore, we will not delve into all the known variables that influence the outcomes of their sonolysis. Instead, we will focus on fundamental parameters such as ultrasound frequency, purging gas (excluding its composition, which can have a strong impact on sonochemistry [115,116]), and power input/acoustic intensity where applicable. Additionally, the use of sonocatalysts and piezocatalysts to enhance the sonolysis of alcohols in water will be discussed, as these have the potential to significantly increase hydrogen production via the sonolysis of aqueous alcohols beyond the current limit.
Other authoritative reviews focusing on different facets of sonochemistry are available in the literature. For an in-depth discussion on sono-reactor design to optimize the sonolysis of aqueous methanol, including theoretical models and computational fluid dynamics (CFD) techniques, please refer to the work of Dehane et al.[114]. A thorough examination of theoretical aspects, reactor engineering, and scaling-up considerations can be found in the study by Meroni et al.[117] Merabet and Kerboua reviewed the state-of-the-art in sonocatalysis, sonoelectrocatalysis, sonophotolysis, and sonophotocatalysis for hydrogen production, emphasizing the importance of controlling parameters and reactor design for efficiency.[118] In a more focused note, Islam et al. discussed the potential of using sonochemical and sonoelectrochemical methods to produce clean hydrogen efficiently, highlighting how these processes enhance traditional water electrolysis.[119] Kiss et al. highlighted ultrasound-assisted emerging technologies in chemical processes, detailing advancements in extraction, crystallization, and reactive distillation, along with a proposed roadmap for the industrial implementation of these technologies.[120] Wood et al. detailed the key factors influencing sonochemical activity in aqueous solutions, including primary parameters such as pressure amplitude, frequency, and reactor design, and secondary parameters like the use of gas and liquid additives, highlighting their effects on bubble dynamics and sonochemical efficiency.[121]
2.7.1. Basic Theoretical Background
The application of ultrasound to a liquid medium resulted in the formation of tiny gas bubbles, which expand and eventually collapse. This process is known as acoustic cavitation.[122] The implosion of bubbles can result in localized hotspots with temperature ranging from few thousand to tens of thousands Kelvin and pressure of a few hundreds to a few thousands bars.[123,124] Reactive radicals can be produced inside the hotspot (primary sonochemistry) or outside the hotspot (secondary sonochemistry).[125] Heating and cooling due to acoustic cavitation occur at very high rate (in the order of picoseconds),[86] thus enabling unique chemistry to occur via ultrasonic activation which would otherwise be not possible under an ambient condition.
The occurrence and size of these bubbles, which depend on the frequency of the applied ultrasound, will determine whether physical or chemical effects dominate. For low-frequency ultrasound (20 - 100 kHz), physical effects such as liquid circulation and turbulence dominate, as cavitation events are much rarer compared to higher frequency ultrasound. Despite producing larger acoustic cavities, lower frequency ultrasound is not optimal for radical yield. Radical yield is a balance between the size of the bubbles and their occurrence, and bubble occurrence increases with increasing frequency. Therefore, the optimal range for radical yield is between 200 and 600 kHz.[117]
For detailed theoretical and experimental aspects of acoustic cavitation, the authors are referred to the reviews that are cited in this section.
2.7.2. Sonolysis of Aqueous Alcohols
It is known that the presence of low concentration of methanol in water can highly enhance the hydrogen production rate via sonolysis. This has been consistently reported by many reports. In this section, we will discuss various works on hydrogen production via the sonolysis of aqueous alcohols.
The attenuation of ultrasound resulted in a lower acoustic intensity as the distance from the transducer is increased (Figure 7).[117] In proof-of-concept studies, sono-reactors are usually limited to one transducer with no optimization of configuration. Therefore, to mitigate the impact of volumes on hydrogen production rate, we employed volume normalized metric. However, we note that optimization of transducer configuration is an essential component in the design of sono-reactor, therefore we included the liquid volume used so that the reader can calculate the reported hydrogen production rate easily by multiplying with the values given in µmol/mL-liquid/h.
Buttner et al. studied the sonolysis of aqueous methanol at 1 MHz.[127] Under argon, they found that the optimal amount of methanol is around 8 wt.% in water. The hydrogen production rate at this concentration is approximately 9 µmol/mL-liquid/h. Compared to sonolysis of 8 wt.% methanol in water, at 35 wt.%, the selectivity for formaldehyde and CH4 increased significantly from 15% and 9% to 30% and 15%, respectively with a concomitant decrease in H2 selectivity. When the sonolysis was performed in oxygen, CO2 which is formed from combustion is the main product.
Rassokhin et al. explored the hydrogen evolution rate of the sonolysis of aqueous methanol at various temperatures.[128] They employed intermediate frequency ultrasound at 724 kHz. They found that hydrogen production is greatly accelerated by adding a small amount of methanol to water (Figure 8). The hydrogen production rate for water and methanol individually are low, generally less than 1 µmol/mL-liquid/h. However, if there is 3.2 wt. % of methanol, a hydrogen production rate of 12 µmol/mL-liquid/h can be achieved over a range of temperatures (38-50°C).
Mizukoshi et al. reported the sonolysis of various C1-C6 alcohols at 5°C.[129] The results are depicted in Figure 9. Intermediate frequency ultrasounds of 200kHz were used and an acoustic intensity of 6 W/cm2. Sonolysis of ethanol and 1-propanol produced hydrogen at a rate of 2.4 and 3.0 µmol/mL-liquid/h which is a drastic improvement over methanol (1.3 µmol/mL-liquid/h). However, the amount of CH4 produced also increased for ethanol and 1-propanol over methanol. Interestingly, the branched isomer of 1-propanol – 2-propanol – appeared to have a very high resistance to sonolysis which was only exceeded by pentanol and hexanol. They concluded that for alcohols evaporation rate instead of vapor pressure is a better descriptor for sonolysis activity. This is in contrast to the sonolysis of hydrocarbons where vapor pressure demonstrates a good negative correlation with sonolysis rate.[130,131]
2.7.3. Insights Into the Mechanism of Sonolysis
Spin-trapping experiments and electron spin resonance spectroscopy have been used to provide insights into the radical species formed during the sonolysis of aqueous methanol. Krishna et al. reported the observation of CH3 and CH2OH radicals from the sonolysis of aqueous methanol at 50 Hz.[132] The concentration of these radicals peaks at 5M of methanol in water (about 16 wt.% methanol in water) and decreases drastically with increasing amounts of methanol. They rationalized this observation by the decrease in temperature that the collapse of the bubble can reach due to the higher heat capacity of methanol vapor compared to water vapor, and the increase in thermal conductivity with increasing methanol content. The decreased in bubble temperatures with increasing alcohols concentration has also been reported by Rae et al.[133]
Yasui studied the non-equilibrium reactions and physical properties of acoustic cavitation of water in the presence of argon via numerical simulation.[115] To the left of Figure 10, the relationship between the bubble radius and temperature during the final stage of bubble collapse is shown. As the bubble collapses violently in a matter of picoseconds, the temperature inside rises sharply, reaching around 5100 K. This increase in temperature is primarily due to the work done by the liquid surrounding the bubble. After reaching this peak, the temperature decreases rapidly as the bubble expands. At the same time, a dramatic increase in pressure, reaching approximately 6 GPa, which leads to a sudden halt in the bubble collapse (Right of Figure 10). This halt occurs when the density inside the bubble nears that of a condensed phase, around 650 kg/m³.
Kerboua and Hamdaoui conducted numerical simulations on a single acoustic bubble to investigate the impact of varying dioxygen and argon compositions on the production rates of various chemical species during the sonolysis of water and methanol-water mixtures.[134] In pure water, a molar fraction of 90% argon resulted in an optimal sonolysis rate due to peak bubble temperatures and increased radical lifetimes afforded by the high concentration of inert argon. Both oxygen atoms and hydroxyl radicals are prevalent at both high and low argon compositions relative to dioxygen. However, at high argon compositions, hydrogen radicals become more prominent, while at low argon but high oxygen compositions, the HOO· radical is more prevalent. When methanol is added to water, the chemical dynamics within the bubble change significantly, giving rise to new species such as CH3O, CH2O, HCO, CO2, and CO, which are not present in pure water sonolysis. For a 1% (v/v) methanol-water mixture, with a bubble containing a high oxygen level (90% molar oxygen), CO and H2O2 emerge as the major products, followed by CH2O and H2. At this oxygen-argon composition, the production of H2 is significant but not necessarily at its maximum, which tends to occur with different methanol concentrations. On the other hand, at 90% molar argon, species such as CO, ·O, ·OH, and CO2 are drastically reduced, indicating that methanol not only enhances the selectivity of sonochemical reactions but also shifts the chemical pathways to produce different species compared to pure water.
2.7.4. Sonocatalyst or Piezocatalyst
Solid cavitation agents can enhance the acoustics cavitation efficiency and lower energy consumption of reaction driven by ultrasound.[135] There is report on the use of nanostructured AuPd/TiO2 as sonocatalysts for the oxidation of benzyl alcohols.[136] However, the application of these cavitation agents in the sonolysis of aqueous alcohols is rare.
Wang et al. reported that Au/TiO2 significantly improved the hydrogen production rate via the sonolysis of various alcohols, including methanol, ethanol, and glycerol, in water.[137] Au/TiO2 increased the hydrogen production rate of water and aqueous methanol sonolysis by 54-fold (Table 18, Entries 1 and 2) and 83-fold (Entries 3 and 4), respectively, compared to sonolysis performed without Au/TiO2. For the sonolysis of 1.9% (v/v) ethanol in water, Au/TiO2 increased the hydrogen production rate by 248 times, achieving a value of 1.3 µmol/mL-liquid/h. The effect on 0.67% (v/v) glycerol in water was less pronounced, with a 31-fold increase, resulting in a hydrogen production rate of 0.2 µmol/mL-liquid/h. For comparison, the specific hydrogen production rate from the sonolysis of aqueous methanol is 3.8 mmol/g-cat/h, which is noteworthy when compared to the thermal aqueous phase reforming of methanol since no room temperature APR via thermal catalysis has been reported thus far. However, the scalability of this technology remains to be evaluated.
Zhang et al. reported that the sonolysis of a suspension of BaTiO3 in 10 wt.% methanol in water can produce hydrogen at a rate of 6 mmol/g-cat/h over a duration of four days.[126] The hydrogen production rate, normalized by liquid volume, is 0.6 µmol/mL-liquid/h (Table 18, Entry 5) with 10 mg of BaTiO3 as Piezocatalyst. They found it crucial to disperse the BaTiO3 via mechanical stirring or agitation before the sonolysis; otherwise, negligible hydrogen will be produced. Additionally, they observed that the BaTiO3-catalyzed sonolysis of aqueous methanol is sensitive to various factors, including the vertical distance of the reactor to the transducer, the catalyst dosage, and the volume of liquid used.
While comparing results from different reports can be misleading as frequency may not be the only significant factors that affect the rate of hydrogen production from an alcohol-water mixture, it could be nonetheless instructive to compile the sonolysis of water, methanol and their mixture (Table 18). Intermediate frequency ultrasound, at similar power input, seems to be superior to lower frequency ultrasound in the production of H2 from sonolysis. For instance, at 724 kHz, the sonolysis of 3.2 wt.% methanol in water is reported to produce 12 µmol/mL-liquid/h or 480 µmol/h in 40 mL of 3.2 wt.% methanol in water (Entry 8). The use of 1000 kHz ultrasound seems to be comparable for the sonolysis of aqueous methanol (Entry 11) This is remarkable considered that with low frequency ultrasound produced 0.023 µmol/mL-liquid/h or 3.5 µmol/h in 150 mL of 4 wt.% methanol in water (Entry 3). Similar trend can be seen for the sonolysis of water (Entry 1, 7 and 11).
3. Conclusion
In this review, we have surveyed literature on the aqueous phase reforming (APR) of model alcohols such as methanol, ethanol, ethylene glycol and glycerol. The APR of these alcohols is mainly catalyzed by Pt, Ni, Co, or their binary mixtures, and supported on metal oxides, carbon, Mo2C or MoS2. State-of-the-art catalysts are currently dominated by the use of expensive Pt as active metals. Pt based catalysts have been demonstrated in various works to be stable for extended duration under APR (up to 600 h in the case of Pt/NiAl2O4). Much research has been done to use more cost-effective metal such as Ni, Cu and Co which has resulted in some promising catalysts with rooms for improvement.
In term of stability, one of the recommended metrics for industry is catalyst consumption (kg-cat per tons-product).[18] The ideal value for catalyst consumption is less than 0.1, which implies in this case, that for 1 g of catalyst, 10 kg (or 5 kmol) of H2 has to be produced. For APR catalysts which have been tested under continuous operation in a fixed bed reactor, the specific hydrogen production rate ranges from 26-160 mmol/g-cat/h. If we take the median of 90 mmol-H2/g-cat/h, which translates to 0.18 g-H2/g-cat/h or 4.3 g-H2/g-cat/day, the catalyst will have to run for more than 2300 days to meet this criterion. Therefore, it appears that there is still significant gap between laboratory-based research and industry-based application.
Ultrasound induced sonolysis of water and aqueous alcohols have been extensively studied and reported in the 1980s, however, commercially viable hydrogen generation via this technology remains out of reach. Promising works on the use of piezocatalysis or sonocatalysis to enhance the efficiency of sonolysis have been demonstrated, however, further research would be required to push the boundary of sonolysis of aqueous methanol before it can reach a higher technological readiness level.
In conclusion, while hydrogen is a clean and efficient fuel, its widespread use is limited by logistical challenges. Liquid organic hydrogen carriers, such as alcohols, present a viable solution through aqueous phase reforming (APR), which eliminates the need for energy-intensive feedstock vaporization. However, the success of APR on an industrial scale hinges on addressing the stability of catalysts under hydrothermal conditions, which is critical for sustained hydrogen production. Furthermore, ultrasound-assisted APR offers a promising alternative by enabling hydrogen production without external heating, although this technology is less advanced compared to thermal APR. Continued research and development of catalysts specifically designed for ultrasound-assisted processes could open new avenues for efficient hydrogen production from alcohols.
Author Contributions
Conceptualization C. W. Kee.; Writing – Original Draft Preparation, C. W. Kee.; Methodology, C. W. Kee.; Writing – Review & Editing, C. W. Kee, J. E. Zheng, W. J. Yap, R. Ou Yong, and Y. Liu.; Resources, Y. Liu.; Project Administration, Y. Liu.; All authors have read and agreed to the published version of the manuscript.
Funding
This research is supported by A*STAR under its A*STAR I&E GAP funding (Grant No. I23D1AG017).
Institutional Review Board Statement
Not applicable.
Informed Consent Statement
Not applicable.
Data Availability Statement
On request, calculations to obtain specific hydrogen production rate from all cited literatures are available from C.W. Kee.
Acknowledgments
This work was supported by the A*STAR Computational Resource Centre through the use of its high-performance computing facilities. The computational work for this article was partially performed on resources of the National Supercomputing Centre, Singapore (https://www.nscc.sg).
Conflicts of Interest
The authors declare no conflict of interest.
Sample Availability
Not applicable.
References
- Suleman, F.; Dincer, I.; Agelin-Chaab, M. Environmental impact assessment and comparison of some hydrogen production options. Int. J. Hydrogen Energy 2015, 40 (21), 6976-6987. [CrossRef]
- Palo, D. R.; Dagle, R. A.; Holladay, J. D. Methanol Steam Reforming for Hydrogen Production. Chem. Rev. 2007, 107 (10), 3992-4021. [CrossRef]
- Anil, S.; Indraja, S.; Singh, R.; Appari, S.; Roy, B. A review on ethanol steam reforming for hydrogen production over Ni/Al2O3 and Ni/CeO2 based catalyst powders. Int. J. Hydrogen Energy 2022, 47 (13), 8177-8213. [CrossRef]
- Bepari, S.; Kuila, D. Steam reforming of methanol, ethanol and glycerol over nickel-based catalysts-A review. Int. J. Hydrogen Energy 2020, 45 (36), 18090-18113. [CrossRef]
- Sharma, Y. C.; Kumar, A.; Prasad, R.; Upadhyay, S. N. Ethanol steam reforming for hydrogen production: Latest and effective catalyst modification strategies to minimize carbonaceous deactivation. Renewable Sustainable Energy Rev. 2017, 74, 89-103. [CrossRef]
- Achomo, M. A.; Kumar, A.; Peela, N. R.; Muthukumar, P. Hydrogen production from steam reforming of methanol: A comprehensive review on thermodynamics, catalysts, reactors, and kinetic studies. Int. J. Hydrogen Energy 2024, 58, 1640-1672. [CrossRef]
- Yang, W.-W.; Ma, X.; Tang, X.-Y.; Dou, P.-Y.; Yang, Y.-J.; He, Y.-L. Review on developments of catalytic system for methanol steam reforming from the perspective of energy-mass conversion. Fuel 2023, 345, 128234. [CrossRef]
- Fermoso, J.; He, L.; Chen, D. Sorption enhanced steam reforming (SESR): a direct route towards efficient hydrogen production from biomass-derived compounds. J. Chem. Technol. Biotechnol. 2012, 87 (10), 1367-1374. [CrossRef]
- Dou, B.; Song, Y.; Wang, C.; Chen, H.; Xu, Y. Hydrogen production from catalytic steam reforming of biodiesel byproduct glycerol: Issues and challenges. Renewable Sustainable Energy Rev. 2014, 30, 950-960. [CrossRef]
- Shokrollahi Yancheshmeh, M.; Radfarnia, H. R.; Iliuta, M. C. High temperature CO2 sorbents and their application for hydrogen production by sorption enhanced steam reforming process. Chem. Eng. J. 2016, 283, 420-444. [CrossRef]
- Kothandaraman, J.; Kar, S.; Goeppert, A.; Sen, R.; Prakash, G. K. S. Advances in Homogeneous Catalysis for Low Temperature Methanol Reforming in the Context of the Methanol Economy. Top. Catal. 2018, 61 (7-8), 542-559. [CrossRef]
- Kumar, A.; Daw, P.; Milstein, D. Homogeneous Catalysis for Sustainable Energy: Hydrogen and Methanol Economies, Fuels from Biomass, and Related Topics. Chem. Rev. 2022, 122 (1), 385-441. [CrossRef]
- Sordakis, K.; Tang, C.; Vogt, L. K.; Junge, H.; Dyson, P. J.; Beller, M.; Laurenczy, G. Homogeneous Catalysis for Sustainable Hydrogen Storage in Formic Acid and Alcohols. Chem. Rev. 2018, 118 (2), 372-433. [CrossRef]
- Davda, R. R.; Shabaker, J. W.; Huber, G. W.; Cortright, R. D.; Dumesic, J. A. A review of catalytic issues and process conditions for renewable hydrogen and alkanes by aqueous-phase reforming of oxygenated hydrocarbons over supported metal catalysts. Appl. Catal., B 2005, 56 (1), 171-186. [CrossRef]
- Joshi, A. N.; Vaidya, P. D. Recent studies on aqueous-phase reforming: Catalysts, reactors, hybrid processes and techno-economic analysis. Int. J. Hydrogen Energy 2024, 49, 117-137. [CrossRef]
- DWSIM: Open-source process simulator; 2024. https://dwsim.org/ (accessed 28/8/2024).
- Stryjek, R.; Vera, J. H. PRSV2: A cubic equation of state for accurate vapor—liquid equilibria calculations. Can. J. Chem. Eng. 1986, 64 (5), 820-826. [CrossRef]
- Lange, J.-P. Performance metrics for sustainable catalysis in industry. Nat. Catal. 2021, 4 (3), 186-192. [CrossRef]
- Elliott, D. C.; Sealock, L. J., Jr.; Baker, E. G. Chemical processing in high-pressure aqueous environments. 2. Development of catalysts for gasification. Ind. Eng. Chem. Res. 1993, 32 (8), 1542-1548. [CrossRef]
- Van Cleve, T.; Underhill, D.; Veiga Rodrigues, M.; Sievers, C.; Medlin, J. W. Enhanced Hydrothermal Stability of γ-Al2O3 Catalyst Supports with Alkyl Phosphonate Coatings. Langmuir 2018, 34 (12), 3619-3625. [CrossRef]
- Huo, J.; Tessonnier, J.-P.; Shanks, B. H. Improving Hydrothermal Stability of Supported Metal Catalysts for Biomass Conversions: A Review. ACS Catal. 2021, 11 (9), 5248-5270. [CrossRef]
- Lin, F.; Xu, M.; Ramasamy, K. K.; Li, Z.; Klinger, J. L.; Schaidle, J. A.; Wang, H. Catalyst Deactivation and Its Mitigation during Catalytic Conversions of Biomass. ACS Catal. 2022, 12 (21), 13555-13599. [CrossRef]
- Chen, W.-H.; Chen, C.-Y. Water gas shift reaction for hydrogen production and carbon dioxide capture: A review. Appl. Energy 2020, 258, 114078. [CrossRef]
- Mohanty, P.; Pant, K. K.; Mittal, R. Hydrogen generation from biomass materials: challenges and opportunities. WIREs Energy and Environment 2015, 4 (2), 139-155. [CrossRef]
- Davda, R. R.; Shabaker, J. W.; Huber, G. W.; Cortright, R. D.; Dumesic, J. A. Aqueous-phase reforming of ethylene glycol on silica-supported metal catalysts. Appl. Catal., B 2003, 43 (1), 13-26. [CrossRef]
- Chen, G.-y.; Li, W.-q.; Chen, H.; Yan, B.-b. Progress in the aqueous-phase reforming of different biomass-derived alcohols for hydrogen production. Journal of Zhejiang University-SCIENCE A 2015, 16 (6), 491-506. [CrossRef]
- Coronado, I.; Stekrova, M.; Reinikainen, M.; Simell, P.; Lefferts, L.; Lehtonen, J. A review of catalytic aqueous-phase reforming of oxygenated hydrocarbons derived from biorefinery water fractions. Int. J. Hydrogen Energy 2016, 41 (26), 11003-11032. [CrossRef]
- Vaidya, P. D.; Lopez-Sanchez, J. A. Review of Hydrogen Production by Catalytic Aqueous-Phase Reforming. ChemistrySelect 2017, 2 (22), 6563-6576. [CrossRef]
- Pipitone, G.; Zoppi, G.; Pirone, R.; Bensaid, S. A critical review on catalyst design for aqueous phase reforming. Int. J. Hydrogen Energy 2022, 47 (1), 151-180. [CrossRef]
- Azizan, M. T.; Aqsha, A.; Ameen, M.; Syuhada, A.; Klaus, H.; Abidin, S. Z.; Sher, F. Catalytic reforming of oxygenated hydrocarbons for the hydrogen production: an outlook. Biomass Conversion and Biorefinery 2023, 13 (10), 8441-8464. [CrossRef]
- Tian, Z.; Lu, Y.; Wang, J.; Shu, R.; Wang, C.; Chen, Y. Advances in hydrogen production by aqueous phase reforming of biomass oxygenated derivatives. Fuel 2024, 357, 129691. [CrossRef]
- Xiong, H.; Pham, H. N.; Datye, A. K. Hydrothermally stable heterogeneous catalysts for conversion of biorenewables. Green Chem. 2014, 16 (11), 4627-4643. [CrossRef]
- Shabaker, J. W.; Huber, G. W.; Davda, R. R.; Cortright, R. D.; Dumesic, J. A. Aqueous-Phase Reforming of Ethylene Glycol Over Supported Platinum Catalysts. Catal. Lett. 2003, 88 (1), 1-8. [CrossRef]
- Ravenelle, R. M.; Copeland, J. R.; Kim, W.-G.; Crittenden, J. C.; Sievers, C. Structural Changes of γ-Al2O3-Supported Catalysts in Hot Liquid Water. ACS Catal. 2011, 1 (5), 552-561. [CrossRef]
- Pham, H. N.; Anderson, A. E.; Johnson, R. L.; Schmidt-Rohr, K.; Datye, A. K. Improved Hydrothermal Stability of Mesoporous Oxides for Reactions in the Aqueous Phase. Angew. Chem. Int. Ed. 2012, 51 (52), 13163-13167. [CrossRef]
- Cortright, R. D.; Davda, R. R.; Dumesic, J. A. Hydrogen from catalytic reforming of biomass-derived hydrocarbons in liquid water. Nature 2002, 418 (6901), 964-967. [CrossRef]
- Liu, Y.; Li, S.; Zhu, S. Novel Pt/MoS2 nanosheet catalyst for hydrogen production via aqueous-phase reforming of methanol. React. Kinet., Mech. Catal. 2022, 135 (5), 2579-2589. [CrossRef]
- Zhang, J.; Klasky, M.; Letellier, B. C. The aluminum chemistry and corrosion in alkaline solutions. J. Nucl. Mater. 2009, 384 (2), 175-189. [CrossRef]
- Li, D.; Li, Y.; Liu, X.; Guo, Y.; Pao, C.-W.; Chen, J.-L.; Hu, Y.; Wang, Y. NiAl2O4 Spinel Supported Pt Catalyst: High Performance and Origin in Aqueous-Phase Reforming of Methanol. ACS Catal. 2019, 9 (10), 9671-9682. [CrossRef]
- Lin, L.; Yu, Q.; Peng, M.; Li, A.; Yao, S.; Tian, S.; Liu, X.; Li, A.; Jiang, Z.; Gao, R.; et al. Atomically Dispersed Ni/α-MoC Catalyst for Hydrogen Production from Methanol/Water. J. Am. Chem. Soc. 2021, 143 (1), 309-317. [CrossRef]
- Lv, Z.; Zhu, S.; Wang, S.; Dong, M.; Qin, Z.; Wang, J.; Fan, W. Aqueous-phase reforming of methanol to hydrogen over CoAl oxide-supported Pt catalyst. Appl. Catal., A 2023, 665, 119378. [CrossRef]
- Wen, G.; Xu, Y.; Ma, H.; Xu, Z.; Tian, Z. Production of hydrogen by aqueous-phase reforming of glycerol. Int. J. Hydrogen Energy 2008, 33 (22), 6657-6666. [CrossRef]
- El Doukkali, M.; Iriondo, A.; Cambra, J. F.; Gandarias, I.; Jalowiecki-Duhamel, L.; Dumeignil, F.; Arias, P. L. Deactivation study of the Pt and/or Ni-based γ-Al2O3 catalysts used in the aqueous phase reforming of glycerol for H2 production. Appl. Catal., A 2014, 472, 80-91. [CrossRef]
- El Doukkali, M.; Iriondo, A.; Arias, P. L.; Requies, J.; Gandarías, I.; Jalowiecki-Duhamel, L.; Dumeignil, F. A comparison of sol–gel and impregnated Pt or/and Ni based γ-alumina catalysts for bioglycerol aqueous phase reforming. Appl. Catal., B 2012, 125, 516-529. [CrossRef]
- Liu, Y.; Yu, S.; Wu, X.; Cao, X.; Geng, H.; Zhang, C.; Liu, S. Improving the hydrothermal stability and hydrogen selectivity of Ni-Cu based catalysts for the aqueous-phase reforming of methanol. Int. J. Hydrogen Energy 2023, 48 (34), 12699-12711. [CrossRef]
- Kalekar, V. N.; Vaidya, P. D. Hydrogen production from aqueous-phase reforming of polyols over Ru/Al2O3 catalyst in a fixed-bed reactor. J. Indian Chem. Soc. 2024, 101268. [CrossRef]
- Franck, J. P.; Freund, E.; Quéméré, E. Textural and structural changes in transition alumina supports. J. Chem. Soc., Chem. Commun. 1984, 0 (10), 629-630. [CrossRef]
- Jun-Cheng, L.; Lan, X.; Feng, X.; Zhan-Wen, W.; Fei, W. Effect of hydrothermal treatment on the acidity distribution of γ-Al2O3 support. Appl. Surf. Sci. 2006, 253 (2), 766-770. [CrossRef]
- Abi Aad, J.; Courty, P.; Decottignies, D.; Michau, M.; Diehl, F.; Carrier, X.; Marceau, E. Inhibition by Inorganic Dopants of γ-Alumina Chemical Weathering under Hydrothermal Conditions: Identification of Reactive Sites and their Influence in Fischer–Tropsch Synthesis. ChemCatChem 2017, 9 (12), 2106-2117. [CrossRef]
- Liu, Y.; Jia, L.; Hou, B.; Sun, D.; Li, D. Cobalt aluminate-modified alumina as a carrier for cobalt in Fischer–Tropsch synthesis. Appl. Catal., A 2017, 530, 30-36. [CrossRef]
- Shen, J.; Hayes, R. E.; Wu, X.; Semagina, N. 100° Temperature Reduction of Wet Methane Combustion: Highly Active Pd–Ni/Al2O3 Catalyst versus Pd/NiAl2O4. ACS Catal. 2015, 5 (5), 2916-2920. [CrossRef]
- Liu, Y.; Wang, S.; Sun, T.; Gao, D.; Zhang, C.; Wang, S. Enhanced hydrothermal stability of high performance lean fuel combustion alumina-supported palladium catalyst modified by nickel. Appl. Catal., B 2012, 119-120, 321-328. [CrossRef]
- Reynoso, A. J.; Ayastuy, J. L.; Iriarte-Velasco, U.; Gutiérrez-Ortiz, M. A. Cobalt aluminate spinel-derived catalysts for glycerol aqueous phase reforming. Appl. Catal., B 2018, 239, 86-101. [CrossRef]
- Reynoso, A. J.; Iriarte-Velasco, U.; Gutiérrez-Ortiz, M. A.; Ayastuy, J. L. Highly stable Pt/CoAl2O4 catalysts in Aqueous-Phase Reforming of glycerol. Catal. Today 2021, 367, 278-289. [CrossRef]
- Reynoso, A. J.; Ayastuy, J. L.; Iriarte-Velasco, U.; Gutiérrez-Ortiz, M. A. Aqueous-phase reforming of glycerol over Pt-Co catalyst: Effect of process variables. J. Environ. Chem. Eng. 2022, 10 (3), 107402. [CrossRef]
- Morales-Marín, A.; Ayastuy, J. L.; Iriarte-Velasco, U.; Gutiérrez-Ortiz, M. A. Nickel aluminate spinel-derived catalysts for the aqueous phase reforming of glycerol: Effect of reduction temperature. Appl. Catal., B 2019, 244, 931-945. [CrossRef]
- Leboda, R.; Mendyk, E.; Gierak, A.; Tertykh, V. A. Hydrothermal modification of silica gels (xerogels) 1. Effect of treatment temperature on their porous structure. Colloids Surf., A 1995, 105 (2), 181-189. [CrossRef]
- WebPlotDigitizer; 2024. https://automeris.io/WebPlotDigitizer (accessed 28/8/2024).
- Seretis, A.; Tsiakaras, P. Crude bio-glycerol aqueous phase reforming and hydrogenolysis over commercial SiO2Al2O3 nickel catalyst. Renewable Energy 2016, 97, 373-379. [CrossRef]
- Ciftci, A.; Eren, S.; Ligthart, D. A. J. M.; Hensen, E. J. M. Platinum–Rhenium Synergy on Reducible Oxide Supports in Aqueous-Phase Glycerol Reforming. ChemCatChem 2014, 6 (5), 1260-1269. [CrossRef]
- Wu, K.; Dou, B.; Zhang, H.; Liu, D.; Chen, H.; Xu, Y. Aqueous phase reforming of biodiesel byproduct glycerol over mesoporous Ni-Cu/CeO2 for renewable hydrogen production. Fuel 2022, 308, 122014. [CrossRef]
- Lu, Y.; Wang, C.; Luo, X.; Shu, R.; Lei, L.; Liu, J.; Tian, Z.; Liao, Y.; Chen, Y. Aqueous phase reforming of methanol for hydrogen production over highly-dispersed PtLa/CeO2 catalyst prepared by photochemical reduction method. Int. J. Hydrogen Energy 2024, 62, 1054-1066. [CrossRef]
- Zhang, G.; Qu, Z.; Tao, W.-Q.; Wang, X.; Wu, L.; Wu, S.; Xie, X.; Tongsh, C.; Huo, W.; Bao, Z.; et al. Porous Flow Field for Next-Generation Proton Exchange Membrane Fuel Cells: Materials, Characterization, Design, and Challenges. Chem. Rev. 2023, 123 (3), 989-1039. [CrossRef]
- Nielsen, M.; Alberico, E.; Baumann, W.; Drexler, H.-J.; Junge, H.; Gladiali, S.; Beller, M. Low-temperature aqueous-phase methanol dehydrogenation to hydrogen and carbon dioxide. Nature 2013, 495 (7439), 85-89. [CrossRef]
- Zhang, S.; Liu, Y.; Zhang, M.; Ma, Y.; Hu, J.; Qu, Y. Sustainable production of hydrogen with high purity from methanol and water at low temperatures. Nat. Commun. 2022, 13 (1). [CrossRef]
- Chen, L.-N.; Hou, K.-P.; Liu, Y.-S.; Qi, Z.-Y.; Zheng, Q.; Lu, Y.-H.; Chen, J.-Y.; Chen, J.-L.; Pao, C.-W.; Wang, S.-B.; et al. Efficient Hydrogen Production from Methanol Using a Single-Site Pt1/CeO2 Catalyst. J. Am. Chem. Soc. 2019, 141 (45), 17995-17999. [CrossRef]
- Mai, H.-X.; Sun, L.-D.; Zhang, Y.-W.; Si, R.; Feng, W.; Zhang, H.-P.; Liu, H.-C.; Yan, C.-H. Shape-Selective Synthesis and Oxygen Storage Behavior of Ceria Nanopolyhedra, Nanorods, and Nanocubes. J. Phys. Chem. B 2005, 109 (51), 24380-24385. [CrossRef]
- Guo, Q.; Wang, Y.; Li, W.; Zou, Y.; Zhang, S. Oxygen vacancy of Pt/CeO2 enabled low-temperature hydrogen generation from methanol and water. J. Catal. 2024, 430, 115309. [CrossRef]
- Lin, Y.-S.; Chang, C.-H.; Gopalan, R. Improvement of Thermal Stability of Porous Nanostructured Ceramic Membranes. Ind. Eng. Chem. Res. 1994, 33 (4), 860-870. [CrossRef]
- Duan, J.; Kim, Y. T.; Lou, H.; Huber, G. W. Hydrothermally stable regenerable catalytic supports for aqueous-phase conversion of biomass. Catal. Today 2014, 234, 66-74. [CrossRef]
- Bernard, P.; Stelmachowski, P.; Broś, P.; Makowski, W.; Kotarba, A. Demonstration of the Influence of Specific Surface Area on Reaction Rate in Heterogeneous Catalysis. J. Chem. Educ. 2021, 98 (3), 935-940. [CrossRef]
- Stekrova, M.; Rinta-Paavola, A.; Karinen, R. Hydrogen production via aqueous-phase reforming of methanol over nickel modified Ce, Zr and La oxide supports. Catal. Today 2018, 304, 143-152. [CrossRef]
- Pavesi Contreras, C.; Blanco, E.; Pazo, C.; Dongil, A. B.; Escalona, N. H2 production through aqueous phase reforming of ethanol over molybdenum carbide catalysts supported on zirconium oxide. Appl. Catal., A 2024, 670, 119535. [CrossRef]
- Karpenko, A.; Leppelt, R.; Cai, J.; Plzak, V.; Chuvilin, A.; Kaiser, U.; Behm, R. J. Deactivation of a Au/CeO2 catalyst during the low-temperature water–gas shift reaction and its reactivation: A combined TEM, XRD, XPS, DRIFTS, and activity study. J. Catal. 2007, 250 (1), 139-150. [CrossRef]
- Larimi, A. S.; Kazemeini, M.; Khorasheh, F. Aqueous phase reforming of glycerol using highly active and stable Pt0.05CexZr0.95-xO2 ternary solid solution catalysts. Appl. Catal., A 2016, 523, 230-240. [CrossRef]
- Bastan, F.; Kazemeini, M.; Larimi, A. S. Aqueous-phase reforming of glycerol for production of alkanes over Ni/CexZr1-xO2 nano-catalyst: Effects of the support’s composition. Renewable Energy 2017, 108, 417-424. [CrossRef]
- Elliott, D. C.; Hart, T. R.; Neuenschwander, G. G. Chemical Processing in High-Pressure Aqueous Environments. 8. Improved Catalysts for Hydrothermal Gasification. Ind. Eng. Chem. Res. 2006, 45 (11), 3776-3781. [CrossRef]
- Lin, L.; Zhou, W.; Gao, R.; Yao, S.; Zhang, X.; Xu, W.; Zheng, S.; Jiang, Z.; Yu, Q.; Li, Y.-W.; et al. Low-temperature hydrogen production from water and methanol using Pt/α-MoC catalysts. Nature 2017, 544 (7648), 80-83. [CrossRef]
- Nozawa, T.; Mizukoshi, Y.; Yoshida, A.; Naito, S. Aqueous phase reforming of ethanol and acetic acid over TiO2 supported Ru catalysts. Appl. Catal., B 2014, 146, 221-226. [CrossRef]
- Nozawa, T.; Yoshida, A.; Hikichi, S.; Naito, S. Effects of Re addition upon aqueous phase reforming of ethanol over TiO2 supported Rh and Ir catalysts. Int. J. Hydrogen Energy 2015, 40 (11), 4129-4140. [CrossRef]
- Zhao, Z.; Zhang, L.; Tan, Q.; Yang, F.; Faria, J.; Resasco, D. Synergistic bimetallic Ru–Pt catalysts for the low-temperature aqueous phase reforming of ethanol. AlChE J. 2019, 65 (1), 151-160. [CrossRef]
- Valente, J. S.; Hernandez-Cortez, J.; Cantu, M. S.; Ferrat, G.; López-Salinas, E. Calcined layered double hydroxides Mg–Me–Al (Me: Cu, Fe, Ni, Zn) as bifunctional catalysts. Catal. Today 2010, 150 (3), 340-345. [CrossRef]
- Dewoolkar, K. D.; Vaidya, P. D. Sorption-Enhanced Steam Reforming of Glycerol over Ni–hydrotalcite: Effect of Promotion with Pt. ChemCatChem 2016, 8 (22), 3499-3509. [CrossRef]
- Ghungrud, S. A.; Vaidya, P. D. Improved Hydrogen Production from Sorption-Enhanced Steam Reforming of Ethanol (SESRE) Using Multifunctional Materials of Cobalt Catalyst and Mg-, Ce-, and Zr-Modified CaO Sorbents. Ind. Eng. Chem. Res. 2020, 59 (2), 693-703. [CrossRef]
- Ghungrud, S. A.; Vaidya, P. D. Sorption-enhanced reaction process for glycerol-to-hydrogen conversion over cobalt catalyst supported on promoted hydrotalcites. Int. J. Hydrogen Energy 2020, 45 (16), 9440-9450. [CrossRef]
- Huang, J.; Xie, L.; Luo, X.; Wang, C.; Shu, R.; Song, Q.; Liu, J.; Tian, Z.; Chen, Y. Hydrogen production by aqueous phase reforming over stable La-promoted Ni-based hydrotalcite catalysts. Int. J. Hydrogen Energy 2024, 50, 681-689. [CrossRef]
- Manfro, R. L.; Pires, T. P. M. D.; Ribeiro, N. F. P.; Souza, M. M. V. M. Aqueous-phase reforming of glycerol using Ni–Cu catalysts prepared from hydrotalcite-like precursors. Catal. Sci. Technol. 2013, 3 (5), 1278. [CrossRef]
- Cruz, I. O.; Ribeiro, N. F. P.; Aranda, D. A. G.; Souza, M. M. V. M. Hydrogen production by aqueous-phase reforming of ethanol over nickel catalysts prepared from hydrotalcite precursors. Catal. Commun. 2008, 9 (15), 2606-2611. [CrossRef]
- Huber, G. W.; Guymon, C. G.; Conrad, T. L.; Stephenson, B. C.; Bartholomew, C. H. Hydrothermal Stability of Co/SiO2 Fischer-Tropsch Synthesis Catalysts. In Studies in Surface Science and Catalysis, Spivey, J. J., Roberts, G. W., Davis, B. H. Eds.; Vol. 139; Elsevier, 2001; pp 423-430.
- Karim, A. M.; Howard, C.; Roberts, B.; Kovarik, L.; Zhang, L.; King, D. L.; Wang, Y. In Situ X-ray Absorption Fine Structure Studies on the Effect of pH on Pt Electronic Density during Aqueous Phase Reforming of Glycerol. ACS Catal. 2012, 2 (11), 2387-2394. [CrossRef]
- Kim, T.-W.; Kim, H.-D.; Jeong, K.-E.; Chae, H.-J.; Jeong, S.-Y.; Lee, C.-H.; Kim, C.-U. Catalytic production of hydrogen through aqueous-phase reforming over platinum/ordered mesoporous carbon catalysts. Green Chem. 2011, 13 (7), 1718. [CrossRef]
- Kim, M.-C.; Kim, T.-W.; Kim, H. J.; Kim, C.-U.; Bae, J. W. Aqueous phase reforming of polyols for hydrogen production using supported PtFe bimetallic catalysts. Renewable Energy 2016, 95, 396-403. [CrossRef]
- King, D. L.; Zhang, L.; Xia, G.; Karim, A. M.; Heldebrant, D. J.; Wang, X.; Peterson, T.; Wang, Y. Aqueous phase reforming of glycerol for hydrogen production over Pt–Re supported on carbon. Appl. Catal., B 2010, 99 (1), 206-213. [CrossRef]
- Wang, P.; Huang, Y.; Shu, R.; Wang, J.; Liu, J.; Wang, C.; Tian, Z.; Chen, Y. Efficient hydrogen production by methanol aqueous phase reforming over KMnO4 modified PtMnK/AC catalyst: Regulating the hydrophilicity of carbon support. Mol. Catal. 2024, 559, 114105. [CrossRef]
- Zheng, Z.; Fang, Y.; Ma, L.; Wu, X.; Meng, Q.; Wang, T. High-loaded sub-6 nm Cu catalyst with superior hydrothermal-stability and efficiency for aqueous phase reforming of methanol to hydrogen. Int. J. Hydrogen Energy 2022, 47 (54), 22752-22762. [CrossRef]
- Kim, H.-D.; Kim, T.-W.; Park, H. J.; Jeong, K.-E.; Chae, H.-J.; Jeong, S.-Y.; Lee, C.-H.; Kim, C.-U. Hydrogen production via the aqueous phase reforming of ethylene glycol over platinum-supported ordered mesoporous carbon catalysts: Effect of structure and framework-configuration. Int. J. Hydrogen Energy 2012, 37 (17), 12187-12197. [CrossRef]
- Park, H. J.; Kim, H.-D.; Kim, T.-W.; Jeong, K.-E.; Chae, H.-J.; Jeong, S.-Y.; Chung, Y.-M.; Park, Y.-K.; Kim, C.-U. Production of Biohydrogen by Aqueous Phase Reforming of Polyols over Platinum Catalysts Supported on Three-Dimensionally Bimodal Mesoporous Carbon. ChemSusChem 2012, 5 (4), 629-633. [CrossRef]
- Gai, C.; Wang, X.; Liu, J.; Liu, Z.; Ok, Y. S.; Liu, W.; Yip, A. C. K. Ni/Hydrochar Nanostructures Derived from Biomass as Catalysts for H2 Production through Aqueous-Phase Reforming of Methanol. ACS Applied Nano Materials 2021, 4 (9), 8958-8971. [CrossRef]
- Wu, X.; Zheng, Z.; Ma, L.; Hu, C.; Pi, Y.; Wang, T. Engineering of the Cu+/Cu0 interface by chitosan-glucose complex for aqueous phase reforming of methanol into hydrogen. Int. J. Hydrogen Energy 2023, 48 (87), 33948-33959. [CrossRef]
- Xiao, Z.; Meng, Q.; Qiu, C.; Qiu, S.; Wu, X.; Ma, L.; Wang, T. Promoting mechanism of alkali for aqueous phase reforming of bio-methanol towards highly efficient production of COx-free hydrogen. Fuel Process. Technol. 2022, 236, 107385. [CrossRef]
- Li, J.; Lu, M.; Ge, Y.; Lu, W.; Liu, Z.; Xu, H.; Zhang, Y.; Li, Z.; Zheng, Z.; Gao, P.; et al. Efficient and sustainable H2 production from aqueous-phase reforming of methanol over Cu@CA-Val catalyst at low temperatures. Int. J. Hydrogen Energy 2024, 71, 775-784. [CrossRef]
- Chen, B.; Zheng, Z.; Hu, C.; Zengcai, Z.; Liu, Z.; Lu, M.; Meng, Q.; Wang, T. High-content graphitized N-doped carbon encapsulated Cu catalyst in aqueous phase reforming of methanol for efficient hydrogen production. Fuel 2024, 371, 131888. [CrossRef]
- Zheng, Z.; Fang, Y.; Yang, J.; Ma, L.; Meng, Q.; Lin, X.; Liu, Y.; Zhang, Q.; Wang, T. A highly active and hydrothermal-resistant Cu/ZnO@NC catalyst for aqueous phase reforming of methanol to hydrogen. Int. J. Hydrogen Energy 2022, 47 (2), 950-961. [CrossRef]
- Lu, M.; Liu, S.; Zhu, H.; Huang, H.; Lin, C.; Li, J.; Zhang, B.; Zheng, Z.; Hu, C.; Wu, X.; et al. Highly efficient releasing of hydrogen from aqueous-phase reforming of methanol over Cu-SP/Al2O3–ZnO catalyst by carbon layer encapsulated hierarchical porous microsphere strategy. Int. J. Hydrogen Energy 2024, 52, 125-139. [CrossRef]
- van Haasterecht, T.; Ludding, C. C. I.; de Jong, K. P.; Bitter, J. H. Toward stable nickel catalysts for aqueous phase reforming of biomass-derived feedstock under reducing and alkaline conditions. J. Catal. 2014, 319, 27-35. [CrossRef]
- van Haasterecht, T.; Ludding, C. C. I.; de Jong, K. P.; Bitter, J. H. Stability and activity of carbon nanofiber-supported catalysts in the aqueous phase reforming of ethylene glycol. J. Energy Chem. 2013, 22 (2), 257-269. [CrossRef]
- Wang, X.; Li, N.; Pfefferle, L. D.; Haller, G. L. Pt–Co bimetallic catalyst supported on single walled carbon nanotube: XAS and aqueous phase reforming activity studies. Catal. Today 2009, 146 (1), 160-165. [CrossRef]
- Wang, X.; Li, N.; Pfefferle, L. D.; Haller, G. L. Pt−Co Bimetallic Catalyst Supported on Single-Walled Carbon Nanotubes: Effect of Alloy Formation and Oxygen Containing Groups. J. Phys. Chem. C 2010, 114 (40), 16996-17002. [CrossRef]
- Wang, X.; Li, N.; Webb, J. A.; Pfefferle, L. D.; Haller, G. L. Effect of surface oxygen containing groups on the catalytic activity of multi-walled carbon nanotube supported Pt catalyst. Appl. Catal., B 2010, 101 (1), 21-30. [CrossRef]
- Wang, X.; Li, N.; Zhang, Z.; Wang, C.; Pfefferle, L. D.; Haller, G. L. High-Yield Hydrogen Production from Aqueous Phase Reforming over Single-Walled Carbon Nanotube Supported Catalysts. ACS Catal. 2012, 2 (7), 1480-1486. [CrossRef]
- Rahman, M. M. H2 production from aqueous-phase reforming of glycerol over Cu–Ni bimetallic catalysts supported on carbon nanotubes. Int. J. Hydrogen Energy 2015, 40 (43), 14833-14844. [CrossRef]
- He, C.; Zheng, J.; Wang, K.; Lin, H.; Wang, J.-Y.; Yang, Y. Sorption enhanced aqueous phase reforming of glycerol for hydrogen production over Pt-Ni supported on multi-walled carbon nanotubes. Appl. Catal., B 2015, 162, 401-411. [CrossRef]
- Tang, W.; Chen, Z.; Millan, M.; Zuo, X.; Yuan, G.; Cui, Z.; Dong, Z.; Cong, Y.; Li, X. Facile fabrication of porous carbon nanofibers encapsulated with nanoscale exposed Ni for producing high-purity hydrogen from cheap glycerol. Int. J. Hydrogen Energy 2023, 48 (97), 38172-38187. [CrossRef]
- Dehane, A.; Nemdili, L.; Merouani, S.; Ashokkumar, M. Critical Analysis of Hydrogen Production by Aqueous Methanol Sonolysis. Top. Curr. Chem. 2023, 381 (2), 9. [CrossRef]
- Yasui, K.; Tuziuti, T.; Kozuka, T.; Towata, A.; Iida, Y. Relationship between the bubble temperature and main oxidant created inside an air bubble under ultrasound. J. Chem. Phys. 2007, 127 (15), 154502. (acccessed 7/22/2024). [CrossRef]
- Merouani, S.; Ferkous, H.; Hamdaoui, O.; Rezgui, Y.; Guemini, M. New interpretation of the effects of argon-saturating gas toward sonochemical reactions. Ultrason. Sonochem. 2015, 23, 37-45. [CrossRef]
- Meroni, D.; Djellabi, R.; Ashokkumar, M.; Bianchi, C. L.; Boffito, D. C. Sonoprocessing: From Concepts to Large-Scale Reactors. Chem. Rev. 2022, 122 (3), 3219-3258. [CrossRef]
- Merabet, N.; Kerboua, K. Sonolytic and ultrasound-assisted techniques for hydrogen production: A review based on the role of ultrasound. Int. J. Hydrogen Energy 2022, 47 (41), 17879-17893. [CrossRef]
- Islam, M. H.; Burheim, O. S.; Pollet, B. G. Sonochemical and sonoelectrochemical production of hydrogen. Ultrason. Sonochem. 2019, 51, 533-555. [CrossRef]
- Kiss, A. A.; Geertman, R.; Wierschem, M.; Skiborowski, M.; Gielen, B.; Jordens, J.; John, J. J.; Van Gerven, T. Ultrasound-assisted emerging technologies for chemical processes. J. Chem. Technol. Biotechnol. 2018, 93 (5), 1219-1227. [CrossRef]
- Wood, R. J.; Lee, J.; Bussemaker, M. J. A parametric review of sonochemistry: Control and augmentation of sonochemical activity in aqueous solutions. Ultrason. Sonochem. 2017, 38, 351-370. [CrossRef]
- Suslick, K. S. Sonochemistry. Science 1990, 247 (4949), 1439-1445. [CrossRef]
- Didenko, Y. T.; Suslick, K. S. The energy efficiency of formation of photons, radicals and ions during single-bubble cavitation. Nature 2002, 418 (6896), 394-397. [CrossRef]
- Suslick, K. S.; Flannigan, D. J. Inside a Collapsing Bubble: Sonoluminescence and the Conditions During Cavitation. Annu. Rev. Phys. Chem. 2008, 59 (1), 659-683. [CrossRef]
- Xu, H.; Zeiger, B. W.; Suslick, K. S. Sonochemical synthesis of nanomaterials. Chem. Soc. Rev. 2013, 42 (7), 2555-2567. [CrossRef]
- Zhang, Y.; Khanbareh, H.; Dunn, S.; Bowen, C. R.; Gong, H.; Duy, N. P. H.; Phuong, P. T. T. High Efficiency Water Splitting using Ultrasound Coupled to a BaTiO3 Nanofluid. Advanced Science 2022, 9 (9), 2105248. [CrossRef]
- Buettner, J.; Gutierrez, M.; Henglein, A. Sonolysis of water-methanol mixtures. J. Phys. Chem. 1991, 95 (4), 1528-1530. [CrossRef]
- Rassokhin, D. N.; Kovalev, G. V.; Bugaenko, L. T. Temperature Effect on the Sonolysis of Methanol/Water Mixtures. J. Am. Chem. Soc. 1995, 117 (1), 344-347. [CrossRef]
- Mizukoshi, Y.; Nakamura, H.; Bandow, H.; Maeda, Y.; Nagata, Y. Sonolysis of organic liquid: effect of vapour pressure and evaporation rate. Ultrason. Sonochem. 1999, 6 (4), 203-209. [CrossRef]
- Suslick, K. S.; Gawienowski, J. J.; Schubert, P. F.; Wang, H. H. Alkane sonochemistry. J. Phys. Chem. 1983, 87 (13), 2299-2301. [CrossRef]
- Suslick, K. S.; Gawienowski, J. J.; Schubert, P. F.; Wang, H. H. Sonochemistry in non-aqueous liquids. Ultrasonics 1984, 22 (1), 33-36. [CrossRef]
- Krishna, C. M.; Lion, Y.; Kondo, T.; Riesz, P. Thermal decomposition of methanol in the sonolysis of methanol-water mixtures. Spin-trapping evidence for isotope exchange reactions. J. Phys. Chem. 1987, 91 (23), 5847-5850. [CrossRef]
- Rae, J.; Ashokkumar, M.; Eulaerts, O.; von Sonntag, C.; Reisse, J.; Grieser, F. Estimation of ultrasound induced cavitation bubble temperatures in aqueous solutions. Ultrason. Sonochem. 2005, 12 (5), 325-329. [CrossRef]
- Kerboua, K.; Hamdaoui, O. Oxygen-argon acoustic cavitation bubble in a water-methanol mixture: Effects of medium composition on sonochemical activity. Ultrason. Sonochem. 2020, 61, 104811. [CrossRef]
- Thomas, R. G.; Jonnalagadda, U. S.; Kwan, J. J. Biomedical Applications for Gas-Stabilizing Solid Cavitation Agents. Langmuir 2019, 35 (31), 10106-10115. [CrossRef]
- Jonnalagadda, U. S.; Fan, Q.; Su, X.; Liu, W.; Kwan, J. J. Nanostructured Sonophotocatalysts for spatially controlled inertial cavitation towards energy-efficient sonochemistry. ChemCatChem 2022, 14 (21). [CrossRef]
- Wang, Y.; Zhao, D.; Ji, H.; Liu, G.; Chen, C.; Ma, W.; Zhu, H.; Zhao, J. Sonochemical Hydrogen Production Efficiently Catalyzed by Au/TiO2. J. Phys. Chem. C 2010, 114 (41), 17728-17733. [CrossRef]
Figure 1.
Deactivation mechanisms for heterogeneous catalyst under hydrothermal condition. Reprinted with permission from ref 21. Copyright 2021 American Chemical Society.
Figure 1.
Deactivation mechanisms for heterogeneous catalyst under hydrothermal condition. Reprinted with permission from ref 21. Copyright 2021 American Chemical Society.
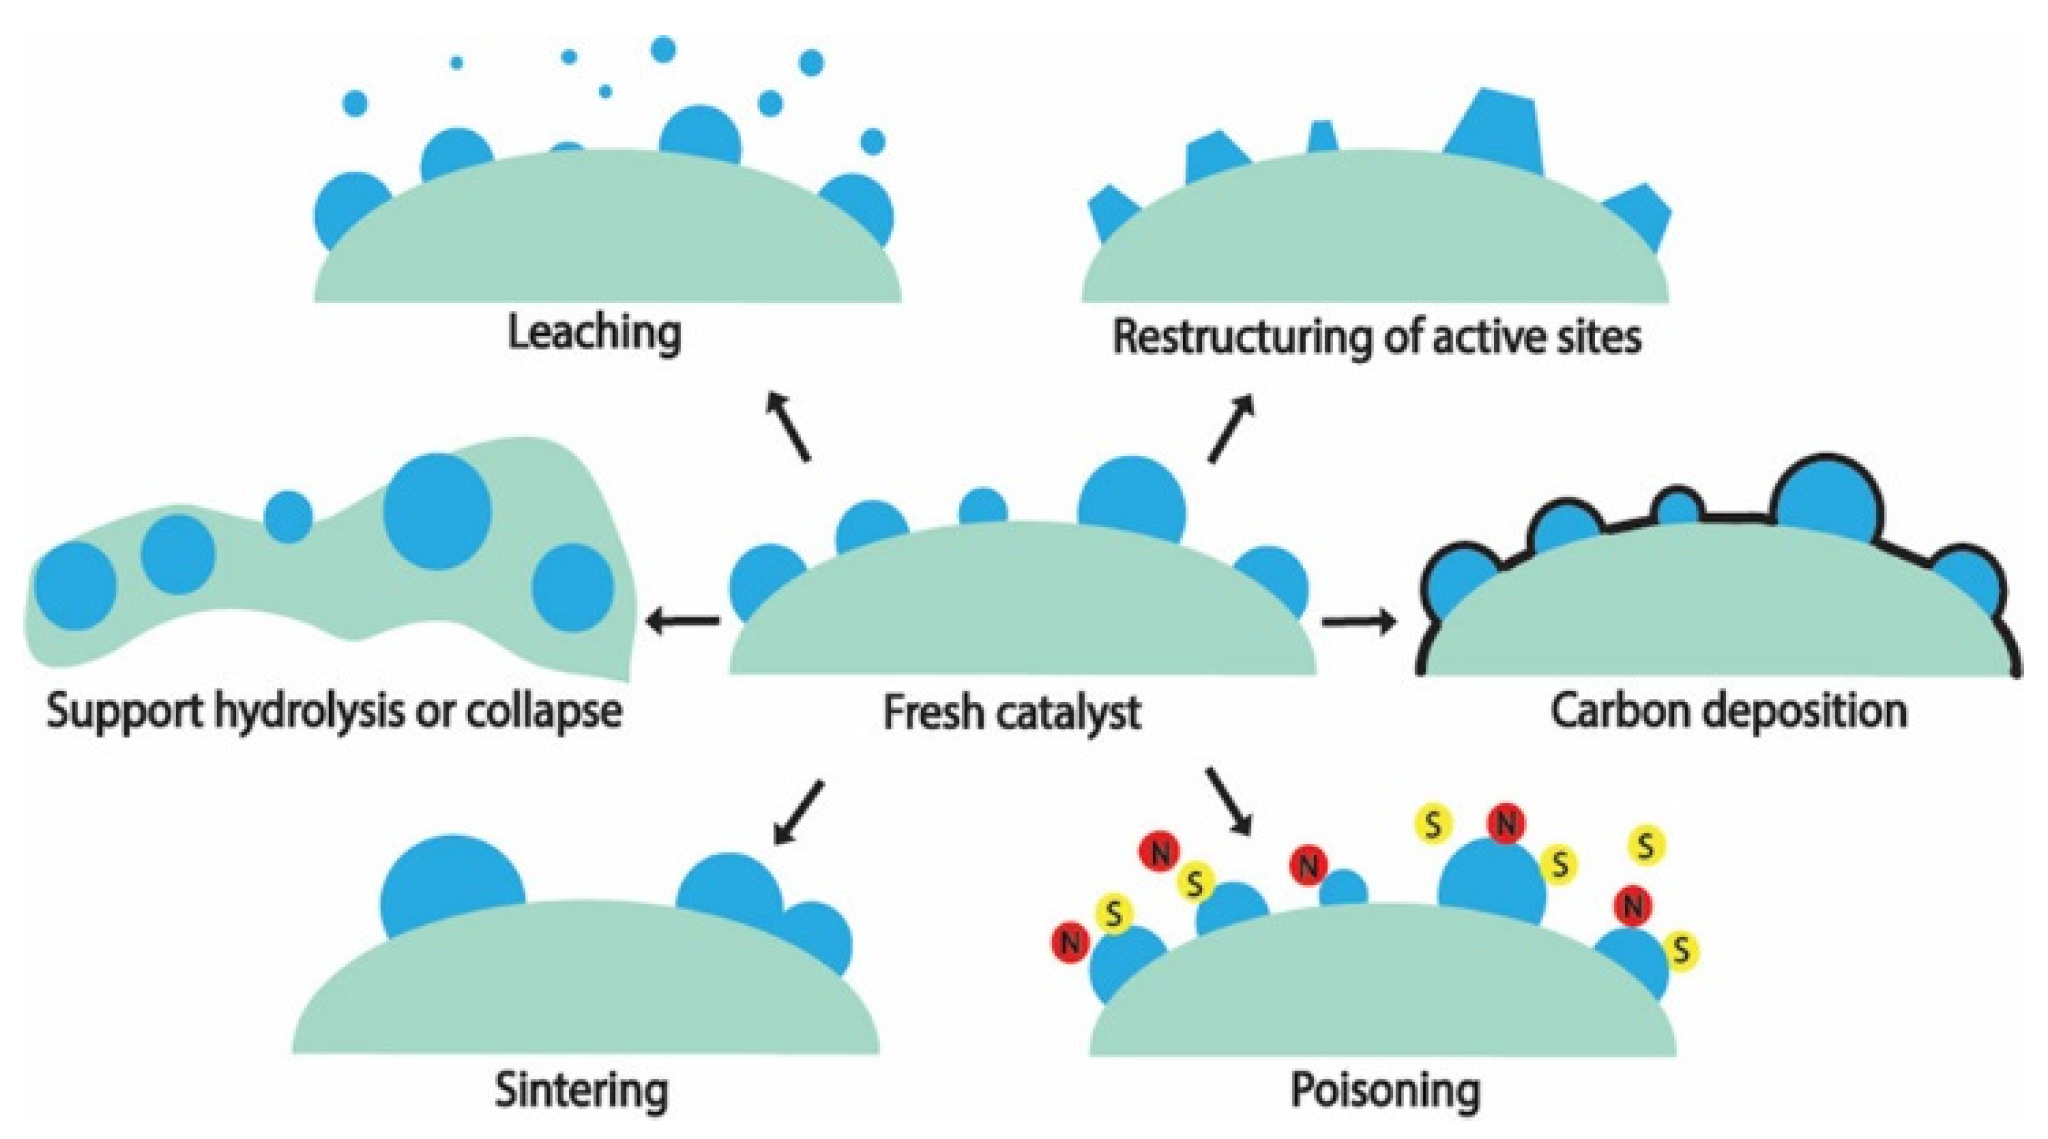
Figure 2.
Reaction pathway for the aqueous phase reforming of glycerol, ethylene glycol, ethanol and methanol. On the left side of the image is reactions that produce and consume H2, while on the right side are reactions that only consume H2, except for the water-gas shift reaction which produces H2 from CO and water.
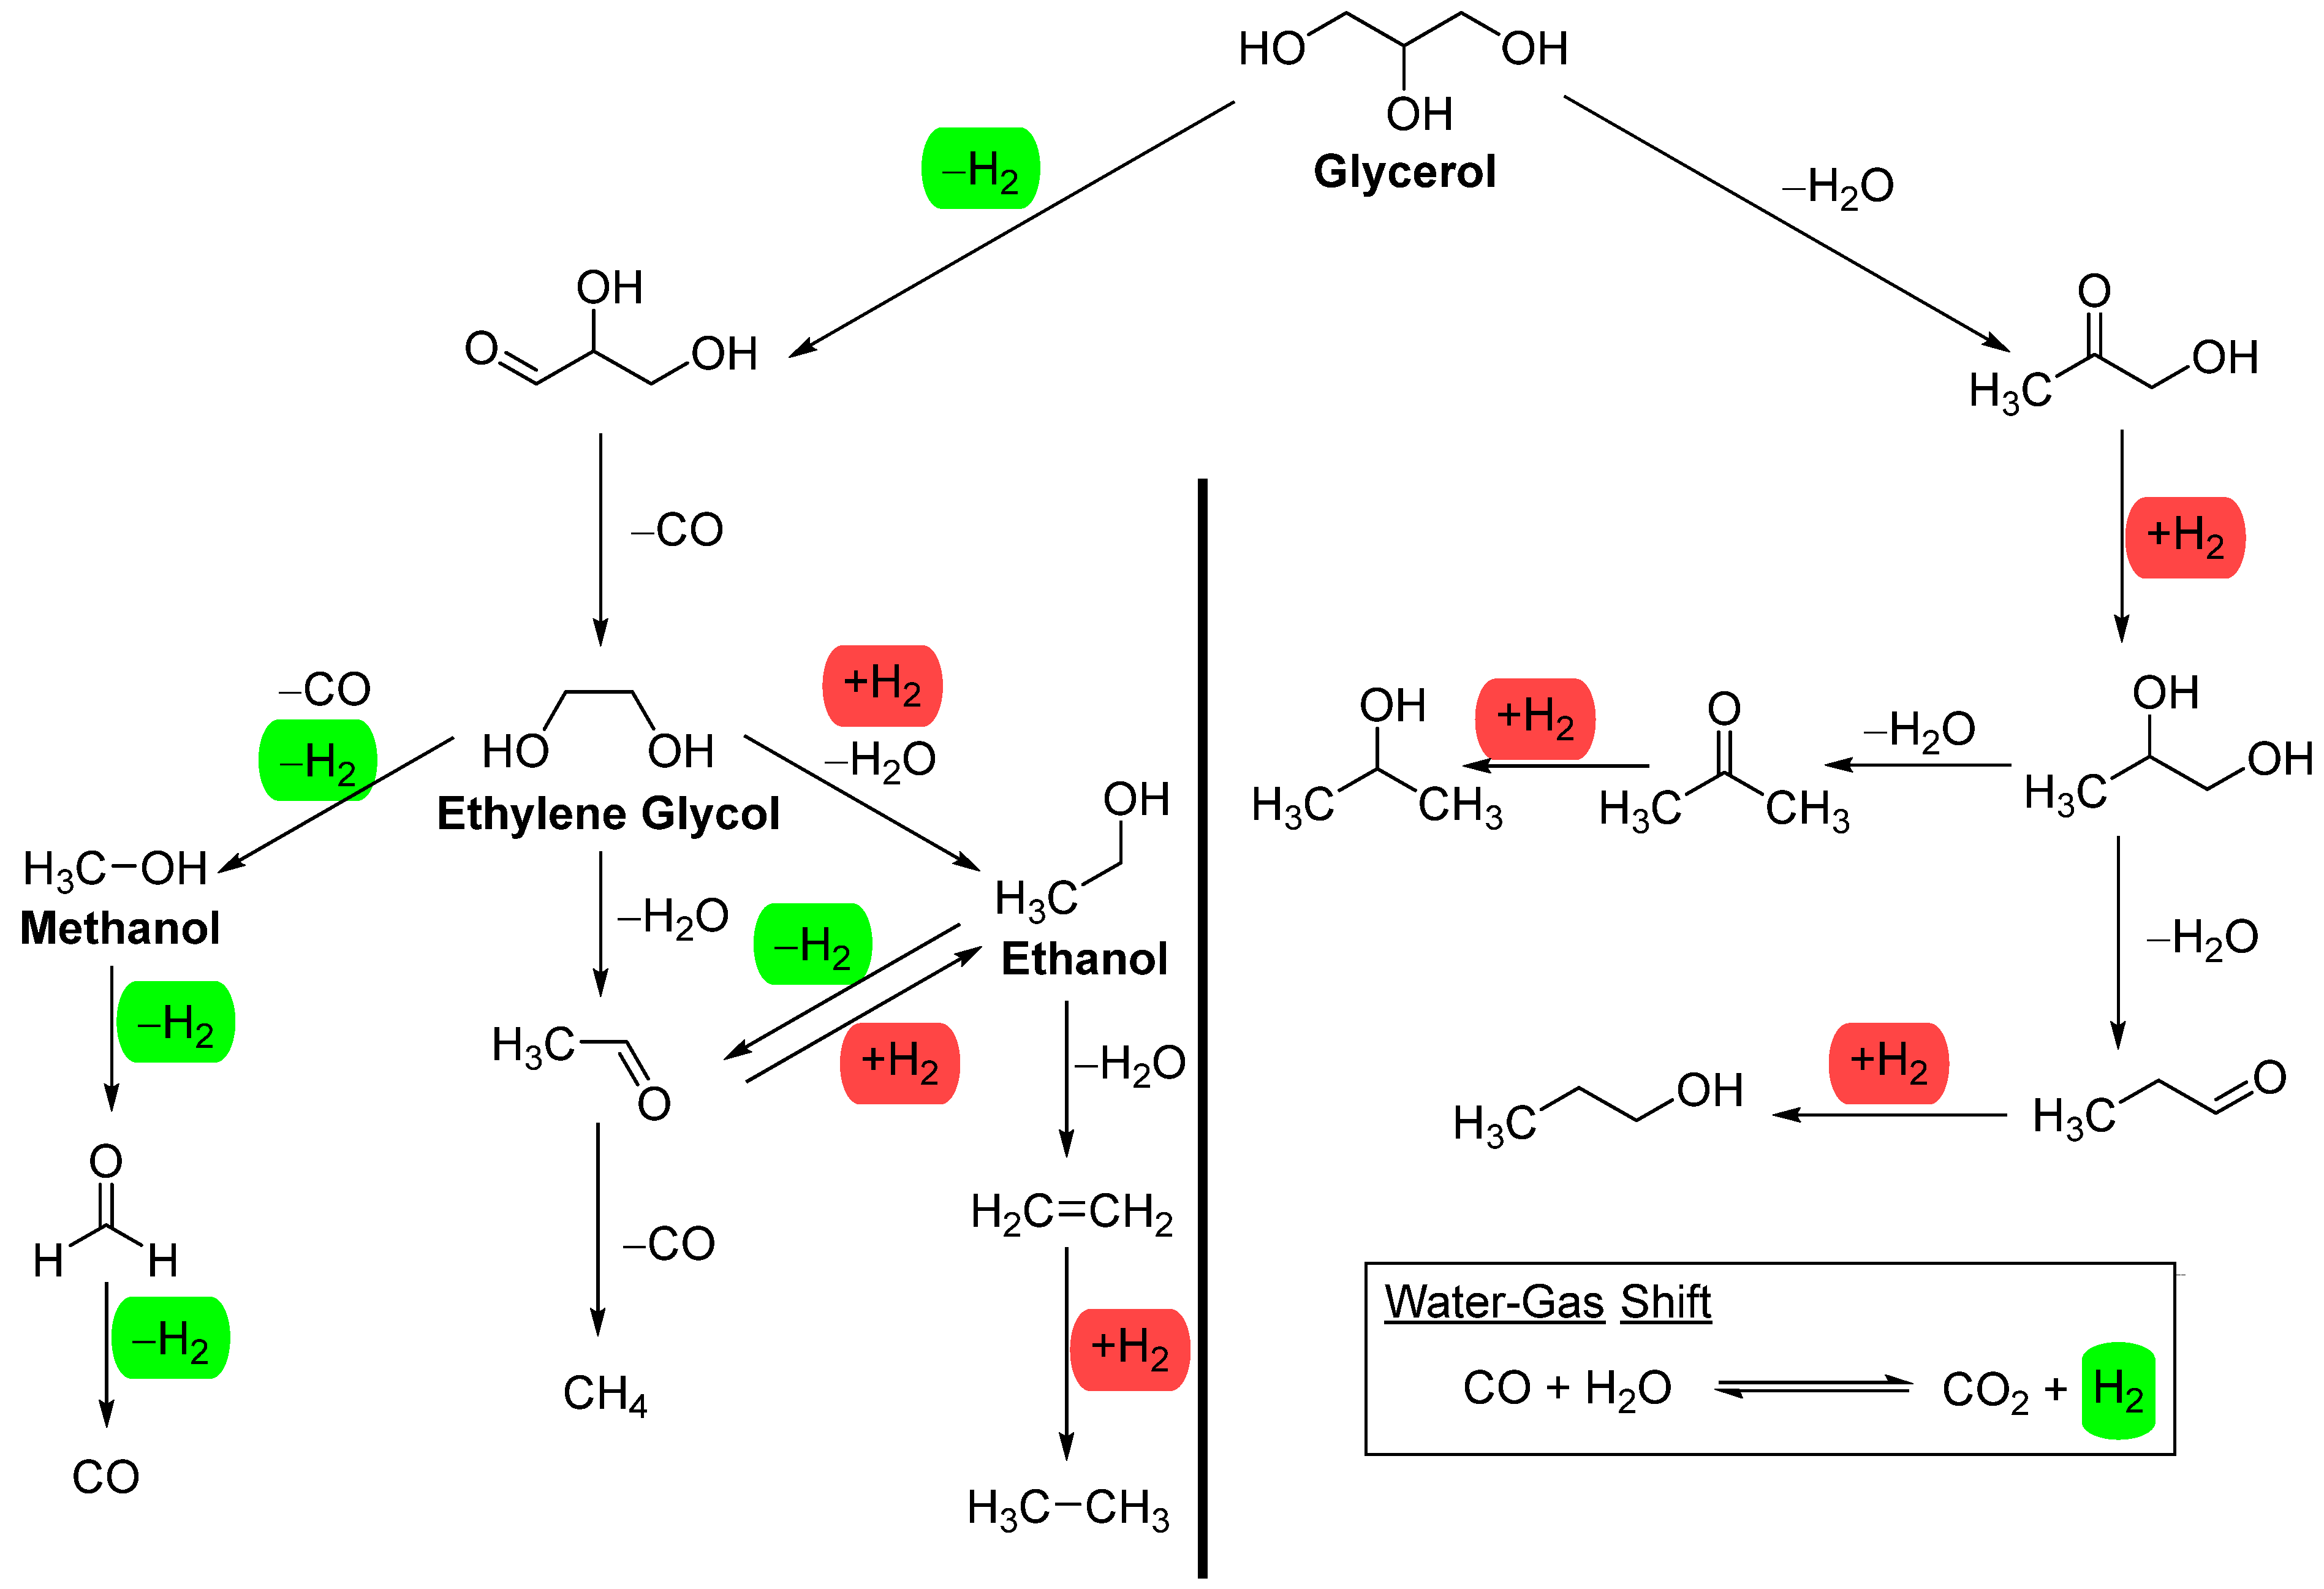
Figure 3.
Hydrothermal stability of support for heterogeneous catalysts in hot water that is less than 374°C. Represent from ref [32] with permission. Copyright 2014 Royal Society of Chemistry.
Figure 3.
Hydrothermal stability of support for heterogeneous catalysts in hot water that is less than 374°C. Represent from ref [32] with permission. Copyright 2014 Royal Society of Chemistry.
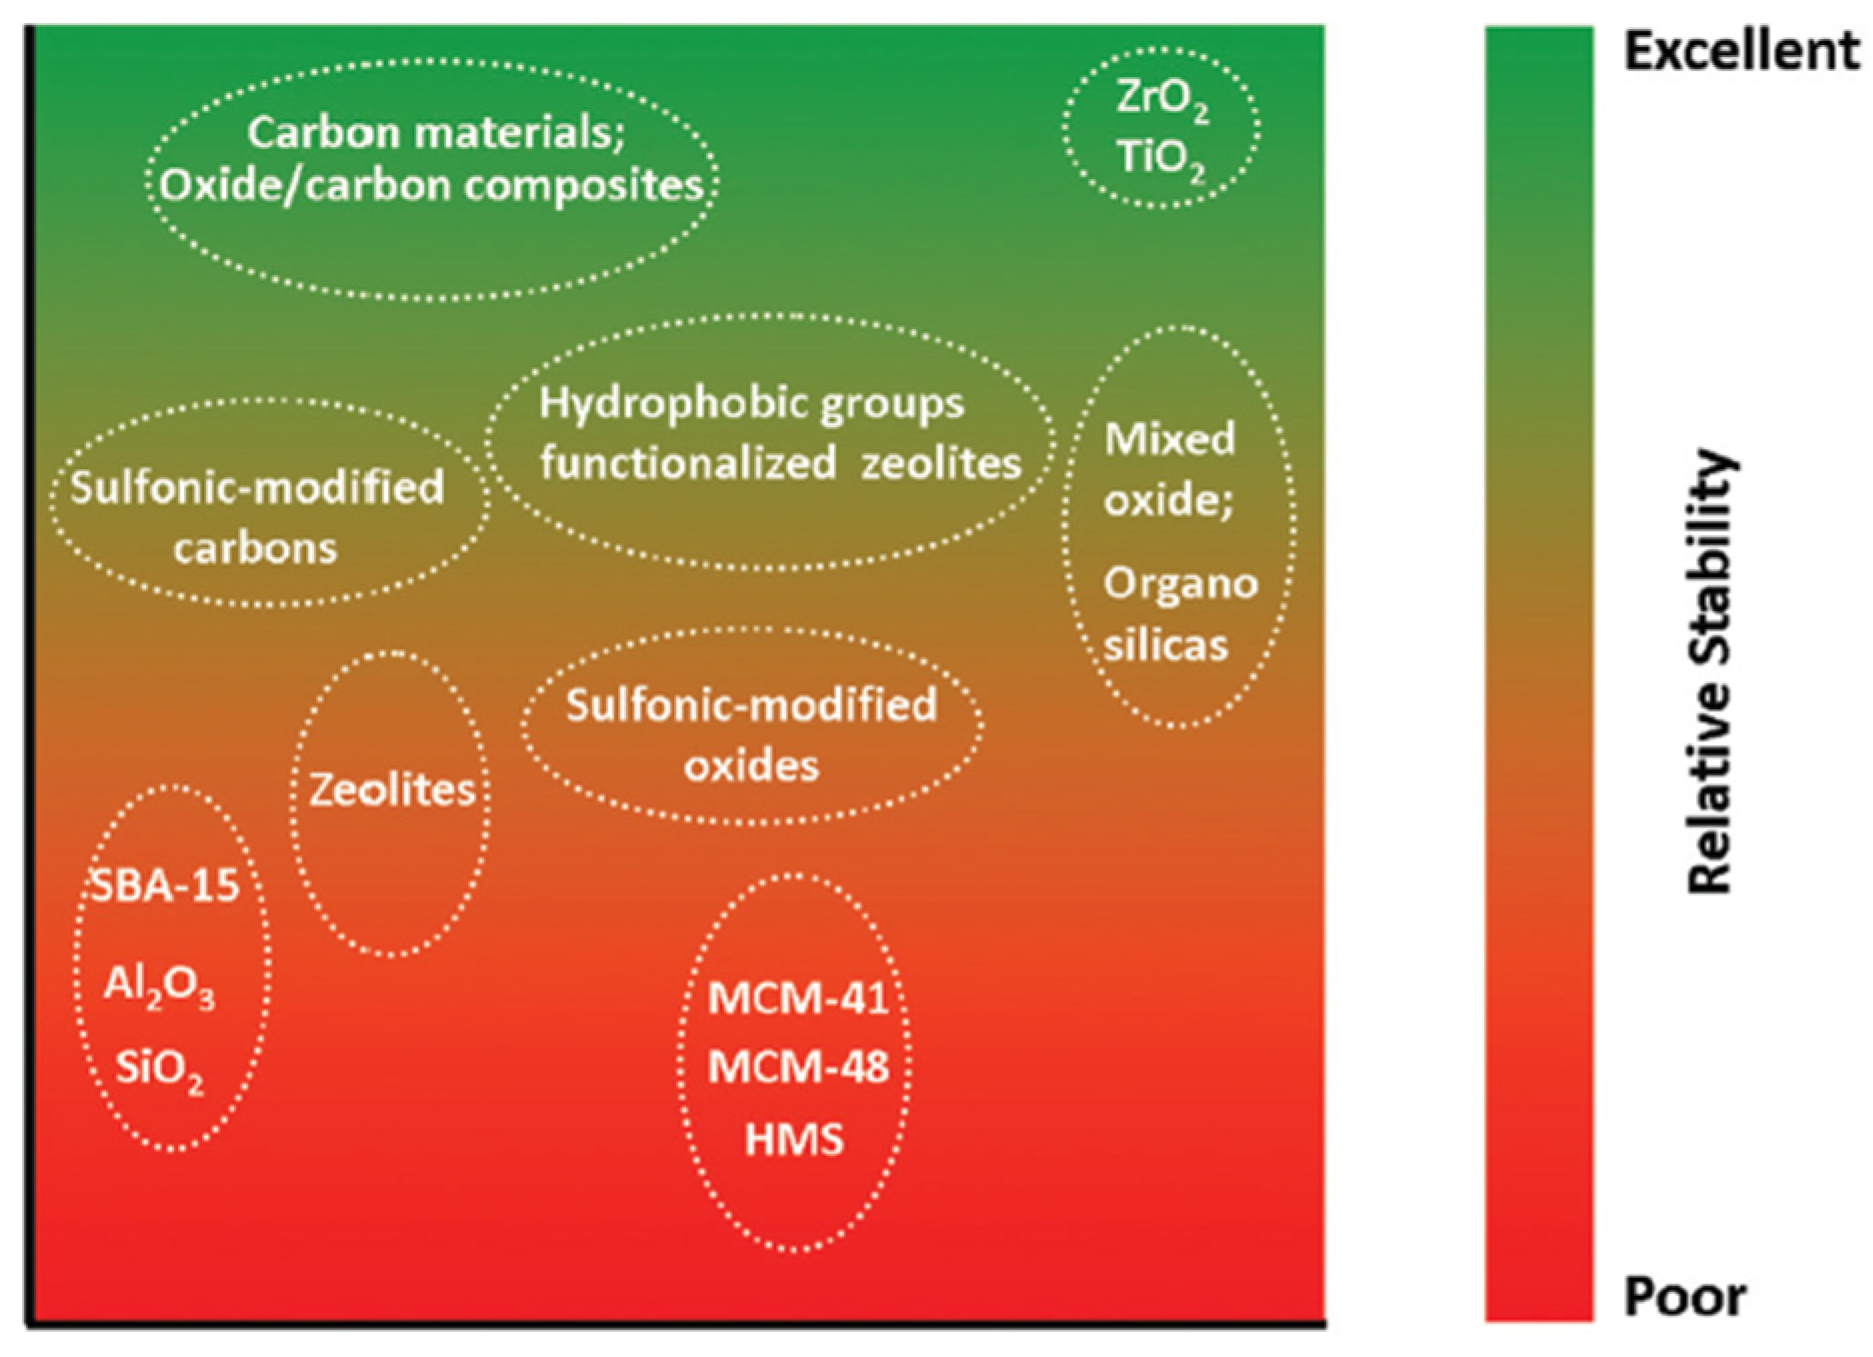
Figure 4.
Stability of various active metals supported on alumina in glycerol APR at 230°C and 32 bar. a) 4.4 wt.% Pt/Al2O3. B) 17.4 wt.% Ni/Al2O3 C) 15.38 wt.% Co/Al2O3 D) 6.1 wt.% Cu/Al2O3. Reprinted from International Journal of Hydrogen Energy, 33, Wen, G.; Xu, Y.; Ma, H.; Xu, Z.; Tian, Z., Production of hydrogen by aqueous-phase reforming of glycerol, 6657, Copyright (2008), with permission from Elsevier.
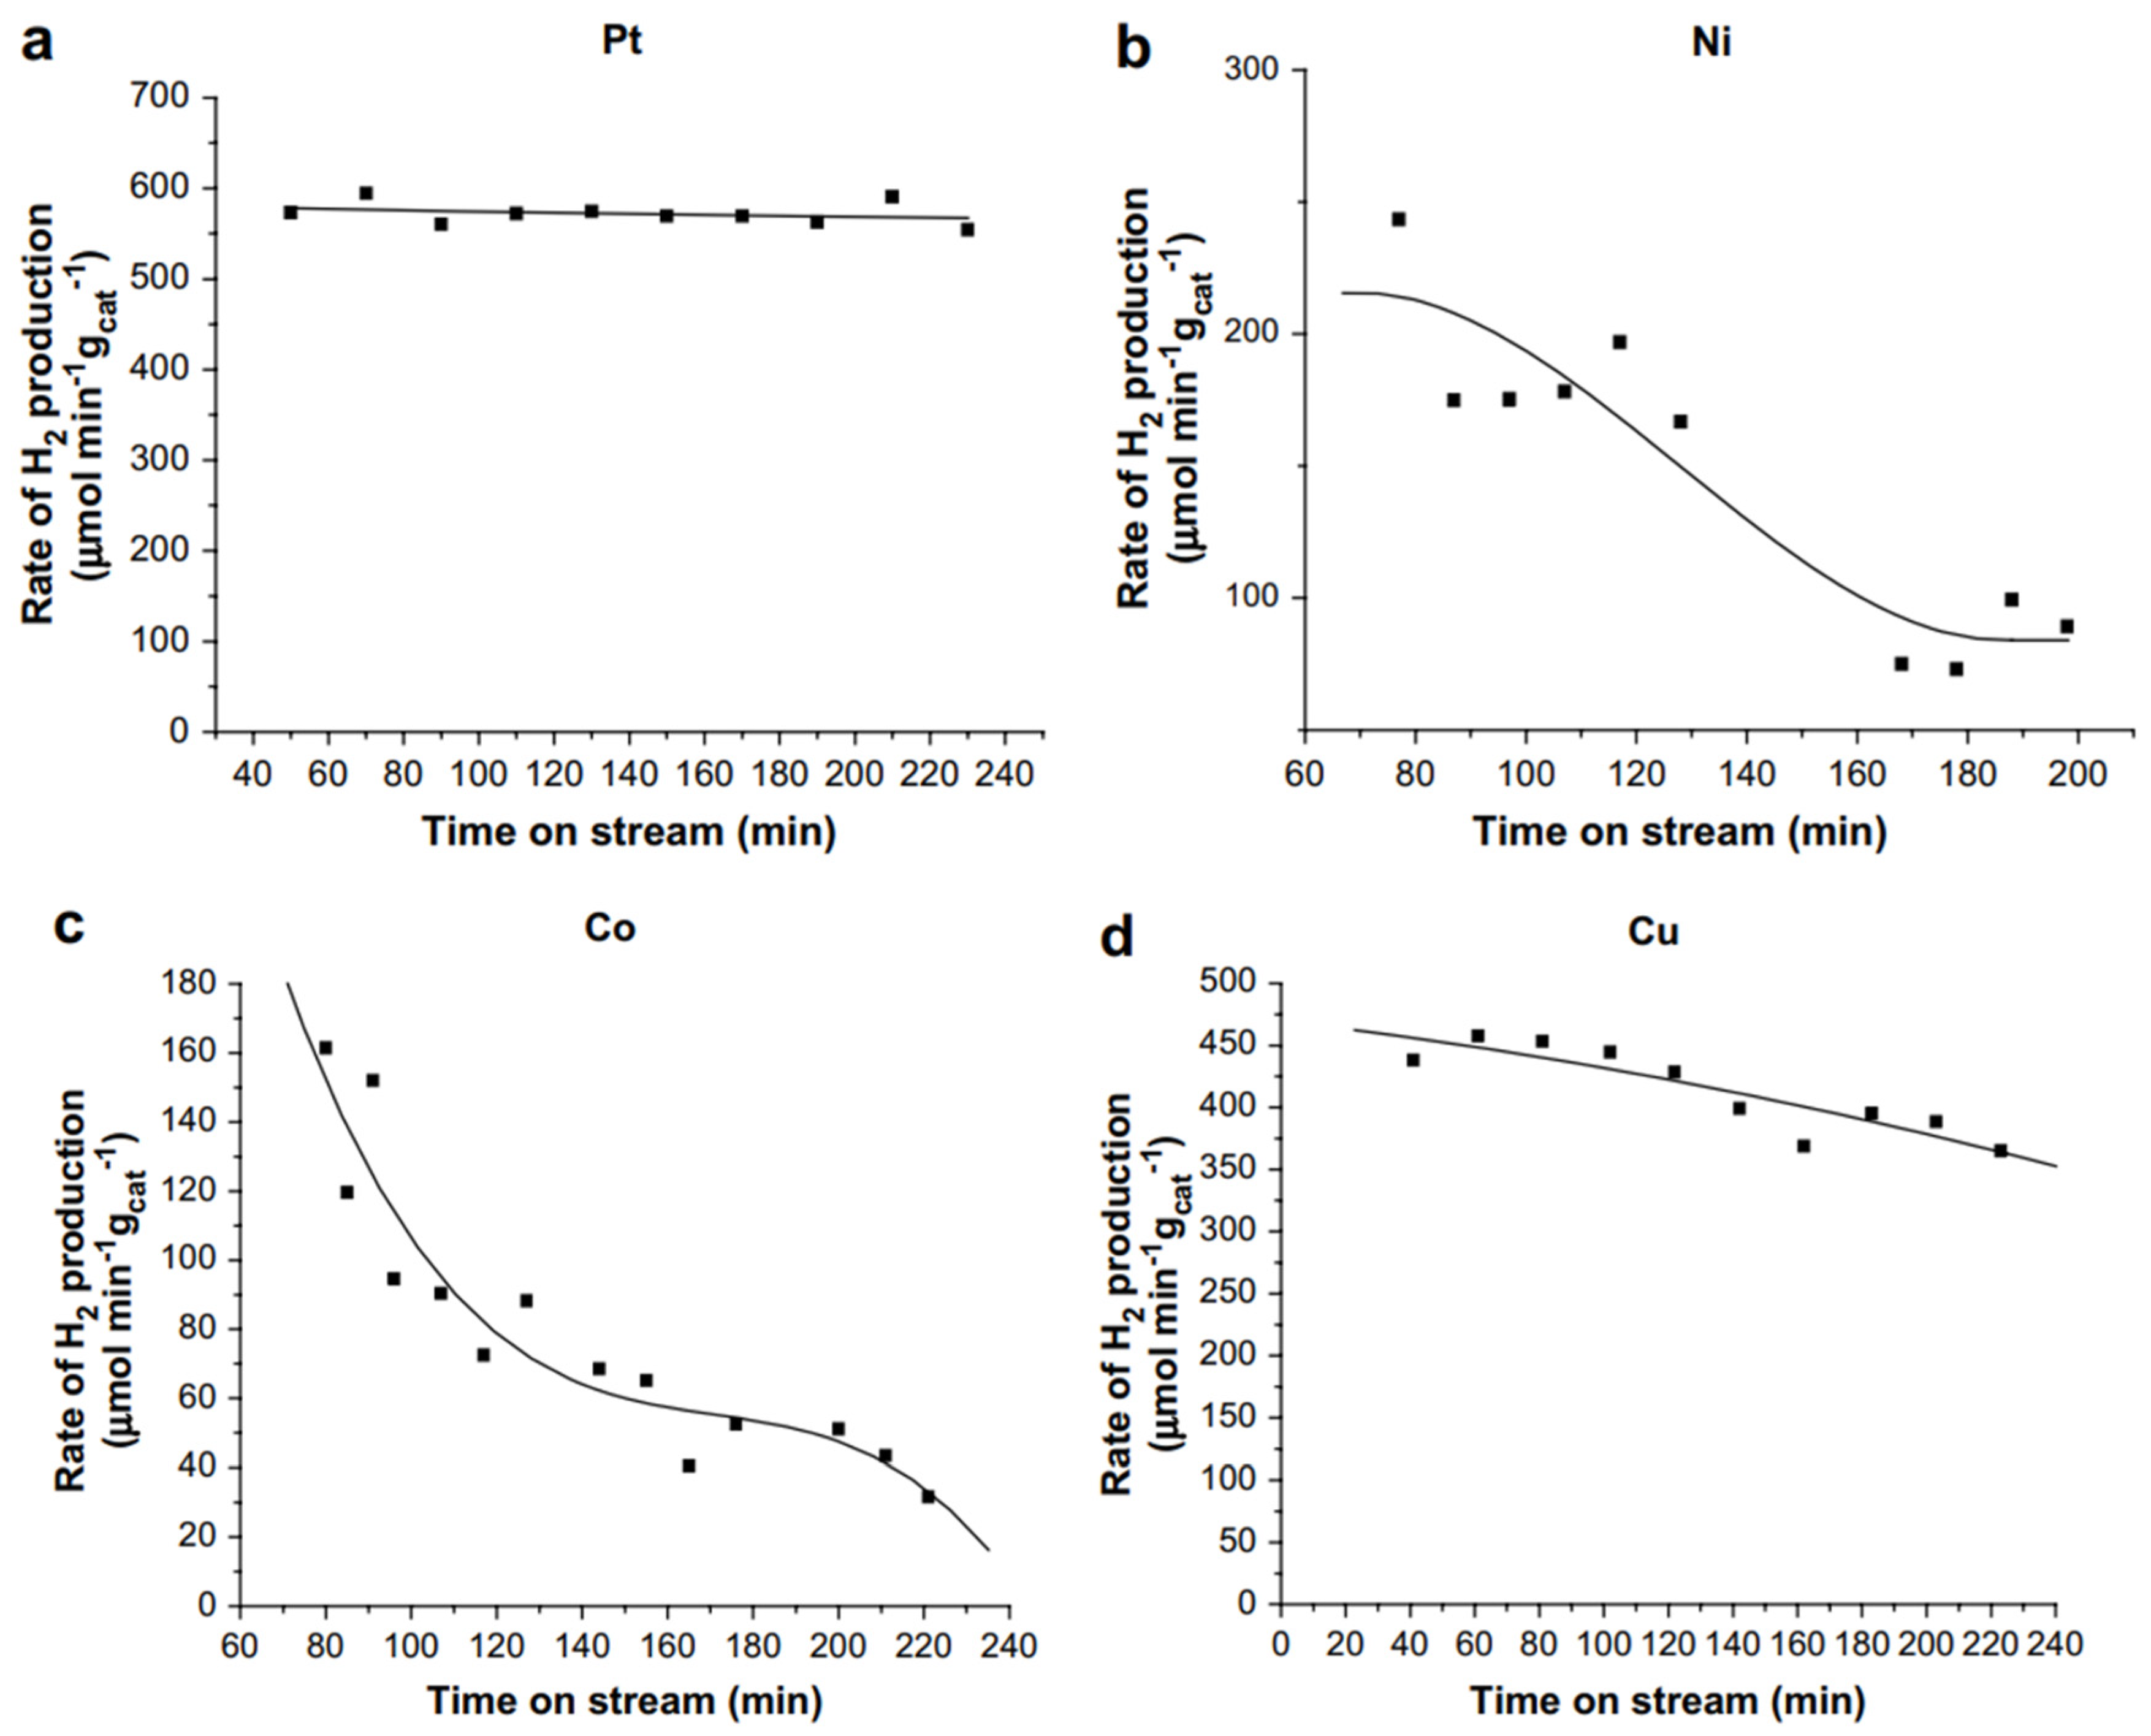
Figure 5.
Hydrogen production rate of Pt/HUSY in the APR of 10 wt.% glycerol in water at 230°C, 32 bar, LHSV of 8 h-1. Data extracted from the work of Wen et al.42 with Webplotdigitizer.58.
Figure 5.
Hydrogen production rate of Pt/HUSY in the APR of 10 wt.% glycerol in water at 230°C, 32 bar, LHSV of 8 h-1. Data extracted from the work of Wen et al.42 with Webplotdigitizer.58.
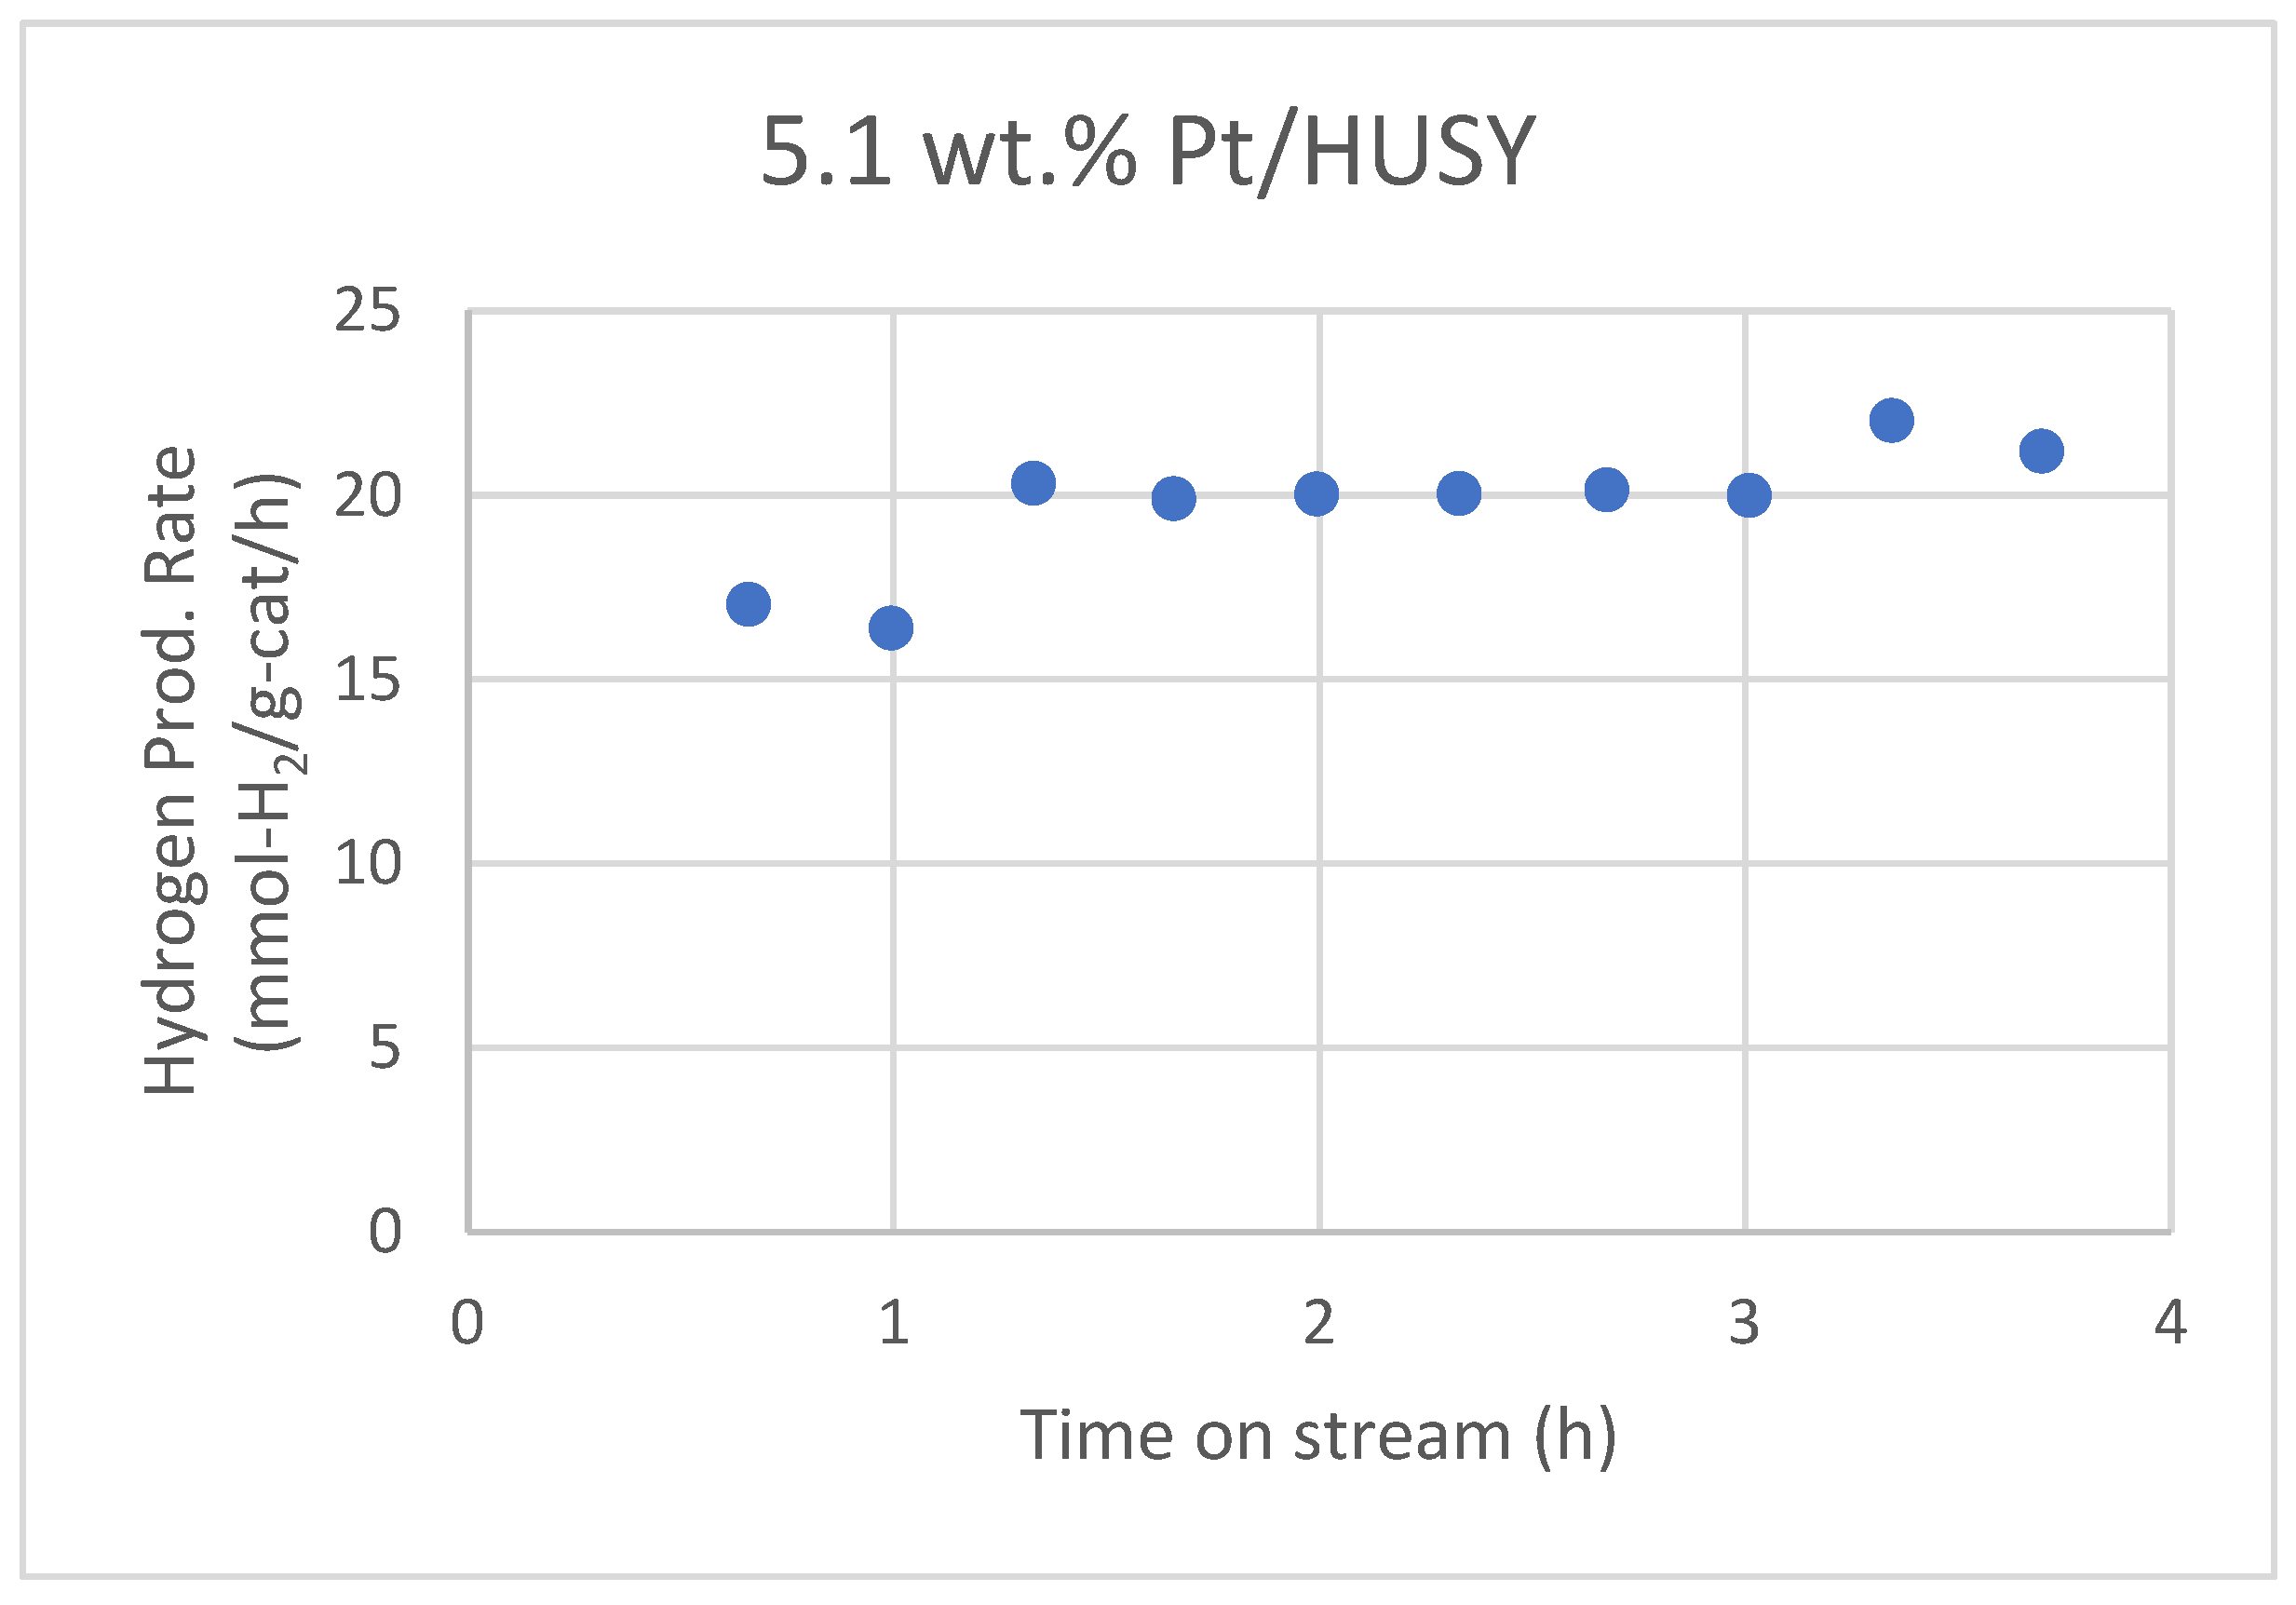
Figure 6.
Data is extracted from Nozawa et al. [80] with Webplot digitizer.[58] Reaction conditions: 0.5 g of catalysts, 80 mL of 10 vol.% aqueous EtOH, reaction temperature = 200°C and initial pressure = 20 bars. 5 wt.% Rh/TiO2, 5 wt.% Ir/TiO2, 5 wt.% Rh – 5 wt.% Re/TiO2 and 5 wt.% Ir – 5 wt.% Re/TiO2. EtOH conversion after 10 hours for Rh/TiO2 = 14.2%, Ir/TiO2 = 5.9%, Rh-Re/TiO2 = 36.1% and Ir-Re/TiO2 = 14.7%.
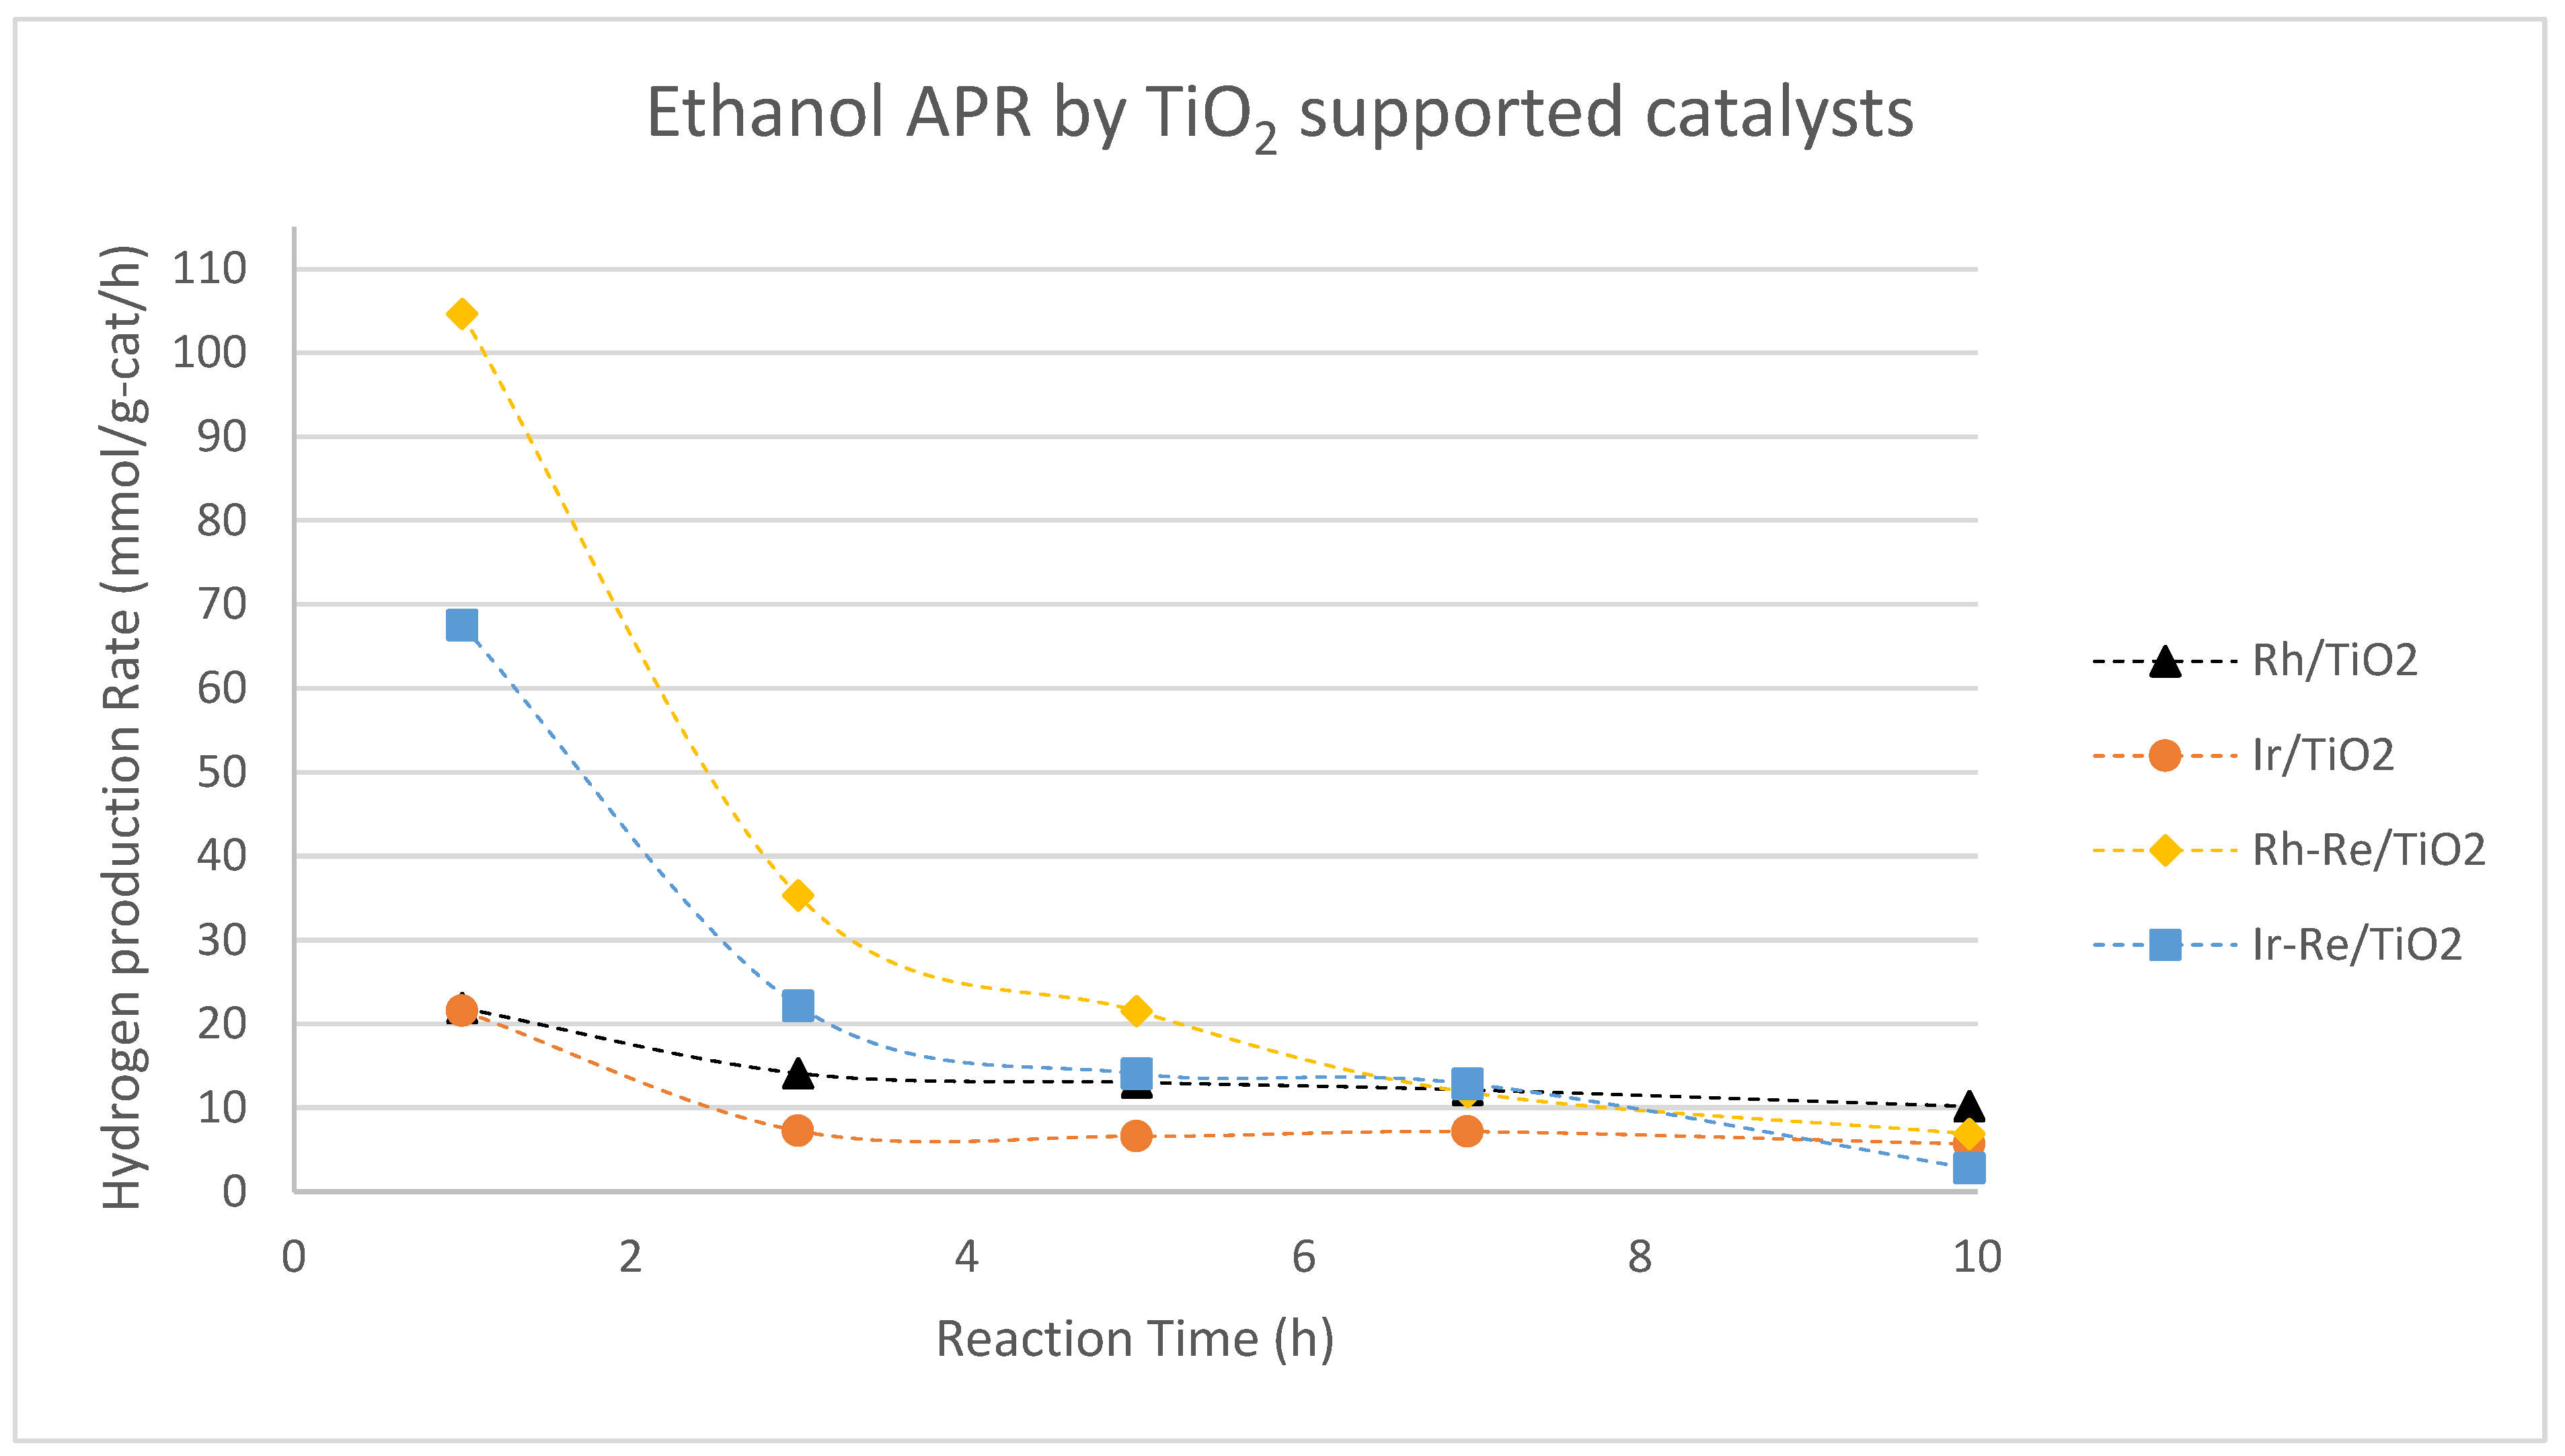
Figure 7.
The dependency of acoustic intensity and hydrogen production rate on liquid volume. Data from Zhang et al.[126].
Figure 7.
The dependency of acoustic intensity and hydrogen production rate on liquid volume. Data from Zhang et al.[126].
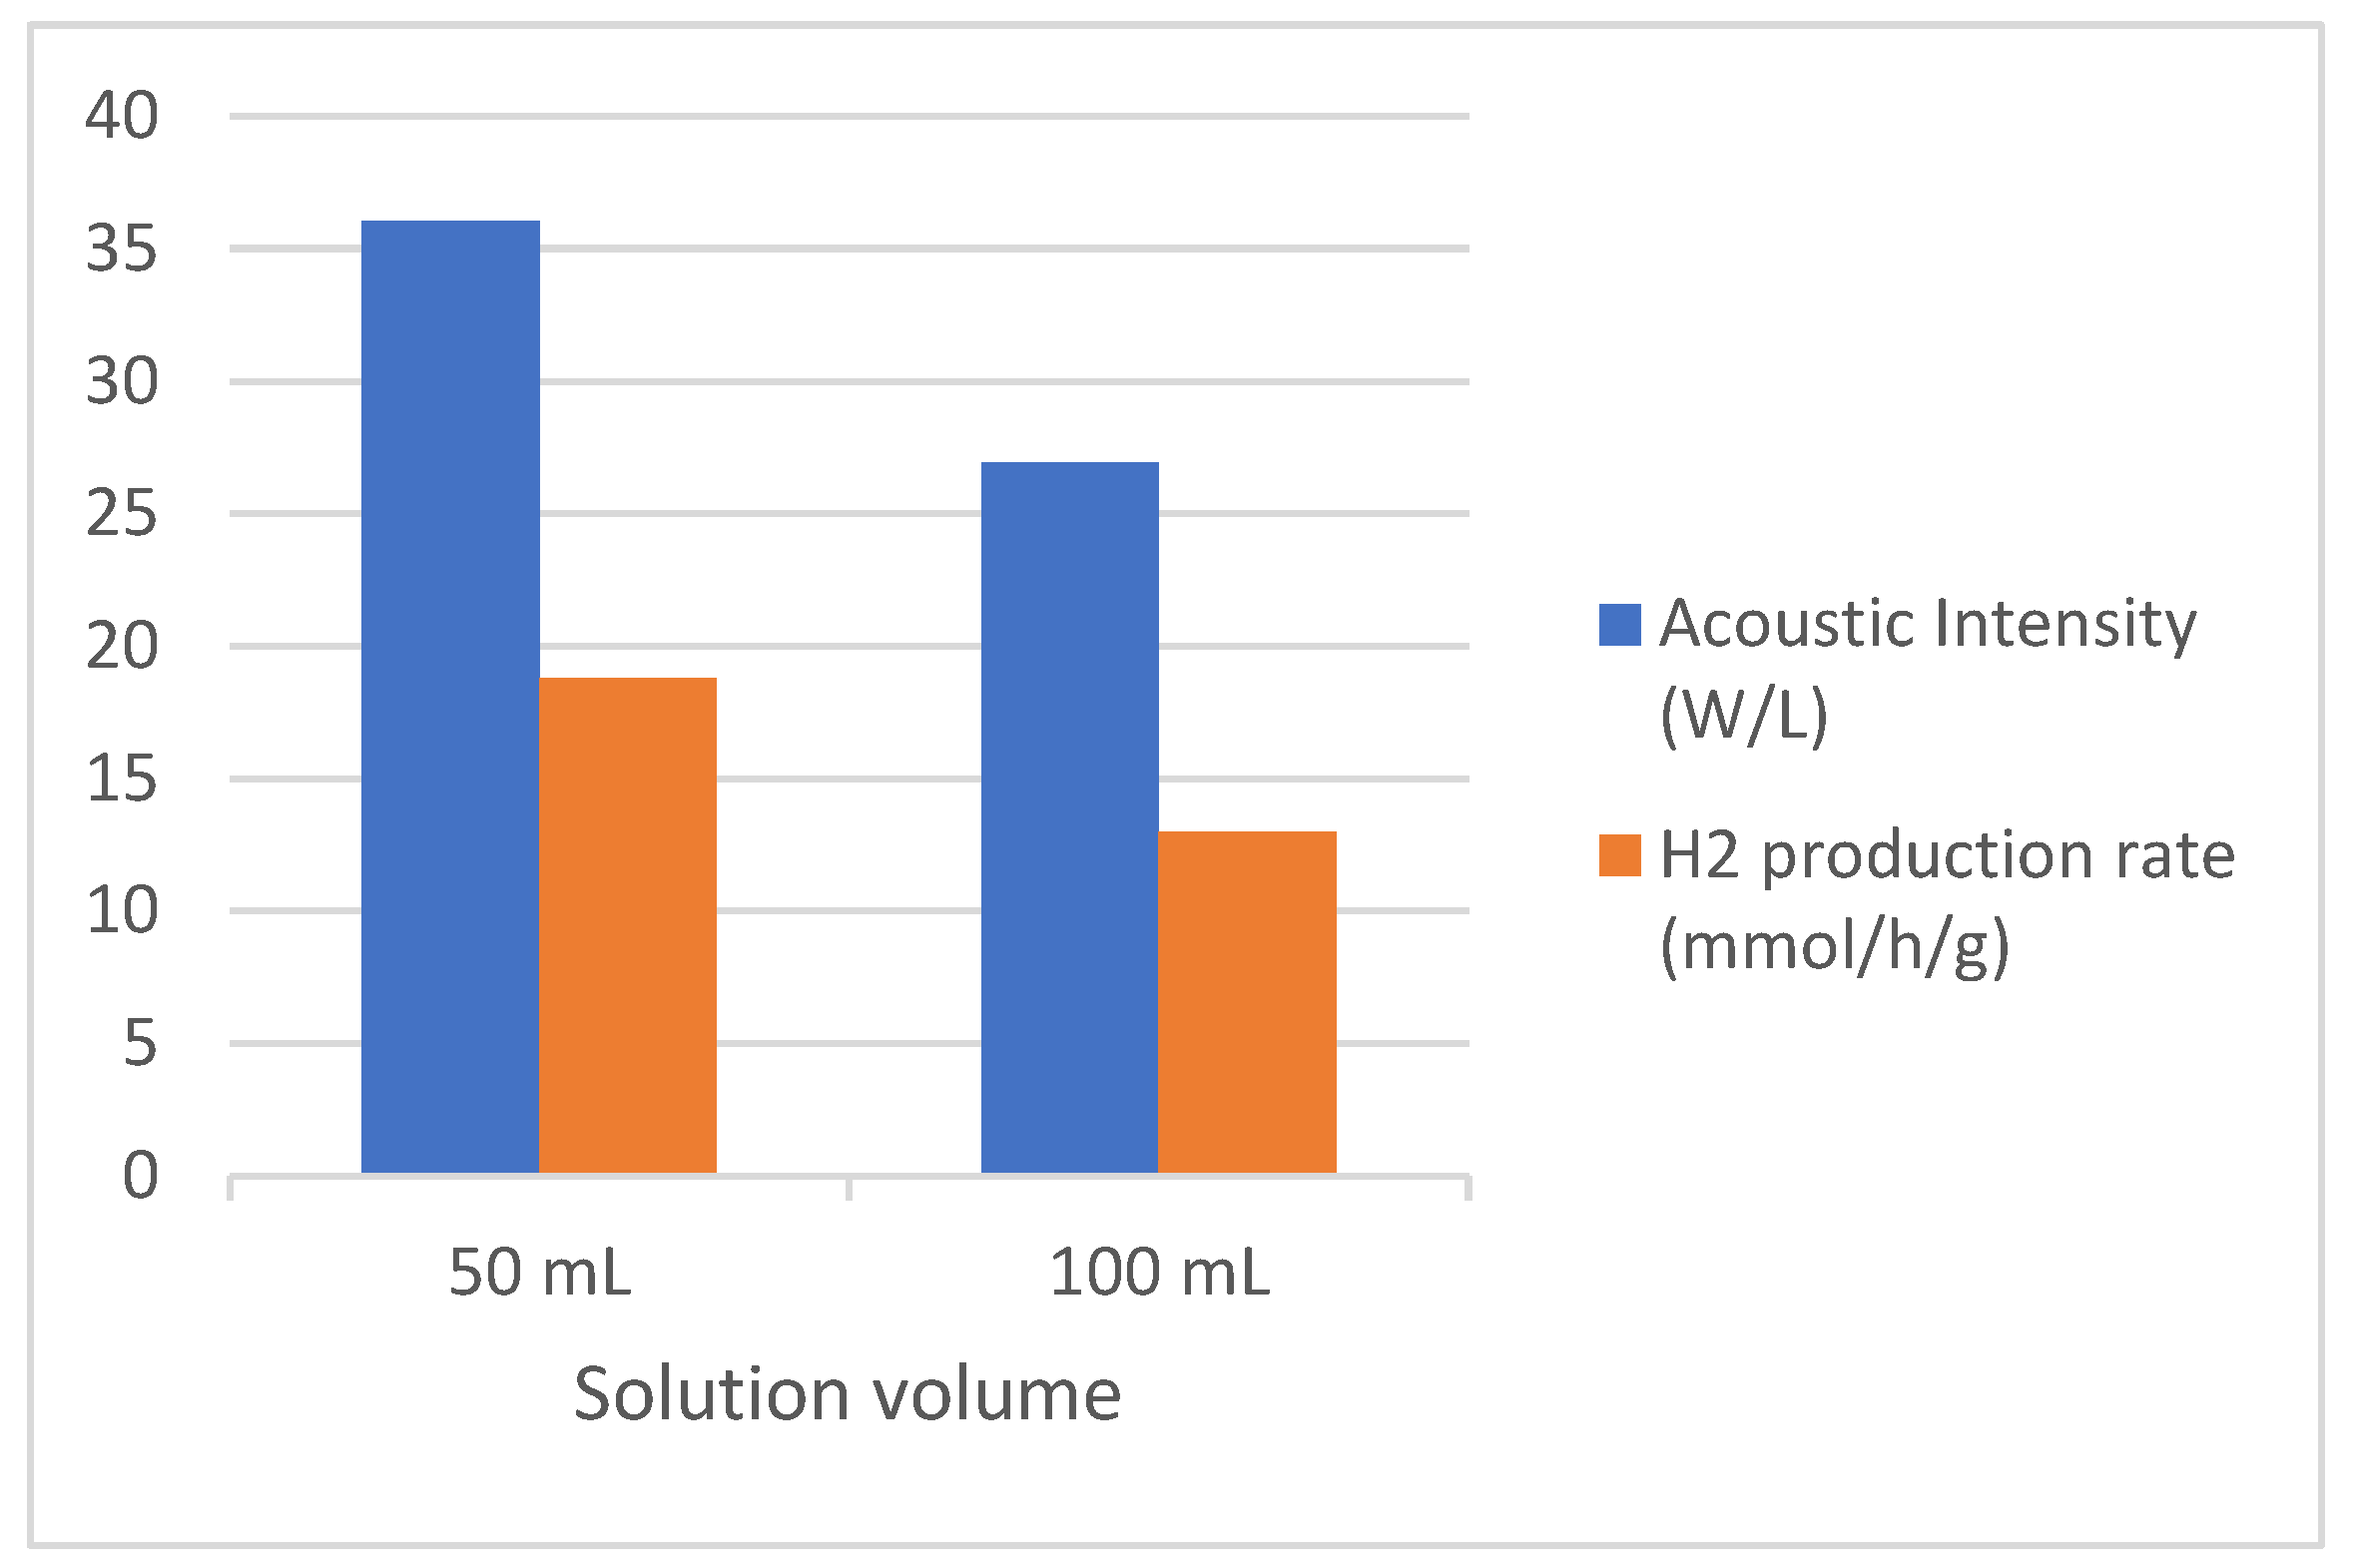
Figure 8.
Temperature dependent hydrogen production rate from the sonolysis of water, methanol and aqueous methanol at 724 kHz reported by Rassokhin et al.[128] Reaction volume of liquid is 40 mL.
Figure 8.
Temperature dependent hydrogen production rate from the sonolysis of water, methanol and aqueous methanol at 724 kHz reported by Rassokhin et al.[128] Reaction volume of liquid is 40 mL.
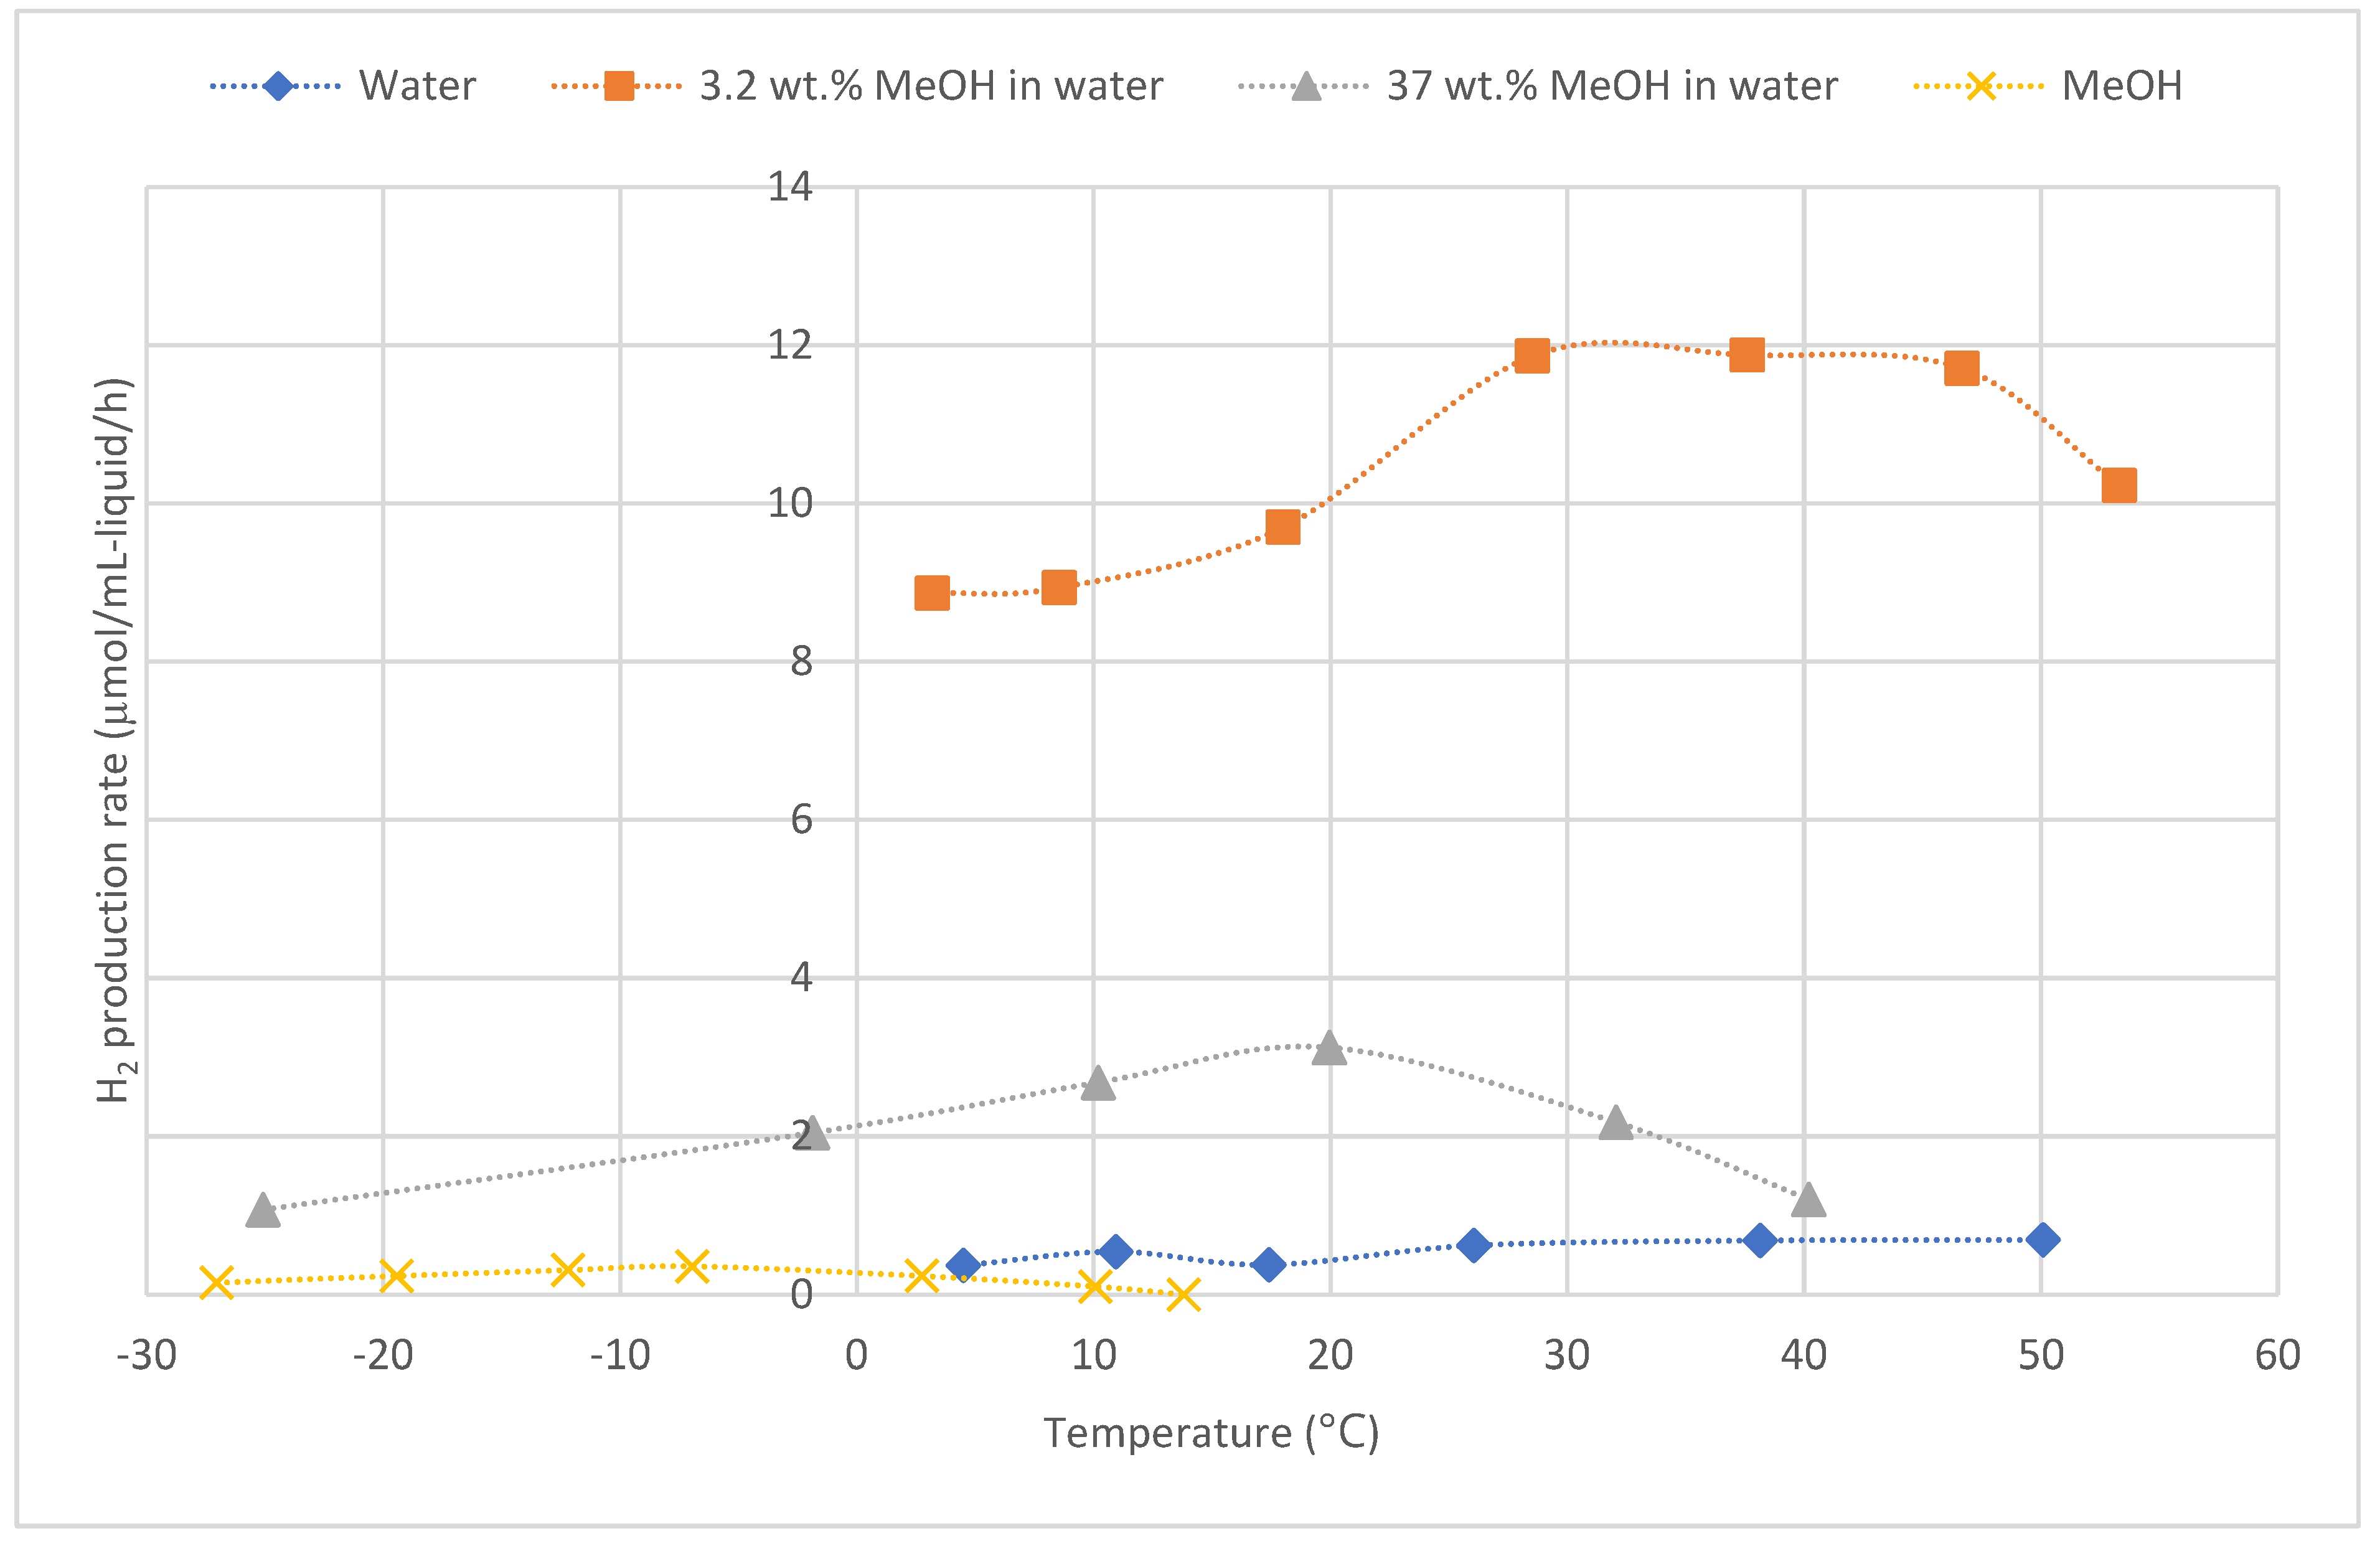
Figure 9.
Sonolysis of various alcohols at 5°C. Liquid volume used is 10 mL. Data is extracted from Mizukoshi et al.[129].
Figure 9.
Sonolysis of various alcohols at 5°C. Liquid volume used is 10 mL. Data is extracted from Mizukoshi et al.[129].
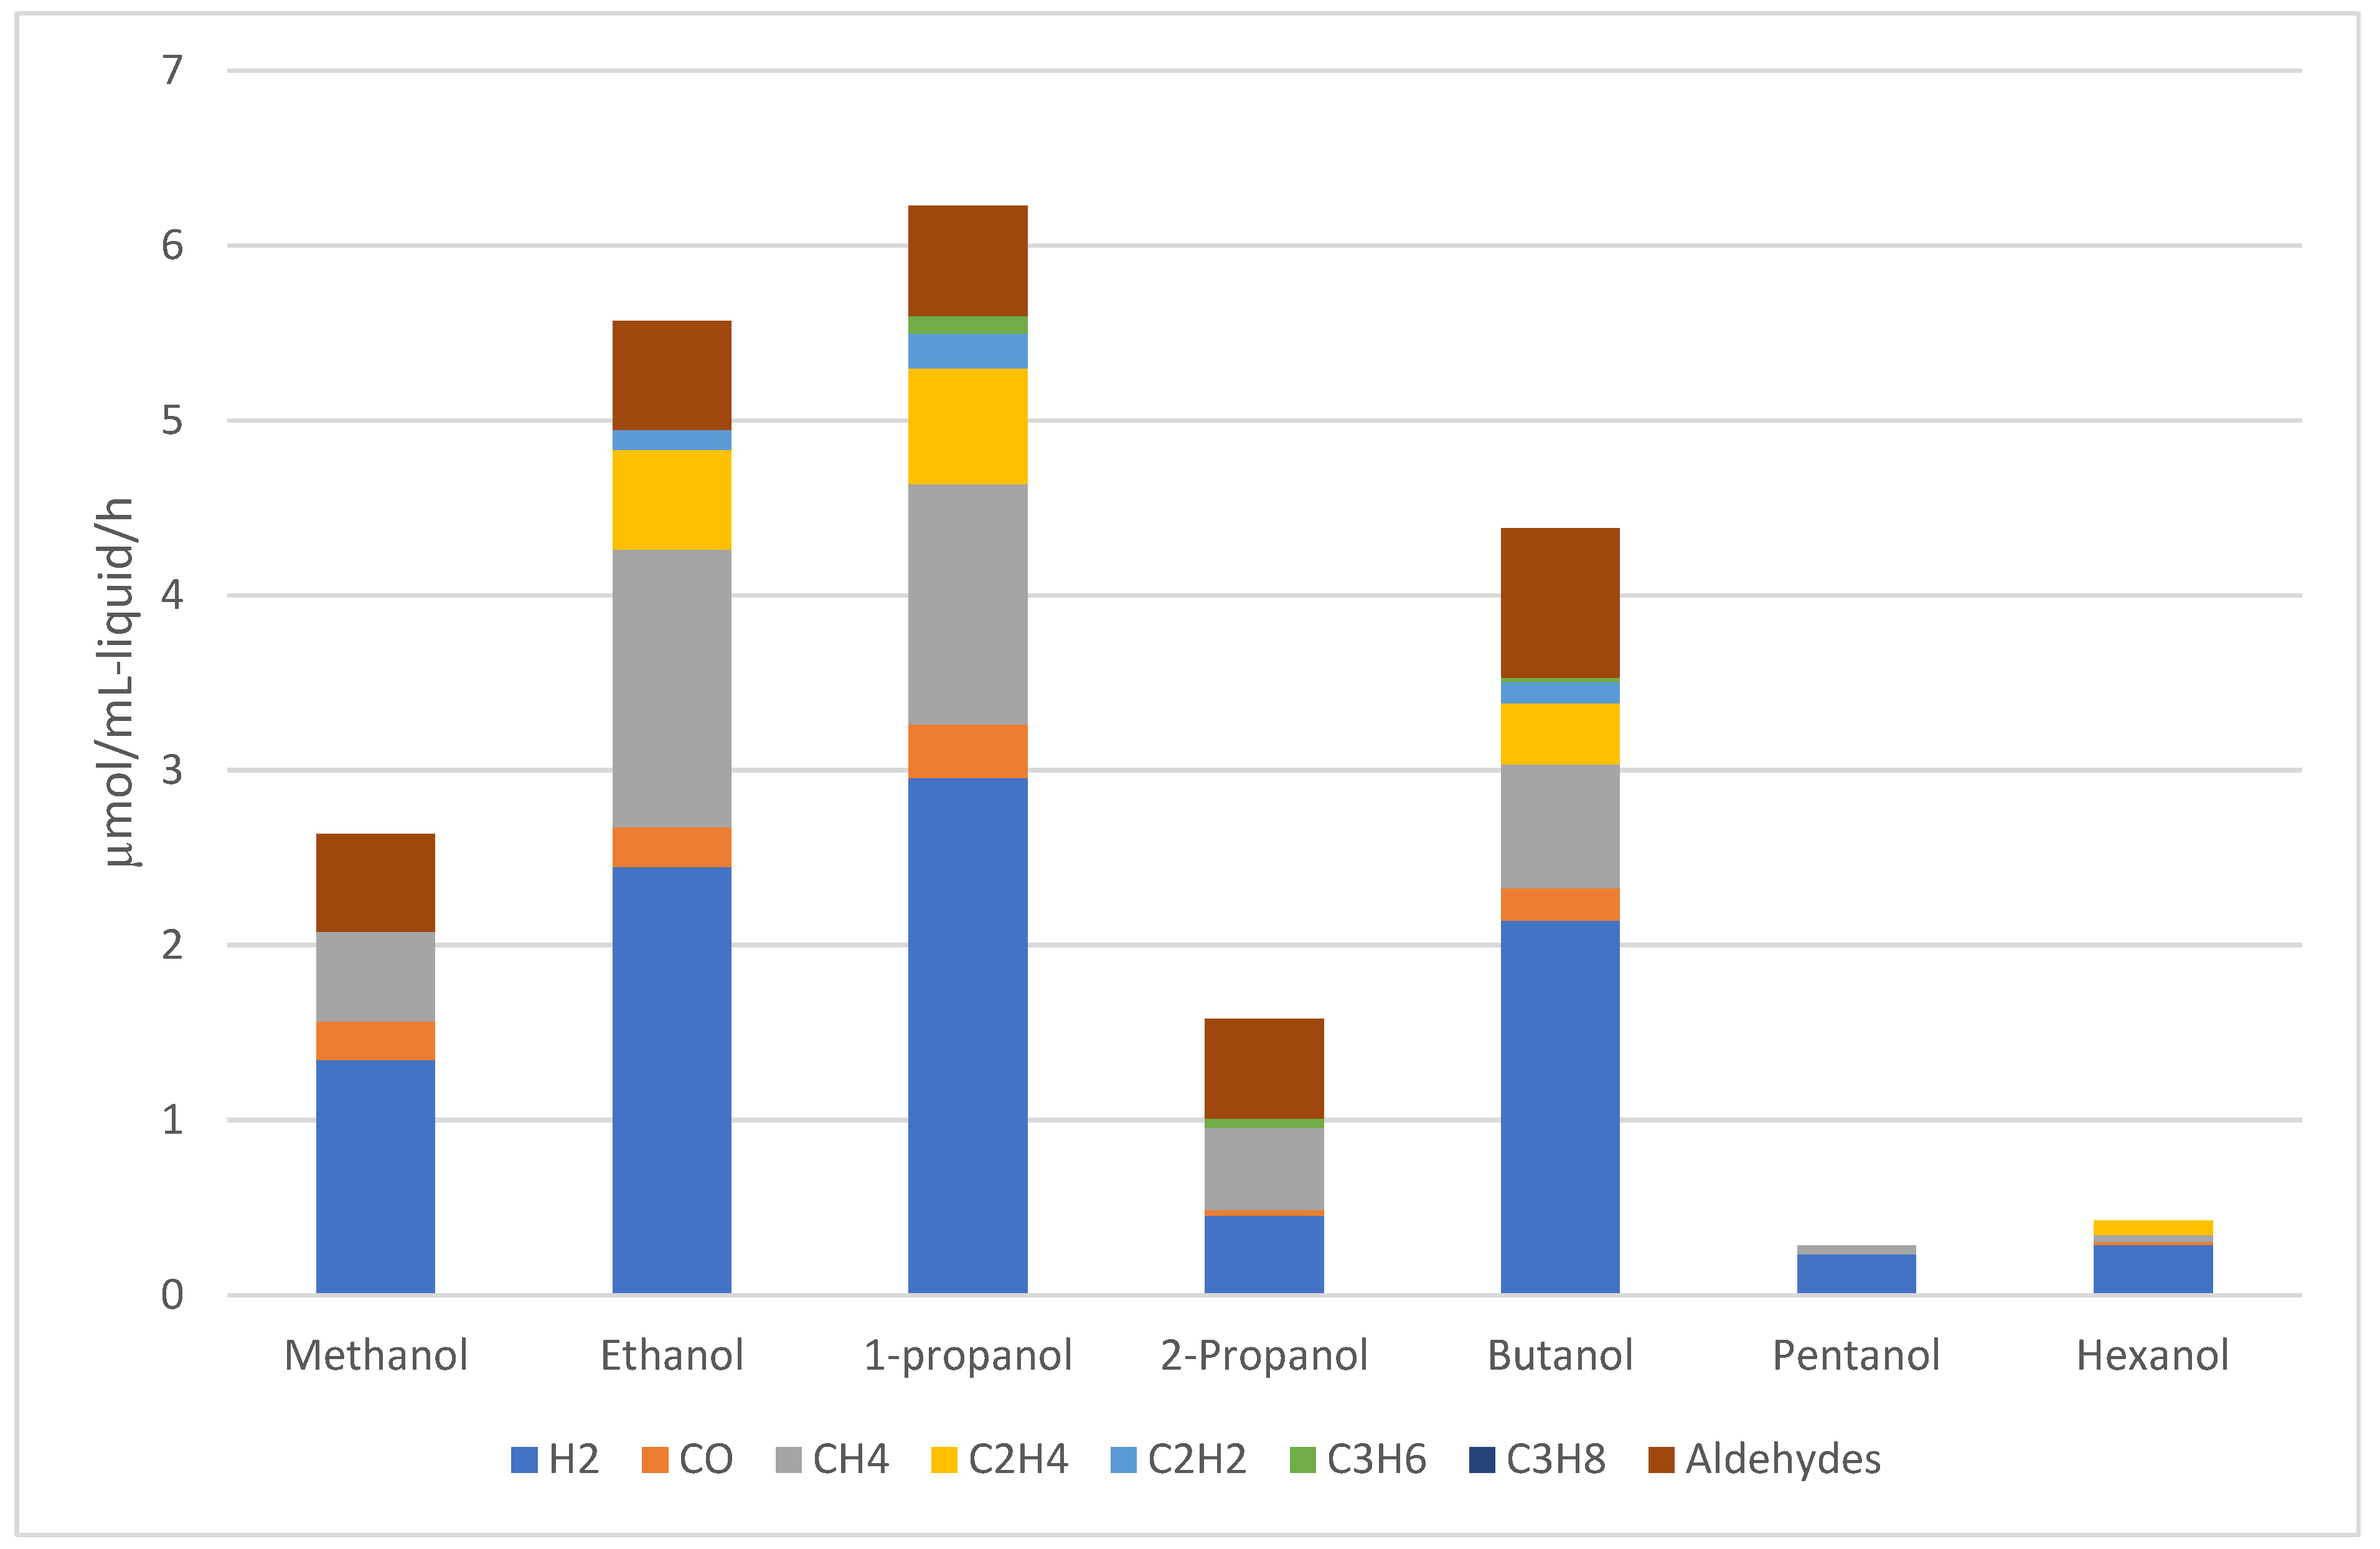
Figure 10.
Left: Bubble temperature and radius around the vicinity of the bubble collapse. Right: Pressure and density inside of the bubble during the collapse of the bubble. Reprinted from J. Chem. Phys. 2007, 127 (15), 154502., with the permission of AIP Publishing.
Figure 10.
Left: Bubble temperature and radius around the vicinity of the bubble collapse. Right: Pressure and density inside of the bubble during the collapse of the bubble. Reprinted from J. Chem. Phys. 2007, 127 (15), 154502., with the permission of AIP Publishing.
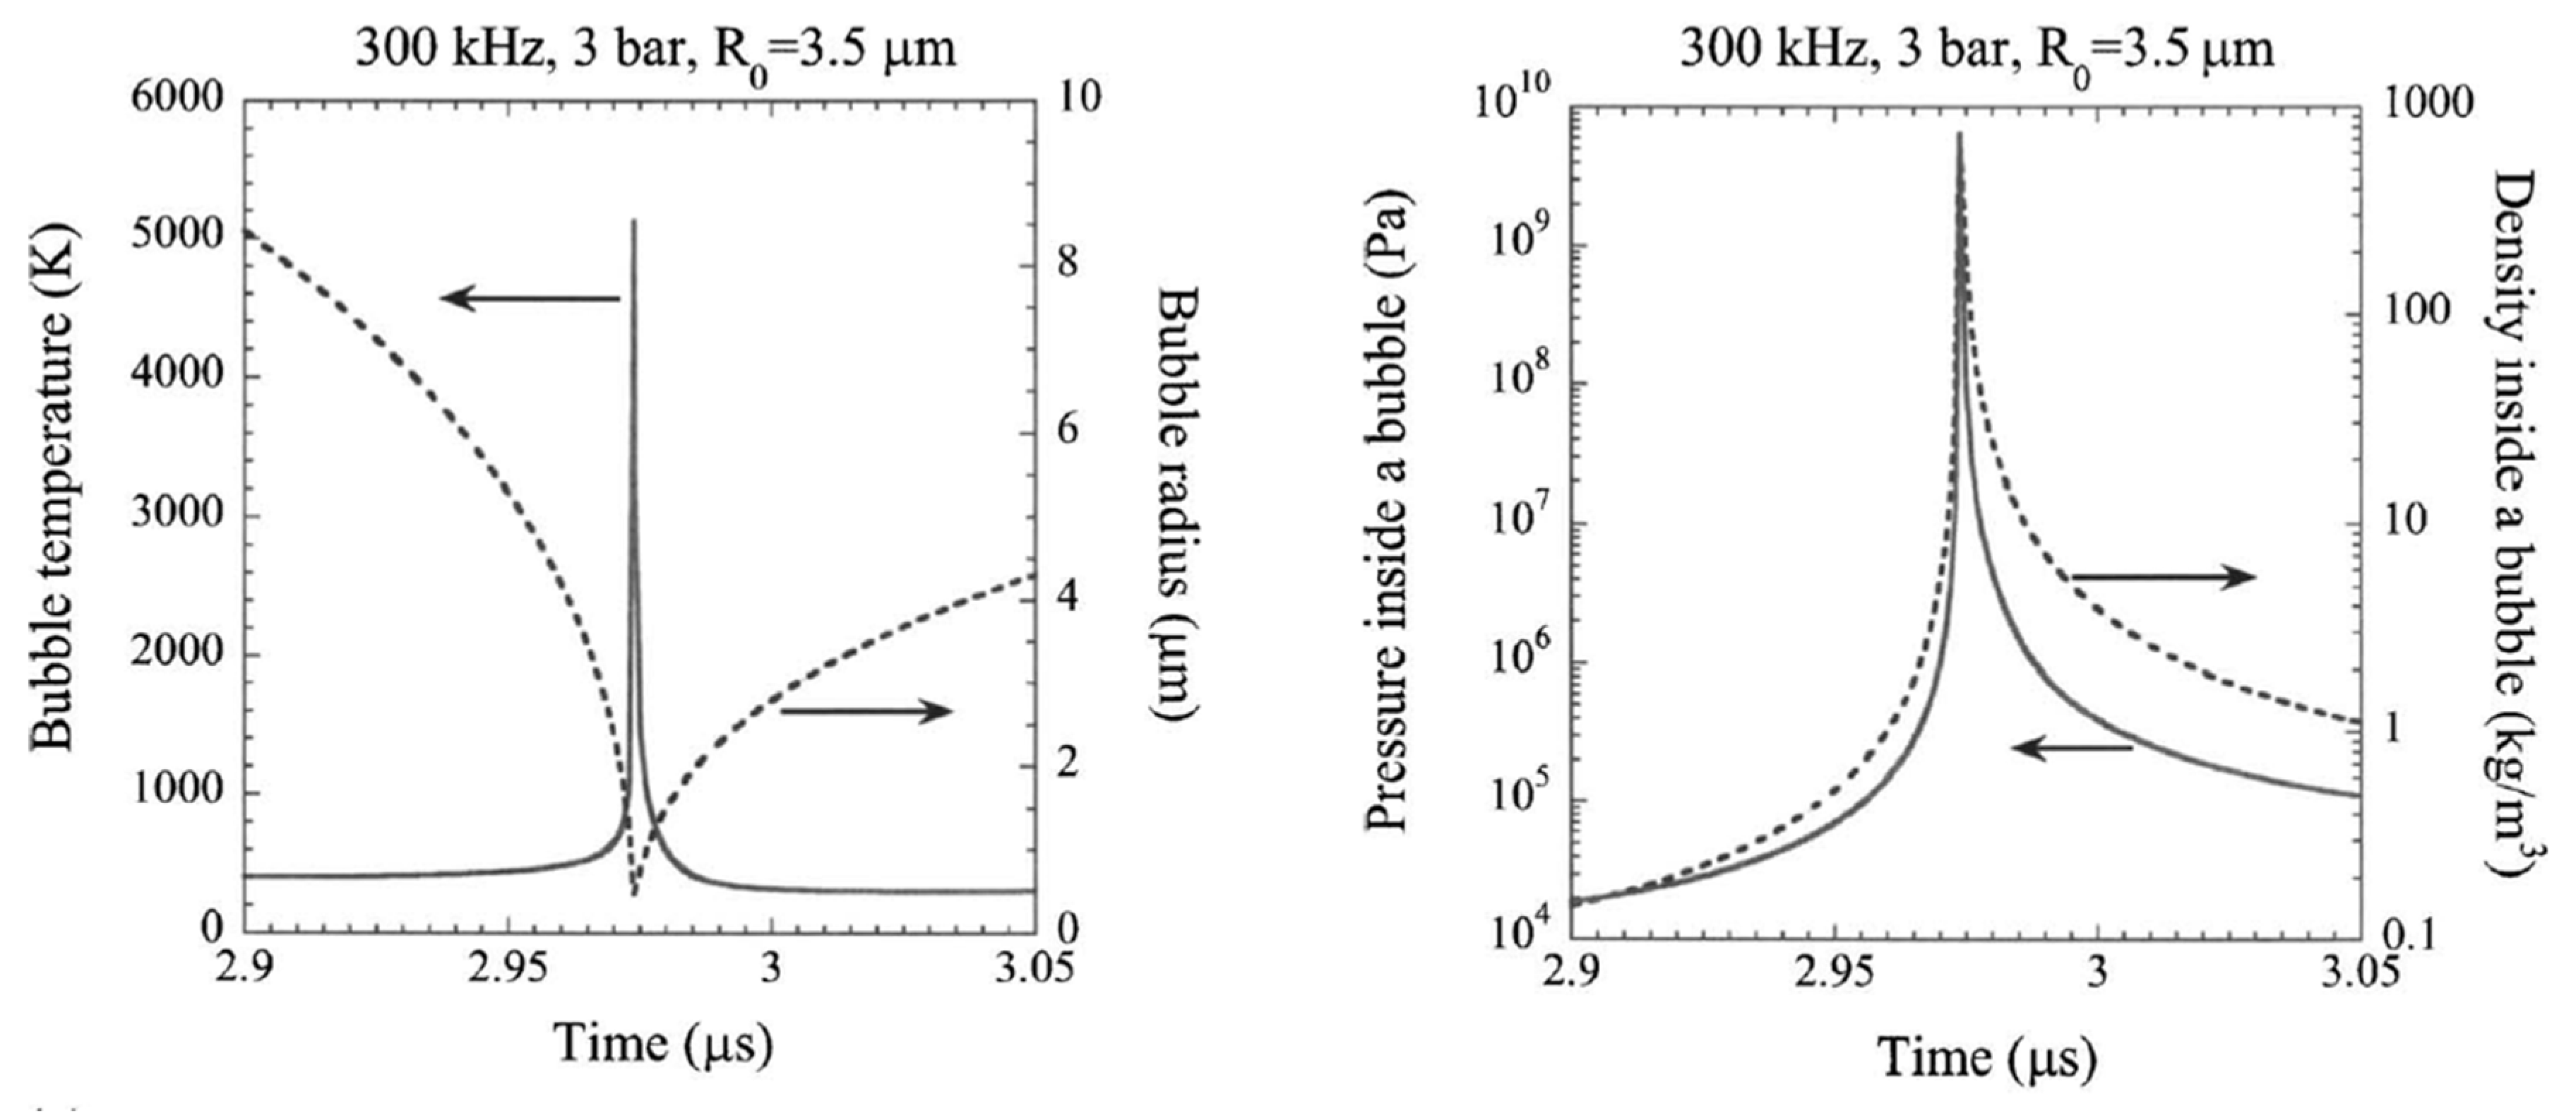

Table 1.
Saturated vapor pressure of model alcohols considered in this review.
| Alcohols | Wt.% (mol.%) in water | Temperature (°C) | ||
|---|---|---|---|---|
| 200 | 225 | 250 | ||
| Methanol | 10 (5.9) | 18.5 | 29.9 | 46.2 |
| 50 (36) | 27.4 | 43.5 | 66.3 | |
| Ethanol | 10 (4.2) | 18.3 | 29.5 | 45.4 |
| 50 (28) | 25.5 | 40.6 | 61.5 | |
| Ethylene Glycol | 1 (0.3) | 15.5 | 25.4 | 39.7 |
| 10 (3.1) | 15.2 | 24.9 | 38.8 | |
| Glycerol | 1 (0.2) | 15.5 | 25.5 | 39.7 |
| 10 (2.1) | 15.2 | 24.9 | 38.8 | |
Calculated with DWSIM 8.8.1 using the Peng-Robinson-Stryjek-Vera 2 (PRSV2-M) equation of state.
Table 2.
Methanol APR for Al2O3 supported metal catalysts.
| Entry | Catalyst | Reaction condition | H2 prod. Rate (mmol/g-cat/h) | Stability |
|---|---|---|---|---|
| 1[a] | Pt/ γ- Al2O3[b] (3 wt.% Pt) |
Fixed-bed, 29 bar, 4.5 g catalyst, 0.06 mL/min of 10 wt.% methanol, WHSV = 0.8 h-1 |
40 (at 225°C) | Stable on stream for at least a week |
| 2[c] | Pt/Al2O3[d] (0.94 wt. % Pt) |
Fixed bed, 29 bar, 1 g catalyst, 0.05 mL/min of 10 wt.% methanol, WHSV = 3 h-1 |
6 (at 210°C) | Stable for at least 20 h on stream |
| 3[e] | Pt/Al2O3 (2% wt. % Pt) |
Batch, 20 bar, 0.1 g catalyst, 50 mL of 64 wt.% methanol, Time N.A. |
110 (at 240°C) | N/A |
| 4[f] | Pt/Al2O3 (20 nm)[g] (0.89% wt.%) |
Batch, 20 bar, 0.1 g catalyst, 15 mL of 37 wt.% methanol, 1 h reaction |
86 (at 220°C) | N/A |
| 5[h] | Pt/Al2O3[i](0.2 wt.% Pt) | Batch, 20 bar. 0.1 g catalyst, 15 g of 37 wt. % methanol in water and 0.3 g NaOH, 1 h reaction |
2.3 (at 220°C) | N/A |
WHSV is the weighted hour space velocity in g-feedstock/g-cat/h. N.D. = Not detected. [a] Data from Cortright and Dumesic.[36] [b] Nanofiber from Argonide Corp. 500 m2/g. [c] Data from Li et al.[39] [d] Pt dispersion from CO chemisorption = 70%. Pt particle size = 2 nm. CO chemisorption = 34 µmol/g. H2 chemisorption = 237 µmol/g. SBET = 205 m2/g. [e] Data from Lin et al.[40] [f] Data from Lv et al.[41] [g] SBET = 128 m2/g. Pore Vol. = 0.5 cm3/g, Pore Diameter = 15 nm. [h] Data from Liu et al.[37] [i] SBET = 159 m2/g.
Table 3.
Performance and stability comparison of Ni, Ni-Cu, Cu, and Ru supported on Al₂O₃ and the impact of incorporating ZnO in stabilizing the catalyst in APR.
Table 3.
Performance and stability comparison of Ni, Ni-Cu, Cu, and Ru supported on Al₂O₃ and the impact of incorporating ZnO in stabilizing the catalyst in APR.
| Entry | Catalyst | Reaction condition | H2 prod. Rate (mmol/g-cat/h) |
Stability |
|---|---|---|---|---|
| 1[a] | ZnO/Ni-8Cu/Al2O3[b] (10 wt.% Ni, 8 wt.% Cu) |
Batch, 5 bar, 1 g catalyst, 100 mL of 10 wt.% methanol, 4 h reaction |
21.8 (at 250°C) | 35% loss after 72h |
| 2[a] | Ni-8Cu/Al2O3[c] (10 wt.% Ni, 8 wt.% Cu) |
21.3 (at 250°C) | 75% loss after 72h | |
| 3[a] | Ni/γ-Al2O3 (10 wt.% Ni) |
10.8 (at 250°C) | N/A | |
| 4[a] | Cu/γ-Al2O3 (10 wt.% Cu) |
8.5 (at 250°C) | N/A | |
| 5[d] | Ru/γ-Al2O3[e] (3.7 wt.% Ru) |
Fixed bed, 24 bar, 4 g catalyst, 3.6 mL/h of 10 wt.% polyols, WHSV = 0.3 h-1 |
Glycerol: 3.5 (at 225°C) | 18% loss after 28 h TOS |
| Sorbitol: 3.3 (at 225°C) | 24% loss after 28 h TOS | |||
| Xylitol: 2.5 (at 225°C) | 22% loss after 28 h TOS |
[a] Data from Liu et al.[45] [b] Ni particle size (Transmission Electron Microscopy) = 6.1 nm. SBET = 87 m2/g. Pore Vol. = 0.55 cm3/g, Pore Diameter = 27 nm. [c] SBET = 114 m2/g. Pore Vol. = 0.78 cm3/g, Pore Diameter = 26 nm. [d] Data from Kalekar and Vaidya.[46] [e] SBET = 210 m2/g. Pore Vol. = 0.63 cm3/g, Pore Diameter = 13 nm.
Table 4.
Cobalt Aluminate as a support or catalyst in the APR of methanol or glycerol and methanol.
| Entry | Catalyst | Reaction condition | H2 prod. Rate (mmol/g-cat/h) | Stability |
|---|---|---|---|---|
| 1[a] | 0.625CoAl-600[b] | Fixed bed, 50 bar, 0.5 g catalyst, 10 wt.% glycerol in water WHSV = 24.5 h-1 |
14 (at 260°C) | 48% loss in H2 production rate after 30 h TOS (8 mmol-H2/g-cat/h) |
| 2[c] | Pt/0.625CoAl [d] (0.3 wt.% Pt) |
Fixed bed, 50 bar, 1.8 g catalyst, 10 wt.% glycerol in water 0.02 mL/min WHSV = 0.68 h-1 |
3.4 (at 260°C, TOS: 10h) 4.1 (at 260°C, TOS: 100h) |
No decrease in glycerol conversion after 100 h TOS. H2 selectivity decreases from 53% to 49%. |
| 3[e] | 0.5 mL/min WHSV = 17 h-1 |
19 (at 260°C, TOS: 3h) |
No data | |
| 4[f] | Pt/Co2Al-c700[g] (0.98 wt.% Pt) |
Batch, 20 bar, 0.1 g catalyst, 15 mL of 37 wt.% methanol in water, 1 h reaction |
202 (at 220°C) | 9% loss in H2 production rate after 10 cycles of one hour each |
WHSV is the weighted hour space velocity in g-feedstock/g-cat/h. [a] Data from Reynoso et al.[53] [b] Co(FCC) particle size = 11.6 nm. SBET = 101.7 m2/g. [c] Data from Reynoso et al.[54] [d] Pt dispersion = 58%. SBET = 131 m2/g. Pore Vol. = 0.52 cm3/g, Pore Diameter = 14.8 nm. [e] Data from Reynoso et al.[55] [f] Data from Lv et al.[41] [g] Pt particle size = 1.5 nm. Pt dispersion of CO chemisorption = 85%. SBET = 41.5 m2/g. Pore Vol. = 0.19 cm3/g, Pore Diameter = 17.9 nm.
Table 5.
Nickel Aluminate as catalysts in the APR of alcohols.
| Entry | Catalyst | Reaction condition | H2 prod. Rate (mmol/g-cat/h) | Stability |
|---|---|---|---|---|
| 1[a] | NiAl2O4[b] (33 wt.% Ni) |
Fixed bed, 35 bar, 0.5 g catalyst, 10 wt.% glycerol in water 0.2 mL/min, WHSV = 24.5 h-1 |
26.2 (at 235°C) | 12% loss in H2 production rate (to 23) after 50 h TOS. |
| 2[c] | Pt/NiAl2O4[d] (0.97 wt.% Pt) |
Fixed bed, 29 bar, 1 g catalyst, 0.05 mL/min of 10 wt.% methanol in water. WHSV = 2.94 h-1 |
26.4 (at 210°C) | 10% loss in conversion to gases after 600 h on stream |
WHSV is the weighted hour space velocity in g-feedstock/g-cat/h. [a] Data from Morales-Marín et al.56 [b] Reduced at 850°C. Ni particle size = 11.6 nm. SBET = 76.6 m2/g. [c] Data from Li et al.39 [d] Pt dispersion from CO chemisorption = 80%. CO chemisorption = 40 µmol/g. H2 chemisorption = 233 µmol/g. SBET = 147 m2/g.
Table 6.
CeO2 supported Ni/Cu catalyst in the APR of glycerol from biodiesel byproducts.
| Entry | Catalyst | Reaction condition | H2 prod. Rate (mmol/g-cat/h) | Gas selectivity | Stability |
|---|---|---|---|---|---|
| 1[a] | Ni/mp-CeO2[b] | Batch, 6 bar, 0.4 g catalyst 150 mL of 30 wt.% glycerol from biodiesel byproduct in water 2 h reaction |
7.5 (at 225°C) | 75.65% H2 16.87% CO2 1.43% CH4 6.05% CO |
N/A |
| 2[a] | 1Ni-2Cu/CeO2[c] (12.2 wt.%Ni, 23.3 wt.% Cu) |
10 (at 225°C) | 82.72% H2 14.41% CO2 0.12% CH4 2.74% CO |
14% loss in H2 production rate (to 8), 10% increase in CO2 and 6% in CO content after 50 cycles of two hour each | |
| 3[a] | 1Ni-2Cu/CeO2 + 0.2 g CaO |
18 (at 225°C) | 85.08% H2 14.25% CO2 0.06% CH4 0.61% CO |
N/A |
[a] Data from Wu et al.61 [b] mp-CeO2: mesoporous CeO2. SBET = 76.5 m2/g. Pore Vol. = 0.33 cm3/g, Pore Diameter = 17 nm. [c] SBET = 58.8 m2/g. Pore Vol. = 0.22 cm3/g, Pore Diameter = 15 nm.
Table 7.
CeO2 supported Pt catalysts prepared by photochemical reduction for the APR of methanol.
| Entry | Catalyst | Reaction condition | H2 prod. Rate (mmol/g-cat/h) | Stability | Wt. % Pt in fresh catalyst / Spent catalyst |
|---|---|---|---|---|---|
| 1[a] | PtLa/CeO2[b](1.92 wt.% Pt, 1.29 wt.% La) | Batch, Autogenous pressure, 0.2 g catalyst, 20 mL of 10 wt.% methanol in water 6 h reaction |
30 (at 250°C) | 17% loss in hydrogen production rate (25) after 5 cycles of six hours each at 250°C | 1.92/1.27 |
| 2[a] | Pt/CeO2-HT[c] (1.86 wt.% Pt) |
25 (at 250°C) | 87 % loss in hydrogen production rate (3.1) after 5 cycles of six hours each at 250°C | 1.86/0.39 |
[a] Data from Lu et al.62 [b] H2 chemisorption = 20.2 µmol/g. CO2-TPD = 18.7 µmol/g. [c] H2 chemisorption = 21.6 µmol/g. CO2-TPD = 38.8 µmol/g.
Table 8.
APR of methanol at low temperatures enabled by Pt/CeO2.
| Entry | Catalyst | Reaction condition | H2 prod. Rate (mmol/g-cat/h) | Stability |
|---|---|---|---|---|
| 1[a] | Pt/PN-CeO2[b] (0.36 wt.%Pt ) |
Batch, 40 bar, 0.05 g catalyst, 58 mL of 63.8 wt.% methanol in water 1 h reaction |
20.4 (165°C) 3.7 (at 135°C) |
20% loss (to 16) after 10 cycles of one hour each at 165°C |
| 2[a] | Pt/Al2O3 (0.5 wt.% Pt) |
0.07 (at 135°C) | N/A | |
| 3[a] | Pt/TiO2 (0.5 wt.% Pt) |
0.1 (at 135°C) | ||
| 4[a] | 0.5 wt.% Pt/C (0.5 wt.% Pt) |
0.02 (at 135°C) | ||
| 5[c] | Pt/PN-CeO2[d](1 wt.% Pt) | Batch, 1 atm 0.005 g catalyst, 5 mL of 56.4 wt.% methanol in 8M KOH (aq) 1 h reaction |
2.8 (at 60°C) 73.4 (at 90°C) |
22% loss (to 2.1) after 10 cycles of one hour each at 60°C |
Table 9.
ZrO2 supported catalysts for APR of alcohols.
| Entry | Catalyst | Reaction condition | H2 prod. Rate (mmol/g-cat/h) | Stability |
|---|---|---|---|---|
| 1[a] | Ni/ZrO2[b] (9.4 wt.% Ni) |
Fixed bed, 32 bar, 1.5 g catalyst, 2 mL/min of 5 wt. % methanol in water. WHSV = 80 h-1 |
60 (at 230°C) | 18% loss in hydrogen production rate (to 49) after 12h TOS. CO/CH4 selectivity changes to 7.8%/1.1% from 4.7%/1.5% |
| 2[c] | β -Mo 2 C/m-ZrO2[d](10 wt.% Mo) | Batch, 6 bar, 0.04 g catalyst, 15 mL of 0.4M ethanol 1.5 h reaction |
20 (at 250°C)[e] | 41% loss (to 12) after 4 cycles of 1.5 hour each. |
WHSV is the weighted hour space velocity in g-feedstock/g-cat/h. [a] Data from Strekrova et al.[72] [b] Ni particle size = 26 nm. Ni dispersion from H2 chemisorption = 3.9%. Ni surface area from H2 chemisorption = 25.9 m2/g. SBET = 60 m2/g. Pore Vol. = 0.26 cm3/g. Pore Diameter = 11.7 nm. [c] Data from Pavesi Contreras et al.[73] [d] SBET = 39 m2/g. Pore Vol. = 0.15 cm3/g. Pore Diameter = 11 nm. [e] H2 production rate is taken from the 2nd cycle as there is a large increase in H2 selectivity after the first cycle.
Table 10.
Mixed oxides of ZrO2 support Pt or Ni catalysts in APR of methanol.
| Entry | Catalyst | Reaction condition | H2 prod. Rate (mmol/g-cat/h) | Stability |
|---|---|---|---|---|
| 1[a] | Pt0.05Ce0.475Zr0.475O2[b] | Fixed-bed, 50 bar, 0.25 g catalyst, 0.61 mL/min of 10 wt.% Glycerol WHSV = 2.45 h-1 |
91 (at 250°C) | Virtually no loss after 50h on stream |
| 2[c] | Ni/25Ce-ZrO2[d] (9.3 wt.% Ni) |
Fixed bed, 32 bar, 1.5 g catalyst, 2 mL/min of 5 wt. % methanol in water. WHSV = 80 h-1 |
151 (at 230°C) | 30% loss in hydrogen production rate (to 106) after 12h TOS. CO/CH4 selectivity changes to 7.8%/1.1% from 4.7%/1.5% |
| 3[c] | Ni/17Ce-5La-ZrO2[e] (10.1 wt.% Ni) | 128 (at 230°C) | 15% loss in hydrogen production rate (to 109) after 12h TOS. CO/CH4 selectivity changes to 5.9%/3.3%% from 4.6%/2.1% |
|
| 4[c] | Ni/10La-ZrO2[f] (9.0 wt.% Ni) | 129 (at 230°C) | 8% loss in hydrogen production rate (to 118) after 12h TOS. CO/CH4 selectivity changes to 5.2%/2.6% from 4.2 %/3.0% |
WHSV is the weighted hour space velocity in g-feedstock/g-cat/h. [a] Data from Larimi et al.[75] [b] Pt dispersion = 39%. Pt surface area = 5 m2/g. CO chemisorption = 101 µmol/g. H2 chemisorption = 1700 µmol/g. SBET = 81 m2/g. Pore Vol. = 0.13 cm3/g. Pore Diameter = 6 nm. [c] Data from Strekrov et al.[72] [d] Ni particle size = 27.3 nm. Ni dispersion from H2 chemisorption = 3.7%. Ni surface area from H2 chemisorption = 24.7 m2/g. SBET = 83 m2/g. Pore Vol. = 0.26 cm3/g. Pore Diameter = 10.9 nm. [e] Ni particle size = 35.6 nm. Ni dispersion from H2 chemisorption = 2.9%. Ni surface area from H2 chemisorption = 19.1 m2/g. SBET = 114 m2/g. Pore Vol. = 0.36 cm3/g. Pore Diameter = 3.7 nm. [f] Ni particle size = 21.9 nm. Ni dispersion from H2 chemisorption = 4.6%. Ni surface area from H2 chemisorption = 30.7 m2/g. SBET = 69 m2/g. Pore Vol. = 0.25 cm3/g. Pore Diameter = 12.6 nm.
Table 11.
Hypotalcite Supported Catalysts in APR.
| Entry | Catalyst | Reaction condition | H2 prod. Rate (mmol/g-cat/h) | Stability |
|---|---|---|---|---|
| 1[a] | 5La-NiMgAl[b] (38 wt.% Ni, 5.4 wt.% La) |
Batch, Autogenous pressure, 0.2 g catalyst, 20 mL of 10 wt.% methanol in water, 6h reaction |
41 (at 250°C) | 20% loss in H2 production rate (to 33) after 5 cycles of six hour each |
| 2[a] | 0La-NiMgAl[c] (39 wt.% Ni) |
36 (at 250°C) | 72% loss in H2 production rate (to 10) after 5 cycles of six hour each | |
| 3[d] | NiMg[e] (23 wt.% NiO, 51.5 wt.% MgO) |
Fixed bed, 35 atm, 1.25 g catalyst., 10 vol. % glycerol in water, 0.102 mL/min, WHSV = 5 ml g-1 h-1 |
4.3 (at 250°C) | N/A |
| 4[d] | Ni5CuMg[f] (21.9 wt.% NiO, 5.9 wt.% CuO, 47.3 wt.% MgO) |
10 (at 250°C) | No deactivation was observed after 6h TOS |
[a] Data is extracted from Huang et al.[86] [b] Ni particle size = 3.5 nm, medium basic sites = 151 µmol-CO2/g [c] Ni particle size = 4.1 nm, medium basic sites = 29.8 µmol-CO2/g [d] Data is extracted from Manfro et al.[87] [e] Ni particle size = 12 nm, SBET = 173 m2/g, Vpore = 0.43 cm3/g. [f] Ni particle size = 6.5 nm, SBET =156 m2/g, Vpore = 0.54 cm3/g.
Table 12.
Selected Pt/AC catalysts.
| Entry | Catalyst | Reaction condition | H2 prod. Rate (mmol/g-cat/h) | Stability |
|---|---|---|---|---|
| 1[a] | Pt/AC[b] (4.23 wt.% Pt) |
Fixed bed, 32 bar, 5 mL catalyst, 10 wt.% glycerol in water, LHSV = 8.4 h-1 |
18±1 (at 230°C) | No significant deactivation over about 4 h TOS |
| 2[c] | Pt/AC (7 wt.% Pt) |
Fixed bed, 45 atm, 0.3 g cat., 10 wt.% ethylene glycol in water, 0.1 mL/min, WHSV = 2 h-1 |
38±2 (at 250°C) | No significant deactivation over about 25 h TOS |
| 3[d] | Pt-Fe/AC[e] (3.11 wt.% Pt, 3.11 wt.% Fe) |
97±3 (at 250°C) | No significant deactivation over about 90 h TOS |
WHSV is the weighted hour space velocity in g-feedstock/g-cat/h. [a] Data from Wen et al.[42] [b] Pt dispersion = 36.4% [c] Data from Kim et al.[91] [d] Data from Kim et al.[92] [e] Metal dispersion = 41.3%, metal particle size = 3.2 nm, SBET = 1233 m2/g, Pore Vol. = 0.89 cm3/g, Pore Diameter = 0.91 nm.
Table 13.
Ordered mesoporous carbon supported catalysts for the APR of ethylene glycol.
| Entry | Catalyst | Reaction condition | H2 prod. Rate (mmol/g-cat/h) | Stability |
|---|---|---|---|---|
| 1[a] | 7 wt.% Pt/CMK-3[b] | Fixed bed, 45 atm, 0.3 g catalyst, 10 wt. % ethylene glycol in water, 0.1 mL/min, WHSV = 2 h-1 |
91[c] (at 250°C) | No deactivation was observed after 25h TOS |
| 2[d] | 7 wt.% Pt/CMK-9[e] | 152 (at 250°C) | ||
| 3[f] | 3 wt.% Pt/CMK-9 | 79 (at 250°C) | No deactivation was observed after 90h TOS | |
| 4[f] | 3 wt.% Pt-Fe/CMK-9 | 114 (at 250°C) | ||
| 5[f] | 7 wt.% Pt/3D-BMC-12[g] | Fixed bed, 45 bar, 0.3 g catalyst, 10 vol. % ethylene glycol in water, 0.1 mL/min, WHSV = 2 h-1 |
161[c] (at 250°C) | No deactivation was observed after 25h TOS |
WHSV is the weighted hour space velocity in g-feedstock/g-cat/h. [a] Data from Kim et al.[91] [b] Pt surface area = 9.6 m2/g. Pt particle size = 2 nm. SBET = 770 m2/g, Vpore = 0.87 cm3/g. mesopore diameter = 4.1 nm. [c] mL/g/min was given by the authors. It was converted to mmol/g/h assuming 25°C and 1 bar. [d] Data from Kim et al.[96] [e] Pt surface area = 10.8 m2/g. Pt particle size = 1.6 nm. SBET = 1713 m2/g, Vpore = 1.9 cm3/g. mesopore diameter = 4.8 nm. [f] Data from the work of Park et al.[97] [g] Pt particle size = 1.3 nm, SBET = 1166 m2/g, Vpore = 1.57 cm3/g. mesopore diameter = 4.7nm.
Table 14.
Catalysts derived from biomass-related compounds in APR.
| Entry | Catalyst | Reaction condition | H2 prod. Rate (mmol/g-cat/h) | Stability |
|---|---|---|---|---|
| 1[a] | Ni/ HC-N1-S1[b] (2.2 wt.% Ni) |
Batch, 5 bar, 0.2 g catalyst, 40 mL of 10 wt.% methanol 1.5 h |
355 (at 250°C) | Estimated 16% loss (to 298) after ten cycles of 1.5 h each. 5.5% loss in conversion 9.9% loss in H2 selectivity |
| 2[c] | Cu@NC-200[d] (44.9 wt.% Cu) |
Fixed bed, 40 bar, 0.1 g catalyst, 64 wt.% methanol in water, 0.03 mL/min, WHSV = 15.8 h-1 |
34 (at 210°C) | No significant loss after 200 hours TOS. CO selectivity ≈ 0.03% |
| 3[e] | Cu@CS19-G1-300[f] (35 wt/% Cu) |
Batch, 20 bar, 0.03 g catalyst, 10 mL of 37 wt.% methanol in water, 1.25 h |
139 (at 210°C) | No significant loss are five cycles of 1.25 h each. H2 prod. rate fluctuated between 131 and 136. |
| 4[g] | Ni@NC[h] (40 wt.% Ni) |
Batch, 20 bar, 0.025 g catalyst, 10 mL of 25 mol.% methanol in water or 0.86 M KOH, 1 h |
152 (at 220°C in water) 973 (at 220°C, 0.86M KOH) |
4.2% loss (to 933) after nine cycles of 1 h each. |
| 5[i] | Cu@Ca-Val-300[j] | Fixed bed, 20 bar, 1 g catalyst, 64 wt.% methanol in water, 0.06 mL/min, WHSV = 3.22 h-1 |
3 (at 180°C) | Stable for 110 h TOS |
WHSV is the weighted hour space velocity in g-feedstock/g-cat/h. [a] Data from Gai et al.[98] [b] Ni dispersion = 38.7%, SBET = 56 m2/g, Vpore = 0.086 cm3/g, Average pore diameter = 6.1 nm. [c] Data from Zheng et al.[95] [d] SBET = 7 m2/g, Vpore = 0.02 cm3/g, Average pore diameter = 15 nm. [e] Data from Wu et al.[99] [f] dCu,XRD (fresh) = 11.3±1.7 nm, dCu,XRD (spent) 11.5±1.2 nm. [g] Data from Xiao et al.[100] [h] Ni particle size (TEM) = 9 nm, SBET = 32 m2/g, Vpore = 0.09 cm3/g, Average pore diameter = 11.6 nm. [i] Data from Li et al.[101] [j] Cu dispersion = 42.4%, SBET = 3.1 m2/g, Vpore = 0.008 cm3/g, Average pore diameter = 10.8 nm.
Table 15.
Carbon encapsulated metal oxides supported copper catalyst in methanol APR.
| Entry | Catalyst | Reaction condition | H2 prod. Rate (mmol/g-cat/h) | Stability |
|---|---|---|---|---|
| 1[a] | 29 wt.% Cu/ZnO | Batch, 20 bar, 0.05 g catalyst, 23 mL of 37 wt.% methanol in 0.05M KOH (aq), 1.25 h |
94 (at 210°C) | 81% loss (to 18) after four cycles of 1.25 h each. |
| 2[a] | 27 wt. % Cu/ZnO@NC[b] | 320 (at 210°C) | 17% loss (to 266) after four cycles of 1.25 h each. | |
| 3[c] | Cu/ZnO/Al2O3 (53.1 wt.% Cu) |
Batch, 20 bar, 0.05 g catalyst, 20 mL of 37 wt.% methanol, 1 h |
87 (at 210°C) | 60% loss (to 35) after five cycles of 1.25 h each |
| 4[c] | Cu-SP/Al2O3-ZnO[d] (52.8 wt.% Cu) |
221 (at 210°C) | 44% loss (to 122) after five cycles of 1.25 h each |
Table 16.
Carbon nanotubes/fibres supported catalysts in the APR of alcohols.
| Entry | Catalyst | Reaction condition | H2 prod. Rate (mmol/g-cat/h) | Stability |
|---|---|---|---|---|
| 1[a] | Pt/CNF[b] (5 wt.% Pt) |
Fixed bed, 29 bar, 0.1 g catalyst, 10 wt.% ethylene glycol (EG) in water, 0.05 mL/min WHSV = 3g-EG/g-cat/h |
39.6±0.5 (at 230°C) | No observable loss in activity after 50 h TOS |
| 2[a] | Ni/CNF[c] (12.5 wt.% Ni) |
with 0.5M KOH: 25.5 ±0.8 (at 230°C) | With 0.5M KOH: No observable loss in activity after 50 h TOS | |
| No KOH: 12 (at 230°C at 2h TOS) | No KOH: 92% loss (to 1) in activity after 50 h TOS | |||
| 3[d] | 12Ni/MWNT[e] (12 wt.% Ni) |
Fixed bed, 40 bar, 0.15 g catalyst, 1 wt.% glycerol in water, 0.05 mL/min WHSV = 20 h-1 |
6.2±0.4 (at 240°C)[f] | 100% activity loss by 75 h TOS |
| 4[d] | 1Cu-12Ni/MWNT[g] (1 wt.% Cu, 12 wt.% Ni) |
9.5±0.4 (at 240°C) | Stable for 110 h TOS | |
| 5[h] | 5Pt-1.5Ni/MWNT[i] (4.7 wt.% Pt, 1.4 wt.% Ni) |
Batch, 30 bar, 0.1 g catalyst, 15 mL of 10 wt.% glycerol in water, 4 h reaction |
no CaO: 9.1 (at 230°C) | N/A |
| With CaO: 18 (at 230°C) | With CaO: 26% loss in activity[j] after five cycles of 4h each. |
WHSV is the weighted hour space velocity in g-feedstock/g-cat/h unless otherwise stated. [a] Data from van Haasterecht et al.[105] [b] Characterization data from van Haasterecht et al.[106] Average Pt particle sizes = 3nm, SBET = 169 m2/g, Vpore = 0.31 cm3/g [c] Average Ni particle size = 8 nm. No textual properties given in van Haasterecht et al.[105] [d] Data from Rahman.[111] [e] Ni dispersion = 6.4%, SBET = 260 m2/g, Vpore = 1.38 cm3/g, Average pore diameter = 31.1 nm. [f] 40 h averaged values. [g] Metal dispersion = 10.3%, SBET = 273 m2/g, Vpore = 1.45 cm3/g, Average pore diameter = 31.0 nm. [h] Data from He et al.[112] [i] Ni dispersion = %, SBET = 141 m2/g, Vpore = 1.29 cm3/g, Average pore diameter = 36.7 nm. [j] Based on H2 yield (mmol-H2/g-glycerol).
Table 17.
Molybdenum Carbide or sulfide supported catalyst.
| Entry | Catalyst | Reaction condition | H2 prod. Rate (mmol/g-cat/h) | Stability |
|---|---|---|---|---|
| 1[a] | 2%Pt/α -Mo2C | Batch, 20 bar, 0.1 g catalyst, 50 mL of 37 wt.% methanol in water. 1.25 h reaction |
467 (at 190°C) | 33% loss (to 313) after 11 cycles of 1.25 h.[b] |
| 2[c] | Ni/α-Mo2C[d] (2.2 wt.% Ni) |
Batch, 20 bar, 0.1 g catalyst, 50 mL of 64 wt.% methanol in water. |
626 (at 240°C) | 30% loss (to 438) after 10 cycles.[e] |
| 3[f] | Pt/MoS2[g] (0.2 wt. % Pt) |
Batch, 20 bar. 0.2 g catalyst, 15 g of 37 wt. % methanol in water and 0.3 g NaOH, 1 h reaction |
11.5 (@ 220°C) | 24% loss after 4 cycles of one hour. |
[a] Data from Lin eat al.[78] [b] Calculated based on the total turnover number of the 1st cycle and 11th cycle. [c] Data from Lin et al.[40] [d] SBET = 80 m2/g. [e] Calculated based on the total turnover number of the 1st cycle and 10th cycle. Reaction time cannot be found. [f] Data from Liu et al.[37] [g] SBET = 37 m2/g.
Table 18.
Compilation of selected results on the sonolysis of aqueous methanol.
| Entry | Frequency (kHz) | Power (W) | Catalyst | Methanol in water (Wt.%) | Optimal Temp. (°C) | Liquid vol. (mL) | H2 prod. rate (µmol/mL-liquid/h)[a] |
|---|---|---|---|---|---|---|---|
| 1 | 40 | 50 | 0 | 21-25 | 150 | 0.0027 | |
| 2 | 40 | 50 | Au/TiO2[b] | 0 | 21-25 | 150 | 0.0087 |
| 3 | 40 | 50 | 4 | 21-25 | 150 | 0.023 | |
| 4 | 40 | 50 | Au/TiO2[b] | 4 | 21-25 | 150 | 1.9 |
| 5 | 40 | 60 | BaTiO3 [c] | 8.1 | 35 | 100 | 0.6 |
| 6 | 200 | 6 W/cm2 | 100 | 5 | 10 | 1.3 | |
| 7 | 724 | 45 | 0 | 38-50 | 40 | 0.7 | |
| 8 | 724 | 45 | 3.2 | 29-47 | 40 | 12 | |
| 9 | 724 | 45 | 100 | -7 | 40 | 0.4 | |
| 10 | 1000 | 2 W/cm2 | 0 | N/A | 40 | 1.4 | |
| 11 | 1000 | 2 W/cm2 | 7 | N/A | 40 | 9.2 |
Entry 1-4 data is from Wang et al.[137] Entry 5 data is from Zhang et al.[126] Entry 6 data is from Mizukoshi et al.[129] Entry 7-9 data is from Rassokhin et al.[128] Entry 10-11 data is from Büttner et al.[127] [a] For works which reported H2 production rate in the units of µM/min. We assumed that the volume refers to the volume of liquids used in the reaction. It is thus converted to µmol/min based on the volume of liquid reactants used in the reaction. [b] 0.075g of 0.75 wt. % Au/TiO2. Au particle size (TEM) = 3.5±0.7 nm. [c] 0.01 g of BaTiO3 was used.
Disclaimer/Publisher’s Note: The statements, opinions and data contained in all publications are solely those of the individual author(s) and contributor(s) and not of MDPI and/or the editor(s). MDPI and/or the editor(s) disclaim responsibility for any injury to people or property resulting from any ideas, methods, instructions or products referred to in the content. |
© 2024 by the authors. Licensee MDPI, Basel, Switzerland. This article is an open access article distributed under the terms and conditions of the Creative Commons Attribution (CC BY) license (http://creativecommons.org/licenses/by/4.0/).
Copyright: This open access article is published under a Creative Commons CC BY 4.0 license, which permit the free download, distribution, and reuse, provided that the author and preprint are cited in any reuse.


