Submitted:
01 October 2024
Posted:
02 October 2024
You are already at the latest version
Abstract
In the rapidly evolving field of insurance, accurate risk measurement is crucial for effective claims management and financial stability. Therefore, this research presented a systematic literature review (SLR) on insurance claims risk measurement using Hidden Markov Model (HMM). Bibliometric analysis was conducted using VOSviewer and ResearchRabbit software to map research trends and collaboration networks in this topic. The review explored the implementation of HMM in predicting the frequency and magnitude of insurance claims, with a focus on the statistical distribution methods used. In addition, the research emphasized the influence of the number of hidden states in HMM on claims behavior, both in terms of frequency and magnitude, and provided interpretations of these hidden dynamics. Data sources for the review comprised three databases, namely Scopus, ScienceDirect, and Dimensions. The article selection process followed PRISMA guidelines, resulting in five key articles relevant to the topic. The results offered insights into the application of HMM for forecasting the frequency and severity of insurance claims and opened avenues for further investigation on distribution models and hidden state modeling.
Keywords:
Insurance claims
; risk measurement
; SLR
; bibliometric analysis
; Hidden Markov Model
1. Introduction
In the contemporary insurance landscape, accurately measuring and managing claims risk is important for ensuring financial stability and operational efficiency. According to Omari et al. (2018), insurance companies face challenges in predicting claims occurrences and severities. Even though traditional statistical models have been consistently used for these purposes, their limitations in capturing the dynamic and often hidden patterns in claims data necessitate the exploration of more sophisticated methodologies. Hidden Markov Model (HMM) has originated as a powerful tool in this regard, offering improved capabilities for modeling sequential data and uncovering latent states that influence observable outcomes (Zucchini & MacDonald, 2009).
Initially developed for speech recognition and bioinformatics, HMM is currently being applied in various fields, including finance and insurance (Oflaz et al., 2019). Awad & Khanna (2015) stated that the model was particularly adept at handling time series data, where the underlying process was assumed to follow a Markov process with unobserved (hidden) states. This unique characteristic makes HMM suitable for analyzing insurance claims data, often exhibiting temporal and dependencies and underlying factors not directly observable.
Several research have analyzed the application of HMM (see Mor et al., 2021; Odumuyiwa & Osisiogu, 2019; Ramaki et al., 2018). Although these research provided a systematic review of HMM and specialized applications, there is no specific focus on insurance claims modeling. Therefore, a literature review of this topic presents a novel contribution. The application of HMM in measuring insurance claims is crucial for providing practical guidance to insurance companies in implementing HMM and improving the claims process. This may include recommendations regarding model parameters, simulation data, emerging trends and other practical applications. The current research offered bibliometric analysis and systematic literature review (SLR), with a focus on HMM and insurance claims risk measurement. The first investigation on the role of HMM in insurance claims can be traced back to Paroli et al. (2000). Subsequently, Lu & Zeng (2012) and Oflaz et al. (2019) developed the role of HMM in insurance claim, particularly in modeling claims counts in a bivariate context.
SLR aimed to provide a comprehensive analysis of the applications of HMM in measuring insurance claims risk. The review covered the period from the early 2000s to the present, reflecting the growing interest and advancements in this area. The following research questions were addressed: How does the implementation of HMM impact the prediction of frequency or severity in insurance claims? How does the number of hidden states in HMM affect the pattern of frequency or severity in claims? By synthesizing existing results, this review aimed to identify the strengths and limitations of HMM in the context of insurance claims and identify areas for future investigations.
To achieve the stated objectives, Scopus, Science Direct and Dimensions databases were used, considering keywords related to the research questions. Bibliometric analysis was conducted using VOSviewer software and ResearchRabbit website. In essence, this research aimed to contribute to the broader understanding and implementation of advanced modeling in the insurance sector, fostering more accurate and effective risk management strategies. The subsequent section of this paper is structured as follows: Section 2 provides a preview of HMM and the methods used to collect articles. In Section 3, the results of bibliometric analysis are presented and described. Section 4 provides a discussion and addresses the research questions. Lastly, Section 5 presents conclusions and recommendations for future investigations.
2. Materials and Methods
2.1. A Preview of Hidden Markov Model
According to Koerniawan et al. (2020), HMM is a discrete-time stochastic process consisting of pairs and . is a Markov Chain representing events that cannot be observed directly, while is an observation depending on . These are the main component of HMM, as described by Orfanogiannaki & Karlis (2018).
- Hidden states through which the system transitions. These states are not directly visible.
- A set of possible observations that can be seen. Each observation corresponds to a particular hidden state.
-
Transition probability matrix where is the probability of transitioning from state to state :The rows of this matrix sum to 1.
-
Emission probabilities matrix where is the probability of observing from state :Each row in this matrix also sums to 1.
- Initial probabilities vector where is the probability of starting in state :
There are three main problems in HMM. First, evaluation problem, given HMM and a sequence of observations, determines the probability of the sequence occurring. This can be addressed using the Forward-Backward Algorithm. Second is the decoding problem, given HMM and a sequence of observations, determine the most likely sequence of hidden states that led to the observations. This can be addressed using the Viterbi Algorithm. The third is learning problem, given a sequence of observations and a general structure of HMM, determine the model parameters (transition and emission probability) that best explain the observed sequence. This can be addressed using the Baum-Welch Algorithm, a form of the Expectation-Maximization algorithm. Preserve & Yin (2018) presented parameter estimation.
In the insurance context, HMM can be used to model the dynamics of insurance claims by accounting for observable variables and hidden variables that influence claims frequency. For instance, in the context of auto insurance claims, observable variables are directly available from claims records and data from policyholders. Examples are claims frequency, severity, time, as well as driver and vehicle information. Meanwhile, hidden variables influence the claims process but cannot be directly observed. An example of a hidden variable is the driver’s risk state, which may change over time (e.g., careful versus reckless drivers). HMM can be specifically applied as follows. Claims frequency is denoted (an observable variable) and the driver’s risk state is denoted as . The driver’s risk state is assumed to be unobservable but affects claims frequency. A driver’s risk condition can be classified as low, medium, or high risk, corresponding to different claims frequencies, and denoted as , respectively. The initial probabilities are denoted by , where is the probability that the driver is in state at . The transition probabilities , as explained previously, describe the likelihood of transitioning from one risk state to another. The emission probabilities describe the probability of observing a claim from state .
2.2. Methods
According to Ortega-Rodríguez et al. (2020), SLR allows for the clear identification, analysis, and synthesis of the existing body of literature. The analysis was carried out in four phases. The eligibility criteria followed PRISMA diagram (Figure 1), and each phase is described as follows. First, based on the research question, the related keywords were (“Hidden Markov Model” OR “HMM”) AND (“insurance” OR “claim” OR “risk profiling” OR “fraud detection”). These were used to search for publications in selected databases, namely Scopus, Science Direct, and Dimensions. The databases were selected because they contain significant publications on the research topic. Journals included in Scopus and Science Direct adhered to high standards of impact and quality. Dimensions, a newly free scholarly database, includes journal articles and citation counts and is considered a plausible alternative for supporting some types of research evaluations (Thelwall, 2018). Previous literature reviews also used these databases (see Ortega-Rodríguez et al., 2020; Sukono et al., 2022; Firdaniza et al., 2022).
A total of 142 articles were obtained from Scopus, 19 from Science Direct, and 68 from Dimensions. Furthermore, in this second phase, Mendeley Reference Manager was used to identify and remove duplicate articles, leaving a total of 175 unique articles.
In the third phase, an initial screening of titles and abstracts was conducted, resulting in the selection of 24 articles. These articles met the criteria by being published after 1999, the year when the first article on HMM application in insurance was published by Paroli et al. (2000). This article became a key reference for subsequent research related to the application of HMM in insurance. Articles discussing HMM but were in the field of speech recognition were excluded in this phase.
Finally, after an in-depth reading of each article, 5 articles were identified as being directly related to the research topic, specifically focusing on HMM in the context of claims, fraud detection, and risk profiling in insurance. Subsequently, these articles were used for SLR analysis and to address the research questions.
From the 5 selected articles, bibliometric analysis was conducted to provide a comprehensive overview of the research being conducted, helping other research experts to identify trends, collaboration opportunities, and future research directions. This current research used VOSviewer software to analyze and visualize bibliometric data, while ResearchRabbit website was used to recommend relevant articles and provide network visualizations showing relationships between articles and authors.
3. Results
3.1. Results from Bibliometric Analysis
The first analysis addressed the trend of publications related to the application of HMM in insurance. Based on the established criteria and the analysis in Figure 2, the publication of articles in this research area followed a linear trend. This could be attributed to the relatively limited number of research conducted on this specific topic. However, a minimum of one article had been published each year over the last 5 years, focusing on the application of HMM in insurance. This steady stream of publications showed literature on this topic remained relevant and important. Despite the relatively low volume of publications, the consistent interest by research experts showed the potential and ongoing importance of HMM in advancing insurance risk measurement and modeling. The steady output shows that while the field may be niche, it holds significant value and continues to garner attention in the academic community.
3.1.1. Visualization and Analysis of Journals
Figure 3 shows that ASTIN Bulletin is a prominent journal with a history of publishing two articles specifically related to the application of HMM in the insurance sector. In contrast, other journals have only published one article on this topic. Therefore, ASTIN Bulletin has a stronger inclination to accept and publish articles on HMM applications within the insurance context, reflecting a particular interest and focus in the niche area. This track record shows a significant opportunity for experts to publish work on HMM in insurance. The journal’s established expertise in this subject area increases the likelihood of acceptance for relevant research submissions. Conversely, journals with only a single publication on the topic also present untapped potential. These journals may be open to expanding the coverage of HMM applications in insurance, suggesting additional avenues for publication. Due to these observations, articles on HMM in insurance should consider a dual method, namely targeting ASTIN Bulletin for its demonstrated interest while also submitting to other journals with preliminary engagement with the topic. By applying a strategic publication plan that includes both established and emerging journals, research experts can increase their chances of article acceptance and contribute to the broader discourse on HMM in insurance.
An analysis was conducted on the journals that published the 5 selected articles, focusing on their quartile ranking in Scimago Journal Rank (SJR) and inclusion in reputable indexers. SJR is a metric that evaluates the scientific impact of academic journals by considering the number of citations received by articles published in those journals. Journals with high SJR scores were regarded as more prestigious and of higher quality, typically attracting more citations compared to others with comparable quality (Kumar et al., 2023).
The reputable indexers considered in this research were Scopus and Web of Science (WoS). Both indexers were highly esteemed in the academic community for rigorous publication standards and selective indexing processes. This ensured the articles included were of high quality and relevant within respective scientific fields, functioning similarly to a curation process with high academic standards.
The results are summarized in Table 1, providing an overview of the journals’ impact and adherence to high-quality publication standards, as reflected by SJR rankings and indexing status. This detailed evaluation helped to understand the credibility and academic significance of the journals where the selected articles were published.
Based on Table 1, the journals in question are predominantly ranked as SJR Q1. The designation showed these journals were in the top 25% of their field, reflecting significant influence and high standing in the corresponding scientific discipline (Kumar et al., 2023). Furthermore, this high ranking showed the prestige and impact of these journals in the academic community.
The journals covered a wide range of fields, with the most prominent areas of publication being Applied Mathematics and Mathematics and Statistics, followed by Economics and Econometrics, as well as Computer Science. This distribution showed the interdisciplinary nature of the articles published in these journals.
For a more detailed view, Figure 4 provides a visualization of the fields represented in these journals. The visualization showed that the applications of HMM transcended multiple disciplines. In addition, the broad applications explained the versatility and utility of HMM across various scientific domains, reinforcing its significance as a robust analytical instrument in diverse research areas.
3.1.2. Visualization of Keywords and Authors
VOSviewer software was used to analyze keywords from the 5 selected articles. This software generated a visual map of related keywords, showing their distribution and interconnections. VOSviewer was specifically used to analyze keywords in the titles and abstracts of the articles. Figure 5 (a) presents the analysis results, showing seven different colors representing seven clusters of HMM applications research in insurance. The first cluster, shown in red, focused on algorithms, particularly parameter estimation, model selection, and distribution in HMM. The second cluster, displayed in green, included the data used in HMM. The third and fourth clusters, shown by dark blue and yellow, respectively, explained the use of Bayesian methods and risk in HMM. Clusters 5, 6, and 7, represented in purple, light blue, and orange, respectively, covered topics like claims, case studies in HMM, and the mathematical models used. Furthermore, Figure 5(b) shows the topic overlay of the 10 articles. The brightness of the color confirmed the recency of the topic, with brighter colors representing more recent articles. The latest topic on auto insurance loss, shown in the brightest color, referred to the financial losses incurred by insurance companies due to claims filed by policyholders for accidents or damage involving motor vehicles. Figure 5 (c) shows the density of research topics, where the brighter the color (yellow), the more the articles on those keywords. The algorithm in HMM was a particularly well-studied topic, as evidenced by the increasingly thick yellow color in the circle shown in Figure 5 (c). HMM algorithm was comprehensively analyzed by Alwansyah & Rachmawati (2024).
Figure 6 shows the mapping of the authors of the 5 selected articles. There was no overlapping network as the authors were not related, as they had distinct interests regarding the application of HMM in insurance. This lack of interconnection confirmed each research expert or group worked independently, focusing on different aspects of HMM applications in the insurance domain. This situation presented a valuable opportunity for collaboration. By fostering connections between the authors, research experts could provide avenues for shared discussions and exchange of ideas. Furthermore, collaboration could improve the quality of research by incorporating diverse perspectives and expertise, and even lead to more robust methodologies, improved data analysis techniques, and better interpretations of results. Collaboration could also advance the field of HMM applications in insurance and lead to more comprehensive and innovative outcomes.
3.1.3. Visualization of Article and Similar Works
Visualization capabilities of Researchrabbit website provided recommendations for relevant papers based on those already discovered. This functionality helped identify additional literature probably neglected. Moreover, the website was adept at tracking research trends and the latest publications in specific fields of interest, offering a dynamic and up-to-date view of ongoing research activities. Figure 7 (a) shows that several research shared similarities with the 5 selected articles, identifying extensive investigations in related areas. However, it was important to note that the mapping results from the website might not always correlate perfectly with the criteria set for this particular research. Despite this, some references identified through Researchrabbit could be valuable additions to the literature review. A significant example is Siu (2013), which referred to Elliott & Filinkov (2008), exploring the complex issue of optimal investment strategies for insurance companies. This research was particularly intriguing and challenging due to the inclusion of insurance liabilities, primarily associated with insurance claims. The research investigated the optimal investment problem within the framework of HMM and regime switching, utilizing Backward Stochastic Differential Equation (BSDE). Furthermore, it provided a significant contribution to understanding how insurance companies could manage investments effectively while accounting for the inherent uncertainties in insurance liabilities.
Figure 7 (b) shows that similar articles were marked in blue, while the primary articles from the selection were in green. Similar articles on HMM were published between 1964 and 2012, with research trends peaking in the early 2000s. On the other hand, the selected articles were published between 2012 and 2024. This showed the topic of HMM had been a focus for several decades, and interest in the topic still persists. The research trends observed in the early 2000s reflected a period when HMM methods started gaining significant attention in various applications, including insurance. The applications of HMM in the insurance field have consistently evolved with technological advancements and increasing data complexity. The more recent articles, published between 2003 and 2021, confirmed how articles in this area have developed and adapted to new challenges and opportunities. Generally, this visualization showed the importance of staying abreast of the latest developments in HMM research, as this topic remained relevant with potential for further innovation. By considering the wide range of publications and ongoing trends, research experts could better understand the evolution of the topic and identify opportunities for new contributions in the field of HMM and its applications in the insurance industry.
Figure 8 (a) and (b) show previous works were related research to the selected articles. Therefore, the previous research should be examined more thoroughly to ensure the suitability requirements for the article selection were met. A significant example that met the selection criteria is Paroli et al. (2000). However, this research was not published in an accredited journal, raising concerns about the credibility and accuracy of the results. While this research served as a reference, it should be considered with caution. Despite the limitations, Paroli et al. (2000) remained a reference point for subsequent research, including Tsoi et al. (2005), Lu & Zeng (2012), Oflaz et al. (2019) and Koerniawan et al. (2020), due to the relevance of the topic, namely Poisson Hidden Markov Model (PHMM) in non-life insurance. This model was particularly useful for modeling the dynamics of over-dispersed data, especially the number of claims. Based on Figure 8 (b), there was a relatively narrow gap between previous and current relevant research, as experts intensively investigated the topic. The focused nature of these research allowed for a more comprehensive and detailed understanding of the research subject. By building on the foundational work of research like Paroli et al. (2000), subsequent investigations could be carried out on specific aspects contributing to more nuanced understanding of PHMM applications in non-life insurance. This depth of exploration not only validates and refines existing models but also opens avenues for innovations and solutions to complex problems in the field.
3.2. Results from Systematic Literature Review
This section addresses the research questions of the 5 selected articles.
3.2.1. The Implementation of HMM in Predicting the Frequency or Severity in Insurance Claims
HMM had been significantly used across various fields due to the capability to handle time-series data and the robust framework for dealing with sequences of observable events that were dependent on underlying hidden states. In the context of insurance, HMM can be particularly effective for predicting the frequency and severity of claims, which are crucial for risk assessment and premium calculation (Elliott & Siu, 2012).
The key components of claims prediction using HMM include hidden states (which cannot be directly observed but influence claims), transition dynamics or probabilities between hidden states and the output (observation) probabilities of each hidden state. Based on these components, HMM can predict the frequency or severity of future claims by estimating the probability of transitions between various hidden states. Out of the 5 selected articles, 3 by Lu & Zeng (2012), Oflaz et al. (2019) and Koerniawan et al. (2020), predicted the frequency of insurance claims. Meanwhile, Irfan (2018) predicted the severity of insurance claims, and Jiang (2024) predicted both the frequency and severity of insurance claims. These articles are presented in Figure 9. HMM is often easier to apply when predicting claims frequency in the form of discrete sequential data, while claims severity typically requires a more complex method due to its continuous nature.
From the 5 articles in Figure 9, the distributions used in predicting claims with HMM were analyzed. These distributions, along with corresponding probability density functions (pdf) or probability mass functions (pmf) are presented in Table 2.
In claims risk prediction using HMM, Poisson distribution was used to calculate the probability of a certain number of claims occurring in the future, based on the current and predicted hidden states. For instance, hidden states can represent conditions affecting claims frequency, such as economic factors, policy changes, or policyholder behavior. Each state can have a different parameter for Poisson distribution, reflecting the expected frequency of claims when the observation is in that state. This concept also applies to the Negative Binomial and Bernoulli distributions, with differences in distributions parameters. The Negative Binomial distribution can be used to model the number of claims in each hidden state, specifically when Poisson distribution is not sufficient to capture the variability involved. Meanwhile, the Bernoulli distribution in each hidden state can model the occurrence of claims, depending on the underlying hidden state. The Exponential distribution can be used to model claims severity when the system is in a particular hidden state in HMM. Each state may have distinct Exponential distribution. For example, a high-risk hidden state might have an Exponential distribution with a smaller parameter (confirming a larger average claims severity). The Exponential distribution is a special case of the Gamma distribution with . The Gamma distribution offers additional transmission with parameter , allowing it to capture more variability in complex severity claims. This makes the Gamma distribution more suitable for cases where claims severity exhibits non-uniform patterns or when modeling large claims with varying levels of severity.
3.2.2. The Number and the Interpretation of Hidden States in HMM
The number of hidden states in HMM plays a crucial role in determining the model’s ability to accurately represent the underlying structure of the observed data, particularly in the context of insurance claims. The number of hidden states is not typically known in advance and needs to be selected based on domain knowledge or experimentation. Typically, the number of hidden states is defined as .. Each hidden state can be interpreted as representing a different risk regime or latent condition that influences the observed frequency or severity of claims. A model with an insufficient number of hidden states might oversimplify the complexity of the data, failing to capture important variations and leading to less accurate predictions of claims risks. Conversely, having numerous hidden states can lead to overfitting, where the model becomes excessively tailored to the training data, reducing its predictive accuracy on new or hidden data. In HMM applications, more than two hidden states are often necessary because real-world systems tend to exhibit complex patterns or phases that cannot be fully captured by only two states (Awad & Khanna, 2015). Table 3 shows that the research using HMM have a minimum of two hidden states.
The number of hidden states had a significant impact on risk assessment, as it directly influenced how the model identified and differentiated between various risk levels. For example, in the insurance context, a model with multiple hidden states could distinguish between periods of low, medium, and high claims risk, allowing for more nuanced risk prediction and management strategies. This level of granularity enabled the model to capture subtle shifts in claims behavior or frequency, providing more accurate estimates of potential risk exposure. Therefore, determining the appropriate number of hidden states was critical, ensuring HMM could adequately balance model complexity with predictive accuracy, leading to better-informed decisions in managing and pricing insurance risk. To determine the appropriate number of hidden states in HMM, model selection criteria like Bayesian Information Criterion (BIC) or Akaike Information Criterion (AIC) were commonly used. HMM with the lowest BIC value was considered to have the optimal number of hidden states.
Most of the selected articles used BIC to determine the appropriate number of hidden states. For example, Lu & Zeng (2012) interpreted hidden states 1, 2, and 3 as corresponding to low-, moderate-, and high- occurrences of hurricanes and tropical storms annually. Oflaz et al. (2019) defined three hidden states, with state 3 representing the lowest mean claims severity (low state), state 2 representing the highest mean claims severity (high state), and state 1 representing the medium level of claims severity (medium state). In contrast, Azis et al. (2018), Koerniawan et al. (2020), and Jiang & Shi (2024) did not define the meaning of hidden states. This was not unusual, as further investigations could show the interpretation of the hidden states.
4. Discussion
4.1. The State of the Art of HMM Applications in Insurance Claims
The applications of HMM in the insurance industry have gained significant traction in recent years due to the ability to model stochastic processes with unobservable states. HMM is particularly well-suited for handling the uncertainty and dynamic nature of insurance claims, where underlying risk factors and claims patterns evolve over time. By allowing for transitions between hidden states, HMM provides a robust framework for capturing the complex temporal dependencies inherent in insurance data. This section reviews the state-of-the-art applications of HMM in insurance, emphasizing common methodologies, the evolving use of distribution models across various types of insurance claims, and the outputs of HMM, which can be in the form of probabilities or forecasts.
Based on Table 4, previous research on insurance claims using HMM showed that Poisson distribution was commonly used to describe claims counts. Poisson distribution was frequently chosen due to its simplicity and suitability for modeling discrete events, such as insurance claims, occurring over a specified time interval. It allowed the model to predict the number of claims events within a given period, assuming the events were independent and occurred randomly at a constant average rate. This fundamental property made it effective in scenarios where claims frequency was low to moderate, justifying its usage in HMM to map claims patterns from policyholders.
Poisson distribution, however, has limitations making it unsuitable for all types of claims data. One of its main assumptions is that the mean and variance of the distribution are equal. In the context of insurance claims, particularly for more complex types like catastrophe or fire claims, the data often exhibit overdispersion, where the variance exceeds the mean. Therefore, Poisson distribution often fails to capture the greater variability in insurance claims data with high frequencies or significant variations between claims. The inability to handle this condition results in inaccuracies when modeling more complex claims data.
Based on previous research like Azis et al. (2018) and Oflaz et al. (2019), the parameter estimation results from HMM, particularly the transition probabilities, have been further developed into exact event forecasts. This allows the model to not only estimate the likelihood of transitions between hidden states but also predict specific future events with a degree of precision. Although this extension of HMM parameter estimation into forecasting represents a significant advancement, the models used for prediction have not been able to achieve high levels of accuracy. In many cases, the predicted outcomes deviate from actual observations, particularly in complex or highly variable datasets. Therefore, improvements in model structure, parameter tuning, or the inclusion of additional factors were necessary to improve forecasting performance.
4.2. Research Gaps
In addressing the limitations of Poisson distribution in HMM, some research have attempted to combine it with other distributions or use modifications, such as Poisson-XLindley. These combinations aim to improve the model’s ability to handle data with overdispersion or underdispersion (see Ahsan-Ul-Haq et al. (2022)), as well as account for situations where claims frequency varies greatly or events were rare but with significant impacts. Such hybrid distributions provide better flexibility in capturing the complexity of insurance claims data, ensuring that HMM can deliver more accurate and realistic predictions in line with real-world claims patterns.
After selecting the appropriate distribution model, it is crucial to support HMM with more accurate forecasting models to improve predictive performance. While HMM excels at capturing hidden state transitions and estimating associated probabilities, integrating it with robust forecasting techniques can improve the precision of future event predictions. Several forecasting models can be used in conjunction with HMM parameters, such as Autoregressive Integrated Moving Average (ARIMA), which can handle time series data by incorporating past observations and residual errors. Another option is Generalized Autoregressive Conditional Heteroskedasticity (GARCH) model, which is useful for predicting volatility, specifically in financial or insurance data with time-varying variances. In addition, Bayesian forecasting models are combined with HMM to provide probabilistic forecasts, capturing uncertainty more effectively. By combining HMM with these models, the resulting framework can leverage the strength of HMM’s hidden state transitions while improving the accuracy of the prediction process.
5. Conclusions
In conclusion, this research presented SLR of the applications of HMM in insurance claims. A total of five articles were selected through a screening process from four digital libraries, namely Scopus, Science Direct, and Dimensions. The results of SLR, particularly in bibliometric analysis, showed that research on the applications of HMM in insurance claims had been actively conducted in the last 5 years, as detailed in the provided journal list. Furthermore, the journals that published articles on this topic were accredited, ensuring reliable results, and the authors of these research had not been able to collaborate extensively. This presented opportunities for further collaboration to produce more articles and contribute beneficial and novel insights.
Analysis of ResearchRabbit website showed that similar investigations in the 5 selected articles occurred between the early 2000s and 2012, offering insights into previous and related articles. From a literature review standpoint, more than 50% of the 5 articles focused on insurance claims from the frequency perspective. Even though Poisson distribution was often used to assess the risk of claims frequency, it needed adjustment according to the characteristics of claims within the specific insurance scheme. Moreover, the optimal number of hidden states in HMM was determined using AIC and BIC methods, with results showing a minimum of two states, which could be interpreted or assumed according to research requirements.
Future research were recommended to expand SLR of HMM applications in assessing insurance claims risk with a broader scope. In addition to addressing claims frequency and severity, it was crucial to involve the risk profiles of policyholders and the detection of fraudulent claims.
Author Contributions
Conceptualization, S. and H.A.; methodology, H.A.; software, H.N.; validation, S, N.I. and H.N..; formal analysis, S.; writing—original draft preparation, H.A.; writing—review and editing, N.I. and H.N..; visualization, H.A.; supervision, S., H.N. and N.I; project administration, S.; funding acquisition, S.
Funding
This research was funded by the Padjadjaran Doctoral Program Scholarship (BPDP) at Universitas Padjadjaran, grant number 1549/UN6.3.1/PT.00/2023.
Acknowledgments
The authors are grateful to Universitas Padjadjaran, who provided the Padjadjaran Doctoral Program Scholarship (BPDP) and Article Processing Charge (APC).
Conflicts of Interest
The authors declare no conflicts of interest.
References
- Ahsan-Ul-Haq, M., Al-Bossly, A., El-Morshedy, M., & Eliwa, M. S. (2022). Poisson XLindley Distribution for Count Data: Statistical and Reliability Properties with Estimation Techniques and Inference. Computational Intelligence and Neuroscience, 2022. [CrossRef]
- Alwansyah, M. A., & Rachmawati, R. (2024). Modeling The Many Earthquakes in Sumatra Using Poisson Hidden Markov Models and Expectation Maximization Algorithm. BAREKENG: J. Math. & App, 18(1), 163–0170. [CrossRef]
- Awad, M., & Khanna, R. (2015). Hidden Markov Model. In Efficient learning Machines: Theories, Concepts, and Application for Engineers and System Designers (pp. 81–104). Apress Berkeley. [CrossRef]
- Azis, I., Setiawaty, B., & Gusti Putu Purnaba, I. (2018). Modeling Of Vehicle Insurance Claim Using Exponential Hidden Markov. International Journal of Pure and Applied Mathematics, 118(2), 309–320. [CrossRef]
- Elliott, R. J., & Filinkov, A. (2008). A self tuning model for risk estimation. Expert Systems with Applications, 34(3), 1692–1697. [CrossRef]
- Elliott, R. J., & Siu, T. K. (2012). An HMM approach for optimal investment of an insurer. Journal of Robust and Nonlinear Control. [CrossRef]
- Firdaniza, F., Ruchjana, B. N., Chaerani, D., & Radianti, J. (2022). Information Diffusion Model in Twitter: A Systematic Literature Review. Information (Switzerland), 13(1). [CrossRef]
- Jiang, Q., & Shi, T. (2024). Auto Insurance Pricing Using Telematics Data: Application of a Hidden Markov Model. North American Actuarial Journal, ahead-of-print(ahead-of-print), 1–18. [CrossRef]
- Koerniawan, V., Sunusi, N., & Raupong, R. (2020). Estimasi Parameter Model Poisson Hidden Markov Pada Data Banyaknya Kedatangan Klaim Asuransi Jiwa. ESTIMASI: Journal of Statistics and Its Application, 1(2), 65. [CrossRef]
- Kumar, A., Paliwal, J., Brar, V., Singh, M., Tambe Patil, P., & Raibagkar, S. (2023). Previous Year’s Cite Score Strongly Predicts the Next Year’s Score: Ten Years of Evidence for the Top 400 Scopus-indexed Journals of 2021. Journal of Scientometric Research, 12, 1–12. [CrossRef]
- Lu, Y., & Zeng, L. (2012). A Nonhomogeneous Poisson Hidden Markov Model for Claim Counts. ASTIN Bulletin, 42(1), 181–202. [CrossRef]
- Mor, B., Garhwal, S., & Kumar, A. (2021). A Systematic Review of Hidden Markov Models and Their Applications. Archives of Computational Methods in Engineering, 28(3), 1429–1448. [CrossRef]
- Odumuyiwa, V., & Osisiogu, U. (2019). A Systematic Review on Hidden Markov Models for Sentiment Analysis. 2019 15th International Conference on Electronics, Computer and Computation (ICECCO), 1–7. https://api.semanticscholar.org/CorpusID:214624137.
- Oflaz, Z. N., Yozgatligil, C., & Selcuk-Kestel, A. S. (2019). AGGREGATE CLAIM ESTIMATION USING BIVARIATE HIDDEN MARKOV MODEL. ASTIN Bulletin, 49(1), 189–215. [CrossRef]
- Omari, C. O., Nyambura, S. G., & Mwangi, J. M. W. (2018). Modeling the Frequency and Severity of Auto Insurance Claims Using Statistical Distributions. Journal of Mathematical Finance, 08(01), 137–160. [CrossRef]
- Orfanogiannaki, K., & Karlis, D. (2018). Multivariate Poisson hidden Markov models with a case study of modelling seismicity. Australian and New Zealand Journal of Statistics, 60(3), 301–322. [CrossRef]
- Ortega-Rodríguez, C., Licerán-Gutiérrez, A., & Moreno-Albarracín, A. L. (2020). Transparency as a key element in accountability in non-profit organizations: A systematic literature review. In Sustainability (Switzerland) (Vol. 12, Issue 14). [CrossRef]
- Paroli, R., Redaelli, G., & Spezia, L. (2000). Poisson Hidden Markov Models for Time Series of Overdispersed Insurance Counts.
- Preserve, L., & Yin, X. (2018). Estimation of Hidden Markov Model Recommended Citation. https://preserve.lehigh.edu/etd/4332.
- Ramaki, A. A., Barforoush, A. R., & Jafari, A. J. (2018). A systematic review on intrusion detection based on the Hidden Markov Model. Statistical Analysis and Data Mining: The ASA Data Science Journal, 11, 111–134. https://api.semanticscholar.org/CorpusID:48362603.
- Sukono, Juahir, H., Ibrahim, R. A., Saputra, M. P. A., Hidayat, Y., & Prihanto, I. G. (2022). Application of Compound Poisson Process in Pricing Catastrophe Bonds: A Systematic Literature Review. In Mathematics (Vol. 10, Issue 15). [CrossRef]
- Thelwall, M. (2018). Dimensions: A Competitor to Scopus and the Web of Science? Journal of Informetrics, 12. [CrossRef]
- Tsoi, A. C., Zhang, S., & Hagenbuchner, M. (2005). Pattern discovery on Australian medical claims data - A systematic approach. IEEE Transactions on Knowledge and Data Engineering, 17(10), 1420–1435. [CrossRef]
- Zucchini, W., & MacDonald, I. (2009). Hidden Markov Models for Time Series (I). Taylor & Francis Group.
Figure 1.
Phases of SLR Presented on PRISMA Diagram.
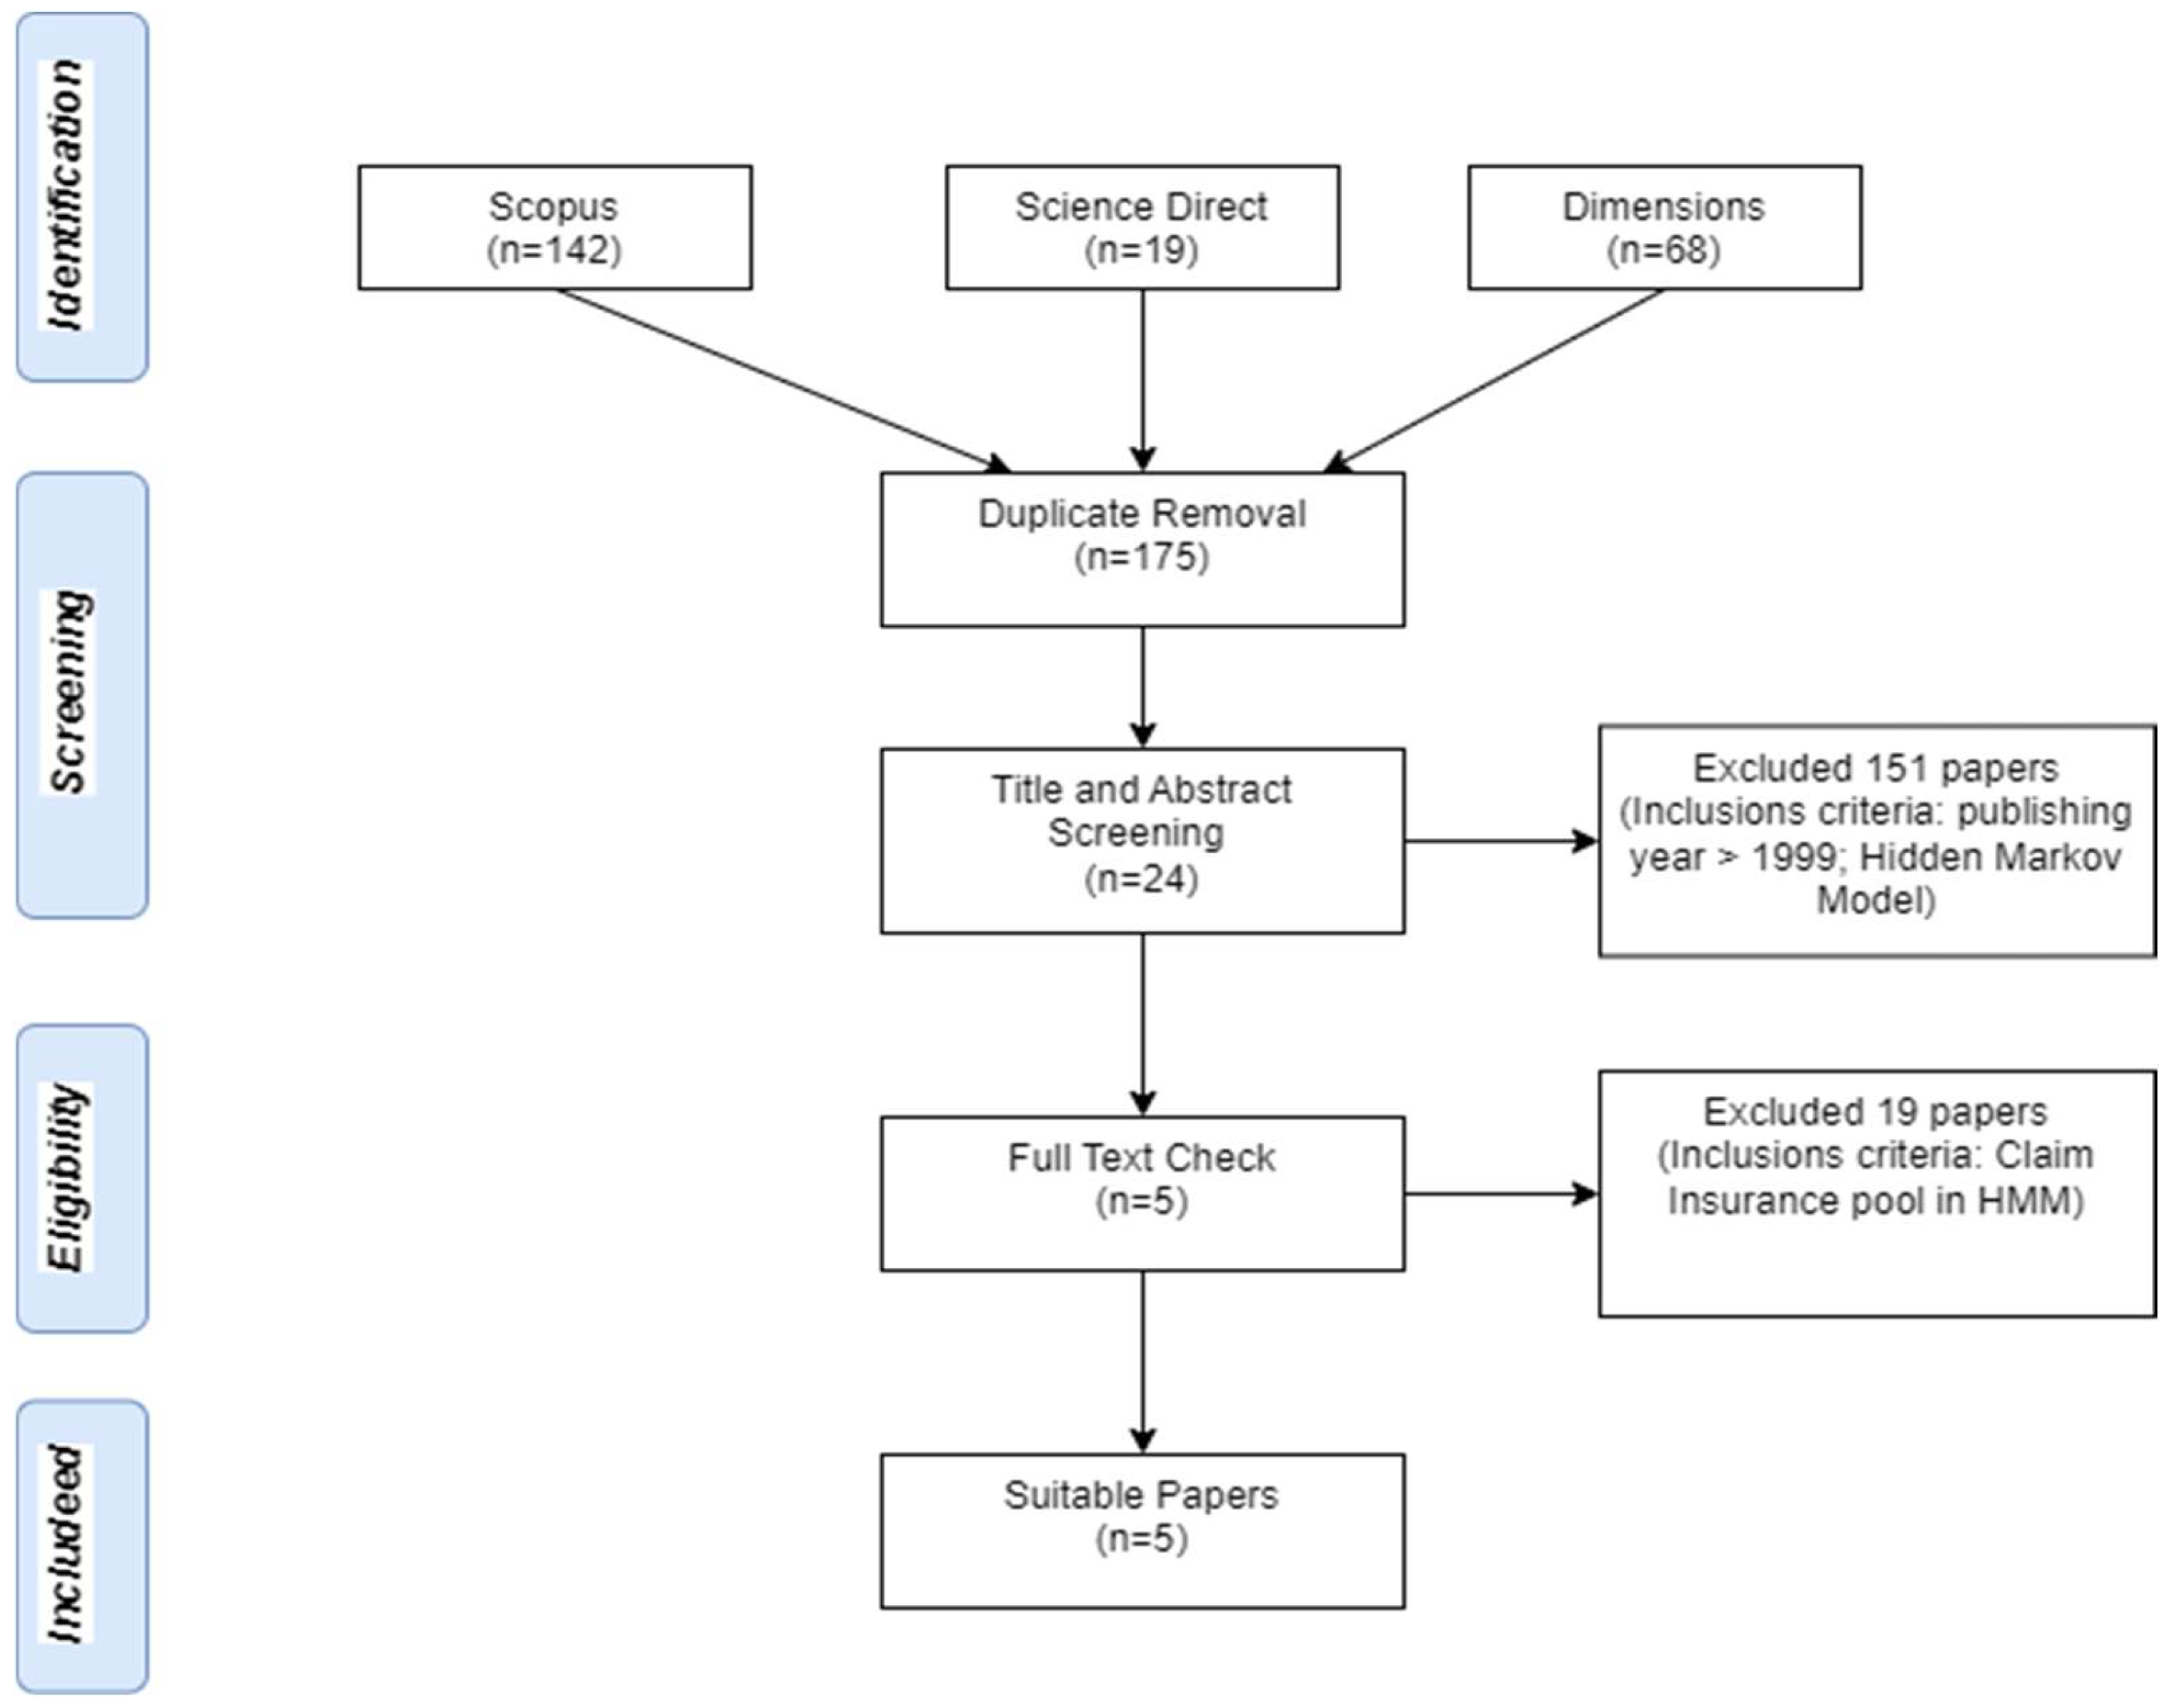
Figure 2.
The Annual Number of Article of HMM Application in Insurance Claim.
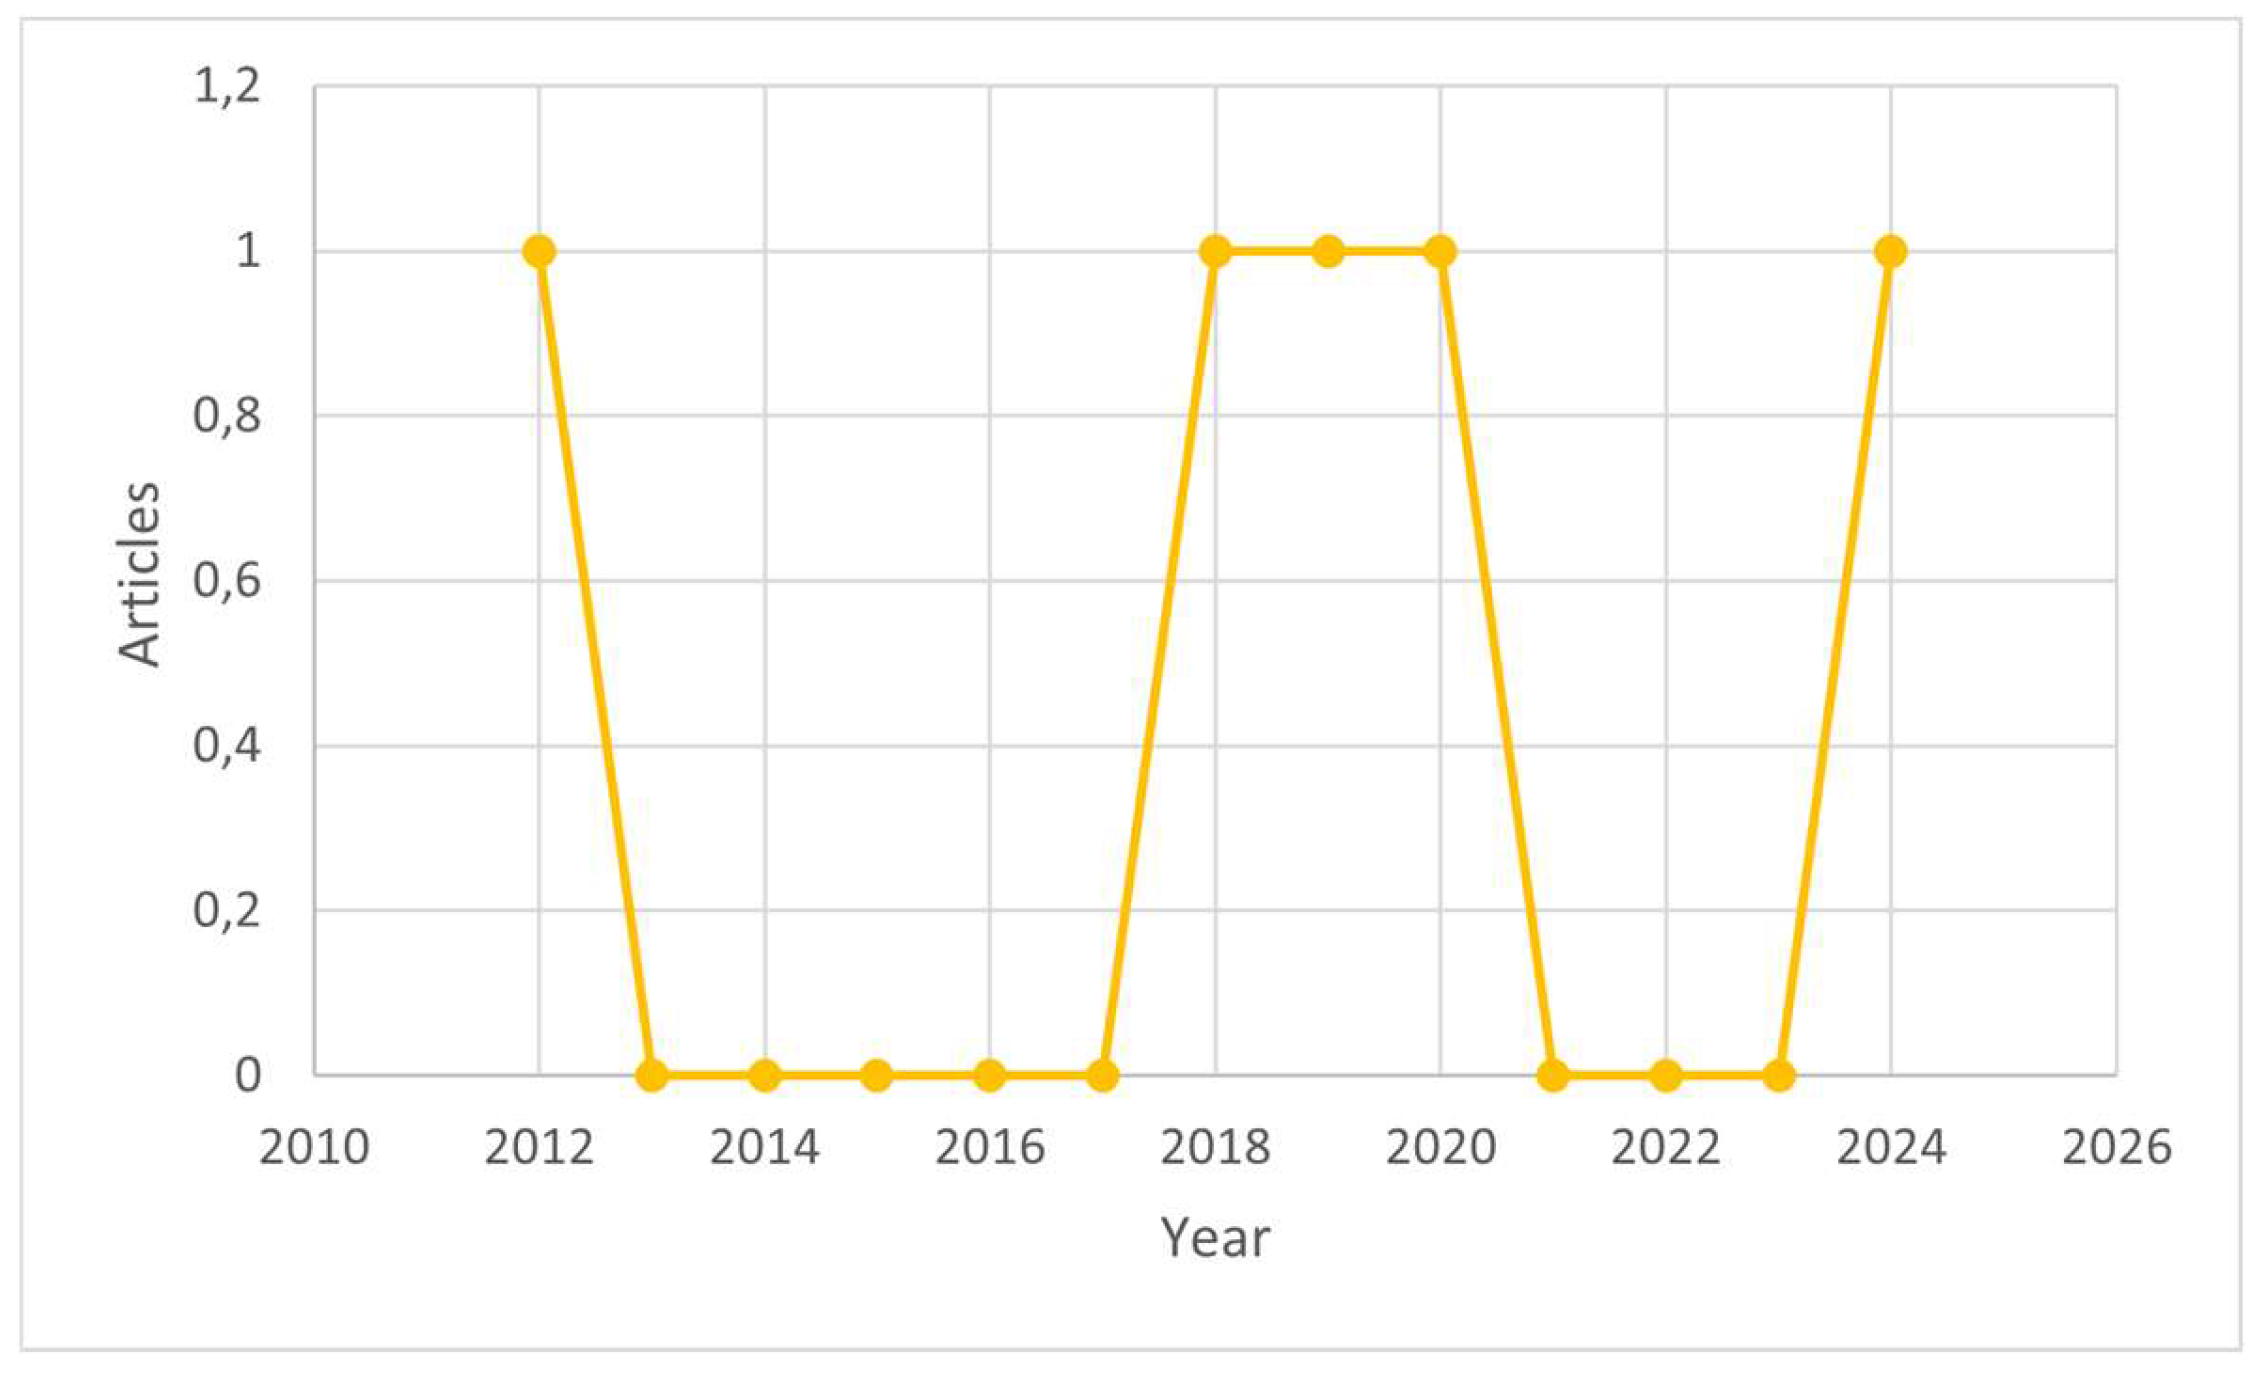
Figure 3.
List of Journals that Publish HMM Application in Insurance Claims.
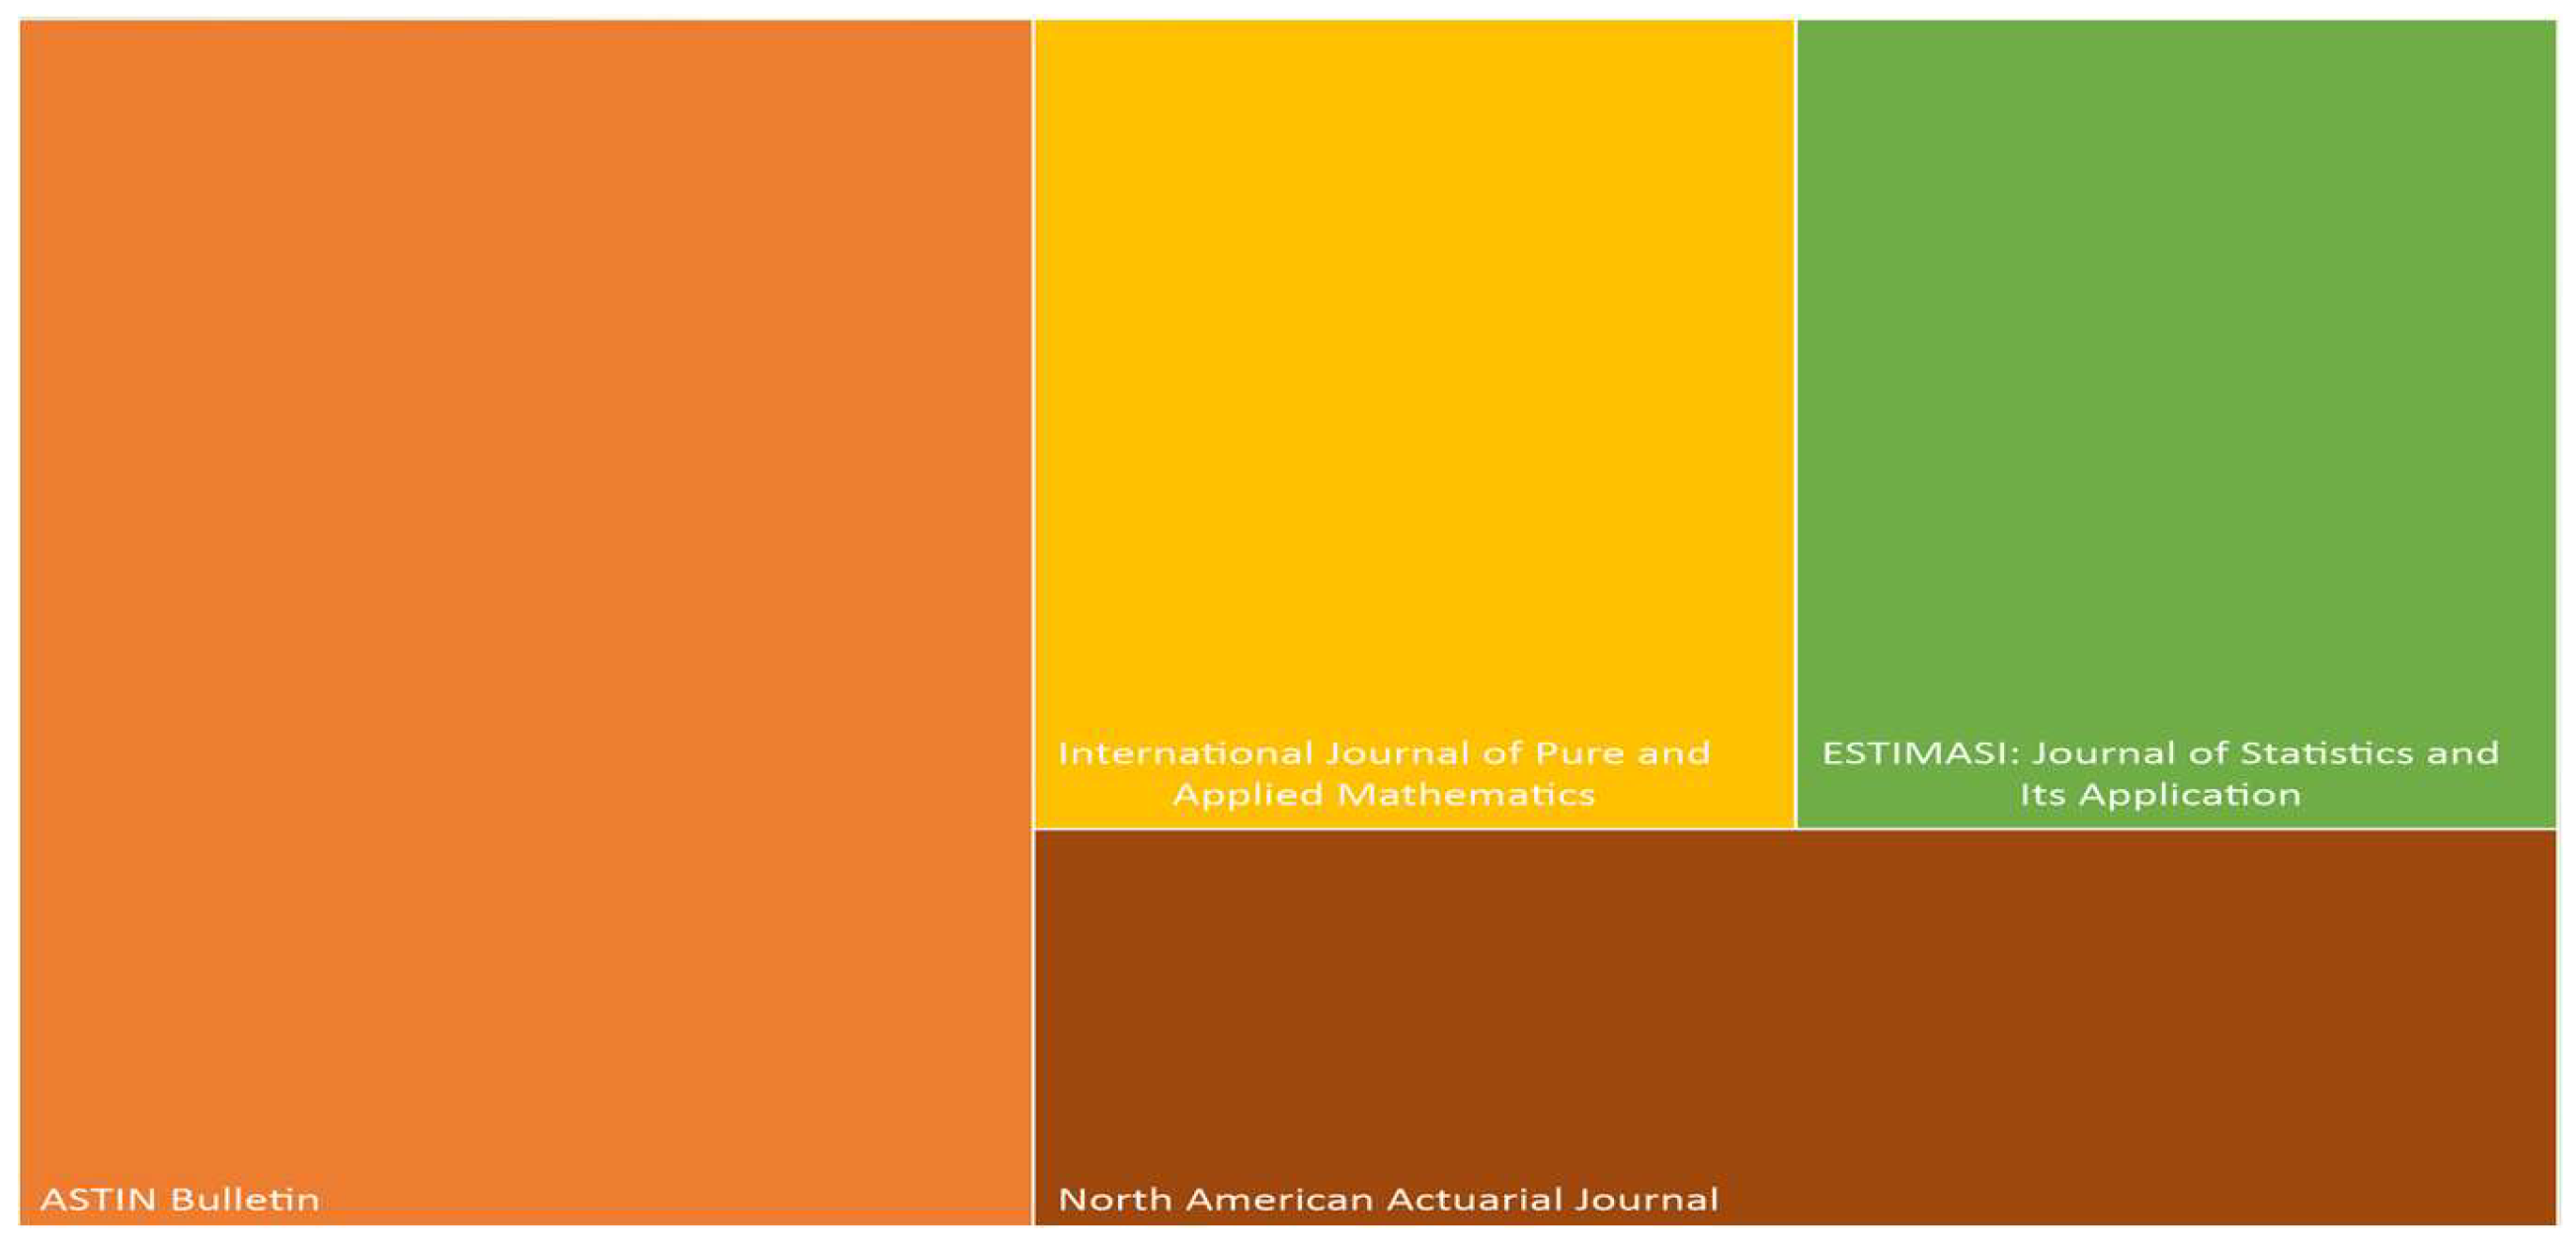
Figure 4.
Field Area Research of Journal that Publish HMM Application in Insurance Claims.
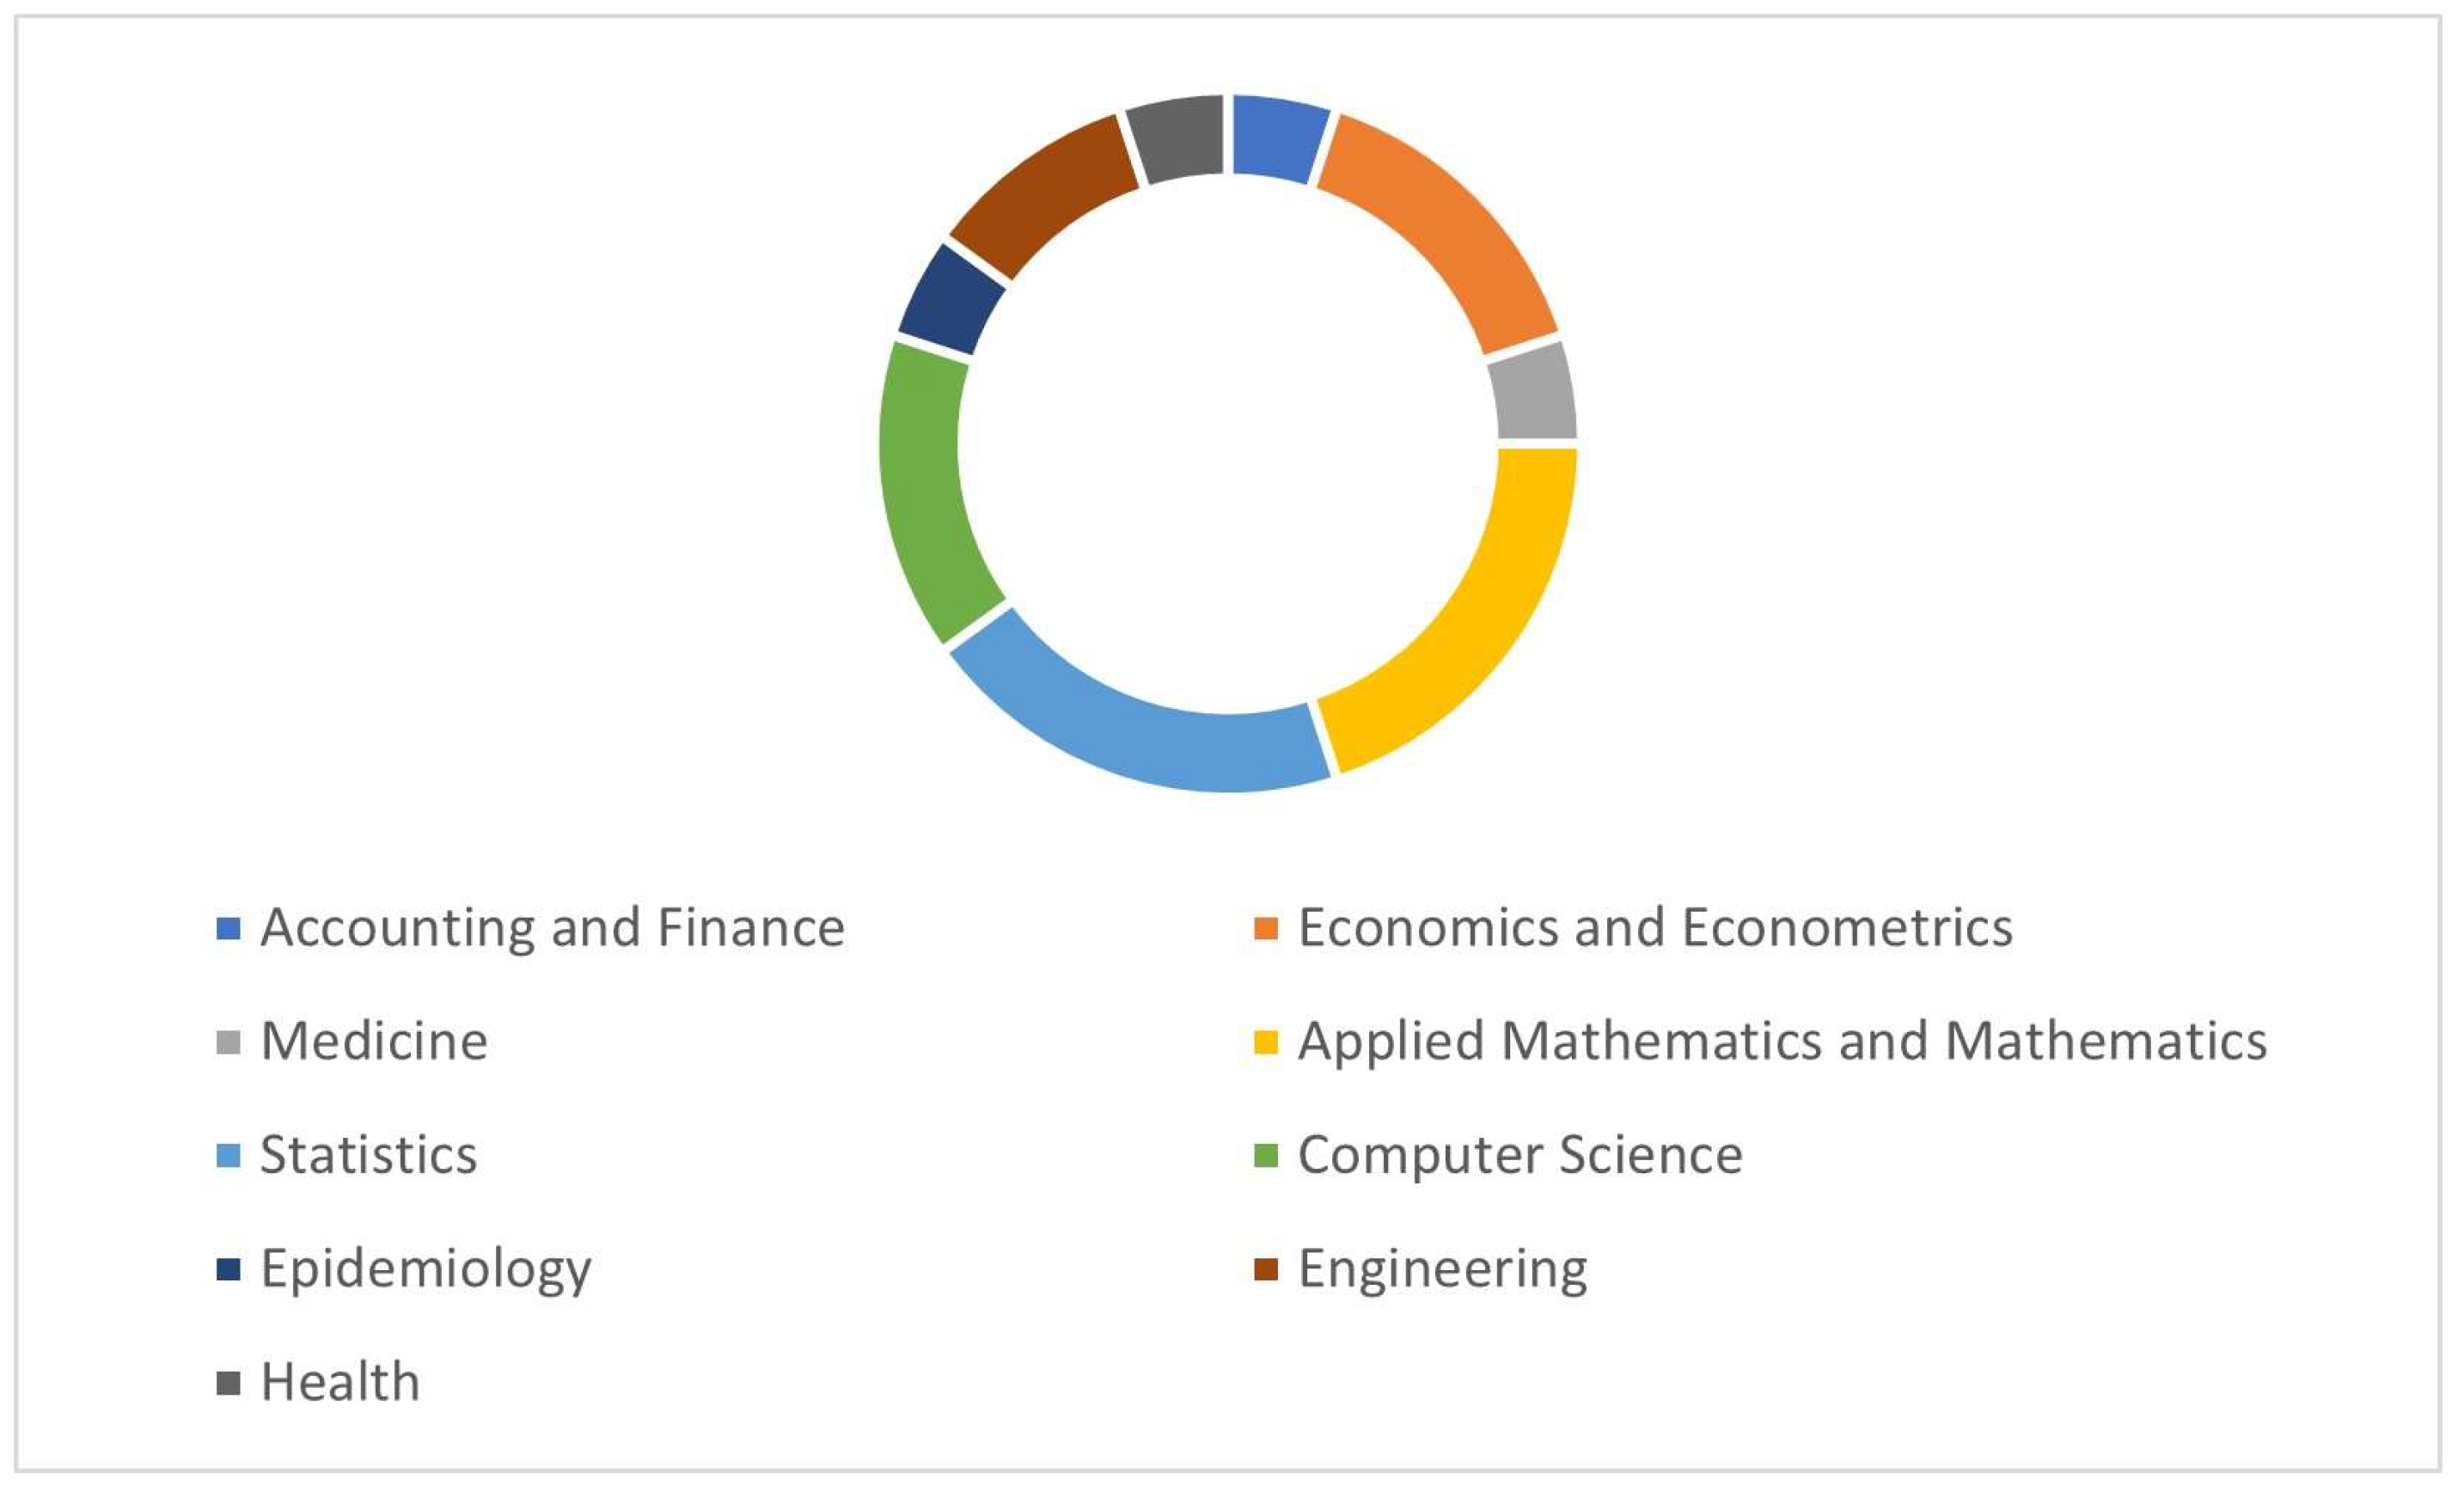
Figure 5.
Bibliographic Mapping by the Co-Occurrence of Keywords: (a) Network Visualization; (b) Overlay Visualization; and (c) Density Visualization.
Figure 5.
Bibliographic Mapping by the Co-Occurrence of Keywords: (a) Network Visualization; (b) Overlay Visualization; and (c) Density Visualization.
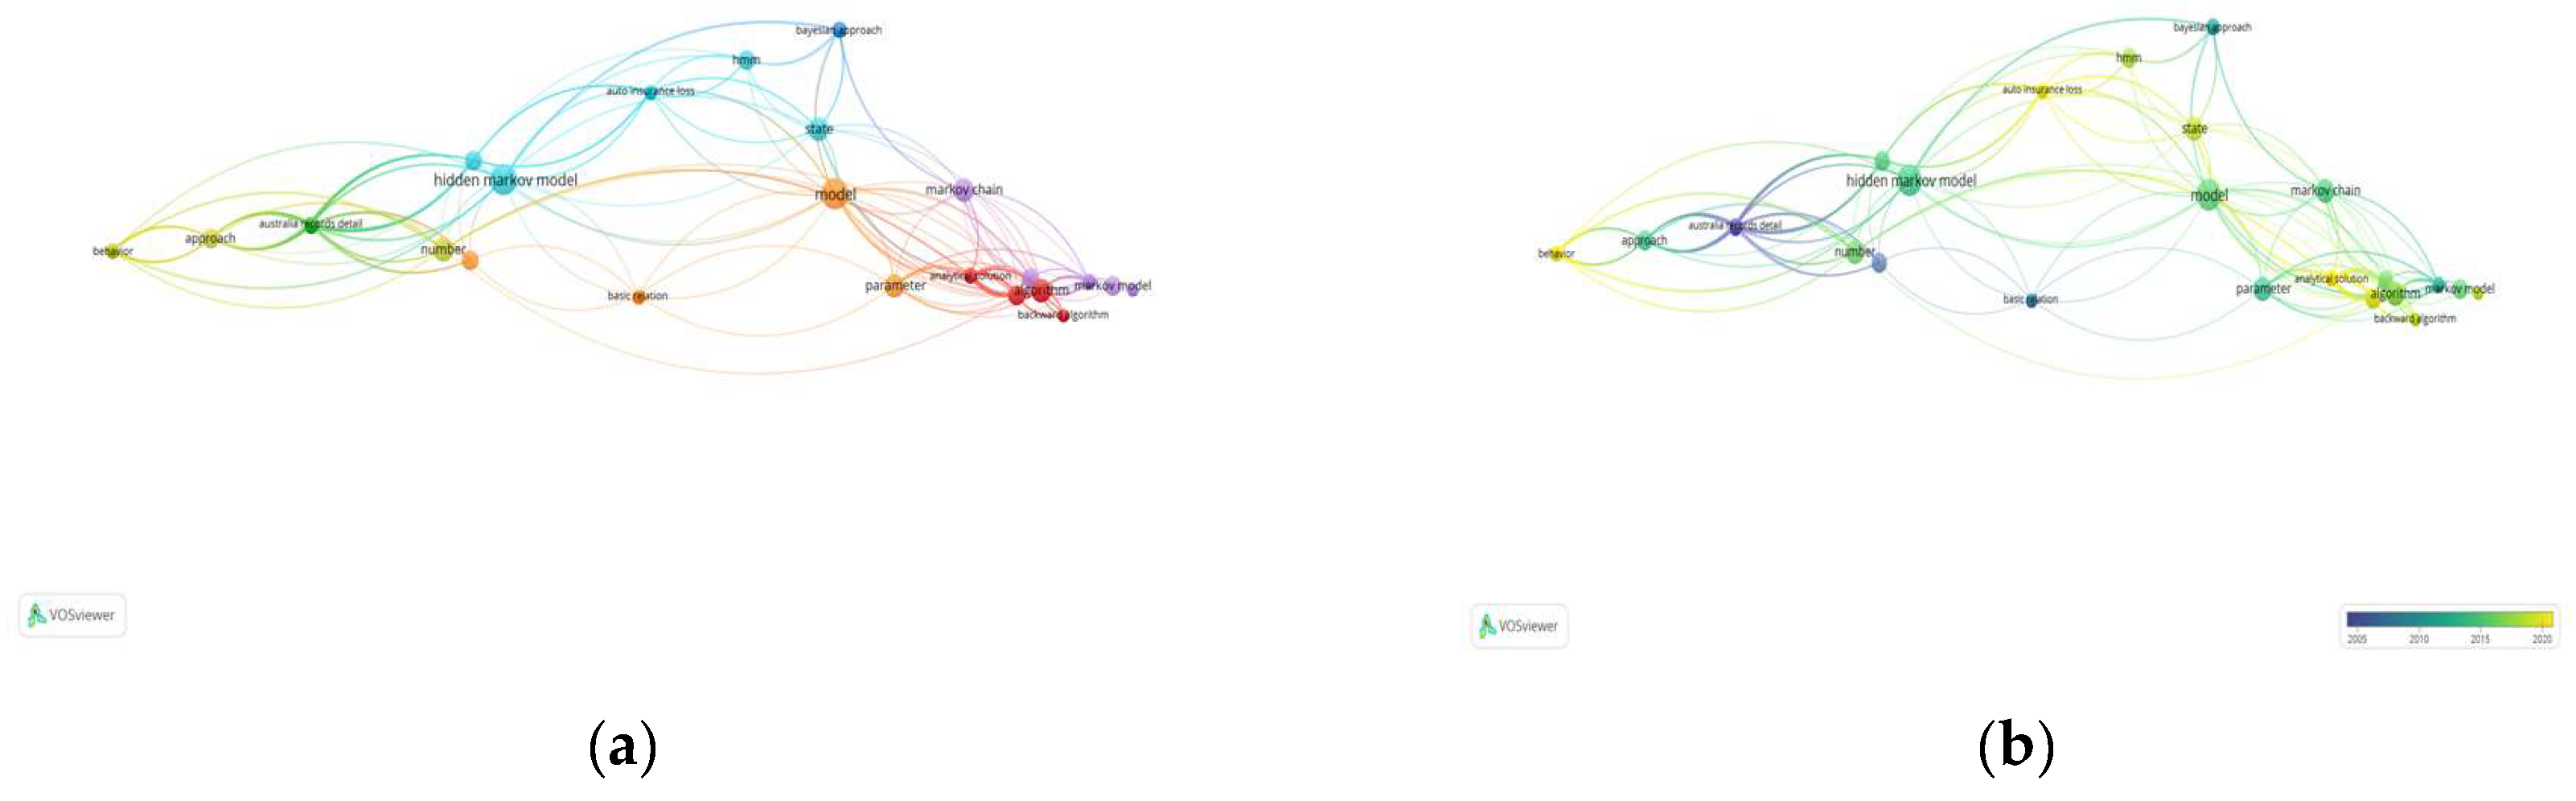
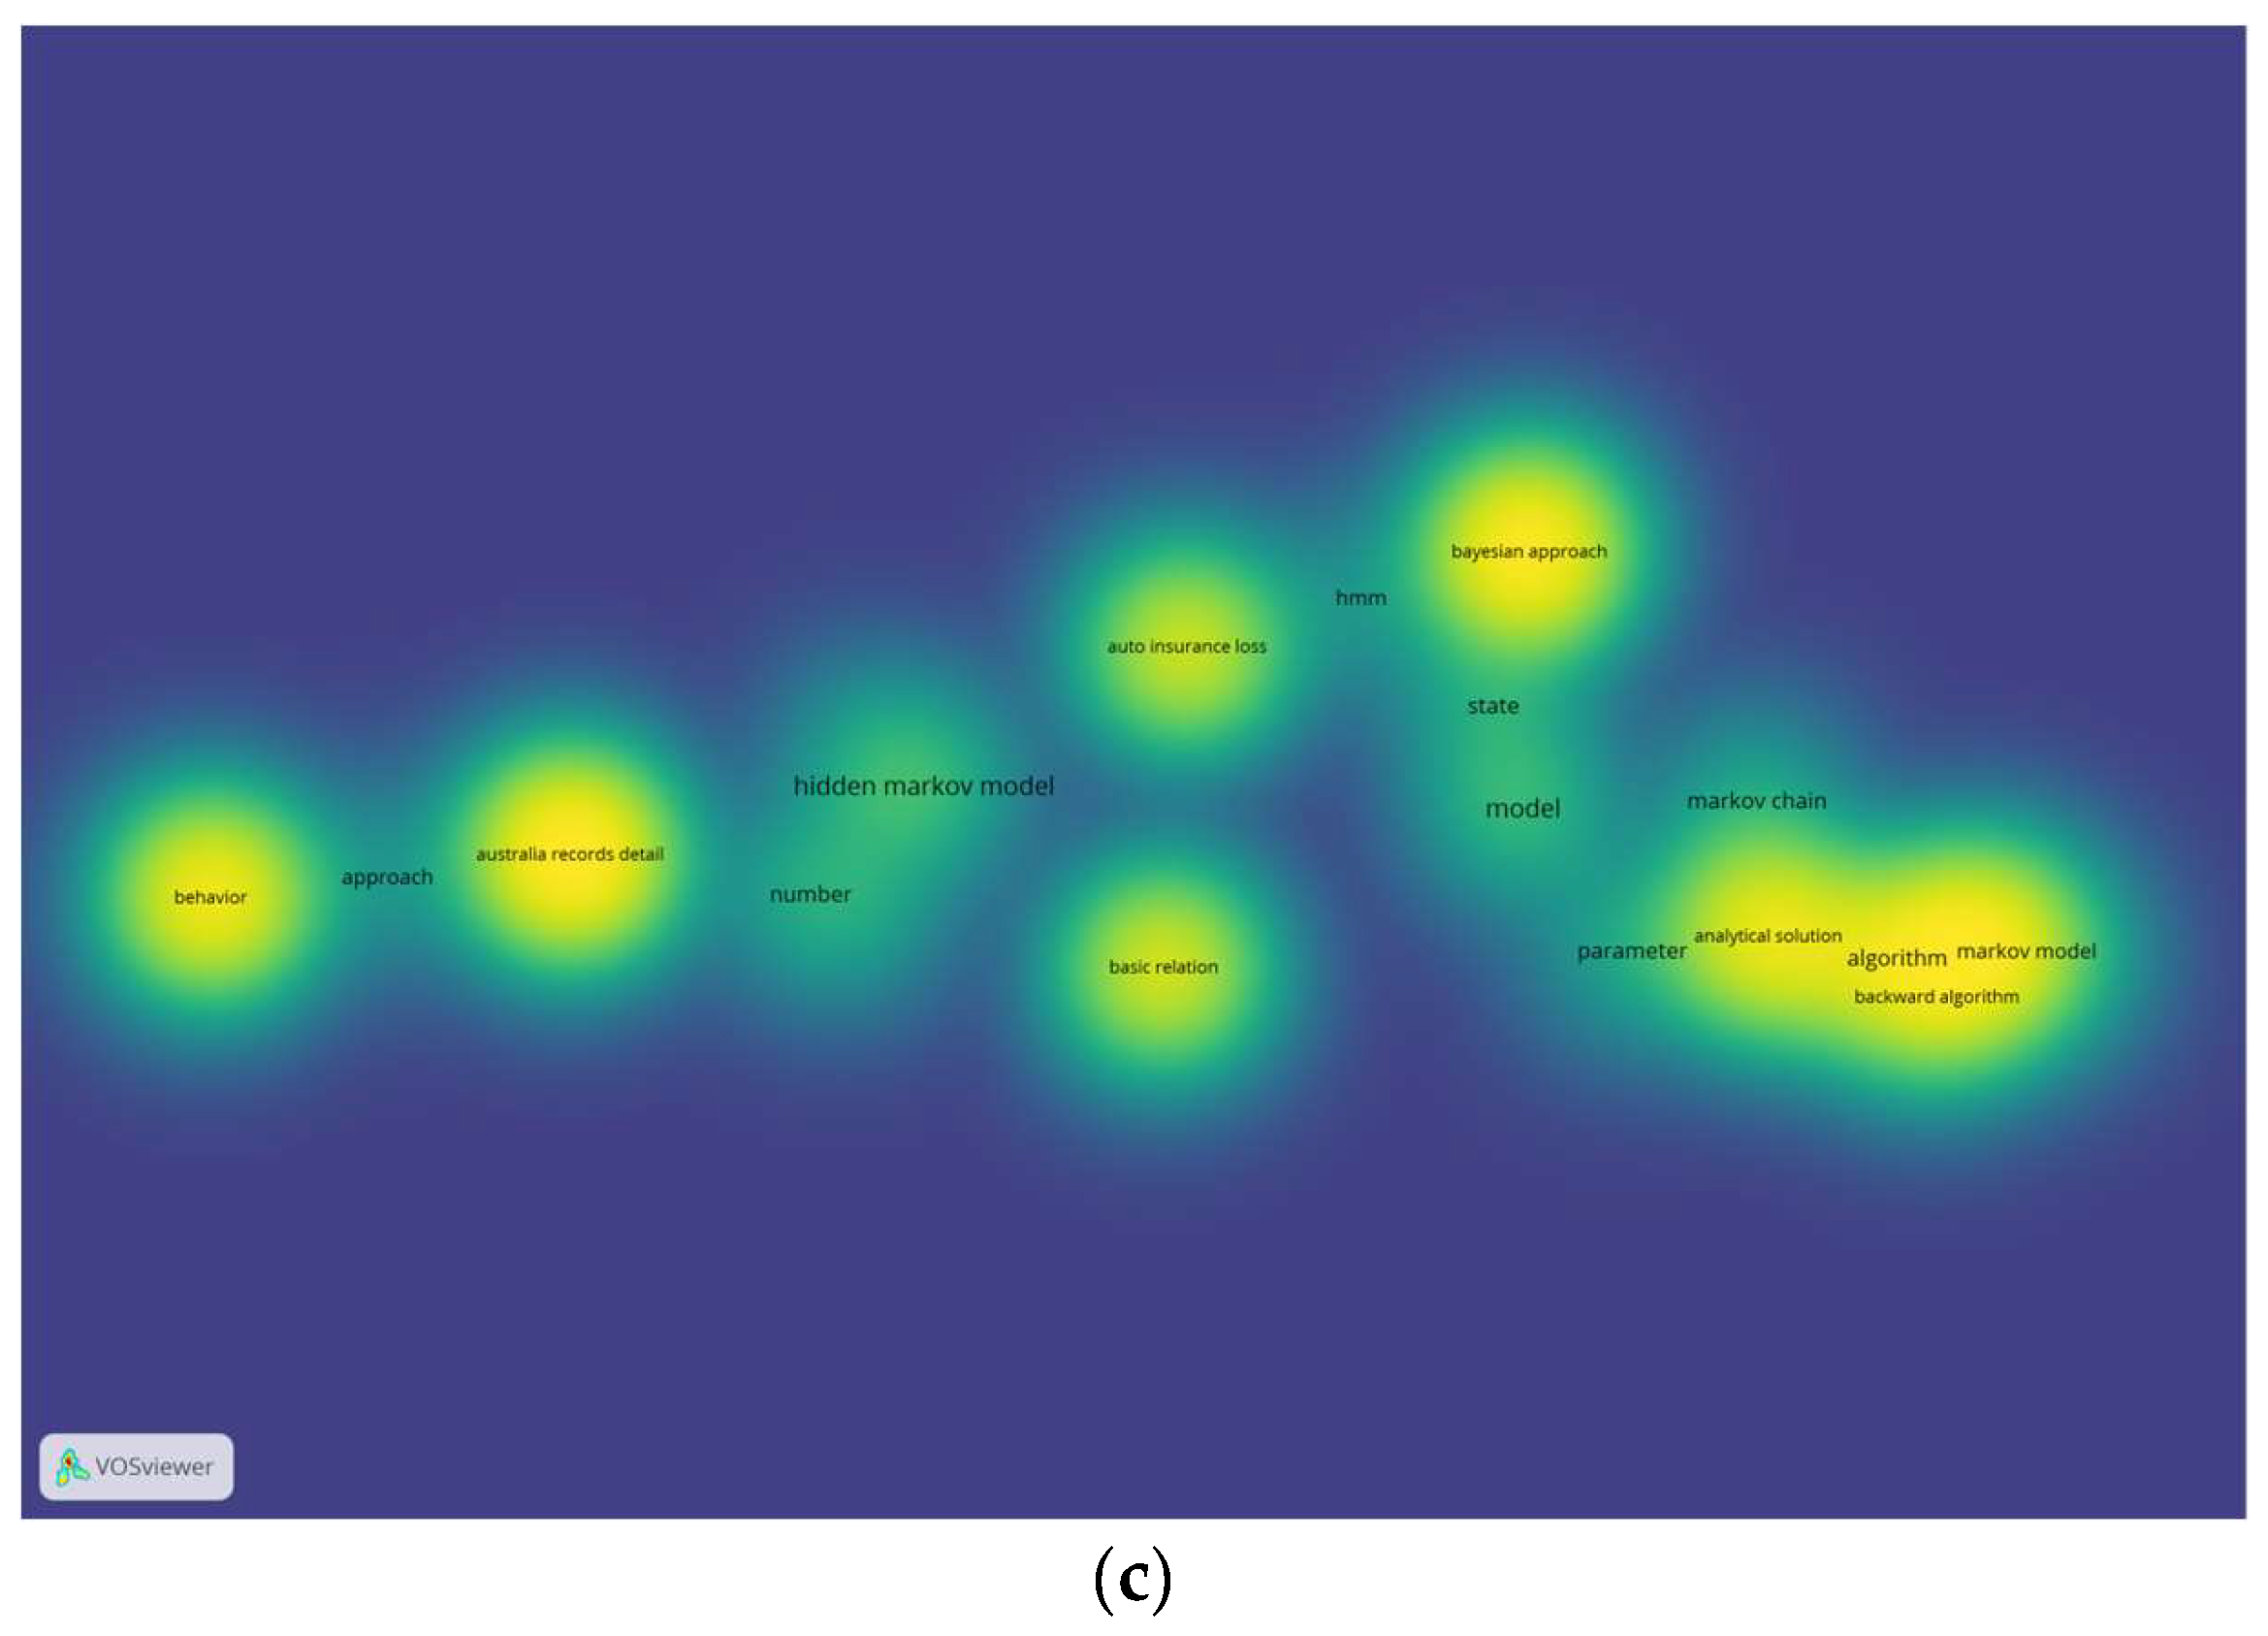
Figure 6.
This is a figure. Schemes follow the same formatting.
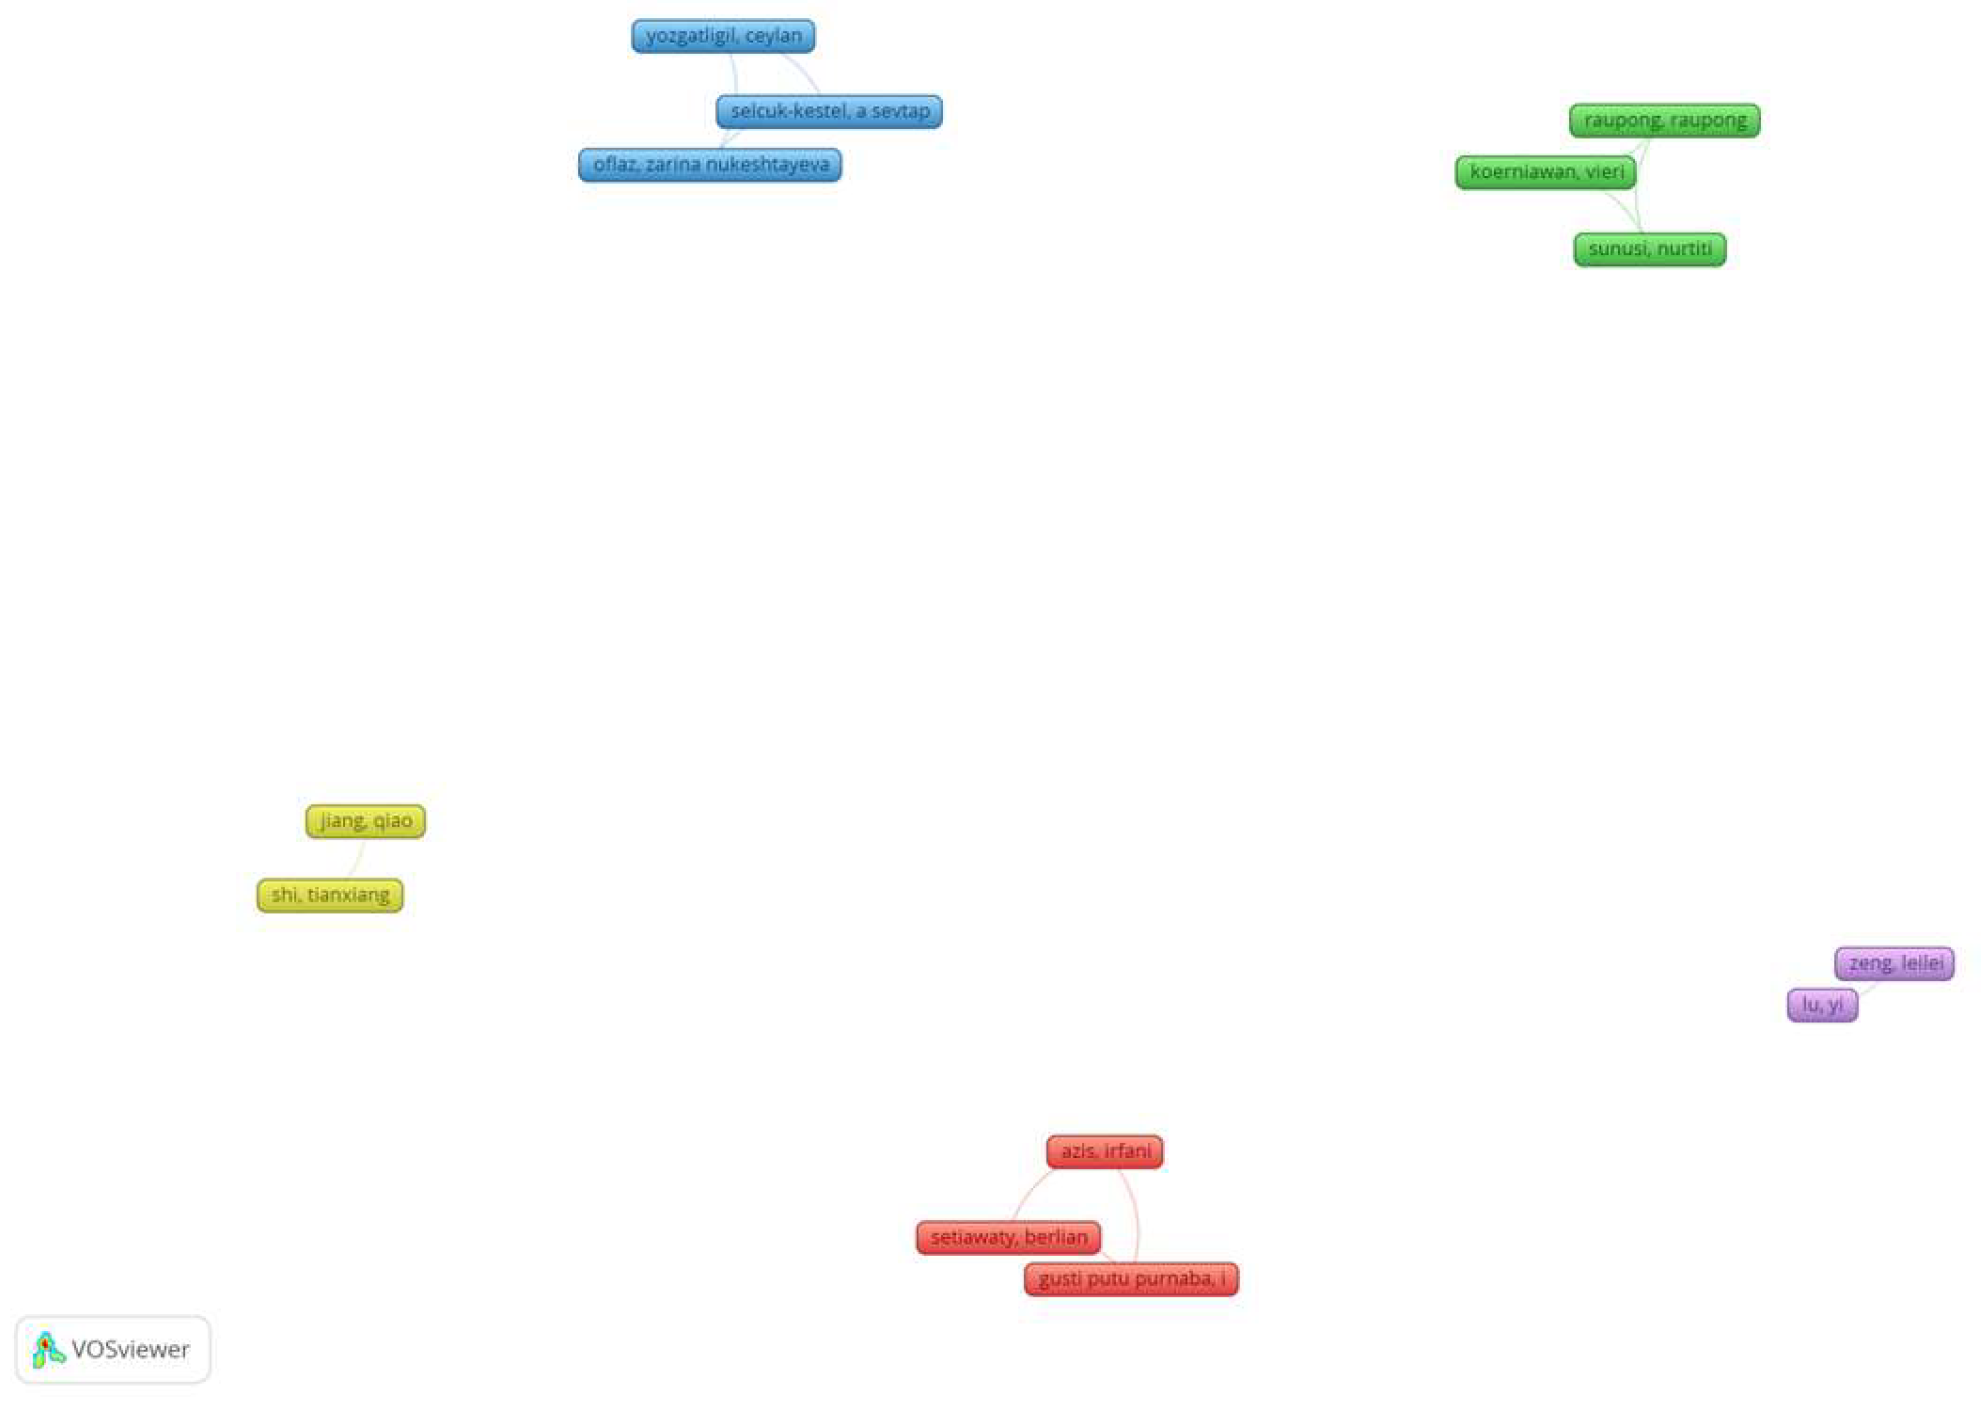
Figure 7.
Similar Works in Relation to the Research of 5 Selected Articles: (a) Graph Type of Network; (b) Graph Type of Timeline.
Figure 7.
Similar Works in Relation to the Research of 5 Selected Articles: (a) Graph Type of Network; (b) Graph Type of Timeline.
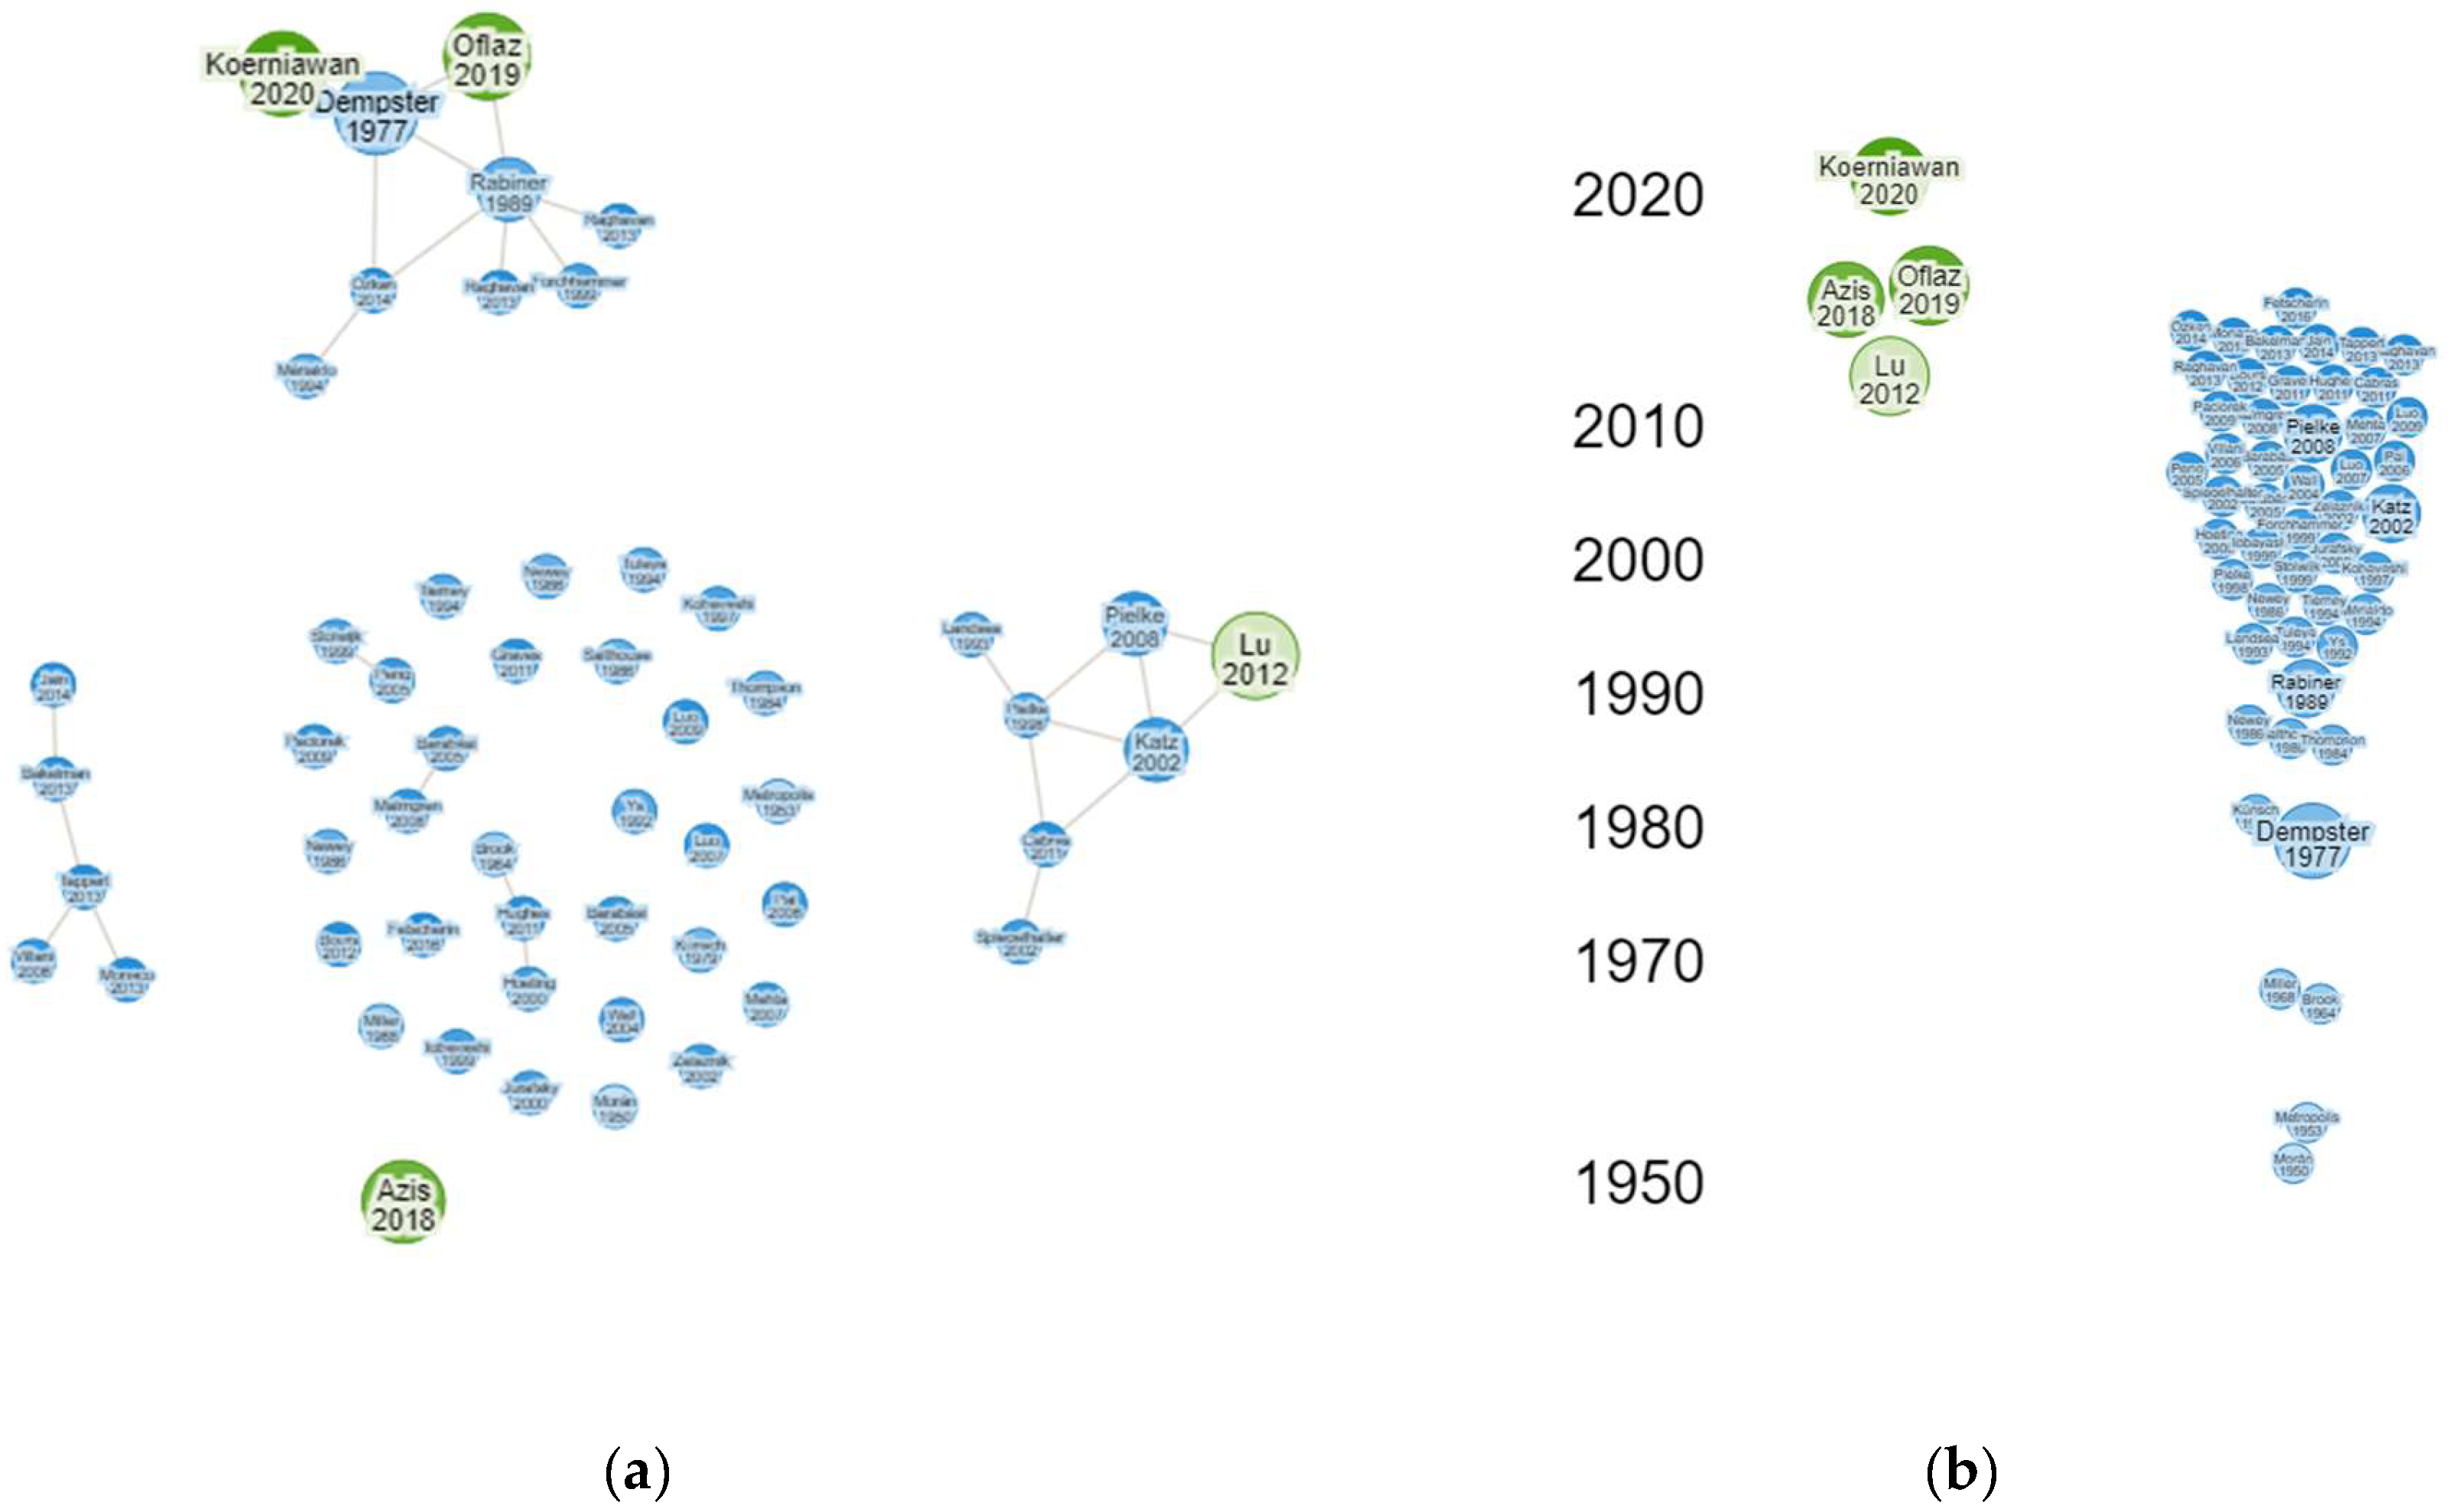
Figure 8.
Similar Works in Relation to the Research of 5 Selected Articles: (a) Graph Type of Network; (b) Graph Type of Timeline.
Figure 8.
Similar Works in Relation to the Research of 5 Selected Articles: (a) Graph Type of Network; (b) Graph Type of Timeline.
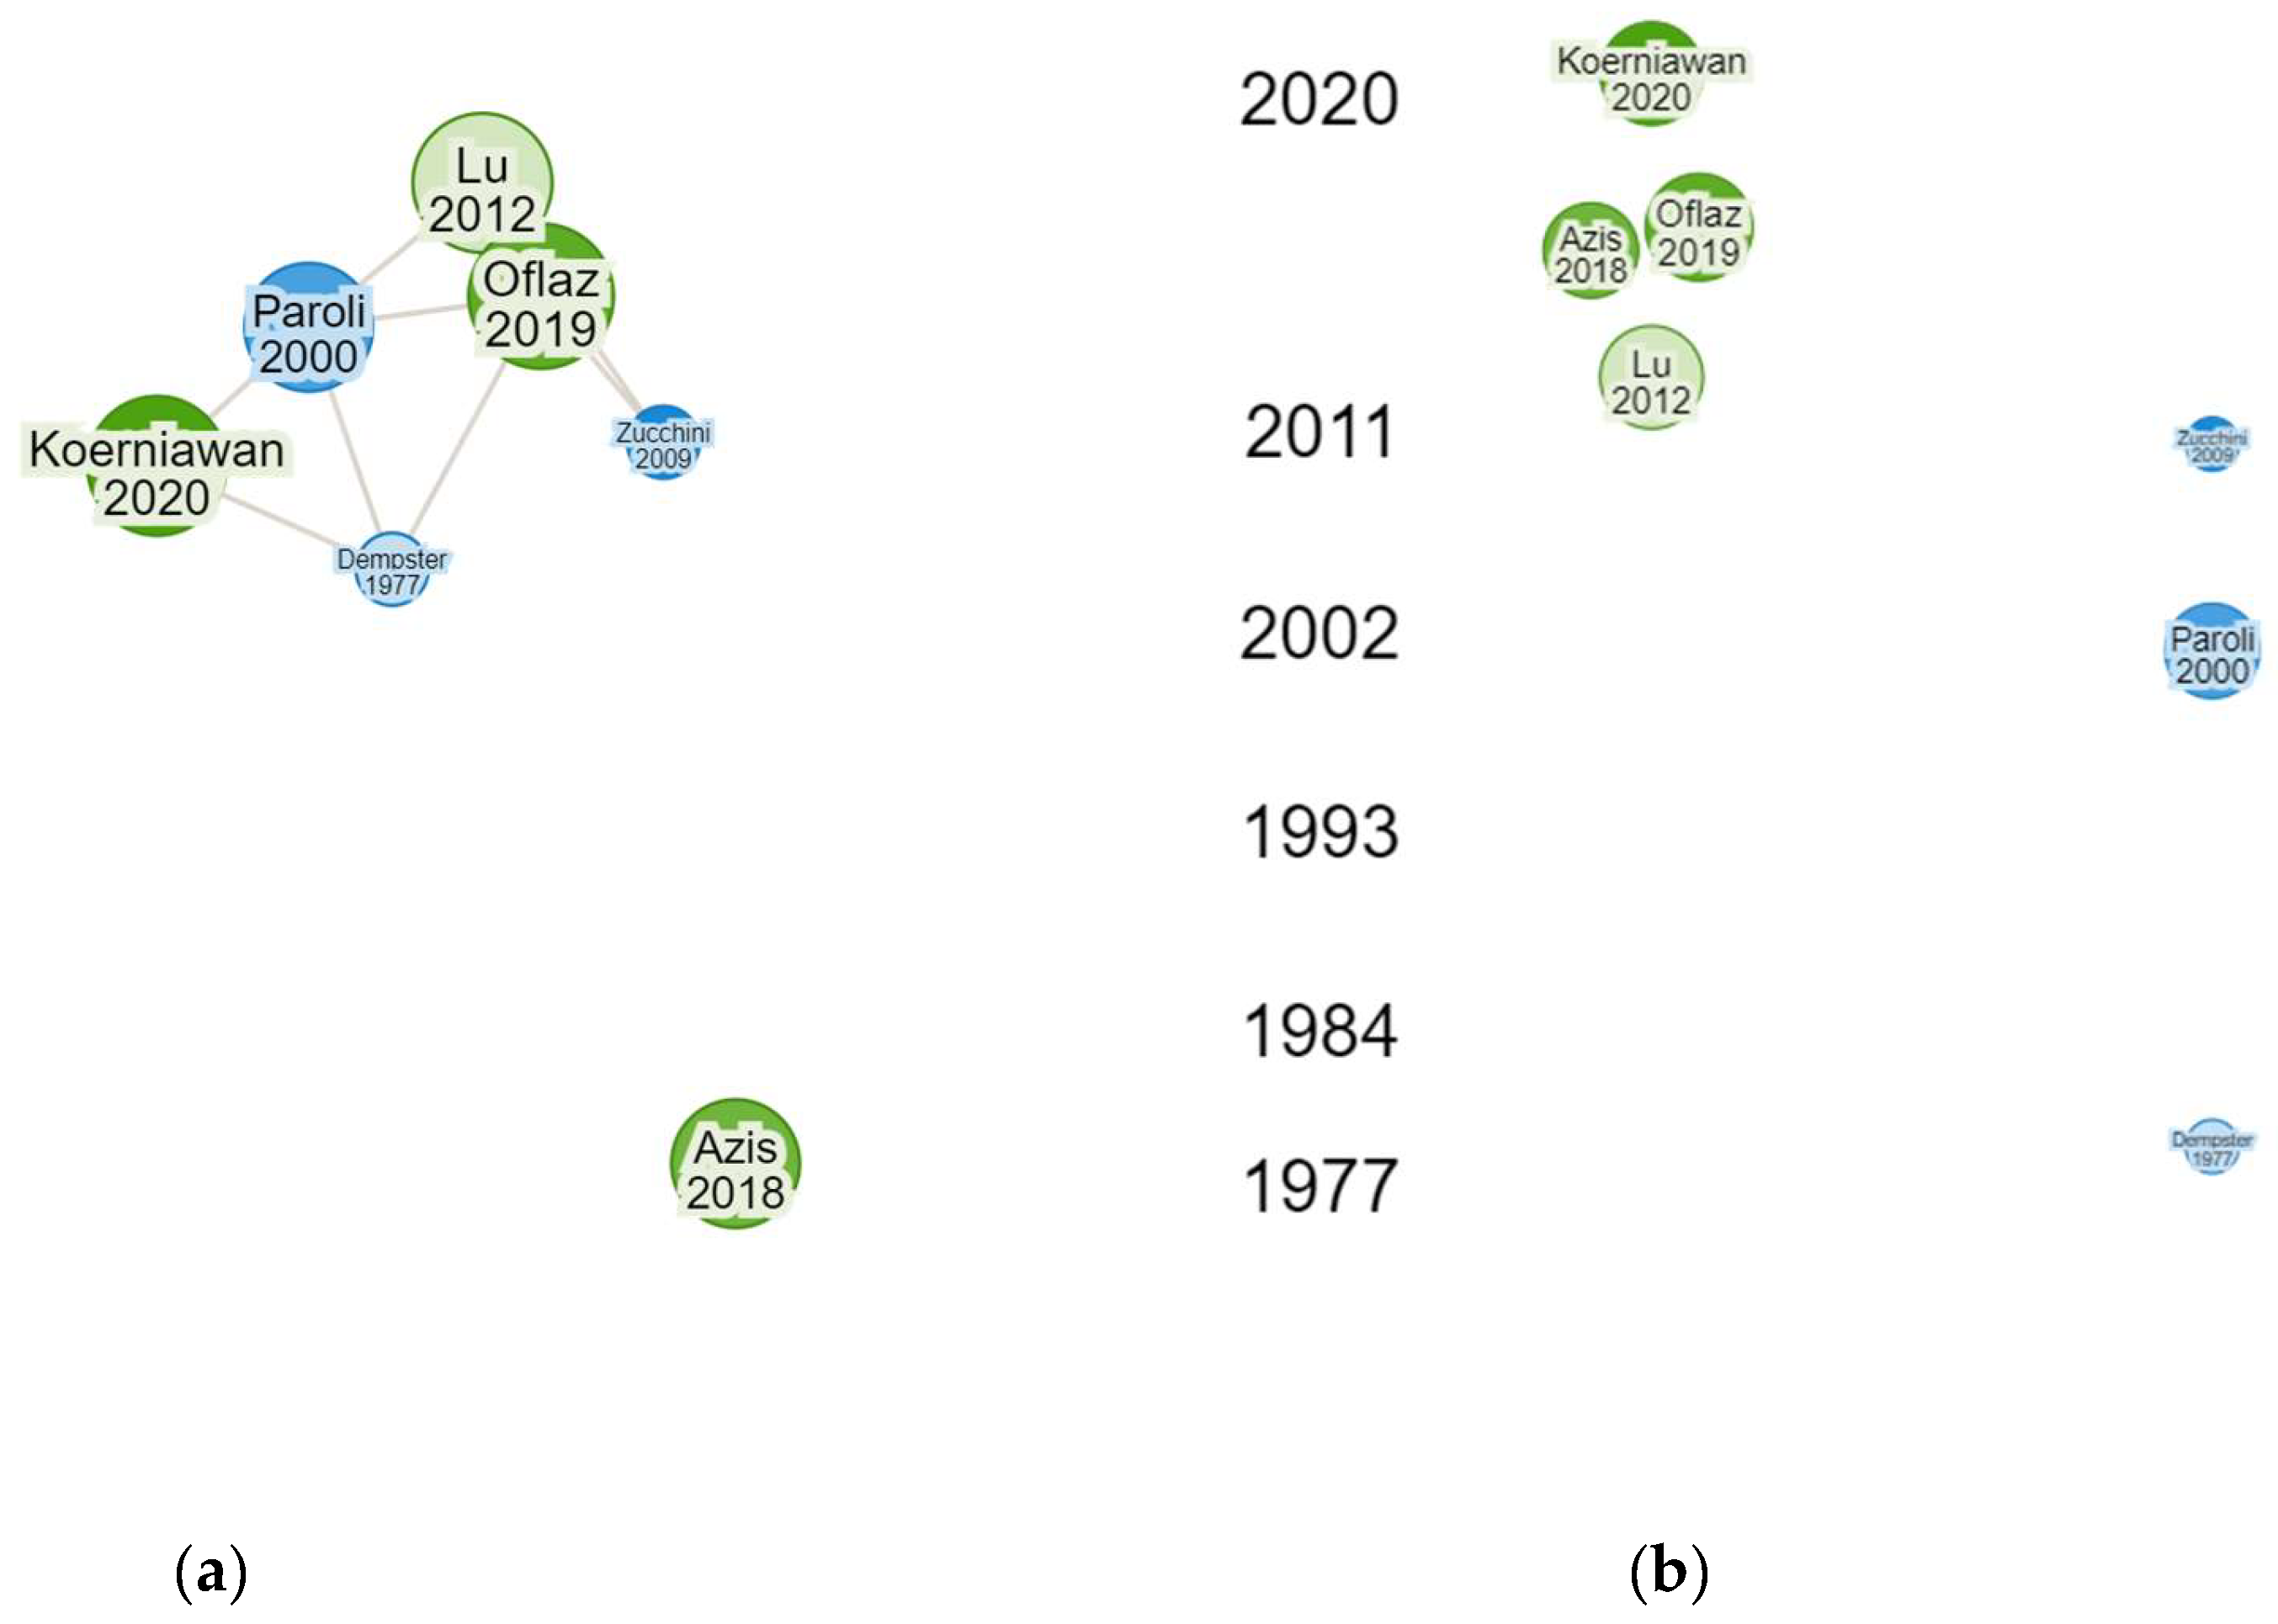
Figure 9.
Frequency and severity claims insurance in HMM Application of Selected Articles.
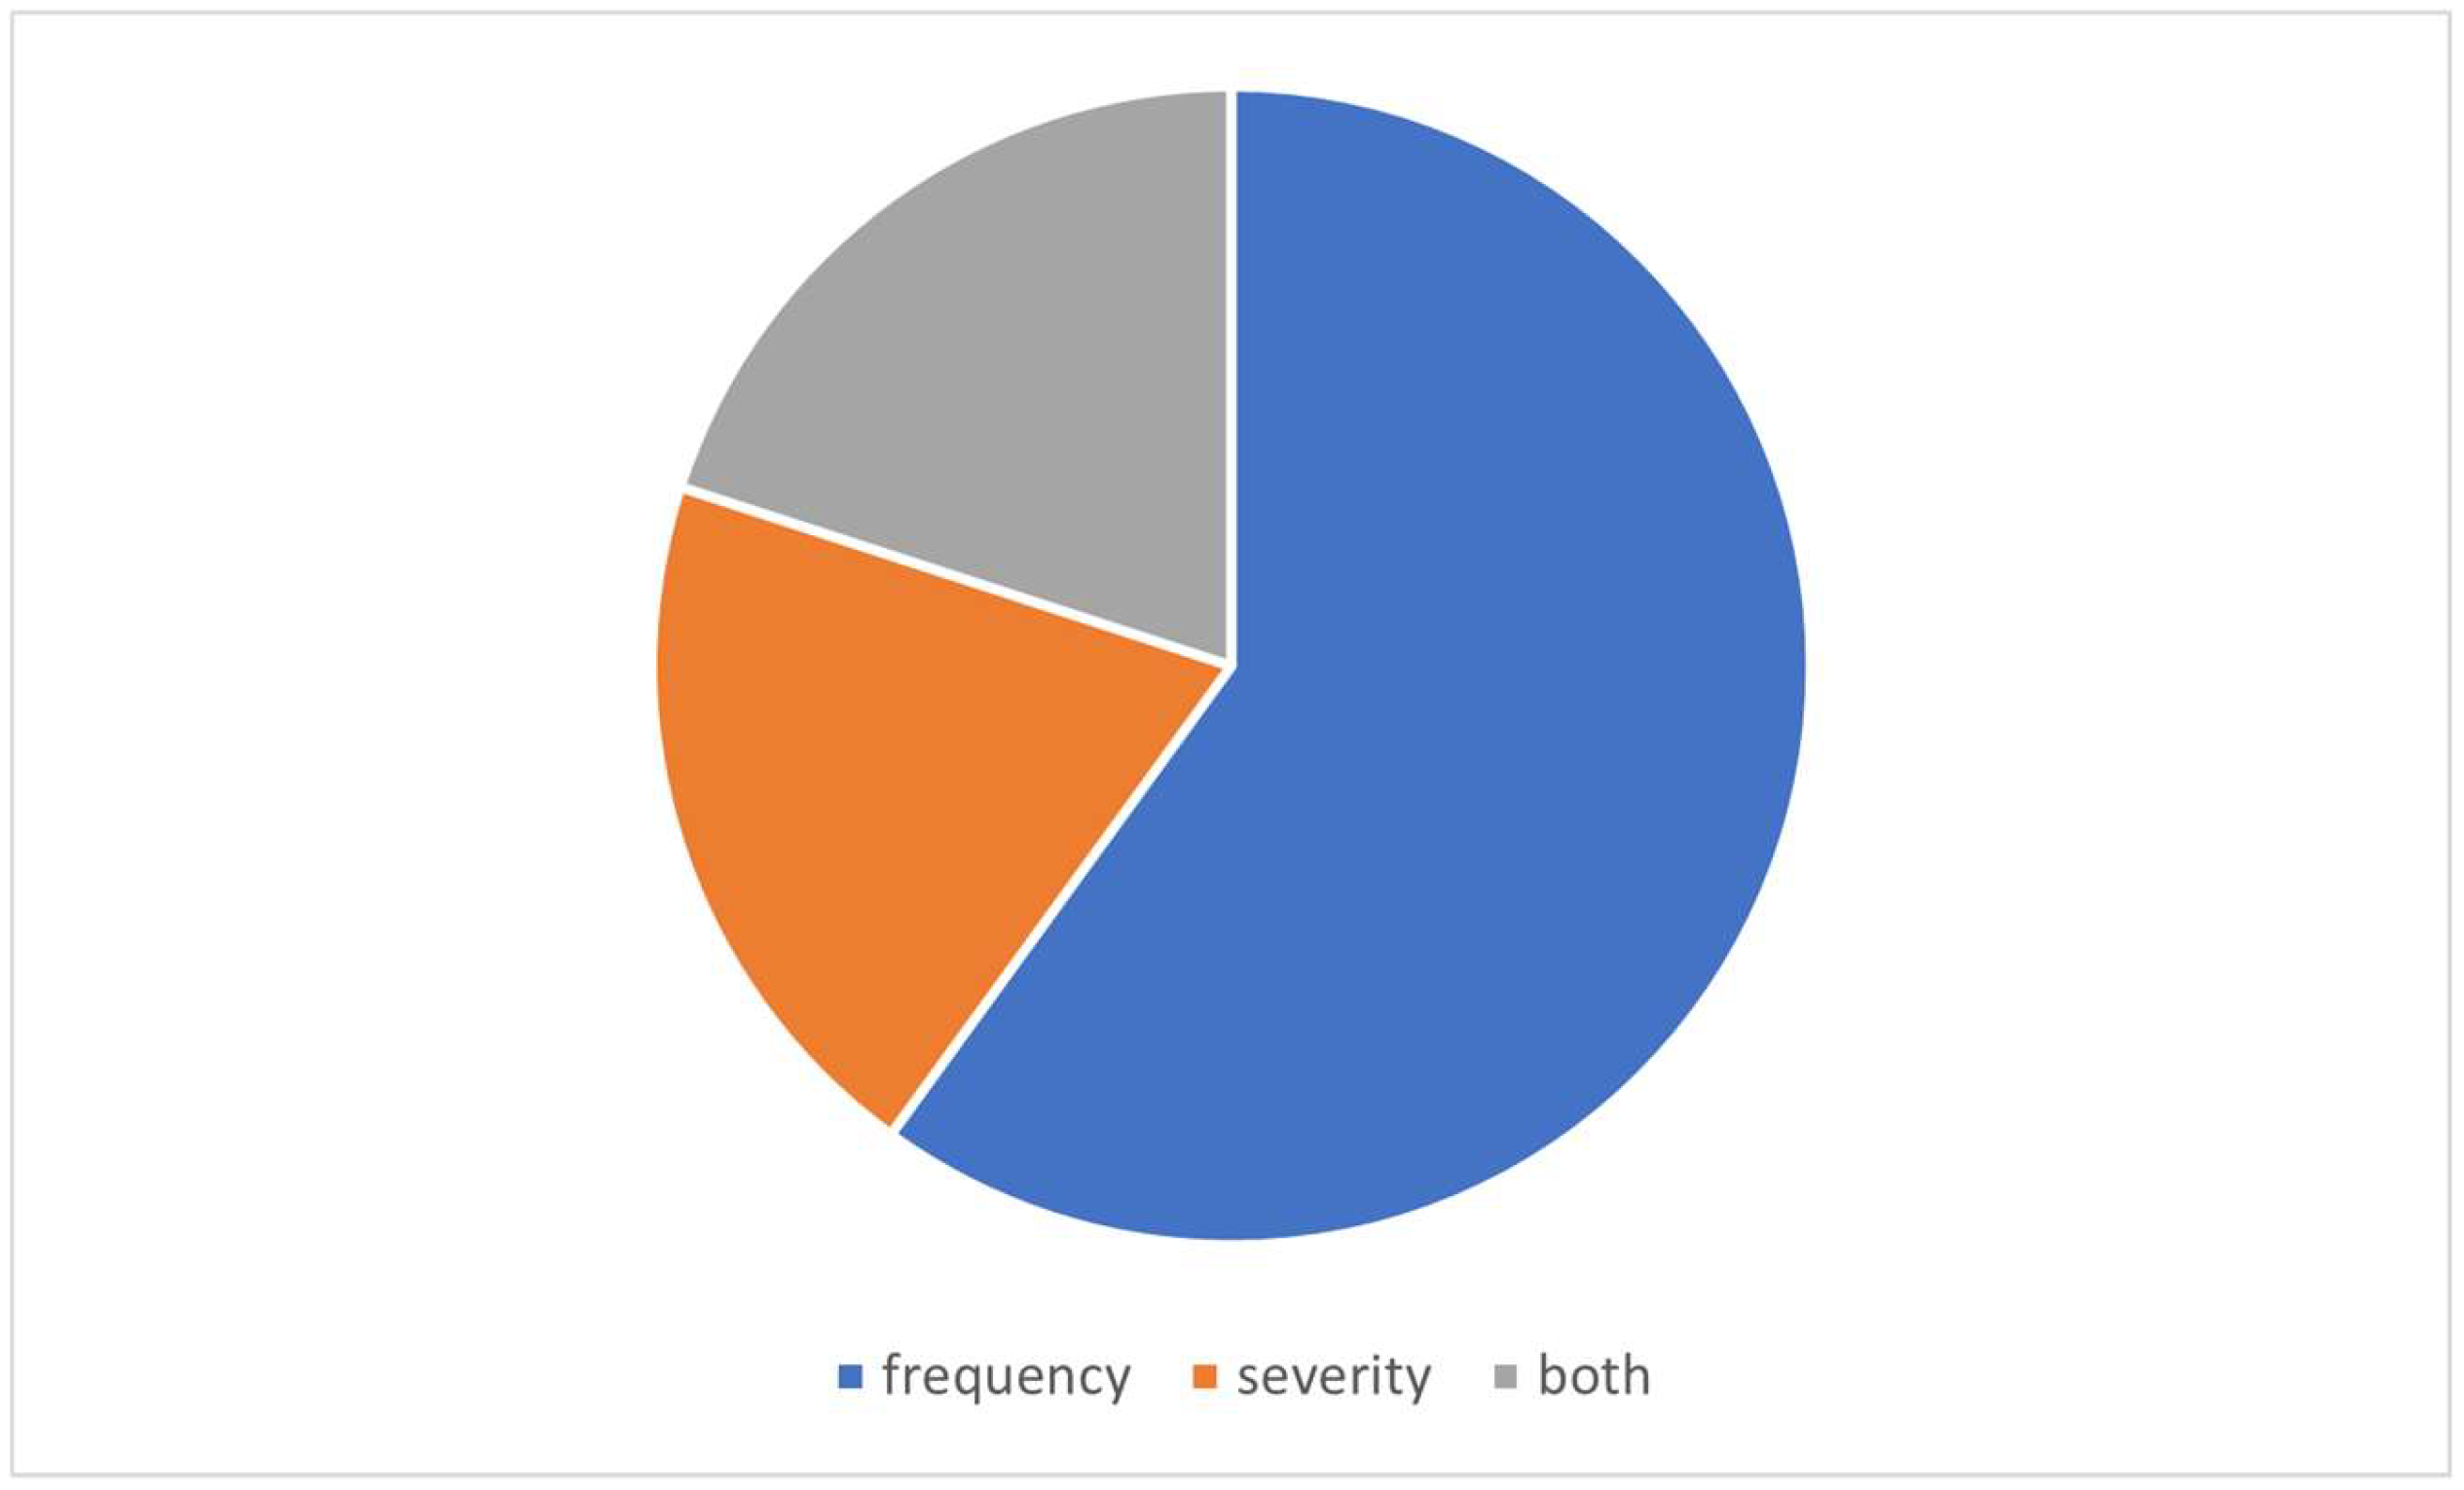

Table 1.
Analysis Results of Journal that Publish HMM Application in Insurance Claims.
| Journal | SJR | Indexed by | |
|---|---|---|---|
| Scopus | WoS | ||
| ASTIN Bulletin | Q1 | Yes | Yes |
| International Journal of Pure and Applied Mathematics | - | No (discontinued in 2016) | No |
| ESTIMASI: Journal of Statistics and Its Application | - | No | No |
| North American Actuarial Journal | Q1 | Yes | Yes |
Table 2.
Analysis Results of Type Distributions in Selected Articles.
| Distributions of Claims Frequency |
pmf | Distribution of Claims Severity | |
|---|---|---|---|
| Poisson | Exponential | ||
| Negative Binomial | Gamma | ||
| Bernoulli | |||
Table 3.
Analysis Results of the Number of Hidden States in Selected Articles.
| Authors | Selection Criteria | |
|---|---|---|
| Lu & Zeng (2012) | 3 | AIC |
| Azis et al. (2018) | 2 | BIC |
| Oflaz et al. (2019) | 3 | AIC and BIC |
| Koerniawan et al. (2020) | 2 | BIC |
| Jiang & Shi (2024) | 7 | AIC and BIC |
Table 4.
The State of the Art of 5 Selected Articles.
| Authors | Methods | Dataset | Results: Probabilities or Forecasts |
|---|---|---|---|
| Lu & Zeng (2012) | Non-Homogeneous Poisson HMM | Catastrophe Insurance | Probabilities |
| Azis et al. (2018) | Exponential HMM | Vehicle Insurance | Probabilities and Forecasts |
| Oflaz et al. (2019) | Bivariate HMM | Automobile Insurance | Probabilities and Forecasts |
| Koerniawan et al. (2020) | Poisson HMM | Life Insurance | Probabilities |
| Jiang & Shi (2024) | HMM | Automobile Insurance | Probabilities |
Disclaimer/Publisher’s Note: The statements, opinions and data contained in all publications are solely those of the individual author(s) and contributor(s) and not of MDPI and/or the editor(s). MDPI and/or the editor(s) disclaim responsibility for any injury to people or property resulting from any ideas, methods, instructions or products referred to in the content. |
© 2024 by the authors. Licensee MDPI, Basel, Switzerland. This article is an open access article distributed under the terms and conditions of the Creative Commons Attribution (CC BY) license (http://creativecommons.org/licenses/by/4.0/).
Copyright: This open access article is published under a Creative Commons CC BY 4.0 license, which permit the free download, distribution, and reuse, provided that the author and preprint are cited in any reuse.


