Submitted:
28 September 2024
Posted:
30 September 2024
You are already at the latest version
Abstract
The purpose of this study was to examine how factors that contribute to the service quality (responsiveness, product diversity, price fairness, and tangibles) offered by a sporting goods store on an online shopping mail affect shopping value. We also explore the moderating effects of positive emotions on the relationship between service quality and shopping value. A total of 654 respondents participated in the survey. The SPSS statistical package and smartPLS 4.0 were used to test the research hypotheses as well as to confirm the moderating effect. The study finds that the abovementioned factors that contribute to the quality of service provided by the online sportswear store had a significant effect on shopping value. Shopping value was in turn found to have a significant effect on customer satisfaction. Customer satisfaction was in turn found to have a significant effect on shopping mall loyalty. The study finds that positive emotions do not have a moderating effect when responsiveness and tangibles affect shopping value. When product diversity and price fairness affect shopping value, however, the moderating effect of positive emotions was found. The results provide implications for practitioners who are concerned about improving the quality of service on online shopping malls. The results of this study contribute valuable guidance to marketers seeking to establish delivery-platform service-marketing strategies.
Keywords:
Online Shopping Mall
; Service Quality
; Sporting Goods
; Positive Emotion
; Shopping Value
; Consumer Behavior
1. Introduction
Transaction volumes on Chinese e-commerce sites continue to grow steadily. According to eMarketer, by 2022 retail transactions in China had reached more than 710 million digital buyers in transactions valued at $2.29 trillion, with the value forecast to reach $3.56 trillion by 2024 [1]. In the future, China’s e-commerce ecosystem is expected to change continuously, and it is necessary to discover business opportunities targeting demand for a range of goods and services that arise in the process of change. The size of the Chinese sportswear market has continued to expand as the Chinese government’s sports industry promotion policy has been implemented along with an increase in consumption that reflects higher income in the Chinese population [2]. In recent years, the Chinese government has announced policies designed to encourage the sporting goods industry, and that industry’s development has had a positive effect on the development of the sportswear industry along with the growth of the population participating in sports. Recently, consumers of sporting goods can easily purchase desired products anytime, anywhere through online stores and mobile markets as well as offline stores.
As online shopping by sporting goods consumers grows, relevant companies have undertaken market research actively. On online shopping malls, for instance, service quality is a broad concept that includes interaction between websites and customers [3]. To move beyond the limited scope of the concept covered in early research on online service quality, a dimension for measuring online shopping mall service quality was developed [4,5].
In recent years, sporting goods sales have been moving steadily from offline stores to online stores, and in this process it can be inferred through prior research in other fields that the service quality offered by online stores is an important factor in generating positive consumption behavior. Prior research on service quality offered by online sporting goods stores is, however, insufficient, and research on the importance of online sports equipment stores that informs previous studies approaches the topic somewhat differently from how it is approached in this study.
Previous studies on online e-commerce related to shopping mall service quality consist mainly of empirical analyses of the structural relationship between shopping mall service quality attributes and consumer behavior. The SERVQUAL (SERVICE+QUALITY) model in the service sector has been used mainly to investigate this causal relationship [4,5]. The SERVQUAL model is very useful for examining the relationship between service quality, customer satisfaction, and reuse. Based on the evolution of customers’ needs, however, the model is at somewhat of a disadvantage inasmuch as it makes it difficult to consider customer emotions as a factor in generating customer satisfaction.
Therefore, we apply the stimulus-organism-response (SOR) model to utilize customer emotions as a variable. The study endeavors to understand the relationship between service quality attributes, with customer emotions used as a moderating variable, and shopping value, satisfaction, and loyalty. In this respect this study can be differentiated from existing research. Existing studies on service quality have tried mainly to understand the abovementioned structural relationship by applying the SERVQUAL model, but as suggested such attempts face a limitation in that they cannot explain customers’ emotional attributes. Therefore, in this study, to overcome these limitations, the SOR model is applied to confirm the moderating effects of customer emotions. The study provides strategic suggestions for providing customer-oriented service quality and implications for improving the quality of online commerce through exploring the theorized causal relationship. The results of this study also contribute to a broader understanding of Chinese consumers and to the improvement of the service process for customers of global online retailers seeking to enter online Chinese market.
2. Theoretical and Empirical Background
2.1. Sporting goods and Online Shopping Malls in China
Among important growing trends in online shopping transactions in China, markets for sports and leisure products are growing rapidly. This means that online consumption of sports and leisure products is increasing daily. It is also true that Chinese consumers are increasingly interested in sports and leisure. With online shopping, price comparisons are easy to make. It is possible to search for products efficiently across multiple shopping malls. And the advantage is that there are no time and space constraints. In addition, most consumers of sporting goods purchase sports-related products or services directly online, a practice that is expected to continue to grow in popularity. The Chinese sportswear market also is growing rapidly, reflecting growing interest in sports among consumers. The Chinese sportswear market was valued at 340 billion yuan in 2022, following an increasing annual upward trend [6]. The Chinese sportswear market is expected to continue expanding as the Chinese government’s sports-industry promotion policy has been implemented along with increased consumption driven by higher incomes. Since 2018, sales of Chinese sportswear have also been on the rise, characterized in particular by growing sales of functional clothing. Sales of sports footwear are growing faster than other sportswear sales.
Consumers are enjoying not only economic and functional value from shopping online but also shifting their behavior as the types of purchases they make expand in scope. As online shopping is becoming deeply embedded in consumers’ daily lives, the growing use of online shopping malls demands attention from marketing research.
The definition of an online shopping mall varies depending on the research purpose. An online shopping mall is a virtual Internet space where corporate profits are generated on a computer network using the Internet as a tool. An online shopping mall is a space where consumers can search for, order, pay, and even ship products through a cyber-shopping service. When consumers consider the characteristics of shopping malls they form an image of a specific shopping mall. This affects the attitudes consumers form when purchasing or consuming products. In other words, unlike in traditional commerce, when shopping on Internet shopping malls consumers do not have to contact sellers directly, as it is the shopping mall itself, not the seller, that consumers encounter because the seller is not involved directly in the sale or purchase process [7].
Consumers purchase products on Internet shopping malls because of the convenience of the purchasing method, the variety of products, and faster access to desired products, information, and services than in traditional stores [8]. Internet shopping malls must gain trust from consumers through product diversity and quality because there is so much information about brands, designs, and prices. An online shopping mall should focus on increasing consumer confidence by increasing consumer satisfaction through effective search and payment methods, faster search speed, personal information protection and delivery, and thorough A/S. In cyber systems, all buyers and sellers are interconnected regardless of geographical and time constraints, and direct connections between buyers and sellers are possible [9].
2.2. Service Quality theory
Service quality is important to service companies because there is a high price to pay for poor quality. This problem is directly related to the life and death of a company. If a customer pays and thinks that the value of the service used is lower than the price paid, the quality of the service is perceived to be poor, and this will prevent repurchase. Service quality is therefore an essential component of organizational survival and marketing success [10,11]. Service quality is a major indicator of an organization’s overall performance. In addition, service quality occupies the most important position in the marketing and service-marketing literatures [12].
Service quality involves an execution (or process) rather than a tangible entity, so unlike product quality it is measured by customer perceptions because it is difficult to measure by objective measures such as defect rate or durability. Therefore, service quality cannot be identified objectively or uniformly, but rather requires a subjective evaluation as recognized and judged by customers. Evaluation takes place throughout the entire process of receiving a service.
Lewis and Booms state that service quality is a measure of how well a delivered service level matches customer expectations [13]. It is said that service quality is determined by subjective criteria based on the difference between consumers’ overall judgments, attitudes, or perceptions and their expectations in relation to the excellence of a service performance [4,14,15].
Most research on service quality has focused on the offline service industry, but recently research on the service quality offered by online shopping malls has begun to emerge. The quantitative and qualitative study conducted by Parasuraman et al. developed SERVQUAL, an offline service-quality measurement tool, and identified five factors with which to measure service quality [16]: tangibility, reliability, responsibility, assurance, and empathy. This model was intended to be generally applicable to all service industries. Research using e-SERVQUAL, an online service-quality tool, has been conducted because the original SERVQUAL tool does not reflect the quality of online service, which does not exist in tangible form [17,18].
Many scholars have proposed factors on the basis of which to measure online service quality. Previous studies of online service quality have variously identified information, convenience of use, stability, privacy protection, responsiveness, efficiency, system availability, and interactivity as the most commonly applied website-evaluation factors [3,19]. In this study, we focus on responsiveness, diversity, fairness, and convenience as online shopping mall factors in service quality.
2.3. SOR Model
The SOR model proposed by Mehrabian and Russell was designed to help researchers and marketers understand, through consumers’ emotional states, how a consumer as an organism, and the consumer’s emotions, affect the consumer’s behavioral response to external stimuli, which are environmental variables [20]. The SOR model, which is widely used in consumer behavior research, focuses on a customer’s emotions and attempts to explain the customer’s behavior in response to the influence of the external environment. In other words, customer sentiment elicits various behavioral responses such as purchase intention and reuse intention. Belk argued that, in the SOR model, a stimulus can be conceptualized by reference to external factors related to decision-making in an external environment in which consumers influence decision-making [21]. An organism can be conceptualized as an internal structure that emerges by intervening between consumer behaviors stimulated by external factors, and typically is the seat of emotions, thoughts, cognitive behaviors, and psychological behaviors [22]. In this study, the final response felt by customers using the services of online shopping malls can be conceptualized as the final result of stimulation by external factors, leading to actual satisfaction or loyalty formation [23].
2.4. Positive Emotions
Miller stated that public interest–linked marketing is a means of encouraging in consumers an attitude that enable a company’s good image and public interest activities to be linked to service quality [25]. Consumers become aware of benefits such as the convenience of shopping that customers feel through the use of Internet shopping malls and the enjoyment such behavior provides. This convenience affects the utilitarian value that consumers obtain as well as the quality of the service provided by Internet shopping malls. These factors in turn affect customer satisfaction, which in turn affects customer attitudes. It is said that individuals try to maintain their positivity when they experience positive emotions and are more likely to feel positive emotions when they are in a positive mood. It is said that positive emotions are subjective and personal and are perceived through fun and enjoyment rather than through the achievement of a specific purpose.
That is why positive emotions reflect the joy or emotional usefulness of shopping [26], and shopping experiences can provide positive emotions by enabling consumers to enjoy the benefits of products even if they do not purchase them [27]. Positive emotions affect consumer attitude formation, changes, and memory performance. Damasio found that positive emotions are strong when evaluation of a product after shopping is judged to be appropriate, affecting preference for a product or store as well as satisfaction, behavior, and decision-making by causing individual physical and subjective behavior [28].
2.5. Shopping Value
Recent studies have emphasized the important role that shopping experiences play in value perception. It is argued that a real value chain can be analyzed in e-commerce by exploiting the efficiency that is made possible by web technology [29,30]. Many studies have been conducted on the emotional reactions that consumers experience in shopping situations and the values they pursue. These studies have found that customers seek utilitarian and hedonistic values in the shopping process [31,32,33]. Most early studies related to shopping value were focused on the utilitarian value to be obtained through shopping [34]. In other words, consumers view shopping as a task that, ideally, involves the efficient purchase of products with the aim of obtaining high-quality products or services while minimizing the financial and non-monetary costs invested in the shopping process. It has been argued that customers pursue empirical consumption values such as pleasure and aesthetic characteristics along with rational consumption values such as problem-solving and needs satisfaction in the purchase/consumption process [35].
Consumers not only purchase products they want in the shopping process, but they also try to satisfy the pleasure value through the natural emotional reactions they experience in the process. Therefore, it has been suggested that in conducting systematic research on shopping behavior in stores, studies investigating how utilitarian shopping value and hedonistic shopping value affect shopping satisfaction and store-love behavior should be conducted [36].
3. Hypotheses and Research Model
3.1. Research Model
The research model for this study was designed based on factors that influence the quality of service offered by online shopping malls and in turn shopping value, satisfaction, and loyalty by identifying factors that contribute to service quality based on the above discussion. Hypotheses 1 is proposed to help us explain how service-quality factors affect shopping value. Hypotheses 2 and 3 are proposed to help us explain the relationship between shopping value, customer satisfaction, and loyalty. Hypothesis 5 is proposed to help us explain the moderating effects of positive emotions on the relationship between service quality, satisfaction, and loyalty. The research model presented in Figure 1 outlines the study design.
3.2. Research Hypotheses
With the increasing importance of consumer behavior in the online space, it is important to understand service quality and its role in consumer behavior. Existing studies have focused on how services affect consumer behavior in traditional situations such as retail, finance, service telecommunications, and post-purchase sales support. Service quality is the difference between a customer’s expectation when consuming a service and the customer’s perception after consuming the service [10]. If service quality as defined is related to an attitude, and service quality is higher than what consumers expected to experience, reflecting the difference the time before and the time after service consumption, service quality is high [10,37]. Service quality reflects a consumer’s overall judgment or attitude, perception, and expectation regarding the performance of a service, as determined by subjective criteria [38]. The quality dimensions of service have been classified as tangible, responsive, fair, reliable, empathetic, security, entertaining, and convenient [39,40,41,42].
Many studies have attempted to grasp the causal relationship between the dimensions of service quality and consumer behavior. In online e-commerce, service quality has also been found to be closely related to the formation of trust and loyalty among customers [43,44]. In online e-commerce, convenience, ease of use, and customer responses are important factors that determine service quality and are precedents that influence consumer behavior [45,46,47]. Customers can use websites to purchase products, and the more quickly the websites respond the better customers feel, and the better they feel the more products they buy [48].
Values affect human behavior. Human behavior is a broad and fundamental concept that can be evaluated from multiple perspectives [47]. Studies have found that customers seek utilitarian and hedonistic values in the shopping process [31,32,33]. The purchasing behavior of consumers who seek utilitarian value is reasonable and logical as well as highly task-related [33].
Hedonic shopping value reflects the degree to which consumers perceive the emotional benefits experienced in addition to achieving the original purchase purpose through shopping. Hedonic shopping includes collecting new information, breaking away from reality, and experiencing freedom, refreshment, fun, and enjoyment [35,36]. Customers pursue utilitarian consumption values such as pleasure and aesthetic characteristics along with rational consumption values such as problem-solving and needs satisfaction in the purchase/consumption process. Consumers not only want to purchase a product they want in the shopping process but also try to satisfy the pleasure value through the natural emotional reactions they experience in the process. Therefore, the service-quality dimensions offered by online shopping malls may allow customers to consider shopping a prerequisite to the formation of hedonistic and utilitarian values. Accordingly, we propose:
H1. The service quality of an online shopping mall (H1-1: responsiveness, H1-2: product diversity, H1-3: price fairness, H1-4: tangibles) will positively affect shopping value.
Customer satisfaction has been defined as a cognitive state in which a customer feels that the compensation received for the sacrifice suffered was appropriate or inappropriate (in which case the purchase was unsatisfactory [49]). From another perspective, customer satisfaction has been defined as “the customer’s response to the evaluation of perceived discrepancies between proactive expectations and the actual performance of the perceived product after consumption.” Perceived value appears to have a direct effect on consumption behavior [50,51]. The creation of customer value has a great influence on the establishment of customer relationships and the formation of brand loyalty. Many domestic and international studies have revealed that customer satisfaction based on customer value affects consumer behaviors such as repurchase intention and complaint behavior [52]. The higher the perceived value the stronger the loyalty to a service company and the greater the customer satisfaction [53,54].
If the evaluation of the benefits a customer expects to obtain from a product or service is greater than the cost paid, the perceived value will increase and the customer will be satisfied. On the other hand, if the benefit or performance obtained is lower than the cost paid, the perceived value will decrease and the customer will be dissatisfied. Thus perceived value becomes an important determinant of customer satisfaction [55,56,57].
A study that added service value to the relationship between service quality, satisfaction, and service performance explains that service value plays a mediating role between service quality and satisfaction. In other words, it was suggested that customers become satisfied or dissatisfied by considering service value in a way that reflects the relative difference between the benefits (quality) generated by a transaction and the cost paid. Many studies have also empirically suggested the existence of a causal relationship between value and satisfaction [57,58,59,60]. Therefore, this study proposes the following hypotheses pertaining to how shopping value affects satisfaction and loyalty:
H2: Shopping value will have a significant (+) effect on customer satisfaction.
H3: Customer satisfaction will have a significant (+) effect on customer loyalty.
Emotions can change depending on the external environment and can be said to emerge with actions. In research on consumer behavior, customer emotions have been analyzed mainly by dividing them into positive and negative emotions [61]. Some previous studies using customer emotion factors apply the SOR model. Positive emotions include excitement, enthusiasm, and pride, while negative emotions include anger, distress, and irritation [62]. Positive emotions that function as emotional factors for consumers are applied to experiences characterized as exciting, enthusiastic, funny, happy, interesting, outstanding, and enjoyable [53,63]. Therefore, this study’s research questions can be set as follows. Customers’ emotions have been treated as a major variable in relationship marketing, and emotional responses have had a significant impact on satisfaction and repurchase [64]. Positive emotions reflect the joy or emotional usefulness of shopping [26]. Positive emotions affect consumer attitude formation, changes, and memory performance. It is said that positive emotions affect preferences for products or stores and also affect satisfaction, behavior, and purchasing decisions by causing individual physical and subjective behavior [28]. Therefore, this study proposes the following hypothesis pertaining to how the intensity of positive emotions will have a moderating effect when service quality affects shopping value.
H4: The intensity of positive emotions will play a moderating role in the relationship between service quality and shopping value.
4. Method
4.1. Operational definitions and measures
This study’s data were obtained through a questionnaire. Service quality is measured by the extent to which the service provided by an Internet shopping mall matches customers’ expectations when using such a shopping mall. When shopping online, the act of looking at the shopping mall’s website and judging it is a tangible factor. Fairness is the evaluation of the appropriate price for a product or service on a shopping mall website. Product diversity is an assessment of whether products offered by online shopping malls are sufficiently varied. And responsiveness is an assessment of whether a company responds to personal needs in a timely manner through the service it provides to customers [24,39,]. This study examines factors that contribute to the service quality offered by online shopping malls, which include responsiveness, product diversity, tangibles, and price fairness. A total of 12 question items were used to measure service quality.
Shopping value includes characteristics of the pursuit of pleasure in the purchase/consumption process and rational consumption values such as problem-solving and needs satisfaction [35,36]. Three question items related to shopping value used in a previous study were modified and supplemented to fit this study. Customer satisfaction is the result of evaluating a product or service after purchase and use [65]. Shopping mall loyalty is a behavioral tendency in virtue of which consumers show favorable attitudes toward specific stores for a certain period of time and engage subsequently in repeat purchasing behavior [58]. Three question items for satisfaction and loyalty used in a previous study were modified and supplemented to fit this study. Questions about positive emotions were composed of four items. Accordingly, a questionnaire was modified to accommodate this study.
4.2. Data Collection
This study aims to investigate the relationship between service quality, shopping value, and consumption behavior involving online stores in the process of purchasing sporting goods. Participants in (subjects of) the study were selected as members of a population with experience purchasing sports equipment online from a population of consumers who engage in various sports or athletic activities (outdoor sports, ball games). Regarding the survey method, an online survey was conducted using convenience sampling to form non-probability samples. To distribute online questionnaires and collect data effectively, participants were sent e-mails or texts explaining the purpose of the study and how the data would be processed as well as assuring respondents of the anonymity of the information they share. All responses to the questionnaire were written with a self-administration method. Responses indicating that prospective participants had not purchased sports equipment through an online shopping mall within the preceding 3 months were excluded. In addition, questionnaires judged to include unfaithful responses, such as non-response and inconsistent responses, were also excluded. Finally, a total of 654 sets of data were selected and analyzed as a valid sample.
Demographic questions were included at the end of the survey. Five-point Likert scales ranging from agree very much (5) to agree not at all (1) were used for all other questions. Before conducting this survey, the questionnaire paper was finalized through a meeting of experts including one professor and two individuals with doctoral degrees or higher in topics related to the study’s academic area.
To address the problem of common method bias, a questionnaire on the service quality (the independent variable) of the focal online shopping mall was first posted online for one week. Following that week, the dependent variables—shopping value, customer satisfaction, customer loyalty, and positive customer emotions—were investigated at different times.
To test the research hypotheses, the SPSS statistical package and the structural equation analysis program smartPLS 4 were used. Frequency analysis using the SPSS package was performed to determine the distribution of demographic composition. The means and standard deviations of latent variables and question items were analyzed. Cronbach’s Alpha coefficients were used to determine the reliability of the main variables. Factor analysis was conducted to confirm the one-dimensionality and validity of the main variables. The study analyzed the moderating effects of positive emotions.
5. Results
5.1. Descriptive statistics
Of the study participants, 46.3% were men and 53.7% were women. Participants in the survey represented various age groups and educational levels. It was found that sports activities were performed 4–9 times per month. Most participants were found to have purchased sporting goods through online shopping around 10 times per year.
5.2. Measurement validity
This study, using a PLS structural equation, analyzed the relationship between each variable for perceived benefits and risk, perceived value, consumer brand relationship, and loyalty. This study used SmartPLS 4.0 as PLS-SEM software. Before applying the PLS path model to test the study’s model, the factor-loading value and the cross-factor-loading value for each factor were calculated as a result of the PLS measurement model for each group, as shown in Table 2 and Table 3. Correlation analysis was performed to test the discriminant validity of the relationships between the variables used in this study. The results are shown in Table 2 and Table 3. The above analyses were used as indicators to judge the centralized validity and conceptual validity of each factor. As shown in Table 2 and Table 3, it was found that internal consistency was achieved by meeting the criteria of average variance extraction value (AVE: Average Variance Extracted, 0.5 or more), composite reliability (CR: CR, 0.7 or more), reliability (Cronbach’s Alpha, 0.6 or more), AVE value (0.5 or more), and CR value (0.7 or more). In this study, it was found that the AVE values of all latent variables were all suitable. It is judged that the measurement tool used in this study has secured convergent validity and discriminant validity. It can be said that the above judgment result measurement tool has discriminant validity.
5.3. Hypothesis Testing
The hypothesized causal paths were estimated to test the causal relationship in the conceptual research model. Bootstrap analysis was performed 500 times using the smart PLS 4.0 program to test the statistical significance of the hypothesis for each variable through path analysis for each group. The structural model represents the dependent relationship between the latent variables in the model and is used to represent correlations between variables, representing standard errors and the t values of each coefficient as well as the measurement coefficient. As shown by the hypothesis-confirmation results reported in Table 4 and Figure 2, the research hypothesis is adopted if the t statistic is greater than ±1.96.
As seen in Figure 2 and Table 4, the R² value for variables including responsiveness, product diversity, price fairness, and tangibles that explain whether shopping value is profitable was high, at 52.2%. The R² value of the variable that explains customer satisfaction was found to be 41.1%. In addition, the R² value of the variable in which customer satisfaction explains shopping mall loyalty was found to be 21.3%.
Regarding the research hypotheses, it was found first that responsiveness had a significant effect on shopping value (estimate=.248, t=6.855, p<.001), product diversity had a significant effect on shopping value (estimate=.303, t=8.553, p<.001), price fairness had a significant effect on shopping value (estimate=.211, t=6.328, p<.001), and tangibles had a significant effect on shopping value (estimate=.195, t=6.783, p<.001). Thus, H1 and H2 were supported but H3 was not.
Second, shopping value was found to have a significant effect on customer satisfaction (estimate=.641, t=21.34, p<.001). Customer satisfaction had a significant effect on shopping mall loyalty (estimate=.462, t=13.29, p<.001). The economic value or practical value experienced on the Internet shopping mall sportswear store was an important factor in increasing customer satisfaction. Customer satisfaction is essential for enhancing and shaping users’ loyalty to shopping malls. It was found that online shopping mall sportswear stores are preferred because customers can see a variety of products in a short period of time. It was found that using online shopping malls saves time and effort, is convenient and practical, enabling customers to shop economically. Customer satisfaction formed in this way makes the shopping mall feel more intimate and customers will continue to use the shopping mall in the future. Thus, H2 and H3 were supported.
Hypothesis 4 predicts the finding of a moderating effect of positive emotions on the relationship between service quality and shopping value. Positive emotions were found not to have a moderating effect when responsiveness affects shopping value (estimate=.1448, t=.588, p=.557). But positive emotions did have a moderating effect when product tangibles affect shopping value (estimate=173, t=.815, p=.415). We found, however, that positive emotions had a moderating effect when product diversity (t=2.528, p=.000) affects shopping value. And positive emotions had a moderating effect when price fairness (t=2.243, p=.000) affects shopping value. Thus, H4-2 and H4-3 were supported but H4-1 and H4-4 were not.
6. Conclusions and Implications
The purpose of this study was to examine how factors that contribute to service quality offered by a sportswear store on an online shopping mail affect shopping value as well as to explore the moderating effects of positive emotions on the relationship between service quality and shopping value. First, the service-quality factors (responsiveness, product diversity, price fairness, and tangibles) involved in online shopping mall sportswear stores were found to have a significant (+) effect on shopping value. Indeed, all of the service quality-factors involved in online shopping mall sportswear stores were found to be significant in forming shopping value.
Product search should be easy, and the information provided should be easy to understand. Discount information on a presented product should be useful, and it was found that the number of products of various models of one item offered by the online sporting goods store was very large, so the response was good. A price is reasonable when it is judged that the price of the product presented is relatively lower than that asked on other Internet shopping malls. It was found that various products can be viewed within a short time, saving time and effort, allowing convenient, practical, and economical shopping. Active efforts to resolve the inconvenience of returning, exchanging, A/S, and compensation for products in sportswear stores on Internet shopping malls are also factors that increase shopping value for consumers.
Information about a specific product, brand, or service is closely linked to the formation of a positive attitude by consumers. Consumers continue to select or use products, brands, and stores that they evaluate favorably or about which they form favorable emotions. When consumers are satisfied with a specific product, they form an attitude of product preference, which has a positive effect on future purchase intentions and actual purchase behavior. These results use Internet shopping malls, and it is important to respond quickly to users’ questions because it is attractive to purchase products because kindness to customers is believed to be safe for continuous transactions by processing user inconveniences to make it easier to understand information provided.
Moreover, when using online shopping malls, positive emotions will play a controlling role in the relationship between service-quality factors and shopping value. When using an online shopping mall, it is attractive to purchase items by actively resolving inconveniences with quick responses to questions, but customers do not feel satisfied while shopping. The information provided to facilitate the use of online shopping malls should be easy to understand and the location or arrangement of the information should make it easy to see, making it attractive to purchase items, but users do not find it enjoyable and satisfying to shop. It was found that when the products provided by Internet shopping malls are diverse, customers feel satisfied and find the shopping experience enjoyable. It was found that, when the price of a product on an Internet shopping mall was in line with customer expectations and it was attractive to purchase the item, customers felt satisfied and the shopping experience was enjoyable.
The various characteristics of online shopping malls also induce various emotions in consumers, and unlike emotions that are stable to individuals or emotions with relatively short and specific objects or behavioral reactions, moods are less intense, relatively long, and there are no specific objective or behavioral reactions.
The academic and utilitarian implications of this study are as follows. First, the results of this study provide implications for practitioners who are concerned about improving the quality of service offerings on online shopping malls. First, the study’s findings suggest that the speed and accuracy of unique services on online shopping malls must reach a certain minimal level. Second, investment and attention are needed to increase product diversity, customer response services, price fairness, and product information to increase positive emotions among customers. Third, it is necessary to identify factors that generate negative emotions in online shopping mall customers and to improve and develop secondary service quality. To enhance shopping value for customers and increase satisfaction and loyalty, it is necessary to develop an online shopping mall service strategy.
This study uses the theoretical and practical significance of responsiveness, product diversity, price fairness, and tangibles as independent variables, with shopping value, customer satisfaction, and loyalty selected as dependent variables. A research model was developed to verify the causal relationships. It is also of academic significance that the factors that contribute to service quality offered by online stores for sports equipment were developed by reviewing previous studies on existing offline sporting goods stores. It can be said that it is meaningful to broaden our understanding of factors that influence the formation of consumers’ attitudes toward online stores that sell sports equipment.
In this study, although Chinese e-commerce entered the market later than e-commerce in developed market economies, its spread is progressing rapidly through rapid economic development and increased Internet use and penetration. As commerce has been transferred to the Internet environment, and the importance of consumer behavior in the online space that can be provided in both directions increases, it is important to understand the role that services play in generating customer satisfaction.
6.1. Limitations
Despite the academic and utilitarian significance of the results of this study, it is subject to several limitations. The research was conducted on online shopping malls, focusing on sportswear stores, potentially limiting the generalizability of the results. Therefore, in future research it is necessary to diversify the data and collect and analyze users more specifically and realistically.
Institutional Review Board Statement: Because of the nature of this study, no formal approval of the Institutional Review Board of the local Ethics Committee was required. Nonetheless, all subjects were informed about the study and participation was fully on a voluntary basis. Participants were ensured of confidentiality and anonymity of the information associated with the surveys. The study was conducted according to the guidelines of the Declaration of Helsinki. Informed Consent Statement: Informed consent was obtained from all subjects involved in the study. Data Availability Statement: The datasets generated and analyzed during the current study are available from the corresponding author on reasonable request. Conflicts of Interest: The authors declare that they have no conflict of interest.
Institutional Review Board Statement:
Because of the nature of this study, no formal approval of the Institutional Review Board of the local Ethics Committee was required. Nonetheless, all subjects were informed about the study and participation was fully on a voluntary basis. Participants were ensured of confidentiality and anonymity of the information associated with the surveys. The study was conducted according to the guidelines of the Declaration of Helsinki.
Author Contributions
Conceptualization, 000; project administration, all authors have read and agreed to the published version of the manuscript
Funding
NONE
Informed Consent Statement
Informed consent was obtained from all subjects involved in the study.
Data Availability Statement
The datasets generated and analyzed during the current study are available from the corresponding author on reasonable request.
Conflicts of Interest
The authors declare that they have no conflict of interest.
References
- International Trade Administration. Ecommerce, Available from https://www.trade.gov/country-commercial-guides/china-ecommerce, retrieved at 4/1/2024.
- Ou, X. Market share of sport goods online sales in China 2014-2016, Available from statista.com, retrieved at 3/1/2024.
- Parasuraman, A.; Zeithaml, V.A.; Malhotra, A. E-S-QUAL: A multiple-item scale for assessing electronic service quality. Journal of Service Research, 2005, 7(3), 213-333.
- Parasuraman, A.; Grewal, D. The impact of technology on the m-quality-value-loyalty chain: A research agenda. Journal of the Academy of Marketing Science, 2000, 28(1), 168-174.
- Javenpaa, S.L.; Todd, P.A. Consumer Reaction to Electronic Shopping on World Wide Web. International Journal of Electronic Commerce, 1996, 1(2), 59-88.
- The 52nd Statistical Report on China’s Internet Development, China Internet Network Information Center (CNNIC), Available from https://www.cnnic.com.cn/IDR/ReportDownloads/202311/P020231121355042476714.pdf. retrieved at 3/1/2024.
- Culnan, M.J.; Armstrong, P.K. Information Privacy Concerns, Procedural Fairness and Impersonal Trust: An Empirical Investigation. Organization Science, 1999, 10(1), 104-115.
- Ellison, G.D. Risk Taking by Mutual Funds as a Response to Incentives. Journal of Political Economy, 1997; 105, 1167–1200. [Google Scholar] [CrossRef]
- Babin, B.J.; Attaway, S. Atmospheric Affect as a Tool for Creating Value and Gaining Share of Customer. Journal of Business Research, 2000; 49, 91–99. [Google Scholar]
- Mandhani, J.; Nayak, J.K.; Parida, M. Interrelationships among Service Quality Factors of Metro Rail Transit System: An Integrated Bayesian Networks and PLS-SEM Approach. Transportation Research Part A: Policy and Practice, 2020; 140, 320–336. [Google Scholar] [CrossRef]
- Reichheld, F.F.; Sasser, W.E. Zero Defections: Quality Comes to Service. Harvard Business Review, 1990; 68, 105–111. [Google Scholar]
- Jensen, J.B.; Markland, R.E. Improving the application of quality conformance tools in service firms. Journal of Services Marketing, 1996; 10, 35–55. [Google Scholar] [CrossRef]
- Lewis, R.; Booms, H. The Marketing of Service Quality: In emerging Perspectives on Service Marketing, eds, Berry, L., Shostack,G., and Upah,G., AMA, Chicago, 1983.
- Gronroos, C. A service-orientated approach to marketing of services. European Journal of Marketing, 1978; 12, 588–601. [Google Scholar] [CrossRef]
- Lehtinen, U.; Lehtinen, J.R. Two approaches to service quality dimensions, Service Industries Journal, 1991, 11(3), 287-303. 1991; 11, 287–303. [Google Scholar] [CrossRef]
- Parasuraman, A.; Zeithaml, V.A.; Berry, L.L. SERVQUAL, A multiple item scale for measuring consumer perceptions of service quality. Journal of Retailing, 1988; 64, 12–37. [Google Scholar]
- Fassnacht, M.; Koese, I. Quality of Electronic Services: Conceptualizing and Testing a Hierarchical Model. Journal of Service Research, 2006; 9, 19–37. [Google Scholar]
- Santos, J. E-service Quality: A Model of Virtual Service Quality Dimensions. Managing Service Quality, 2003; 13, 233–246. [Google Scholar] [CrossRef]
- Park, Y.A.; Gretzel, U.; Sirakaya-Turk, E. Measuring Web Site Quality for Online Travel Agencies. Journal of Travel and Tourism Marketing, 2007; 23, 15–30. [Google Scholar] [CrossRef]
- Mehrabian, A.; Russell, J.A. An approach to environmental psychology, the MIT Press, 1974.
- Belk, R.W. Situational variables and consumer behavior. Journal of Consumer research, 1975; 2, 157–164. [Google Scholar] [CrossRef]
- Bagozzi, R.P. Principles of Marketing Management. Chicago: Science Research Associates, 1996.
- Sherman, E.; Mathur, A.; Smith, R.B. Store environment and consumer purchase behavior: mediating role of consumer emotions. Psychology and Marketing, 1997; 14, 361–378. [Google Scholar]
- Barnes, S.; Vidgen, R. An evaluation of cyber-bookshops: The WebQual method. International Journal of Electronic Commerce, 2001; 6, 11–30. [Google Scholar] [CrossRef]
- Miller, A. Citizenship that’s hard to ignore. Industry Week, 1996, 245(16), 21-24.
- Bellenger, D.; Steinberg, E.; Stanton, W. The congruence of store image and self-image. Journal of Retailing, 1976; 52, 17–32. [Google Scholar]
- MacInnis, D.J.; Price, L.L. The Role of Imagery in Information Processing: Review and Extensions. Journal of Consumer Research, 1987, 13, 473–491. [Google Scholar] [CrossRef]
- Damasio, A. The feeling of what happens: Body and emotion in the making of consciousness. New York, NY: Harcourt Brace, 2006.
- Amit, R.; Zott, C. Value Creation in E-Business. Strategic Management Journal, 2001; 22, 493–520. [Google Scholar]
- Rayport, J.E.; Sviokla, J.J. Exploiting the Value Chain. Harvard Business Review, 1995; 73, 14–24. [Google Scholar]
- Belk, R.W. (1987), Qualitative Analysis from the Consumer Behavior Odyssey: Role of Consumer and Researcher. Proceedings division of consumer psychology, American Psychological Association - Annual Convention. 1987; 8, 7–11. [Google Scholar]
- Fischer, E.; Arnold, A.J. More than a Labor of Love: Gender Roles and Christmas Shopping. Journal of Consumer Research, 1990; 17, 333–345. [Google Scholar]
- Sherry, J.F. Dealers and Dealing in a Periodic Market: Informal Retailing in Ethnographic Perspective. Journal of Retailing, 1990; 66, 174–200. [Google Scholar]
- Bloch, P.; Bruce, G. Product involvement as leisure behavior. Advances in Consumer Research, 1984, 11, 197–202. [Google Scholar]
- Hirshman, E.C. ; Holbrook. M.B. Hedonic Consumption: Emerging Concepts, Methods and Propositions. Journal of Marketing, 1982; 46, 92–101. [Google Scholar]
- Babin, B.J.; Darden, W.D.; Griffin, M. Work and/or fun: measuring hedonic and utilitarian shopping value. Journal of Consumer Research, 1994; 20, 644–656. [Google Scholar] [CrossRef]
- Erto, P.; Vanacore, A. A probabilistic approach to measure hotel service quality. Total Quality Management & Business Excellence, 2022; 13, 165–174. [Google Scholar] [CrossRef]
- Lehtinen, U.; Lehtinen, J.R. Two Approaches to Service Quality Dimensions. Service Industries Journal, 1991; 11, 287–303. [Google Scholar] [CrossRef]
- Aladwani, A.M.; Palvia, P.C. Developing and validating an instrument for measuring user perceived web quality, Information and Management, 2002, 39(6), 467-475. [CrossRef]
- Rust, R.; Lemon, K. E-Service and the Consumer. International Journal of Electronic Commerce, 2001; 5, 85–11. [Google Scholar]
- Wolfinbarger, M.; Gilly, M.C. eTailQ: Dimensionalizing, measuring and predicting etail quality. Journal of Retailing, 2003; 79, 183–198. [Google Scholar] [CrossRef]
- Barnes, S.J.; Vidgen, R. An Evaluation of Cyber-Bookshops: The WebQual Method. International Journal of Electronic Commerce, 2001; 6, 11–30. [Google Scholar] [CrossRef]
- Gefen, D. Reflections on the Dimensions of Trust and Trust Worthiness among Online Consumers. Data Base for Advances in Information Systems, 2002; 33, 38–53. [Google Scholar]
- Rabinovich, E.; Bailey, P.J. Physical Distribution Service Quality in Internet Retailing: Service Pricing, Transaction Attribution, and Firm Attributes. Journal of Operation Management, 2004; 21, 651–672. [Google Scholar]
- AL-dweeri, R.M.; Obeidat, Z.; Al-dwiry, M.A.; Alshurideh, M.T. The Impact of E-service Quality and E-loyalty on Online Shopping: Moderating Effect of E-satisfaction and E-trust. International Journal of Marketing Studies, 2017; 9, 92–103. [Google Scholar] [CrossRef]
- Madu, C.N.; Madu, A.A. Dimension of E-Quality. International Journal of Quality and Reliability Management, 2002; 19, 246–258. [Google Scholar]
- Pizam, A.; Calantone, R. Beyond psychographics—values as determinants of tourist behavior. International Journal of Hospitality Management, 1987; 6, 177–181. [Google Scholar] [CrossRef]
- Bhat, S.; Darzi, M. Online Service Quality Determinants and E-trust in Internet Shopping: A Psychometric Approach. Vikalpa, 2021; 45, 207–222. [Google Scholar] [CrossRef]
- Howard, J.A.; Sheth, J.N. The Theory of Buyer Behavior. John Wiley, New York, 1969.
- Sheth, J.N.; Newman, B.I.; Gross, B.L. Why We Buy What We Buy: A Theory of Consumption Values. Journal of Business Research, 1991; 22, 159–170. [Google Scholar] [CrossRef]
- Vinson, D.E.; Scott, J.E.; Lamont, L.M. (1977). The Role of Personal Values in Marketing and Consumer Behavior. The Journal of Marketing, 1977; 41, 44–50. [Google Scholar]
- Maute, M.F.; Forrester, W.R. The Structure and Determinants of Consumer Complaint Intentions and Behavior. Journal of Economic Psychology, 1993; 14, 219. [Google Scholar] [CrossRef]
- Chang, H.J.; Eckman, M.; Yan, R.N. Application of the Stimulus-Organism-Response model to the retail environment: the role of hedonic motivation in impulse buying behavior. The International Review of Retail, Distribution and Consumer Research, 2011; 21, 233–249. [Google Scholar] [CrossRef]
- Woodruff, R.B.; Gardial, S.F. Know Your Customer: New Approaches to Understanding Customer Value and Satisfaction, Malden, MA: Blackwell Publishers Inc, 1998.
- Fornell, C.; Johnson, M.D.; Anderson, E.W.; Cha, J.; Bryant, B.E. The American Customer Satisfaction Index: Nature, Purpose, and Findings. Journal of Marketing, 1996; 60, 7–18. [Google Scholar]
- Liljander, V.; Strandvik, T. Estimating Zones of Tolerance in Perceived Service Quality and Perceived Service Value. quis-proceedings, 1994, 3, 394–716. [Google Scholar] [CrossRef]
- Anderson, E.W.; Mittal, V. Strengthening the Satisfaction-Profit Chain. Journal of Service Research, 2000; 3, 107–120. [Google Scholar] [CrossRef]
- Anderson, A.R.; Srinivasan, S.S. E-satisfaction and E-Loyalty: A Contingence Framework. Psychology & Marketing, 2003; 20, 123–138. [Google Scholar]
- Cronin, J.J.; Brady, M.K.; Hult, G.T.M. Assessing the Effects of Quality, Value, and Customer Satisfaction on Consumer Behavioral Intentions in Service Environments. Journal of Retailing, 2000; 76, 193–218. [Google Scholar] [CrossRef]
- McDougall, G.H.; & Levesque, T. ; & Levesque, T. Customer Satisfaction with Services: Putting Perceived Value into the Equation. Journal of Services Marketing, 2000; 14, 492-410. [Google Scholar] [CrossRef]
- Westbrook, R.A. Product/consumption-based affective responses and post purchase processes. Journal of Marketing Research, 1987; 24, 258–270. [Google Scholar]
- Beatty, S.E.; Ferrell, M.E. Impulse buying: Modeling its precursors. Journal of retailing, 1998; 74, 169–191. [Google Scholar] [CrossRef]
- Carlson, J. G.; Hatfield, E. Psychology of emotion. Harcourt Brace Jovanovich, 1992.
- Westbrook, R.A.; Reilly, M.D. Value percept disparity: An alternative to the disconfirmation of expectations theory of consumer satisfaction. In R. P. Bagozzi & A. M. Tybout (Eds.), Advances in consumer research. 10, Ann Arbor, MI: Association for Consumer Research, 1983, 256–261.
- Sweeney, J.C.; Soutar, G.N.; Johnson, L.W. The Role of Perceived Risk in the Quality-Value Relationship: A Study in a Retail Environment. Journal of Retailing, 1999; 75, 77–105. [Google Scholar] [CrossRef]
Figure 1.
Conceptual Research Model.
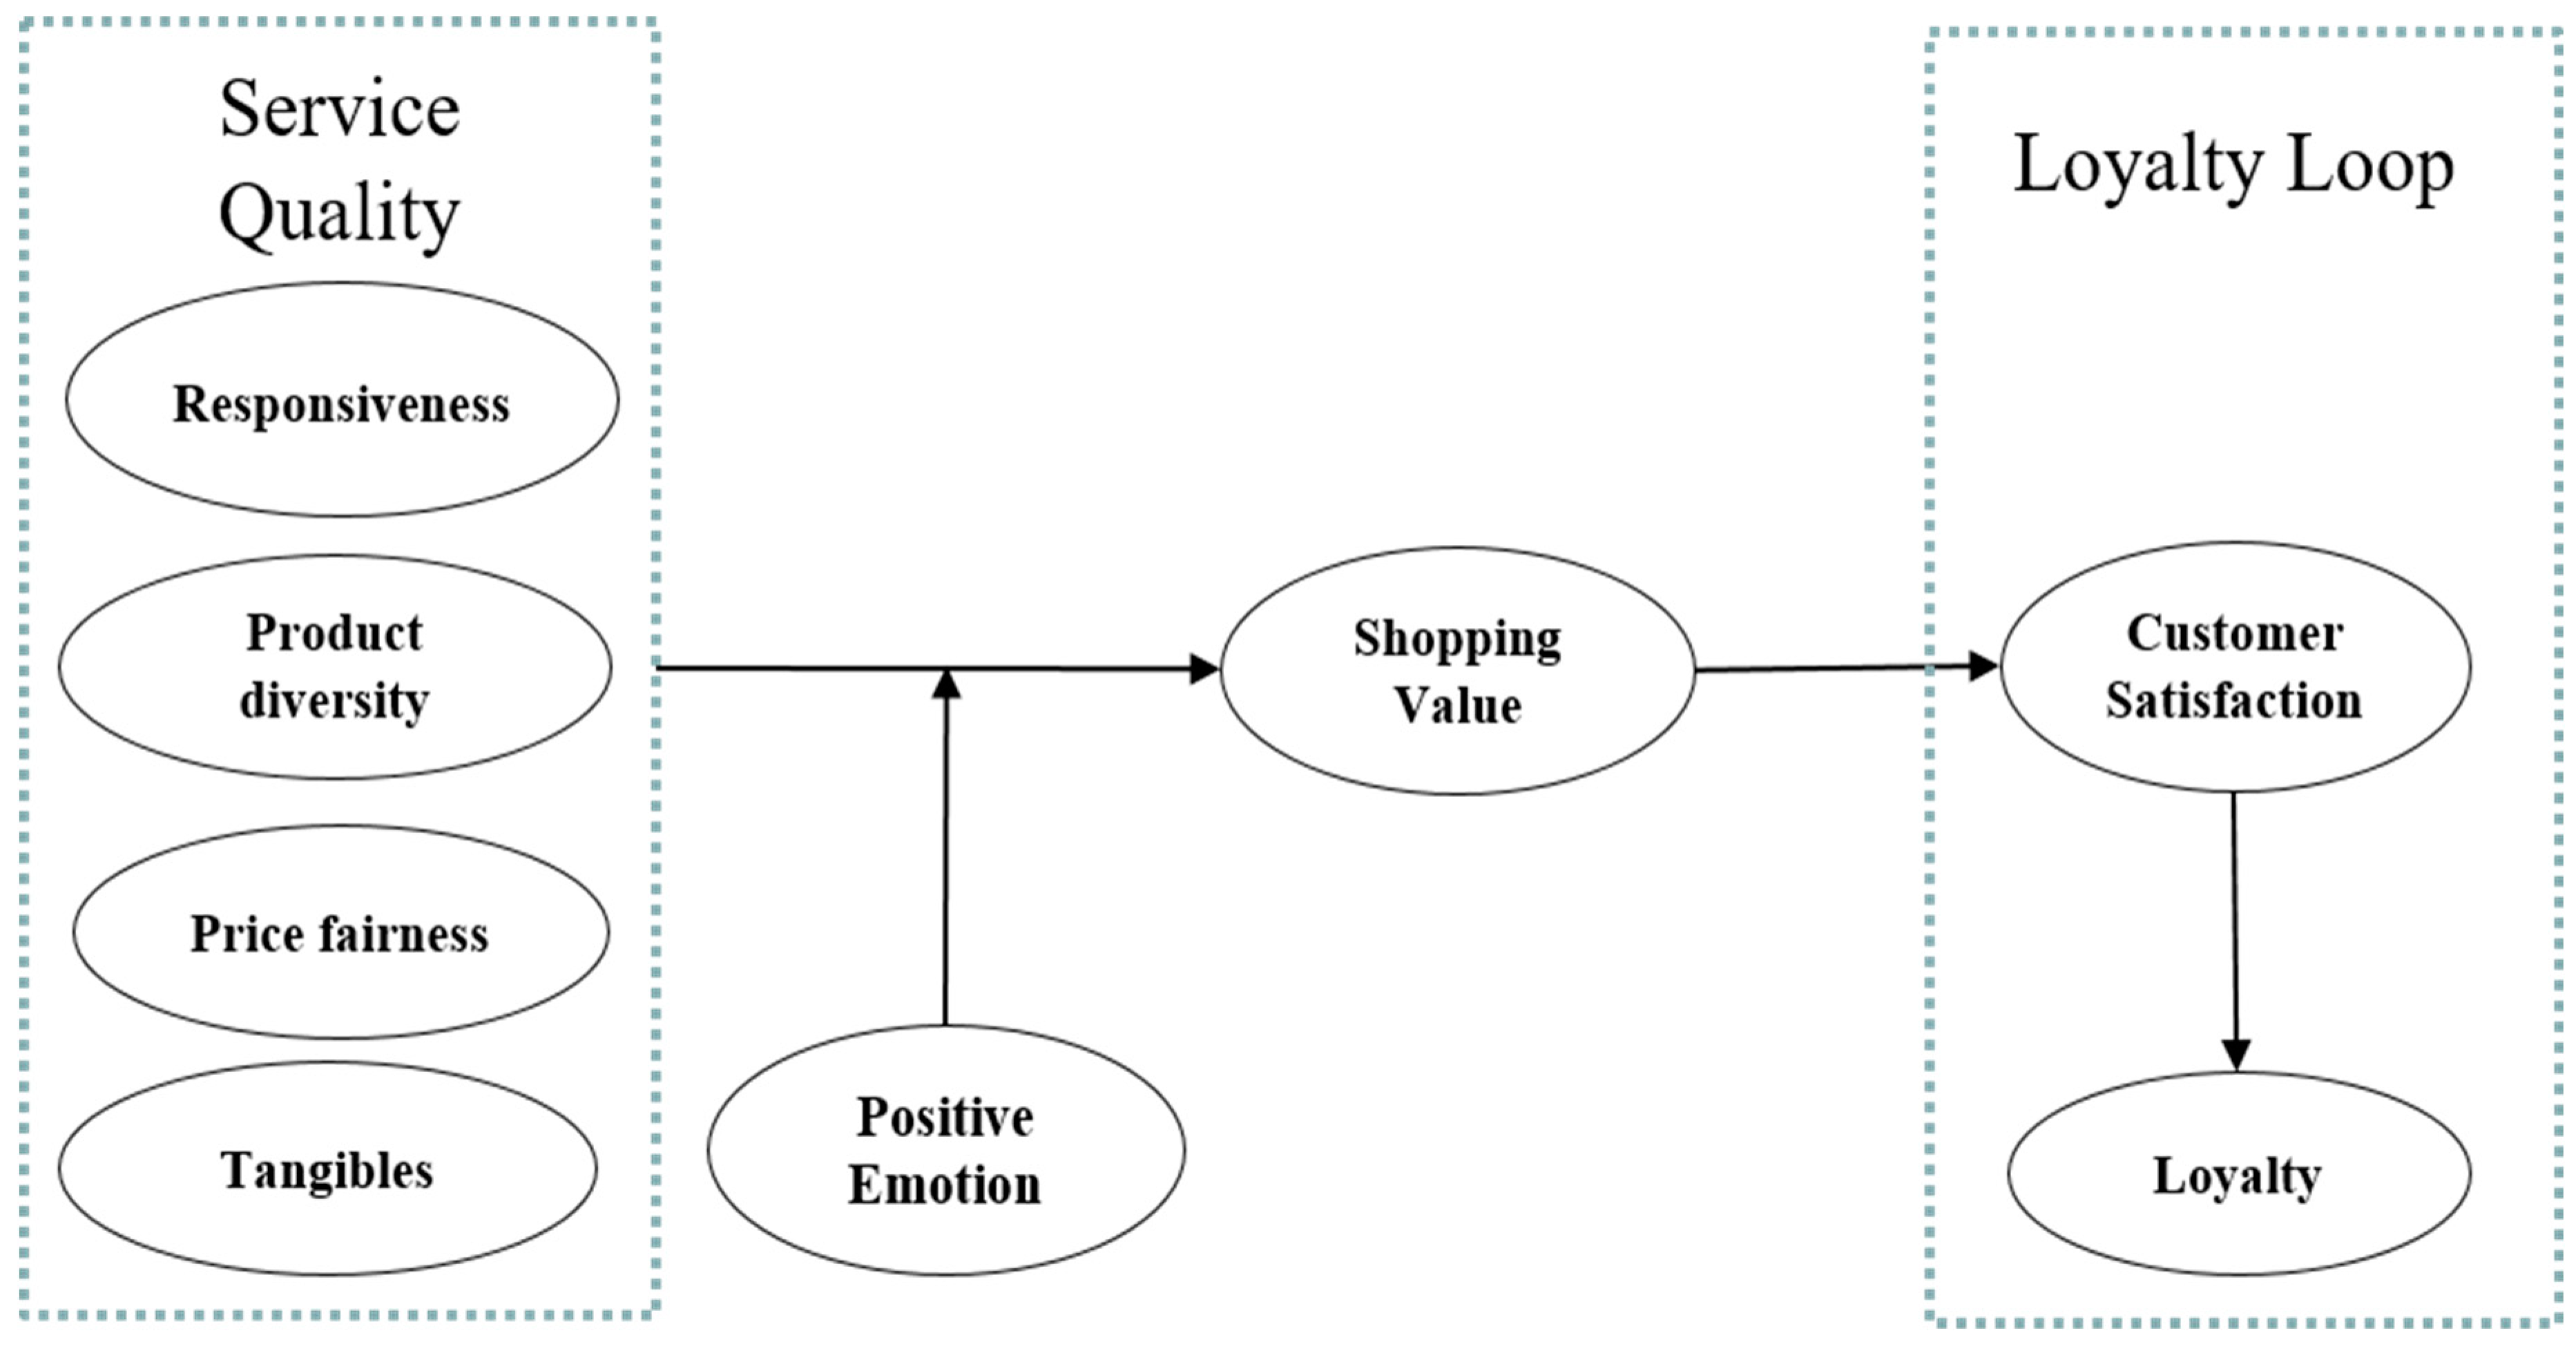
Figure 2.
Path Analysis.
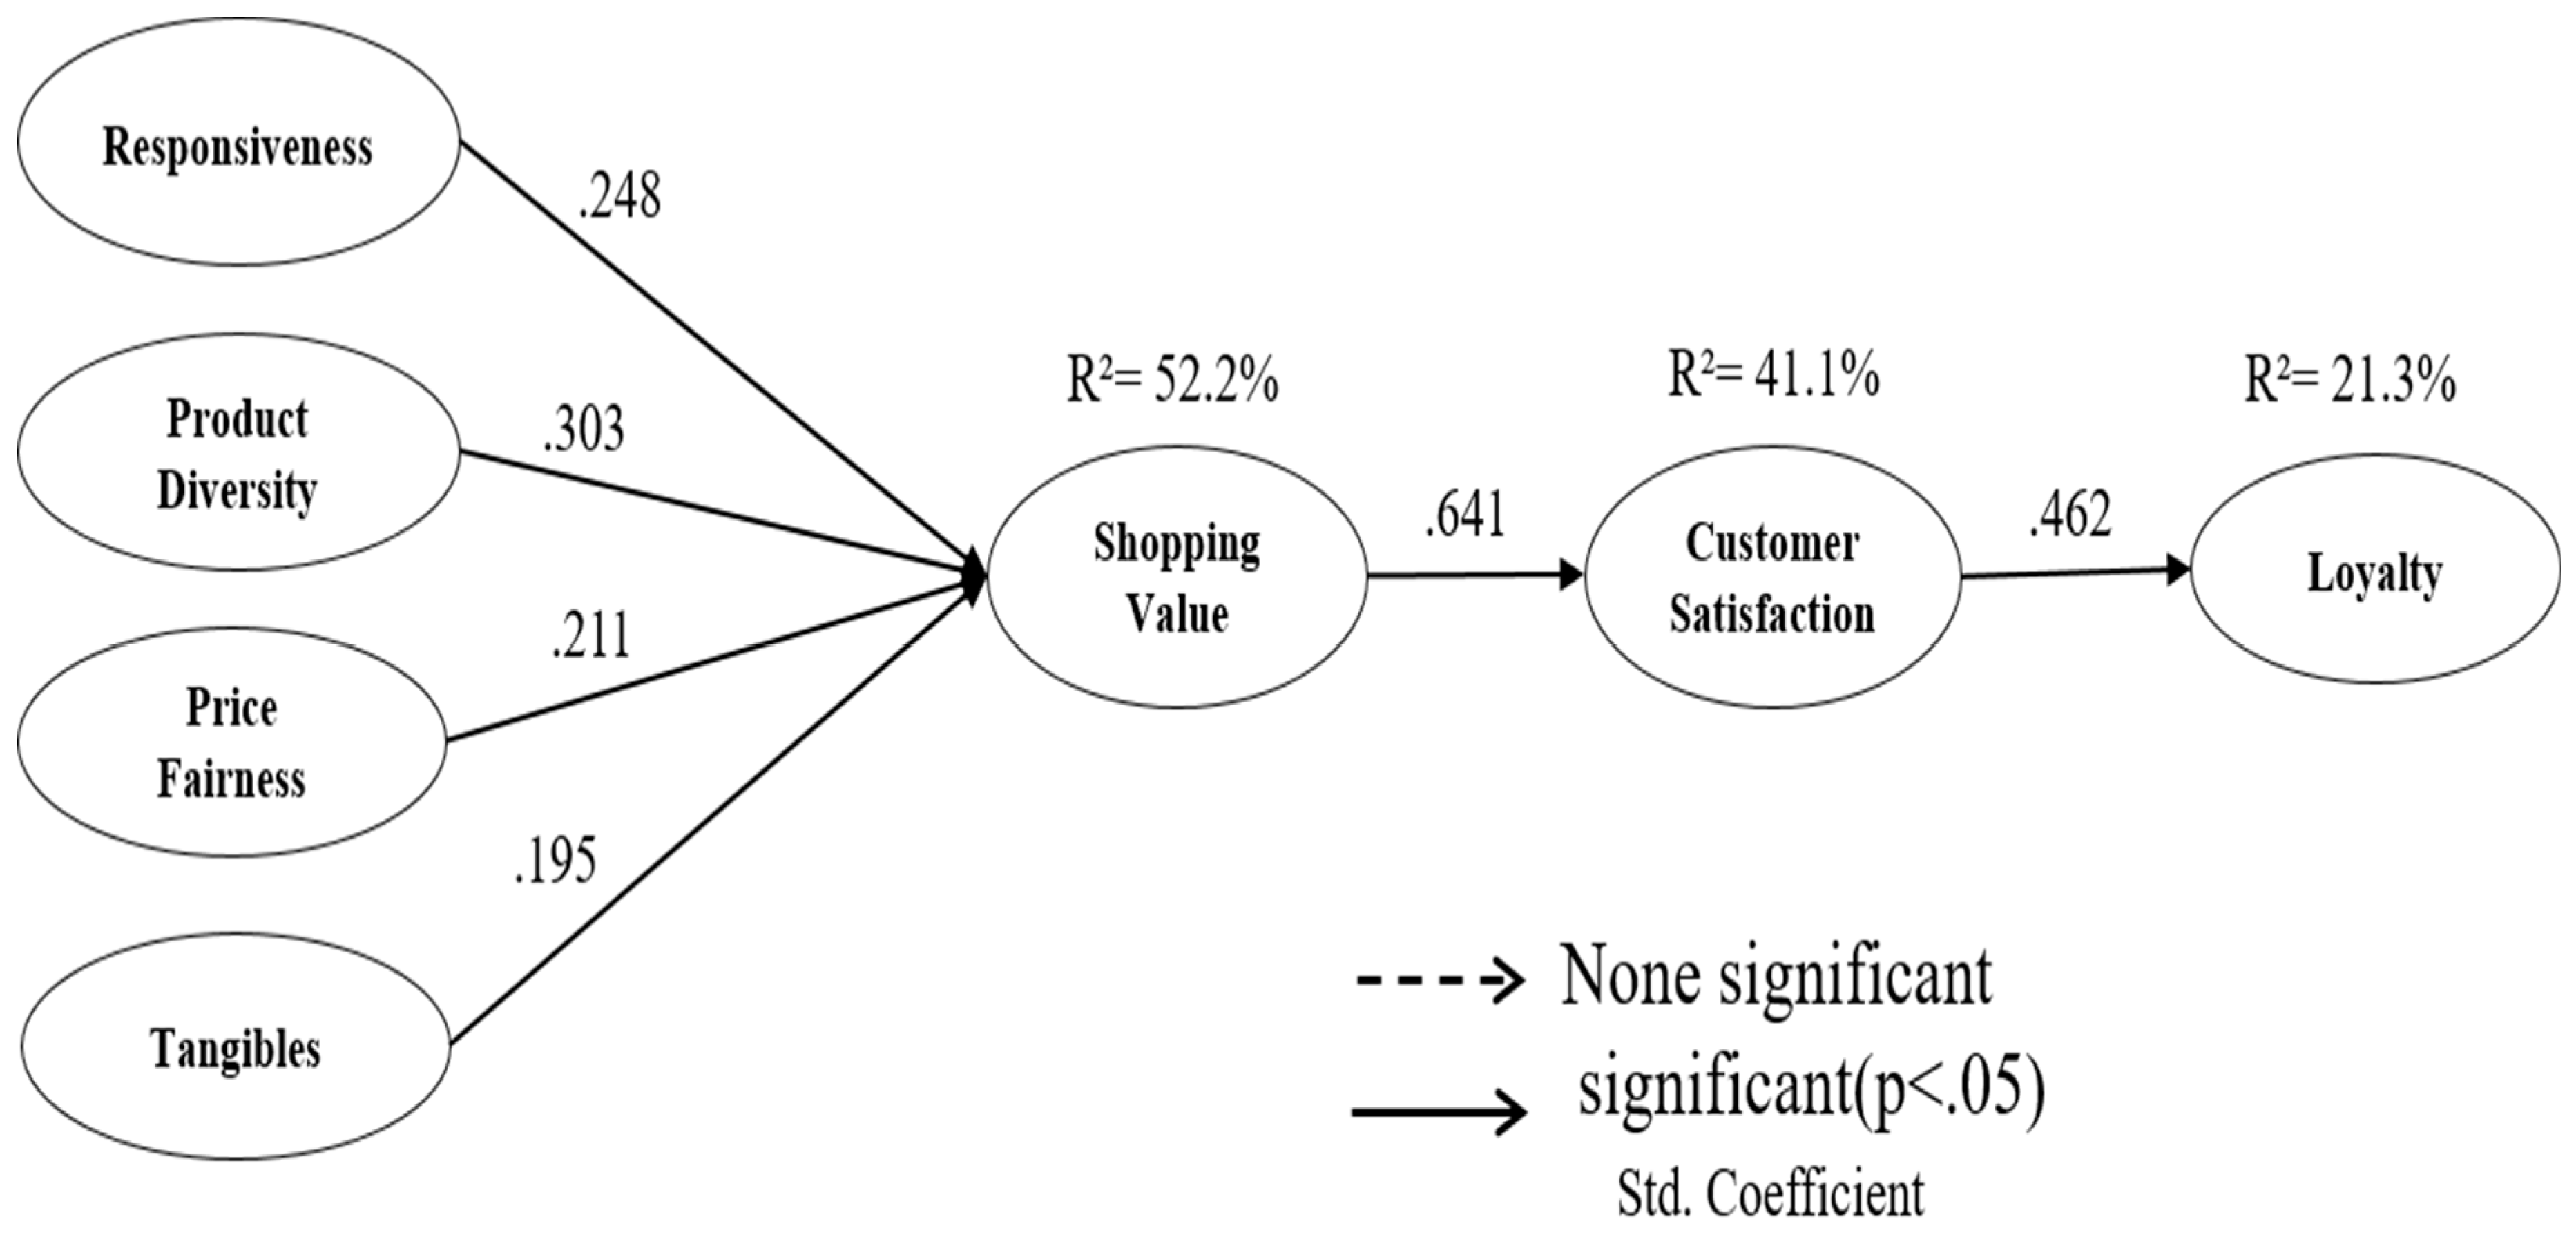

Table 1.
Demographic Profile.
| Index (n=654) | Frequency | % | |
| Sex | Man | 303 | 46.3 |
| Female | 351 | 53.7 | |
| Years | 20–29 | 158 | 24.2 |
| 30–39 | 245 | 37.5 | |
| 40–49 | 153 | 23.4 | |
| Over 50 | 98 | 15.0 | |
| Education Level |
High school degree | 58 | 8.9 |
| College students | 188 | 28.7 | |
| College degree | 310 | 47.4 | |
| Graduate school degree | 98 | 15.0 | |
| Occupation | Employee | 168 | 25.7 |
| Public office | 162 | 24.8 | |
| Self-employment | 98 | 15.0 | |
| Students | 187 | 28.6 | |
| House keeper | 39 | 6.0 | |
| Monthly income in USD |
below $2000 | 88 | 13.5 |
| 2000~3000 | 158 | 24.2 | |
| 3000~4000 | 196 | 30.0 | |
| 4000~5000 | 174 | 26.6 | |
| Above $5000 | 38 | 5.8 | |
| Frequency of participation in monthly sports activities | 1–3 | 77 | 11.8 |
| 4–6 | 296 | 45.3 | |
| 7–9 | 249 | 38.1 | |
| Over 10 times | 32 | 4.9 | |
| Number of sporting goods purchased per year | below 5 times | 185 | 28.3 |
| 6–10 | 208 | 31.8 | |
| 11–15 | 155 | 23.7 | |
| 15–20 | 51 | 7.8 | |
| 20–25 | 28 | 4.3 | |
| Over 25 times | 27 | 4.1 | |
Table 2.
Factor Analysis for Service Quality on an Online Shopping Mall.
| Variables | Items | Communality | Factor Loadings |
Composite Reliability |
(Cronbach’s Alpha) |
| Responsiveness | RE1 | .745 | .671 | .936 | .817 |
| RE2 | .720 | .673 | |||
| RE3 | .748 | .789 | |||
| Product Diversity |
PD1 | .701 | .739 | .879 | .819 |
| PD2 | .724 | .765 | |||
| PD3 | .757 | .762 | |||
| Price Fairness | PF1 | .734 | .730 | .911 | .858 |
| PF2 | .694 | .701 | |||
| PF3 | .722 | .691 | |||
| Tangibles | TA1 | .766 | .844 | .692 | .827 |
| TA2 | .729 | .783 | |||
| TA3 | .689 | .686 | |||
| Shopping Vale | SV1 | .803 | .785 | .863 | .846 |
| SV2 | .795 | .726 | |||
| SV3 | .727 | .612 | |||
| Customer satisfaction |
CS1 | .785 | .658 | .818 | .820 |
| CS2 | .819 | .665 | |||
| CS3 | .680 | .667 | |||
| Loyalty | LO1 | .645 | .699 | .774 | .808 |
| LO2 | .781 | .794 | |||
| LO3 | .792 | .822 | |||
| Positive emotion |
PE1 | .707 | .711 | .774 | .859 |
| PE2 | .762 | .673 | |||
| PE3 | .685 | .778 | |||
| PE4 | .705 | .817 |
KMO: .895, Bartlett=10308.0, df=300, p=.000, Total extracted Variance of 73.7%.
Table 3.
Correlation Coefficients and AVE.
| Factor | 1 | 2 | 3 | 4 | 5 | 6 | 7 | 8 | |
| RE | |||||||||
| PD | 0.347 | ||||||||
| PF | 0.297 | 0.227 | |||||||
| TA | 0.056 | 0.107 | 0.045 | ||||||
| SV | 0.346 | 0.376 | 0.282 | 0.158 | |||||
| CS | 0.253 | 0.325 | 0.300 | 0.113 | 0.411 | ||||
| LO | 0.162 | 0.164 | 0.353 | 0.077 | 0.190 | 0.213 | |||
| PE | 0.040 | 0.102 | 0.011 | 0.487 | 0.157 | 0.110 | 0.053 | ||
Note: RE: Responsiveness, PD: Product Diversity, PF: Price Fairness, TA: Tangibles, SV: Shopping Value, CS: Customer Satisfaction, LO: Loyalty, AVE: Average Variance Extracted, r²: correction coefficient, C.V. (Convergent validity): AVE > .50, D.V. (Discriminant validity): (AVE/r² > 1).
Table 4.
Results of Path Analysis.
| H | Paths | Estimate | S.E | t-value | p-value | ||
| H1-1 | Responsiveness → Shopping Value | .248 | .034 | 6.856 | .000 | ||
| H1-2 | Product Diversity → Shopping Value | .303 | .035 | 8.553 | .000 | ||
| H1-3 | Price Fairness → Shopping Value | .212 | .029 | 6.328 | .000 | ||
| H1-4 | Tangibles → Shopping Value | .195 | .028 | 6.763 | .000 | ||
| H2 | Shopping Value → Satisfaction | .641 | .031 | 21.34 | .000 | ||
| H3 | Satisfaction → Loyalty | .462 | .039 | 13.29 | .000 | ||
| Moderating Effect | |||||||
| I.D | D.V | Moderating Variable | Estimate | S.E | t-value | p-value | |
| Responsiveness | Shopping Value | Positive emotion |
.144 | .047 | .588 | .557 | |
| Diversity | .476 | .034 | 2.528 | .012 | |||
| Fairness | .509 | .044 | 2.243 | .025 | |||
| Tangibles | .173 | .039 | .815 | .415 | |||
Note: S.E: Standards Error.
Disclaimer/Publisher’s Note: The statements, opinions and data contained in all publications are solely those of the individual author(s) and contributor(s) and not of MDPI and/or the editor(s). MDPI and/or the editor(s) disclaim responsibility for any injury to people or property resulting from any ideas, methods, instructions or products referred to in the content. |
© 2024 by the authors. Licensee MDPI, Basel, Switzerland. This article is an open access article distributed under the terms and conditions of the Creative Commons Attribution (CC BY) license (http://creativecommons.org/licenses/by/4.0/).
Copyright: This open access article is published under a Creative Commons CC BY 4.0 license, which permit the free download, distribution, and reuse, provided that the author and preprint are cited in any reuse.


