
Submitted:
27 September 2024
Posted:
30 September 2024
You are already at the latest version
Abstract
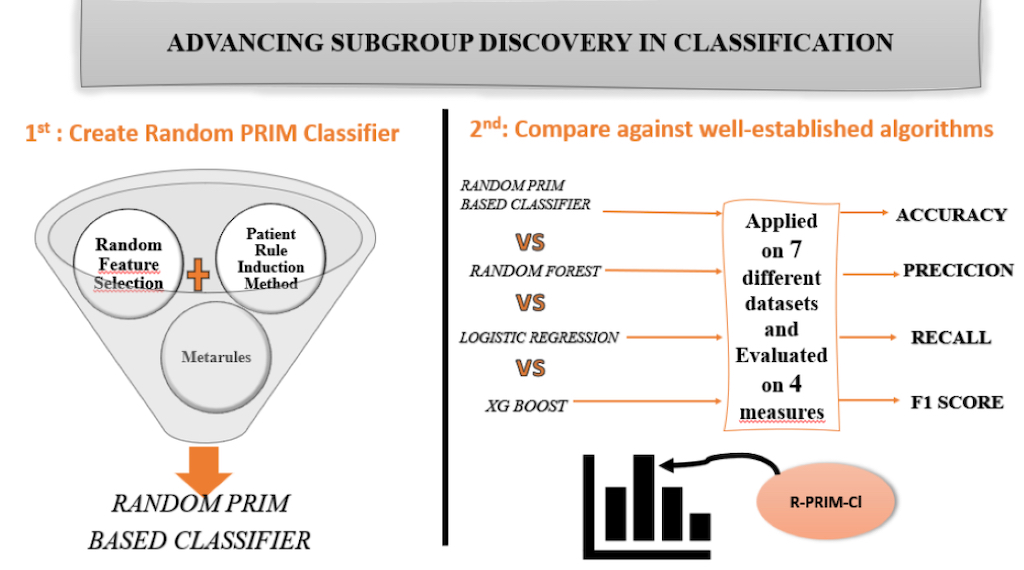
Machine learning algorithms have made significant strides, achieving high accuracy in many applications. However, traditional models often need large datasets, as they typically peel sub-stantial portions of the data in each iteration, complicating classifier development without suffi-cient data. In critical fields like healthcare, there is a growing need to identify and analyze small yet significant subgroups within data. To address these challenges, we introduce a novel classifier based on the Patient Rule Induction Method (PRIM), a subgroup discovery algorithm. PRIM finds rules by peeling minimal data at each iteration, enabling the discovery of highly relevant regions. Unlike traditional classifiers, PRIM requires experts to select input spaces manually. Our inno-vation transforms PRIM into an interpretable classifier by starting with random input space se-lections for each class, then pruning rules using Metarules, and finally selecting definitive rules for the classifier. Tested against popular algorithms such as Random Forest, Logistic Regression, and XGBoost, our Random PRIM-based Classifier (R-PRIM-Cl) demonstrates comparable robustness, superior interpretability, and the ability to handle categorical and numeric variables. It discovers more rules in certain datasets, making it valuable especially in fields where understanding the model's decision-making process is as important as its predictive accuracy.
Keywords:
Classification
; Subgroup Discovery
; Patient Rule Induction Method
; Metarules
; Interpretability
1. Introduction
Recently, there has been a significant breakthrough in the accuracy of machine learning models, which has revolutionized various industries, including finance [1,2] and healthcare [3,4]. These models are very good at spotting patterns in large datasets and making predictions. But interpretability still presents a big obstacle in spite of their outstanding performance [5]. Deciphering the logic behind these models' forecasts gets harder as they get more intricate. In areas where transparency is essential, in particular, this opacity restricts our ability to fully trust and use these models [6].
Determining rules that can yield practical insights is one area where interpretability is particularly. Conventional machine learning models frequently perform exceptionally well on classification tasks, but they struggle to identify and explain the underlying principles that underlie their predictions vital [7,8]. This gap shows how approaches that improve predictive accuracy while also providing comprehensible guidelines are needed.
Among various techniques employed in classification, such as tree-based and rule-based methods, one notable approach is known as bump hunting [9]. This method focuses on identifying significant deviations or bumps in the data that can reveal important subgroups or patterns. In this context, the Patient Rule Induction Method (PRIM) emerges as a promising tool. Developed by Friedman and Fisher [9], PRIM is a well-regarded algorithm for subgroup discovery, known for its ability to identify and describe subgroups with distinct characteristics. These regions have rectangular shapes; hence they are called “boxes”. PRIM is highly valued for its ability to generate actionable insights through interpretable rules, making it a valuable tool in various fields including medicine, finance, and marketing. However, while PRIM excels in revealing valuable subgroups, it is not inherently designed as a classifier. This limitation presents an opportunity to enhance PRIM’s utility by developing a classifier based on its principles.
In this paper, we propose a novel approach that leverages the strengths of PRIM to build a robust bump hunting rule-based classifier. By integrating PRIM’s rule-discovery capabilities with classification techniques, we aim to create a model that not only provides accurate predictions but also offers interpretable and actionable insights into the data. This advancement promises to bridge the gap between high accuracy and interpretability, ultimately contributing to more effective and trustworthy machine learning applications.
In summary, the contributions of our paper are as follows:
- -
- Initial PRIM only search in chosen feature space, in our work, the algorithm chooses multiple random feature spaces.
- -
- Once the rules of each class label are discovered, we innovated in pruning the rules using Metarules. Meaning that not only the ruleset is interpretable, but also no rule is completely removed from the ruleset. Metarules aim at creating association rules having as items the rules generated.
- -
- To build the classifier, the selection of the final rule is primordial. We investigate the literature, especially CART and CBA original papers, to select the final rules that will be part of the final model. Having the algorithm choosing only the optimal boxes in each peel makes the selection fall on the first rules with the most significant coverage, support and confidence.
- -
- We tested our Random PRIM based classifier (R-PRIM-Cl) on ten well-known datasets to validate the classifier and raise the future challenges, and we compared the results to the three well known and well-established classifiers: Random Forest, Logistic Regression and XG-Boost. We used four metrics to evaluate the performances: Accuracy, Precision, Recall and F1-score.
2. Materials and Methods
In this section we present first an overview of the Patient Rule Induction Method, second some related works that motivated the research and finally the algorithms for the final experiment results.
2.1. Overview of the Patient Rule Induction Method
2.1.1. Definition
Introduced by Friedman and Fisher in 1999 [9], the Patient Rule Induction Method is an algorithm used for identifying and interpreting patterns in data, relying on the procedure of bump hunting. PRIM is a flexible and interpretable method that aims to uncover regions in the feature space where the response variable is significantly different from the overall mean or median. PRIM is particularly useful for identifying segments or subgroups within data that exhibit particular characteristics or behaviors. It is often applied in various domains such as medicine, finance, and marketing to find patterns that could help with decision-making and understanding of the data. Therefore, PRIM is considered as a subgroup discovery method since it contributes in pattern discovery in datasets. This method relies on two main steps: the top-down peeling and the bottom-up pasting. In PRIM, the rules are shapes as rectangles and hence named boxes. Figure 1 shows the construction of the first box containing the red data. As observed, the construction is done iteratively and the refinement at each iteration doesn’t peel a lot of data, thus the name patient given to the algorithm. This procedure assures to not miss any area of the data.
To better understand the search in the input space according to the type of variables, numeric or categorical, here is a more formal statement of the problem:
Let p be the number of the input variables denoted by x1, x2…, xp and y be a target variable in the same dataset. If y is a multiclass variable, then the problem has to be reformulated as binary subproblems. Let Sj denote the set of possible values of xj (j=1, …., p). The input space is then:
S = S1 x S2 x …… x Sp
The objective is to find subregions R ⊂ S for which:
where is the global mean of y and the mean of y in R.
Let si ⊂ Si, we define a box by:
where x B xj sj ). When si = Si, we leave xi out of the box definition since it may take any value in its domain. Figure 2 shows an example of a box defined on two numeric variables, where x B x1 [a,b] x2 [c,d]. And Figure 3 shows the definition of a box if the variables are categorical, where x B x1 {a,b} x2 {c,d]}. A box can also be defined by numeric and categorical variables at the same time.
B = s1 x s2 x …… x sp
Following top-down peeling, we are left with a series of boxes, each of which was made by peeling a portion of its predecessor. We only consider the next step at a time while conducting our searches, which is to select the peel that leads to the ideal sub-box. In other words, box boundaries are established without taking into account potential peels. Thus, redrawing the final box's boundaries can occasionally make it better. Using bottom-up pasting, we recursively enlarge the last box until the next paste causes the value of in the box to decrease
PRIM is known as a hill-climbing algorithm because, at each search step, the single sub-box that most improves the target mean is peeled off. The peeling process comes to an end when the current box's support falls below the user-specified minimum support value of β0 fixed by the user.
2.1.2. The Box Evaluation Metrics
When evaluating a box, there are four metrics to analyze: the support, the coverage, the density, and the dimension of the box.
The first statistic is the coverage. It is the proportion of the target cases (cases of interest) that are in the box compared to the total number of target cases in the dataset. The mathematical expression is as follows:
The starting point of PRIM is the unrestricted full set of cases, which includes all outcomes of interest, and therefore the coverage starts at 1 and drops as the algorithm progresses. If the coverage of a box is high, it means that the box captures a larger fraction of the target cases, thus it identifies the behavior of interest. And if the coverage is low, it can lead to more precise and actionable insights, it may also miss out on broader patterns or be applicable to only a limited set of cases. The coverage helps evaluate the effectiveness of the box in isolating the desired patterns or responses within the dataset.
The second import statistic is the support. The support of a box is the fraction of points from the dataset that fall into the box, in the prim package on python it is referred as mass and mathematically it is expressed as:
In terms of the dataset it captures, the "mass" aids in determining the size of the box. A higher mass denotes a greater amount of data contained in the box, which means it is less specific but more general., whereas a lower mass indicates a smaller amount captured, hence focusing more on a subset that meets the criteria defined by the box. This statistic is crucial for comprehending the trade-off between the box's specificity and coverage when locating intriguing areas within the data space.
The third statistic to evaluate a box is the density of the box. The density is the equivalent of the confidence in PRIM. It measures how concentrated the target cases are within the box, providing insight into the purity of the box concerning the target cases. Since with PRIM we deal with rectangles or hyper-rectangles, the density makes more sense. The expression of the density is as follow:
If the density is high then it means that a larger proportion of the points in the box are target cases, suggesting that the box is well-targeted and specific to the desired behavior or outcome. Conversely, a lower density suggests that the box includes a significant number of non-target cases, making it less precise.
The last measurement is the restricted dimensions, or res dim, found in the Python prim package. The quantity of variables that define a box is indicated by this measure. It is helpful to evaluate the box's complexity and comprehend the number of features that go into identifying the target cases inside the box, as this gives insight into the patterns that are produced and their interpretability and specificity.
The relationships between mass, density, and coverage in PRIM are critical to comprehending how well a box captures the target cases. Density shows the concentration of those target cases within the box, indicating how pure the box is, whereas coverage measures the percentage of target cases that are included within the box relative to all target cases in the dataset. There is a trade-off between capturing many targets and retaining specificity; a box with high coverage captures many target cases, but its density may be low if it also includes many non-target cases. Conversely, mass indicates the percentage of the total dataset that the box contains, including both target and non-target cases. The correlation between mass and coverage demonstrates that, since mass includes all data points inside the box, not just the targets, a high mass does not always imply a high coverage. In order to effectively isolate the target cases and minimize the inclusion of non-target cases, a box with high coverage but low mass is preferred. This makes the box efficient and specific. When defining the boundaries of a box in PRIM, it is helpful to understand these relationships in order to assess the appropriate balance between specificity and generality.
To understand better let’s suppose, as an example, that we have a dataset with 1,000 instances and a two-dimensional input space where each dimension ranges from 0 to 100 and we found two boxes. A box 1 containing 200 points and having a support of 20% and a coverage of 36%. And a box 2 containing 50 points with a support of 5% and a coverage of 0.01%. These measures show that box 1 is more general since it has a higher coverage a higher mass than box 2 which is more specific. Hence, the selection of the boxes depends on the domain knowledge and the search interest.
2.2. Metarules
In 2007, Berrado and Runger in [10] offered a process for handling the massive quantity of association rules, many of which are redundant and overlapping and that are produced from high-dimensional data. The notion of metarules is then presented as the rules that characterize connections among the identified association rules themselves. In order to improve their interpretability and utility for data analysts, this method seeks to restructure, group, and prune the association rules.
The problem of data sparseness in high-dimensional spaces, which results in the creation of numerous redundant rules, is highlighted by the authors. The inefficiency of traditional rule summarization techniques in recognizing and removing redundant rules is a common cause of failure in sparse datasets. The rule sets are grouped and made simpler by the metarule-based technique described in the original paper, which finds relationships between the rules. By using this method, the number of rules is decreased and they are arranged into more easily understood subgroups as illustrated in Figure 4. Within a new role, where each association rule is considered an item within a transaction, the paper describes the generation of metarules using the same algorithm applied to the original data. Then, using these metarules, more specific and corresponding rules are found and grouped. The entire rule set can be made more readable and simpler by removing any redundant or excessively specific rules by looking at these meta-rules. The efficiency of the authors' method is illustrated by the notable reductions in rule complexity they show in both real manufacturing data and benchmark datasets. Comparing the metarule approach to other distance-metric clustering techniques, it performs well, demonstrating that it can uncover the relationships between rules rather than just clustering them according to proximity.
This work has been then used as a pruning technique for other rules in machine learning than just the association rules. In [11,12,13,14] authors apply the concept of the metarules to optimize and increase the interpretability of their models. They use the rules generated by Random Forest or R-CAR as the items in the dataset, then they apply APRIORI algorithm to find the associations between the rules.
Metarules, all things considered, offer an organized method of managing the numerous association rules produced by high-dimensional data, improving the results' actionability and comprehension for analysts. Using domain expertise to inform future refinement, this approach prioritizes data-driven organization.
We propose to use metarules for two tasks: box pruning and overlapping region detection. Metarules appears to be the best method for pruning. In fact, it preserves the more specific rules for the analyst to allow knowledge discovery that may aid in the detection of novel phenomena in the data, in addition to allowing us to present the general boxes as the classifier. All of this occurs without removing any rules from the ruleset. Regarding the identification of the overlapping region, the number of identical instances that we can locate in the rules is what determines the association between them. This means that, as Figure 4(b) illustrates, if two rules from two distinct class labels are associated, then some population overlaps in both regions. After that, the overlapping regions can be dealt with to create a precise classifier.
2.3. Related Works and Motivation
The PRIM related works can be categorized in two sets: the improvements and the applications. The improvements include the use of the Principal Component Analysis (PCA) combined with PRIM [15]. Another improvement concerns the second step of PRIM, the bottom-up pasting, where the box is expanded one dimension at a time to optimize it by expanding it two dimensions at once [16]. Also, in [17], the researchers use a modified PRIM to try to statistically identify significant subgroups based on clinical and demographic characteristics. Other improvements or innovations involves optimizing industrial process and mean and standard deviation by modifying PRIM [18,19]. On the other hand, the applications of PRIM are the main source that motivated this research. Indeed, PRIM is mostly used in the healthcare field where the discovery of subgroups is of high interest. For example, in [20] the purpose of the study was to find the groups of patients for which the trial was a failure. And in [21], PRIM was used with other algorithms to find the interesting rules to define an unstable slope. Against M5’, Group Method of Data Handling (GMDH) and Multivariate Adaptive Regression Splines (MARS), PRIM was one of the most effective and practical algorithms.
From most the related works, the redundant observations that motivated this research are:
- -
- PRIM requires too much interactions with the expert because of the choice of the feature search space;
- -
- In case of a large number of rules, if the expert chooses multiple search spaces, the interpretability is lost and so is the explainability, since if the rules are not interpretable, they cannot be evaluated according to the domain knowledge;
- -
- The lack of a classifier to use the discovered rules as a predictive model for future predictions.
2.4. Selected Algorithms for the Comparison
To analyze the performance of our approach, we contrasted our R-PRIM-CL with three of the most well-known and reputable algorithms in the field of data classification, in section 4, to assess the effectiveness of our method. Although the comparison can be expanded to include other algorithms, it is interesting to compare classifiers based on bagging with Random Forest (RF), boosting with XG-Boost (XGB), bump hunting with Random PRIM-based Classifier, and the linear model with Logistic Regression (LR). Indeed, comparing a new classification algorithm with established algorithms like Random Forest, XG-Boost, and Logistic Regression is essential because these well-known models represent different strengths, weaknesses, and approaches to classification, making them valuable benchmarks.
The Random Forest [24] ensemble technique efficiently handles large, high-dimensional datasets by combining multiple decision trees to increase accuracy, robustness, and resistance to overfitting [25]. One way to evaluate how well a new algorithm captures complex patterns and interactions in the data is to compare it with Random Forest.
XG-Boost [26], with its exceptional accuracy, speed, and efficiency, excels in machine learning competitions and real-world applications. It is especially good at handling large datasets, missing values, and imbalanced data [27]. Assessing the new algorithm's speed, scalability, and accuracy against one of the most competitive models out there is made possible by comparing it to XG-Boost.
In contrast, the widely used technique known as Logistic Regression [28] is easy to understand, straightforward, and a reliable baseline because it can effectively simulate linear relationships between inputs and outputs. It offers a simple point of comparison to assess whether the new algorithm's added complexity represents a significant improvement over a conventional, uncomplicated method.
The range of machine learning techniques covered by these algorithms, which include boosting, tree-based ensembles, and linear modeling, is quite extensive, ranging from simple to complex. Its performance across various data distributions, feature interactions, and problem complexity is demonstrated through benchmarking against them, which aids in establishing the new algorithm's efficacy, adaptability, and competitive edge. Additionally, these comparisons show where R-PRIM-Cl sits on the interpretability versus predictive power spectrum: while Random Forest and XG-Boost offer high accuracy with less interpretability, Logistic Regression offers high interpretability. Thus, comparing R-PRIM-Cl to Logistic Regression, XG-Boost, and Random Forest offers a thorough understanding of its advantages, disadvantages, and possible uses while placing it in the context of classification models as a whole.
3. Proposed Methodology
In this section, we will first introduce the algorithm and then present an example to illustrate our approach.
3.1. Random PRIM Based Classifier
Based on the search strategy provided by PRIM, our algorithm includes additional steps to construct the classifier. The expert is still in charge of determining PRIM's parameters, though. It is significant to remember that the prim package already has these same parameters set by default to 5% for the peeling and pasting threshold. If the support is not set, PRIM continues searching for region until it reaches an empty box as a stopping criterion. Not setting any support threshold can be benefic to the subgroup discovery. These parameters are determined based on the particular field of work and the experimentation conducted by analysts.
The detailed steps of the Random PRIM based Classifier (R-PRIM-Cl) are outlined below.
-
Initialization Step
- (a)
- A set of N data instances
- (b)
- A set of P categorical or numeric variables as X = {x1, x2, …, xp}
- (c)
- Two class labels target variable Y {0, 1}
- (d)
- Define a minimum support, peeling and pasting thresholds {s, α, β}
- 2.
-
Procedure
- (a)
- Random choice of the feature search spaces
- (b)
- Implementation of PRIM on each subspace for each class label
- (c)
- Find boxes with the metrics
- (d)
- Implement Metarules to find the associations between rules
- (e)
- Execute Cross-Validation on 10 folds
- (f)
- Retain the rules or metarules based on Cross-Validation, the support, the density and the coverage rates
- (g)
- Calculate the Accuracy, Recall, Precision and F1-Score to validate the Model
- 3.
-
Output
- (a)
- The set of all boxes found to allow the discovery of new subgroups
- (b)
- The set of selected boxes from the Metarules pruning step
- (c)
- The final box measures: coverage, density, support, dimension
- (d)
- The final model metrics: accuracy, precision, recall, f1-score
3.2. Validation of the Classifier
As we intend to create a classifier based on the boxes generated for each class by PRIM which falls in the subgroup discovery algorithms, we have investigated the original book of Classification and Regression Tree (CART) by Breiman et.al [29], to understand the process of validating a classifier.
Let x1, x2…, xp be the number of features in our dataset.
Let X be the vectorial space of all the measures induced by the features.
Let G be the number of the objects’ classes 1,....,G and C the ensemble of the classes in our dataset C = {1,…..,m}
A classifier is then defined as a function f(x) defined on X so that for every x, f(x) is equal to one of the numbers 1,….,G.
Another way of looking at it, is to define SG as the subset of X on which f(x) = g, that is :
SG = {x, f(x)=g}.
S1,….SG are disjoints so X = U SG. Making SG a partition of X.
In that additional context, a classifier can also be defined as a partition of X into G disjoint subsets such that for every x ϵ Sg the preselected class is g.
The most important criterion for a good classification procedure is to not only produce accurate classifiers, within the limits of the data, but also provide insight and understanding into the predictive structure of the data, in other words to focus on interpretability and explainability as much as we focus on the accuracy and precision of the results.
According to the literature, one of the limits in constructing a good classifier is the dimensionality of the dataset. In fact, the bigger the dimensionality, the sparser and more spread apart are the data points as called in The curse of dimensionality by Bellman in 1961 [30]. One of the advantages of the bump hunting procedure, is the adaptation for the high dimensionality. Indeed, since it peels one dimension at a time, it is able to focus on all the space and spot subgroups according to the input space chosen.
In [29], Breiman et.al validated CART as a classifier by evaluating the probability of misclassifying a sample. They set three types of internal estimates to evaluate the performance of the classifier. The first one is the resubstitution estimate which consists of counting the misclassified cases and which is considered as accurately weak. The second is the test sample estimation, where the dataset is divided into two independent samples, on the first one the classifier is created and on the second one the misclassification is measured. The main drawback is the reduction of the effective sample size, a bigger data is needed to ensure that the test is efficient. The last procedure to estimate the efficiency of a classifier is the cross validation, the best approach, that consists of resampling the data into different portions to test the classifier and train the model.
To ensure that our classifier is valid, we have also investigated CBA, the Classification Based on Association [31]. Three steps are involved in validating the classifier based on CBA. Sorting the rules according to their support and confidence is the first step. The precedency level refers to how rules that have greater support and confidence are typically given priority. Pruning the rules to prevent overfitting and redundancy is the second step. This entails getting rid of regulations that are superfluous or less important. The rule with the higher confidence is kept in place, for instance, if two rules have the same antecedent but different consequents. The last stage is to construct the classifier by putting the rules into priority order. When a new instance needs to be classified, the classifier looks through the rules one after the other until it locates one that corresponds with the attributes of the instance. These are completed for every rule. Next, we calculate the classifier's total number of errors, and the process ends when neither a rule nor any training data remain. The last stage is to remove the rules that don't increase the classifier's accuracy.
In our classifier, since the approach is a bump hunting method we have two sorts of boxes: general boxes and specific boxes. Our algorithm can at the same time classify instances and allow the discovery of subgroups. Thus, the classifier selects the general boxes as the final rules but since we use Metarules to prune the boxes, the majority of boxes are not removed. They are all organized using association between them which makes the reading easier. Therefore, having in PRIM, the coverage and the support and the density being equally important makes the selection relies on them three instead of only the support and the confidence. Concerning overlapping rules, they are detected in the Metarules step and can be handled by evaluating the coverage since it represents the proportion of the positive target in the box in comparison with the number of positive targets in all the dataset. So, if the coverage is important then the instance should be classified as positive. We are still investigating other techniques, such as the Bayes theorem to ensure that the rule conflict is well handled.
3.3. Illustrative Example
To illustrate the functioning of R-PRIM-Cl we used the Iris dataset on python. Indeed, the low dimensionality, balanced classes, and ease of use of the Iris dataset make it a popular choice for quick experimentation and visualization of classifiers. Also, it is a good dataset to guide the users through the example. It offers a useful test of a classifier's capacity to discern between three different but somewhat overlapping classes. Its compact size makes it ideal for learning and fine-tuning algorithms because it enables rapid training and testing. The dataset is a trustworthy standard for evaluating new classifiers because of its extensive documentation and popularity in the machine learning community. This makes it a great place to start before working with more complicated datasets as in Section 4.
We used prim package in python with additional functions that we developed to select random features and create matrices that contain the final results. And for an illustrative purpose we set the prediction at setosa (1) or not setosa (0).
The detailed steps for R-PRIM-CL to predict if a flower is a Setosa are as follows:
-
Initialization Step
- (a)
- A set of 150 flowers from the Iris dataset
- (b)
- A set of 4 numeric variables as X = {sepal length (cm) , sepal width (cm), petal length (cm), petal width (cm)}
- (c)
- Y being a three class labels target we coded setosa as 1 and versicolor and virginica as 0, hence Y {0, 1}
- (d)
-
Define a minimum support, peeling and pasting thresholds:s = 10%, α= 5%, β=5%
- 2.
-
Procedure
- (a)
-
Random choice of the feature search spaces by the algorithm:[['sepal length (cm)', 'sepal width (cm)'],['sepal length (cm)', 'petal width (cm)'],['sepal width (cm)', 'petal length (cm)', 'petal width (cm)'],['sepal width (cm)', 'petal length (cm)'],['petal length (cm)', 'petal width (cm)']]
- (b)
- Implementation of PRIM on each subspace for each class label
- (c)
- Find boxes with the metrics as displays in Table 1 before the Metarules and cross- validation
- (d)
-
Implement Metarules to prune and detect overlapping
- No overlapping detected
-
Metarules detected for a density=100%:
- ○
- R2 => R1
- ○
- R3 => R7
- ○
- R4,R8 => R5 and R5,R8 => R4 and R5,R4 =>R8
- ○
- R6 => R8
- (e)
- Execute Cross-Validation on 10 folds
- (f)
- Retain the rules or metarules based on Cross-Validation, the support, the density and the coverage rates as displayed in Table 2
- (g)
-
Calculate the Accuracy, Recall, Precision and F1-Score to validate the Model
- Accuracy: 0.97
- Precision: 0.83
- Recall: 1.00
- F1 Score: 0.91
- 3.
-
Output
- (a)
-
The set of all boxes found to allow the discovery of new subgroups(R1, R2, R3, R4, R5, R6, R7, R8, R9, R10, R11, R12)
- (b)
-
The set of selected from the Metarules pruning step(R1, R4, R5, R6, R8) with R4,R5 and R8 covering the same dataand R6 include in R8
- (c)
-
The final box measures: coverage, density, support, dimensionEx: R1 (coverage=78%, density= 100%, support=26%, dimension=2)
- (d)
-
The final model metrics: accuracy, precision, recall, f1-scoreAccuracy=96.7%; Precision=95%; Recall=100%; F1 Score=97.4%
As illustrated by this simple example, R-PRIM-Cl offers at each step the possibility to evaluate the boxes and reconsider them depending on the experts and the domain knowledge. By having perfect recall and high precision, in particular, the model's metrics show that it is operating at a high level and making accurate and comprehensive predictions. The model shows promise for applications needing both sensitivity and accuracy because of its balance between recall and precision, as evidenced by its high F1 score.
4. Results
The Random Forest, XG-Boost, and Logistic Regression algorithms are compared with the recently introduced Random PRIM Classifier in this section. Based on different scores, seven renowned datasets are subjected to the four algorithms' application. In this section the dataset is described, the methods for tuning and estimating the different models are detailed, and the empirical evaluation results are presented.
4.1. Empirical Setting
Since PRIM works on categorical and numeric attributes, the benchmark datasets used in the comparison have for some of them only categorical attributes and others only numeric. The seven datasets used in the test are:
- o Congressional Voting dataset (Vote)
- o Mushroom Dataset (Mush)
- o Breast Cancer Dataset (Cancer)
- o SPECT heart dataset (Heart)
- o Tic-Tac-Toe Endgame dataset (TicTac)
- o Pima Diabetes Dataset (Diabetes)
- o German Credit Card Dataset (Credit)
The seven datasets were obtained from the UC Irvine repository [32]. All the datasets have binary target variables that were codes as 0 or 1. In Table 3 we find the characteristics of each dataset with the number of instances, the number of attributes, the class labels and the class distribution. As seen bellow, the diversity of the datasets in the class distribution and dimensionality is essential to draw an accurate performance of R-PRIM-CL.
4.2. Results
Table 4 and Table 5 summarize the results of the empirical comparison they display the datasets and four scores that are measured for the classifiers produced by Random Forest, XG-Boost, Logistic Regression and R-PRIM-Cl. The precision tells us how many of the positive predictions are true, the recall gauges how well the model can identify every positive case, and the f1 score is the harmonic mean of recall and precision that balances the trade-off between the two. The three reflect the importance of classifying positive examples. The most popular metric in machine learning is accuracy, which compares the number of true positives and true negatives to the total number of predictions to determine how accurate the model is. In this section, Table 4 displays the recall and the precision, and Table 5 shows the accuracy and the f1 score.
In the tables, the highest scores are highlighted. As seen in Table 4
The recall, precision, F1 score, accuracy, and evaluation of the R-PRIM-Cl algorithm across multiple datasets in Table 4 and Table 5 show that it performs consistently well, frequently surpassing or closely matching other industry-leading algorithms such as Random Forest (RF), XGBoost (XGB), and Logistic Regression (LG). R-PRIM-Cl performs well in terms of recall, especially when it comes to datasets like Cancer, Heart, and Credit, where it attains the highest recall, proving that it is efficient in detecting true positive cases without overlooking pertinent cases. According to precision results, R-PRIM-Cl frequently has fewer false positives than other models and is very accurate in its positive predictions. This is especially true in datasets like Cancer, Diabetes, and Credit, which are crucial when the cost of false positives is high. The robust performance of R-PRIM-Cl is further highlighted by the F1 score, which strikes a balance between recall and precision. It consistently manages false positives and false negatives with effectiveness, and it excels in the Cancer and Heart datasets in particular. Figure 5 offers a visualization of the performances of the four algorithms on the seven datasets for each measure, having Figure 5(a) for the accuracy, Figure 5(b) for the recall, Figure 5(c) for the precision and Figure 5(d) for the f1 score.
Overall efficacy of R-PRIM-Cl is validated by accuracy results, which show that it can make accurate classifications in a wide range of datasets, consistently obtaining top or near-top scores. Its performance is particularly impressive on complicated datasets like Cancer, Heart, and Credit, where it considerably outperforms other models, indicating that it is a good fit for difficult classification tasks. R-PRIM-Cl is a strong and adaptable classification model that can maintain performance across a variety of data types and guarantee balanced, accurate predictions. These high levels of recall, precision, F1 score, and accuracy highlight this strength. Its general stability in these metrics confirms its robustness and adaptability in a variety of scenarios, making it a great option for applications that need both sensitivity and precision.
The experimentation was conducted using the prim package on python. The execution machine was a CORE i5 8th Gen with 16GB of RAM, running Windows 11. Random Forest, XG-Boost and Logistic Regression were applied on Orange [33], which was created by the University of Ljubljana and is available as open-source data mining, machine learning, and visualization software. With the use of widgets and/or Python scripts, it is utilized to create and evaluate machine learning models as well as carry out exploratory data analysis and viewing.
5. Discussion
When R-PRIM-Cl is compared to well-known classification algorithms like Random Forest (RF), XGBoost (XGB), and Logistic Regression (LG), important information about how well it performs on different datasets is revealed. According to the analysis, R-PRIM-Cl frequently outperforms or closely matches the other models in important metrics like recall, precision, F1 score, and accuracy. R-PRIM-Cl is a competitive option for classification tasks because of its robustness and versatility, which are highlighted by its consistent performance across a variety of complex and diverse datasets.
In terms of recall, R-PRIM-Cl frequently achieves the highest scores, especially in datasets like Cancer, Heart, and Credit. This indicates that the model excels in identifying all positive cases without missing any, which is particularly crucial in sensitive applications such as medical diagnosis or risk assessment, where missing true positives could have severe consequences. The model's ability to maintain high recall while balancing precision is a noteworthy advantage over RF and XGB, which, although strong, often show slightly lower recall, particularly in more complex datasets. LG, while occasionally competitive, generally struggles with maintaining high recall, particularly in challenging datasets like Heart, further highlighting R-PRIM-Cl's strength in sensitivity.
Findings on precision highlight the dependability of R-PRIM-Cl even more, especially for datasets where preventing false positives is essential. For instance, in the Cancer, Diabetes, and Credit datasets, R-PRIM-Cl achieves some of the highest precision scores, demonstrating its ability to make accurate positive predictions with minimal false positives. Applications like financial risk assessment and targeted medical treatments, where the cost of false positives is significant, benefit greatly from this feature. R-PRIM-Cl displays a more balanced performance with a stronger overall precision-recall trade-off when compared to RF and XGB, which may have slightly higher false positive rates.
Combining recall and precision, the F1 score demonstrates how well R-PRIM-Cl balances these metrics, particularly in large, complex datasets like Cancer and Heart. A well-rounded performance that skillfully handles false positives and false negatives is demonstrated by the model's consistent high F1 scores. R-PRIM-Cl's dependable F1 performance over a larger range of data complexities emphasizes its versatility and resilience, whereas RF and XGB are competitive and perform well in simpler datasets. R-PRIM-Cl performs better than LG, which indicates that even though LG occasionally displays strong F1 scores, it frequently falls short in situations where recall and precision must be balanced.
The general effectiveness of R-PRIM-Cl's classification is also supported by accuracy results, especially when compared to other models on complex datasets like Cancer, Heart, and Credit. This implies that R-PRIM-Cl preserves a high rate of accurate classifications under a variety of conditions and performs exceptionally well in striking a balance between recall and precision. Even on easier datasets like Mush, where RF and XGB attain near-perfect accuracy, R-PRIM-Cl maintains a competitive edge, proving that it can handle both easy and difficult classification tasks with ease. While LG performs well most of the time, it sometimes falters in the more complicated datasets. This emphasizes R-PRIM-Cl's advantage in terms of general performance maintenance.
All things considered, R-PRIM-Cl performs well on all assessed metrics, indicating that it is a very flexible and trustworthy model for classification application. Particularly well-suited for applications where both sensitivity and specificity are crucial is its capacity to simultaneously maintain high recall and precision. The consistent high F1 scores and accuracy further affirm R-PRIM-Cl's robustness, making it a valuable tool in diverse contexts, from healthcare to finance. These findings show that in scenarios requiring balanced, accurate, and dependable classification performance, R-PRIM-Cl is not only a competitive substitute for well-known algorithms like RF, XGB, and LG, but also the smarter option. To fully realize the potential of R-PRIM-Cl, future research could investigate ways to improve its efficiency and interpretability through further optimization. Additionally, the technique could be applied to a wider range of high-dimensional datasets.
6. Conclusion
In this paper, we presented a new classifier based on the bump hunting technique namely the Patient Rule Induction Method. This classifier chooses randomly numerous feature search spaces, and finds the boxes by having a minimum support, a peeling threshold and pasting thresholding. This search is conducted for each class label, which is binary. Once the search finished, the algorithm goes through the pruning with the Metarules to, both, organize the ruleset and detect overlapping regions. Finally, it ends by performing a 10-fold cross-validation to keep the more general rules based on the coverage, density and support. The remaining boxes are, then, interpretable. The algorithm was tested against popular machine learning algorithms: Random Forest, XG-Boost and Logistic Regression. The performance of the overall R-PRIM-Cl was satisfied even though it lacked precision is some cases.
This experiment opens up new research directions to enhance the algorithm even more. The first one is to establish a sensitivity analysis regarding the number of feature search space it selects. It would be fascinating to investigate if a high number of subspaces is chosen at the expense of the algorithm's interpretability and accuracy, or if it actually improves them. The second direction would be to investigate other pruning techniques. Another one is to study the rule conflict resolution of the algorithm. And the last one is to apply the approach on more datasets, binary and multiclass, to work on the robustness of the algorithm.
Author Contributions
Both authors have contributed equally to the research and writing of this paper.
Funding
This research received no external funding.
Conflicts of Interest
The authors declare no conflicts of interest.
References
- Dixon, M. F., Halperin, I., & Bilokon, P. (2020). Machine learning in finance (Vol. 1170). New York, NY, USA: Springer International Publishing.
- Ahmed, S.; Alshater, M.M.; El Ammari, A.; Hammami, H. Artificial intelligence and machine learning in finance: A bibliometric review. Res. Int. Bus. Finance 2022, 61, 101646. [Google Scholar] [CrossRef]
- Nayyar, A., Gadhavi, L., & Zaman, N. (2021). Machine learning in healthcare: review, opportunities and challenges. Machine Learning and the Internet of Medical Things in Healthcare, 23-45. [CrossRef]
- An, Q., Rahman, S., Zhou, J., & Kang, J. J. (2023). A comprehensive review on machine learning in healthcare industry: classification, restrictions, opportunities and challenges. Sensors, 23(9), 4178. [CrossRef]
- Gao, L., & Guan, L. (2023). Interpretability of machine learning: Recent advances and future prospects. IEEE MultiMedia, 30(4), 105-118. [CrossRef]
- Nassih,R., Berrado,A.,. 2020. State of the art of Fairness, Interpretability and Explainability in Machine Learning: Case of PRIM. In Proceedings of the 13th International Conference on Intelligent Systems: Theories and Applications (SITA'20). Association for Computing Machinery, New York, NY, USA, Article 32, 1–5. [CrossRef]
- Capponi A, Lehalle C-A, eds. Black-Box Model Risk in Finance. In: Machine Learning and Data Sciences for Financial Markets: A Guide to Contemporary Practices. Cambridge University Press; 2023:687-717.
- Imrie, F.; Davis, R.; van der Schaar, M. Multiple stakeholders drive diverse interpretability requirements for machine learning in healthcare. Nat. Mach. Intell. 2023, 5, 824–829. [Google Scholar] [CrossRef]
- Friedman, J.H., Fisher, N.I. Bump hunting in high-dimensional data. Statistics and Computing 9, 123–143 ,1999. [CrossRef]
- Berrado, A.; Runger, G.C. Using metarules to organize and group discovered association rules. Data Min. Knowl. Disc. 2007, 14, 409–431. [Google Scholar] [CrossRef]
- Azmi, M., Runger, G. C., & Berrado, A, 2019. Interpretable regularized class association rules algorithm for classification in a categorical data space. Information Sciences, 483, 313-331. [CrossRef]
- Maissae, H., & Abdelaziz, B. (2024). Forest-ORE: Mining Optimal Rule Ensemble to interpret Random Forest models. arXiv preprint arXiv:2403.17588. arXiv:2403.17588.
- Maissae, H., & Abdelaziz, B. (2022). A novel approach for discretizing continuous attributes based on tree ensemble and moment matching optimization. International Journal of Data Science and Analytics, 14(1), 45-63. [CrossRef]
- Azmi, M., & Berrado, A. (2021). CARs-RP: Lasso-based class association rules pruning. International Journal of Business Intelligence and Data Mining, 18(2), 197-217. [CrossRef]
- Dazard, J.E.; Rao, J.S. Local Sparse Bump Hunting. J. Comput. Graph. Stat. 2010, 19, 900–929. [Google Scholar] [CrossRef] [PubMed]
- Polonik, W.; Wang, Z. PRIM analysis. J. Multivar. Anal. 2010, 101, 525–540. [Google Scholar] [CrossRef]
- Dyson, G. An application of the Patient Rule-Induction Method to detect clinically meaningful subgroups from failed phase III clinical trials. Int. J. Clin. Biostat. Biom. 2021, 7, 038. [Google Scholar] [CrossRef]
- Yang, J.K.; Lee, D.H. Optimization of mean and standard deviation of multiple responses using patient rule induction method. Int. J. Data Warehous. Min. 2018, 14, 60–74. [Google Scholar] [CrossRef]
- Lee, D.H.; Yang, J.K.; Kim, K.J. Multiresponse optimization of a multistage manufacturing process using a patient rule induction method. Qual. Reliab. Eng. Int. 2020, 36, 1982–2002. [Google Scholar] [CrossRef]
- Dyson, G. An application of the Patient Rule-Induction Method to detect clinically meaningful subgroups from failed phase III clinical trials. Int. J. Clin. Biostat. Biom. 2021, 7. [Google Scholar] [CrossRef]
- Kaveh, A.; Hamze-Ziabari, S.M.; Bakhshpoori, T. Soft computing-based slope stability assessment: A comparative study. Geomech. Eng. 2018, 14, 257–269. [Google Scholar]
- Nassih, R.; Berrado, A. Potential for PRIM based classification: a literature review. In Proc. Third Eur. Int. Conf. Ind. Eng. Oper. Manag., Pilsen, Czech Republic, 2019, 7.
- Nassih, R.; Berrado, A. Towards a patient rule induction method based classifier. In Proc. 2019 1st Int. Conf. Smart Syst. Data Sci. (ICSSD); IEEE, 2019, 1-5.
- Breiman,L. Random forests, Mach. Learn. 45 (1) (2001) 5–32. [CrossRef]
- Biau, G., Scornet, E. A random forest guided tour. TEST 25, 197–227 (2016). [CrossRef]
- Chen, T., & Guestrin, C. (2016). XGBoost: A Scalable Tree Boosting System. In Proceedings of the 22nd ACM SIGKDD International Conference on Knowledge Discovery and Data Mining (pp. 785-794).
- Qiu, Y., Zhou, J., Khandelwal, M., Yang, H., Yang, P., & Li, C. (2022). Performance evaluation of hybrid WOA-XGBoost, GWO-XGBoost and BO-XGBoost models to predict blast-induced ground vibration. Engineering with Computers, 38(Suppl 5), 4145-4162. [CrossRef]
- Cox, D. R. (1958). The Regression Analysis of Binary Sequences. Journal of the Royal Statistical Society: Series B (Methodological), 20(2), 215-242.
- Breiman, L., Friedman, J. H., Olshen, R. A., & Stone, C. J. (1984). Classification and Regression Trees. Belmont, CA: Wadsworth International Group.
- Bellman, R. E. (1961). Adaptive Control Processes: A Guided Tour. Princeton University Press. [CrossRef]
- Liu, B., Hsu, W., & Ma, Y. (1998). Integrating Classification and Association Rule Mining. Proceedings of the Fourth International Conference on Knowledge Discovery and Data Mining (KDD), 80-86.
- C.L. Blake, C.J. Merz, Uci repository of machine learning databases [ http://www.ics.uci.edu/ ∼mlearn/mlrepository.html ]. irvine, ca: University of california, Department of Information and Computer Science 55 (1998).
- J. Demšar, T. Curk, A. Erjavec, Č. Gorup, T. Hočevar, M. Milutinović, M. Možina, M. Polajnar, M. Toplak, A. Starič, M. Štajdohar, J. Umek, L. Zupančič, L. Žagar, T. Žbontar, M. Kravanja, M. Kale, and B. Zupan. (2013). Orange: Data Mining Toolbox in Python. Journal of Machine Learning Research, 14, 2349-2353.
Figure 1.
Illustration of the top-down peeling phase to find one box.
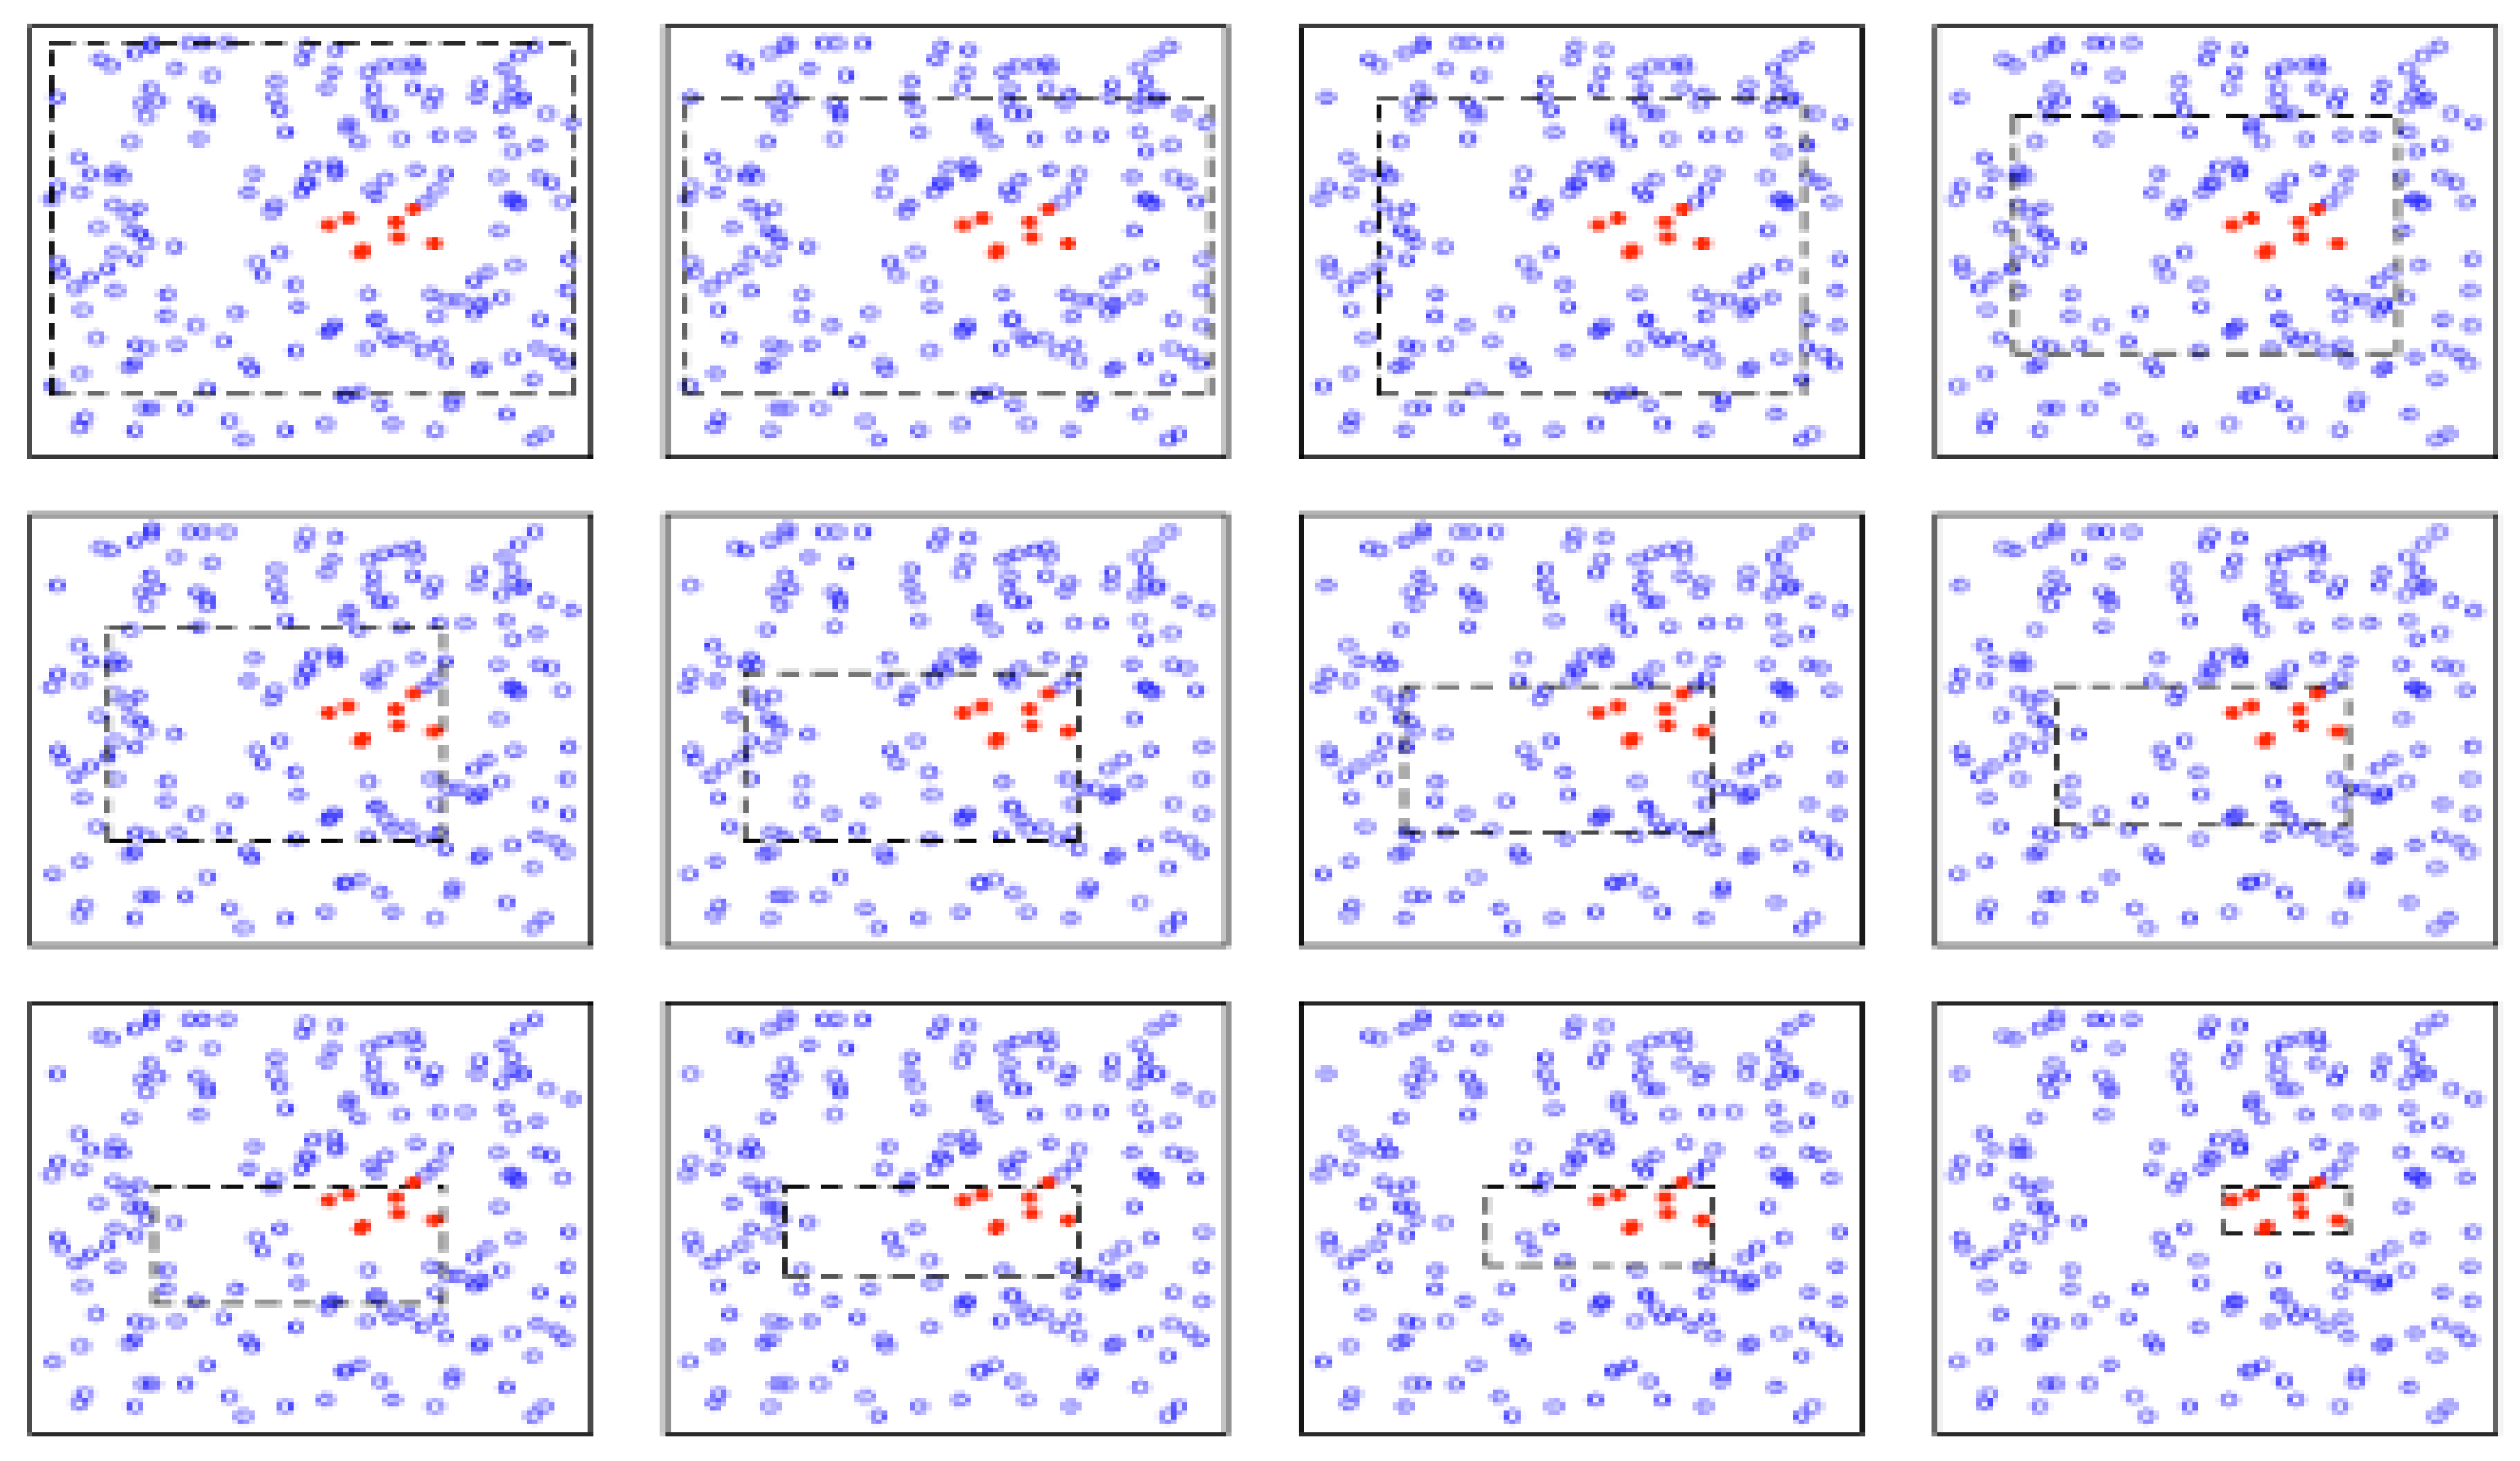
Figure 2.
Example of a numeric box.
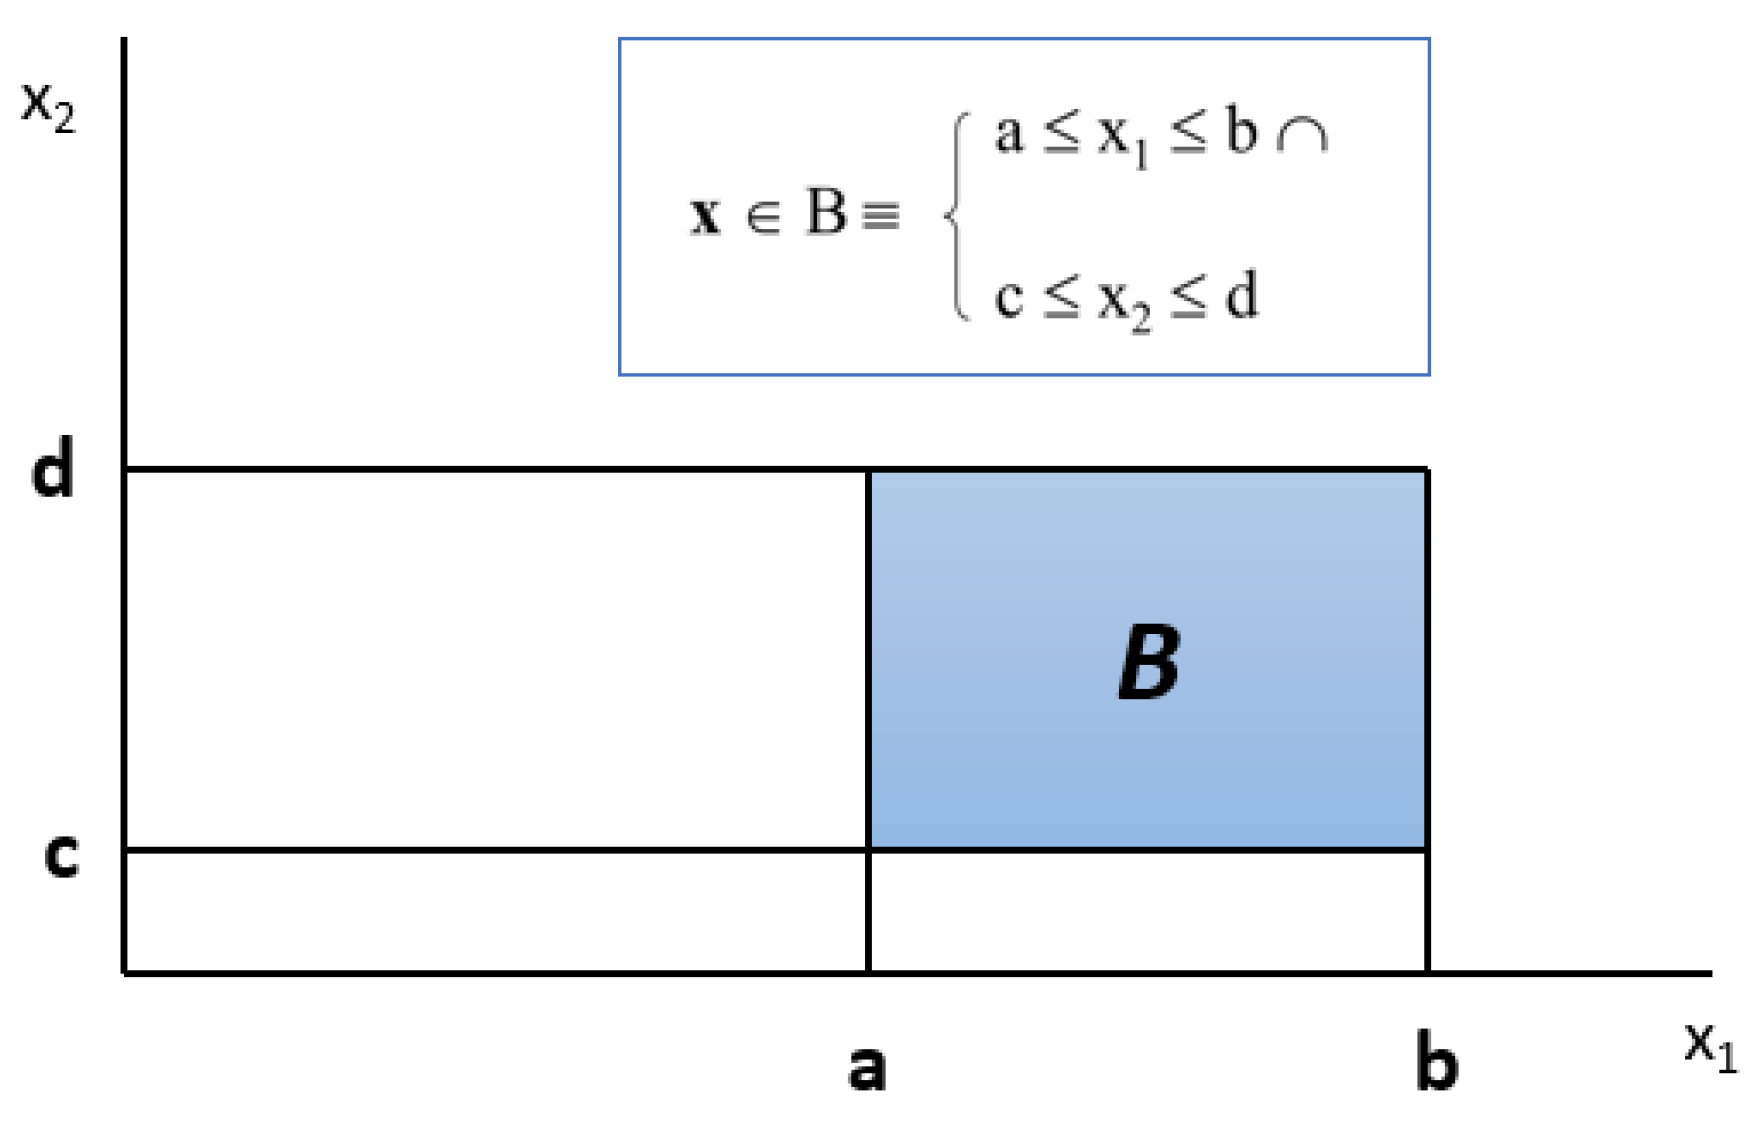
Figure 3.
Example of a categorical box.
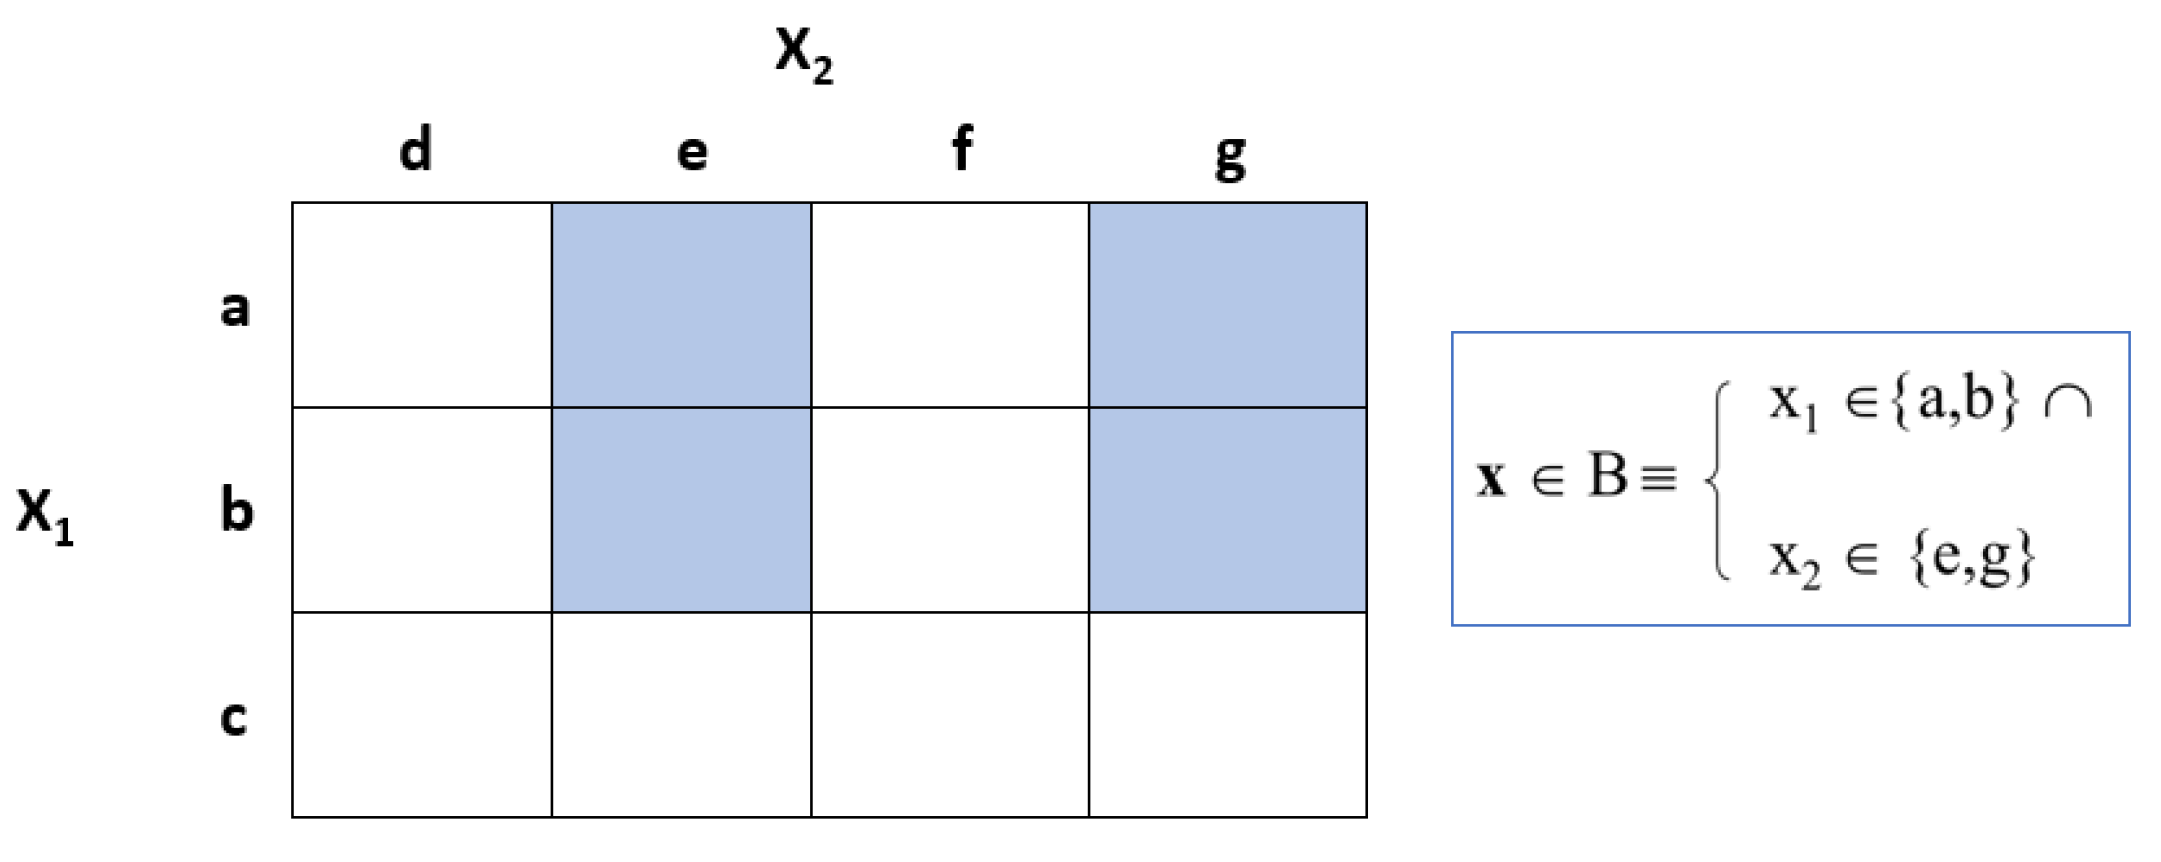
Figure 4.
An illustration of the organization of rules in the ruleset using metarules. (a) Display of the Ruleset without the organization. (b): Illustration of the new organized ruleset with association between R6-R7, R1-R4 and R5-R3. The one-way relationship between R4 and R1 shows that R4 is more specific than R1.
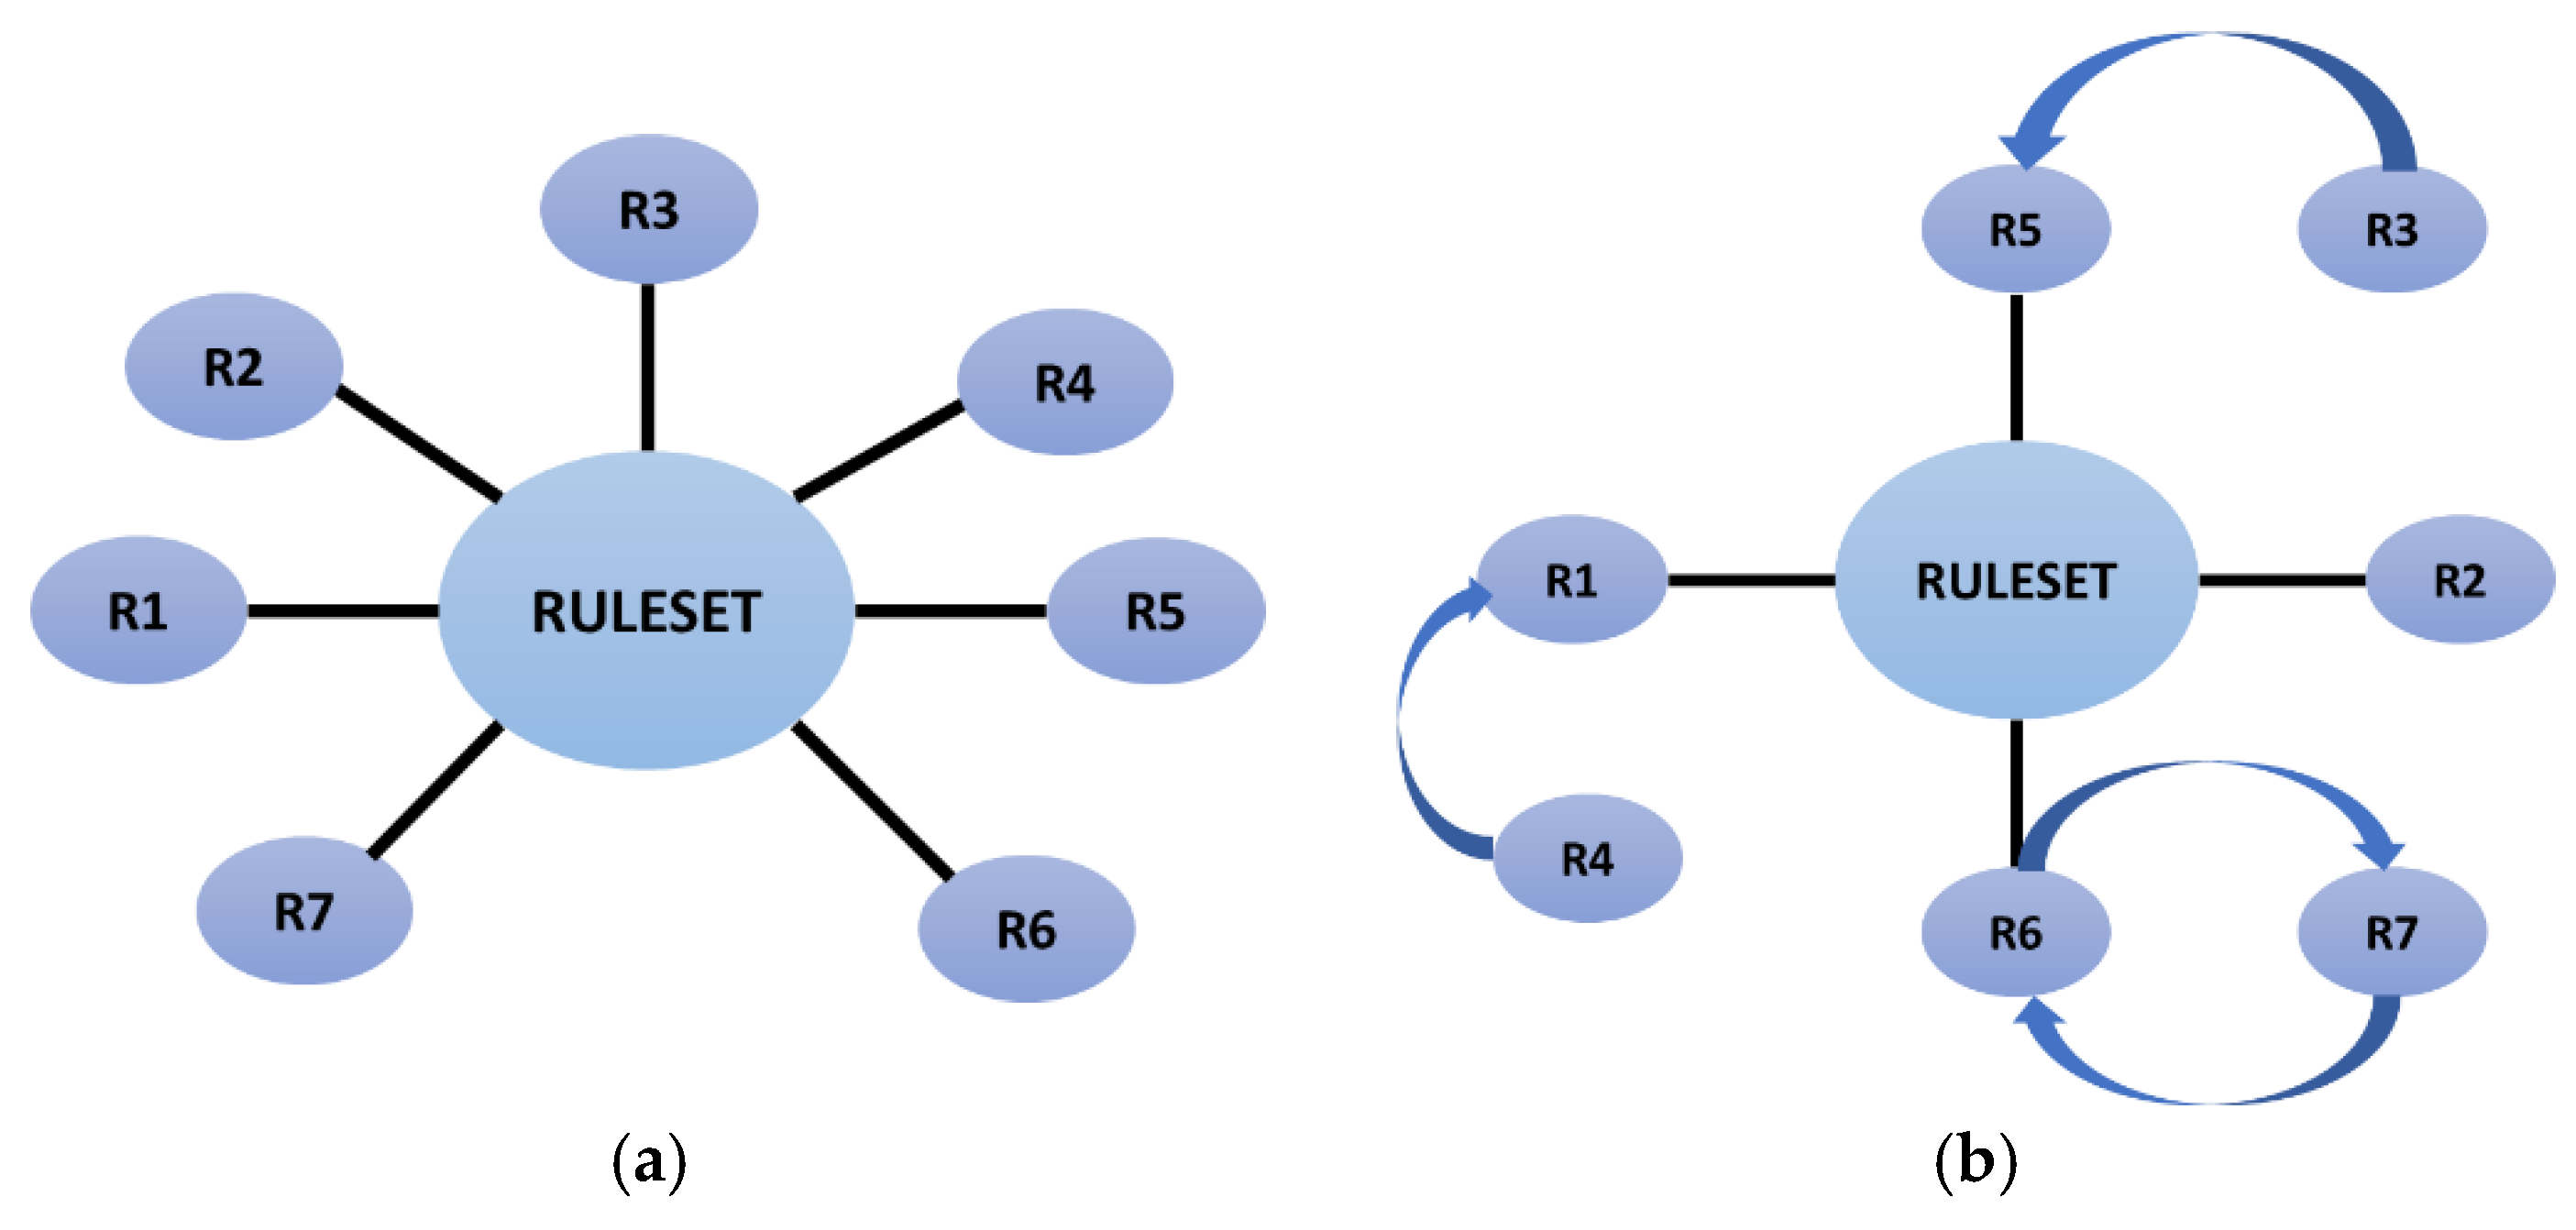
Figure 5.
Visualization of the four measures obtained in the experiment: (a)Accuracy of each model; (b)Recall of each model; (c)Precision of each model; (d)F1-Score of each model.
Figure 5.
Visualization of the four measures obtained in the experiment: (a)Accuracy of each model; (b)Recall of each model; (c)Precision of each model; (d)F1-Score of each model.
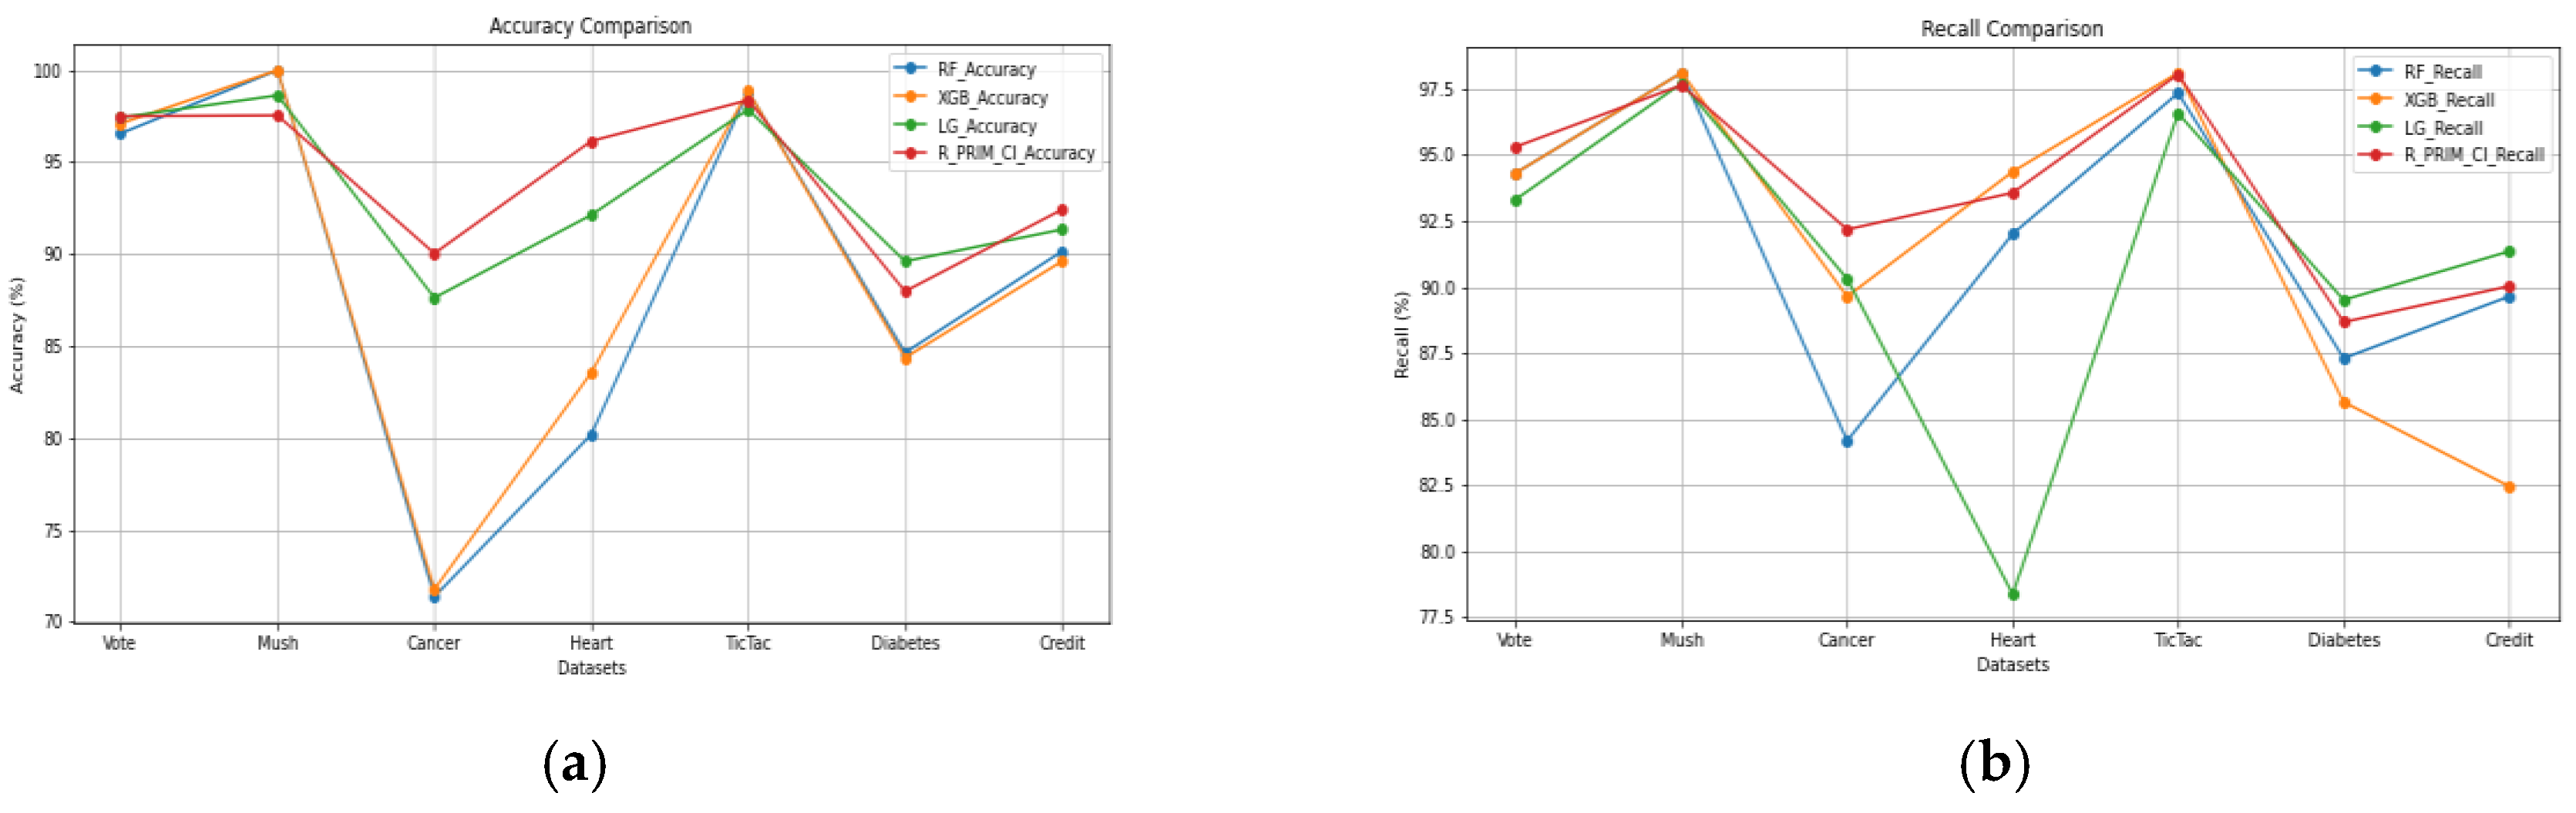
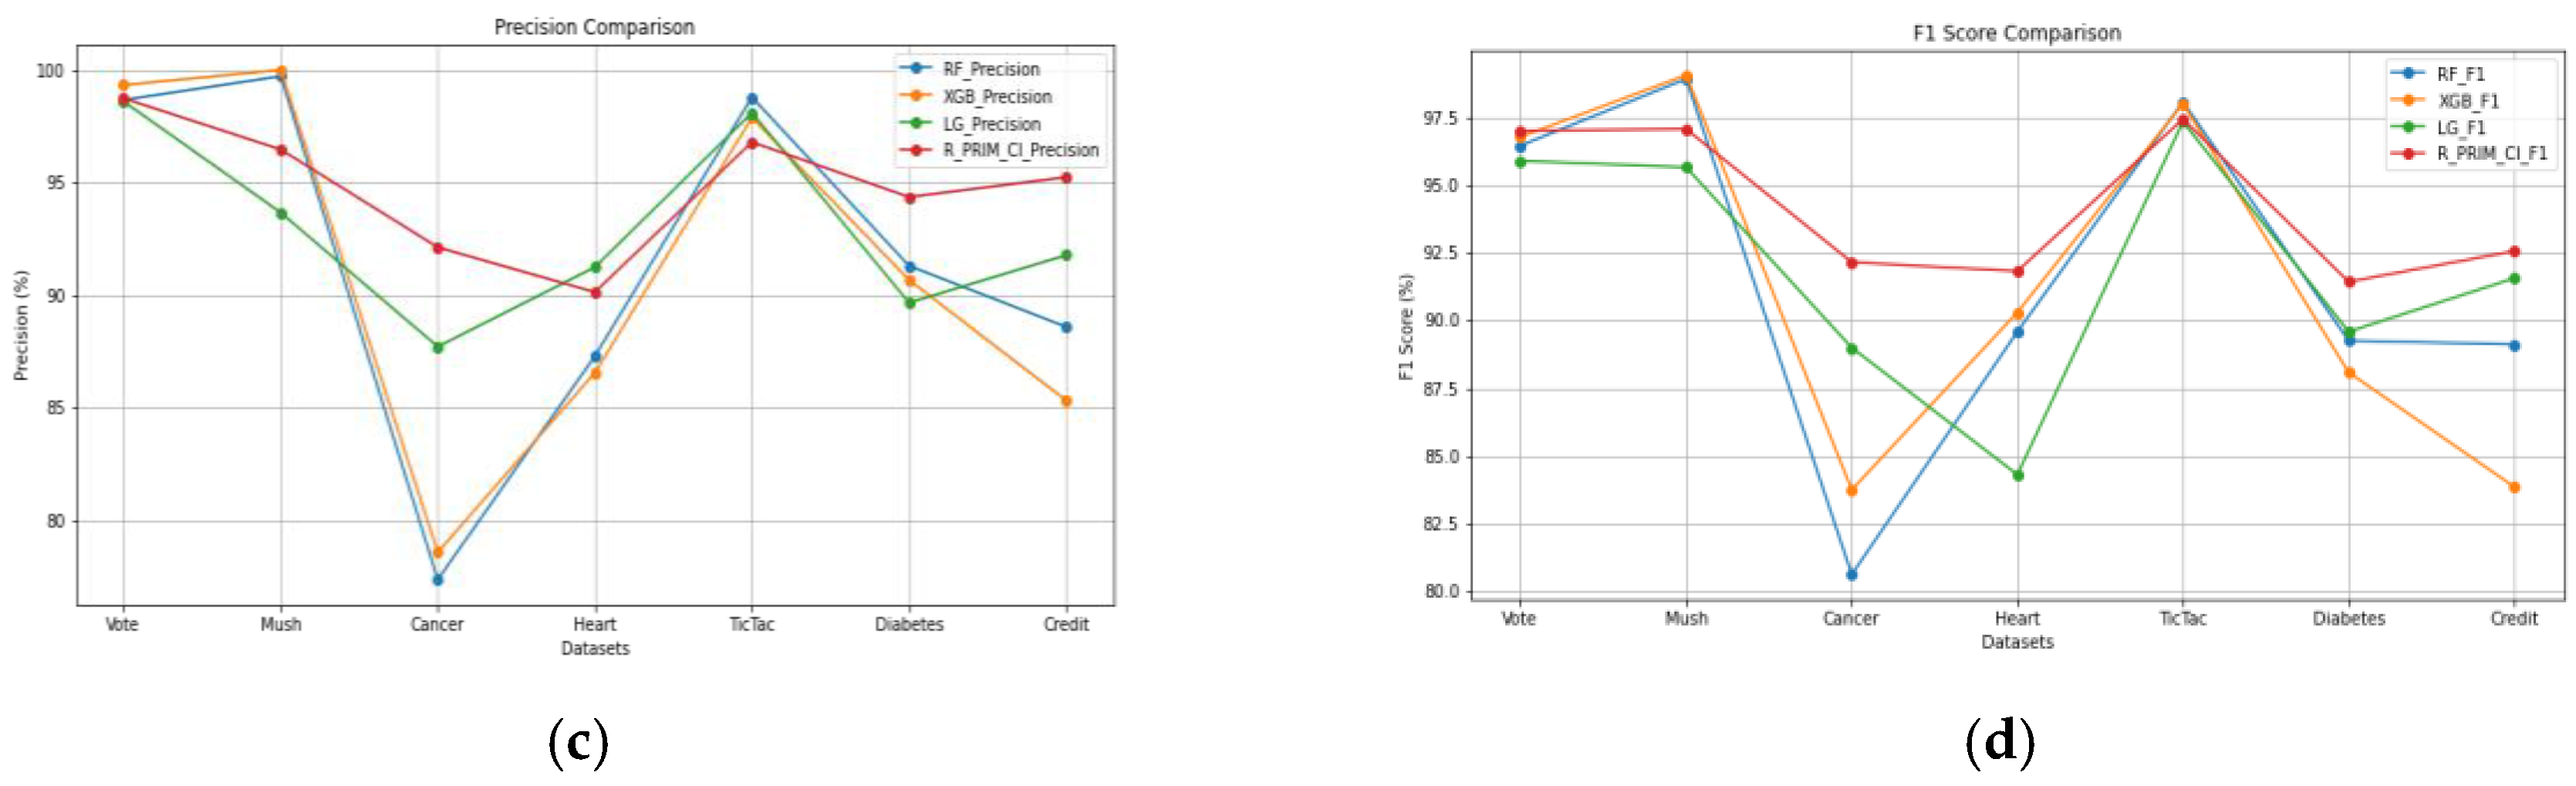

Table 1.
The boxes generated by R-PRIM-CL before pruning and selecting.
| Index | Box | coverage | density | res dim | mass |
|---|---|---|---|---|---|
| R1 | 4.3 < sepal length (cm) < 5.35 AND 2.95 < sepal width (cm) < 4.4 | 0.78 | 1.00 | 2 | 0.26 |
| R2 | 4.3 < sepal length (cm) < 5.45 AND 2.15 < sepal width (cm) < 4.4 | 0.15 | 0.50 | 2 | 0.10 |
| R3 | 3.349 < sepal width (cm) < 4.4 | 0.08 | 0.38 | 1 | 0.07 |
| R4 | 4.3 < sepal length (cm) < 5.95 AND 0.1 < petal width (cm) < 0.8 | 1.00 | 1.00 | 2 | 0.33 |
| R5 | 1.0 < petal length (cm) < 3.75 AND 0.1 < petal width (cm) < 0.8 | 1.00 | 1.00 | 2 | 0,33 |
| R6 | 1.0 < petal length (cm) < 1.79 | 0.95 | 1.00 | 1 | 0,32 |
| R7 | 3.25 < sepal width (cm) < 4.4 AND 1.0 < petal length (cm) < 6.05 | 0.05 | 0.25 | 2 | 0.07 |
| R8 | 1.0 < petal length (cm) < 3.75 AND 0.1 < petal width (cm) < 0.8 | 1.00 | 1.00 | 2 | 0.33 |
| R9 | 4.3 < sepal length (cm) < 7.35 AND 0.1 < petal width (cm) < 2.25 | 0,90 | 0,35 | 2 | 0,86 |
| R10 | 3.05 < sepal width (cm) < 4.05 AND 1.35 < petal length (cm) < 5.85 | 0,45 | 0,49 | 2 | 0,31 |
| R11 | 4.3 < sepal length (cm) < 7.80 AND 3.05 < sepal width (cm) < 4.05 AND 1.35 < petal length (cm) < 6.9 AND 0.1 < petal width (cm) < 2.25 | 0,40 | 0,52 | 4 | 0,26 |
| R12 | 6.55 < sepal length (cm) < 7.80 AND 2.15 < petal width (cm) < 2.5 | 0,10 | 0,44 | 2 | 0,08 |
Table 2.
The final boxes retained for the classifier.
| Index | Box | coverage | density | res dim | mass |
| (R4,R5,R8) | 4.3 < sepal length (cm) < 5.95 AND 0.1 < petal width (cm) < 0.8 AND 1.0 < petal length (cm) < 3.75 | 1.00 | 1.00 | 3 | 0.33 |
| R6 | 1.0 < petal length (cm) < 1.79 | 0.95 | 1.00 | 1 | 0,32 |
| R1 | 4.3 < sepal length (cm) < 5.35 AND 2.95 < sepal width (cm) < 4.4 | 0.78 | 1.00 | 2 | 0.26 |
Table 3.
Major properties of the datasets selected for the experimentation.
| Datasets | Nb of instances | Nb of attributes | Class labels | Class distribution |
|---|---|---|---|---|
| Vote | 232 | 16 | democrat: 0 republican:1 |
142 90 |
| Mush | 8124 | 22 | e: 0 p: 1 |
4208 3916 |
| Cancer | 286 | 9 | No recurrent: 0 Recurrent: 1 |
201 85 |
| Heart | 267 | 2 | 0 1 |
55 212 |
| TicTac | 958 | 9 | Negative: 1 Positive: 0 |
332 626 |
| Diabetes |
768 | 8 | Yes: 1 No: 0 |
269 499 |
| Credit | 1000 | 10 | Bad: 1 Good: 0 |
300 700 |
Table 4.
Results of the Recall and Precision of every algorithm on the seven datasets in %.
| Recall | Precision | |||||||
|---|---|---|---|---|---|---|---|---|
| Datasets | RF | XGB | LG | R-PRIM-Cl | RF | XGB | LG | R-PRIM-Cl |
| Vote | 94.33 | 94.33 | 93.33 | 95.32 | 98.67 | 99.33 | 98.60 | 98.74 |
| Mush | 98.12 | 98.12 | 97.72 | 97.65 | 99.72 | 100.00 | 93.67 | 96.47 |
| Cancer | 84.17 | 89.64 | 90.31 | 92.18 | 77.39 | 78.60 | 87.72 | 92.13 |
| Heart | 92.01 | 94.37 | 78.36 | 93.57 | 87.30 | 86.57 | 91.25 | 90.14 |
| TicTac | 97.35 | 98.12 | 96.58 | 98.06 | 98.79 | 97.88 | 98.10 | 96.80 |
| Diabetes | 87.30 | 85.64 | 89.51 | 88.67 | 91.31 | 90.68 | 89.67 | 94.36 |
| Credit | 89.64 | 82.45 | 91.35 | 90.03 | 88.60 | 85.34 | 91.78 | 95.24 |
Table 5.
Results of the F1 score and Accuracy of every algorithm on the seven datasets in %.
| F1 score | Accuracy | |||||||
|---|---|---|---|---|---|---|---|---|
| Datasets | RF | XGB | LG | R-PRIM-Cl | RF | XGB | LG | R-PRIM-Cl |
| Vote | 96.45 | 96.77 | 95.89 | 97.00 | 96.56 | 97.10 | 97.43 | 97.40 |
| Mush | 98.91 | 99.05 | 95.65 | 97.06 | 100.00 | 100.00 | 98.63 | 97.54 |
| Cancer | 80.64 | 83.76 | 89.00 | 92.15 | 71.38 | 71.78 | 87.63 | 90.04 |
| Heart | 89.59 | 90.30 | 84.32 | 91.82 | 80.20 | 83.56 | 92.13 | 96.15 |
| TicTac | 98.06 | 98.00 | 97.33 | 97.43 | 98.85 | 98.87 | 97.86 | 98.37 |
| Diabetes | 89.26 | 88.09 | 89.59 | 91.43 | 84.65 | 84.37 | 89.61 | 87.98 |
| Credit | 89.12 | 83.87 | 91.56 | 92.56 | 90.15 | 89.61 | 91.34 | 92.42 |
Disclaimer/Publisher’s Note: The statements, opinions and data contained in all publications are solely those of the individual author(s) and contributor(s) and not of MDPI and/or the editor(s). MDPI and/or the editor(s) disclaim responsibility for any injury to people or property resulting from any ideas, methods, instructions or products referred to in the content. |
© 2024 by the authors. Licensee MDPI, Basel, Switzerland. This article is an open access article distributed under the terms and conditions of the Creative Commons Attribution (CC BY) license (http://creativecommons.org/licenses/by/4.0/).
Copyright: This open access article is published under a Creative Commons CC BY 4.0 license, which permit the free download, distribution, and reuse, provided that the author and preprint are cited in any reuse.


