

Submitted:
27 September 2024
Posted:
30 September 2024
You are already at the latest version
Abstract
The consistent recognition of both explicit short term and implicit long term elements of post-retirement contracts between employees and the firm can have a significant implication for estimating a firms long term sustainable cost of capital. In this paper, we show that the significant levels of investment in company own stock by pension and post-retirement plans can effectively dilute the interest of pre-existing shareholders in the enterprise value of corporations in ways which are not revealed by a classic entity theory perspective on equity. We test the empirical implications of adopting a pre-existing shareholder model of the reporting entity to re-examine the relationship between a firm’s sustainable cost of capital and various sources of idiosyncratic risk. We find that the estimated cost of capital is sensitive to: (a) alternative explicit versus implicit definitions of pension liability; (b) the nature and scope of long-term deferred compensation arrangements; and (c) the scope and nature of investment-related risks through investment in sponsoring company stock that are associated with these pension arrangements.
Keywords:
pension plans
; cost of capital
; enterprise value
1. Introduction
Understanding the financial dimensions and long term sustainability of relations between firms and their employees is increasingly recognized by public policy makers and standard setters. Human capital is the measure of the economic value that an employee provides, through their knowledge, skills, and abilities 1. However an important implication of reporting the full financial dimensions of these relations under a sustainability reporting framework is their implications for the economic scope of the consolidation, and the sensitivity of the cost of capital estimates to alternative definitions of the scope of the reporting entity (Callahan et al., 2012). However, despite the material impact of corporate failure on implicit contractual promises made to employees (Tinker and Ghicas, 1992), the broader dilution impact of divestitures and investments in implicit contracts on outsider investor interests has received little attention (Zambon and Zen, 2000). Yet despite the material impact of corporate failure on implicit contractual promises made to employees e.g Tinker and Ghicas (1992); the broader dilution impact of divestitures and investments in implicit contracts on employee wealth on outsider investor interests has received little attention! Landsman and Penman demonstrate that, under the existing entity theory of accounting, diverstitures and investments by corporations in employer own stock investments by employee stock options, pension funds and other post-retirement investments are not recorded. By contrast, under an alternative proprietorship theory perspective, passive individual investors collectively control management by holding them accountable for profit, where debt and equity are sharply antagonistic, so that the ‘buseiness does not stand in the sme relation to its proprietors or its capitalists as to its ‘other liabilities’ (Sprague, 1907, 57).
However, such divestitures as part of equity consideration are currently not fully accounted for (Forker, 2000). Indeed recently the Urgent Issues Task Force (guidance 38) proposed that the outside equity diluting effects of all divestitures in company stock should be fully accounted for and that all employee related benefits with significant levels of own company stock investments should be deducted in calculating shareholder equity. Nevertheless current US GAAP and IFRS continue to apply the entity theory perspective; so that such transactions are ignored.
We thus define a ‘sustainable’ cost of capital as existing where relevant entities have sufficient finance when needed to make it possible to maintain long-term, demographically-sensitive and implicit contractual relations with their employees, at their current quality and intensity. This is to be contrasted with a standard procedure which accounts for neither the long-term nature of the relationship nor the equity diluting effect of employee ownership of company own stock. The purpose of this paper is to take a proprietary theory to estimate the diluting impact of significant and material investments and divestitures of company own stock by employee pension and post-retirement and stock ownership trusts in the equity of US firms, and to consider their implications for estimating a long-term sustainable cost of capital for such entities. Forker (2000) argues that a distinguishing feature of the alternative pre-existing equity model of the reporting entity (hereinafter ‘PEEM’) is that the interests of pre-existing shareholders is identified with that of the business entity 2.
Existing evidence suggests that the PEEM is more informative than the EM to investors evaluating employee stock options. Landsman et al. (2006) show that employee stock options measured under the PEEM are more value relevant to investors than under existing US GAAP, which implicitly assumes the EM. However, their study is restricted to only examining short-term equity-based compensation and therefore does not consider the valuation implications of longer-term employee compensation arrangements. Current US GAAP and IFRS treat these elements separately by expensing the former, but not the latter. Arguably this has led to an overstatement of profits and incentives for management to manipulate earnings (Picconi, 2007).
This inconsistent treatment of equity-based employee compensation does not adhere to the principles of clean surplus accounting and instead proposes the pre-existing equity model (Forker, 2000). This also has important implications for analyzing the impact of firm-specific risks related to long term employment compensation arrangements and the sponsoring firms’ cost of capital. Although finance theory suggests that only non-diversifiable risks are awarded and firms’ idiosyncratic risks do not affect investors’ expected returns or firms’ cost of capital, there is growing evidence concerning the impact of idiosyncratic risk in explaining cross-sectional expected returns (e.g., Malkiel and Xu, 2002; Spiegel and Wang, 2005; Fu, 2009; Brockman et al., 2009). Practitioner-oriented textbooks (e.g., Brealey et al. 2006; Pratt and Grabowski, 2010) also argue that investors concerns about lack of diversification, insider stock ownership, liquidity, financial distress, and management incentives cause stock markets to price firm-specific risk.
However, the existing literature provides little guidance as to how such factors can affect firms’ cost of capital. In this paper, we explore the effect of firm specific risks, in particular pension related risks, on firms’ cost of capital from a PEEM perspective. This is important where employees hold material investment in companies’ own stocks, whether explicitly in the form of stock options, or implicitly through the delegated ownership of company stock through participation in company sponsored 401K, investment trusts, health care plans or defined benefit plans due to lack of diversification or liquidity 3. Research shows that this kind of idiosyncratic risk has impact on firms’ cost of capital. For example, Himmelberg et al. (2002) find a positive association between the concentration of inside ownership and the cost of capital, even in countries with relatively high degrees of investor protection such as the UK and the US 4.
During the financial crisis of 2007-2009, the combination of declining stock prices and lower interest rates has attracted substantial attention on the nature and magnitude of firms’ exposure to pension fund commitments to their employees, and in particular the declining significance of defined benefit pension funds relative to non-defined pension and post-retirement benefits 5. At the same time, financial markets experience difficulties in valuing even just the defined benefit pension promises made by firms. Coronado and Sharpe (2003, 2008) find that stock prices of S&P 500 companies providing defined benefit pension plans were generally misvalued over their sample periods, while others (Picconi, 2006, Hann et al., 2007, Franzoni and Marin, 2005) suggest that opaque accounting has caused firms to be undervalued relative to overfunded pension plans. In contrast, Jin et al. (2006, hereinafter, JMB) find that pension risk is priced despite arcane financial reporting for pensions. They assume that pension risk is entirely reflected in the systematic risk of pension plan sponsoring firms (as measured by beta from the capital asset pricing model (CAPM)), although they acknowledge examining the broader relation of pension risk to ‘idiosyncratic risk, or total risk may be of interest’ (p2).
In this paper, we extend JMB’s research in several ways besides integrating the extended pension arrangements into the firm. First, we re-estimate the cost of capital, by using more detailed pension asset allocation decomposition than that reported in JMB, as well as data on longevity risk and credit risk, using data drawn from annually published industry sources. We also further decompose the pension liability beta to reflect the underlying demographics of the maturity profile of the scheme liabilities. These can be important since simulation studies show that pension assets and liabilities are extremely sensitive to even minor variations in these assumptions (Selling and Stickney, 1986; Winkelvoss, 1997). Thus, our definition of operating assets is more explicit than JMB, and consistent with that of the prior empirical results reported in the relevant financial analysis literature 6.
We disentangle the proportion of ‘enterprise value’ belonging to the firms’ sub-group of external, diversified stockholders from its separate sub-group of mostly undiversified, employee stockholders. On the one hand, equity interests of outside investors may be severely diluted by employees who hold company stocks; on the other hand, employees are undiversified investors and expose themselves to firm-specific risk through participation in 401K plans. For the purposes of presentation, we term any post-retirement benefit arrangement other than defined benefits plans (DB), including 401K plans, defined contribution plans, health care plans, stock option plans, and saving plans, which involve significant or material investment in company own stock by employee participants in these schemes, who thereby become undiversified investors, the combined impact of which is labeled ‘NDB’-related plans for simplicity. NDB plans are thus a significant source of pension-related sources of idiosyncratic risk of the sponsoring firm and can be very significant for firms that curtail their DB plans, as disclosed in the pension footnotes.
While JMB identify the value and risk errors of not consolidating the DB plans, our analysis develops this insight further by integrating NDB plans, as forms of idiosyncratic risk which affect the equity claims of existing shareholders. We characterize these NDB and DB arrangements as either as segregated insurance contracts or as fully consolidated sources of retirement income risk capital. These alternative treatments have important debt-equity mix implications since these exposures can either be fully merged with the firm as an insurance subsidiary or consolidated into the firm as an equity ‘company own stock’ investment activity by undiversified NDB plans, thus effectively diluting the interests of outside equity holders.
We estimate the cost of capital for a sample of US S&P 500 firms under various scenarios where change in pension Generally Accepted Accounting Principles (GAAP) can occur. We find that the estimated cost of capital is sensitive to: (a) alternative pension GAAP; (b) whether a firm’s pension exposure is classified primarily as a debt or equity instrument; and (c) the scope and nature of the pension plans being consolidated with the firm. Consolidating the defined benefit pension fund into the broader set of deferred compensation arrangements between employees and the firm significantly and materially alters the debt and equity composition of the firm. This results in significantly higher cost of capital estimates than those reported by JMB. In contrast to JMB, we find that the relationship between firm systematic risk and pension risk is not statistically significant. We also find that identifying the value and risk associated with a broader set of deferred compensation arrangements, such as underfunded health care plans and company owned stock investments of 401K and defined contribution plans, increases the strength of association with firm risk, particularly for the sub-set of firms which terminated their defined benefit arrangements 7. Finally, we also find that the cross-section of returns is explained incrementally by the degree of idiosyncratic risk exposure, especially for firms with significant levels of pension under-funding.
2. The Model
In the PEEM, the full cost of equity-based consideration payable to employees is recognized as an expense irrespective of whether it is funded by cash or equity or a mixture of the two. Thus, compared to existing GAAP practices in accordance with EM, periodic income and return on capital employed is lower in the PEEM and reflects the change in the wealth of pre-existing shareholders in the firm.
A major motivation for our analysis is our doubts over the validity of the EM as a valid basis for recognizing long term implicit equity-based employee compensation components, which is the maintained assumption underlying prior research. This study therefore reexamines the JMB analysis of the relationship of pension value and risk to firm systematic risk that is premised on the EM, with the PEEM. This in turn has implications for identifying the appropriate measure of pension obligations that should be recognized by employer sponsors (i.e; accumulated benefit obligation, projected benefit obligation, and economic benefit obligation) under these alternative models of the reporting entity, which we discuss below.
(i) Accumulated benefit obligation (ABO). The pension liability is estimated without incorporating any assumptions about the future growth of the obligations defined in terms of accrued benefit obligations. It was formerly required under US GAAP SFAS 87 before the introduction of SFAS 157. It is also consistent with an all-equities model (hereinafter AEM), since changes are netted as a surplus or deficit and no distinction is made between debt and equity components of pension arrangements. It was previously required to be recognized in financial statements, but only if underfunded. In other words, firms were not required to report the full ABO prior to 2006. In measuring pension risk, JMB use the Form 5500 pension asset categorization to identify pension asset risk and acknowledge that they are only able to use the average risk level for each broader asset class. We consider the allocation of pension assets at a more detailed level than reported under the Form 5500 data. The detailed pension asset allocation data is expected to lead to higher accuracy in estimating pension asset beta 8.
(ii) Projected benefit obligation (PBO). This pension liability incorporates allowances for growth, as set out under new pension accounting rules SFAS 158, effective for reporting periods ending on or after 15 December 2006. Barth (1992) shows evidence that capital markets place greater weight on the projected benefit obligation, which incorporates future salary growth assumptions. This measure of the pension obligation is consistent with the EM, since all intra-equity transfers are netted as a surplus or deficit, but price changes on liabilities are recognized on the comprehensive income statement.
(iii) Economic benefit obligation (EBO). The economic benefit obligation is the long-term implicit contract with employees, that includes assumptions both about salary growth and wage-tenure profile assumptions. Ippolito (1985) suggests that the nature of the claims of corporate sponsors and employee participants over pension fund property rights is neither the ABO nor PBO, but more related to the EBO. In this case we assume that the EBO also includes implicit call and put options 9, and other elements of the deferred compensation package, i.e., all aspects of NDB plans, both their liability risk and asset risk, are fully consolidated into the corporation, and to the extent that the assets held to fund these obligations are investments in sponsoring company stock. They are treated as a non-arms length equity investment and ‘eliminated’ on consolidation 10. Most importantly, and consistent with arguments by Campbell and Vieira (2002) that long-duration bonds exhibit greater volatile than equity, we note that the difference between the EBO and ABO exhibits equity risk characteristics due to the long-duration of the liability. This measure of the pension obligation is consistent with the PEEM, since all funding instruments except those affecting existing equity are treated as liabilities, and all wealth transfers are recognized in the income statements.
We specifically focus on the distinctions between cases (i), (ii) and (iii) above and their implications for redefining the relationship between a sponsoring firm’s capital structure and that of its sponsored DB and NDB Plans, under alternative AEM, EM and PEEM models of the reporting entity. A comparison of the characteristics of different models of the reporting entity and their implications for the appropriate treatment of equity-based employee consideration is provided in Table 1 11.
We define NOA as the value of net operating assets, NFL as the net financial liabilities, PADB as the value of pension asset for a DB plan, PANDB as the value of pension asset for a NDB Plan, PLDB as the value of pension liability for the DB plan, PLDB as the pension liability value of the DB plan, and PLNDB as the liability value of NDB plans. Although NDB plans in theory cover any post retirement benefit arrangement, due to the availability of data, PLNDB here mainly covers 401k plan and DC plan.
Taking account of employee’s interest in company stock as equity investments to be eliminated upon consolidation, we also discriminate between ECE as the value of common equity (outsider shareholders), EEE as the value of employee equity (employee shareholders). Denote OPT pension plan related options, including PBGC and employer’s call option on net pension fund worth.
Similar to JMB, we consider cases without taxes. The economic balance sheet can be written as:
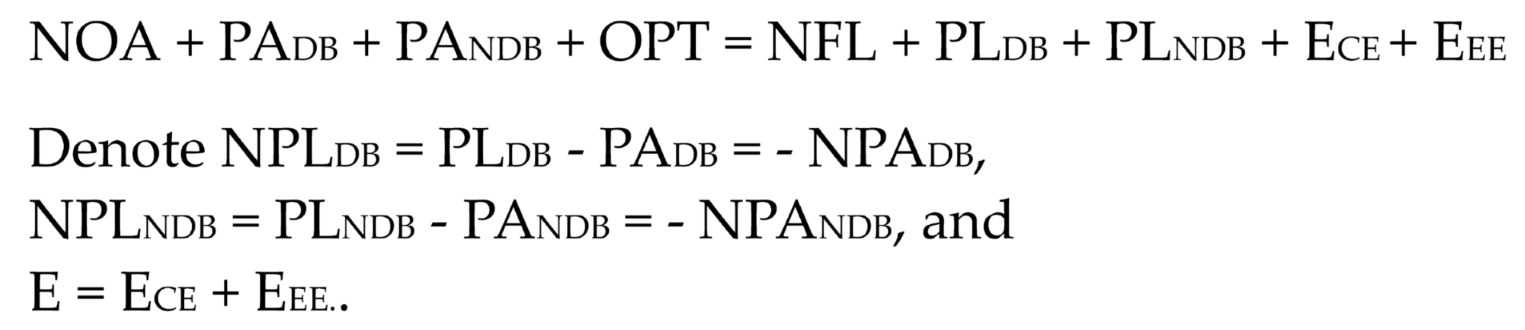
Thus, under the consolidated approach, E, equity of the firm is segregated into two components: common equity of the firm, ECE, and equity of employer securities, EEE, the equity invested by the firm’s sponsoring pension plans (both DB and NDB pension plan assets).
Systematic risk or beta of operating assets, , when both the pension value and pension risk are correctly considered, is
Error case 1: The calculation of operating asset risk ignores both DB and NDB pension plans, including their values and risks. The estimated operating asset beta becomes

The resulting estimation specification error, define as , is
Where .
Proof. See Appendix.
Without considering the NDB Plan, this expression of difference between “true” and estimated systematic risks of operating assets is the same as that in JMB. For both DB and NDB Plans, it is usually true that: . Therefore, if both DB and NDB pension surpluses are not large, then or , i.e., the specification error on the estimation of the operating asset beta generally leads to an upward bias. If both DB and NDB pension funds are in balance, NPA=0, or if NPADB = 0, , or if NPANDB=0, and , then holds.
Error case 2: The calculation of operating asset risk includes both pension values, but inappropriately assumes the associated risks for both pension plans. If, for example, both DB and NDB pension asset and pension liability risks are assumed to be the same and equal to the risk of the debt of the firm, , then the estimated operating asset beta becomes
The specification error in the estimated beta is given by
Proof: See Appendix.
As JMB point out that usually the risk level of pension liabilities and firm debt are similar with normal leverage ratios, i.e., , but the portion of pension assets that are invested in equities has significantly higher beta risk than the firm debt, i.e., . Therefore, it generally holds that . Again, operating asset beta is biased upward when both pension fund risks are assumed to be the same as firm’s liability risk.
In terms of the implicit contracting theory, we need to adjust JMB’s model as follows. Note that
or
and both DB and NDB net pension plan risks are separately ‘consolidated’ into the firms’ accounts, where E = ECE + EEE. Denote
NOA + PADB + PANDB – (PLDB + PLNDB) + OPT = NFL + E,
NOA + PADB + (PANDB - EEE) – (PLDB + PLNDB) + OPT = NFL + ECE,
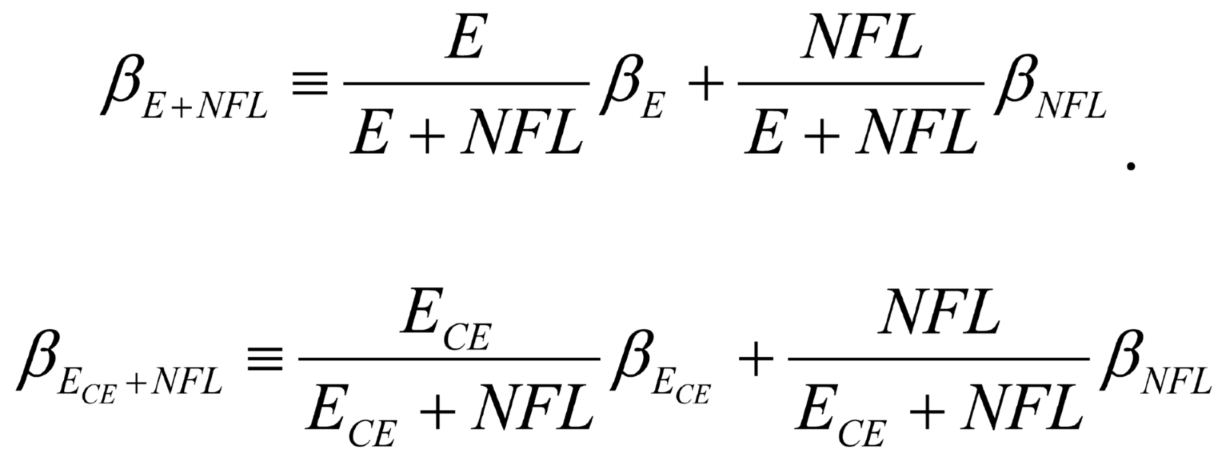
Therefore, can be rewritten as
where

Similarly, can be rewritten as

where

PANDBE = PANDB - EEE, and is the systematic risk of PANDBE.
By considering a merged case of pension risk, we can assign a single coefficient b in the regression, assuming that the degree of sensitivity of firm risk to DB pension plan and NDB pension plan is the same. On the other hand, in the separate risk view, we differentiate sources of pension risk between DB and NDB.
We can use the relationships in equations (6a) and (6b) to test whether the beta risk of pension is incorporated in the risk of the firm’s capital structure as below:
Where , and .
In these regressions, b represents the sensitivity of firm risk to firm pension risks, and intercept a represents the part of the expected firm risk that cannot be captured by the pension risks. We will use a number of instrumental variables to pick up the effect of the intercept. We expect b to be positive.
3. Sample and Data
The sample is based on the S&P 500 firms that (1) are in continuous existence in the index for the study period 1 January 2006 to 31 December 2008; (2) have all available stock price in CRSP and financial information on Compustat; and (3) have complete DB and NDB Plan asset allocation information reported in the relevant Money Market Directory publication and finally provided sufficient data to complete analysis of their pension risk and value in the period from the date the relevant balance sheet recognition requirements of SFAS 158 for pension assets and liabilities became fully effective, i.e., for reporting periods ending after 15 December 2008. We also exclude financial firms. This resulted in a final sample of 150 firms.
3.1. Sample and Data Collection Procedures
Data for this study is collected from a variety of sources. Stock price and returns data were captured from the merged CRSP and Compustat file. Compustat was also used to capture the main DB pension variables: ABO, PBO and market value of pension assets. The Money Market Directory was the source of data for detailed asset allocation. The Ratings Direct service of Standard & Poor’s provided the credit rating history.
3.2. Data Description
Table 2 reports the descriptive statistics for the sample firms. It reports selected company balance sheet information separately by type of pension liability used. The descriptive statistics show that the book value of equity is sensitive to the measurement of pension liability used.
The total pension plan liabilities and asset values are much higher than under the implicit approach (iii) due to the additional recognition of the net worth of unfunded NDB Plan, although the consolidation reduces this value through the equity elimination of investment in company sponsoring stock. The pension assets and liabilities also incorporate estimates of future cash flows, risk capital and credit insurance margins which insurance firms would expect to incur. This in turn also increases the amount of equity in the ‘combined’ firm 12.
The insurance hypothesis, advanced by Bodie (1990), assumes that shareholders of the sponsoring firm share the ownership of future pension deficit (surplus) with the employees in a form of a put (call) option 13. Shareholders therefore have the option to default on the portion of pension liabilities that are not covered by the pension fund’s collateral (i.e., plan assets) (Bodie, 1990; Blake, 1998) 14. A curtailment transaction can thus be viewed as the firm’s exercise of a ‘default’ option on this shared ownership. This ‘default’ option is exercisable when the action is optimal for the sponsoring firm. It is possible that pension curtailments will constitute part of a broader corporate restructuring programme. Consequently, we predict that pension curtailments with subsequent corporate restructuring are associated with the likelihood of default on pension obligations. Marcus (1985) applies option-pricing theory in estimating the value of firms’ put option to default on their portion of pension liabilities. The put option values derived in Marcus (1985) allow for the calculation of fair value-based measures of pension obligations in which the sponsoring firm’s termination decision is determined endogenously under various operating conditions. Following Marcus (1985), we derive the estimate of the put option value as a proxy measure for firms’ propensity to exercise the default option (PUT). Marcus defines a rate of firm contributions into the pension fund net of payments to retirees, we calibrate this as the difference between the periodic pension employer contributions less the periodic pension benefits divided by end of period ABO. Marcus also defines a ‘net growth rate in accrued benefits attributable to demographic factors’. We calibrate this as the periodic difference between accrued pension cost and the pension benefits deflated by end of period ABO. Appendix B overviews the option pricing procedures.
Table 3 reports relevant data on the composition of the pension plans sponsored by these companies. It shows the impact of the pensions as a percentage of firm value. The amount of DB, NDB plan net worth as a proportion of total corporate market capitalization is shown. The total percentage of DB and NDB plan investments in the corporate sponsor’s own stock is also shown. It averages nearly 5% in 2006, but this reduces to 3% in 2008. The decrease is due to the declining economic significance of plans relative to stock options over this period. As we can see that, relative to stockholders’ equity, both DB and NDB Plan pension funds are on average very significant. This information is not available from JMB as neither the sample selection procedure nor the composition of the data sets is described.
Table 3 also shows the assumed beta of each asset category identified by the Money Market Directory (MMD). The MMD lists at a detailed level, the asset composition of pension schemes on a ‘functional’ basis. For example, MMD decomposes investments across various debt instruments, from government bonds, corporate bonds, high-yield bonds, convertible bonds, indexed linked bonds and international bonds. Similarly pension equities are decomposed into various risk classes, including small, medium, or large stock, and/or growth versus value stocks, as well as international, indexed and emerging market equities.
The asset allocation for the relevant DB plan and NDB Plan are shown separately in the table. Note that NDB plans, on average, have invested 35% of sponsoring company’s stocks relative to 2% invested by DB plans. This has important implication for risk transformation and changes in capital structure for sponsoring companies.
JMB suggest that the cost of capital should be ‘corrected’ to allow for both the value and risk of pension plans. However, they do not consider NDB Plans, which have a significant investment in the sponsoring company’s own stock. Since NDB Plans own a significant proportion of company own stock, they can be ‘eliminated upon consolidation’ in recognizing the equity or ‘book value’ of the sponsoring company, i.e., by eliminating these common investments made by ‘undiversified’ investors. Because of the materiality and increasing economic significance of such investments by NDBs, they also complicate the relationship of pension risk to firm risk as if it were just a form of systematic risk, as represented by JMB.
4. Baseline Empirical Tests
In this section, we re-examine the results previously reported in JMB concerning the formal relationship between firm risk and pension risk, using Fama McBeth regressions. We also follow JMB by restricting the discussion of our main results to non-distressed firms since firms in financial distress are likely to behave differently from non-distressed firms due to PBGC. In the next section we conduct robustness checks to extend the analysis to explicitly incorporate new insights on risk management, consolidated treatments, industry, effect and financially distressed firms.
Following the procedure in JMB, we use three measures to identify financially distressed firms: book to market, return on investment, and leverage. These capture measures of overall risk, operating risk and financial risk, respectively. Then, in each year of the sample, all firms are ranked by each measure of financial distress, and the deciles of firms with the most severe measure as distressed and the rest are treated as non-distressed. Regressions are run on firms that are not in distress in the previous year. The following panel data regression is fitted, where equation (8) is the adjusted specification for case (iv), i.e., where the SOE Plan is merged with the firm, but as a separate financial services entity.
In terms of the ‘extended new’ GAAP cases (iii) and (iv), where the presently off-balance sheet SOE plans and the DB plans are ‘fully consolidated’; i.e., either merged with the firm as an additional or consolidated as an equity investment, we need to adjust JMB’s model as follows. Note that
or
and both DB and SOE net pension plan risks are separately ‘consolidated’ into the firms’ accounts consistent with case (iv). Denote
NOA + PADB + PASOE – ( PLDB + PLSOE) + OPT = NFL + E,
NOA + PADB + (PASOE - EEE) – ( PLDB + PLSOE) + OPT = NFL + ECE,
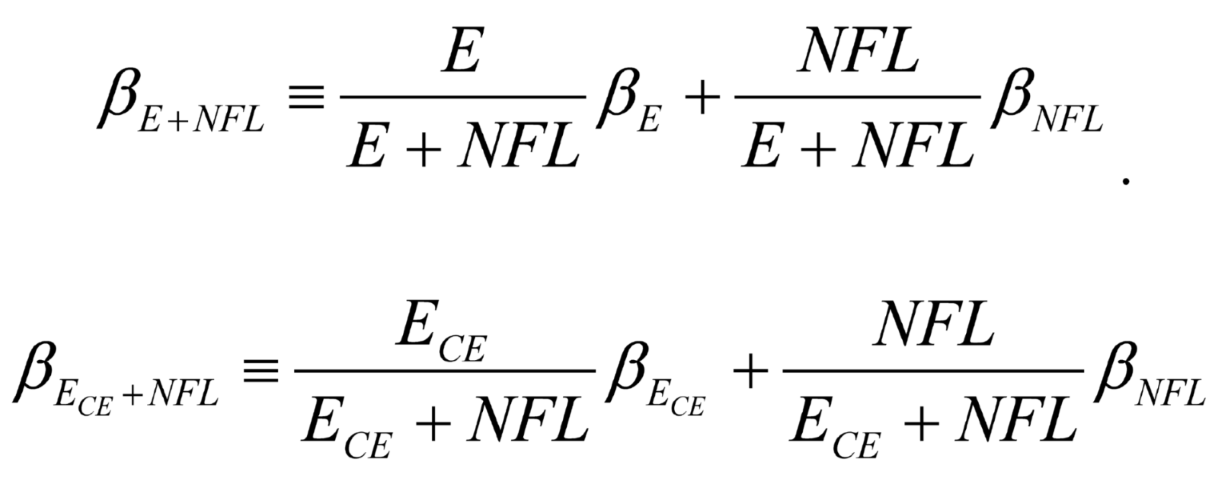
Therefore, can be rewritten as
where

Similarly, can be rewritten as

where

PASOEE
= PASOE - EEE, and is the
systematic risk of PASOEE.
We can use the relationships in equations (6a) and (6b) to test whether the beta risk of pension is incorporated in the risk of the firm’s capital structure as below:

Where , and .
In these regressions, b and c represent the sensitivity of firm risk to firm pension risks, and intercept a represents the part of the expected firm risk that cannot be captured by the pension risks. We will use a number of instrumental variables to pick up the effect of the intercept. We expect b and c to be positive.
4.1. Simple Tests
Table 5 reports various estimates of pension risk that are appropriate to the various cases outlined in Section 2. These show that pension risk is generally lower as the cases move from case (i) to case (iv), as we would expect when more implicit and extended components of the deferred compensation contracts are incorporated.
Following the procedure outlined in JMB, we run Fama-McBeth (1973) methodology OLS time series tests to compute robust standard errors for the coefficient estimates, by first running cross-sectional regressions for each year separately, while controlling for fixed effects at the industry levels using the two-digit Standard Industrial Classification (SIC) code, and report the time-series averages of the coefficient estimates and use the time series standard errors of the average slopes to draw inferences, The regression coefficients for each of the three measures of risk and their t-statistics are initially reported for the ‘simplistic’ cases (i) and (ii) in Table 6.
Contrary to the results reported in JMB, we find large variation in the pension asset betas. The standard deviations increase as we move from the simplistic US GAAP case (i) towards the new GAAP case (ii). However, the pension risk turns negative for the extended growth cases (iii) and (iv), indicating extreme volatility in the measurement. Furthermore, in none of the cases, do we find a significant association between firm risk and pension risk, contrary to the results obtained by JMB. This is either due to an error in variables problem, different specification of data, or to different time period. We now conduct a number of robustness checks and specification checks to evaluate these alternative explanations.
4.2. Tests by Incorporating Various Control Variables for Operating Asset Risk
We now follow JMB by running multiple regressions which incorporate various control variables as proxies for differences in the no pension operating asset risks across the firms.
The list of control variables and the procedures used to describe them are also initially based on those described in Jin et al. (2006, 15) and are reproduced again in Table 7.
The results of the Fama-McBeth multiple regressions with control variables are listed in Table 8.
Table 8, Panel A shows that neither old US GAAP or new US GAAP (cases (i) and (ii), respectively) demonstrate any relationship between firm risk and pension risk. Panel C results (case (iii)), there is a significant and positive association between pension risk and firm risk, although these results do not extend to the ‘extended put option’ case (iv) (Panel D) or combined case (v) (Panel E). However we also have reservations in estimating standard pension risk to firm risk comparisons in the latter cases, since the consolidation or merger of the pension plans with the sponsoring firm also change the nature of overall firm risk. We examine this issue further in Section 5 below.
5. Robustness Checks
In this section, we report various robustness checks on the regressions results that were reported in Section 4. We follow the procedures described in JMB for financial distressed firms and filtered tests. We also conduct industry-based tests.
5.1. Financially Distressed Firms
Following Jin et al. (2006, 17) we first re-run the regression analysis specified in Table 6 (for baseline GAAP cases) and in Table (for the consolidated cases with ‘corrected’ firm risk estimates) with the distressed firms sub sample. JMB posit that distressed firms are likely to have a distinctly different pattern than non-distressed firms. Table 9 reports the results.
The overall results for financially distressed firms are not consistent with those reported by JMB, and shows that the relation between pension risk and firm risk are even more significant for those firms relative to the simple regression results reported in Table 6 for non-distressed firms. We attribute these differences to mainly the slightly restricted sample selection procedure, since up to 2/3 of the JMB sample did not include firms with significant pension exposure, whereas over 90% of our sample did so.
5.2. Exclude Firms with Significant Company Stock in the Pension Plan
Following the procedure suggested by JMB (Table 10), we also rerun the regressions by excluding pension investment in company own stock. However the outcome of this procedure is more significant since we also include company stock owned by SOE plans (cases (iii) and (iv)) which is both material and has a bearing on overall equity ownership between outside equity holders and non-diversified employee holders.
The results reported in Table 10 are nevertheless largely consistent with those reported in our Table 8 but with a slight but significant increase in explanatory power of the overall regressions. Thus eliminating the company stock ownership significantly enhances the relation of firm risk to pension risk, but only at the conditioning of the external stockholders from the inside employee stockholders.
5.3. Filter Tests
We now run filter tests in order to examine whether our results are robust to restricting the sample to only those firms with at a minimum threshold of pension exposure. Our initial tests (not reported) replicated the analysis in JMB by restricting the threshold to the proportion of DB pension assets relative to firm debt and equity. Those results further corroborate our earlier finding in Table 8 that, contrary to those obtained by JMB, there is no significant relation between pension risk and firm risk.
6. Pooled Sample Results
6.1. Pension Risk and Cost of Capital
Table 4 shows the beta estimates, relating to each of the three alternative treatments of measuring DB pension liability contracts outlined above 15. (i) where the reported defined benefit pension obligation is measured as the accrued benefit obligation (ABO) based on the AEM of the reporting entity; (ii) where the reported defined benefit pension obligation is measured as the projected benefit obligation (PBO) based on the EM of the reporting entity; (iii) where the liability includes all future expectations of salary, wage-tenure profile (EBO) based on the PEEM of the reporting entity, and additionally includes other elements of the deferred compensation package, e.g., unfunded health care obligations, defined contribution plans, 401K plans, as well as implicit calls and puts on the PBGC 16.
Table 4 shows that the beta estimates for firm operating asset beta slightly increase from cases (i) to (iii) as more risk is taken on by the pension liability risk measure. The operating asset beta errors related to risk (error 2) are significantly higher than when value and risk (error 1).
Table 5 reports the cost of capital estimates based on the betas reported in Table 4 and the CAPM. The cost of capital is increases as the definition of pension liability is broadened and is on average higher under the case (iii) EBO implicit contracting approach relative to either the ABO or PBO approaches. In this case, the overestimates related to risk (error 2) are again significantly greater than the errors related to valuation overestimates (error 1). The results also show significant variation across the cases 17. Panel B shows the corresponding cost of capital estimates based on assumptions consistent with those used by JMB. Our estimates are also significantly higher than the cost of capital estimates estimated using JMB’s assumptions (panel C), and moreover increase as the level of pension obligation increases, as expected (whereas JMB estimates illogically decrease as the scope and nature of the pension liability increases from ABO to EBO).
6.2. Tests by Incorporating Various Control Variables for Operating Asset Risk
We now follow JMB by running multiple regressions which incorporate various control variables as proxies for differences in the no pension operating asset risks across the firms.
The list of control variables and the procedures used to describe them are also initially based on those described in Jin et al. (2006, 15) and are reproduced again in Table 7.
The results of the Fama-McBeth multiple regressions with control variables are listed in Table 8.
Table 8, Panel A shows that neither old US GAAP or new US GAAP (cases (i) and (ii), respectively) demonstrate any relationship between firm risk and pension risk. Panel C results (case (iii)), there is a significant and positive association between pension risk and firm risk, although these results do not extend to the ‘extended put option’ case (iv) (Panel D) or combined case (v) (Panel E). However we also have reservations in estimating standard pension risk to firm risk comparisons in the latter cases, since the consolidation or merger of the pension plans with the sponsoring firm also change the nature of overall firm risk. We examine this issue further in Section 7.3. below.
7. Robustness Checks and Filtered Tests
In this section, we report various robustness checks on the regressions results that were reported in Section 4. We follow the procedures described in JMB for financial distressed firms and filtered tests. We also conduct tests that delineate DB pension terminating from non-terminating sub-sample firms.
7.1. Financially Distressed Firms
Following Jin et al. (2006, 17) we first re-run the regression analysis specified in Table 8. JMB posit that distressed firms are likely to have a distinctly different pattern than non-distressed firms. Table 9 reports the results.
The overall results for financially distressed firms are not consistent with those reported by JMB, and shows that the relation between pension risk and firm risk are even more significant for those firms relative to the simple regression results reported in Table 6 for non-distressed firms. We attribute these differences to mainly the slightly restricted sample selection procedure, since up to 2/3 of the JMB sample did not include firms with significant pension exposure, whereas over 90% of our sample did so.
7.2. Exclude Firms with Significant Company Stock in the Pension Plan
Following the procedure suggested by JMB (Table 10), we also rerun the regressions by excluding pension investment in company own stock. However the outcome of this procedure is more significant since we also include company stock owned by SOE plans (which is both material and has a bearing on overall equity ownership between outside equity holders and non-diversified employee holders.
The results reported in Table 10 are nevertheless largely consistent with those reported in our Table 8 but with a slight but significant increase in explanatory power of the overall regressions. Thus eliminating the company stock ownership significantly enhances the relation of firm risk to pension risk, but only at the conditioning of the external stockholders from the inside employee stockholders.
7.3. Filter Tests
We now run filter tests in order to examine whether our results are robust to restricting the sample to only those firms with at a minimum threshold of pension exposure. Our initial tests (not reported) replicated the analysis in JMB by restricting the threshold to the proportion of DB pension assets relative to firm debt and equity. Those results further corroborate our earlier finding in Table 8 that, contrary to those obtained by JMB, there is no significant relation between pension risk and firm risk.
7.4. DB Pension Plan Termination Decisions
One of the more intriguing aspects of our primary results reported in Table 4 is the equivocal nature of the relation of firm overall risk, pension risk and their components. In this section, we reconsider this issue by decomposing the sample between continuing (i.e., surviving DB plan sponsors) and terminating DB pension plan sponsors 18.
Approximately one-third of our sample firms (167 pooled firm observations) terminated their DB pension plans during the five-year period 2004-2008, when the schemes were subject to significant changes in both regulation and GAAP –based reporting and funding requirement. The remaining two-thirds of the sample firms (283 pooled firm observations) continued to operate the schemes over the five fiscal reporting years ending 2008. To address this issue, we decompose the results reported in tables 6 to 7 of this paper as between DB continuing and DB-terminating pension plan sponsors.
Table 11 reports the results of a regression of firm systematic risk and pension risk, again separately for continuing (Panel A) and terminating (Panel B) firms 19. While the relationship between systematic risk and pension risk is equivocal for surviving firms, there is a positive relationship for terminating firms (for the EBO measure). Moreover, these results hold after controlling for significant relationships between firm systematic risk and other factors posited by JMB, including cash position, financial leverage and research and development.
8. Conclusion
Although the importance of human capital to corporations has been recognized by public policy makers and regulators as important elements of their long-term sustainable value, the cost of capital implications of employee commitments has received scant attention. This study contributes to this issue by examining how alternative treatments of equity based employee compensation and models of the reporting entity can impact the sensitivity of cost of capital, that is premised on traditional entity perspective of the reporting entity that does not recognize the potentially material impact of employee investments in company own stock and other sources of corporate exposure to defined benefit pension and unfunded health care benefits.
This study examine the cost of capital implications of alternative PEEM reporting entity perspective that incorporates both explicit and implicit long-term contracts between a firm and its employees by quantifying and then analyzing the impact of stock divestitures and investments in company own stock by employee pension, post-retirement and equity stock investments. Further, we exploit these insights to re-examine prior analysis which implied that there is not a significant relation between firm risk and pension risk. We incorporate adjustments that allow more detail estimates of both pension asset risk and pension liability risk. Our analysis of cost of capital estimates are sensitive to broader PBO and EBO measures of pension liability risk than the narrower ABO measure that defines the minimum liability that firms must bear in event of default. Whereas the PBO includes salary expectations, the EBO also incorporates future wage-tenure profiles and implicit calls and puts by the employees and employer sponsor, respectively. Broadening the concept of pension contract to include implicit claims under the EBO also incorporates what are usually considered to be two sources of idiosyncratic risk: employee ownership of defined benefit and NDB plans.
Our empirical results concerning the assocation of pension risk to firm risk are much more equivocal than those reported by JMB and are also sensitive to variations in pension asset and liability values and risk under various cases. We re-specify the issue of ignoring pension value and risk relationships by considering the impact of merger or consolidation of NDB plans and by extending the concept of firm risk and pension risk to incorporate various elements of idiosyncratic risk. These subtle changes as result of apparently minor variations have a significant impact on the magnitude, relative weighting, and risk implications of any inference about the relation of firm risk to pension risk. Our results are robust to alternative specifications of these risks and corroborative tests are also consistent with those of the broader literature which find a positive association between idiosyncratic risk and stock returns in the presence of high degrees of agency costs in the form of insider ownership.
Our results should be treated with caution as we have simply applied the one-period CAPM and consequently issues concerning duration and multi-period impact of value changes on various operating, financial and pension components of the firm have not been addressed. We also have not considered the broader impact on idiosyncratic risk of other firm strategies related to derivative usage or other sources of transferable capital. These remain issues for further research.
Subject to these caveats, we find that the extent of overestimation because of omitting pension value and risk is less than what prior researchers imply. We also find that there are systematic variations in the association of pension risk and firm value for firms with implicit contracts and those with explicit contracts. Sources of idiosyncratic risk appear to explain the relation of pension risk to firm risk, especially for firms that terminate their defined benefit pensions. Finally, our findings suggest that altering the mix and magnitude of value and risk components of pension assets and liabilities can affect the cost of capital and pension risk. Our analysis also bears upon standard models used to explain the cross-section of stock returns, since unfunded pension exposure appears to be important for many firms.
The primary contributions of the paper are the following:
- (1)
- It is important to control for alternative measurement bases for defined benefit pension liabilities that incorporate salary growth assumptions that firms now recognize on their balance sheets, i.e., beyond the previously reported spinoff termination value (ABO). Specifically, current GAAP requires firms to report the broader PBO, which includes wage growth assumptions. Both the ABO and PBO make restrictive assumptions about the explicit and short-term nature of DB employment contracts. A broader EBO or long-term funding measure of the pension liabilities is conceptually more consistent with a long-term asset pricing or returns model. However, the estimated cost of capital increases as the DB pension liability measure broadens from an ABO to a PBO and to the EBO 20.
- (2)
- Any analyst estimating a firms’ WACC should adjust explicitly for various sources of firm risk management strategy (e.g., O’Brien, 2006), and such procedures should be sufficiently robust to more clearly delineate the categories ‘net operating assets’ from ‘net financial liabilities.
- (3)
- Cost of capital estimates should also be sufficiently precise in modeling details of a firms’ pension asset allocation to enable more reliable and robust inferences to be drawn concerning the predicted relationship between pension risk and firm risk, allowing for both DB and NDB plans.
- (4)
- It is important to adjust WACC estimates for the purposes of ‘fundamental value’ analysis by separating the impact of ‘implicit contracts’ with employees, arising from the recognition of (i) salary growth assumptions (PBO v ABO) and the (ii) avoid ‘double counting’ problems by separating the interests of both diversified external investors and non-diversified employee stock investors that participate in pension plans with significant investments in parent company stock.
- (5)
- The adjustment procedures suggested in (1) to (4) above is particularly relevant to those examining the explanatory power of Fama-French 3 factor plus momentum models, and especially in examining the cross-section of returns of significantly underfunded firms.
This paper proposes a simple set of procedures for estimating the cost of capital that incorporate both systematic and non-systematic sources of pension risk. By considering the debt and equity implications, our analysis suggests that standard procedures underestimate these risks. Further research can address these issues even more comprehensively by examining broader inter-relationships between various retained and transferred risk sources which are often off-balance sheet contingent claims.
Appendix A
Proofs
Proof of equation (3).
If both the value and the risk of the pension plans, including DB and NDB plans, are ignored, then the estimated operating asset is
The estimated operating asset beta becomes
Define . Note that . The weighted average betas of NPA and are given by: and
Q.E.D.
Proof of Equation (5). If values of both DB and NDB plans are included, then the estimated operating asset is
The estimated operating asset beta becomes
Define
Q.E.D.
Appendix B
Overview of pension insurance model
(for reviewers)
The pension insurance model, which is based on Marcus (1985) is outlined here for reviewers information only. Please consult Marcus (1985, 231-233) for more information about this model. The model assumes that a defined benefit pension fund comprises a simple portfolio of pension contracts.3 A denotes the total, actuarially-determined present value of their accrued liabilities. F denotes the market value of assets in the pension fund and 0.3E denotes the proportion of shareholder’s capital funds that are tied up in the fund. At a voluntary termination by take-over, and assuming that the fund is sufficiently funded (F + 0.3E > A), the firm gains F, transfers assets of value A to the acquiring firm. Net proceeds are:

or equivalently,

Expression (A2) highlights the nature of the firm’s put option. Its net pension liability is F - A; however, at the termination date it can transfer its liability of A to the acquiring firm in return for only F + 0.3E. To solve for the value of pension fund insurance put it is first necessary to specify the dynamics for accrued liabilities and the assets backing the fund. Let S denote the sum F a constant fraction 0.3E. S follows the diffusion process

where s is a standard drift term attributable to the normal rate of return on the pension fund’s invested assets, and where Cs is the rate (as a fraction of S) of regulatory required firm funding of the pension fund liabilities. Denote by A the expected rate of return on a bond with a payoff stream identical to the expected growth rate in the present value of accrued fund liabilities. If interest rates were non-stochastic, then A would equal r. Denoting the net growth rate in termination values attributable to demographic factors as CA, the total growth rate in A would be CA + r. In the non-stochastic steady state, CA equals -r, and A would remain constant. The evolution of A is summarised by the process
The stochastic component of (A4) is due to uncertainty regarding long-term interest rates and future liabilities. Denote the correlation coefficient between dzA and dzS as p.
Following the analysis in Merton (1973) and letting P(A,S) denote the value of the pension insurance put; one can show that P must satisfy the partial differential equation
where subscripts on P denote partial derivatives and r denotes the rate of return on either (a) AAA corporate bond rates or (b) the firms’ own assumption concerning the expected rate of return on pension assets. The terms CA and CS have effects analogous to those of (negative) proportional dividends in the standard option pricing model.
The boundary conditions for P are:
- (a)
- At a point of exercise of the put (i.e.,: termination of the plan), P = A - S.
- (b)
- The limit of P as S approaches infinity is zero.
- (c)
- The limit of P as An approaches zero is zero.
- (d)
- The rule for voluntary termination is chosen to maximise the value of the insurance put option.
For general specifications for CA and CS, (A5) must be solved numerically (see section III). In the special case that CA and CS are constant, (A5) has an analytic solution that can be shown to have the general form (McDonald and Siegel 1986):
n
Where K is the ratio of S/A at which the option is exercised. Equation (A6) will satisfy p.d.e. (A5) for
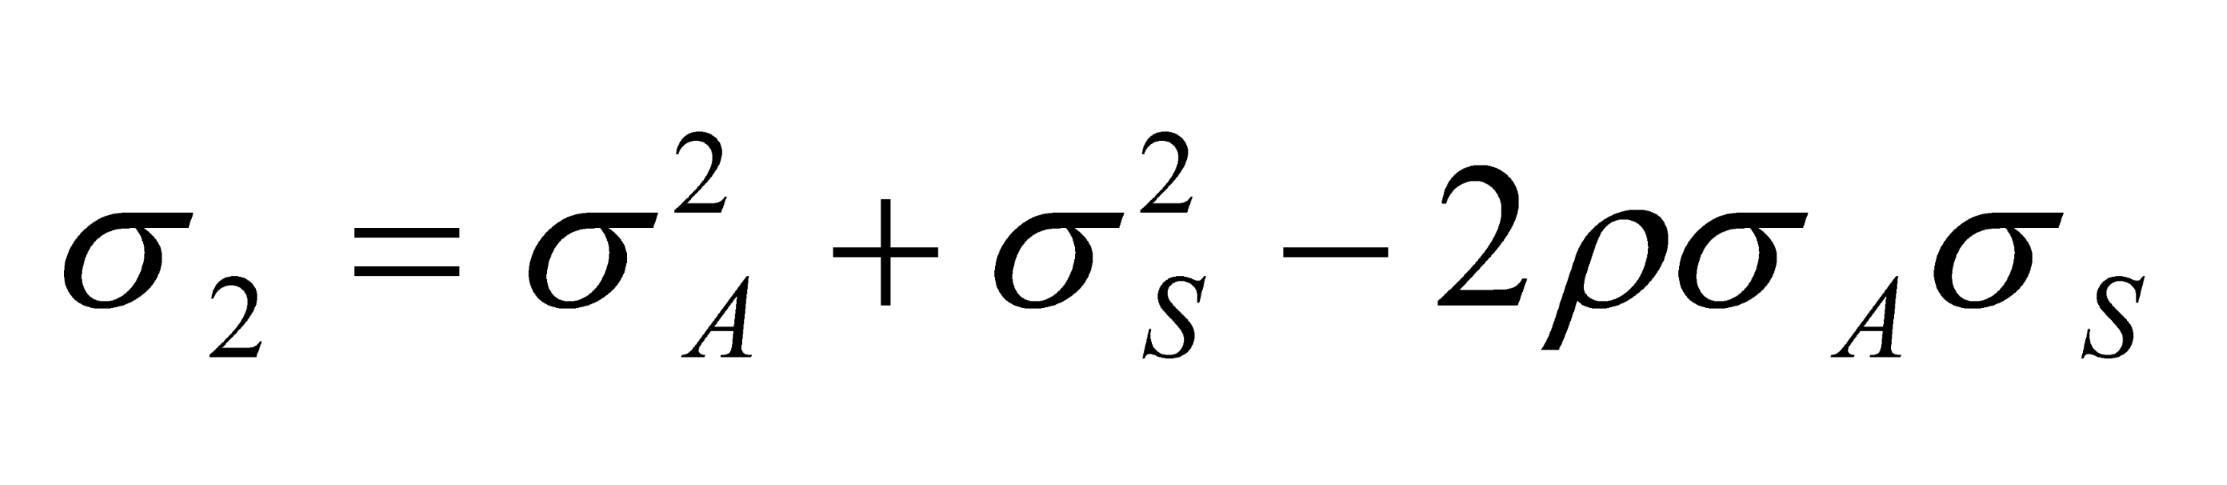
These conditions are derived by solving the quadratic equation that is generated by substituting (A6) into (A5). Choosing K to maximise the value of the option results in the condition (Marcus 1985):
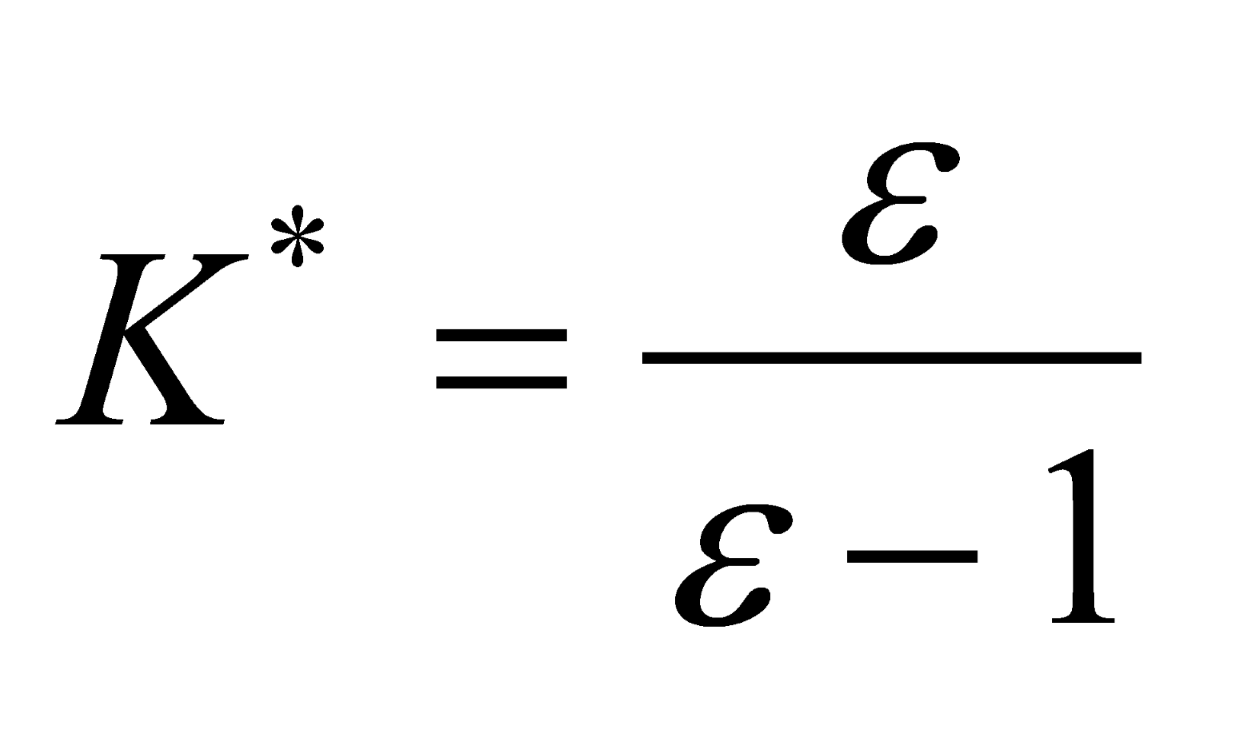
Equation (A6) gives the value of the pension insurance under simplifying assumptions of constant CS and CA. Given estimates of the parameters in (A6) and (A8), one can assess the value of the pension insurance to the shareholders of the sponsoring firm.
Equation (A8) gives the condition for voluntary termination of the pension fund. Second-order conditions require that < 1. One must further restrict to be negative since a feasible K* must be positive (because A and S are always positive). Thus, < 0, which implies 0 < K* < 1 so that the put will be exercised only for S < A, that is, if fund assets plus 30% of net worth fall below accrued benefits. Parameters that result in nonnegative values for would imply that the option would never be exercised.
Equations (A6) and (A8) generalise the formula for the perpetual American put option presented in Merton (1973). For the special case presented in equation (A6), the value of the termination option increases with CA and decreases with CS. Conversely, the ratio of S/A at which it is optimal to terminate falls with CA and increases with CS.
Equation (A6) can be used to generate fair values of the put for any initial values of A and S. If a fund is increasing in size (large positive CA, CS), then the dollar gain from a termination for any given ratio of S/A is larger. If the fund is growing, it pays to wait to terminate, and the ratio S/A must be smaller to induce early termination. Thus, one should expect voluntary termination decisions to be more frequent where funds are shrinking.
| 1 | SEC amendment to 101(c) of Regulation S-K, US listed companies requires a description of a registrant’s human capital resources, including any human capital measures or objectives that the registrant focuses on in managing the business” (SEC 2020). The SASB’s Human Capital Management Research Project (2020) states that “Human capital is a critical element of the SASB standards. As a thematic issue, it is the second most prevalent issue across the SASB standards, second only to climate risk” |
| 2 | Other researchers distinguish more generally between proprietary theory and entity theory, but in this paper, we follow Forker (2000) with the PEEM and EM models because it relates more clearly to alternative accounting treatments of equity based employee compensation and for analysing its implications for the estimating the impact of alternative pension accounting treatments of the reporting entity, including the all equity model. |
| 3 | A 401K plan permits employees to elect to have a portion of their compensation contributed to a qualified retirement plan (EBRI, 2009). Investors in 401K plans issued by Lucent Technologies sued based on the Employee Retirement Income Security Act (ERISA) of 1974, which states that plan sponsors have a fiduciary responsibility to provide prudent and diversified investing options. However, it does not impose any upper restrictions on the amount of company stock that a 401K plan can invest in. |
| 4 | Himmelberg et al (2002) derive a model whereby cost of capital, capital structure and ownership concentration are endogenous variables. |
| 5 | The Employee Benefits Research Institute (2011a) reports that participation in defined contribution plans (which promise a specified contribution to an employee’s account) is growing faster than participation in traditional defined benefit pension plans (which promise a specified benefit at retirement). The percent of private-sector active-worker participants in a defined benefit plan where the defined benefit plan was the only plan declined from 62 percent in 1975 to 7 percent in 2009, while the percent of private-sector active-worker participants in a defined contribution plan where the defined contribution plan was the only plan increased from 16 percent in 1975 to 67 percent in 2009. EBRI (2011b) also identifies significant increases in the average 401(K) plan accounts to 2009, except for 2008, with the bulk of assets invested in stocks, of which a significant (but declining) proportion is invested in the sponsoring company’s own stock (EBRI, 2011). |
| 6 | Dhaliwal (1986) and Mandelker and Rhee (1984) argue that financial leverage and fundamental risk should be incorporated into cost of capital estimates. Chen et al. (2009) finds that fundamental risk affects the cost of capital estimates. We estimate net financial liabilities and net operating assets using the definition in Callen and Segal (2003). |
| 7 | We recognise that the full range of deferred compensation arrangements are necessarily off balance sheet in nature and asymmetric; hence we restrict our analysis to direct company exposure to underfunded defined benefit plans and health care obligations, company own stock investments of 401K and defined contribution plans. |
| 8 | This is one of the caveats acknowledged by JMB. Not being able to assign specific beta risk to each asset under a specific asset class may lead to some measurement error in their analysis. |
| 9 | Bodie (1990) argues that the corporate guarantee of the ABO is in effect a put option on the investments of the pension fund with an exercise price equal to the ABO. The pension fund net worth is the difference between its total assets (investments plus corporate pension guarantee) and the ABO. The employer sponsor owns a proportion, q, of the pension fund net worth; the remainder (1-q) belongs to the employees. Since shareholders’ equity in the employer sponsoring corporation is the difference between total corporate assets (conventional assets plus the corporation’s share of the pension fund surplus) and corporate debt (conventional liabilities plus the guarantee of the pension benefits), if pension claims are implicit contracts, then the corporate guarantee of the ABO is a put option, while the pension fund net worth is analogous to a call option. |
| 10 | This implies that modifications must be made to the standard measurement of corporate liabilities where the pension liability instead depends on further assumptions that need to reflect their own expectation. For example, it is usually assumed that the entity’s own credit standing should be incorporated in the value of the liability under fair value accounting. However, if insurance contracts are taken over by a third party, then that party’s credit standing would apply to the insurance contracts. If the credit standing is not applicable (as in the case above), then risk capital (i.e., the minimum required to attain risk free obligations for regulatory purposes) must incorporated as a contingent claim in the form of an asset and a corresponding contingent claim on equity. |
| 11 | This table is similar to Forker (2000) table 5 but we have included the implications for the appropriate measure of the pension obligation. |
| 12 | Our measures of the ABO, PBO and EBO are highly positively correlated, consistent with the simulation results of Selling and Stickney (1986) and are not reported here. |
| 13 | Bodie (1990) views pension funds as an insurance subsidiary. The pension promises are viewed as participating annuities that offer a guaranteed minimum nominal benefit determined by the plan’s benefit formula. This guaranteed benefit is permanently enriched from time to time, at the discretion of management, depending on the financial condition of the plan sponsor, the increase in the living cost of retirees, and the performance of the fund’s assets. Evidence in support of this ‘guaranteed minimum’ contention is the fact that many UK plans have given ad hoc benefit increases to plan participants in the past. |
| 14 | The optionality element inherent in pension commitments is introduced by Sharpe (1976), who focuses on the impact of the introduction of government pensions insurance in ERISA on the nature of an employer sponsors’ pension obligations. However, he does not model an equivalent implicit contingent claim by employees on the pension fund surplus, which is the focus of the insurance view of pension contract. |
| 15 | As our analysis is focused on the post-disclosure period 2006 to 2008 only, we do not attempt to amend the CAPM estimates to reflect longer-run changes in risk factor loadings or learning-based approaches to estimate CAPM (e.g. Adrian and Franzoni, 2009), although we recognize that this may also bear on the validity of our model and findings. |
| 16 | In the ‘combination case’, the highest quartile of firms with ‘growth’ are treated as (iii), the next quartile of firms with the highest estimated put options are treated as (iv); and firms with minimal pension exposure are treated as (i). The remainder are treated as (ii). |
| 17 | Further analysis of cost of capital estimates by industry 2-SIC code breakdown (not reported) shows that significant inter-industry variation in cost of capital estimates. The lowest sector is utilities, while the highest if retail. These results are consistent with the finding that incorporating risk and value of pension risk in utilities has little impact on their already structured balance sheets, whereas it has a more significant impact on more leveraged retail firms. |
| 18 | Decomposing results by whether firms terminate or continue DB pension plans is important because Bulow and Scholes (1983) argue that there is a separating equilibrium by which firms either have continuing or terminating contracts with their employees. |
| 19 | Our choice and definitions of control variables are consistent with those employed by JMB to clarify the incremental explanatory power of alternative proxies and measurement bases of pension risk. |
| 20 | We suspect this is a major reason why financial analysts prefer not to use the PBO for cost of capital estimation purposes. |
References
- Adrian, T. and F. Franzoni. 2009. Learning about beta: time-varying factor loadings, expected returns and the conditional CAPM. Journal of Empirical Finance 16(4): 537-556.
- Amir, E., Benartzi, S. 1998. The expected rate of return on pension funds and asset.
- allocation as predictors of portfolio performance. The Accounting Review 73: 335–352.
- Amir, E., Y. Guan and D. Oswald. 2010. The effect of pension accounting on corporate pension asset.
- allocation. Review of Accounting Studies 15(2): 345-366.
- Barth, M.E. 1991. Relative Measurement Errors Among Alternative Pension Asset and Liability Measures. The Accounting Review 66: 433-463.
- Benartzi, S. 2001. Excessive Extrapolation and the Allocation of 401(k) Accounts to Company Stock, Journal of Finance, 56(5): 1747-1764.
- Bergstresser, D., M. Desai, and J. Rauh. 2006. Earnings manipulations, pension.
- assumptions and managerial investment decisions. The Quarterly Journal of Economics 121: 157-194.
- Bodie, Z. 1990. Pensions as Retirement income insurance. Journal of Economic Literature, 30: 1-30.
- Bodie, Z. 2008. Pension guarantees, capital adequacy and international risk sharing, Frontiers in Pension Finance, Elgar: Cheltenham.
- Brealey, R.A., S.C. Myers and F. Allen. 2006. Principles of Corporate Finance (8th ed). Boston: Irwin McGraw-Hill.
- Brockman, P., M. Gabriela Schutte and W. Yu. 2009. Is idiosyncratic risk priced? The international evidence, Mimeo.
- Callahan, C.M, R.E. Smith and A.W Spencer. An examination of the cost of capital implications of FIN46, Accounting Review 87(4): 1105-1134.
- Callen, R. And J. Segal. 2003. Empirical estimate of the Ohlson Model. Review of Accounting Studies.
- Campbell, J. and L. Vieira. 2002. Strategic asset allocation: portfolio choice for long-term investors. Clarendon Lectures in Economics.
- Chen, L. H. S. Dhaiwal and M. A. Trombley. 2009. The effect of fundamental risk on the market pricing of accruals quality. Journal of Accounting, Auditing and Finance.
- Choi, J.J., B.C. Madrian, and D. Laibson. 2004. The Flypaper effect in individual pension asset allocation. NBER Working paper 13656.
- Coronado, J. and S. Sharpe. 2003. Did Pension Accounting Contribute to a Stock Market Bubble? BPEA: 1: 323-359.
- Coronado, J. S. Mitchell, S. Sharpe, S. Nesbitt Blake. 2008. Footnotes Arent Enough: The Impact of Pension Accounting on Stock Values. Journal of Pension Economics and Finance, 7(3): 257-76.
- Culp, C. 2001., ‘The Compliance management Process - Business Strategy and Tactics, Wiley.
- Da, Z., R Guo and R Jagannathan. 2009. CAPM for estimating the Cost of Equity Capital: Interpreting the Empirical Evidence. NBER: April.
- Dhaliwal, D. S. 1986. Measurement of financial leverage in the presence of unfunded pension obligations. The Accounting Review 61(4): 651-688.
- Employee Benefits Retirement Institute. 2009. Fundamentals of Employee Benefits Programs. (6th edition). Washington: DC.
- 2011a. EBRI Data Book on Employee Benefits, EBRI: Washington DC.
- 2011b. Issue Brief: 401(k) Plan Asset Allocation, Account Balances and Loan Activity in 2009. EBRI: Washington DC.
- European Financial Reporting Advisory Group, 2008. The Financial Reporting of Pensions. EFRAG: Brussels.
- Exley, W. and C. Smith. 2007. Cost of capital for financial firms, British Actuarial Journal, Vol. 12, London: Institute of Actuaries.
- Ferreira, M.A. and P.A. Laux. 2007. Idiosyncratic risk and corporate governance. Journal of Finance. 62(2); 951-89.
- Financial Accounting Standards Board. 1985. Statement of Financial Accounting Standards No. 87: Employers’ Accounting For Pensions. FASB: Stamford Ct.
- Financial Accounting Standards Board. 2003. Statement of Financial Accounting Standards No. 132: Employers’ Disclosures about Pensions and Other Postretirement benefits: An Amendment of FASB Statements No. 87, 88 and 106. FASB: Stamford. Ct.
- Financial Acounting Standards Board. 2006. Statement of Financial Accounting Standards No. 158: Employers’ Accounting for Defined Benefit Pensions and Other Postretirement Plans – An Amendment of FASB Statements No. 87, 88, 106 and 132. FASB: Stamford. Ct.
- Forker, J. 2000. Models of the reporting entity and accounting for equity-basede consideration. Accounting and Business Research 31(2): 3-17.
- Franzoni, F. and J. M. Marin. 2006 Pension Plan Funding and Stock Market Efficiency. Journal of Finance 61(2): 921-956.
- Froot, K.A. 2004. ‘Risk Management, Capital Budgeting and Capital Structure Policy for Insurers and Reinsurers’, Harvard Working Paper, Boston MA.
- Froot, K. Scharfstein, D. and J. Stein. 1993. Risk Management: Coordinating Corporate Investment and Financing Policies. Journal of Finance 48(5): 1629-1658.
- Froot, K. 1995. Incentive Problems in Financial Contracting: Impacts on Corporate Financing, Investment, and Risk Management Policies, 225-262, in D. Crane, ed., The Global Financial System: A Functional Perspective, HBS. Boston.
- Froot, K.A. and J.C. Stein. 1998. ‘Risk Management, Capital Budgeting and Capital Structure Policy for Financial Institutions: An Integrated Approach’, Journal of Financial Economics 47: 55-82.
- Hann, R., F. Heflin, and K.R. Subramanyam. 2007. Fair value Pension Accounting. Journal of Accounting and Economics. 44(3): 328-35.
- Himmelberg, C.P., R. Glenn Hubbard and I. Love. 2002. Investor protection, ownership, and the cost of capital. Working paper, National Bank of Belgium.
- International Accounting Standards Board. (2004). IAS 19. Employee Benefits. London.
- Ippolito. R. 1985. The labor contract and true economic pension liabilities. American Economic Review 75(5): 1031-1043.
- Jin, L., Z., R.C. Merton and Z. Bodie. 2006. Do a Firm’s Equity Returns reflect the Risk of its Pension Plan? Journal of Financial Economics 1-26.
- Landsman, W. 1986. Pension fund property rights. Accounting Review. 59.
- Landsman W and S. Penman. 2007. A proprietorship theory perspective on equity valuation. Journal of Applied Corporate Finance.
- Landsman W R, Peasnell K V, Pope P F and Yeh S, 2006, ‘Which approach to accounting for employee stock options best reflects market pricing?’, Review of Accounting Studies, vol 11, no. 2-3, pp. 203-245.
- Langetieg, T.C., M.C. Findlay and L.F.J. da Motta. 1982. Multiperiod Pension plans and ERISA, Journal of Financial and Quantitative Analysis, Vol. 17(4), November.
- Curme, M. and Kahn, L. M. 1990. The impact of the threat of bankruptcy on the structure of compensation. Journal of Labor Economics. 8(4): 419-44.
- Lazear, J. 2000. The economic effects of private pensions. Foundations of Pension Finance, eds Z. Bodie and E. P. Davis. Elgar, Cheltenham.
- Malkiel, B.G. and Xu, Y. 2002. Idiosyncratic risk and returns. Mimeo.
- Marcus, A.J., 1985. Spinoff/Termination and the value of Pension Insurance, Journal of Finance 40, 911-924.
- Merton, R.C. and A. F. Perold. 1993. Management of risk capital in financial firms. In S. L. Hayes ed., Financial Services: Perspectives and Challenges. HBS Press.
- Merton, R.C., 1973. The theory of rational option pricing. Bell Journal of Economics and Management Science 4, 141-83. Merton, R.C. The Theory of Continuous-Time Finance (Blackwell: Cambridge, 1992).
- Meulbroek, L. 2005. Company Stock in Pension Plans: How Costly is it? Journal of Law and Economics.48(2): 443-74.
- O’Brien, T.J. 2006. Risk Management and the cost of capital for operating assets. Journal of Applied Corporate Finance. Fall.
- Ohlson, J.A. and S. W. Landsman. 2007. Accounting for employee stock options and other contingent equity claims: taking a shareholders view. Journal of Applied Corporate Finance. 19(2)L 105-114.
- Penman, S. 2001. Financial Statement Analysis and Security Valuation. McGraw Hill, Englewood Cliffs.
- Penman, S. 2010. Accounting for Value. Columbia University Press. New York.
- Picconi, M. 2006. The Perils of Pensions: does Pension accounting Lead Investors and Analysts astray? The Accounting Review 81(4): 925-95.
- Pratt, S.P. and R.J. Grabowski. 2010. Cost of Capital – Applications and Examples. Hoboken, J. Wiley.
- Sabac, F. 2008. Dynamic incentives and retirement. Journal of Accounting and Economics, 46: 172-200.
- Sprague, C.E. 1907 The Philosophya of Accounts, Scholars Book Co, Kansas. (reprinted 1972).
- Selling. S. and C.P. Stickney. 1986. Accounting measures of unfunded pension liabilities and the expected present value of future pension cash flows. Journal of Accounting and Public Policy 5, 267-28.
- Sharpe, W. F. 1975. Corporate Pension funding Policy. Journal of Financial Economics 3(2): 183-193.
- Tepper, I. 1981. Taxation and Corporate Pension Policy. Journal of Finance 36(1): 1-1.
- Tinker, T. and D. Ghicas. 1992. Accounting and the appropriation of employee wealth. Accounting Organisations and Society.
- Urgent Issues Task Force 2010. Accounting for employee stock options Financial Reporting Council: London.
- Winkelvoss. H. 1993. Pension Mathematics, Irwin.
- Zambon, S. and L. Zan. 2000. Accounting relativism: the unstable relationship between income measurement and theories of the firm. Accounting, Organizations and Society: 25: 799-822.

Table 1.
Comparison of models of the reporting entity (MRE).
| Characteristic | All equities model (AEM) | Equity model (EM) | Pre-existing equity model (PEEM) |
| Boundary of the model of the reporting entity (MRE) | All funding instruments | Equity instruments, including rights to contingently issueable shares | Existing equity shareholders |
| Income measurement and capital structure | No distinction between debt and equity | Debt and equity separately classified | All funding instruments, except existing equity classified as liabilities |
| Accounting for wealth transfers within the boundary of the MRE | All transfers are netted with zero impact on income | Intra-equity transfers are netted, but price changes on liabilities are recognized in the income statement | All wealth transfers are recognized in the income statement |
| Clean surplus accounting | No | Yes, for liability instruments. No for equity instruments | Yes |
| Accounting for employee stock options, share of DB and DC and 401K equity investments in own firm | Yes, for DB only (assume ‘surplus’ = ABO – MV of pension assets); no unexpected variations affect income | Yes, for DB (assume ‘surplus’ = ABO – MV pension assets); no for DC or 401K employee ownership of company own stock | Yes, for DB (assume ‘surplus’ = PBO – MV pension assets); yes for DC or 401K employee ownership of company own stock as liabilities |
Table 2.
Descriptive Statistics. Selected Company Balance sheet information. (Standard deviations statistics in brackets). Pension asset, pension liability and market cap information are obtained from Compustat. Figures are in millions of dollars. Sample is 150 S&P 500 firms. Data is pooled from 2006-2008. Pension asset DB is the market value of pension assets in the defined benefit fund. PFL is the present value of pension obligations in the defined benefit plan, and is either based on the ABO (PFL1), the PBO (PFL2) or the EBO (PFL3). The NDBPA (NDBPL) are the market value of assets (liabilities) invested in non-defined plans, NDB plans. MVE is the market capitalization of the firm. BVE is the book value of equity of the firm, allowing for any company stock investment depending on how the pension plan liability is defined. NFL is the total (non-pension) financial liabilities of the firm. Value of put option is the estimates of the corporate guarantee and value of call option is the estimates of the pension fund net worth.
Table 2.
Descriptive Statistics. Selected Company Balance sheet information. (Standard deviations statistics in brackets). Pension asset, pension liability and market cap information are obtained from Compustat. Figures are in millions of dollars. Sample is 150 S&P 500 firms. Data is pooled from 2006-2008. Pension asset DB is the market value of pension assets in the defined benefit fund. PFL is the present value of pension obligations in the defined benefit plan, and is either based on the ABO (PFL1), the PBO (PFL2) or the EBO (PFL3). The NDBPA (NDBPL) are the market value of assets (liabilities) invested in non-defined plans, NDB plans. MVE is the market capitalization of the firm. BVE is the book value of equity of the firm, allowing for any company stock investment depending on how the pension plan liability is defined. NFL is the total (non-pension) financial liabilities of the firm. Value of put option is the estimates of the corporate guarantee and value of call option is the estimates of the pension fund net worth.
| Variable | No | Mean | Std dev | 25% | Median | 75% |
| DB PA | 450 | 3967 | 7912 | 484 | 1517 | 3584 |
| PFL1 | 450 | 3925 | 7051 | 508 | 1627 | 3834 |
| PFL2 | 450 | 4290 | 7582 | 582 | 1758 | 4116 |
| PFL3 | 450 | 7557 | 13566 | 979 | 3141 | 7390 |
| NDBPA | 450 | 2225 | 3264 | 420 | 1115 | 2500 |
| NDBPL | 450 | 1730 | 2831 | 270 | 715 | 1713 |
| MVE | 450 | 22336 | 32726 | 5174 | 11326 | 24945 |
| BVE1 | 450 | 8655 | 13211 | 1997 | 4620 | 9806 |
| BVE2 | 450 | 8432 | 13228 | 1933 | 4460 | 9571 |
| BVE3 | 450 | 7986 | 13143 | 1689 | 3977 | 9067 |
| NFL | 450 | 3797 | 8095 | 328 | 2056 | 5513 |
| Put | 450 | 957 | 2653 | 0 | 51 | 497 |
| Call | 450 | 1004 | 2932 | 0 | 99 | 629 |
| Employee Equity | 450 | 441 | 771 | 0 | 139 | 470 |
Table 3.
Pension asset categories as reported in Money Market Directory, 2006-2008. We use the CAPM to back out the systematic risk beta for various types of assets in pension fund. Relevant assumptions are consistent with Brealey and Myers (2007) in capital market history from 1926-2005. Specifically, we assumed T-bill rate is 4.2%, the average market return is assumed to be 12%, the average risk premium is assumed to be 7.8%. Large-firm stocks average annual return is 12.3%, and 17.4% for small firms, the long-term corporate bonds yield is 6.2%, long-term government bonds yield is 5.8%, intermediate-term government bond yield is 5.5%, and US. Treasury bills yield is 3.8%. Assume high yield bond is 8%, which is between large-stock and corporate bond. Municipals yields are assumed to the same as long-term government bonds. Inflation-linked bond earns 5% ‘real’ return. Assume both capital guaranteed insurance and convertibles yield 5.8% as long-term government bonds. The returns on small cap value stock and large cap stocks are assumed to be 17.4% ± 2.5%; The returns on large cap value and growth stocks are assumed to be 12.3% ± 2.5%. This is consistent with the average annual difference between the returns on value stock and growth stock has been about 5% since 1926. Betas of other equity classes, including index and international equities are assumed to be 1.
Table 3.
Pension asset categories as reported in Money Market Directory, 2006-2008. We use the CAPM to back out the systematic risk beta for various types of assets in pension fund. Relevant assumptions are consistent with Brealey and Myers (2007) in capital market history from 1926-2005. Specifically, we assumed T-bill rate is 4.2%, the average market return is assumed to be 12%, the average risk premium is assumed to be 7.8%. Large-firm stocks average annual return is 12.3%, and 17.4% for small firms, the long-term corporate bonds yield is 6.2%, long-term government bonds yield is 5.8%, intermediate-term government bond yield is 5.5%, and US. Treasury bills yield is 3.8%. Assume high yield bond is 8%, which is between large-stock and corporate bond. Municipals yields are assumed to the same as long-term government bonds. Inflation-linked bond earns 5% ‘real’ return. Assume both capital guaranteed insurance and convertibles yield 5.8% as long-term government bonds. The returns on small cap value stock and large cap stocks are assumed to be 17.4% ± 2.5%; The returns on large cap value and growth stocks are assumed to be 12.3% ± 2.5%. This is consistent with the average annual difference between the returns on value stock and growth stock has been about 5% since 1926. Betas of other equity classes, including index and international equities are assumed to be 1.
| Description | Average asset allocation DB(%) | Average asset allocation DC Plan(%) | Assumed Beta | Indicated in JMB |
| Bonds | 18.2 | 4.1 | 0.175 | 0.175 |
| Corporate bonds | 1.8 | 0.3 | 0.230 | 0.175 |
| Government bonds | 2.1 | 0.5 | 0.179 | 0.175 |
| Municipal bonds | 0.1 | 0.2 | 0.205 | 0.175 |
| Inflation linked bond | 2.3 | 0.6 | 0.102 | 0.175 |
| International bonds | 1.0 | 0.2 | 0.175 | 0.175 |
| High yield bonds | 0.6 | 0.0 | 0.175 | 0.175 |
| General insurance | 0.6 | 13.4 | 0.205 | 0.175 |
| Convertible bond | 0.2 | 0.0 | 0.205 | 0.175 |
| Small cap value | 1.0 | 0.5 | 2.012 | 1.0 |
| Small cap growth | 1.1 | 0.5 | 1.372 | 1.0 |
| Small cap | 5.0 | 1.3 | 1 | 1.0 |
| Large cap value | 2.5 | 1.3 | 1.359 | 1.0 |
| Large cap growth | 2.0 | 1.2 | 0.717 | 1.0 |
| Large cap | 8.1 | 1.2 | 1 | 1.0 |
| Growth equities | 2.1 | 1.6 | 1.044 | 1.0 |
| Value equities | 2.6 | 1.1 | 1 | 1.0 |
| Indexed equities | 8.5 | 8.2 | 1 | 1.0 |
| International equity | 12.0 | 2.1 | 1 | 1.0 |
| Equities | 16.9 | 8.6 | 1 | 1.0 |
| Cash | 2.04 | 2.5 | 0.06 | 0.06 |
| Property | 2.1 | 0.2 | 0.15 | 0.150 |
| Company stock | 1.9 | 35.2 | Equity beta | Equity beta |
| Other investments | 5.26 | 15.2 | 0.795 | 1.0 |
Table 4.
ESTIMATES OF PENSION ASSET AND OPERATING BETAS.(Averages with standard deviation in brackets). This table reports the average pension risk and overestimation of cost of operating assets for cases (i) (PBO), (ii) (ABO), and (iii), the consolidated equity case. Beta of equity is estimated using capital asset pricing model, using data on three-year monthly stock return, obtained from the Center for Research in Security Prices, and the value-weighted return on all stocks on NYSE, AMEX, Nasdaq as the proxy for market. Operating asset beta correct is the operation asset beta when correctly accounting for pension value and risk, Operating asset beta error 1 is the operating asset beta ignoring pension plan altogether, and Operating asset beta error 2 is the operating asset beta counting pension value but misrepresenting pension risk.
Table 4.
ESTIMATES OF PENSION ASSET AND OPERATING BETAS.(Averages with standard deviation in brackets). This table reports the average pension risk and overestimation of cost of operating assets for cases (i) (PBO), (ii) (ABO), and (iii), the consolidated equity case. Beta of equity is estimated using capital asset pricing model, using data on three-year monthly stock return, obtained from the Center for Research in Security Prices, and the value-weighted return on all stocks on NYSE, AMEX, Nasdaq as the proxy for market. Operating asset beta correct is the operation asset beta when correctly accounting for pension value and risk, Operating asset beta error 1 is the operating asset beta ignoring pension plan altogether, and Operating asset beta error 2 is the operating asset beta counting pension value but misrepresenting pension risk.
| Case | Operating asset beta correct | Operating asset beta error1 | % overestimate for error 1 | Operating asset beta error 2 | % overestimate for error 2 |
| Panel A: Based on our assumptions | |||||
| (i): ABO | 0.560 (1.432) |
0.775 (1.403) |
38.3 | 1.186 (7.331) |
111.7 |
| (ii): PBO | 0.561 (1.432) |
0.770 (1.394) |
37.2 | 1.117 (6.221) |
99.1 |
| (iii) EBO | 0.560 (1.432) |
0.940 (3.842) |
67.8 | 1.115 (5.868) |
99.1 |
| Panel B: based on JMB assumptions | |||||
| (i): ABO | 0.297 (0.287) |
0.543 (0.537) |
82.8 | 0.574 (0.599) |
93.3 |
| (ii): PBO | 0.297 (0.287) |
0.509 (0.334) |
71.3 | 0.565 (0.551) |
90.2 |
| (iii) EBO | 0.297 (0.287) |
0.498 (0.324) |
67.7 | 0.566 (0.552) |
90.5 |
| Panel C: t statistics difference A-B | |||||
| (i): ABO | 4.005 | 3.477 | 1.775 | ||
| (ii): PBO | 4.005 | 4.142 | 1.909 | ||
| (iii) EBO | 3.536 | 2.448 | 1.991 | ||
| (iv) ABO v EBO | 0.573 | 0.362 | 1.255 | ||
| (v) ABO v PBO | -1.501 | 0.716 | 0.969 | ||
Table 5.
COST OF CAPITAL ESTIMATES. (Averages with standard deviation in brackets). This table reports the average systematic risk and overestimation of cost of operating assets for cases (i) – (iii). Beta of equity are estimated using capital asset pricing model, using data on three-year monthly stock return, obtained from the Center for Research in Security Prices, and the value-weighted return on all stocks on NYSE, AMEX, Nasdaq as the proxy for market. Operating asset beta correct is the operation asset beta when correctly accounting for pension value and risk, Operating asset beta error 1 is the operating asset beta ignoring pension plan altogether, and Operating asset beta error 2 is the operating asset beta counting pension value but misrepresenting pension risk.
Table 5.
COST OF CAPITAL ESTIMATES. (Averages with standard deviation in brackets). This table reports the average systematic risk and overestimation of cost of operating assets for cases (i) – (iii). Beta of equity are estimated using capital asset pricing model, using data on three-year monthly stock return, obtained from the Center for Research in Security Prices, and the value-weighted return on all stocks on NYSE, AMEX, Nasdaq as the proxy for market. Operating asset beta correct is the operation asset beta when correctly accounting for pension value and risk, Operating asset beta error 1 is the operating asset beta ignoring pension plan altogether, and Operating asset beta error 2 is the operating asset beta counting pension value but misrepresenting pension risk.
| Case | Correct Cost of capital estimate (%) | Cost of capital estimate error 1 (%) | % overestimate for error 1 | Cost of capital estimate error 2 (%) | % overestimate for error 2 |
| Panel A: Based on our assumptions | |||||
| (i): ABO | 7.448 (10.734) |
9.341 (10.192) |
25.5 | 12.218 (51.231) |
63.8 |
| (ii): PBO | 7.842 (10.411) |
9.317 (10.274) |
18.7 | 11.730 (44.485) |
49.2 |
| (iii) EBO | 8.818 (17.414) |
10.491 (27.136) |
18.9 | 11.721 (41.029) |
32.9 |
| Panel B: based on JMB assumptions | |||||
| (i): ABO | 7.088 (3.718) |
7.712 (4.423) |
8.9 | 7.929 (4.737) |
11.8 |
| (ii): PBO | 5.993 (2.822) |
7.479 (3.508) |
24.8 | 7.822 (4.220) |
30.5 |
| (iii) EBO | 6.041 (2.911) |
7.403 (3.458) |
22.5 | 7.873 (4.508) |
30.2 |
| Panel C: t statistics difference A-B | |||||
| (i): ABO | 0.742 | 3.477 | 1.776 | ||
| (ii): PBO | 4.005 | 4.104 | 1.909 | ||
| (iii) EBO | 3.526 | 2.448 | 1.991 | ||
| (iv) ABO v EBO | -0.573 | 1.230 | 1.255 | ||
| (v) ABO v PBO | -1.501 | 0.662 | 0.969 | ||
Table 6.
Relation Between Pension Risk and Firm Risk: Simple Regression: Non-distressed firms (existing and New GAAP, standard deviation in brackets). This table reports regression results for the sample from 2004 to 2008 using the procedure described in Jin et al. (2006, 14). The regression being run for cases (i) and (ii) is equation (7a) with βSOE = 0: . All results are estimated with company betas estimated using the market model and one lagged term and with the end of year pension data. The regression is run for each year, controlling for fixed effect at the industry level, and then the time series mean and standard deviation of the regression coefficients are used to make inferences. The standard deviation, reported under each coefficient and in parenthesis is further adjusted for potential time series correlation.
Table 6.
Relation Between Pension Risk and Firm Risk: Simple Regression: Non-distressed firms (existing and New GAAP, standard deviation in brackets). This table reports regression results for the sample from 2004 to 2008 using the procedure described in Jin et al. (2006, 14). The regression being run for cases (i) and (ii) is equation (7a) with βSOE = 0: . All results are estimated with company betas estimated using the market model and one lagged term and with the end of year pension data. The regression is run for each year, controlling for fixed effect at the industry level, and then the time series mean and standard deviation of the regression coefficients are used to make inferences. The standard deviation, reported under each coefficient and in parenthesis is further adjusted for potential time series correlation.
| Panel A: Case I - ABO | ||||||
| Asset allocation /financial distress assumption | ||||||
| Book-market ratio | Return on investments | Financial leverage | ||||
| BPL=0.18 | BPL=0.46 | BPL=0.18 | BPL=0.46 | BPL=0.18 | BPL=0.46 | |
| Intercept | 1.037 (0.097) |
1.049 (0.091) |
1.028 (0.109) |
1.042 (0.093) |
1.029 (0.096) |
1.042 (0.087) |
| Pension risk | 0.103 (0.097) |
0.144 (0.206) |
0.097 (0.146) |
0.108 (0.229) |
0.080 (0.116) |
0.105 (0.213) |
| No. of observations | 672 | 672 | 672 | 672 | 672 | 672 |
| R-Squared | 0.015 | 0.010 | 0.017 | 0.010 | 0.015 | 0.010 |
| Panel B: Case ii - PBO | ||||||
| Asset allocation /financial distress assumption | ||||||
| Book-market ratio | Return on investments | Financial leverage | ||||
| BPL=0.18 | BPL=0.46 | BPL=0.18 | BPL=0.46 | BPL=0.18 | BPL=0.46 | |
| Intercept | 1.035 (0.101) |
1.045 (0.095) |
1.024 (0.112) |
1.032 (0.098) |
1.030 (0.096) |
1.039 (0.089) |
| Pension risk | 0.119 (0.134) |
0.262 (0.350) |
0.154 (0.190) |
0.249 (0.331) |
0.078 (0.109) |
0.191 (0.347) |
| No. of observations | 672 | 672 | 672 | 672 | 672 | 672 |
| R-Squared | 0.030 | 0.025 | 0.037 | 0.027 | 0.018 | 0.017 |
| Panel C: Case iii - EBO | ||||||
| Asset allocation /financial distress assumption | ||||||
| Book-market ratio | Return on investments | Financial leverage | ||||
| BPL=0.18 | BPL=0.46 | BPL=0.18 | BPL=0.46 | BPL=0.18 | BPL=0.46 | |
| Intercept | 1.031 (0.103) |
1.046 (0.092) |
1.018 (0.118) |
1.030 (0.093) |
1.028 (0.095) |
1.039 (0.085) |
| Pension risk | 0.130 (0.145) |
0.210 (0.247) |
0.149 (0.229) |
0.346 (0.272) |
0.087 (0.106) |
0.161 (0.236) |
| No. of observations | 672 | 672 | 672 | 672 | 672 | 672 |
| R-Squared | 0.029 | 0.021 | 0.039 | 0.026 | 0.015 | 0.014 |
Table 7.
List of Control Variables. (following Jin et al., 2007, p. 15).
| Variable | Calculation | Compustat Item no. |
| Market share by value | Calculated using market value and the industry classification codes | DATA24*DATA25 |
| Market share by sales | Calculated using total sales and the industry classification codes | DATA12 |
| Capital intensiveness | Current assets/total assets | DATA4/DATA6 |
| Cash position | Cash and short-term investments/total assets | DATA1/DATA6 |
| Financial leverage | Debt/total assets/ | (Data9+Data34)/DATA6 |
| Growth rate | Log(total assets/lagged total assets) | Log(DATA6)/DATA6_lag) |
| Liquidity | Current assets/current liabilities | DATA4/DATA5 |
| Return on investment | Net income/total assets | DATA172/DATA6 |
| Firm size | Log(total assets) | Log(DATA6) |
| Research and development | Research and development expense/total assets | DATA46/DATA6 |
| Advertisement | Advertising expense/total assets | DATA45/DATA6 |
Table 8.
Relation Between Pension Risk and Firm Risk: Regression: Nondistressed Firms. This table reports regression results for the sample from 2004 to 2008 using the procedure described in Jin et al. (2006, 14) and based on US GAAP. The regression being run is . All results are estimated with company betas estimated using the market model and one lagged term and with the end of year pension data. The regression is run for each year, controlling for fixed effect at the industry level, and then the time series mean and standard deviation of the regression coefficients are used to make inferences. The standard deviation, reported under each coefficient and in parenthesis is further adjusted for potential time series correlation. This table shows the effect of revising firm risk estimates based on incorporating risk management assets, which can either be held as insurance, case (iii) or as risk capital, case (iv).
Table 8.
Relation Between Pension Risk and Firm Risk: Regression: Nondistressed Firms. This table reports regression results for the sample from 2004 to 2008 using the procedure described in Jin et al. (2006, 14) and based on US GAAP. The regression being run is . All results are estimated with company betas estimated using the market model and one lagged term and with the end of year pension data. The regression is run for each year, controlling for fixed effect at the industry level, and then the time series mean and standard deviation of the regression coefficients are used to make inferences. The standard deviation, reported under each coefficient and in parenthesis is further adjusted for potential time series correlation. This table shows the effect of revising firm risk estimates based on incorporating risk management assets, which can either be held as insurance, case (iii) or as risk capital, case (iv).
| Panel A: Case i - ABO | |||||||||
| Asset allocation / assumption | |||||||||
| Book-market ratio | Return on investments | Financial leverage | |||||||
| BPL=0.18 | BPL=0.46 | BPL=0.18 | BPL=0.46 | BPL=0.18 | BPL=0.46 | ||||
| Intercept | 1.895 (0.392) |
1.875 (0.385) |
2.004 (0.384) |
1.976 (0.382) |
2.147 (0.570) |
2.125 (0.566) |
|||
| Pension risk | 0.113 (0.100) |
0.158 (0.162) |
0.190 (0.188) |
0.142 (0.213) |
0.081 (0.092) |
0.114 (0.161) |
|||
| Market share by value | -0.246 (0.125) |
-0.247 (0.124) |
-0.211 (0.222) |
-0.206 (0.216) |
-0.151 (0.232) |
-0.144 (0.224) |
|||
| Market share by sales | 0.130 (0.204) |
0.148 (0.196) |
0.152 (0.173 |
0.154 (0.160) |
0.143 (0.168) |
0.147 (0.160) |
|||
| Capital intensiveness | 0.239 (0.240) |
0.257 (0.251) |
0.185 (0.218) |
0.219 (0.249) |
0.152 (0.204) |
0.176 (0.236) |
|||
| Cash position | 0.407 (0.779) |
0.402 (0.770) |
0.556 (0.726) |
0.554 (0.721) |
0.586 (0.754) |
0.584 (0.738) |
|||
| Financial leverage | -0.277 (0.171) |
-0.296 (0.131) |
-0.401 (0.187) |
-0.422 (0.172) |
-0.643 (0.324) |
-0.660 (0.292) |
|||
| Growth rate | 0.414 (0.514) |
0.395 (0.515) |
0.571 (0.561) |
0.564 (0.573) |
0.506 (0.564) |
0.493 (0.570) |
|||
| Liquidity | 0.001 (0.003) |
0.001 (0.003) |
0.001 (0.002) |
0.001 (0.002) |
0.000 (0.004) |
0.000 (0.004) |
|||
| Return on investment | -0.015 (2.188) |
-0.054 (2.285) |
0.191 (2.224) |
0.067 (2.358) |
-0.299 (2.012 |
-0.362 (2.101) |
|||
| Firm size | -0.090 (0.049) |
-0.087 (0.049) |
-0.102 (0.052) |
-0.097 (0.052) |
-0.103 (0.060) |
-0.098 (0.062) |
|||
| Advertisement | -2.825 (2.135) |
-2.787 (2.140) |
-1.870 (1.756) |
-1.838 (1.750) |
-1.887 (1.078) |
-1.851 (1.081) |
|||
| Research and development | 1.170 (2.207) |
1.154 (2.097) |
1.094 (1.765) |
0.812 (2.061) |
0.463 (2.070) |
0.417 (2.037) |
|||
| No. of observations | 684 | 684 | 684 | 684 | 684 | 684 | |||
| R-Squared | 0.278 | 0.275 | 0.282 | 0.277 | 0.277 | 0.275 | |||
| Panel B: Case ii - PBO | |||||||||
| Asset allocation /financial distress assumption | |||||||||
| Book-market ratio | Return on investments | Financial leverage | |||||||
| BPL=0.18 | BPL=0.46 | BPL=0.18 | BPL=0.46 | BPL=0.18 | BPL=0.46 | ||||
| Intercept | 1.887 (0.396) |
1.864 (0.393) |
2.000 (0.387) |
1.965 (0.385) |
2.152 (0.576) |
2.128 (0.575) |
|||
| Pension risk | 0.116 (0.131) |
0.264 (0.255) |
0.111 (0.176) |
0.326 (0.254) |
0.101 (0.132) |
0.195 (0.290) |
|||
| Market share by value | -0.199 (0.152) |
-0.207 (0.130) |
-0.174 (0.240) |
-0.169 (0.220) |
-0.140 (0.227) |
-0.105 (0.255) |
|||
| Market share by sales | 0.076 (0.234) |
0.104 (0.207) |
0.112 (0.217) |
0.118 (0.182) |
0.182 (0.178) |
0.102 (0.208) |
|||
| Capital intensiveness | 0.216 (0.228) |
0.250 (0.216) |
0.147 (0.193) |
0.192 (0.220) |
0.100 (0.240) |
0.165 (0.235) |
|||
| Cash position | 0.455 (0.838) |
0.456 (0.835) |
0.587 (0.793) |
0.581 (0.798) |
0.447 (0.783) |
0.560 (0.724) |
|||
| Financial leverage | -0.226 (0.242) |
-0.247 (0.203) |
-0.352 (0.242) |
-0.384 (0.204) |
-0.622 (0.300) |
-0.648 (0.270) |
|||
| Growth rate | 0.404 (0.500) |
0.385 (0.504) |
0.577 (0.550) |
0.571 (0.572) |
0.509 (0.561) |
0.505 (0.573) |
|||
| Liquidity | 0.001 (0.003) |
0.001 (0.003) |
0.001 (0.002) |
0.001 (0.002) |
0.000 (0.004) |
0.000 (0.004) |
|||
| Return on investment | 0.096 (2.082) |
0.062 (2.153) |
0.306 (2.029) |
0.176 (2.135) |
-0.276 (2.007) |
-0.342 (2.108) |
|||
| Firm size | -0.092 (0.052) |
-0.089 (0.051) |
-0.104 (0.053) |
-0.099 (0.053) |
-0.104 (0.063) |
-0.101 (0.063) |
|||
| Advertisement | -2.916 (2.147) |
-2.883 (2.071) |
-1.904 (1.703) |
-1.884 (1.601) |
-1.832 (1.065) |
-1.762 (1.070) |
|||
| Research and development | 2.312 (1.618) |
2.516 (2.066) |
2.011 (1.843) |
1.847 (1.643) |
0.449 (1.927) |
0.384 (1.783) |
|||
| No. of observations | 684 | 684 | 684 | 684 | 684 | 684 | |||
| R-Squared | 0.284 | 0.281 | 0.291 | 0.286 | 0.276 | 0.278 | |||
| Panel C: Case iii - EBO | |||||||||
| Asset allocation /financial distress assumption | |||||||||
| Book-market ratio | Return on investments | Financial leverage | |||||||
| BPL=0.18 | BPL=0.46 | BPL=0.18 | BPL=0.46 | BPL=0.18 | BPL=0.46 | ||||
| Intercept | 1.893 (0.381) |
1.876 (0.382) |
2.017 (0.372) |
1.975 (0.374) |
2.155 (0.557) |
2.137 (0.558) |
|||
| Pension risk | 0.122 (0.122) |
0.221 (0.181) |
0.147 (0.209) |
0.321 (0.245) |
0.079 (0.088) |
0.163 (0.204) |
|||
| Market share by value | -0.199 (0.159) |
-0.191 0.154 |
-0.171 (0.255) |
-0.169 (0.233) |
-0.111 (0.284) |
-0.104 (0.275) |
|||
| Market share by sales | 0.073 (0.244) |
0.090 (0.237) |
0.097 (0.228) |
0.116 (0.198) |
0.086 (0.238) |
0.096 (0.229) |
|||
| Capital intensiveness | 0.225 (0.219) |
0.244 (0.226) |
0.163 (0.189) |
0.199 (0.213) |
0.324 (0.278) |
0.175 (0.223) |
|||
| Cash position | 0.427 (0.849) |
0.435 (0.860) |
0.563 (0.767) |
0.573 (0.803) |
0.222 (0.977) |
0.545 (0.731) |
|||
| Financial leverage | -0.224 (0.235) |
-0.247 (0.213) |
-0.360 (0.219) |
-0.380 (0.207) |
-0.293 (0.585) |
-0.633 (0.270) |
|||
| Growth rate | 0.428 (0.445) |
0.411 (0.449) |
0.588 (0.515) |
0.582 (0.537) |
0.384 (0.562) |
0.512 (0.532) |
|||
| Liquidity | 0.001 (0.003) |
0.001 (0.003) |
0.001 (0.002) |
0.001 (0.002) |
-0.172 (0.389) |
0.000 (0.004 |
|||
| Return on investment | 0.090 (2.124) |
0.051 (2.169) |
0.258 (2.045) |
0.168 (2.106) |
-0.128 (2.033) |
-0.340 (2.131) |
|||
| Firm size | -0.093 (0.049) |
-0.091 (0.049) |
-0.106 0.051) |
-0.101 (0.051) |
-0.308 (0.456) |
-0.102 (0.062) |
|||
| Advertisement | -3.000 (2.146) |
-2.920 (2.126) |
-2.107 (1.802) |
-2.060 (1.716) |
-1.947 (1.010) |
-1.842 (1.036) |
|||
| Research and development | 2.177 (1.449) |
2.541 (2.076) |
1.767 (1.557) |
1.839 (1.649) |
0.376 (2.131) |
0.384 (1.888) |
|||
| No. of observations | 684 | 684 | 684 | 684 | 684 | 684 | |||
| R-Squared | 0.287 | 0.284 | 0.294 | 0.285 | 0.275 | 0.276 | |||
Table 9.
Relation Between Pension Risk and Firm Risk: Simple Regression: Distressed firms (existing and New GAAP, standard deviation in brackets). This table reports regression results for the sample from 2004 to 2008 using the procedure described in Jin et al. (2006, 14). The regression being run for cases (i) and (ii) is equation (7a) with βSOE = 0: . All results are estimated with company betas estimated using the market model and one lagged term and with the end of year pension data. The regression is run for each year, controlling for fixed effect at the industry level, and then the time series mean and standard deviation of the regression coefficients are used to make inferences. The standard deviation, reported under each coefficient and in parenthesis is further adjusted for potential time series correlation.
Table 9.
Relation Between Pension Risk and Firm Risk: Simple Regression: Distressed firms (existing and New GAAP, standard deviation in brackets). This table reports regression results for the sample from 2004 to 2008 using the procedure described in Jin et al. (2006, 14). The regression being run for cases (i) and (ii) is equation (7a) with βSOE = 0: . All results are estimated with company betas estimated using the market model and one lagged term and with the end of year pension data. The regression is run for each year, controlling for fixed effect at the industry level, and then the time series mean and standard deviation of the regression coefficients are used to make inferences. The standard deviation, reported under each coefficient and in parenthesis is further adjusted for potential time series correlation.
| Panel A: Case i ABO | ||||||
| Asset allocation /financial distress assumption | ||||||
| Book-market ratio | Return on investments | Financial leverage | ||||
| BPL=0.18 | BPL=0.46 | BPL=0.18 | BPL=0.46 | BPL=0.18 | BPL=0.46 | |
| Intercept | 1.001 (0.287) |
0.932 (0.206) |
1.047 (0.145) |
1.058 (0.126) |
0.843 (0.167) |
0.892 (0.162) |
| Pension risk | -0.386 (1.310) |
0.603 (0.789) |
0.098 (0.160) |
0.130 (0.230) |
0.676 (0.757) |
1.066 (1.088) |
| No. of observations | 75 | 75 | 75 | 75 | 75 | 75 |
| R-Squared | 0.055 | 0.037 | 0.075 | 0.069 | 0.229 | 0.260 |
| Panel B: Case ii PBO | ||||||
| Asset allocation /financial distress assumption | ||||||
| Book-market ratio | Return on investments | Financial leverage | ||||
| BPL=0.18 | BPL=0.46 | BPL=0.18 | BPL=0.46 | BPL=0.18 | BPL=0.46 | |
| Intercept | 1.018 (0.261) |
0.968 (0.192) |
0.989 (0.160) |
1.050 (0.133) |
0.841 (0.156) |
0.904 (0.144) |
| Pension risk | -0.420 (0.969) |
0.016 (0.971) |
0.195 (0.254) |
0.355 (0.353) |
0.687 (0.754) |
1.145 (1.028) |
| No. of observations | 75 | 75 | 75 | 75 | 75 | 75 |
| R-Squared | 0.071 | 0.030 | 0.084 | 0.077 | 0.207 | 0.222 |
| Panel C: Case iii EBO | ||||||
| Asset allocation /financial distress assumption | ||||||
| Book-market ratio | Return on investments | Financial leverage | ||||
| BPL=0.18 | BPL=0.46 | BPL=0.18 | BPL=0.46 | BPL=0.18 | BPL=0.46 | |
| Intercept | 1.012 (0.250) |
0.964 (0.183) |
1.040 (0.152) |
1.051 (0.129) |
0.841 (0.181) |
0.906 (0.173) |
| Pension risk | -0.344 (0.818) |
0.311 (0.509) |
0.143 (0.239) |
0.345 (0.287) |
0.706 (0.776) |
1.218 (1.054) |
| No. of observations | 75 | 75 | 75 | 75 | 75 | 75 |
| R-Squared | 0.046 | 0.028 | 0.089 | 0.081 | 0.229 | 0.248 |
Table 10.
Robustness Check with impact of employer security removed from security risk. This table reports regression results for the sample from 2004 to 2008 using the procedure described in Jin et al. (2006, 14). This regression being run is . For case (iv) it is the extended model applicable to the combined entity of the firm and the sponsored SOE/SOE Plan; i.e., . All results are estimated with company betas estimated using the market model and one lagged term and with the end of year pension data. The regression is run for each year, controlling for fixed effect at the industry level, and then the time series mean and standard deviation of the regression coefficients are used to make inferences. The standard deviation, reported under each coefficient and in parenthesis is further adjusted for potential time series correlation. This table shows the effect of revising firm risk estimates based on incorporating risk management assets, which can either be held as insurance, case (iii) or as risk capital, case (iv).
Table 10.
Robustness Check with impact of employer security removed from security risk. This table reports regression results for the sample from 2004 to 2008 using the procedure described in Jin et al. (2006, 14). This regression being run is . For case (iv) it is the extended model applicable to the combined entity of the firm and the sponsored SOE/SOE Plan; i.e., . All results are estimated with company betas estimated using the market model and one lagged term and with the end of year pension data. The regression is run for each year, controlling for fixed effect at the industry level, and then the time series mean and standard deviation of the regression coefficients are used to make inferences. The standard deviation, reported under each coefficient and in parenthesis is further adjusted for potential time series correlation. This table shows the effect of revising firm risk estimates based on incorporating risk management assets, which can either be held as insurance, case (iii) or as risk capital, case (iv).
| Panel A: Case I - ABO | ||||||
| Financial distress assumption | ||||||
| Book-market ratio | Return on investments | Financial leverage | ||||
| BPL=0.18 | BPL=0.46 | BPL=0.18 | BPL=0.46 | BPL=0.18 | BPL=0.46 | |
| Intercept | 1.895 (0.391) |
1.865 (0.379) |
1.913 (0.466) |
1.877 (0.462) |
2.147 (0.570) |
2.126 (0.566) |
| Pension risk | 0.113 (0.100) |
0.053 (0.193) |
0.108 (0.138) |
0.157 (0.199) |
0.081 (0.092) |
0.114 (0.161) |
| Market share by value | -0.246 (0.125) |
-0.167 (0.237) |
-0.246 (0.159) |
-0.255 (0.148) |
-0.151 (0.232) |
-0.144 (0.223) |
| Market share by sales | -0.246 (0.125) |
-0.167 (0.237) |
-0.246 (0.159) |
-0.255 (0.148) |
-0.151 (0.232) |
-0.144 (0.223) |
| Capital intensiveness | 0.239 (0.240) |
0.287 (0.270) |
0.235 (0.238) |
0.273 (0.262) |
0.152 (0.204) |
0.176 (0.236) |
| Cash position | 0.407 (0.779) |
0.211 (0.864) |
0.589 (0.696) |
0.493 (0.841) |
0.586 (0.754) |
0.584 (0.738) |
| Financial leverage | -0.277 (0.171) |
0.053 (0.675) |
-0.300 (0.140) |
-0.322 (0.136) |
-0.643 (0.324) |
-0.660 (0.292) |
| Growth rate | 0.412 (0.514) |
0.255 (0.250) |
0.577 (0.562) |
0.568 (0.575) |
0.506 (0.564) |
0.493 (0.570) |
| Liquidity | 0.001 (0.003) |
0.558 (1.246) |
0.001 (0.002) |
0.001 (0.002) |
0.000 (0.004) |
0.000 (0.004) |
| Return on investment | -0.015 (2.188) |
-0.644 (1.665) |
0.418 (2.239) |
0.322 (2.380) |
-0.299 (2.012) |
-0.362 (2.101) |
| Firm size | -0.090 (0.049) |
-1.335 (2.836) |
-0.098 (0.057) |
-0.093 (0.056) |
-0.103 (0.060) |
-0.100 (0.060) |
| Advertisement | -2.825 (2.135) |
-1.199 (1.678) |
-2.078 (1.951) |
-2.048 (1.953) |
-1.887 (1.078) |
-1.851 (1.081) |
| Research and development | 1.170 (2.207) |
0.912 (2.112) |
1.633 (2.025) |
1.394 (2.438) |
0.463 (2.070) |
0.417 (2.037) |
| No. of observations | 684 | 684 | 684 | 684 | 684 | 684 |
| R-Squared | 0.2788 | 0.275 | 0.254 | 0.287 | 0.277 | 0.275 |
| Panel B: Case ii PBO | ||||||
| Financial distress assumption | ||||||
| Book-market ratio | Return on investments | Financial leverage | ||||
| BPL=0.18 | BPL=0.46 | BPL=0.18 | BPL=0.46 | BPL=0.18 | BPL=0.46 | |
| Intercept | 1.887 (0.396) |
1.864 (0.393) |
1.894 (0.482) |
1.857 (0.473) |
2.152 (0.576) |
2.128 (0.575) |
| Pension risk | 0.116 (0.131) |
0.051 (0.282) |
0.106 (0.177) |
0.285 (0.312) |
0.074 (0.098) |
0.195 (0.290) |
| Market share by value | -0.212 (0.141) |
-0.038 (0.272) |
-0.225 (0.204) |
-0.202 (0.198) |
-0.113 (0.272) |
-0.105 (0.255) |
| Market share by sales | 0.088 (0.222) |
-0.019 (0.132) |
0.085 (0.233) |
0.188 (0.217) |
0.095 (0.227) |
0.102 (0.208) |
| Capital intensiveness | 0.216 (0.228) |
0.394 (0.143) |
0.210 (0.224) |
0.074 (0.389) |
0.146 (0.192) |
0.165 (0.235) |
| Cash position | 0.455 (0.838) |
0.291 (0.878) |
0.525 (0.860) |
0.572 (0.816) |
0.574 (0.754) |
0.560 (0.724) |
| Financial leverage | -0.225 (0.242) |
-0.135 (0.335) |
-0.242 (0.168) |
-0.139 (0.345) |
-0.622 (0.300) |
-0.648 (0.270) |
| Growth rate | 0.404 (0.500) |
0.317 (0.534) |
0.584 (0.552) |
0.493 (0.631) |
0.509 (0.561) |
0.505 (0.573) |
| Liquidity | 0.001 (0.003) |
-0.079 (0.180) |
0.001 (0.002) |
0.131 (0.290) |
0.000 (0.004) |
0.000 (0.004) |
| Return on investment | 0.096 (2.082) |
0.122 (2.141) |
0.583 (2.055) |
0.328 (2.184) |
-0.276 (2.007) |
-0.342 (2.108) |
| Firm size | -0.092 (0.052) |
-0.409 (0.725) |
-0.099 (0.059) |
-0.376 (0.605) |
-0.104 (0.063) |
-0.101 (0.063) |
| Advertisement | -2.916 (2.146) |
-2.540 (2.426) |
-2.137 (1.775) |
-1.338 (2.684) |
-1.832 (1.065) |
-1.772 (1.072) |
| Research and development | 2.312 (1.618) |
2.649 (1.877) |
2.508 (1.730) |
1.891 (1.921) |
0.382 (1.945) |
0.384 (1.783) |
| No. of observations | 684 | 684 | 684 | 684 | 684 | 684 |
| R-Squared | 0.284 | 0.281 | 0.301 | 0.293 | 0.280 | 0.276 |
| Panel C: Case iii - EBO | ||||||
| Financial distress assumption | ||||||
| Book-market ratio | Return on investments | Financial leverage | ||||
| BPL=0.18 | BPL=0.46 | BPL=0.18 | BPL=0.46 | BPL=0.18 | BPL=0.46 | |
| Intercept | 1.893 (0.381) |
1.876 (0.382) |
1.913 (0.463) |
1.870 (0.453) |
2.155 (0.557) |
2.137 (0.558) |
| Pension risk | 0.122 (0.122) |
0.221 (0.181) |
0.138 (0.213) |
0.308 (0.256) |
0.079 (0.088) |
0.163 (0.204) |
| Market share by value | -0.199 (0.159) |
-0.191 (0.154) |
-0.212 (0.215) |
-0.213 (0.190) |
-0.111 (0.284) |
-0.104 (0.275) |
| Market share by sales | 0.072 (0.244) |
0.089 (0.237) |
0.069 (0.245) |
0.093 (0.215) |
0.086 (0.238) |
0.093 (0.230) |
| Capital intensiveness | 0.226 (0.219) |
0.244 (0.227) |
0.221 (0.211) |
0.263 (0.227) |
0.157 (0.197) |
0.175 (0.223) |
| Cash position | 0.427 (0.849) |
0.436 (0.860) |
0.518 (0.856) |
0.519 (0.897) |
0.533 (0.746) |
0.545 (0.731) |
| Financial leverage | -0.224 (0.235) |
-0.247 (0.213) |
-0.247 (0.175) |
-0.267 (0.171) |
-0.610 (0.288) |
-0.633 (0.270) |
| Growth rate | 0.428 (0.445) |
0.411 (0.449) |
0.594 (0.519) |
0.586 (0.541) |
0.519 (0.524) |
0.512 (0.532) |
| Liquidity | 0.001 (0.003) |
0.001 (0.003) |
0.001 (0.002) |
0.001 (0.002) |
0.008 (0.020) |
0.000 (0.004) |
| Return on investment | 0.091 (2.124) |
0.051 (2.169) |
0.513 (2.056) |
0.425 (2.127) |
-0.285 (2.059) |
-0.340 (2.131) |
| Firm size | -0.093 (0.049) |
-0.090 (0.050) |
-0.101 (0.056) |
-0.095 (0.055) |
-0.105 (0.061) |
-0.104 (0.060) |
| Advertisement | -3.001 (2.145) |
-2.920 (2.126) |
-2.330 (1.893) |
-2.280 (1.820) |
-1.947 (1.010) |
-1.842 (1.036) |
| Research and development | 2.177 (1.449) |
2.541 (2.076) |
2.336 (1.659) |
2.442 (1.722) |
0.376 (2.131) |
0.384 (1.888) |
| No. of observations | 684 | 684 | 684 | 684 | 684 | 684 |
| R-Squared | 0.336 | 0.284 | 0.304 | 0.296 | 0.276 | 0.275 |
Table 11.
Relation Between Pension Beta and Firm Systematic Risk: OLS Regression. (DB plan surviving firms v DB plan terminating firms). This table reports regression results of the relation between pension beta risk and firm beta risk for the sample from 2006 to 2008 separately for those firms which continued to operate DB pension plans (283 firm observations) and those which terminated DB plans during the previous five years (167 firm observations). This table reports regression results for the sample from 2006 to 2008 The regression being run is either or Results are reported separately for pension risk defined in accord with equation 7a (all equity) and equation 7b (after controlling for employees’ equity). All results are estimated with company betas estimated using the market model and one lagged term and with the end of year pension data. Standard deviations are shown in brackets.
Table 11.
Relation Between Pension Beta and Firm Systematic Risk: OLS Regression. (DB plan surviving firms v DB plan terminating firms). This table reports regression results of the relation between pension beta risk and firm beta risk for the sample from 2006 to 2008 separately for those firms which continued to operate DB pension plans (283 firm observations) and those which terminated DB plans during the previous five years (167 firm observations). This table reports regression results for the sample from 2006 to 2008 The regression being run is either or Results are reported separately for pension risk defined in accord with equation 7a (all equity) and equation 7b (after controlling for employees’ equity). All results are estimated with company betas estimated using the market model and one lagged term and with the end of year pension data. Standard deviations are shown in brackets.
| Panel A: surviving firms (n = 283 firm observations) | ||||||
| Pension Asset allocation / Pension liability assumption | ||||||
| Beta=ABO | Beta=PBO | Beta=EBO | ||||
| Equation 7a | Equation 7b | Equation 7a | Equation 7b | Equation 7a | Equation 7b | |
| Intercept | 0.133 (0.765) |
0.087 (0.760) |
2.047 (1.388)* |
1.962 (1.381) |
0.817 (2.745) |
0.714 (2.737) |
| Pension risk | -0.122 (0.173) |
-0.399 (0.204) |
-0.251 (0.315) |
-0.627 (0.552) |
-0.347 (0.622) |
-0.538 (1.094) |
| Market share by value | -0.003 (0.001) |
-0.003 (0.001) |
-0.003 (0.001) |
-0.004 (0.001) |
-0.001 (0.001)* |
-0.001 (0.001)* |
| Capital intensiveness | -0.237 (0.434) |
-0.232 (0.429) |
-0.795 (0.788) |
-0.811 (0.779) |
-0.690 (1.558) |
-0.747 (1.543) |
| Cash position | 2.107 (0.949) |
2.115 (0.942) |
4.717 (1.722)*** |
4.758 (1.711)*** |
8.251 (3.406)*** |
8.354 (3.389)*** |
| Financial leverage | -1.048 (0.345)** |
-1.122 (0.349)*** |
-1.011 (0.626)* |
-1.114 (0.634)*** |
-2.026 (1.238)* |
-2.079 (1.256)* |
| Growth rate | -0.143 (0.297) |
-0.176 (0.296) |
0.195 (0.539) |
0.146 (0.539) |
-0.218 (1.066) |
-0.247 (1.067) |
| Liquidity | -0.002 (0.002) |
-0.002 (0.002) |
-0.000 (0.004) |
-0.001 (0.004) |
0.001 (0.008) |
-0.001 (0.008) |
| Return on investment | -0.516 (0.907) |
-0.386 (0.900) |
0.140 (1.645) |
1.710 (3.239) |
1.521 (3.254) |
1.710 (3.239) |
| Firm size | 0.095 (0.077) |
0.099 (0.077) |
-0.063 (0.140) |
0.144 (0.277) |
0.142 (0.277) |
0.144 (0.277) |
| Advertisement | 0.574 (1.502) |
0.389 (1.503) |
-1.445 (2.725) |
-1.334 (5.408) |
-1.121 (5.390) |
-1.344 (5.408) |
| Research and development | 0.172 (0.719) |
0.204 (0.715) |
0.115 (1.304) |
0.053 (2.573) |
-0.020 (2.580) |
0.053 (2.573) |
| Idiosyncratic risk | -0.018 (0.036) |
-0.015 (0.035) |
-0.078 (0.065) |
-0.153 (0.128) |
-0.154 (0.128) |
-0.153 (0.128) |
| No. of observations | 450 | 450 | 450 | 450 | 450 | 450 |
| R-Squared | 0.065 | 0.069 | 0.076 | 0.068 | 0.068 | 0.068 |
| Panel B: terminating firms (n = 167 firm observations) | ||||||
| Pension Asset allocation / Pension liability assumption | ||||||
| Beta=ABO | Beta=PBO | Beta=EBO | ||||
| Equation 7a | Equation 7b | Equation 7a | Equation 7b | Equation 7a | Equation 7b | |
| Intercept | 4.008 (2.628)* |
3.542 (2.603) |
2.278 (1.674) |
2.208 (1.650) |
2.154 (2.280) |
2.368 (2.294) |
| Pension risk | -0.660 (0.537) |
0.269 (0.432) |
0.155 (0.342) |
0.136 (0.274) |
1.102 (0.466)** |
0.082 (0.380) |
| Market share by value | -0.004 (0.001) |
-0.002 (0.001) |
-0.004 (0.001) |
-0.005 (0.001) |
0.004 (0.001) |
-0.004 (0.001) |
| Capital intensiveness | -1.576 (1.321) |
-1.337 (1.312) |
1.462 (0.842)* |
1.611 (0.832)** |
1.808 (1.146)* |
2.096 (1.156)* |
| Cash position | 14.650 (1.882)*** |
14.938 (1.814)*** |
-2.423 (1.199)* |
-2.546 (1.150)** |
-1.903 (1.633) |
-2.683 (1.598)* |
| Financial leverage | -0.793 (1.337) |
-0.191 (1.243) |
-3.103 (0.852)*** |
-3.157 (0.788)*** |
-3.587 (1.160)*** |
-4.282 (1.095)*** |
| Growth rate | 0.270 (1.350) |
0.251 (1.339) |
-0.235 (0.860) |
-0.163 (0.849) |
-0.104 (1.171) |
0.076 (1.180) |
| Liquidity | -0.002 (0.027) |
-0.006 (0.027) |
-0.009 (0.017) |
-0.009 (0.017) |
-0.029 (0.023) |
-0.024 (0.024) |
| Return on investment | -2.484 (2.313) |
-2.469 (2.298) |
0.932 (1.473) |
0.873 (1.456) |
-0.521 (2.007) |
-0.589 (2.025) |
| Firm size | -0.294 (0.268) |
-0.315 (0.264) |
-0.063 (0.171) |
-0.047 (0.167) |
-0.091 (0.232) |
-0.019 (0.233) |
| Advertisement | -1.492 (5.105) |
-2.672 (4.990) |
4.634 (3.252) |
4.644 (3.163) |
5.052 (4.429) |
5.912 (4.396) |
| Research and development | -9.246 (9.558) |
-10.360 (9.587)*** |
-6.736 (6.090) |
-7.320 (6.077) |
-17.539 (8.293)** |
-17.875 (8.447)** |
| Idiosyncratic risk | -0.164 (0.113)* |
0.269 (0.432) |
-0.110 (0.072)* |
-0.113 (0.071)* |
-0.075 (0.098) |
-0.090 (0.098) |
| No. of observations | 450 | 450 | 450 | 450 | 450 | 450 |
| R-Squared | 0.446 | 0.430 | 0.227 | 0.229 | 0.220 | 0.220 |
Disclaimer/Publisher’s Note: The statements, opinions and data contained in all publications are solely those of the individual author(s) and contributor(s) and not of MDPI and/or the editor(s). MDPI and/or the editor(s) disclaim responsibility for any injury to people or property resulting from any ideas, methods, instructions or products referred to in the content. |
© 2024 by the author. Licensee MDPI, Basel, Switzerland. This article is an open access article distributed under the terms and conditions of the Creative Commons Attribution (CC BY) license (https://creativecommons.org/licenses/by/4.0/).
Copyright: This open access article is published under a Creative Commons CC BY 4.0 license, which permit the free download, distribution, and reuse, provided that the author and preprint are cited in any reuse.


