
Submitted:
26 September 2024
Posted:
27 September 2024
You are already at the latest version
Abstract
This study investigated whether quantitative MRI and histology of the prostate reveals differences between races that can affect diagnosis. Cancer signal enhancement rate (α) on DCE-MRI was significantly higher for African Americans (AA) compared to Caucasian Americans (CA). Signal washout rate (β) was significantly lower in benign tissue in AAs and significantly elevated in cancers in AAs. However, no significant differences were found for ADC and T2. ROC analysis showed that ADC and T2 are slightly less effective in AA compared to CA. DCE significantly improves the differentiation of PCa from benign in AAs (α: 52%, β: 62% more effective in AA compared to CA). Histologic analysis showed cancers have a greater proportion of epithelium and lower lumen in AA compared to CA. This study shows that the different races have different quantitative MRI values and histologic makeup. Quantitative DCE-MRI is highly effective and improves PCa diagnosis in African Americans.
Keywords:
prostate cancer
; MRI
; racial differences
; quantitative
; DCE-MRI
; African Americans
; Caucasian Americans
Introduction
Prostate cancer (PCa) is the second most common diagnosed cancer in men, with 1 in 8 men diagnosed with it, and is one of the leading causes of cancer-related deaths worldwide [1,2] . PCa incidence and mortality is strongly associated with age, with an average age of diagnosis at 67 years old [3]. In addition to age, there are inherited and genetic risk factors for prostate cancer. Men with a family history of prostate cancer (inherited risk factors), genetic risk factors (germline mutations – BRCA2 gene), and specific race (African ancestry) have an elevated risk for developing prostate cancer [3,4,5,6].
African Americans (AA) have higher risk for prostate cancer compared to Caucasian Americans (CA), likely due to a combination of factors including underlying tumor differences (aggressiveness), genetic factors, and racial disparities in access to healthcare [5,7,8,9]. This is a critical problem, especially because PCa detected in AAs is typically more aggressive and advanced compared to PCa in CAs, and the mortality rate for AAs with PCa compared to CAs is significantly higher, even after adjusting for prognostic factors (PSA level, age, clinical stage, Gleason score) [10,11]. A recent study found that racial disparities were greatest in non-clinically significant low-grade Gleason 6 disease, in which AA men were twice as likely to die of Gleason 6 tumors compared to men from other ethnicities [5]. There are no studies that have clearly established racial differences in prostate cancer biology and physiology that could affect diagnosis using imaging methods.
MRI can play an important role in the diagnosis and management of PCa because it is non-invasive, can reliably detect clinically significant tumors, and can provide information regarding tumor size, location, and grade [12]. The current diagnostic radiology guidelines for prostate MRI is the Prostate Imaging—Reporting and Data System (PI-RADS v2.1) [13]. This system utilizes T2-weighted (T2W) imaging and diffusion weighting imaging (DWI) as the primary sequences, while there is less emphasis on dynamic contrast-enhanced (DCE) MRI which is used as a secondary sequence. It is also important to note that PI-RADS guidelines were recommended by a steering committee that is almost entirely comprised of experts from US and Europe, and most of the published prostate MRI research has been done predominantly on Caucasian populations [14]. While PI-RADS guidelines may provide accurate diagnoses for certain populations (Caucasians), we should not assume that the same solution will work for other patient populations as well, such as African Americans who are at a higher risk for PCa [15] and Asians who are at a lower risk for PCa [16]. This is especially important, as physician decision bias and disparities in access to healthcare exists for AA patients. AA are less likely to undergo MRI imaging following an elevated prostate-specific antigen (PSA) compared to CAs [17].
A recent study by Mahran et al. [18] showed racial disparity in the utility of qualitative multi-parametric MRI for the diagnosis for PCa. It is likely that the poor performance in PCa diagnosis is due, in part, to failure to account for racial differences in prostate and PCa biology and physiology. However, there are no studies that have evaluated racial differences in biomarkers/parameters from quantitative MRI. Whether PCas have different MR characteristics in AA versus CA men has yet to be determined. MRI-based quantitative biomarkers that account for racial differences could be used to create MRI protocols specifically for different racial groups. Therefore, this study investigates whether quantitative MRI and quantitative histology of the prostate reveals differences between races, specifically African Americans and Caucasian Americans, that can affect diagnosis.
Materials and Methods
Study participants: This study involved retrospective analysis of prospectively acquired data. The study was approved by the institutional review board and conducted with informed patient consent and was HIPPA compliant. Inclusion criteria for the study included patients with known or suspected PCa who underwent prostate mpMRI between February 2014 and November 2021 at the MRI Research Center prior to undergoing prostatectomy or biopsy. Patients were excluded from the study if they had undergone radiation, chemotherapy, or hormonal therapy, as these therapies can alter the MRI signal. Patients self-reported their race. We chose the two races in this cohort with the largest sample size: Caucasian Americans and African Americans for further analysis.
MRI Acquisition: Patients underwent a preoperative mpMRI scan on 3T Philips Ingenia or Achieva MR scanners with the use of a 16-channel phased array coil around their pelvis (Philips, Eindhoven, Netherlands) and an endorectal coil (Medrad, Warrendale, PA, USA). The MR protocol included T2-weighted images (axial, coronal); axial multi-echo T2 weighted, diffusion weighted, and dynamic contrast enhanced images (DCE). For DCE MR imaging, either gadobenate dimeglumine (Multihance, Bracco, Milan, Italy) or gadoterate meglumine (Dotarem, Guerbet, Paris, France) 0.1 mmol/kg was injected followed by a 20 mL saline flush. Since, quantitative MR parameters depend of imaging parameters (b-value, echo time, etc.) [19,20,21], we chose a cohort where all patients underwent a very similar MRI protocol, so that quantitative parameters could be compared. Typical imaging parameters for the cohort used in this study are described in Table 1.
Reference standard: Post imaging, patients with known cancer underwent radical prostatectomy and patients with suspected cancer underwent 12 core systematic biopsy along with MR-TRUS biopsy based on the assessment of radiologists using PI-RADS guidelines. The prostatectomy samples were fixed overnight in 10% buffered formalin, transversally sectioned every 4 mm, and then used to create whole mount histology slides. The biopsy samples from patients with suspected PCa were also processed to create histological slides. All slides were H&E stained and evaluated for cancer by an expert pathologist (TA, 18 years’ experience). Cancers were outlined and the Gleason score for each lesion was assigned. The prostatectomy slides were also digitized at 20× magnification using a brightfield Olympus VS120 whole-mount digital microscope (Olympus, Waltham, MA, USA) to be used for subsequent quantitative histologic analysis described later.
MRI analysis: Histology slides and MR images were correlated with the consensus of an expert radiologist, a pathologist, and a medical physicist (AO, TA, AC with 20, 18, 9 years of experience respectively). Only cancers larger than the threshold 5 mm × 5 mm on prostatectomy specimens and 5 mm on mpMRI for biopsy cases were used for analysis. Using a custom PCampReviewer module on 3D slicer [22] and T2-weighted images as a reference, apparent diffusion coefficient (ADC) and DCE MR images were co-registered and matched with the corresponding histological portions. Axial T2-weighted images were marked by a radiologist (AO, 20 years’ experience) for sections with pathologist-verified PCa, and benign tissue. The radiologist used the pathology whole-mount histology cancer outlines as a guide to draw ROIs on the T2-weighted MR images. These ROIs were then transferred to the other mpMRI sequences using 3D Slicer to keep the same PCa shape and size.
Quantitative analysis of mpMRI data was performed in MATLAB (MathWorks, Natick, MA, USA) using in-house programs. This code calculated ADC and quantitative T2 maps using a mono-exponential signal decay model on a voxel-by-voxel basis using the diffusion weighted and multi-echo T2-weighted images. Quantitative analysis of DCE-MRI data was done using the empirical mathematical model (EMM) as described in Fan et al. [23]. The EMM makes no assumptions about the underlying physiology of a tumor and provides quantitative analysis of the kinetics that the radiologist sees on visual assessment. The percent signal enhancement (PSE) curve was calculated using the formula below where S0 = baseline signal intensity, S(t) = DCE signal at time ‘t’.
Then PSE vs. time curves were analyzed using the following equation
to estimate the amplitude of the relative percent signal enhancement or PSE curve or A, the signal enhancement rate or α and the signal washout rate or β.
Quantitative histology: We used the digitized H&E stained prostatectomy samples for subsequent quantitative histologic analysis similar to previous work that validated this approach [24,25]. ROIs were selected using ImageJ (National Institutes of Health, Bethesda, MD, USA) for confirmed cancers and benign tissue in the peripheral and transition zones corresponding to the ROIs taken for quantitative MRI analysis earlier. Using the “Smart Segment” functionality in Image Pro (Media Cybernetics, Rockville, Maryland), the images were segmented into stroma, epithelium and lumen on the basis of color, intensity, morphology, and background. The results were iteratively rectified semi-automatically by the consensus of a pathologist and medical physicist until the final segmented image was determined to have error less than 5%. Then using the “Count” functionality, the percentage volumes of these prostatic tissue components were calculated.
Statistical analysis: Statistical analysis was performed using SPSS v29 (IBM Corporation, Armonk, NY, USA). The difference in measured mpMRI and quantitative histology parameters between AAs and CAs was assessed by t-test. Chi-squared test used to test if the distribution were different between the two cohorts. Receiver operating characteristic (ROC) analysis was used to evaluate the performance of the quantitative mpMRI parameters in diagnosing PCa. Area under the ROC curve (AUC) and ideal cutoff point or the Youdens index with associated sensitivity and specificity were reported. Z-score test was used determine significant difference in AUC value between the two populations.
Results
Patient and lesion characteristics: The final cohort for this study included 47 African American and 98 Caucasian American subjects. No significant difference in age (p = 0.29) and PSA level (p = 0.94) was found between AA (age = 60 ± 7 years, PSA = 8.5 ± 5.9 ng/ml) versus CA (age = 58 ± 8 years, PSA = 8.6 ± 9.9 ng/ml). The percentage of patients undergoing biopsy and prostatectomy were similar (p = 0.89) between the two groups, with 25 biopsies and 22 prostatectomies cases for AAs and 51 and 47 respectively in CA patients. AA’s (29% Gleason 3+3, 36% Gleason 3+4, 22% Gleason 4+3, 11% Gleason 4+4, 2% Gleason 4+5) had a greater (p = 0.01) percentage of higher Gleason grade lesions compared to CAs (29% Gleason 3+3, 57% Gleason 3+4, 11% Gleason 4+3, 1% Gleason 4+4, 2% Gleason 4+5). Detailed patient and lesion characteristics can be found in Table 2.
Quantitative mpMRI results: Representative figures depicting prostate MRI for a typical AA and CA patient in this study are shown in Figure 1 and Figure 2 respectively. We found no significant difference in quantitative ADC values (Cancers: 1.03 ± 0.32 µm2/ms in AA vs 1.07 ± 0.34 µm2/ms in CA, p = 0.75, Benign: 1.53±0.37 in AA vs 1.62 ± 0.37 µm2/ms in CA, p = 0.12) and T2 values (Cancer: 107.5 ± 55.8 ms in AA vs 99.7 ± 27.7 ms, in CA p = 0.25, Benign: 151.9 ± 96.5 ms for AA, 159.1 ± 73.2 ms for CA, p = 0.70) between AA and CA for cancer and benign tissue. However, ADC and T2 values for cancers were nominally higher in AA than in CA, despite the higher Gleason grade cancers in the AA cohort. No significant difference was found between AA and CA for these metrics when compared for each Gleason score category. Detailed results for quantitative MRI metrics measured in this study can be found in Table 3.
However, significant differences were found in the quantitative DCE metrics between the two cohorts. DCE signal enhancement rate (α) was significantly higher in cancerous tissue for AA compared to CA (AA: 13.3 ± 9.3 s-1 vs CA: 6.1 ± 4.7 s-1, p < 0.001). Similarly, differences were found across all Gleason scores (Gleason 3+3: 10.3 ± 4.4 vs. 4.9 ± 2.9 s-1, p = 0.002; Gleason 3+4: 11.7 ± 6.5 vs. 6.7 ± 5.6 s-1, p = 0.04; and Gleason ≥ 4+3: 15.6 ± 11.7 and 6.2 ± 2.9 s-1, p = 0.02 respectively) where signal enhancement rate was significantly higher in AAs than CAs. No significant differences in signal enhancement rate were found in benign tissue (5.1 ± 4.6 for AA vs 4.9 ± 2.9 s-1 for CA, p = 0.81).
DCE signal washout rate (β) was significantly lower in benign tissue of AA (AA: 0.01±0.09 s-1 vs CA: 0.07 ± 0.07 s-1, p < 0.001) and significantly elevated in cancer tissue in AAs (AA: 0.12 ± 0.07 s-1 vs. CA: 0.07 ± 0.08 s-1, p = 0.02). However, while these differences were found to be significant in cancer ROIs overall for AAs versus CAs, no significant differences were found across the Gleason scores categories.
Significant differences in DCE signal enhancement amplitude (A), were found between different Gleason grades between AA and CA, except for Gleason 3+4 tumors. In cancer ROIs overall, AA signal enhancement amplitude (181.1 ± 44.8 %) was significantly higher (p < 0.001) compared to CAs (120.2 ± 47.4 %). In benign tissue, amplitude was also significantly higher (p < 0.001) for AAs (157.6 ± 82.6 %) compared to CAs (126.1 ± 51.2 %) for CAs.
Diagnostic performance: The diagnostic performance as evidenced by the area under the ROC curve showed ADC (AA = 0.79 vs CA = 0.87, p = 0.21) and T2 (AA = 0.68 vs CA = 0.79, p = 0.15) were statistically equally effective in differentiation between benign and cancer tissue in both CA and AA. However, it should be noted that ADC (AUC 10% lower in AA’s) and T2 (AUC 16% lower in AA’s) were nominally less effective in AA compared to CA for diagnosis PCa in CAs despite a higher proportion of high grade cancer in the AA cohort. DCE on the other hand, significantly improved the differentiation of PCa from benign in AAs but was found to be ineffective in CAs. The area under the ROC curve showed that DCE signal enhancement rate (AUC for AA’s = 0.88 vs CA = 0.58, p < 0.001) and signal washout rate (AUC for AA = 0.81 vs CA = 0.50, p < 0.001) were 52% and 62% significantly more effective (p < 0.001) respectively in diagnosing PCa in AA patients. In addition, the cutoff values based on the Youden’s index for quantitative mpMRI parameters were different for the two cohorts. This leads to different sensitivity and specificity measured using these cutoffs (he detailed results are in Table 4).
Quantitative histology: Histology analysis for prostate tissue composition showed similar breakdown of tissue components between AA (epithelium 28.7 ± 9.0 %, lumen 28.8 ± 13.3 %, stroma 42.3 ± 10.2%) and CA (epithelium 29.6 ± 9.2 %, lumen 27.4 ± 11.1 %, stroma 43.1 ± 12.1%) for benign tissue. However, in cancerous tissue, there were greater proportions of epithelium and lower lumen (p = 0.04) in CA (epithelium 50.9 ± 12.3 %, lumen 10.5 ± 6.9 %) compared to AA (epithelium 44.7 ± 12.8 %, lumen 16.2 ± 6.8 %), suggesting differences in histologic makeup and micro-anatomy of PCa in AAs versus CAs. No difference in stroma volume was found for cancer between the two groups. Detailed results are in Table 5.
Discussion
The results of our study show that cancer signal enhancement rate (α) of prostate cancer is significantly higher for AA compared to CA. DCE signal washout rate (β) is significantly lower in benign tissue of AA and significantly elevated in cancer tissue in AAs. Due to these differences, DCE significantly improves the differentiation of PCa from benign prostate tissue in AAs, but not in CAs. There were no significant differences in quantitative ADC and T2 values between AA and CA. Histologic analysis showed cancers have a greater proportion of epithelium and lower lumen in CA compared to AA. These findings underscore the importance of considering racial differences when developing screening or diagnostic guidelines, especially as bi-parametric MRI is increasingly being proposed for population screening.
PCa detected in AAs tend to have higher Gleason score lesions (more aggressive and advanced, Gleason 4+3 and above) compared to PCa in CAs [10,11]. We found a similar trend in our cohort. Despite having more high grade lesions in AA, cancers in AA tend to have very similar ADC and T2 values to CA. The background benign tissue has nominally lower T2 and ADC in AA. This potentially decreases the contrast between the cancer and normal regions in prostate and can make the cancer less conspicuous. [26] as evidenced by the lower AUC values for cancer detection using ADC and T2 in AAs. This is consistent with qualitative mpMRI results from Mahran et. al. where negative predictive value for AA using mpMRI is lower than that for CA [18]. Our quantitative histology results showed cancer in AAs tend to have lower epithelium (epithelium is associated with lower ADC and T2) and higher lumen (lumen is associated with higher ADC and T2) making them less conspicuous on T2 and ADC. In addition, increased inflammation in the tumor microenvironment of prostate cancer in AA men has been noted; this is a driver of disparate clinical outcomes [27]. From MRI literature we also know that inflammation affects T2 relaxometry and diffusion measures, and can mimic prostate cancer, making cancer diagnosis more difficult [28].
Quantitative DCE-MRI using EMM has been shown to be effective in the diagnosis of PCa [29,30],. The results of this study demonstrate that EMM is even more effective for differentiating PCa from benign tissue in AAs with the AUCs for α and β being 52% and 62% greater respectively in AA compared to CA. Numerous studies have noted inherent molecular and biological differences in cancer of AA patients [31,32]. The observed difference in contrast uptake and washout can be attributed to tumor microenvironment. Most importantly, neo-angiogenesis or higher microvessel density (MVD) in cancer of AA subjects compared to CA has been reported [32]. These blood vessels produced by cancers allow increased blood flow which results in rapid contrast uptake and quick washout. The increased blood flow brings increased oxygen and nutrients that support tumor growth, invasion, and metastatic progression. This is consistent with findings of increased tumor progression and worse clinical outcomes in AAs [33].
This study found that the ideal cutoff values (Youdens’ index) for quantitative mpMRI parameters were very different for AAs vs. CAs showing that the standard diagnostic model is not optimal for AAs. This also suggests the more general hypothesis that quantitative MRI protocols and thresholds for PCa diagnosis for different races should be determined independently. The current PI-RADS v2.1 guideline [13] utilizes T2-weighted (T2W) imaging and diffusion weighting imaging (DWI) as the primary sequences, while giving less emphasis to dynamic contrast-enhanced (DCE) MRI. The results showing DCE-MRI is highly effective for PCa diagnosis in African Americans suggest that PI-RADS guidelines should be modified to include a greater emphasis on DCE-MRI for AAs. However, the current results must be verified in a larger cohort in a multi-center setting.
There is growing interest in bi-parametric MRI, with T2-weighted images and DWI images only, leaving out DCE-MRI completely [34,35]. This would have advantages in terms of cost, efficiency, and accessibility [35]. However, the results of this study suggest that bi-parametric MRI would not produce optimal outcomes for African Americans, and perhaps also be sub-optimal for other groups that are at risk for aggressive PCa. In addition, there is also increasing interest in quantitative MR imaging and analysis methods and artificial intelligence (AI) tools for PCa diagnosis [36,37]. Consideration of biparametric MRI, quantitative MRI and AI tools as a substitute for conventional mpMRI should account for racial differences in prostate and PCa physiology and biology. Future studies should compare the current results with results for races or genetic sub-groups with the lower incidences of PCa, e.g. the Asian population. MRI-based quantitative biomarkers that account for racial differences could be used to optimize MRI protocols specifically for different racial groups. This will be a critical step towards personalized PCa screening.
There are a few limitations to this study. First, this study is a retrospective single center study with a relatively small sample size. Therefore, these results should be validated in a multi-center setting with a large sample size. Second, we used equipment and software from a single MR vendor. Similar studies are needed using scanners from other vendors as hardware and imaging parameters have been shown to affect quantitative MRI results [19,20,21]. Third, quantitative histology was performed on a subset of patients undergoing prostatectomy. Therefore, due to the small sample size, comparison of quantitative histology in the two populations stratified by Gleason score could not be performed. Fourth, we did not have the histological specimens to confirm increased vessel density in cancers in African Americans where DCE analysis suggests increased blood flow [38]. This should be tested in future studies. Fifth, the use of a combined cohort of prostatectomy and biopsy can introduce potential bias while comparing the 2 populations when stratifying cancers by Gleason score. This is due to the fact that a significant number of cancers are upgraded when biopsy subjects undergo prostatectomy [39].
Conclusions
This study shows that AA has different quantitative DCE-MRI values for benign prostate and prostate cancer compared to CA. Quantitative DCE-MRI is highly effective and improves PCa diagnosis in African Americans. These findings should be confirmed in larger studies, but we believe they are particularly important to consider, especially as bi-parametric MRI, which excludes DCE, is attracting increasing interest as a replacement for mp-MRI. There are also some quantitative histologic differences between the cancers in AAs and CAs. The results also suggest that other racial groups may have differing prostate biology and physiology and may requiring specialized MRI screening methods. Racial differences should be taken into account when creating screening or diagnostic guidelines, particularly as bi-parametric MRI is being increasingly suggested for population screening.
Author Contributions
Conceptualization, A.C., G.S.K., A.O.; methodology, A.C., X.F., T.A., G.S.K., A.O.; software, A.C., X.F.; validation, A.C., A.O.; formal analysis, A.C., X.F., J.S., G.A., M.M., T.A., A.O.; investigation, A.C., J.S., G.A., A.Y., T.A., A.O.; resources, M.M., T.A, S.E., G.S.K., A.O.; data curation, A.C., X.F., J.S., G.A., A.Y., T.A.; writing—original draft preparation, A.C., J.S.; writing—review and editing, A.C, X.F., J.S., G.A., A.Y., M.M., T.A., S.E., G.S.K, A.O; visualization, A.C., T.A., G.S.K., A.O.; supervision, A.C., T.A, S.E., G.K. and A.O.; project administration, A.C., T.A, G.S. K. and A.O.; funding acquisition, G.K. and A.O. All authors have read and agreed to the published version of the manuscript.
Funding
This research was funded by NIH (R01 CA227036, 1R41CA244056-01A1, R01 CA17280, 1S10OD018448-01), and Sanford J. Grossman Charitable Trust.
Institutional Review Board Statement
The study was conducted in accordance with the Health Insurance Portability and Accountability Act, and approved by the Institutional Review Board of University of Chicago.
Informed Consent Statement
The institutional review board approved study involved retrospective analysis of prospectively acquired data. It was conducted with prior informed patient consent and was HIPAA compliant.
Data Availability Statement
In accordance with the institutional review board, the data acquired in this study contain person-sensitive information, which can be shared only in the context of scientific collaborations.
Acknowledgements
We would like to acknowledge and thank MRI Research Center at the University of Chicago (MRIRC, RRID:SCR_024723) for their assistance in MRI data acquisition of this study.
Conflicts of Interest
The authors state that they have no conflict of interest related to the material discussed in this article. Drs. Chatterjee, Oto, and Karczmar have equity in QMIS, LLC, which is unrelated to this study.
References
- Siegel RL, Giaquinto AN, Jemal A (2024) Cancer statistics, 2024. CA: A Cancer Journal for Clinicians 74 (1):12-49. [CrossRef]
- Sung H, Ferlay J, Siegel RL, Laversanne M, Soerjomataram I, Jemal A, Bray F (2021) Global Cancer Statistics 2020: GLOBOCAN Estimates of Incidence and Mortality Worldwide for 36 Cancers in 185 Countries. CA: A Cancer Journal for Clinicians 71 (3):209-249. [CrossRef]
- Key Statistics for Prostate Cancer. (2024) American Cancer Society. Available online: https://www.cancer.org/cancer/types/prostate-cancer/about/key-statistics.html (accessed on 9 April 2024).
- Mahal BA, Alshalalfa M, Spratt DE, Davicioni E, Zhao SG, Feng FY, Rebbeck TR, Nguyen PL, Huang FW (2019) Prostate Cancer Genomic-risk Differences Between African-American and White Men Across Gleason Scores. European Urology 75 (6):1038-1040. [CrossRef]
- Mahal BA, Berman RA, Taplin M-E, Huang FW (2018) Prostate Cancer–Specific Mortality Across Gleason Scores in Black vs Nonblack MenProstate Cancer–Specific Mortality Across Gleason Scores in Black and Nonblack MenLetters. JAMA 320 (23):2479-2481. [CrossRef]
- Prostate Cancer Risk Factors. (2024) US Centers for Disease Control and Prevention (CDC). Available online: https://www.cdc.gov/prostate-cancer/risk-factors/index.html (accessed on 9 May 2024).
- Lillard JW, Jr., Moses KA, Mahal BA, George DJ (2022) Racial disparities in Black men with prostate cancer: A literature review. Cancer 128 (21):3787-3795. [CrossRef]
- Krimphove MJ, Cole AP, Fletcher SA, Harmouch SS, Berg S, Lipsitz SR, Sun M, Nabi J, Nguyen PL, Hu JC, Kibel AS, Choueiri TK, Kluth LA, Trinh Q-D (2019) Evaluation of the contribution of demographics, access to health care, treatment, and tumor characteristics to racial differences in survival of advanced prostate cancer. Prostate Cancer and Prostatic Diseases 22 (1):125-136. [CrossRef]
- Sundi D, Ross AE, Humphreys EB, Han M, Partin AW, Carter HB, Schaeffer EM (2013) African american men with very low-risk prostate cancer exhibit adverse oncologic outcomes after radical prostatectomy: Should active surveillance still be an option for them? Journal of Clinical Oncology 31 (24):2991-2997. [CrossRef]
- Tolcher A, Moinpour CM, Tangen CM, Crawford ED, Thompson IM, Eisenberger M (2001) Association of African-American Ethnic Background With Survival in Men With Metastatic Prostate Cancer. JNCI: Journal of the National Cancer Institute 93 (3):219-225. [CrossRef]
- Rebbeck TR (2017) Prostate Cancer Genetics: Variation by Race, Ethnicity, and Geography. Seminars in radiation oncology 27 (1):3-10. [CrossRef]
- Bonekamp D, Jacobs MA, El-Khouli R, Stoianovici D, Macura KJ (2011) Advancements in MR Imaging of the Prostate: From Diagnosis to Interventions. RadioGraphics 31 (3):677-703. [CrossRef]
- Turkbey B, Rosenkrantz AB, Haider MA, Padhani AR, Villeirs G, Macura KJ, Tempany CM, Choyke PL, Cornud F, Margolis DJ, Thoeny HC, Verma S, Barentsz J, Weinreb JC (2019) Prostate Imaging Reporting and Data System Version 2.1: 2019 Update of Prostate Imaging Reporting and Data System Version 2. European Urology 76 (3):340-351. [CrossRef]
- Davenport MS, Shankar PR (2020) Biparametric Prostate MRI Influencing Care Patterns in a Caribbean Population. Radiol Imaging Cancer 2 (4). [CrossRef]
- Powell IJ (2007) Epidemiology and pathophysiology of prostate cancer in African-American men. J Urol 177 (2):444-449. [CrossRef]
- Ha Chung B, Horie S, Chiong E (2019) The incidence, mortality, and risk factors of prostate cancer in Asian men. Prostate International 7 (1):1-8. [CrossRef]
- Abashidze N, Stecher C, Rosenkrantz AB, Duszak R, Jr., Hughes DR (2021) Racial and Ethnic Disparities in the Use of Prostate Magnetic Resonance Imaging Following an Elevated Prostate-Specific Antigen Test. JAMA Netw Open 4 (11):32388. [CrossRef]
- Mahran A, Mishra K, Bukavina L, Schumacher F, Quian A, Buzzy C, Nguyen CT, Gulani V, Ponsky LE (2019) Observed racial disparity in the negative predictive value of multi-parametric MRI for the diagnosis for prostate cancer. International Urology and Nephrology 51 (8):1343-1348. [CrossRef]
- Peng Y, Jiang Y, Antic T, Sethi I, Schmid-Tannwald C, Eggener S, Oto A (2014) Apparent Diffusion Coefficient for Prostate Cancer Imaging: Impact of b Values. American Journal of Roentgenology 202 (3):W247-W253. [CrossRef]
- Feng Z, Min X, Wang L, Yan X, Li B, Ke Z, Zhang P, You H (2018) Effects of Echo Time on IVIM Quantification of the Normal Prostate. Scientific Reports 8 (1):2572. [CrossRef]
- Chatterjee A, Nolan P, Sun C, Mathew M, Dwivedi D, Yousuf A, Antic T, Karczmar GS, Oto A (2020) Effect of Echo Times on Prostate Cancer Detection on T2-Weighted Images. Academic Radiology 27 (11):1555-1563. [CrossRef]
- Chatterjee A, Tokdemir S, Gallan AJ, Yousuf A, Antic T, Karczmar GS, Oto A (2019) Multiparametric MRI Features and Pathologic Outcome of Wedge-Shaped Lesions in the Peripheral Zone on T2-Weighted Images of the Prostate. American Journal of Roentgenology 212 (1):124-129. [CrossRef]
- Fan X, Medved M, River JN, Zamora M, Corot C, Robert P, Bourrinet P, Lipton M, Culp RM, Karczmar GS (2004) New model for analysis of dynamic contrast-enhanced MRI data distinguishes metastatic from nonmetastatic transplanted rodent prostate tumors. Magnetic Resonance in Medicine 51 (3):487-494. [CrossRef]
- Chatterjee A, Gallan A, Fan X, Medved M, Akurati P, Bourne RM, Antic T, Karczmar GS, Oto A (2023) Prostate Cancers Invisible on Multiparametric MRI: Pathologic Features in Correlation with Whole-Mount Prostatectomy. Cancers 15 (24):5825. [CrossRef]
- Chatterjee A, Mercado C, Bourne R, Yousuf A, Hess B, Antic T, Eggener S, Oto A, Karczmar GS (2021) Validation of prostate tissue composition using Hybrid Multidimensional MRI: Correlation with histology. Radiology 2022 (302(2)):368-377. [CrossRef]
- Hötker AM, Dappa E, Mazaheri Y, Ehdaie B, Zheng J, Capanu M, Hricak H, Akin O (2019) The Influence of Background Signal Intensity Changes on Cancer Detection in Prostate MRI. American Journal of Roentgenology 212 (4):823-829. [CrossRef]
- Lowder D, Rizwan K, McColl C, Paparella A, Ittmann M, Mitsiades N, Kaochar S (2022) Racial disparities in prostate cancer: A complex interplay between socioeconomic inequities and genomics. Cancer Letters 531:71-82. [CrossRef]
- Rourke E, Sunnapwar A, Mais D, Kukkar V, DiGiovanni J, Kaushik D, Liss MA (2019) Inflammation appears as high Prostate Imaging-Reporting and Data System scores on prostate magnetic resonance imaging (MRI) leading to false positive MRI fusion biopsy. Investig Clin Urol 60 (5):388-395. [CrossRef]
- Chatterjee A, He D, Fan X, Wang S, Szasz T, Yousuf A, Pineda F, Antic T, Mathew M, Karczmar GS, Oto A (2018) Performance of ultrafast DCE-MRI for diagnosis of prostate cancer. Academic Radiology 25 (3):349-358. [CrossRef]
- Clemente A, Selva G, Berks M, Morrone F, Morrone AA, Aulisa MDC, Bliakharskaia E, De Nicola A, Tartaro A, Summers PE (2024) Comparison of Early Contrast Enhancement Models in Ultrafast Dynamic Contrast-Enhanced Magnetic Resonance Imaging of Prostate Cancer. Diagnostics 14 (9):870. [CrossRef]
- Goswami S, Sarkar C, Singh S, Singh AP, Chakroborty D (2022) Racial differences in prostate tumor microenvironment: implications for disparate clinical outcomes and potential opportunities. Cancer Health Disparities 6 (214):31.
- Gillard M, Javier R, Ji Y, Zheng SL, Xu J, Brendler CB, Crawford SE, Pierce BL, Griend DJV, Franco OE (2018) Elevation of Stromal-Derived Mediators of Inflammation Promote Prostate Cancer Progression in African-American Men. Cancer Research 78 (21):6134-6145. [CrossRef]
- Powell IJ, Bock CH, Ruterbusch JJ, Sakr W (2010) Evidence supports a faster growth rate and/or earlier transformation to clinically significant prostate cancer in black than in white American men, and influences racial progression and mortality disparity. J Urol 183 (5):1792-1796. [CrossRef]
- Schieda N, Nisha Y, Hadziomerovic AR, Prabhakar S, Flood TA, Breau RH, McGrath TA, Ramsay T, Morash C, Goh V (2024) Comparison of Positive Predictive Values of Biparametric MRI and Multiparametric MRI–directed Transrectal US–guided Targeted Prostate Biopsy. Radiology 311 (3):e231383. [CrossRef]
- Greenberg JW, Koller CR, Casado C, Triche BL, Krane LS (2022) A narrative review of biparametric MRI (bpMRI) implementation on screening, detection, and the overall accuracy for prostate cancer. Ther Adv Urol 14 (17562872221096377):Jan-Dec. [CrossRef]
- Chatterjee A, Dwivedi DK (2024) MRI-based virtual pathology of the prostate. Magnetic Resonance Materials in Physics, Biology and Medicine. [CrossRef]
- Saha A, Bosma JS, Twilt JJ, van Ginneken B, Bjartell A, Padhani AR, Bonekamp D, Villeirs G, Salomon G, Giannarini G, Kalpathy-Cramer J, Barentsz J, Maier-Hein KH, Rusu M, Rouvière O, van den Bergh R, Panebianco V, Kasivisvanathan V, Obuchowski NA, Yakar D, Elschot M, Veltman J, Fütterer JJ, de Rooij M, Huisman H, Saha A, Bosma JS, Twilt JJ, van Ginneken B, Noordman CR, Slootweg I, Roest C, Fransen SJ, Sunoqrot MRS, Bathen TF, Rouw D, Immerzeel J, Geerdink J, van Run C, Groeneveld M, Meakin J, Karagöz A, Bône A, Routier A, Marcoux A, Abi-Nader C, Li CX, Feng D, Alis D, Karaarslan E, Ahn E, Nicolas F, Sonn GA, Bhattacharya I, Kim J, Shi J, Jahanandish H, An H, Kan H, Oksuz I, Qiao L, Rohé M-M, Yergin M, Khadra M, Şeker ME, Kartal MS, Debs N, Fan RE, Saunders S, Soerensen SJC, Moroianu S, Vesal S, Yuan Y, Malakoti-Fard A, Mačiūnien A, Kawashima A, de Sousa Machadov AMMdMG, Moreira ASL, Ponsiglione A, Rappaport A, Stanzione A, Ciuvasovas A, Turkbey B, de Keyzer B, Pedersen BG, Eijlers B, Chen C, Riccardo C, Alis D, Courrech Staal EFW, Jäderling F, Langkilde F, Aringhieri G, Brembilla G, Son H, Vanderlelij H, Raat HPJ, Pikūnienė I, Macova I, Schoots I, Caglic I, Zawaideh JP, Wallström J, Bittencourt LK, Khurram M, Choi MH, Takahashi N, Tan N, Franco PN, Gutierrez PA, Thimansson PE, Hanus P, Puech P, Rau PR, de Visschere P, Guillaume R, Cuocolo R, Falcão RO, van Stiphout RSA, Girometti R, Briediene R, Grigienė R, Gitau S, Withey S, Ghai S, Penzkofer T, Barrett T, Tammisetti VS, Løgager VB, Černý V, Venderink W, Law YM, Lee YJ, Bjartell A, Padhani AR, Bonekamp D, Villeirs G, Salomon G, Giannarini G, Kalpathy-Cramer J, Barentsz J, Maier-Hein KH, Rusu M, Obuchowski NA, Rouvière O, van den Bergh R, Panebianco V, Kasivisvanathan V, Yakar D, Elschot M, Veltman J, Fütterer JJ, de Rooij M, Huisman H (2024) Artificial intelligence and radiologists in prostate cancer detection on MRI (PI-CAI): an international, paired, non-inferiority, confirmatory study. The Lancet Oncology 25 (7):879-887.
- Singanamalli A, Rusu M, Sparks RE, Shih NN, Ziober A, Wang LP, Tomaszewski J, Rosen M, Feldman M, Madabhushi A (2016) Identifying in vivo DCE MRI markers associated with microvessel architecture and gleason grades of prostate cancer. J Magn Reson Imaging 43 (1):149-158. [CrossRef]
- Epstein JI, Feng Z, Trock BJ, Pierorazio PM (2012) Upgrading and downgrading of prostate cancer from biopsy to radical prostatectomy: incidence and predictive factors using the modified Gleason grading system and factoring in tertiary grades. Eur Urol 61 (5):1019-1024. [CrossRef]
Figure 1.
52 years old African American patient with Gleason 4+3 cancer in the left apex in the peripheral zone. The lesion is seen as a hypo-intense region on T2W image, T2 (87.9±16.4 ms) and mildly hypo-intense on ADC (1.32±0.20 µm2/ms) maps with early focal enhancement on DCE-MRI evidenced by high signal enhancement rate (19.3 s-1) and rapid washout rate (0.07 s-1). Surrounding benign tissue in the peripheral zone had ADC=2.05±0.10 µm2/ms, T2=308.9±62.6 ms, α=2.87 s-1 and β=0.04 s-1. Another relevant finding is the presence of Gleason 3+3 cancers in the right apex.
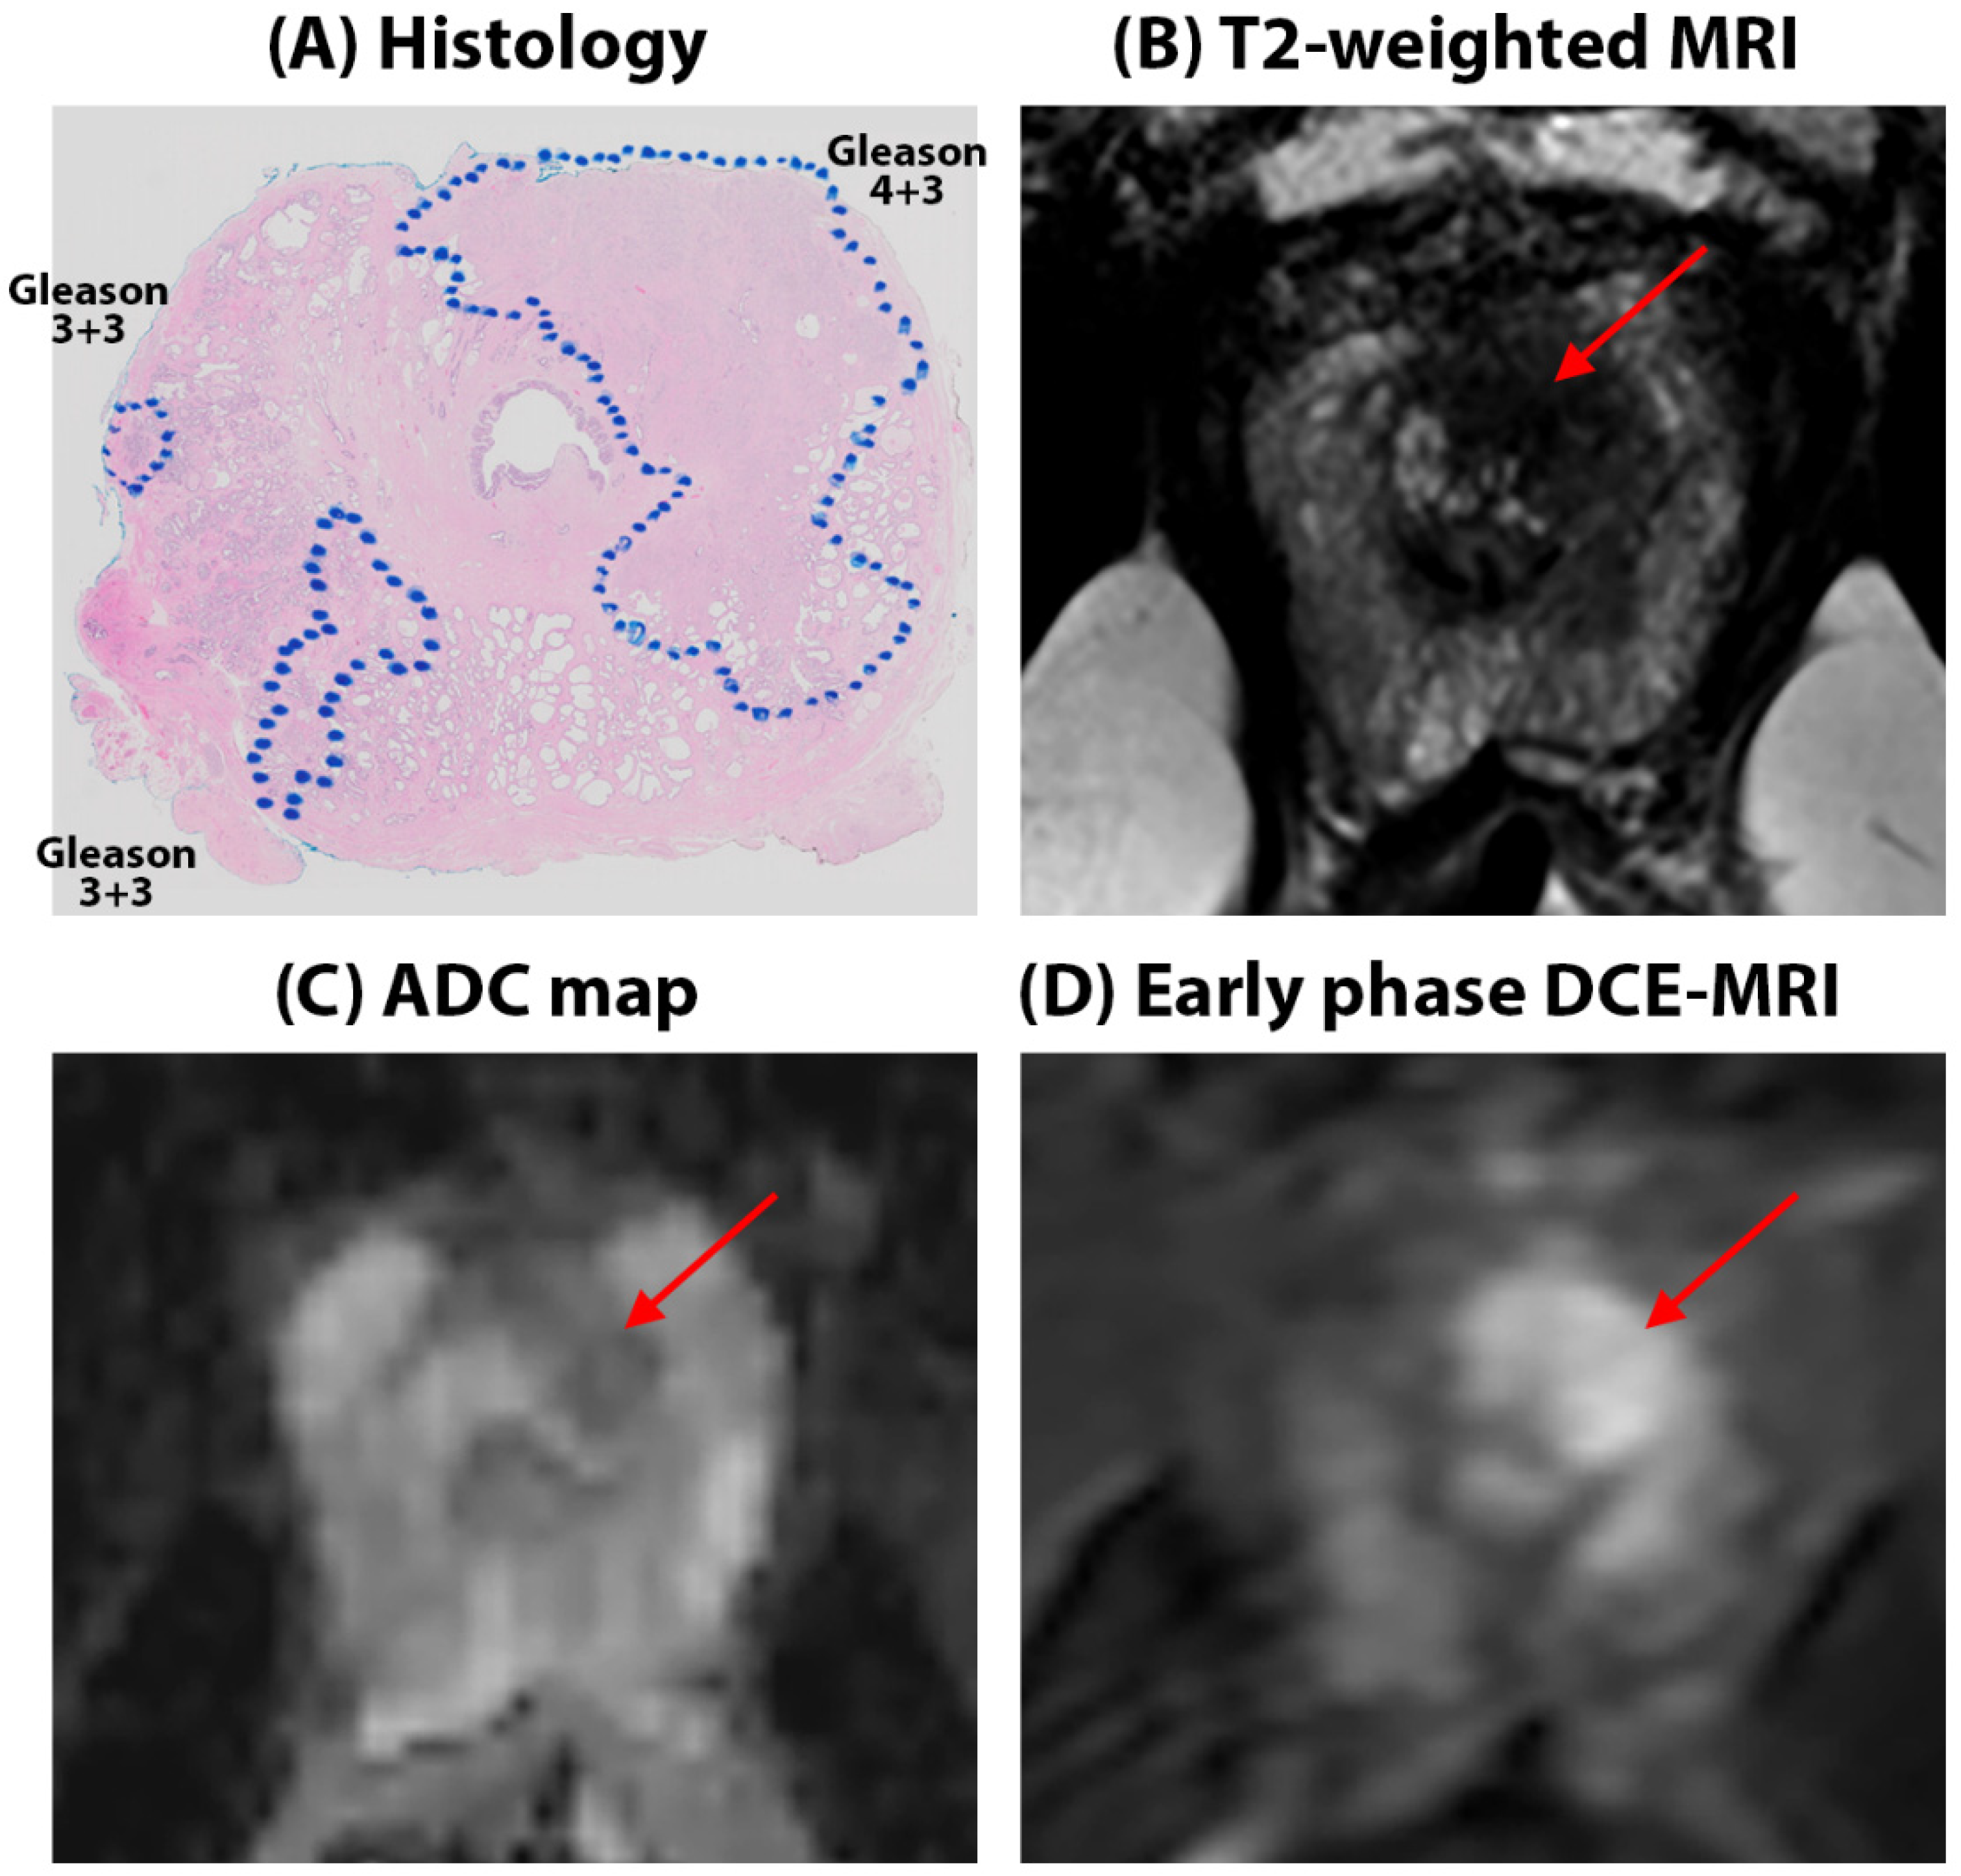
Figure 2.
52 years old Caucasian American patient with Gleason 3+4 cancer in the right apex in the peripheral zone. The lesion is seen as a hypo-intense region on T2W image, T2 (112.4±54.6 ms) and mildly hypo-intense on ADC (0.86±0.12 µm2/ms) maps with only diffuse early enhancement on DCE-MRI evidenced by low signal enhancement rate (3.50 s-1) and washout rate (0.03 s-1). Surrounding benign tissue in the peripheral zone had ADC=1.16±0.19 µm2/ms, T2=125.1±34.5 ms, α=3.20 s-1 and β=0.01 s-1.
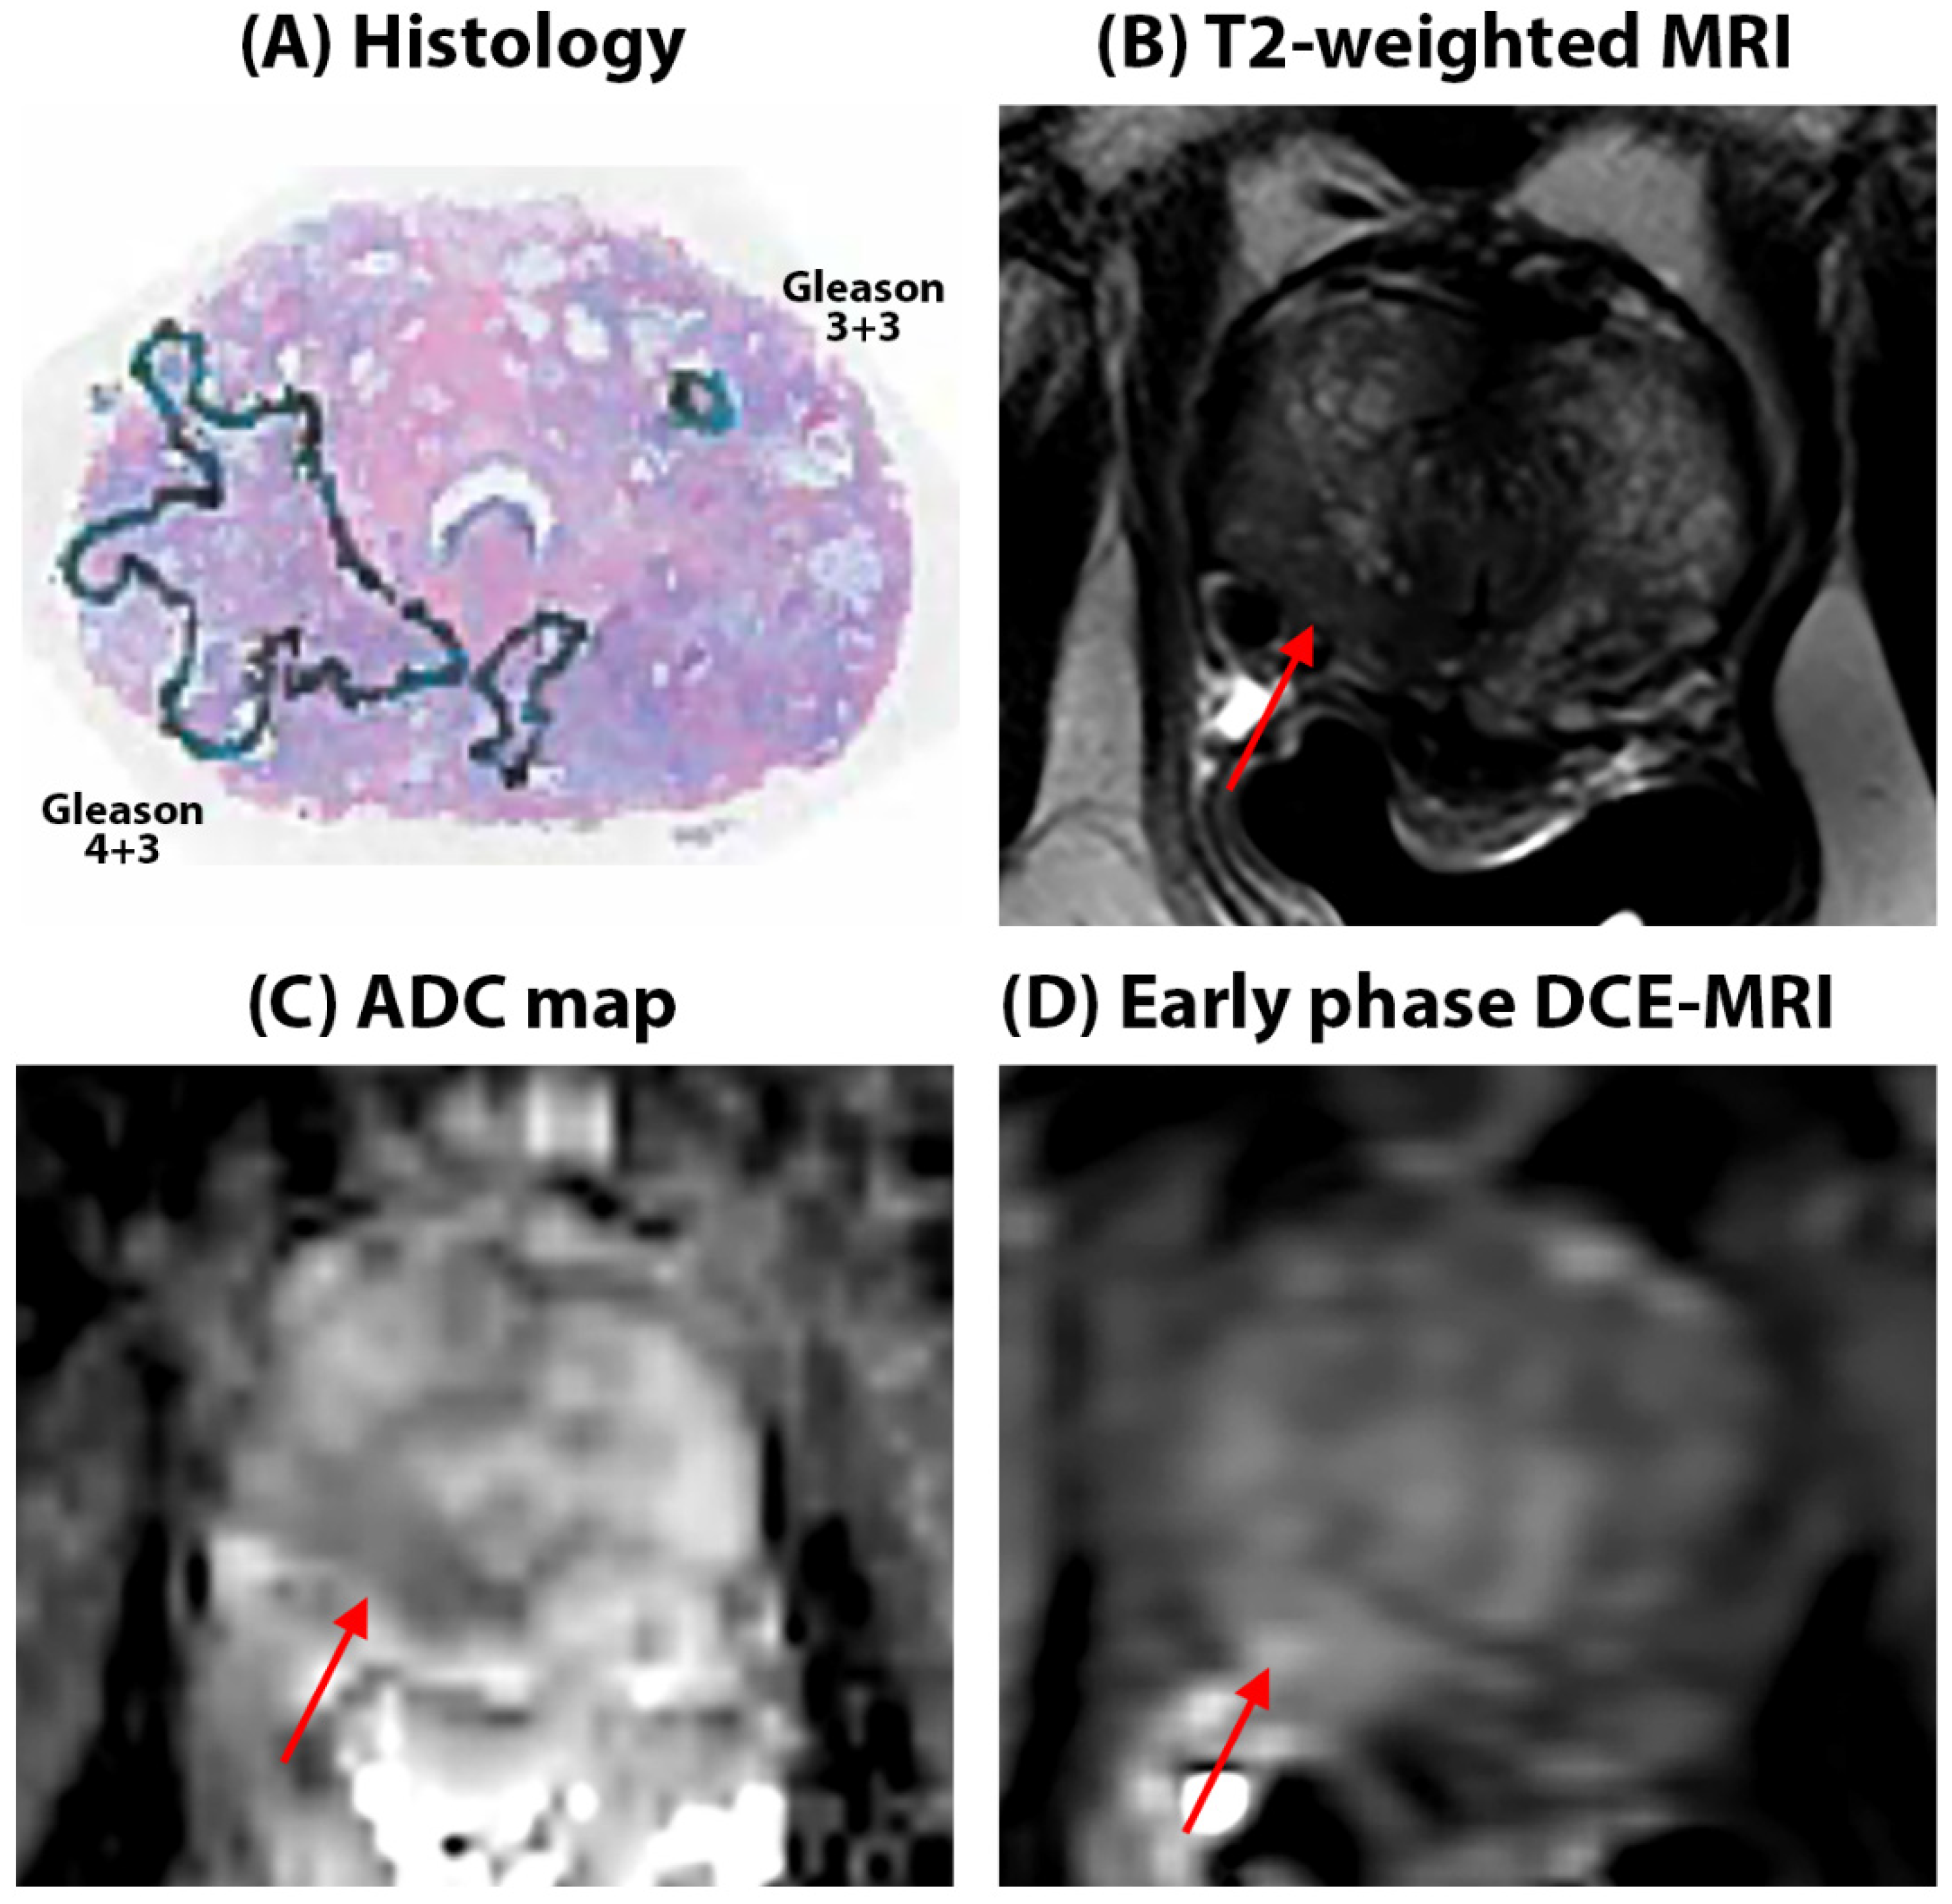

Table 1.
Typical MR Imaging parameters.
| Imaging sequence | Pulse sequence | FOV (mm) |
Scan Matrix size | In plane Resolution (mm) |
TE (ms) |
TR (ms) |
Slice Thickness (mm) |
Flip angle (⁰) |
|---|---|---|---|---|---|---|---|---|
| Axial T2W | SE-TSE | 180 × 180 | 450 × 450 | 0.4 × 0.4 | 115 or 150 | 4800 | 3 | 90 |
| Multi-echo T2W (T2 mapping) | SE-TSE | 160 × 160 | 212 × 212 | 0.75 × 0. 75 | 30, 60, 90, 120, 150, 180, 210, 240, 270 | 7850 | 3 | 90 |
| DWI a | SE-EPI | 180 × 180 | 120 × 120 | 1.5 × 1. 5 | 80 | 5000 | 3 | 90 |
| DCE-MRI b | T1-FFE | 220 × 260 | 148 × 171 | 1.5 × 1.5 | 1.5 | 3.1 | 3 | 10 |
| SE - spin echo, TSE - turbo spin echo. EPI – echo planar imaging, FFE - fast field echo, DCE-MRI – dynamic contrast-enhanced MRI a b-values used 0, 50, 150, 990, 1500 s/mm2 b Contrast agent: gadoterate meglumine (Dotarem, Guerbet, France) or gadobenate dimeglumine (Multihance, Bracco, Minneapolis, USA) was injection at a rate of 2.0 mL/s followed by a 20-mL saline flush. Contrast dose amount was based on patient’s weight (0.1 mmol/kg). DCE-MRI T1-weigthed images were taken with temporal resolution of ~6.4 sec at 60 dynamic scan points over 6.4 minutes | ||||||||
Table 2.
Patient characteristics.
| African Americans | Caucasian Americans |
||
|---|---|---|---|
| Age (years) | 60 ± 7 | 58 ± 8 | |
| PSA (ng/ml) | 8.5 ± 5.9 | 8.6 ± 9.9 | |
| Patients | Biopsy | 25 | 51 |
| Prostatectomy | 22 | 47 | |
| Total | 47 | 98 | |
| ROIs | Cancer | 45 | 99 |
| Benign | 94 | 196 | |
| Total | 139 | 295 | |
| Gleason score | 3+3 | 13 (29%) | 29 (29%) |
| 3+4 | 16 (36%) | 56 (57%) | |
| 4+3 | 10 (22%) | 11 (11%) | |
| 4+4 | 5 (11%) | 1 (1%) | |
| 4+5 | 1 (2%) | 2 (2%) |
Table 3.
Quantitative mpMRI results from both populations.
| African Americans | Caucasian Americans |
p-value | ||
|---|---|---|---|---|
| ADC (µm2/ms) |
Benign | 1.53±0.37 | 1.62±0.37 | 0.12 |
| Cancer | 1.03±0.32 | 1.07±0.34 | 0.75 | |
| Gleason 3+3 | 1.23±0.27 | 1.22±0.34 | 0.88 | |
| Gleason 3+4 | 1.12±0.29 | 1.06±0.33 | 0.55 | |
| Gleason ≥ 4+3 | 0.85±0.28 | 0.81±0.27 | 0.62 | |
| T2 (ms) |
Benign | 151.9±96.5 | 159.1±73.2 | 0.70 |
| Cancer | 107.5±55.8 | 99.8±27.5 | 0.25 | |
| Gleason 3+3 | 110.8±40.2 | 112.7±31.2 | 0.89 | |
| Gleason 3+4 | 108.0±26.5 | 96.9±26.6 | 0.31 | |
| Gleason ≥ 4+3 | 104.9±74.5 | 85.7±12.8 | 0.35 | |
| DCE Signal enhancement amplitude or A (%) |
Benign | 157.6±82.6 | 126.1±51.2 | 0.01 |
| Cancer | 181.1±44.8 | 120.2±47.4 | <0.001 | |
| Gleason 3+3 | 200.9±64.1 | 114.8±28.44 | <0.001 | |
| Gleason 3+4 | 158.5±28.2 | 123.3±55.6 | 0.18 | |
| Gleason ≥ 4+3 | 179.1±35.3 | 125.4±35.6 | 0.03 | |
| DCE Signal enhancement rate (s-1) |
Benign | 5.1±4.6 | 4.9±2.9 | 0.81 |
| Cancer | 13.3±9.3 | 6.1±4.7 | <0.001 | |
| Gleason 3+3 | 10.3±4.4 | 4.9±2.9 | 0.002 | |
| Gleason 3+4 | 11.7±6.5 | 6.7±5.6 | 0.04 | |
| Gleason ≥ 4+3 | 15.6±11.7 | 6.2±2.9 | 0.02 | |
| DCE Signal washout rate (s-1) |
Benign | 0.01±0.09 | 0.07±0.07 | <0.001 |
| Cancer | 0.12±0.07 | 0.07±0.08 | 0.02 | |
| Gleason 3+3 | 0.10±0.09 | 0.04±0.08 | 0.12 | |
| Gleason 3+4 | 0.11±0.07 | 0.09±0.08 | 0.62 | |
| Gleason ≥ 4+3 | 0.13±0.07 | 0.08±0.03 | 0.13 |
Table 4.
ROC analysis for differentiating cancer from benign prostate tissue.
| African Americans | Caucasian Americans | p-value+ | |
|---|---|---|---|
| ADC | AUC = 0.79 95% CI = [0.69, 0.88] Cutoff = 1.00 µm2/ms Sensitivity = 93% Specificity = 56% |
AUC = 0.87 95% CI = [0.81, 0.92] Cutoff = 1.23 µm2/ms Sensitivity = 89% Specificity = 74% |
0.06* |
| T2 | AUC = 0.68 95% CI = [0.56, 0.78] Cutoff = 136.2 ms Sensitivity = 45% Specificity = 88% |
AUC = 0.79 95% CI = [0.72, 0.86] Cutoff = 116.9 ms Sensitivity = 67% Specificity = 80% |
0.10* |
| DCE Signal enhancement rate |
AUC = 0.88 95% CI = [0.81, 0.96] Cutoff = 6.0 s-1 Sensitivity = 96% Specificity = 73% |
AUC = 0.58* 95% CI = [0.48, 0.69] Cutoff = 6.3 s-1 Sensitivity = 38% Specificity = 79 % |
<0.001 |
| DCE Signal washout rate |
AUC = 0.81 95% CI = [0.73, 0.91] Cutoff = 0.02 s-1 Sensitivity = 96% Specificity = 52% |
AUC = 0.50* 95% CI = [0.39, 0.60] Cutoff = 0.10 s-1 Sensitivity = 38% Specificity = 69% |
<0.001 |
| * not significant (p > 0.05) + p-value comparing if performance is better in one population over the other | |||
Table 5.
Quantitative histology results from both populations.
| African Americans | Caucasian Americans |
p-value | ||
|---|---|---|---|---|
| Stroma | Benign | 42.3 ± 10.2 | 43.1 ± 12.1 | 0.44 |
| Cancer | 39.1 ± 11.5 | 38.6 ± 12.4 | 0.46 | |
| Epithelium | Benign | 28.7 ± 9.0 | 29.6 ± 9.2 | 0.41 |
| Cancer | 44.7 ± 12.8 | 50.9 ± 12.3 | 0.04 | |
| Lumen | Benign | 28.8 ± 13.3 | 27.4 ± 11.1 | 0.38 |
| Cancer | 16.2 ± 6.8 | 10.5 ± 6.9 | 0.04 |
Disclaimer/Publisher’s Note: The statements, opinions and data contained in all publications are solely those of the individual author(s) and contributor(s) and not of MDPI and/or the editor(s). MDPI and/or the editor(s) disclaim responsibility for any injury to people or property resulting from any ideas, methods, instructions or products referred to in the content. |
© 2024 by the authors. Licensee MDPI, Basel, Switzerland. This article is an open access article distributed under the terms and conditions of the Creative Commons Attribution (CC BY) license (http://creativecommons.org/licenses/by/4.0/).
Copyright: This open access article is published under a Creative Commons CC BY 4.0 license, which permit the free download, distribution, and reuse, provided that the author and preprint are cited in any reuse.


