Submitted:
26 September 2024
Posted:
26 September 2024
You are already at the latest version
Abstract
You Only Look One (YOLO) and its variants have emerged as the most popular real-time object detection algorithms. They have been widely used in real-time smart transportation applications due to their low-latency detection and high accuracy. However, because of the diverse characteristics of YOLO models,
choosing selecting the optimal model according to various applications and environments in smart transportation is critical. In this article, we conduct an empirical evaluation and analysis study for most YOLO versions to assess their performance in smart transportation. To achieve this, we first measure the average precision of YOLO models across multiple datasets (e.g., COCO, PASCAL VOC). Second, we analyze the performance of YOLO models on multiple object categories within each dataset, focusing on classes relevant to road transportation such as those commonly used in smart transportation applications.
Third, multiple intersection-over-union (IoU) thresholds are considered in our performance measurement and analysis. By examining the performance of various YOLO models across datasets, IoU thresholds, and object classes, we make six observations on these three aspects while aiming to identify optimal models for road transportation scenarios. Thus, YOLOv5 and YOLOv8 outperform other models in all three aspects due to their novel performance features. For instance, YOLOv5 achieves stable performance thanks to its cross-stage partial darknet-53 (CSPDarknet53) backbone, auto-anchor mechanism, and efficient loss functions including IoU loss, complete IoU loss, focal loss, gradient harmonizing mechanism loss. Similarly, YOLOv8 outperforms others with its upgraded CSPDarknet53 backbone, anchor-free mechanism, and efficient loss functions like complete IoU loss and distribution focal loss.
Keywords:
Convolution neural network (CNN)
; real-time object detection
; road transportation
; smart transportation
; You Only Look Once (YOLO)
1. Introduction
Smart transportation has recently emerged as the optimal solution to address the mobility needs of people [1,2,3]. By leveraging modern technology, such as wireless communication, cloud-fog-edge computing, and object detection, smart transportation aims to simplify processes, enhance safety, reduce costs, and improve overall efficiency in transportation systems [4,5,6]. For example, smart transportation can offer optimized route suggestions, easy parking reservations, accident prevention, traffic control, and support for autonomous driving [4,5,6]. Among modern technology building smart transportation, object detection techniques play the most important role, as identifying and tracking specific objects is crucial for various purposes, such as traffic monitoring [7], collision avoidance [8], pedestrian safety [7], parking assistance [7], infrastructure monitoring [7], and public transport security [9].
Specifically, several object detection techniques exist, such as pioneer detection (i.e., histogram of oriented gradients (HOG) [10], deformable part model (DPM) detector [11], etc.), two-stage detection (i.e., region-based convolutional neural network (R-CNN), spatial pyramid pooling network (SPP-net) [12], Fast R-CNN [13], RepPoints [14], etc.), transformer-based detection (i.e., detection transformer (DETR) [15], segmentation transformer (SETR) [16], transformer-based set prediction (TSP) [17], etc.), and one-stage detection (i.e., region proposal network (RPN) [18], single-shot detector (SSD) [19], You Only Look Once (YOLO) [20], RetinaNet [21], CornerNet [22], etc.). In smart transportation applications, real-time processing is essential to guarantee the safety, accuracy, and efficiency of operating vehicles. For example, in a self-driving car within a smart transportation system, a real-time object detector is required to quickly and accurately detect speed limit signs, pavement, pedestrian zone signs, and other vehicles on the street, allowing the car to take the appropriate subsequent actions in real-time. Therefore, one-stage detection is the most suitable for real-time smart transportation applications due to its fast detection speed and high accuracy [23,24]. Furthermore, among recently developed one-stage detection models, YOLO is considered the leading representative.
First launched in 2015, the YOLO [20] real-time object detection model has been developed through the years with multiple versions (i.e., YOLOv2 [25], YOLOv3 [26], YOLOv4 [27], YOLOv5 [28], YOLOv6 [29], YOLOv7 [30], and YOLOv8 [31]) as depicted in Figure 1. Specifically, YOLO takes a different approach compared with traditional object detection models. Instead of dividing the image into regions and applying classification and localization separately, YOLO performs both tasks in a single pass through its network [24]. It predicts bounding boxes and class probabilities directly on a grid-based output. By doing so, YOLO and its variants have significantly contributed to object detection. Moreover, YOLO models aim to improve themselves, becoming more efficient, accurate, and scalable for real-world applications [32,33,34]. However, YOLO models differ in their network backbone, neck, head, loss functions, and other features, making it crucial to select the optimal models for smart transportation applications by evaluating and analyzing their performance.
Previous studies have investigated object detection models. Nazir et al. [35] introduce an overview of YOLO variants, including YOLOv2, YOLOv3, YOLOv4, YOLOv5, YOLOv6, and YOLOv7. In addition, Sozzi et al. [36] introduce a comparative evaluation of the accuracy and speed of various versions of YOLO object detection algorithms, such as YOLOv3, YOLOv3-tiny, YOLOv4, YOLOv4-tiny, YOLOv5x, and YOLOv5s, for grape-yield estimation. Our study is inspired by these works regarding the performance comparison and architectural analysis of various YOLO models. In contrast, this article specifically focuses on the performance of YOLO models on transportation data that affects the autonomous driving situation in smart transportation. Notably, we evaluate YOLO performance across various datasets, object classes, and intersection-over-union (IoU) thresholds.
In this article, we conduct an empirical evaluation and analysis of multiple YOLO models, including YOLO version 3 to 8 to observe their performance and determine the optimal models for smart transportation, with a focus on road transportation. To achieve this, we first analyze and evaluate the performance of multiple YOLO models in terms of accuracy (i.e., average precision (AP)) according to road transportation data using multiple datasets (i.e., COCO and PASCAL VOC datasets). Second, we evaluate the performance of various YOLO models on multiple object classes within the datasets, specifically focusing on those relevant to road transportation. Third, multiple IoU thresholds are also considered in the performance measurement and analysis. By doing so, we make six observations related to the following three aspects:
- Datasets: The observations on datasets are obtained in the evaluation and analysis. First, the performance of YOLO models trained and evaluated on various datasets can be disparate. In particular, YOLO models perform better on PASCAL VOC than on COCO. Second, YOLOv5 and YOLOv8 are dominant models on both datasets. The reason for the performance disparity of YOLO models on the two datasets can be attributed to various factors, including differences in object classes, dataset sizes, object characteristics, architectural design, optimization techniques, and dataset biases. These factors affect model performance on various datasets, leading to variations in AP scores.
- IoU thresholds: The observation on IoU thresholds indicates that as the IoU threshold increases, the mean AP (mAP) of a YOLO model decreases. YOLOv5 and YOLOv8 perform better than other YOLO models across various IoU thresholds. The first observation is related to the essence of the IoU threshold, where a higher threshold demands a higher standard for accurate predictions. For the second observation, YOLOv5 and YOLOv8 outperform other models, because of their bag of freebies (BoF) and bag of specials (BoS) techniques, such as backbone, neck, head architectures, loss functions, anchor-based mechanisms, modules for enhancing the receptive field, data augmentation strategies, feature integration, and activation functions.
- Class of objects: Based on the observation of object classes, the performance of YOLO models can fluctuate or stabilize depending on the quality of the datasets and the characteristics of the objects within them. Similar to the above observations, YOLOv5 and YOLOv8 outperform most object classes in the two datasets. For the first observation related to the class of objects, we observe that differences in AP values of YOLO models across object classes come from certain factors, such as object class imbalance and object class-specific characteristics. For example, objects with smaller sizes or complex shapes can pose challenges for detection, resulting in lower AP values for those object classes. For the second observation, YOLOv5 and YOLOv8 still maintain their lead, because of their BoF and BoS techniques as analyzed in the observations related to IoU thresholds.
2. Background and Motivation
2.1. Object Detection in Road Transportation
2.1.1. Object Detection-based Applications
Object detection has become an essential element in contemporary road transportation systems, improving safety, efficiency, and decision-making processes. Four key applications of object detection in road transportation are: (1) intelligent traffic management [4], (2) advanced driver assistance systems, (3) autonomous vehicles [8], and (4) traffic-related object detection and recognition [7].
- Intelligent traffic management: Object detection is applied to monitor and analyze traffic conditions in real-time in traffic surveillance systems. For example, sensors in these systems, combined with object detection techniques, can identify and track vehicles, pedestrians, and other road users. The data gathered from detection and tracking is then employed for traffic flow management, congestion detection, and incident identification, helping to inform decisions and enhance traffic management strategies.
- Advanced driver assistance systems (ADAS): Object detection is a core technique in ADAS designed to improve driver safety and assist with driving tasks. By using sensors, object detection in ADAS can identify and track road objects, enabling features such as forward collision warnings, lane departure alerts, blind-spot detection, and adaptive cruise control.
- Autonomous vehicles: Object detection using multiple sensors, such as cameras, LiDAR (light detection and ranging), radar, and ultrasonic sensors, enables vehicles to perceive and comprehend their surroundings, facilitating autonomous driving without human intervention. The data collected by these sensors allow autonomous vehicles to identify and classify objects like vehicles, pedestrians, cyclists, traffic signs, and traffic lights. This information supports decision-making and ensures safe navigation, enabling vehicles to operate independently.
- Traffic sign detection and recognition: Object detection detects and recognizes traffic signs and road markings, such as traffic signs (speed limits, stop signs, yield signs, and lane markings). This information assists drivers in real-time compliance with traffic regulations and supports autonomous vehicles in understanding and obeying traffic signs.
- In summary, object detection techniques are vital in road transportation systems. They enhance safety and efficiency for drivers, passengers, and pedestrians. Additionally, these techniques enable smart transportation systems to perceive and adapt to dynamic road conditions.
2.1.2. One-Stage-Based Object Detection System
Object detection systems share common components, such as video/image from a camera, image frames generated from the video, object detectors, and object bounding boxes as output. In this article, we focus on evaluating and analyzing the performance of YOLO models (e.g., a one-stage object detector) in smart transportation (e.g., one of IoT applications). A one-stage detector (i.e., YOLO, SSD, etc.) is regarded as the object detector in an object detection system used in smart transportation, such as on autonomous vehicles, smart traffic lights. In Figure 2, we provide an overview of the one-stage object detection system in smart transportation. As illustrated in Figure 2, the one-stage object detection system maintains common components of a conventional object detection system. The video/image input is collected from cameras deployed in smart transportation. The output is bounding boxes of detected objects. The primary difference is which object detection mechanisms are utilized by the object detector. A one-stage object detection system employs one-stage object detection mechanisms as its object detectors. An architectural overview of one-stage object detectors is shown on the right side of the figure.
The architecture of one-stage object detectors in Figure 2 is referred from [37,38]. It typically includes a backbone network, usually pretrained models on ImageNet datasets [39], region-based analysis methods, such as region of interest (RoI) pooling, and a dense prediction with the object locations and classifications in bounding box outputs. For more details:
- Backbone network: acts as a feature generation network, which extracts features from an image. It inputs an image and generates a feature map while preserving spatial information of the image. Popular backbone networks used in object detection methods are Darknet [20], CSPDarknet [39], ResNet [40], VGG [41], EfficientNet [42], MobileNet [43], etc.
- RoI pooling: is a method focusing only on certain portions of the feature map generated from the backbone to output new fixed-length feature vectors. Using the feature map from the backbone network alone is ineffective for locating objects, so RoI pooling addresses this by focusing on a set number of Regions of Interest (RoIs), determined by a region proposal network (RPN), to produce a fixed-length feature vector for each RoI. Thus, RoI pooling gets two inputs, which are the feature map from the backbone and RoI proposals from an RPN.
- Classification and location: fixed-length feature vectors from RoI pooling are input to fully connected layers for classification and bounding box regression (e.g., location)
2.2. YOLO Models
Three essential components of the YOLO framework [27] are backbone, neck, and dense prediction (or head), as presented in Figure 3.
- Backbone: is a CNN which extracts features from input images, typically pre-trained on a classification dataset, usually ImageNet, as explained in Section 2.1.2. All backbone models are classification models. Well-known backbones used in object detection are VGG16 [41], ResNet50 [44], EfficientNet [42], CSPDarknet53 [45], etc.
- Neck: layers collected feature maps from different backbone stages. Simply, it works as a feature aggregator. It is composed of several bottom-up and top-down paths as depicted in the figure. Neck networks in object detection include spatial pyramid pooling (SPP) [46], feature pyramid network (FPN) [47], path aggregation network (PANet) [48], etc.
- Head/dense prediction: works as an object detector, which determines the object region but does not specify which object classes are presented in the region. It is equal to the RoI pooling of the one-stage object detection in Figure 2. Head networks can be classified into anchor-based or anchor-free detectors [27].
YOLO versions are developed based on the YOLO framework described above. They vary in the mechanisms used for the backbone, neck, and head. We present a summary of the primary mechanisms, such as backbone, neck, anchor box, activation function, loss function, and data augmentation, utilized in latest YOLO models (e.g., YOLOv3, YOLOv4, YOLOv5, YOLOv6, YOLOv7, YOLOv8) in Table 1 and Table 2.
2.3. Metrics for Evaluating Object Detection
Three popular performance metrics for object detection are frames per second (FPS), recall, and precision [33,49,50,51]. Two main approaches for object detection performance evaluations are speed and accuracy. The fps or frame rate is a performance metric focusing on the speed of the object detection procedure. This performance metric is critical in real-time applications based on object detection, such as autonomous driving, traffic monitoring, video surveillance, and medical detection in healthcare [52]. A typical fps for computer vision applications is about 15 to 30 (fps) [53]. For real-time object detection applications, a high speed of 10 (fps) or higher is required. For example, YOLO models are well-known for their accuracy and speed, on i7 CPU and the inference on 640-resolution images, YOLOv5 Nano, YOLOv6 Nano, and YOLOv6 Tiny perform more than 20 (fps) [54], satisfying the real-time requirement of object detection applications. However, this article focuses on comparing YOLO models in terms of accuracy. The following sections review two popular performance metrics related to accuracy: recall and precision.
Before considering the details of accuracy performance metrics, we discuss the same commonly used concepts. First, it is intersection over union (IoU), which is a principle in all state-of-the-art metrics [55]. It is defined as the intersection over a union of the detection bounding box and the ground truth bounding box.
Figure 4 visualizes the IoU with the detection and the ground truth bounding boxes. The formula for calculating IoU is given below:
- According to IoU and its score threshold definition (e.g., is considered as a good prediction), how many objects in an image are detected correctly will be determined.
-
Other basic concepts used in accuracy metrics are the true positive (TP), false positive (FP), and false negative (FN), which are defined as follows:
- True positive (TP): indicates the correct detection of the ground truth bounding box [49]. It means the IoU score of the prediction is greater than a predefined threshold
- False positive (FP): indicates the incorrect detection of the ground truth bounding box [49]. It means the IoU score of the prediction is smaller than a predefined threshold
- False negative (FN): indicates the undetected ground truth bounding box [49]
- A true negative (TN) indicates that the bounding boxes should not be detected in an image. This concept are not be considered in object detection, because the number of this kind of bounding boxes is massive in an image. Thus, metrics using the TN are not be used to assess object detection methods, such as the receiver operating characteristic (ROC) curves, FP rate (FPR), TP rate (TPR) [49].
Two basic metrics based on the above concepts are precision (P) and recall (R). The precision measures how accurate predictions are. In other words, this metric indicates the percentage of correct predictions.
Recall (R) measures how well the model determines all positives.
F1-Score is the combination of both precision and recall. This metric is known as the harmonic mean of the two metrics. The formula for the F1-Score is represented as follows:
Instead of using only one metric (P or R) in the assessment process, an area under the curve (AUC) has been used to indicate both precision and recall. The higher AUC is, the higher both precision and recall are. However, AUC is usually a zigzag-like curve, which makes it hard to analyze the accurate measurement of AUC [49]. Average precision (AP) has been utilized popularly to overcome challenges with AUC. The following part provides an explanation of metrics related to AP.
- is an area under the precision-recall curve evaluated at IoU threshold. It is defined as follows:One of the most popular metrics developed from is the mean average precision (mAP). mAP is used to assess object detection methods over all classes in a particular dataset [49]. Basically, it is the average AP over all classes:where denotes the AP of the class in the dataset, and N is the total number of classes in the dataset.
- Which metric should be used for measuring the performance of object detection is crucial. According to the steps in an object detection problem, mAP is suggested to use on a validation set. Otherwise, precision, recall, and F1-Score are adequate on the test set.
- In this article, we focus on analyzing and evaluating the performance of different YOLO versions, thus we consider mAP as the primary performance metric.
2.4. Datasets for Object Detection
Various datasets are used in object detection applications, such as ImageNet [56], COCO [57], PASCAL VOC [58], KITTI [59], and DOTA [60], etc. In this article, we focus on an empirical evaluation and analysis of YOLO models in smart transportation context, such as road transportation. Accordingly, we select COCO and PASCAL VOC as our experimental datasets. The two datasets are capable of providing not only a number of objects in road transportation but efficient notations as well with high-resolution images. Principle statistics of these datasets are provided next.
2.4.1. COCO (Common Objects in Context)
The COCO dataset is a large-scale image recognition dataset for object detection, segmentation, and captioning tasks. It contains over images. Each image is annotated with 80 object categories and 5 captions describing the scene. Object categories are also divided into two main categories, “things” and “stuff”. While the “things” contains object classes easily handled (i.e., animals, vehicles, household items, etc.), “stuff” includes environmental items (i.e., tree, sky, road, etc.) [61]. In particular, some prevalent object classes in 80 classes are person, bicycle, car, airplane, bus, train, truck, traffic light, cat, dog, sink, etc. Moreover, COCO offers various types of annotations, such as object detection, stuff image segmentation, panoptic segmentation, and keypoint. For more details, with object detection annotation, COCO provides annotations with bounding box coordinates for 80 object classes.
2.4.2. PASCAL VOC (Visual Object Classes)
PASCAL VOC provides standardized images for object detection and segmentation tasks. The latest update contains images with 20 object classes. Additionally, it provides annotated objects and segmentations [62]. These object classes are grouped into person, animal, vehicle, and indoor classes. In particular, some prevalent object classes are person, bird, horse, airplane, boat, bicycle, bus, chair, sofa, etc. PASCAL VOC also provides object detection annotation with bounding box coordinates for 20 object classes.
We conduct an accuracy comparison between models using average precision (AP).
Precision-recall curves are good for grasping the overall performance of an algorithm, but have limitations in quantitatively comparing performance between different algorithms. The alternative that came out is Average Precision. Average Precision is a single value representing the performance of the recognition algorithm and is calculated as the area under the graph line on the precision-recall curve. The higher the Average Precision, the better the overall performance of the algorithm. If you have multiple object classes, take the AP for each class, sum them all up, and divide by the number of object classes to evaluate the performance of your algorithm. This is called mAP (mean average precision). Ultimately, the AP of each model is measured by class, aggregated, and mAP is obtained for comparative analysis.
We used road transportation data as the dataset to validate the model. Our goal was to conduct a comparative analysis to determine the accuracy of object recognition in autonomous driving situations. We investigated which model structure and algorithm are most suitable for correctly recognizing objects encountered by a car. It is worth noting that even a YOLO model with a higher version or known for its high accuracy (mAP) may perform worse than previous models on certain datasets. Therefore, in the context of autonomous driving, particularly road transportation, it is crucial to identify the model with the highest recognition rate and accuracy among YOLO models. By doing so, we can find a suitable model for the specific transportation data and improve the overall performance of autonomous driving systems.
We divided the AP results into six dimensions for analysis. We calculated AP for IoU values greater than or equal to 0.50, greater than or equal to 0.75, and for each threshold between 0.5 and 0.95. Additionally, we calculated AP for three different object scales: AP(S) for small objects (area < 32² px), AP(M) for medium objects (32² < area < 96² px), and AP(L) for large objects (area > 96² px).
3. Evaluation and Result Analysis
In this article, the performance of YOLO models is extensively evaluated using various benchmark datasets (e.g., COCO and PASCAL VOC) and the evaluation metric setup (e.g., IoU thresholds). Specifically, we evaluate YOLO models on the COCO and PASCAL VOC datasets which cover a wide range of object categories on road transportation. The mAP evaluation metric is used to measure the accuracy of various YOLO models across different datasets, object classes, and IoU thresholds.
3.1. Experimental Setup
We use a server equipped with a 32-core Intel Xeon Gold CPU and 64 GB of DRAM, running with an 18.04.5 Ubuntu and 4.15.0 Linux kernel for training and evaluation. We use COCO2017 and PASCAL VOC as training and evaluation datasets. In this article, we focus on object detection in road transportation and only consider object classes related to road transportation in two datasets. The COCO2017 datasets have about 80 classes, but only road transportation-related object classes are used in the experiments, including ten classes: bicycle, car, motorcycle, bus, train, truck, traffic light, stop sign, parking meter, and person. The total number of images we use for the validation is 5000 and with each object class detection, the number of labels varies from 60 to 10777.
For the PASCAL VOC datasets, we use 11530 images with 20 object classes of road transportation for training. In validation, we use 3422 images with six object classes (e.g., bicycle, bus, car, motorbike, person, and train). The number of labels varies from 142 to 7835. A summary of the datasets’ usage in the experiments is presented in Table 3.
- We validate various YOLO models on COCO with pre-trained weights. Additionally, we train and validate various YOLO models on COCO and Pascal VOC with CPUs.
3.2. Evaluation Overview
We present the experiment results, comparing the performance of YOLO models in terms of the datasets (e.g., COCO and PASCAL VOC), accuracy (e.g., mAP scores at various IoU thresholds), and object classes. Figure 5a,b illustrate the AP results of YOLO models on COCO and PASCAL VOC datasets, respectively. Figure 6 and Figure 7 indicate how the IoU thresholds affect the AP of object classes in COCO and PASCAL VOC datasets, respectively. Table 4, Table 5, Table 6 and Table 7 show the AP at the IoU threshold 50 and the average AP (e.g., average AP at all IoU thresholds) of YOLO models on specific object classes in COCO and PASCAL VOC datasets, respectively.
3.3. Experimental Results and Observations
The next section examines the performance of YOLO from three perspectives: datasets, IoU thresholds, and object classes. Based on the performance analysis, we provide empirical observations on the performance of various YOLO models when applied to road transportation datasets (e.g., COCO and PASCAL VOC).
3.3.1. Dataset
Figure 5a,b present the AP of six YOLO models at four thresholds (e.g., IoU threshold ) on the COCO and PASCAL VOC datasets, respectively. As depicted in the figures, YOLO models on the PASCAL VOC datasets can get higher mAP than on the COCO datasets across various IoU thresholds.
For example, as shown in Figure 5a, dominant YOLO models (e.g., YOLOv4, YOLOv5, YOLOv8), trained on COCO datasets, raise the AP in a range at , at , at , and at . Whereas, for these dominant YOLO models on PASCAL VOC datasets shown in Figure 5b, the AP range is greater with at , at , at , and at .
YOLO models perform better on the Pascal VOC dataset than on COCO because Pascal VOC contains fewer object classes and a less diverse range of object sizes compared to COCO. Additionally, the PASCAL VOC dataset is specifically designed for object detection tasks, whereas the COCO dataset covers a broader range of computer vision tasks, including object detection, instance segmentation, and more. Hence, images in PASCAL VOC can contain efficient and suitable objects for the training and validation processes of object detection tasks. Thus, according to the database variety, we make the following observation related to the YOLO performance.
- Observation 1: The performance of YOLO models trained or evaluated on different datasets can have disparate performance.
In addition, in Figure 5, we can observe that YOLOv5 and YOLOv8 are dominant models at various IoU thresholds. For example, on COCO datasets, YOLOv5 outperforms the others at . Further, YOLOv8 follows YOLOv5. At , YOLOv4 and YOLOv6 can achieve high performance, but at other IoU thresholds, they cannot maintain their performance like YOLOv5 and YOLOv8 can do. Therefore, we can not consider YOLOv4 and YOLOv6 as dominant YOLO models on the COCO datasets. On the PASCAL VOC datasets, YOLOv8 is better than the others at . YOLOv5 goes after YOLOv8 at . YOLOv4 can achieve high performance at , but has the lowest performance at . Therefore, we can not consider it a dominant YOLO model on the PASCAL VOC datasets.
- Furthermore, YOLOv5 outperforms other models because it uses the CSPDarknet53 backbone, PANet for effective multi-scale feature integration, the auto-anchor technique for bounding box adjustment, and improved loss function. Additionally, YOLOv8 demonstrates superior performance due to its use of the modified CSPDarknet53 backbone, PAN feature fusion, anchor-free detection, class loss optimization, complete IoU loss for precise bounding boxes, and distribution focal loss to enhance accuracy across diverse object classes. Therefore, we make the following observation related to the datasets as follows.
- Observation 2: The YOLOv5 model is dominant on the COCO dataset, and YOLOv8 is dominant on the PASCAL VOC dataset.
3.3.2. Intersection over Union (IoU) Thresholds
Next, we conduct experiments using various IoU thresholds to observe how YOLO models perform on the two datasets. In detail, four different IoU thresholds (e.g., 50, 75, 85, and 95) are set up in the experiment to measure the performance of the YOLO models using mAP. Figure 5a and Figure 5b present the mAP for six YOLO models on the COCO and PASCAL VOC datasets, respectively.
As shown in the two figures, as the IoU threshold increases (e.g., from 50 to 95), the mAP of all YOLO models tends to decrease. This finding is apparently according to (5) and (6), indicating that a higher IoU threshold results in a higher standard for good prediction. Thus, fewer predictions are considered good or correct. Hence, we make the first observation related to the IoU threshold as follows.
- Observation 3: The mAP of the YOLO models becomes lower with a higher IoU threshold.
Also in Figure 5, we can observe that YOLOv5 and YOLOv8 outperform the rest of the models for most of the IoU threshold scales. For example, on the COCO datasets, YOLOv5 and YOLOv8 obtain the highest mAP at three IoU thresholds (e.g., ). On PASCAL VOC datasets, YOLOv5 and YOLOv8 outperform the other models at two IoU thresholds (85 and 95).
This better performance can be attributed to various architectural improvements and optimizations introduced in YOLOv5 and YOLOv8, such as CSPDarknet53, PANet, Binary Cross Entropy, Logit Loss function, and CIoU loss. The first factor is the model architecture of YOLO models. The architectural design for each YOLO model plays a crucial role in performance at various IOU thresholds. Further, YOLOv3, YOLOv4, YOLOv5, YOLOv6, YOLOv7, and YOLOv8 have distinct network structures, layer configurations, and feature fusion mechanisms. These architectural variances affect the models’ ability to handle object detection tasks with varying IOU thresholds. For example, some models may prioritize precision at higher IOU thresholds, whereas others may focus on recall at lower IOU thresholds. Hence, we provide a second observation of the best YOLO models when varying IoU thresholds.
- Observation 4: The YOLOv5 and YOLOv8 models outperform other YOLO models across IoU thresholds.
3.3.3. Class of Objects
Figure 6 and Figure 7 illustrate the performance of various object classes in the two datasets. As depicted in Figure 6, the performance of YOLO models on object classes in the COCO datasets fluctuates, demonstrating the difference in performance between the traffic light and bicycle classes perform the worst for all YOLO models. For example, at and , traffic light and bicycle classes get the lowest performance with all YOLO models. As for the bicycle class, it achieves around (e.g., with YOLOv7) and (e.g., with YOLOv3) at and , respectively. As for the traffic light class, it even achieves even lower performance of around (e.g., with YOLOv7) and (e.g., with YOLOv3) at and , respectively. Considering the same YOLO models at and , the training object classes can achieve around and , respectively, demonstrating a large performance gap between object classes on the same dataset.
In contrast, the performance of YOLO models on object classes in the Pascal VOC dataset remains more stable than in the COCO dataset, as presented in Figure 7 because PASCAL VOC contains more efficient and suitable objects than COCO. The fluctuating and stable performance of YOLO models on various object classes in the COCO and PASCAL VOC datasets respectively indicate that the data quality of object classes can influence the performance of YOLO models. Thus, the first observation related to the datasets is provided below.
- Observation 5: The performance of YOLO models on various object classes can fluctuate or stabilize according to the quality of the datasets.
Table 4 and Table 5 detail the YOLO performance at and the average YOLO performance at a range of IoU thresholds on the COCO datasets, respectively. The performance on the PASCAL VOC datasets is presented in Table 6 and Table 7. As shown in Table 4 and Table 6, at a low IoU threshold, , YOLOv4 outperforms other YOLO models on both datasets. For example, on COCO datasets, shown in Table 4, YOLOv4 achieves the highest performance with object classes (e.g., bicycle, car, bus, truck, traffic light, and parking meter). On the PASCAL VOC datasets, in Table 6, YOLOv4 is dominant for object classes. However, at various IoU thresholds as displayed in Table 5 and Table 7, the dominant models are YOLOv5 and YOLOv8 on the COCO and PASCAL VOC datasets, respectively. For example, on COCO datasets as shown in Table 5, YOLOv5 outperforms with object classes. in contrast, on the PASCAL VOC datasets as shown in Table 7, YOLOv8 outperforms the other models for object classes. Thus, YOLOv5 and YOLOv8 outperform other models for most object classes in the two datasets, leading to the following observation.
- Observation 6: Both YOLOv5 and YOLOv8 outperform the other models on most of the object classes.
- The following section summarizes the overall performance results, demonstrating that YOLOv4, YOLOv5, and YOLOv8 outperform the other YOLO models on the two datasets.
3.4. Summary
In summary, the experimental results confirm the anticipated effects of datasets, object classes, and IoU thresholds on the performance of YOLO models. Specifically, first, the performance of YOLO models trained and validated on different datasets can perform disparately. Second, the higher the IoU threshold is, the lower YOLO performance achieves. Last, YOLO performance on various object classes stabilizes according to the dataset quality.
Moreover, the experimental results show that YOLOv5 and YOLOv8 consistently outperform others accross the IoU thresholds ranging from 50 to 95 on the COCO and PASCAL VOC datasets. Additionally, at a low IoU threshold (e.g., ), YOLOv4 exhibits the best performance on both datasets. These results suggest that YOLOv5 and YOLOv8 are promising choices for object detection tasks in the road transportation scenario, due to their strong performance across a suitable range of IoU thresholds (e.g., from 50 to 95).
4. Related Work
Several studies have focused on evaluating the performance of YOLO variants in object detection. For example, Liule et al. [63] experiment on three versions: YOLOv3, YOLOv4, and YOLOv5. They evaluate and analyze the performance of the three YOLO variants regarding accuracy and inference speed by using training and predicting on the PASCAL VOC dataset. The present study aligns with their research in evaluating and analyzing the performance of YOLO variants on Pascal VOC. In contrast, we evaluated and analyzed more YOLO variants, including the latest one (YOLOv8). Further, we considered their performance on various datasets (COCO and Pascal VOC) and IoU thresholds, whereas they [63] does not consider such diverse factors.
Nazir et al. [35] provide a review of the YOLO variants (YOLO version 1 to 5) on their performance. They also study the accuracy and inference speed of various YOLO models like [63] does but on various datasets (e.g., COCO, KITTI, and SUN-RGBD datasets). The present work aligns with this research regarding evaluating the performance of YOLO variants on various datasets. In contrast, the present study provides a performance evaluation of YOLO variants on various datasets and contributes an empirical analysis of the performance evaluation. Furthermore, the other difference is that this article considers YOLO performance on various IoU thresholds, whereas [35] does not.
Sozzi et al. [36] introduce a comparative evaluation of the accuracy and inference speed of various versions of YOLO object detection algorithms, such as YOLOv3, YOLOv3-tiny, YOLOv4, YOLOv4-tiny, YOLOv5x, and YOLOv5s, for grape-yield estimation. The current study aligns with this work regarding providing a performance evaluation of YOLO variants in object detection tasks. However, while [36] focuses on object detection tasks in smart farming, the current study focuses on smart transportation. Therefore, the datasets used in these experiments are different. Moreover, the current study considers more variants of YOLO than in their study [36], more datasets, and more IoU thresholds.
Finally, this study empirically evaluates and analyzes various YOLO variants considering multiple datasets, object classes in datasets, and IoU thresholds. However, it also considers the scenario of smart transportation (e.g., road transportation), which is novel and imperative among object detection studies in smart transportation.
5. Conclusions
Based on the evaluation and analysis of YOLO’s performance across different datasets, object classes, and IoU thresholds in the context of road transportation, it has been observed that YOLO’s performance can be inconsistent due to the varying quality and characteristics of the datasets and the specific object classes within each dataset. The performance of YOLO models trained and validated on the same datasets may not always align with the expectation that the latest YOLO version will achieve higher performance. This is because, while improvements in YOLO’s internal architecture enhance its capabilities as an object detector, the quality and characteristics of the datasets also significantly influence its performance. Specifically, the empirical evaluation shows that YOLOv5 and YOLOv8 outperform other YOLO models on two widely-used datasets, COCO and PASCAL VOC, which are commonly employed in smart transportation applications. Consequently, these models are recommended as suitable choices for object detection in road or smart transportation systems.
References
- Butler, L.; Yigitcanlar, T.; Paz, A. Smart Urban Mobility Innovations: A Comprehensive Review and Evaluation. IEEE Access 2020, 8, 196034–196049. doi:10.1109/ACCESS.2020.3034596. [CrossRef]
- Golpayegani, F.; Guériau, M.; Laharotte, P.A.; Ghanadbashi, S.; Guo, J.; Geraghty, J.; Wang, S. Intelligent Shared Mobility Systems: A Survey on Whole System Design Requirements, Challenges and Future Direction. IEEE Access 2022, 10, 35302–35320. doi:10.1109/ACCESS.2022.3162848. [CrossRef]
- Longo, A.; Zappatore, M.; Navathe, S.B. The unified chart of mobility services: Towards a systemic approach to analyze service quality in smart mobility ecosystem. Journal of Parallel and Distributed Computing 2019, 127, 118–133.
- Peak, E. What makes transportation smart? defining intelligent transportation. https://www.iotforall.com/what-makes-transportation-smart-defining-intelligent-transportation. Accessed: 2023-06-13.
- Zantalis, F.; Koulouras, G.; Karabetsos, S.; Kandris, D. A review of machine learning and IoT in smart transportation. Future Internet 2019, 11, 94.
- IBM. What is smart transportation. https://www.ibm.com/blog/smart-transportation/. Accessed: 2023-06-13.
- Chen, B.H.; Huang, S.C. An Advanced Moving Object Detection Algorithm for Automatic Traffic Monitoring in Real-World Limited Bandwidth Networks. IEEE Transactions on Multimedia 2014, 16, 837–847. doi:10.1109/TMM.2014.2298377. [CrossRef]
- Ulmer, B. VITA-an autonomous road vehicle (ARV) for collision avoidance in traffic. Proceedings of the Intelligent Vehicles’ 92 Symposium, 1992, pp. 36–41. doi:10.1109/IVS.1992.252230. [CrossRef]
- Vu, V.T.; Bremond, F.; Davini, G.; Thonnat, M.; Pham, Q.C.; Allezard, N.; Sayd, P.; Rouas, J.L.; Ambellouis, S.; Flancquart, A. Audio-Video Event Recognition System for Public Transport Security. 2006 IET Conference on Crime and Security, 2006, pp. 414–419.
- Dalal, N.; Triggs, B. Histograms of oriented gradients for human detection. 2005 IEEE Computer Society Conference on Computer Vision and Pattern Recognition (CVPR’05), 2005, Vol. 1, pp. 886–893 vol. 1. doi:10.1109/CVPR.2005.177. [CrossRef]
- Felzenszwalb, P.F.; Girshick, R.B.; McAllester, D.; Ramanan, D. Object Detection with Discriminatively Trained Part-Based Models. IEEE Transactions on Pattern Analysis and Machine Intelligence 2010, 32, 1627–1645. doi:10.1109/TPAMI.2009.167. [CrossRef]
- He, K.; Zhang, X.; Ren, S.; Sun, J. Spatial Pyramid Pooling in Deep Convolutional Networks for Visual Recognition. IEEE Transactions on Pattern Analysis and Machine Intelligence 2015, 37, 1904–1916. doi:10.1109/TPAMI.2015.2389824. [CrossRef]
- Girshick, R.B. Fast R-CNN. CoRR 2015, abs/1504.08083, [1504.08083].
- Yang, Z.; Liu, S.; Hu, H.; Wang, L.; Lin, S. RepPoints: Point Set Representation for Object Detection. CoRR 2019, abs/1904.11490, [1904.11490].
- Carion, N.; Massa, F.; Synnaeve, G.; Usunier, N.; Kirillov, A.; Zagoruyko, S. End-to-End Object Detection with Transformers. CoRR 2020, abs/2005.12872, [2005.12872].
- Zheng, S.; Lu, J.; Zhao, H.; Zhu, X.; Luo, Z.; Wang, Y.; Fu, Y.; Feng, J.; Xiang, T.; Torr, P.H.S.; Zhang, L. Rethinking Semantic Segmentation from a Sequence-to-Sequence Perspective with Transformers. CoRR 2020, abs/2012.15840, [2012.15840].
- Sun, Z.; Cao, S.; Yang, Y.; Kitani, K.M. Rethinking transformer-based set prediction for object detection. Proceedings of the IEEE/CVF international conference on computer vision, 2021, pp. 3611–3620.
- Girshick, R. Fast R-CNN. Proceedings of the IEEE International Conference on Computer Vision (ICCV), 2015.
- Liu, W.; Anguelov, D.; Erhan, D.; Szegedy, C.; Reed, S.; Fu, C.Y.; Berg, A.C. SSD: Single Shot MultiBox Detector. Computer Vision – ECCV 2016; Leibe, B.; Matas, J.; Sebe, N.; Welling, M., Eds.; Springer International Publishing: Cham, 2016; pp. 21–37.
- Redmon, J.; Divvala, S.; Girshick, R.; Farhadi, A. You only look once: Unified, real-time object detection. Proceedings of the IEEE conference on computer vision and pattern recognition, 2016, pp. 779–788.
- Lin, T.Y.; Goyal, P.; Girshick, R.; He, K.; Dollár, P. Focal loss for dense object detection. Proceedings of the IEEE international conference on computer vision, 2017, pp. 2980–2988.
- Law, H.; Deng, J. CornerNet: Detecting Objects as Paired Keypoints. CoRR 2018, abs/1808.01244, [1808.01244].
- Zaidi, S.S.A.; Ansari, M.S.; Aslam, A.; Kanwal, N.; Asghar, M.; Lee, B. A survey of modern deep learning based object detection models. Digital Signal Processing 2022, p. 103514.
- Liu, L.; Ouyang, W.; Wang, X.; Fieguth, P.; Chen, J.; Liu, X.; Pietikäinen, M. Deep learning for generic object detection: A survey. International journal of computer vision 2020, 128, 261–318. [CrossRef]
- Redmon, J.; Farhadi, A. YOLO9000: Better, Faster, Stronger. 2017 IEEE Conference on Computer Vision and Pattern Recognition (CVPR) 2016, pp. 6517–6525.
- Redmon, J.; Farhadi, A. YOLOv3: An Incremental Improvement. ArXiv 2018, abs/1804.02767.
- Bochkovskiy, A.; Wang, C.Y.; Liao, H.Y.M. YOLOv4: Optimal Speed and Accuracy of Object Detection. ArXiv 2020, abs/2004.10934.
- YOLOv5: The friendliest AI architecture you’ll ever use. https://ultralytics.com/yolov5. Accessed: 2023-06-12.
- Li, C.; Li, L.; Jiang, H.; Weng, K.; Geng, Y.; Li, L.; Ke, Z.; Li, Q.; Cheng, M.; Nie, W.; Li, Y.; Zhang, B.; Liang, Y.; Zhou, L.; Xu, X.; Chu, X.; Wei, X.; Wei, X. YOLOv6: A Single-Stage Object Detection Framework for Industrial Applications. ArXiv 2022, abs/2209.02976.
- Wang, C.Y.; Bochkovskiy, A.; Liao, H.Y.M. YOLOv7: Trainable bag-of-freebies sets new state-of-the-art for real-time object detectors. ArXiv 2022, abs/2207.02696.
- Reis, D.; Kupec, J.; Hong, J.; Daoudi, A. Real-Time Flying Object Detection with YOLOv8. ArXiv 2023, abs/2305.09972.
- Wu, X.; Sahoo, D.; Hoi, S.C.H. Recent Advances in Deep Learning for Object Detection. ArXiv 2019, abs/1908.03673.
- Jiao, L.; Zhang, F.; Liu, F.; Yang, S.; Li, L.; Feng, Z.; Qu, R. A Survey of Deep Learning-Based Object Detection. IEEE Access 2019, 7, 128837–128868.
- Tong, K.; Wu, Y.; Zhou, F. Recent advances in small object detection based on deep learning: A review. Image Vis. Comput. 2020, 97, 103910.
- Nazir, A.; Wani, M.A. You Only Look Once - Object Detection Models: A Review. 2023 10th International Conference on Computing for Sustainable Global Development (INDIACom), 2023, pp. 1088–1095.
- Sozzi, M.; Cantalamessa, S.; Cogato, A.; Kayad, A.; Marinello, F. Automatic Bunch Detection in White Grape Varieties Using YOLOv3, YOLOv4, and YOLOv5 Deep Learning Algorithms. Agronomy 2022, 12. doi:10.3390/agronomy12020319. [CrossRef]
- Pal, S.K.; Pramanik, A.; Maiti, J.; Mitra, P. Deep learning in multi-object detection and tracking: state of the art. Applied Intelligence 2021, 51, 6400 – 6429. [CrossRef]
- Jiao, L.; Zhang, F.; Liu, F.; Yang, S.; Li, L.; Feng, Z.; Qu, R. A Survey of Deep Learning-Based Object Detection. IEEE Access 2019, 7, 128837–128868. doi:10.1109/ACCESS.2019.2939201. [CrossRef]
- Bochkovskiy, A.; Wang, C.; Liao, H.M. YOLOv4: Optimal Speed and Accuracy of Object Detection. CoRR 2020, abs/2004.10934, [2004.10934].
- He, K.; Zhang, X.; Ren, S.; Sun, J. Deep Residual Learning for Image Recognition. 2016 IEEE Conference on Computer Vision and Pattern Recognition (CVPR), 2016, pp. 770–778. doi:10.1109/CVPR.2016.90. [CrossRef]
- Simonyan, K.; Zisserman, A. Very deep convolutional networks for large-scale image recognition. arXiv preprint arXiv:1409.1556 2014.
- Tan, M.; Le, Q. Efficientnet: Rethinking model scaling for convolutional neural networks. International conference on machine learning. PMLR, 2019, pp. 6105–6114.
- Howard, A.G. MobileNets: Efficient convolutional neural networks for mobile vision applications. arXiv preprint arXiv:1704.04861 2017.
- He, K.; Zhang, X.; Ren, S.; Sun, J. Deep residual learning for image recognition. Proceedings of the IEEE conference on computer vision and pattern recognition, 2016, pp. 770–778.
- Wang, C.Y.; Liao, H.Y.M.; Wu, Y.H.; Chen, P.Y.; Hsieh, J.W.; Yeh, I.H. CSPNet: A new backbone that can enhance learning capability of CNN. Proceedings of the IEEE/CVF conference on computer vision and pattern recognition workshops, 2020, pp. 390–391.
- He, K.; Zhang, X.; Ren, S.; Sun, J. Spatial Pyramid Pooling in Deep Convolutional Networks for Visual Recognition. IEEE Transactions on Pattern Analysis and Machine Intelligence 2015, 37, 1904–1916. doi:10.1109/TPAMI.2015.2389824. [CrossRef]
- Lin, T.Y.; Dollar, P.; Girshick, R.; He, K.; Hariharan, B.; Belongie, S. Feature Pyramid Networks for Object Detection. Proceedings of the IEEE Conference on Computer Vision and Pattern Recognition (CVPR), 2017.
- Liu, S.; Qi, L.; Qin, H.; Shi, J.; Jia, J. Path Aggregation Network for Instance Segmentation. Proceedings of the IEEE Conference on Computer Vision and Pattern Recognition (CVPR), 2018.
- Padilla, R.; Netto, S.L.; da Silva, E.A.B. A Survey on Performance Metrics for Object-Detection Algorithms. 2020 International Conference on Systems, Signals and Image Processing (IWSSIP), 2020, pp. 237–242. doi:10.1109/IWSSIP48289.2020.9145130. [CrossRef]
- Liu, L.; Ouyang, W.; Wang, X.; Fieguth, P.W.; Chen, J.; Liu, X.; Pietikäinen, M. Deep Learning for Generic Object Detection: A Survey. International Journal of Computer Vision 2018, 128, 261–318.
- Zaidi, S.S.A.; Ansari, M.S.; Aslam, A.; Kanwal, N.; Asghar, M.N.; Lee, B. A Survey of Modern Deep Learning based Object Detection Models. Digit. Signal Process. 2021, 126, 103514.
- Two-i. What are some interesting applications of object detection. https://www.two-i.com/blog/what-are-some-interesting-applications-of-object-detection. Accessed: 2023-07-07.
- Lee, J.; il Hwang, K. YOLO with adaptive frame control for real-time object detection applications. Multimedia Tools and Applications 2021, 81, 36375 – 36396.
- LearnopenCV.com. FPS performance comparison of YOLO models. https://learnopencv.com/performance-comparison-of-yolo-models/#FPS-Performance-Comparison-of-YOLO-Models-on-CPU. Accessed: 2023-07-07.
- KDnuggets.com. Metrics evaluate deep learning object detectors. https://www.kdnuggets.com/2020/08/metrics-evaluate-deep-learning-object-detectors.html. Accessed: 2023-07-11.
- Deng, J.; Dong, W.; Socher, R.; Li, L.J.; Li, K.; Fei-Fei, L. ImageNet: A large-scale hierarchical image database. 2009 IEEE Conference on Computer Vision and Pattern Recognition, 2009, pp. 248–255. doi:10.1109/CVPR.2009.5206848. [CrossRef]
- Lin, T.Y.; Maire, M.; Belongie, S.; Hays, J.; Perona, P.; Ramanan, D.; Dollár, P.; Zitnick, C.L. Microsoft coco: Common objects in context. Computer Vision–ECCV 2014: 13th European Conference, Zurich, Switzerland, September 6-12, 2014, Proceedings, Part V 13. Springer, 2014, pp. 740–755.
- Everingham, M.; Van Gool, L.; Williams, C.K.; Winn, J.; Zisserman, A. The pascal visual object classes (voc) challenge. International journal of computer vision 2010, 88, 303–338. [CrossRef]
- Geiger, A.; Lenz, P.; Urtasun, R. Are we ready for autonomous driving? the kitti vision benchmark suite. 2012 IEEE conference on computer vision and pattern recognition. IEEE, 2012, pp. 3354–3361.
- Xia, G.S.; Bai, X.; Ding, J.; Zhu, Z.; Belongie, S.; Luo, J.; Datcu, M.; Pelillo, M.; Zhang, L. DOTA: A large-scale dataset for object detection in aerial images. Proceedings of the IEEE conference on computer vision and pattern recognition, 2018, pp. 3974–3983.
- v7labs. COCO dataset guide. https://www.v7labs.com/blog/coco-dataset-guide. Accessed: 2023-08-07.
- PASCAL. Pascal2. http://host.robots.ox.ac.uk/pascal/VOC/. Accessed: 2023-08-07.
- Liu, K.; Tang, H.; He, S.; Yu, Q.; Xiong, Y.; Wang, N. Performance validation of YOLO variants for object detection. Proceedings of the 2021 International Conference on bioinformatics and intelligent computing, 2021, pp. 239–243.
Figure 1.
You Only Look Once (YOLO) development timeline.
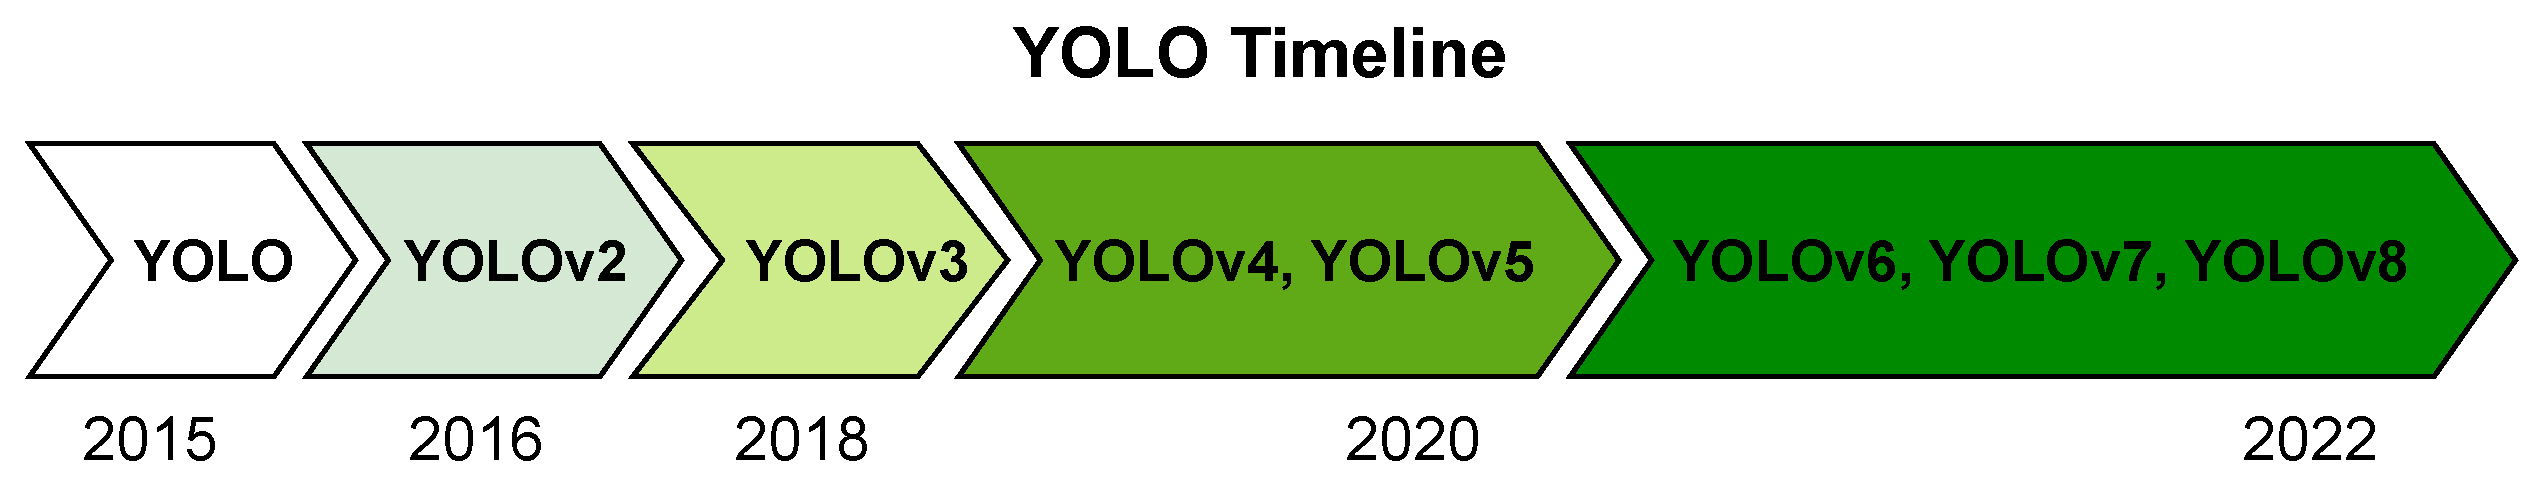
Figure 2.
One-stage object detection in road transportation.
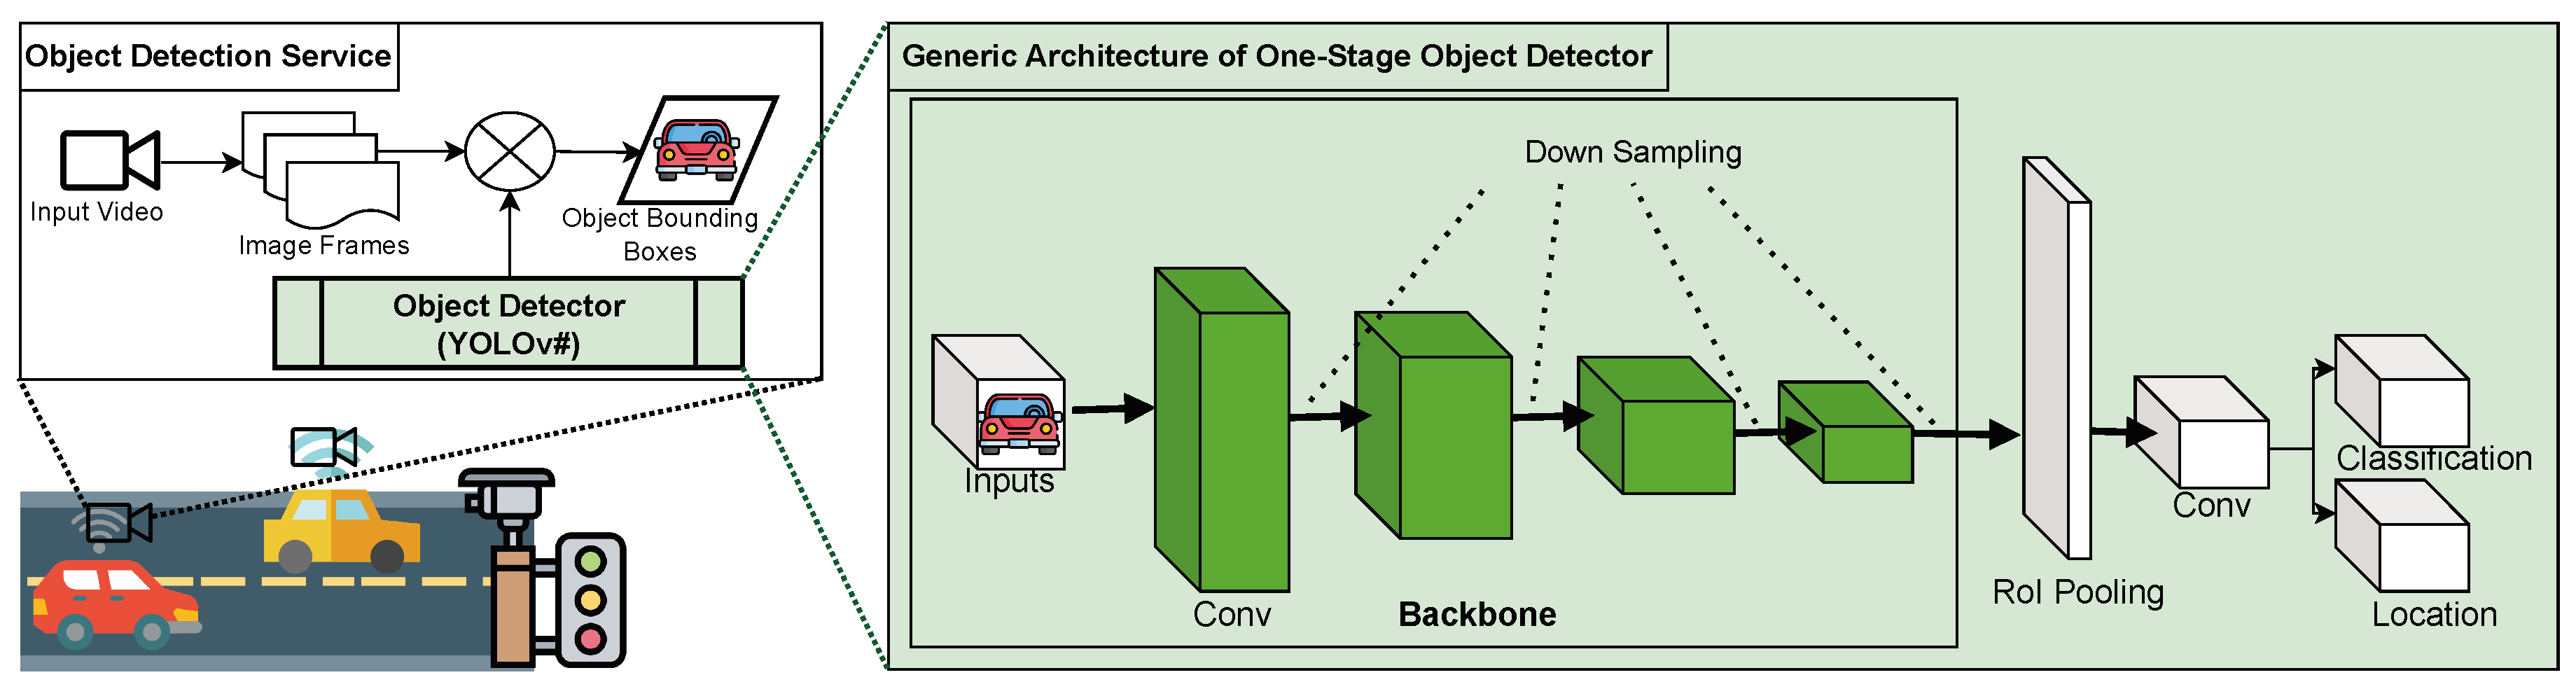
Figure 3.
YOLO framework.
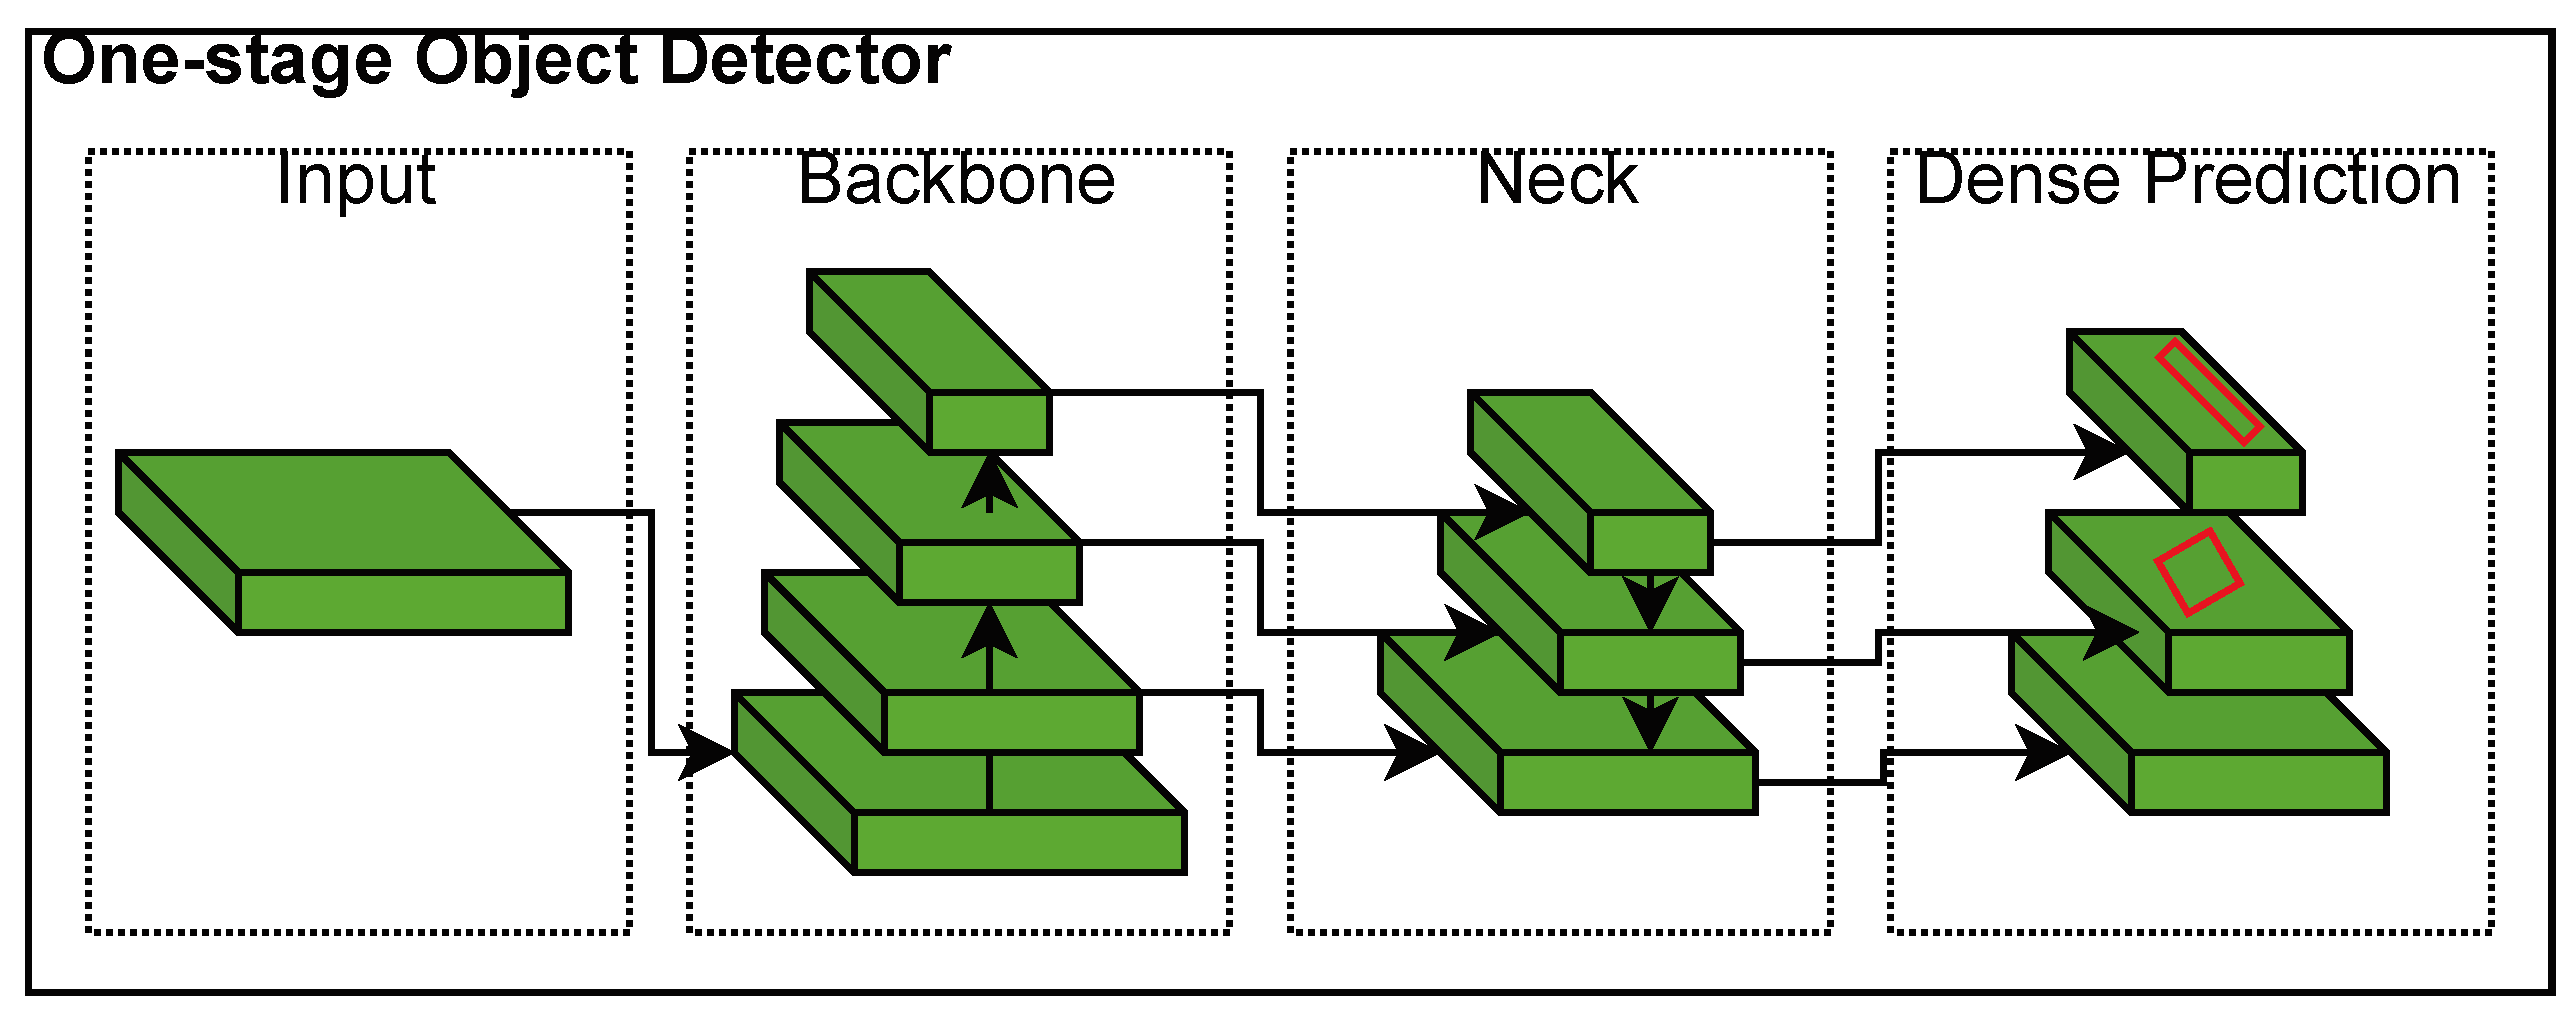
Figure 4.
Intersection over union (IoU).
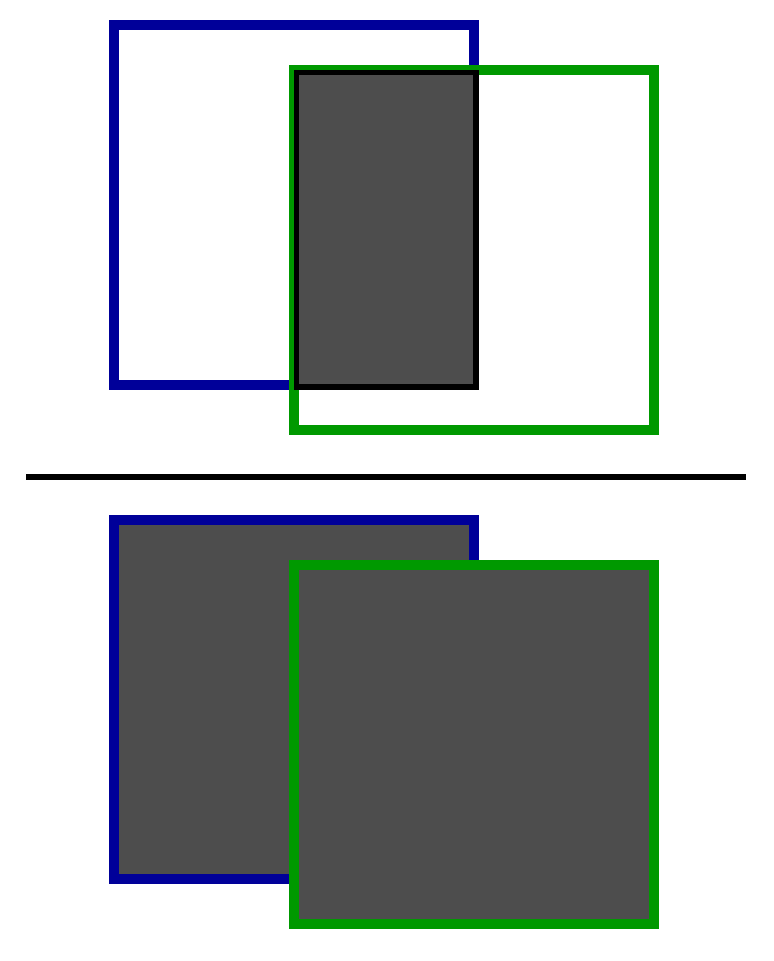
Figure 5.
YOLO models with various IoU thresholds on COCO and PASCAL VOC.
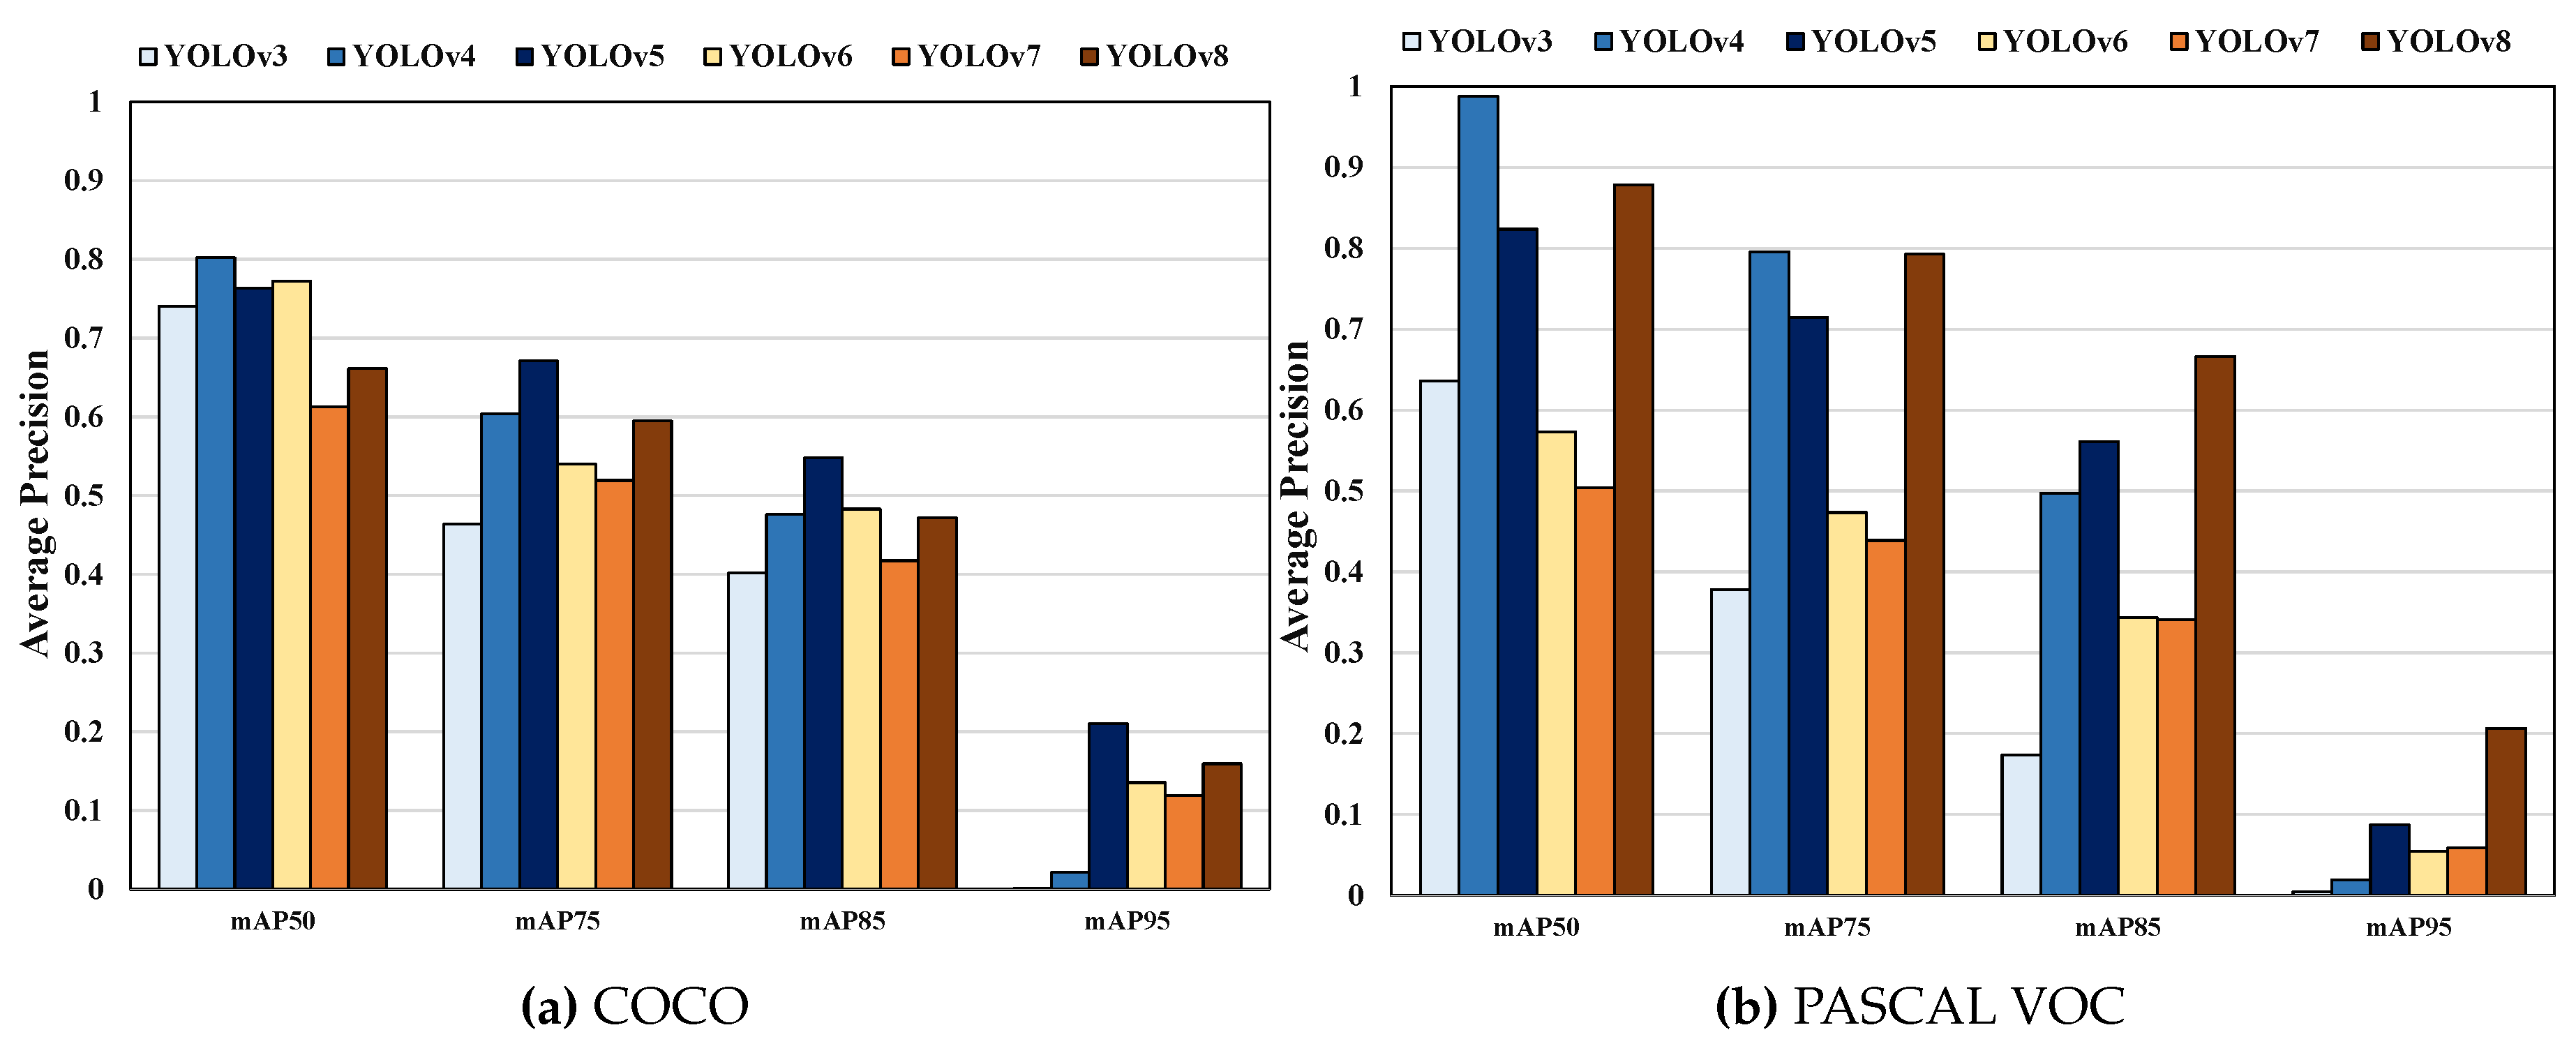
Figure 6.
AP of YOLO models across object classes in COCO.
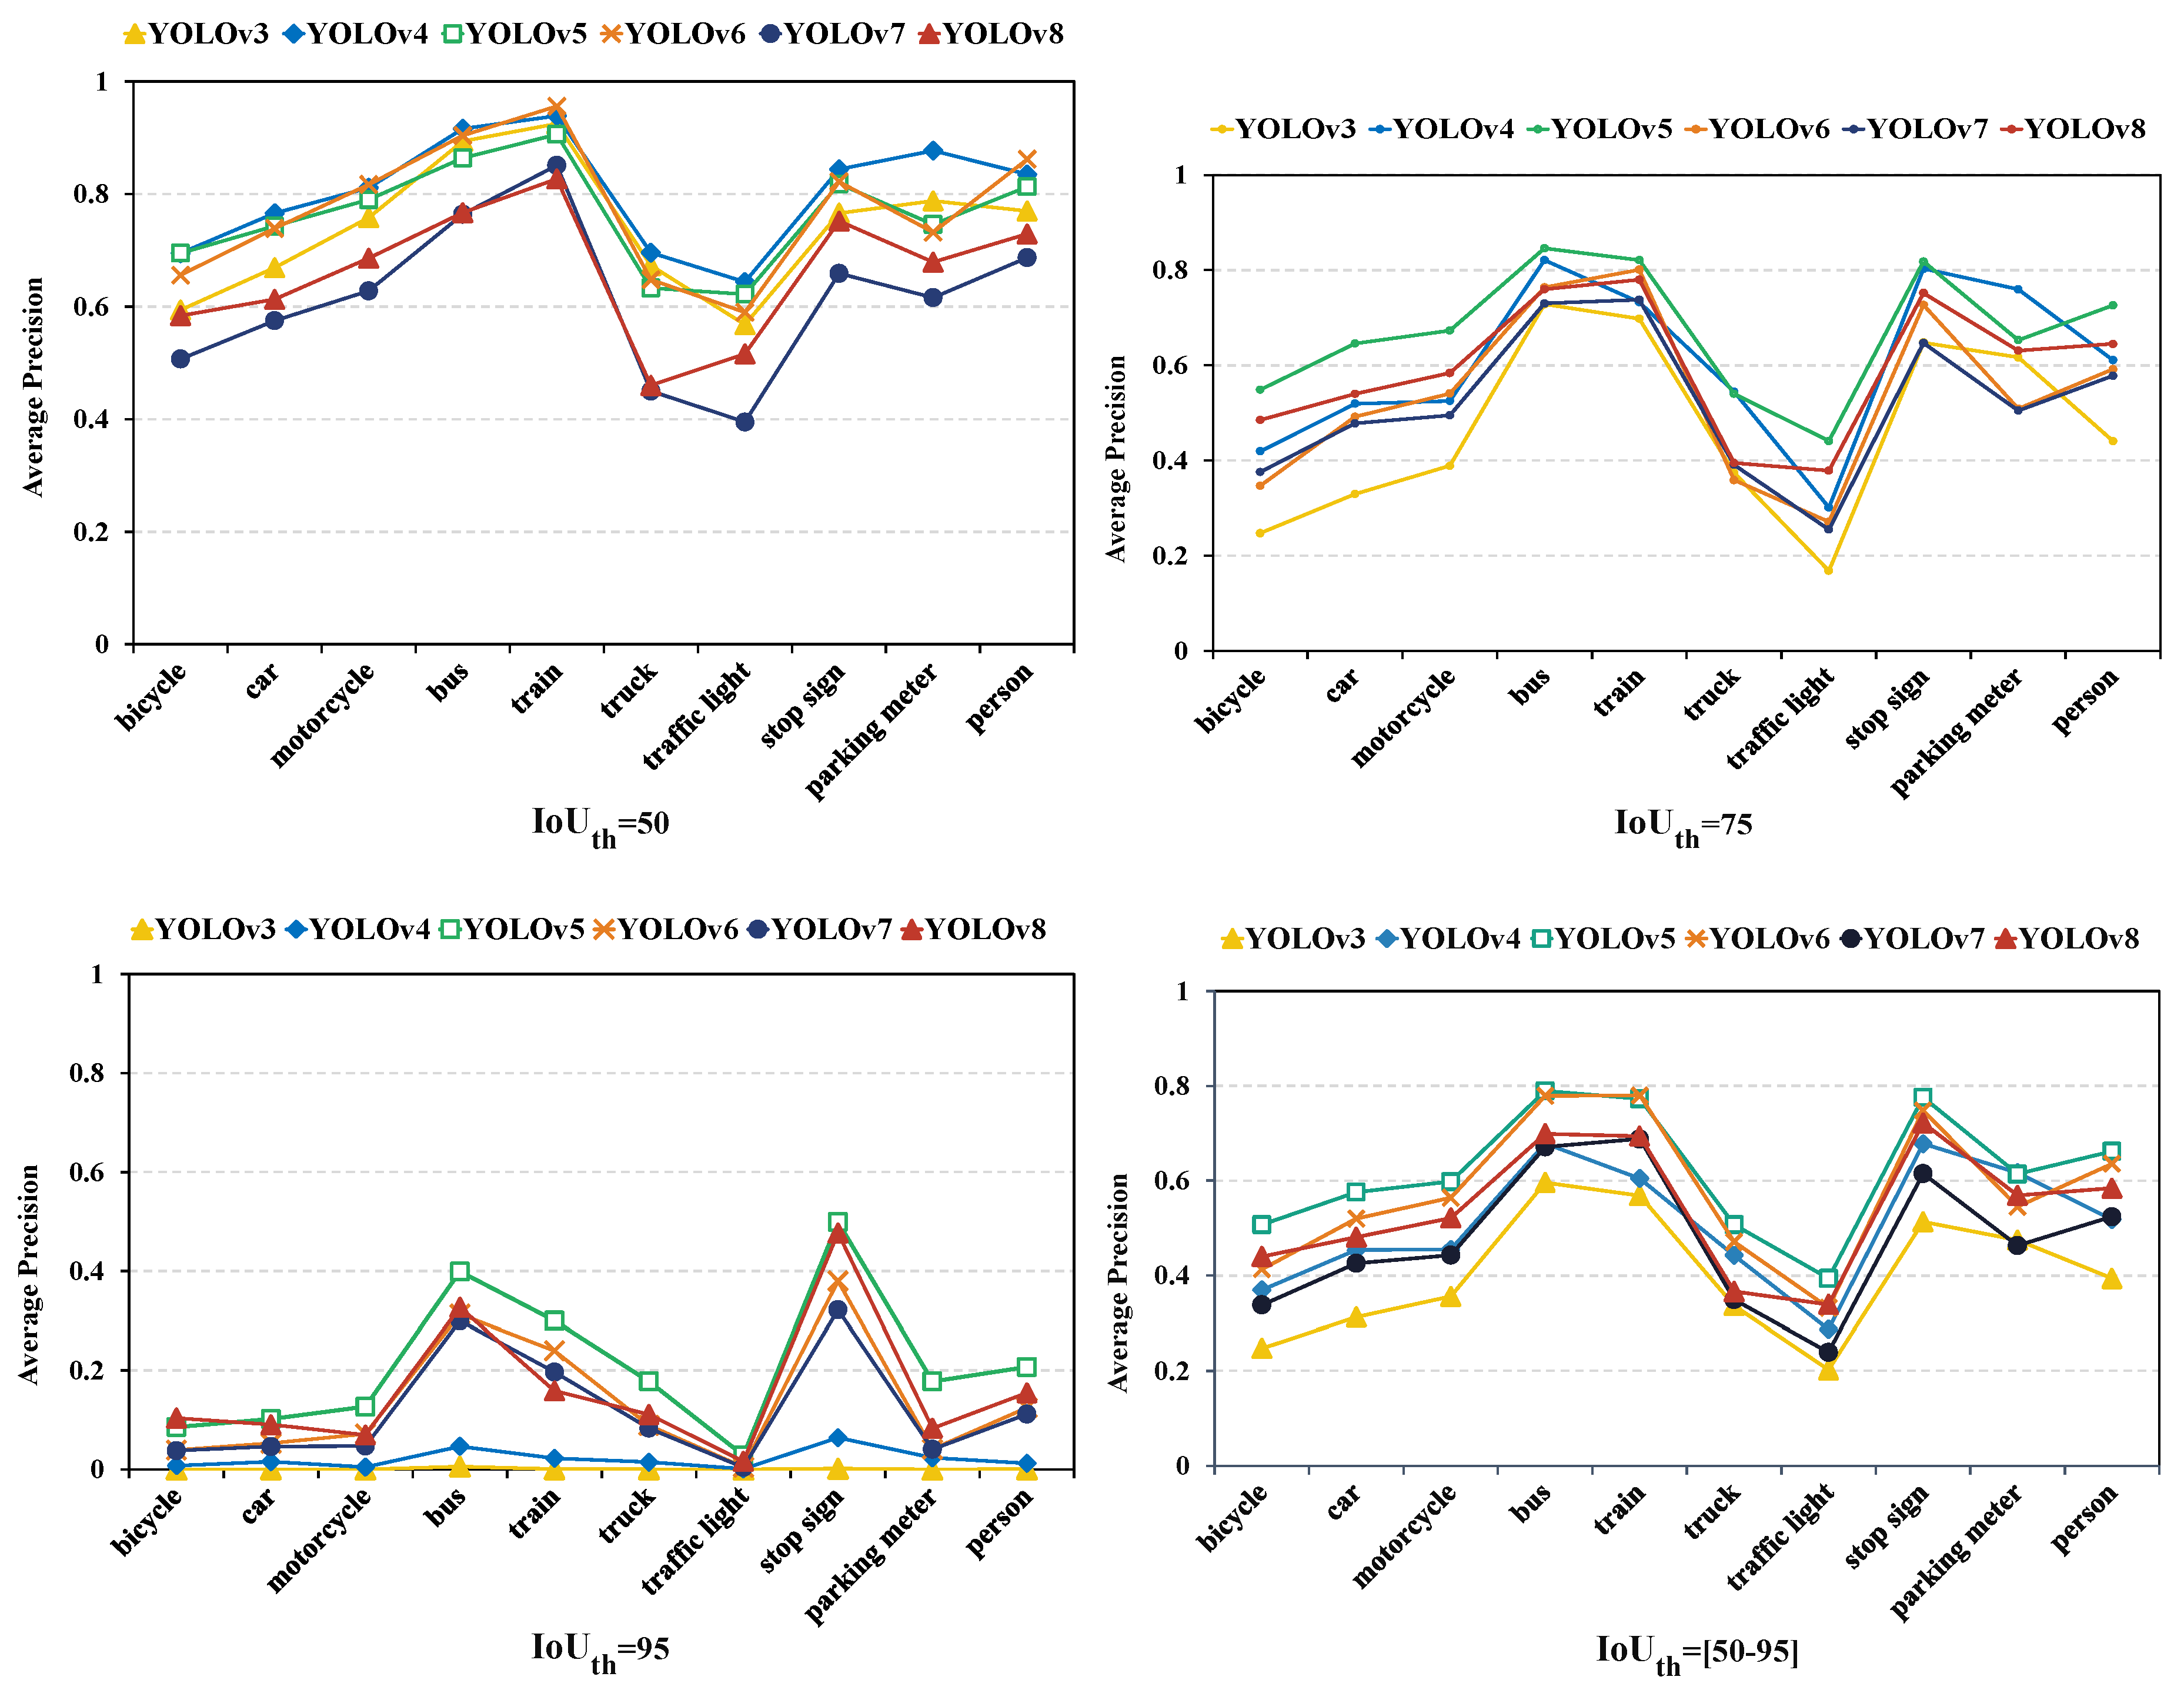
Figure 7.
AP of YOLO models on object classes in PASCAL VOC.
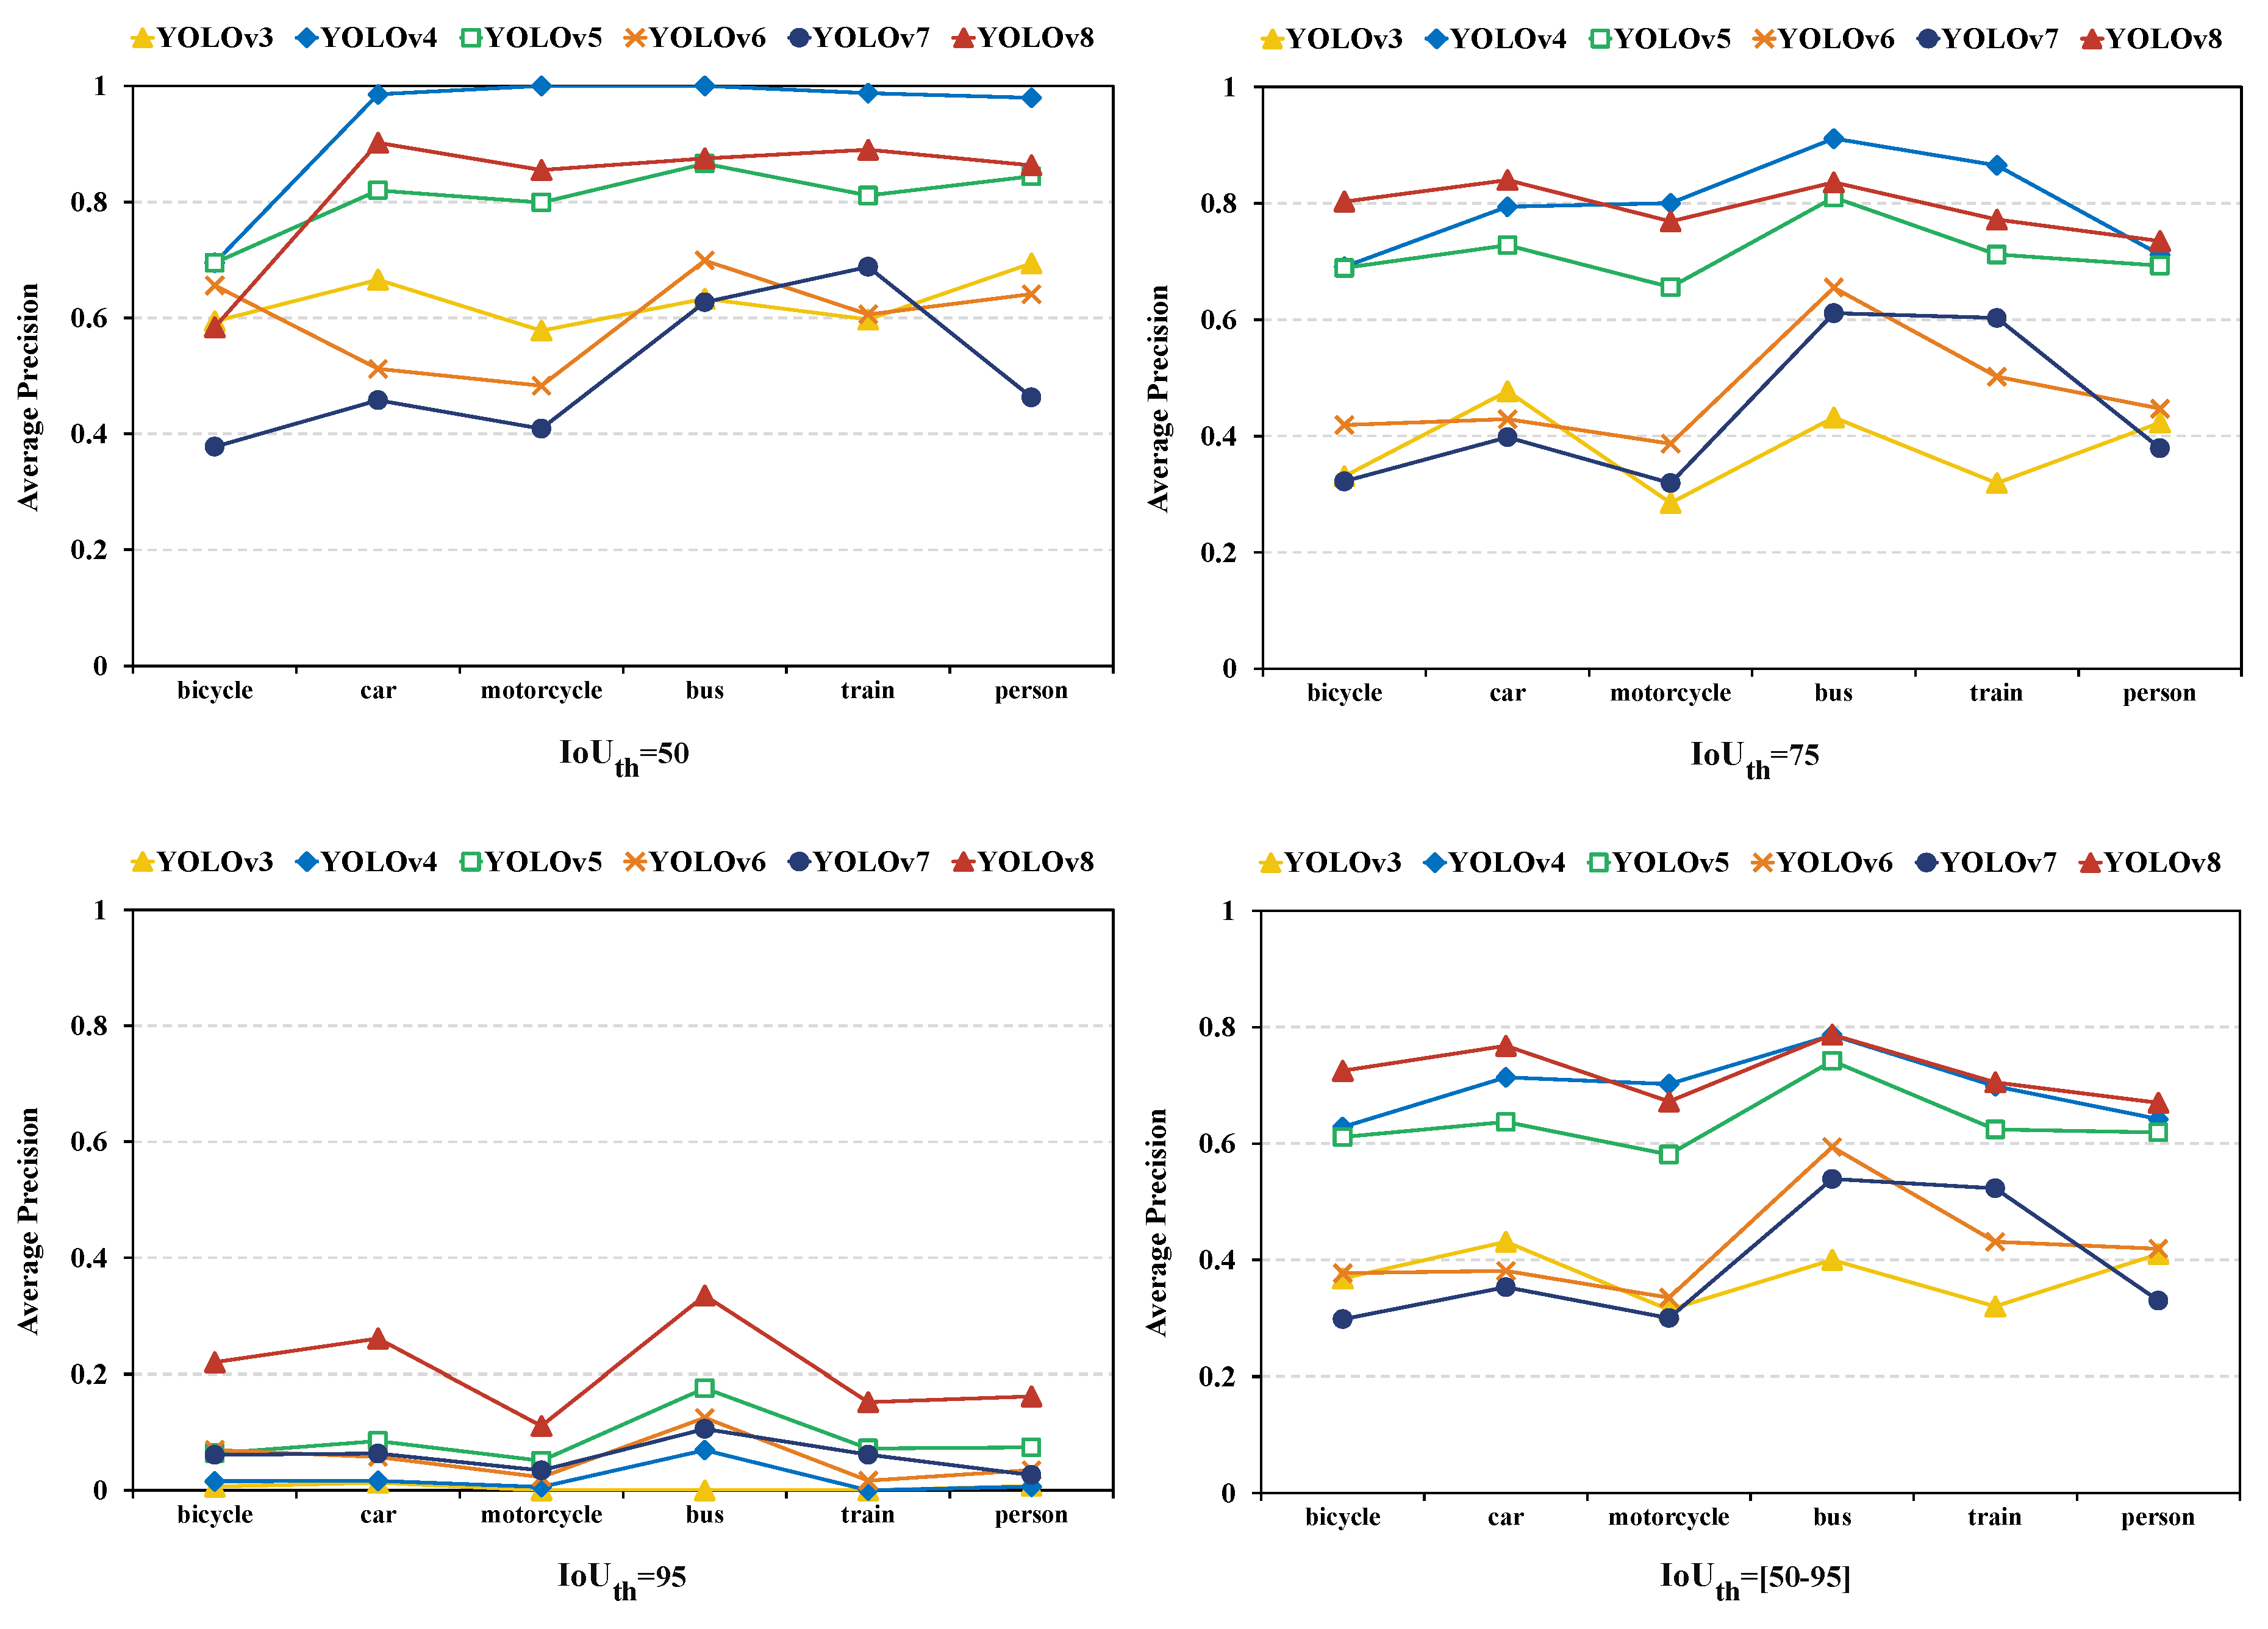

Table 1.
Features used in YOLO models (1).
| features | YOLOv3 | YOLOv4 | YOLOv5 |
| ine Backbone | Darknet53 | CSPDarknet53 | CSPDarknet53 |
| Neck | FPN | SPP, PANet | PANet |
| Anchor box | Scaled size, | Scaled size, | Auto-anchor |
| varied shape | varied shape, | ||
| K-Means generating | |||
| Activation function | ReLU | Leaky ReLU | Swish |
| Loss function | Localization loss, | Localization loss, | Localization loss, |
| confidence loss, | confidence loss, | confidence loss, | |
| class loss | class loss, | class loss, | |
| IoU loss, CIoU loss | IoU loss, CIoU loss | ||
| focal loss, GHM loss | |||
| Data augmentation | Mosaic | Mosaic | Mosaic, random shapes training |
Table 2.
Features used in YOLO models (2).
| features | YOLOv6 | YOLOv7 | YOLOv8 |
|---|---|---|---|
| Backbone | EfficientRep | E-ELAN | Modified CSPDarknet53 |
| Neck | Rep-PAN | CSPSPP, ELAN, E-ELAN | PAN |
| Anchor box | Anchor-free | Auto-anchor | Anchor-free |
| Activation function | ReLU | SiLU | Mish |
| Loss function | Varifocal loss, | Varifocal loss, | Class loss, |
| distribution | distribution | CIoU loss, | |
| focal loss | focal loss | distribution | |
| focal loss | |||
| Data augmentation | Mosaic | Mosaic, mixup | Mosaic |
Table 3.
Dataset description.
| COCO | PASCAL VOC | |||
|---|---|---|---|---|
| Training | Validation | Training | Validation | |
| Num. Image | - | 5000 | 11530 | 3422 |
| person, parking meter | ||||
| Classes | stop sign, traffic light, | bicycle, car, motorbike, | ||
| train, bus, motorcycle, car, | bus, person, train | |||
| truck, bicycle | ||||
| Num. Labels | [60,10777] | [142,7835] | ||
Table 4.
AP@50 of YOLO models on COCO.
| models | bicycle | car | motorcycle | bus | train | truck | traffic light | stop sign | parkingmeter | person | AP |
|---|---|---|---|---|---|---|---|---|---|---|---|
| YOLOv8 | 0.584 | 0.613 | 0.686 | 0.767 | 0.827 | 0.46 | 0.516 | 0.752 | 0.679 | 0.729 | 0.6613 |
| YOLOv7 | 0.507 | 0.575 | 0.628 | 0.764 | 0.851 | 0.45 | 0.395 | 0.659 | 0.616 | 0.687 | 0.6132 |
| YOLOv6 | 0.656 | 0.739 | 0.817 | 0.904 | 0.956 | 0.648 | 0.59 | 0.822 | 0.732 | 0.862 | 0.7726 |
| YOLOv5 | 0.695 | 0.743 | 0.79 | 0.864 | 0.906 | 0.633 | 0.622 | 0.818 | 0.746 | 0.813 | 0.763 |
| YOLOv4 | 0.695 | 0.766 | 0.811 | 0.916 | 0.939 | 0.696 | 0.644 | 0.844 | 0.877 | 0.835 | 0.8023 |
| YOLOv3 | 0.594 | 0.669 | 0.758 | 0.894 | 0.925 | 0.673 | 0.568 | 0.766 | 0.788 | 0.77 | 0.7405 |
Table 5.
AP@50-95 of YOLO models on COCO.
| models | bicycle | car | motorcycle | bus | train | truck | traffic light | stop sign | parking meter | person | AP |
|---|---|---|---|---|---|---|---|---|---|---|---|
| YOLOv8 | 0.44 | 0.481 | 0.521 | 0.699 | 0.694 | 0.366 | 0.339 | 0.722 | 0.569 | 0.584 | 0.5415 |
| YOLOv7 | 0.338 | 0.426 | 0.443 | 0.671 | 0.688 | 0.349 | 0.239 | 0.615 | 0.463 | 0.524 | 0.4756 |
| YOLOv6 | 0.413 | 0.52 | 0.564 | 0.779 | 0.78 | 0.471 | 0.332 | 0.748 | 0.545 | 0.636 | 0.5788 |
| YOLOv5 | 0.507 | 0.576 | 0.598 | 0.789 | 0.773 | 0.507 | 0.394 | 0.776 | 0.614 | 0.662 | 0.6196 |
| YOLOv4 | 0.36943 | 0.4536 | 0.4549 | 0.6782 | 0.6047 | 0.4425 | 0.2869 | 0.6777 | 0.6169 | 0.5179 | 0.4614 |
| YOLOv3 | 0.2472 | 0.3126 | 0.356 | 0.5961 | 0.5685 | 0.3361 | 0.202 | 0.5133 | 0.4747 | 0.3936 | 0.4 |
Table 6.
AP@50 of YOLO models on PASCAL VOC.
| models | bicycle | bus | car | motorbike | person | train | AP |
|---|---|---|---|---|---|---|---|
| YOLOv8 | 0.883 | 0.875 | 0.901 | 0.857 | 0.864 | 0.89 | 0.8783 |
| YOLOv7 | 0.378 | 0.627 | 0.458 | 0.409 | 0.463 | 0.688 | 0.5038 |
| YOLOv6 | 0.494 | 0.691 | 0.51 | 0.477 | 0.632 | 0.603 | 0.5678 |
| YOLOv5 | 0.801 | 0.866 | 0.82 | 0.799 | 0.844 | 0.811 | 0.8235 |
| YOLOv4 | 0.9737 | 1 | 0.9854 | 1 | 0.9795 | 0.9875 | 0.9877 |
| YOLOv3 | 0.62 | 0.637 | 0.644 | 0.607 | 0.731 | 0.602 | 0.6402 |
Table 7.
AP@50-95 of YOLO models on PASCAL VOC.
| models | bicycle | bus | car | motorbike | person | train | AP |
|---|---|---|---|---|---|---|---|
| YOLOv8 | 0.724 | 0.788 | 0.769 | 0.673 | 0.669 | 0.707 | 0.7217 |
| YOLOv7 | 0.298 | 0.539 | 0.353 | 0.3 | 0.33 | 0.523 | 0.3905 |
| YOLOv6 | 0.375 | 0.589 | 0.38 | 0.334 | 0.417 | 0.429 | 0.4207 |
| YOLOv5 | 0.611 | 0.742 | 0.637 | 0.581 | 0.619 | 0.624 | 0.6357 |
| YOLOv4 | 0.6283 | 0.7861 | 0.7136 | 0.7021 | 0.6418 | 0.6984 | 0.6951 |
| YOLOv3 | 0.292 | 0.34 | 0.347 | 0.261 | 0.364 | 0.258 | 0.3103 |
Disclaimer/Publisher’s Note: The statements, opinions and data contained in all publications are solely those of the individual author(s) and contributor(s) and not of MDPI and/or the editor(s). MDPI and/or the editor(s) disclaim responsibility for any injury to people or property resulting from any ideas, methods, instructions or products referred to in the content. |
© 2024 by the authors. Licensee MDPI, Basel, Switzerland. This article is an open access article distributed under the terms and conditions of the Creative Commons Attribution (CC BY) license (http://creativecommons.org/licenses/by/4.0/).
Copyright: This open access article is published under a Creative Commons CC BY 4.0 license, which permit the free download, distribution, and reuse, provided that the author and preprint are cited in any reuse.


