
Submitted:
12 September 2025
Posted:
12 September 2025
You are already at the latest version
Abstract
Reliable object detection is crucial for autonomous driving, particularly in highway construction zones where early hazard recognition ensures safety. This paper introduces an enhanced YOLOv8-based detection system incorporating a motion-temporal attention module (MTAM) to improve robustness under high-speed and dynamic conditions. The proposed architecture integrates a cross-stage partial (CSP) backbone, feature pyramid network-path aggregation network (FPN-PAN) feature fusion, and advanced loss functions to achieve high accuracy and temporal consistency. MTAM leverages temporal convolutions and attention mechanisms to capture motion cues, enabling effective detection of blurred or partially occluded objects. A custom dataset of 34,240 images, expanded through extensive data augmentation and 9-Mosaic transformations, is used for training. Experimental results demonstrate strong performance with mAP@0.5 of 90.77% and mAP@[0.5:0.95] of 70.20%. Real-world highway tests confirm recognition rates of 96% for construction vehicles, 92% for roadside warning signs, and 84% for flag bearers. The results validate the framework’s suitability for real-time deployment in intelligent transportation systems.
Keywords:
YOLOv8
; object detection
; motion-temporal attention
; construction vehicle
; warning sign
; data augmentation
1. Introduction
In recent years, the rapid progress of artificial intelligence has more concise in autonomous driving technologies [1,2]. The development of autonomous vehicle systems critically depends on their ability to detect, recognize, and classify objects, as these capabilities directly impact vehicle navigation and road safety [3]. With the continuous improvement of hardware computing power and the rapid development of deep learning technology, significant progress has been made in vehicle image-based object detection. These advancements are especially crucial in fields such as intelligent transportation systems, automated surveillance, and autonomous driving, where real-time performance and high detection accuracy are essential requirements. Among the most widely adopted approaches are advanced object detection frameworks based on deep learning, particularly the single shot multi-box detector (SSD) [4], the RetinaNet one-stage detector [5], and the you only look once (YOLO) series [6,7]. Although all of these models aim to detect objects, they differ substantially in terms of network architecture and the trade-offs they make between detection speed and accuracy.
The SSD architecture achieves real-time object detection by leveraging multi-scale feature maps along with a set of predefined bounding boxes of various shapes and sizes. It eliminates the need for a separate region proposal stage, enabling efficient inference suitable for embedded systems and mobile applications [8]. RetinaNet is a one-stage object detector that balances speed and accuracy by combining a backbone network with a Feature Pyramid Network for multi-scale feature extraction. It introduces focal loss to address class imbalance, enabling effective detection of both large and small objects in real-time applications [9]. The YOLO series, particularly YOLOv5 and YOLOv8, represents cutting-edge advancements in single-stage detection. YOLOv5 integrates cross stage partial (CSP) modules to enhance feature reuse and computational efficiency, while YOLOv8 introduces anchor-free prediction, decoupled classification-regression heads, and enhanced data augmentation strategies. These improvements allow YOLOv8 to deliver real-time inference with detection accuracy that rivals or even surpasses two-stage detectors in many scenarios [10].
The aforementioned models have been widely applied to vehicle-related tasks such as traffic sign recognition, vehicle counting, pedestrian and cyclist detection, and hazard identification in construction zones. To enhance robustness in real-world scenarios, modern training pipelines now frequently incorporate advanced data augmentation techniques (such as Mosaic, MixUp, and random affine transformations), improved loss functions (e.g.; CIoU and EIoU), and multi-scale feature fusion networks like feature pyramid network (FPN) and PANet [11]. With the ongoing evolution of hardware accelerators such as the NVIDIA RTX 40-series GPUs and Apple M1/M2 chips and the growing adoption of lightweight models like YOLO-NAS and MobileNetV3-based SSD, these detection systems are increasingly deployable on edge devices and embedded platforms. Recent studies continue to focus on enhancing accuracy in autonomous driving environments, reducing latency, supporting domain adaptation, and advancing few-shot learning techniques for recognizing previously unseen object classes [12,13].
In accordance with Taiwanese highway regulations, all construction vehicles operating on expressways for maintenance purposes must be equipped with construction warning signs and electronic flagpole systems [14]. These mandated safety measures serve to alert approaching drivers and reduce the risk of collisions in active construction zones. However, the robustness of detection models in highway environments—particularly under real-world, high-speed driving conditions—has rarely been addressed in existing YOLO-based applications. Such evaluations hold substantial practical significance for regional intelligent transportation systems (ITS) and directly reflect the stringent safety requirements of autonomous driving technologies. To address this gap, the present study proposes an enhanced real-time object detection framework based on the YOLOv8 deep learning architecture. The framework is specifically designed for the early identification of highway vehicles and signs、roadside warning signs, and electronic flag bearers with recognition achieved at a minimum visual confidence threshold from distances ≥50 m, in compliance with Taiwanese traffic safety response standards [15,16]. Within this context, early identification is defined as the reliable detection of roadway hazards (construction vehicles and signs) with a confidence level of at least 85% at distances that provide sufficient stopping or maneuvering time—namely, ≥25 m under low-speed conditions and ≥50 m under high-speed expressway conditions. This definition ensures that autonomous and semi-autonomous vehicles are able to initiate timely responses, thereby strengthening roadway safety in high-risk construction scenarios.
The proposed system leverages a combination of a CSP backbone, a FPN for multi-scale feature extraction, and advanced loss functions including CIoU and EIoU [17]. This architecture enables the model to deliver fast and accurate detection performance, even in adverse conditions such as partial occlusion, dynamic lighting variations, and high-speed motion scenarios. Specifically, the model is trained to detect and classify three high-priority object categories: construction vehicle and sign, roadside warning sign, and electric flag bearer. These objects serve as critical indicators of roadwork activity and are instrumental in helping both human drivers and intelligent transportation systems recognize hazardous zones in time to take appropriate action. By enhancing environmental perception, the proposed system contributes significantly to the operational safety of next-generation driving technologies on Taiwan’s expressways..
2. Neural Network Architecture
An improved object detection architecture based on YOLOv8, as illustrated in Figure 1, is specifically designed to meet the real-time and robustness requirements of highway and autonomous driving applications. This architecture retains the core backbone structure of the original YOLOv8 and introduces key enhancements to the feature fusion module (Neck) and the prediction output module. The objective is to enhance detection accuracy, ensure temporal consistency, and maintain adaptability in high-speed driving environments. The system architecture is organized into three principal components: the backbone, neck, and prediction output, which together form an efficient deep learning inference pipeline suitable for deployment on embedded platforms.
First, the backbone processes the input image, whose core is cross stage partial Darknet (CSPDarknet). This module is composed of multiple convolutional layers and CSP structures that enhance feature reuse and gradient flow while reducing computational cost. At this stage, the model focuses on extracting low- and mid-level visual features from the input, such as edges, textures, and structural patterns, which are essential for subsequent semantic understanding and object localization.
Subsequently, the extracted features are transferred to the neck module, where FPN and path aggregation network (PAN) are combined. This combination forms a top-down and bottom-up feature fusion framework that effectively integrates multi-resolution features to improve semantic richness and spatial accuracy. A major innovation introduced in the Neck is the motion-temporal attention module (MTAM). MTAM utilizes temporal convolutions or attention mechanisms to capture motion information across consecutive frames, enhancing the model’s ability to detect fast-moving or blurred objects—conditions commonly encountered in high-speed driving environments.
The prediction head is divided into two sub-modules: the decoupled head (DH) and the anchor-free detection mechanism. The DH module separates the classification and bounding box regression tasks, reducing interference between the two and improving overall prediction accuracy. The anchor-free mechanism eliminates the reliance on predefined anchor boxes. Instead, it directly regresses the center points and boundary distances of objects, using distance-based loss functions such as CIoU or EIoU. The proposed approach reduces training complexity while enhancing generalization across objects with varying geometries and scales. In this study, a smaller pre-trained version of YOLOv8 is used when the recognition accuracy meets the required threshold. The model is implemented using the PyTorch framework and achieves a detection speed of up to 92 frames per second (fps), making it well-suited for deployment on embedded devices. To address overfitting caused by limited training data, data augmentation techniques are employed. These methods expand the dataset by simulating variations in illumination, occlusion, scale, and background, thereby improving the model’s generalization and robustness in real-world scenarios.
2.1. Motion-Temporal Attention Module (MTAM)
MTAM is inserted in the Neck of the YOLOv8 architecture, parallel to or following the FPN-PAN module as shown in Figure 2. It processes a sequence of consecutive feature maps from multiple input frames and applies both temporal convolution and channel-spatial attention. The MTAM is designed to enhance the feature representation of objects exhibiting motion or temporal dependencies—especially useful for detecting dynamic elements like moving construction vehicle and sign.
It integrates both spatial attention and temporal attention to selectively emphasize informative regions over a sequence of frames. Let the input feature sequence be denoted by:
Temporal attention computes importance weights across time:
where ϕ is temporal projection function. The output is a weighted sum over time:
A spatial attention mask As ∈ RH×W can be computed as:
final attention-enhanced feature:
where σ is the sigmoid function, and ⊙ denotes element-wise multiplication.
The algorithm steps for the MTAM are designed to enhance object detection in high-speed driving environments by capturing temporal and motion cues from sequential frames. First, a sequence of consecutive input images is passed through the YOLOv8 backbone to extract deep feature maps for each frame. These feature maps are then stacked along the temporal dimension and processed using a temporal convolution layer, which captures motion patterns and dynamic changes across frames. Optionally, optical flow information can be incorporated to guide motion-aware feature alignment. Next, a combined channel and spatial attention mechanism—inspired by convolutional block attention module (CBAM) as shown in Figure 3—is applied to emphasize important features and suppress noise. Channel attention is computed by aggregating global information across spatial dimensions, while spatial attention focuses on the spatial regions that are most relevant for detection. The attention-weighted features are then fused with the original Neck outputs through residual connections, enabling the model to retain both motion-aware and spatially rich features. Moreover, residual fusion is implemented as a two-stage structure to progressively enhance feature integration. The first residual fusion combines dynamic features extracted from temporal convolution with static spatial features derived from the channel–spatial attention mechanism, ensuring effective collaboration of multi-source information. Subsequently, the second residual fusion further refines and strengthens the fused representation, preserving original feature information while mitigating gradient vanishing issues, thereby improving network stability. This final motion-temporal enhanced representation is forwarded to the anchor-free prediction head, enabling more robust detection of fast-moving or blurred objects such as construction vehicles and signs, flag bearers or roadside warning signs, which are common in real-world highway conditions.
This module can be integrated into the YOLOv8 detection pipeline before the detection head to enhance both temporal awareness and context-adaptive feature representation, thereby improving detection robustness in highway construction environments.
2.2. Loss Functions
Following model training, object detection performance must be evaluated. Intersection over Union (IoU), defined as the ratio of overlap area to union area between predicted and ground-truth boxes, is a common metric for assessing localization accuracy. Extended loss functions, including GIoU, CIoU, and EIoU, are defined as follows [22,23]:
Here, IoU = |A ∩ B| / |A ∪ B|, where |A ∩ B| denotes the overlap area between the predicted box A and the ground-truth box B, and |A ∪ B| represents their union area. |C| is the area of the smallest enclosing box. ρ(b, b) denotes the Euclidean distance between the center points of the predicted and ground-truth boxes, while c is the diagonal length of the smallest enclosing box. v quantifies the aspect ratio consistency, and α is a positive trade-off parameter. Finally, w, w* and h, h* correspond to the widths and heights of the predicted and ground-truth boxes, respectively.
To evaluate the performance of an object detection model, the IoU value is used to distinguish between true positive cases and false positive cases. A result is considered a true positive case when the IoU is greater than 0.5, indicating a good overlap between the predicted and ground truth bounding boxes. In contrast, an IoU value below 0.5 indicates a false positive detection. Additionally, key metrics such as recall and precision are defined as follows:
where TP are the true cases, FP are the false positive cases, and FN are the false negative cases.
Recall=TP/(TP+FN) ,
Precision=TP/(TP+FP)
Mean Average Precision (mAP) serves as a standard evaluation metric in object detection. Specifically, mAP@0.5 denotes the average precision when the IoU threshold is fixed at 0.5, while mAP@[0.5:0.95] represents the average precision calculated across thresholds from 0.5 to 0.95 in increments of 0.05. Together, these metrics provide a comprehensive assessment of detection performance across varying localization requirements.
To overcome the limitations of the basic IoU, particularly in cases where predicted and ground-truth boxes do not overlap, YOLOv8 incorporates several advanced loss functions. The Generalized IoU (GIoU) introduces the smallest enclosing box to penalize non-overlapping predictions, whereas the Complete IoU (CIoU) additionally accounts for center distance and aspect ratio to provide a more balanced optimization. The efficient IoU (EIoU) extends CIoU by improving computational efficiency, making it well suited for real-time and resource-constrained applications.
These advanced loss functions progressively address the limitations of basic IoU by considering additional aspects like non-overlapping boxes, center distance, and aspect ratio. This approach enhances the accuracy and robustness of object detection models, such as YOLOv8.
2.3. Improved YOLOv8 Loss Function with MTAM module
We propose an enhanced total loss function defined as:
Where LEIoU is the efficient IoU loss, Lcls is classification loss, Ldfl is distribution focal loss, LMTAM: temporal-attention-guided supervision, enforcing temporal consistency:
where ft is the attention-weighted feature from MTAM at frame t.
3. Experimental Results
Establishing a robust experimental environment is essential for the efficient development and deployment of deep learning models. It ensures an optimal balance between powerful hardware and a compatible, up-to-date software stack, enabling high-performance experimentation, model training, and algorithm testing with enhanced stability and reliability.
3.1. Experimental Environment Setup
All training experiments in this study were carried out on a server configured with an NVIDIA GeForce RTX 5080Ti graphics processing unit. The server operates on the Windows 11 operating system and is equipped with 32 GB of dedicated video memory. It supports CUDA and Tensor cores, making it highly effective for training convolutional and transformer-based neural networks. The development environment utilizes Python 3.11.13 and is based on the PyTorch 2.1.2 deep learning framework, integrated with the GPU acceleration tool CUDA 12.4. Detailed specifications are listed in Table 1.
The real-time image inference framework in this study adopts the NVIDIA Jetson Nano super embedded platform, which supports the TensorRT deep learning inference acceleration engine. This research is based on PyTorch and integrates a customized deep learning model combining YOLOv8, MTAM, and OpenCV. First, MTAM is embedded into the YOLOv8 architecture. This module is implemented in PyTorch using 3D convolution, channel-spatial attention mechanisms, and residual fusion layers. MTAM is inserted between the YOLOv8 backbone and detection head, and the forward function is modified to accept time-series image input with a shape of [B, C, T, H, W]. Next, OpenCV is used to capture real-time images from the dashcam, and each frame is resized, normalized, and converted into a PyTorch tensor. A sliding window of T consecutive frames is maintained to form the temporal input for the model. The trained YOLOv8 + MTAM weights are then loaded and executed on a CUDA-enabled GPU to achieve real-time performance. Detailed specifications of the platform are shown in Table 2.
3.2. Image Collection and Augmentation
Data augmentation (DA) is a strategy that enlarges the training dataset by applying transformations to existing samples. It reduces overfitting, alleviates problems associated with limited data, and enhances the performance of deep learning models. In Pytorch framework, image augmentations are typically performed using the Torchvision module. This module provides a set of commonly used transformations for image preprocessing and data augmentation, especially useful during training to improve model generalization.
The dataset comprises images of highway construction zones collected from multiple sources, including on-line platform, dashcam recordings from test vehicles and official surveillance footage provided by the national highway authority. All images were captured at a resolution of 1920×1080 (full HD) pixels to ensure sufficient visual detail for object detection. A total of 2,140 raw images were gathered, containing approximately 785 labeled construction vehicle and signs, 927 labeled roadside warning signs and 428 labeled electronic flag bearers. Annotation was performed using the computer vision annotation tool (CVAT), with all labels saved in YOLO format. Each image was manually annotated by two independent annotators, achieving an inter-annotator agreement rate of 92.4%, which ensures high labeling consistency and reliability.
To enhance dataset diversity and prevent overfitting, comprehensive image data augmentation was applied. The augmentation pipeline includes transformations such as contrast adjustment, hue and brightness variation, Gaussian blur, saturation shifts, affine distortion, image mixing, and grayscale conversion. Each original image underwent 1 to 3 types of augmentation, depending on content and class distribution. These augmentations were implemented using the Albumentations library in Python, with detailed parameters listed in Table 3. As a result of the augmentation process, the dataset expanded from 2,140 to a total of 34,240 images, significantly enriching training diversity while preserving semantic integrity. Representative examples of these augmentation effects are shown in Figure 4.
3.3. Image Data Classification and Labeling
Based on the attached YOLOv8 network architecture, image data classification and labeling follow a structured pipeline that begins with input images from a labeled dataset. These images are passed through the CSPDarknet backbone, which extracts deep spatial and semantic features using convolutional layers optimized with CSP connections. The extracted features are then enhanced and aggregated at multiple scales by the FPN-PAN neck module, incorporating C2f blocks to improve detection across varying object sizes. The output features are fed into a DH, where classification and bounding box regression are handled separately for improved performance. YOLOv8 adopts an anchor-free detection approach, predicting object center points and dimensions directly without relying on predefined anchor boxes. During training, each image is paired with a corresponding label file containing object class IDs and normalized bounding box coordinates. These labels guide the network in learning to associate visual features with specific object classes, enabling it to classify and localize multiple objects within an image effectively. Classify the images in the data set, and use labeling to mark the target as shown in Figure 5. The construction vehicle and sign is named construction, road warning sign is named warning sign, and the electric flag bearer is named person.
3.4. 9-Mosaic Parameters
Figure 6 illustrates YOLOv8's enhanced image augmentation strategy using 9-Mosaic transformation. By stitching nine different labeled traffic construction images into one training instance, the model benefits from greater visual variability and contextual diversity. This leads to improved training efficiency and object detection performance, especially in complex environments like road construction zones.
3.5. Data Analysis
The dataset is divided with a split ratio of 8:1:1, corresponding to 80% for the training set, 10% for the test set, and 10% for the validation set. The input image size is set to 640×640 pixels, and the batch size is configured to 24. The model is trained for 150 epochs using the stochastic gradient descent (SGD) optimizer with a learning rate of 0.01. The loss coefficients are set to the default values, incorporating the complete intersection over union (CIoU) loss function. The training and validation loss curves are presented in Figure 7 and Figure 8, respectively, illustrating the bounding box loss (box_loss), classification loss (cls_loss), and distribution focal loss (dfl_loss). As shown in Figure 7, all training loss components consistently decrease and gradually stabilize as the number of epochs increases, reflecting effective convergence of the model. In contrast, the validation loss curves in Figure 8 also exhibit an overall downward trend, although the val/box_loss displays moderate fluctuations throughout training. This behavior suggests that the model maintains strong generalization capability while continuously refining its localization and classification performance on unseen data. The progressive reduction of both training and validation losses confirms the robustness of the optimization strategy and indicates that the proposed framework achieves reliable performance across different evaluation metrics.
Figure 9 illustrates the variation of the precision and recall rates throughout the training process, while Figure 10 shows the changes in the mAP at two different IoU[0.5] and IoU[0.5:0.95]. These curves reflect the model's improving detection capability over time. For performance evaluation, the mAP index is adopted as a key accuracy metric. To assess the statistical robustness of model performance across different object classes, we apply k-fold cross-validation and compute evaluation metrics such as precision, recall, and mAP across all k folds [24,25]. For each class and metric, we first calculate the mean (μ) and standard deviation (σ) across k folds. The average is given by:
To report statistical confidence, we compute the 95% confidence interval (CI) for each metric using:
where tα/2,k−1 is the critical value from the t-distribution about 2.776 for k = 5. This interval provides a range in which the true mean performance is expected to lie with 95% confidence. The standard deviation (σ) and 95% confidence interval (CI) values calculated us. Table 4 presents the detailed evaluation outcomes following model training. The overall model achieves a precision rate of 91.12 ± 0.70%, recall rate of 89.30 ± 0.69%, mAP@0.5 of 90.09 ± 0.51%, and mAP@[0.5:0.95] of 71.13 ± 0.82%. Among the individual classes, the “construction” category performs best, with a precision of 97.91 ± 0.30% and recall of 95.10 ± 0.37%, reflecting its strong visual distinctiveness. Construction signs typically possess fixed positioning, regular geometric shapes (e.g.; rectangles), and high-contrast color schemes (e.g.; orange with black text), often covering large areas in the image. These characteristics provide robust spatial and semantic cues, enabling highly accurate detection with minimal false positives. The “warning sign” class also demonstrates relatively strong performance, with precision at 90.85 ± 0.60% and recall at 88.87 ± 0.36%. Warning signs generally feature clear triangular or diamond-shaped outlines, consistent pictograms, and standardized color patterns (such as yellow with black symbols), which help the model to capture them effectively. However, their smaller size compared to construction boards and occasional motion blur in roadside scenes may account for the slightly reduced precision and recall compared with the construction class. By contrast, the “person” class records the lowest performance, with precision at 84.60 ± 1.20% and mAP@[0.5:0.95] of 65.24 ± 1.15%. Detection in this class is hindered by smaller object scales, diverse human poses, partial occlusion, motion blur, and visual resemblance to background elements (e.g.; poles, shadows, or safety vests), all of which increase false positives and reduce detection reliability.
According to the simulation results for different loss functions presented in Table 5, CIoU achieves the highest precision rate at 91.80%, indicating that it is the most effective in minimizing false positives and generating confident, accurate predictions when detecting objects. GIoU follows closely at 91.12%, while EIoU lags behind with a precision rate of 88.10%, suggesting that it is more prone to false positive detections. On the other hand, when examining the recall rate, which measures the model’s ability to detect all relevant objects, EIoU stands out with a recall of 91.40%, outperforming GIoU (89.30%) and CIoU (88.20%). This indicates that EIoU is more effective at capturing true positives, although it may do so at the cost of lower precision.
Looking at mAP (IoU[0.5]), which reflects detection performance using a relatively lenient overlap criterion, CIoU again leads with 90.77%, followed by GIoU at 90.09%, while EIoU drops significantly to 83.80%. This suggests that CIoU contributes to more accurate localization of object boundaries, making it particularly suitable for applications where exact bounding box alignment is important. However, under the stricter and more comprehensive evaluation of mAP(IoU[0.5:0.95]), GIoU slightly outperforms the others, achieving 71.13%, while CIoU and EIoU yield similar but slightly lower results at 70.20% and 70.10%, respectively. This highlights GIoU’s balanced performance across varying levels of localization difficulty, indicating its robustness under diverse detection scenarios.
In summary, CIoU is the most effective for high-precision detection and accurate localization, making it preferable for safety-critical applications. EIoU emphasizes recall, offering advantages in scenarios where minimizing missed detections is critical. GIoU, while less specialized, achieves the most consistent balance across all evaluation metrics, particularly under the comprehensive mAP@[0.5:0.95] criterion, underscoring its robustness in diverse detection environments.
In the YOLOv8 architecture, the C2f module is integrated into the high-resolution detection head to enhance object detection accuracy by fusing feature maps across multiple scales. This multi-scale feature fusion allows the network to better capture both fine-grained and large contextual information, improving its ability to detect small or partially occluded objects. However, the inclusion of the C2f module also introduces additional computational complexity, which results in increased training time and higher model parameter count, potentially impacting deployment efficiency, particularly on resource-constrained edge devices.
After training and verifying the model, an experiment was conducted using real-world footage from engineering vehicles operating on Taiwan's expressways. As shown in Figure 11, the YOLOv8-based detection system demonstrates robust performance under challenging conditions, including occlusions and shadow interference caused by high-speed motion and harsh lighting environments. The model successfully identifies three key safety-related object categories—construction vehicle and sign, roadside warning sign and electronic flag bearer—with high accuracy. Specifically, the recognition rate for construction vehicle reaches 96%, while the recognition rate for roadside warning sign and electronic flag bearers are 92% and 84% respectively, indicating effective real-time detection in complex expressway scenarios.
As illustrated in Figure 12, the proposed detection system demonstrates consistent recognition performance under different driving conditions, including variations in speed, distance, and weather. In Figure 12(a), the construction vehicle and sign is moving at approximately 56 km/h on an expressway interchange. At this speed and an estimated detection distance of around 40 m, the system accurately identifies the construction vehicle and warning sign with confidence levels of 96% and 92%, respectively. In contrast, Figure 12(b) presents a scenario where the host vehicle is traveling at 102 km/h on the expressway during rainy weather, with the distance to the construction vehicle ahead increase to about 50 m. Even under these more challenging conditions, the detection system achieves confidence levels of 92% for the construction vehicle and 90% for the caution sign, confirming its robustness in high-speed and low-visibility environments.
These experimental findings highlight the system’s capacity to maintain reliable detection accuracy as the vehicle approaches the target, ensuring that autonomous driving platforms can respond promptly and effectively. Such capability is essential for collision avoidance and safe navigation around stationary or slow-moving obstacles, particularly in high-speed roadway scenarios where early recognition and timely decision-making are critical.
4. Conclusions
This study proposes an enhanced object detection system based on the YOLOv8 deep learning framework integrated with a motion-temporal attention (MTA) algorithm, designed to identify early highway construction vehicles and signs, roadside warning signs, and electronic flag bearers, which are crucial for the safety of autonomous and semi-autonomous driving. By incorporating a cross stage partial (CSP) backbone, feature pyramid networks (FPN), the MTA module, and advanced loss functions such as CIoU and EIoU, the model demonstrates outstanding detection performance, achieving a mAP (IoU [0.5]) of 90.77% and a mAP (IoU [0.5:0.95]) of 70.20%. The system employs a robust training pipeline that includes extensive data augmentation and 9-Mosaic transformation, enabling resilience to occlusions, lighting variations, and high-speed motion. Real-world highway tests show that under challenging conditions, the system attains recognition rates of 90% for construction vehicles and signs, 92% for roadside warning signs, and 84% for electronic flag bearers. The proposed approach significantly enhances the ability of autonomous vehicles to detect hazards at highway speeds, thereby improving road safety and providing valuable early warnings for both drivers and construction crews.
Author Contributions
Data acquisition, W.-P., C.-C. and E.-C.; data processing, C.-C. and E.-C.; methodology, W.-P. , C-H and C.-C.; writing—original draft preparation, C.-C. and E.-C; writing—review and editing, W.-P., C-H and C.-C.; project administration, W.-P. All authors have read and agreed to the published version of the manuscript.
Funding
This research was funded by the Project of Chang Gung University (Grant No. BMRP 740).
References
- Zhang, Y.; Li, H.; Wang, Z.; Liu, Q. A survey on AI-driven autonomous driving: trends, challenges, and future directions. IEEE Trans. on Intell. Trans. Syst. 2024, 25, 1875–1891. [Google Scholar]
- Sakure, A.; Bachhav, K.; Bitne, C.; Chopade, V.; Dhavade, V.; Sangule, U. Generative AI solution for lane departure, pedestrian detection and paving of autonomous vehicle. 4th Intl. Conf. on Comput. Auto. and Knowledge Manag. 2023; 1–6. [Google Scholar]
- Chen, X.; Wu, F.; Yang, R. Recent advances in perception and decision-making for autonomous vehicles: from deep learning to real-world deployment. IEEE Intell. Syst. 2023, 38, 46–57. [Google Scholar]
- Nguyen, T.; Huynh, D.; Tran, Q. Lightweight SSD for real-time object detection on embedded automotive systems. Sensors 2023, 23, 6329. [Google Scholar]
- Khadidos, A.O.; Yafoz, A. Leveraging RetinaNet-based object detection model for assisting visually impaired individuals with metaheuristic optimization algorithm. Sci. Reports (Nature) 2025, 15, 15979–15998. [Google Scholar] [CrossRef]
- Ali, A.; Zhang, T.; Khan, M. (2023). YOLOv8 for real-time road object detection in autonomous driving systems. IEEE Access, 2023, 11, 121230–121242. [Google Scholar]
- Ayachi, R.; Afif, M.; Said, Y. Traffic sign recognition based on scaled convolutional neural network for advanced driver assistance system. 4th Intl. Conf. Image Proc.; Appl. and Syst. (IPAS), 2022; 149–154. [Google Scholar]
- Wang, K.; Lin, Y.; Zhou, Q. A lightweight SSD-based object detection model for real-time embed applications. J. of Real-Time Image Proc. 2023, 20, 945–960. [Google Scholar]
- Carranza-García, M.; Torres-Mateo, J.; Lara-Benítez, P.; García-Gutiérrez, J. On the performance of one-stage and two-stage object detectors in autonomous vehicles using camera data. Remote Sens. 2021, 13, 89–112. [Google Scholar] [CrossRef]
- Ahmed, S.; Raza, A. YOLOv8: redefining anchor-free real-time object detection. IEEE Access, 2024, 12, 65432–65445. [Google Scholar]
- Hu, S.; Luo, X. Advanced training techniques in YOLOv8: mosaic, mixup, and beyond. IEEE Access, 2023, 11, 117842–117855. [Google Scholar]
- Lin, D.; Zhang, F.; Li, Y. Domain adaptive object detection for real-time autonomous driving applications. IEEE Trans. Intell. Transport. Syst.; 2024, 25, 2981–2993. [Google Scholar]
- Baek, J.-W.; Chung, K. Swin transformer-based object detection model using explainable meta-learning mining. Applied Sci. 2023, 3213–3227. [Google Scholar] [CrossRef]
- Tseng, Y.; Chen, M.; Lee, T. Regulatory requirements for construction safety on Taiwanese expressways and their integration with smart vehicle systems. J. Transport. Saf. & Security, 2024, 16, 145–160. [Google Scholar]
- Lin, H.; Wang, J.; Hsu, C. YOLOv8-based real-time detection of highway work zone hazards for autonomous vehicles. IEEE Trans. on Intell. Transport. Syst. 2024, 25, 4021–4033. [Google Scholar]
- Zhang, T.; Liu, S. Advanced YOLOv8 architecture with CIoU/EIoU loss for robust object detection. IEEE Access 2023, 11, 125321–125335. [Google Scholar]
- Wang, C.-C.; Lu, Y.-S.; Lin, W.-P. An modified YOLOv5 Algorithm to improved image identification for autonomous driving. In Congress in Comp. Sci.; Comp. Eng. And appl. Comput.; 2023; pp. 2722–2724. [Google Scholar]
- Huang, Y.; Chen, Y. Survey of state-of-art autonomous driving technologies with deep learning. IEEE International Conference on Software Quality, Reliability and Security Companion 2023, 221–228. [Google Scholar]
- Ning, J.; Wang, J. Automatic driving scene target detection algorithm based on improved YOLOv5 network. IEEE Intl. Conf. on Comput. Network, Elect. and Auto. 2022; 218–222. [Google Scholar]
- Tampuu, A.; Aidla, R.; Gent, J.A.V.; Matiisen, T. LiDAR as camera for end-to-end driving. Sensors 2023, 23, 2845. [Google Scholar] [CrossRef]
- Olimov, B.; Kim, J.; Paul, A.; Subramanian, B. An efficient deep convolutional neural net-work for semantic segmentation. 8th Intl. Conf. on Orange Technol. 2020, 1–9. [Google Scholar]
- Zhang, Z.; Lin, P.; Ma, S.; Xu, T. An improved Yolov5s algorithm for emotion detection. 5th Intl. Conf. on Patt. Recog. and Artifi. Intell. 2022, 1002–1006. [Google Scholar]
- Sophia, S.; Joeffred, G.J. Human behavior and abnormality detection using YOLO and conv2D net. Intl. Conf. on Inventive Comput. Technol. 2024, 70–75. [Google Scholar]
- Ragab, M.G.; Abdulkadir, S.J.; Muneer, a.; Alqushaibi, A.; Sumiea, E.H.; Qureshi, R. ; A comprehensive systematic review of YOLO for medical object detection (2018 to 2023). IEEE Access 2024, 12, 57815–57836. [Google Scholar] [CrossRef]
- Kee, E.; Chong, J.J.; Choong, Z.J.; Lau, M. A Comparative analysis of cross-validation techniques for a smart and lean pick-and-place solution with deep learning. Electronics 2023, 12, 2371–2386. [Google Scholar] [CrossRef]
Figure 1.
Modified YOLOv8 network architecture.
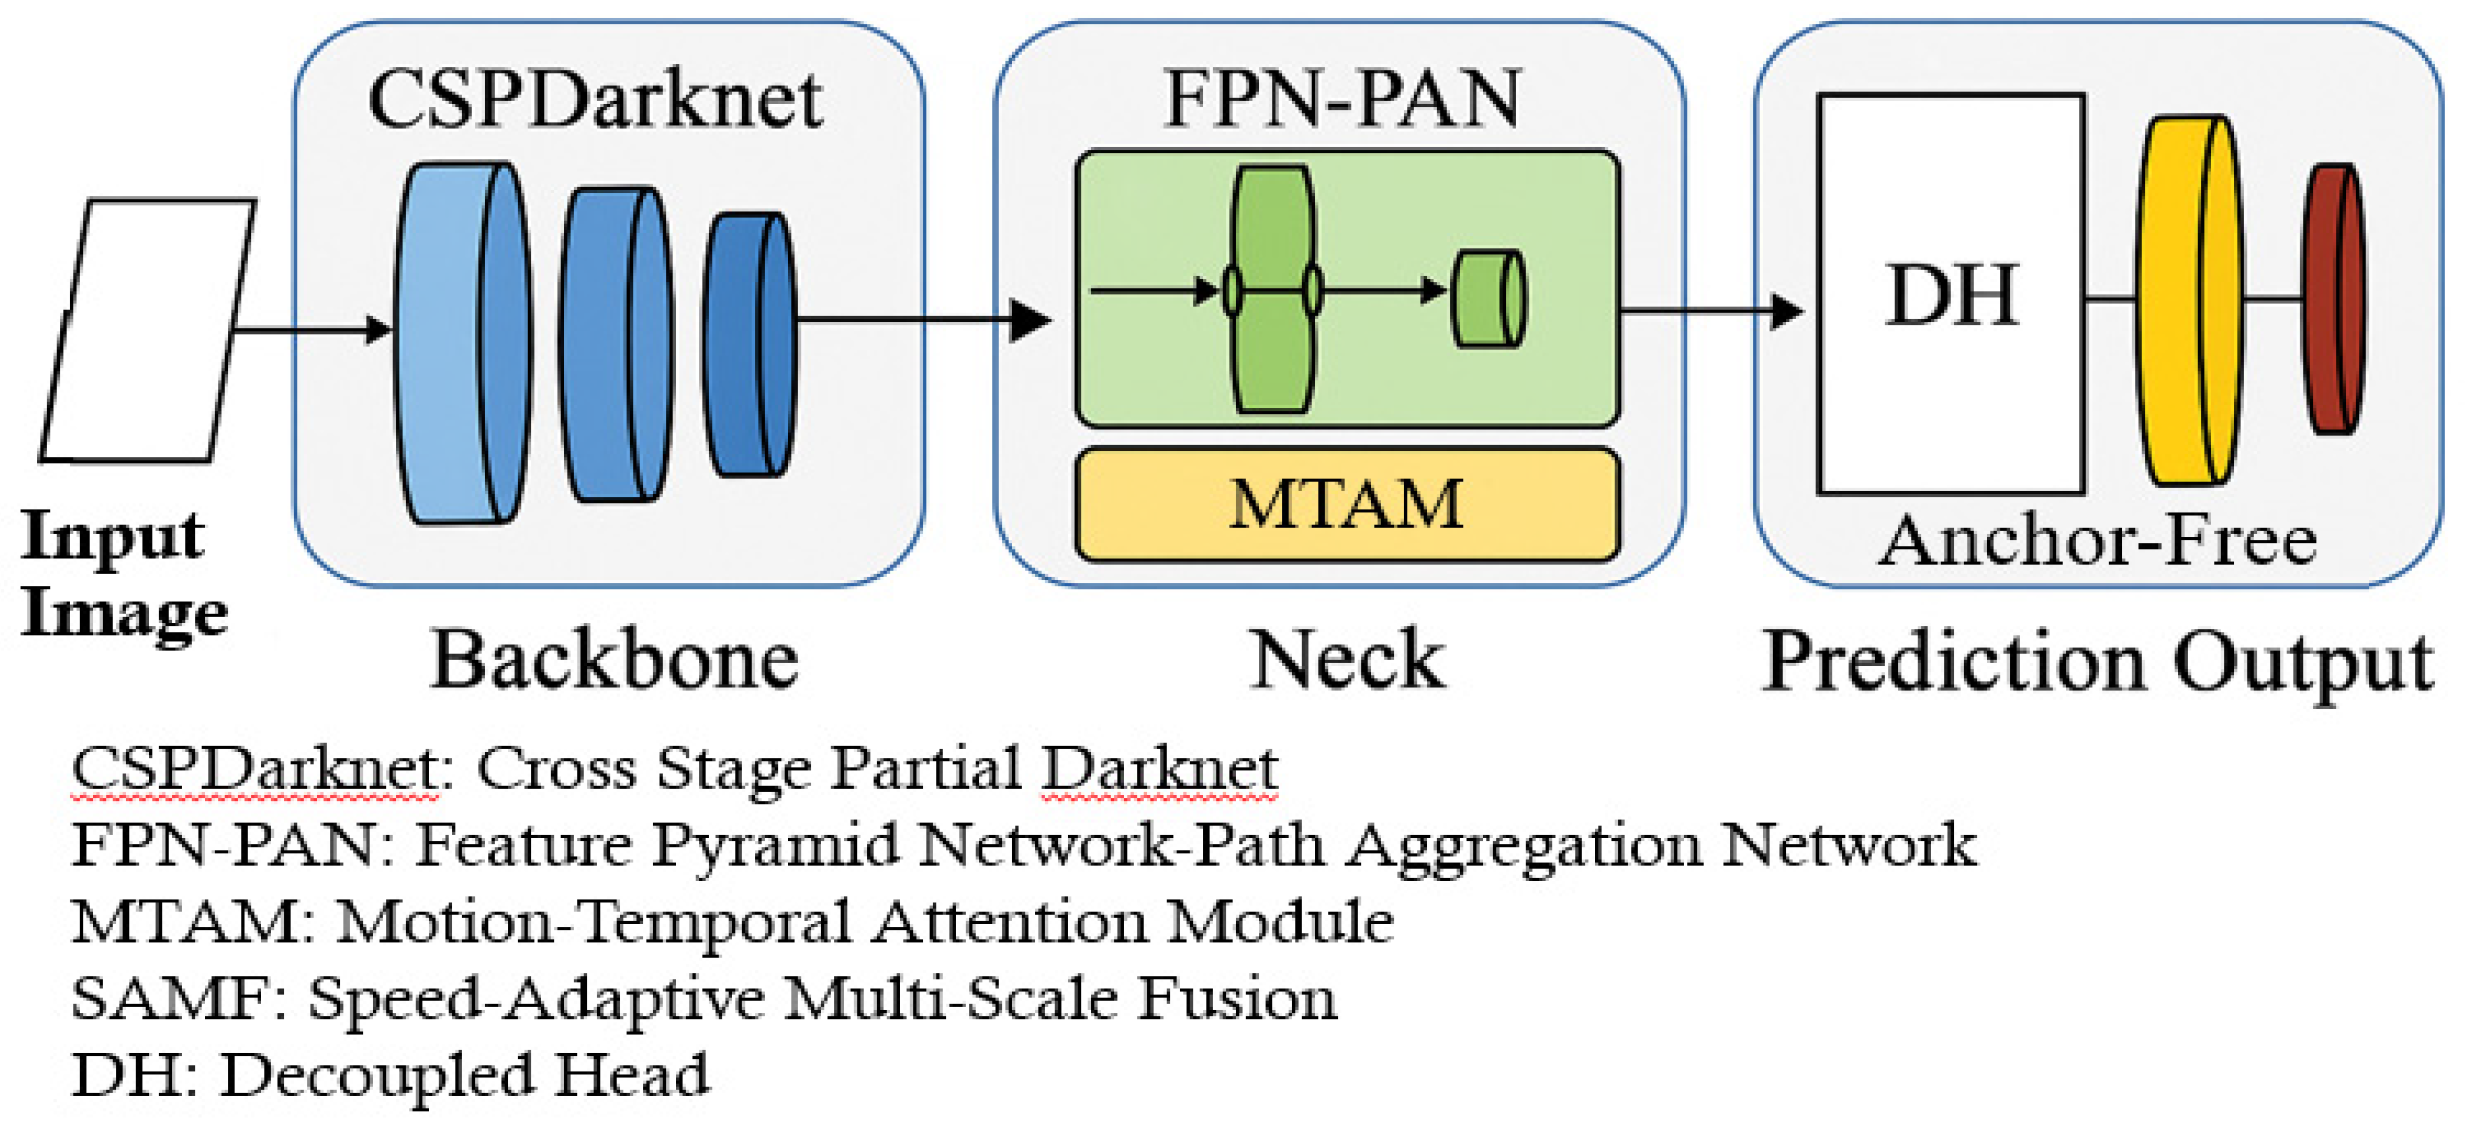
Figure 2.
The structure of motion-temporal attention module (MTAM).
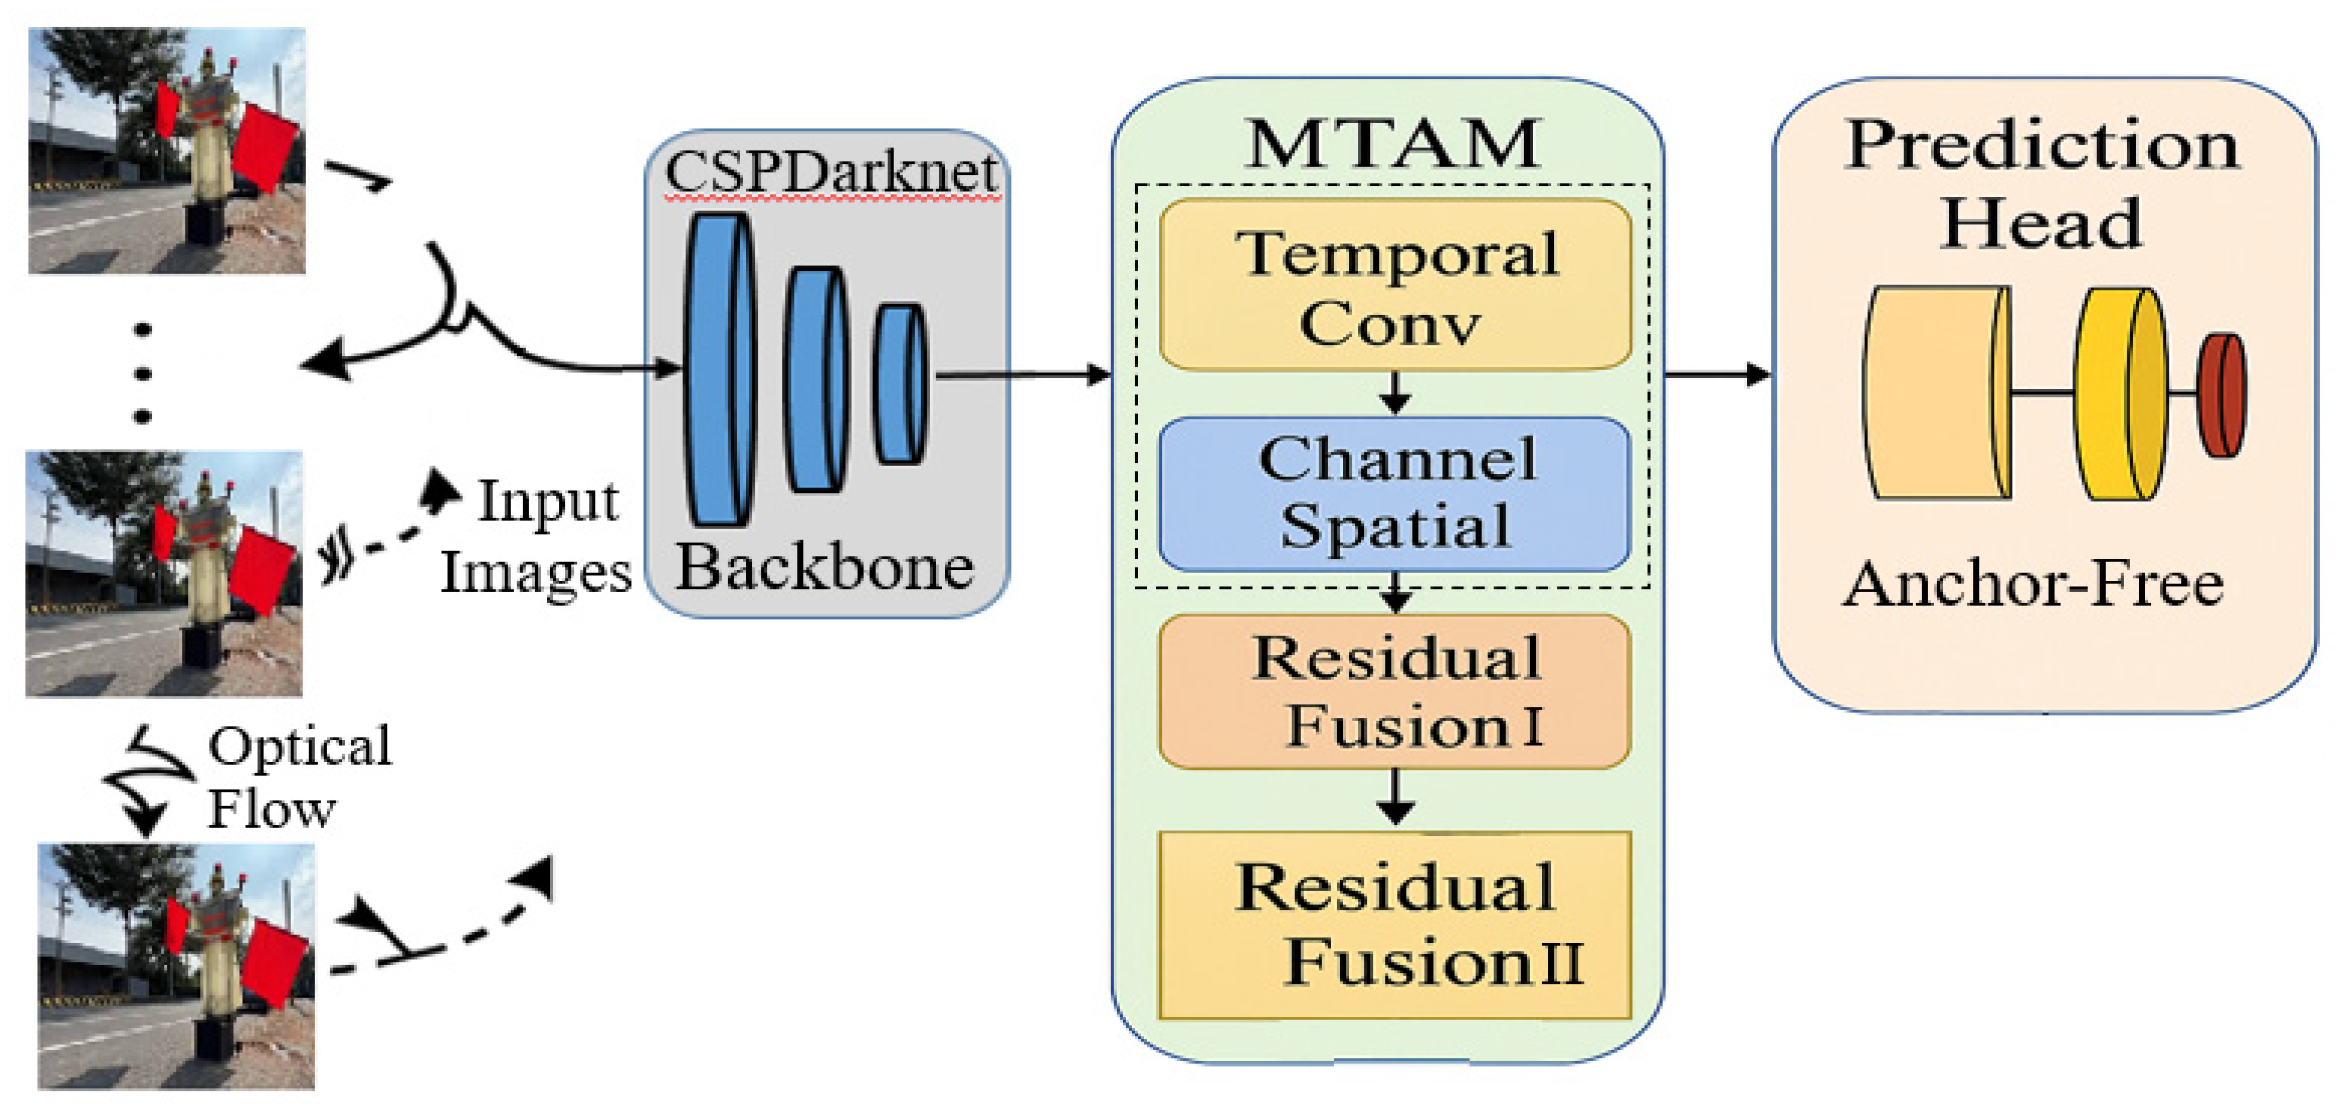
Figure 3.
The structure of convolutional block attention module (CBAM).
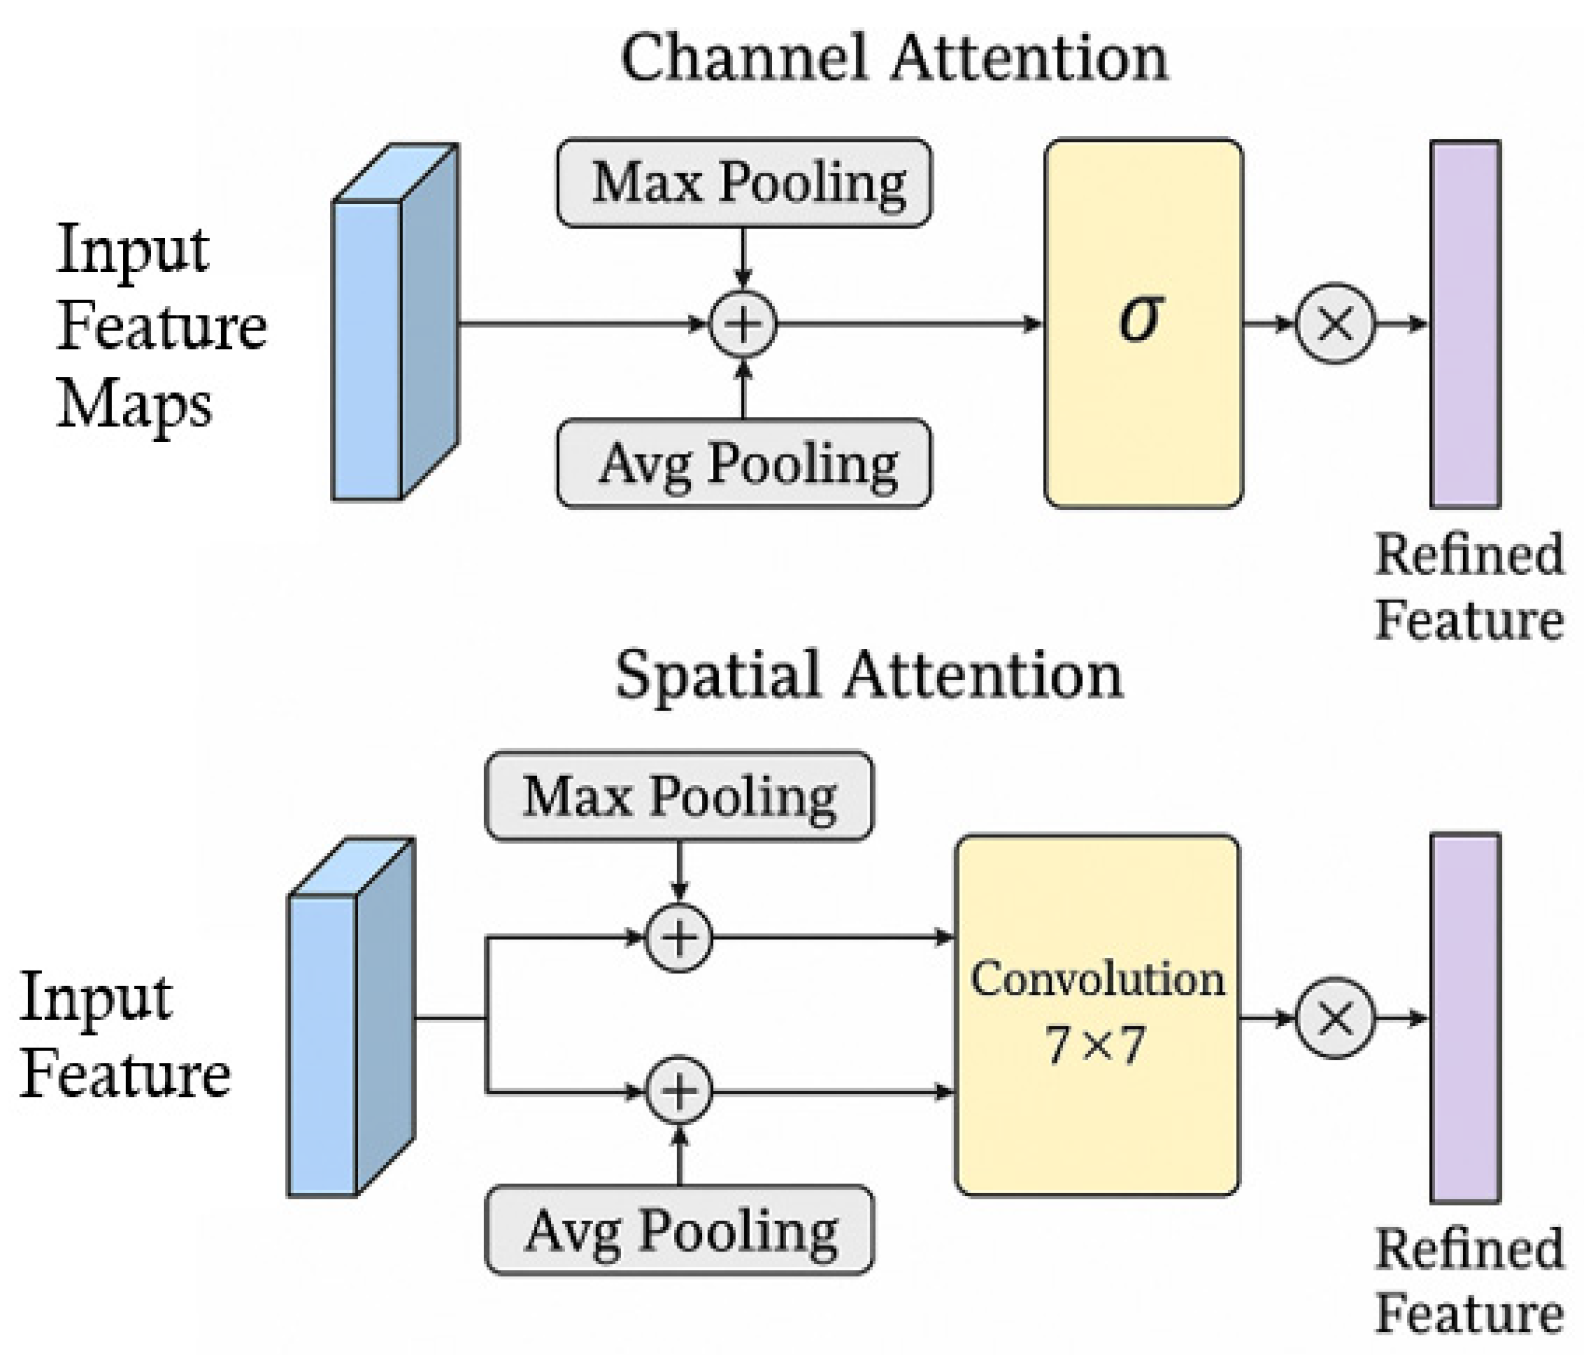
Figure 4.
Different processing for image data augmentations.
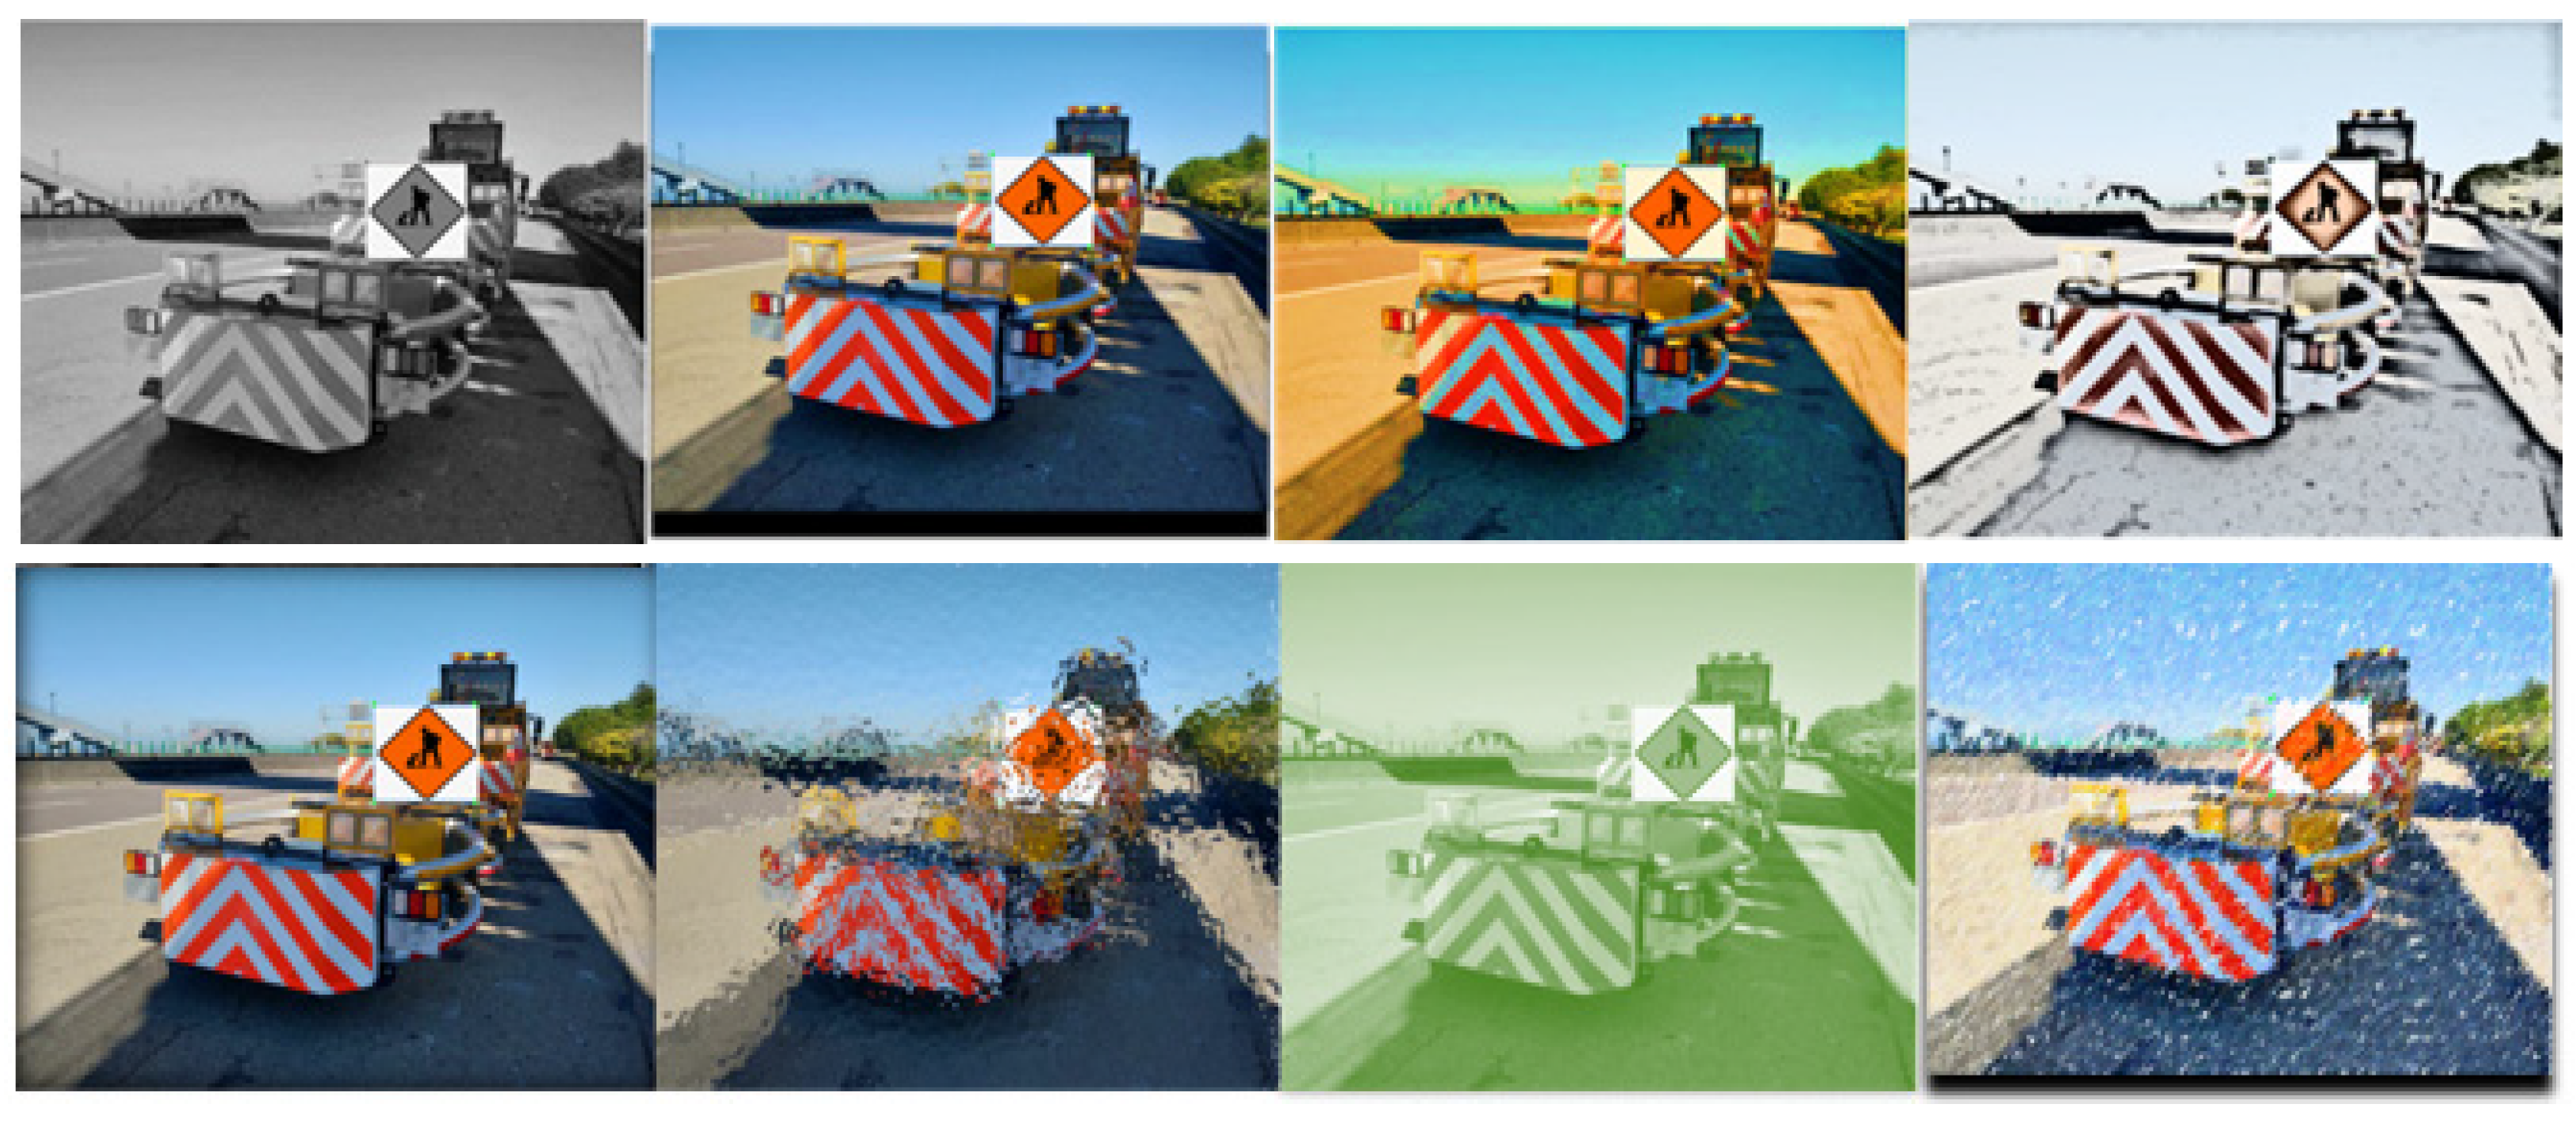
Figure 5.
Traffic sign dataset labeling interface: (a) Construction vehicle and sign; (b) Road warning Sign; (c) Electric flag bearer.
Figure 5.
Traffic sign dataset labeling interface: (a) Construction vehicle and sign; (b) Road warning Sign; (c) Electric flag bearer.
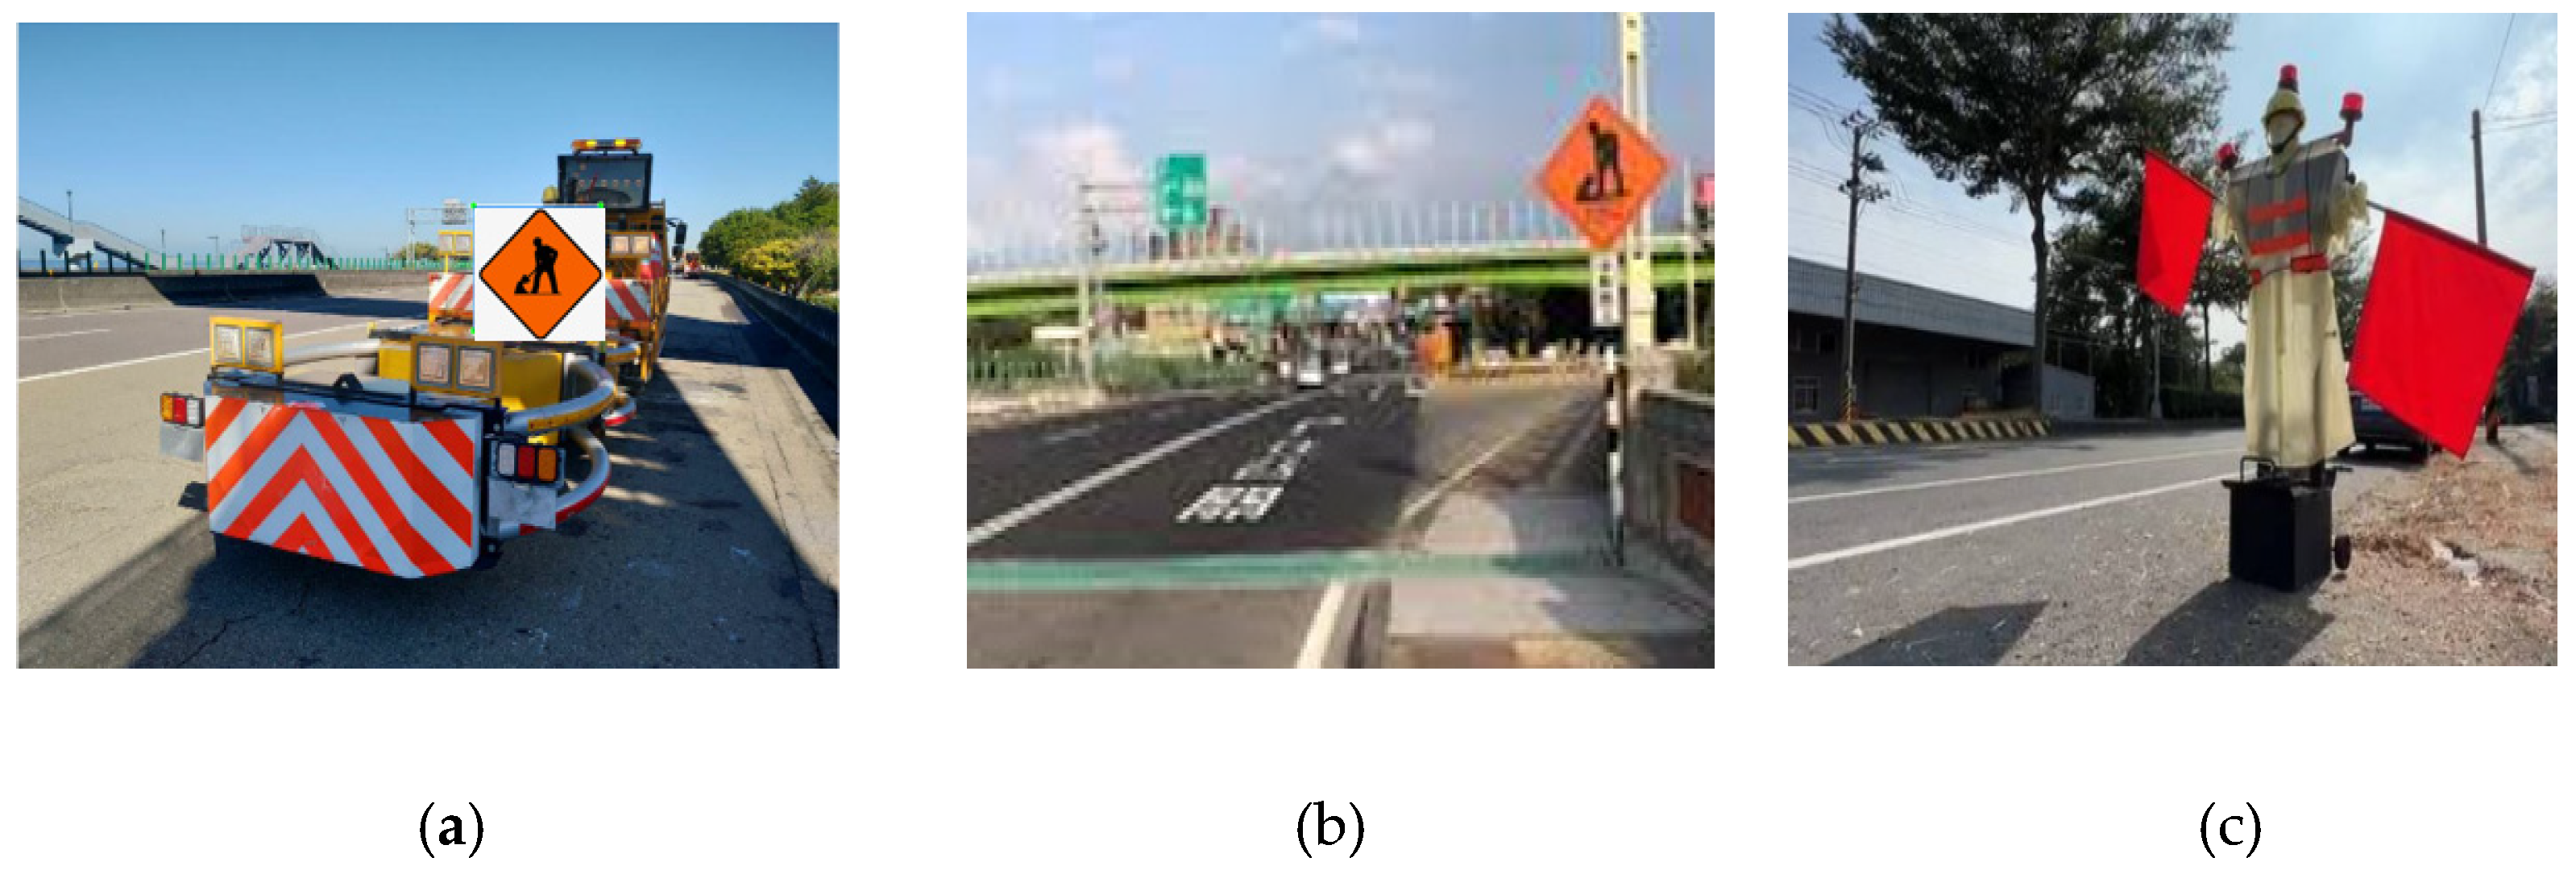
Figure 6.
9-Mosaic transformation.
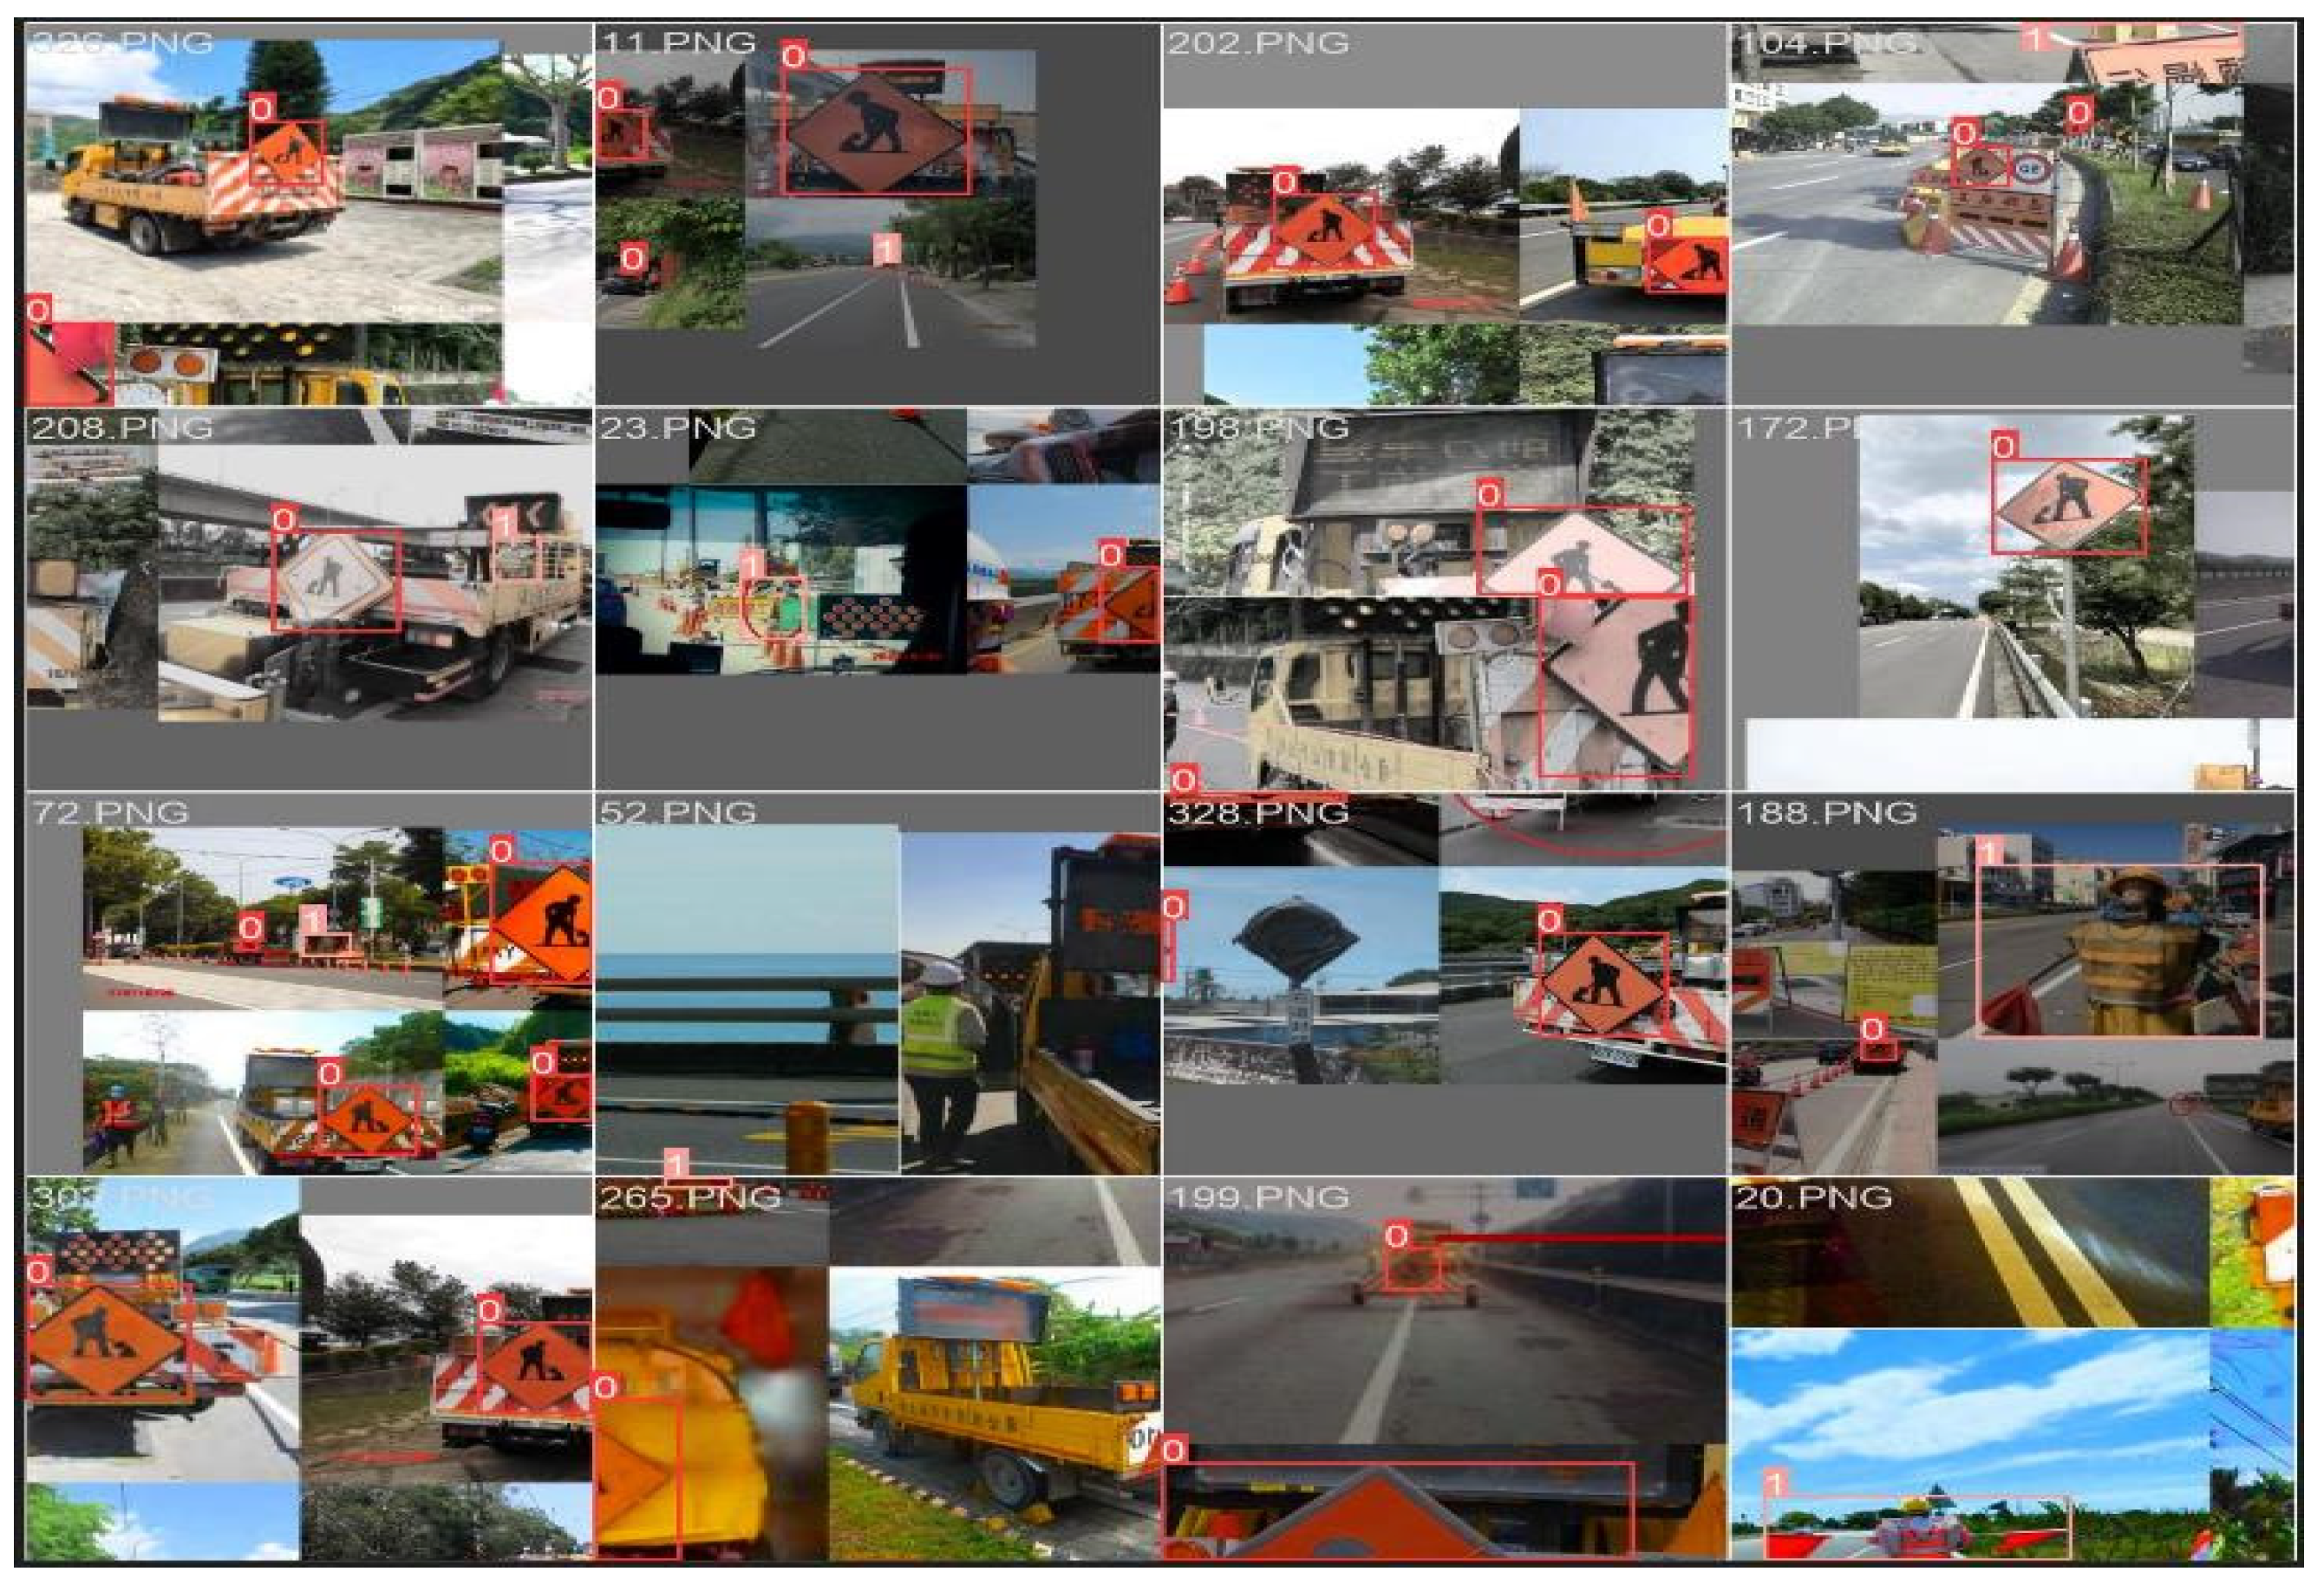
Figure 7.
Training loss curves of bounding box, classification, and distribution focal on image Dataset.
Figure 7.
Training loss curves of bounding box, classification, and distribution focal on image Dataset.
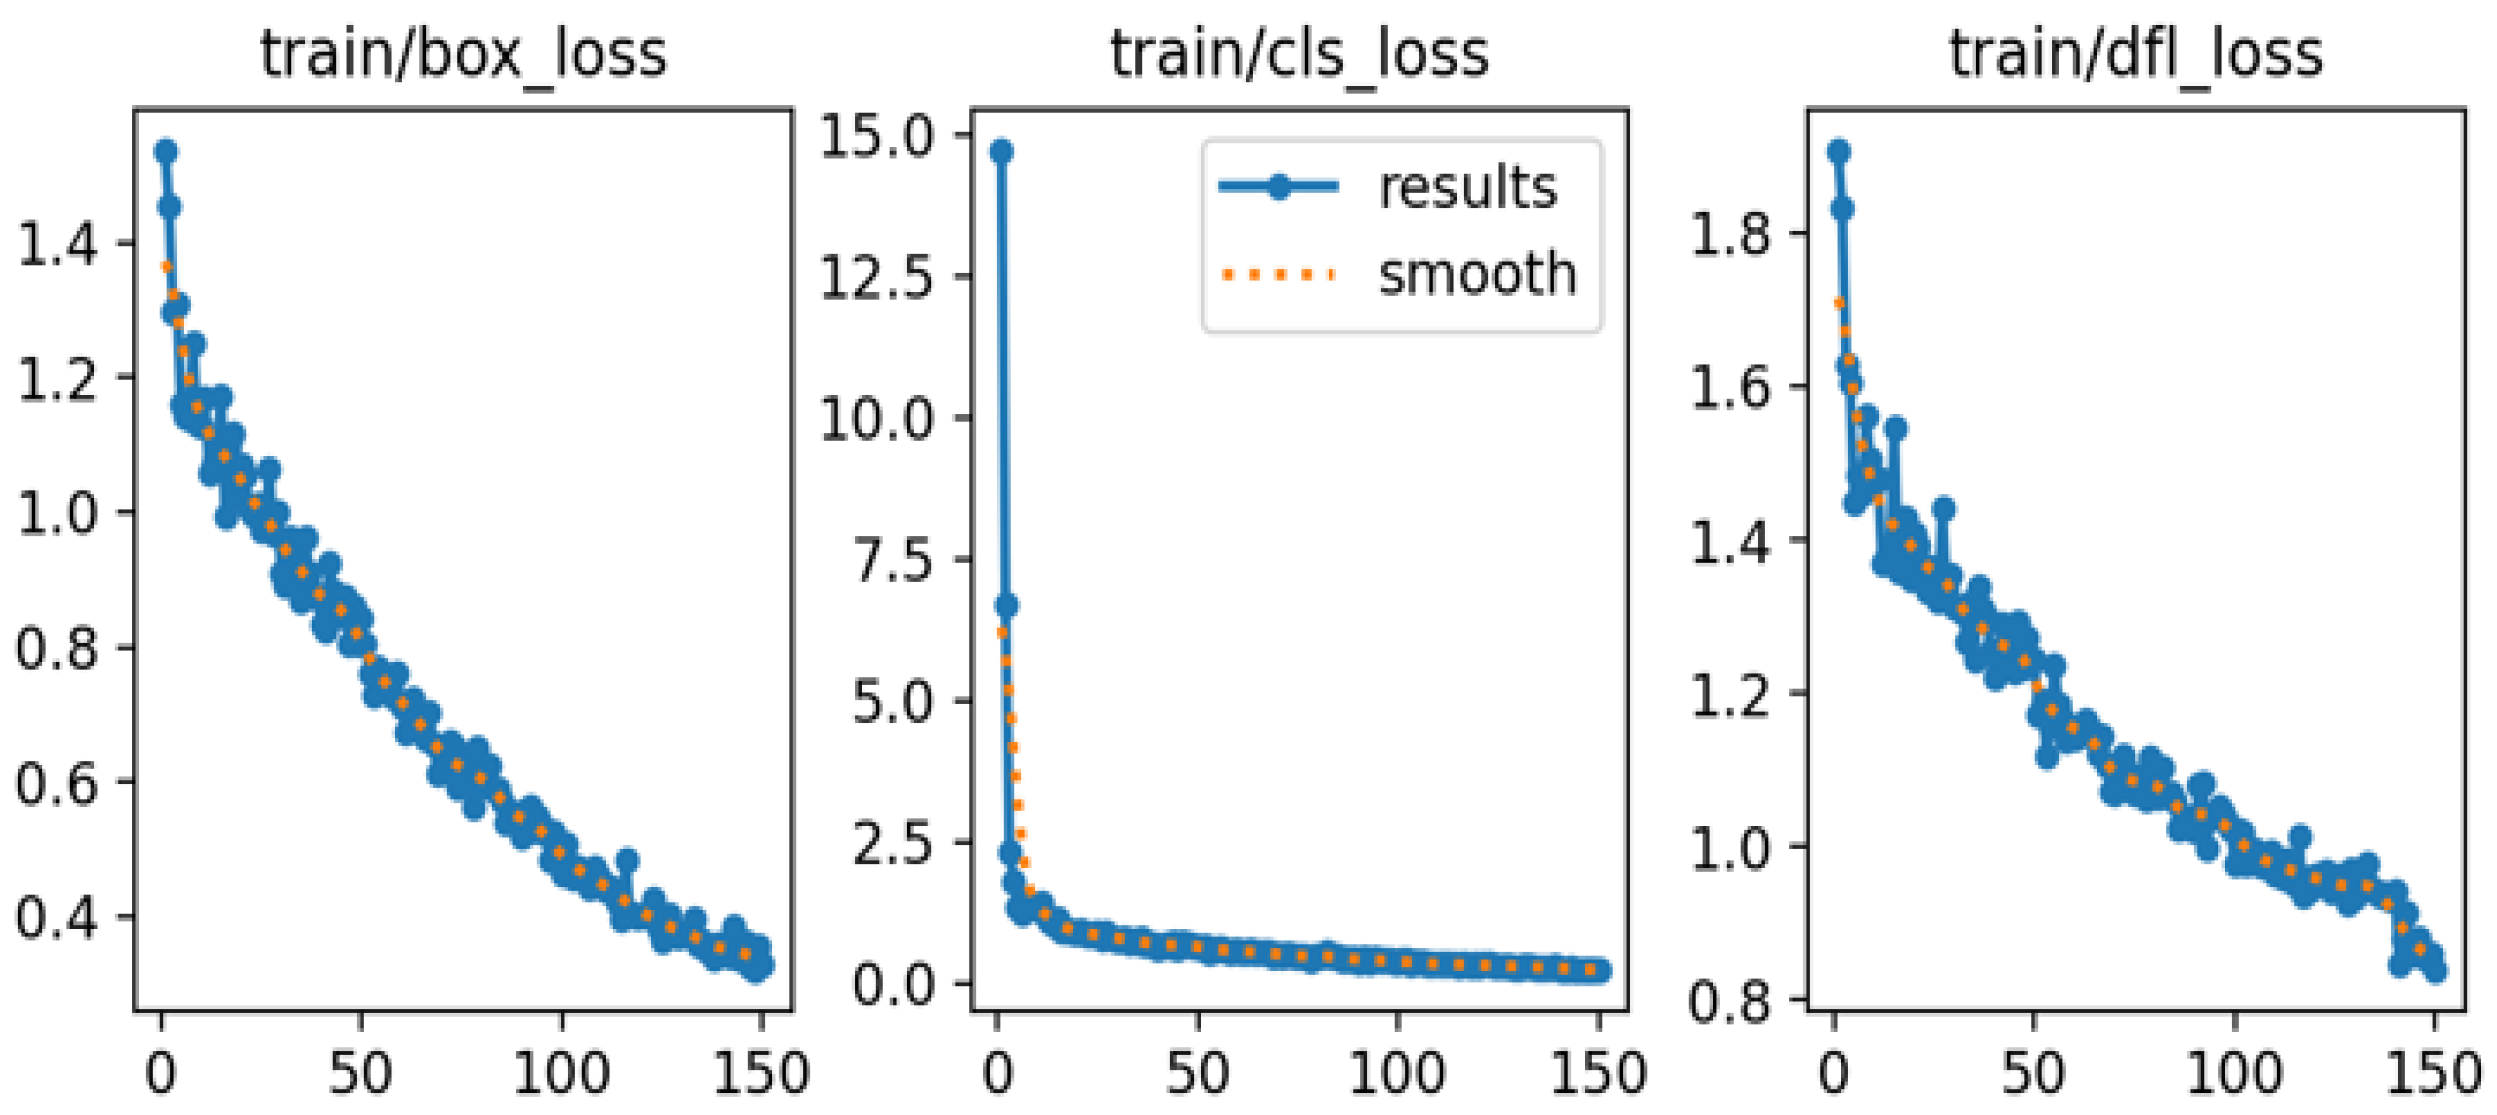
Figure 8.
Validation loss curves of bounding box, classification, and distribution focal on the image dataset.
Figure 8.
Validation loss curves of bounding box, classification, and distribution focal on the image dataset.
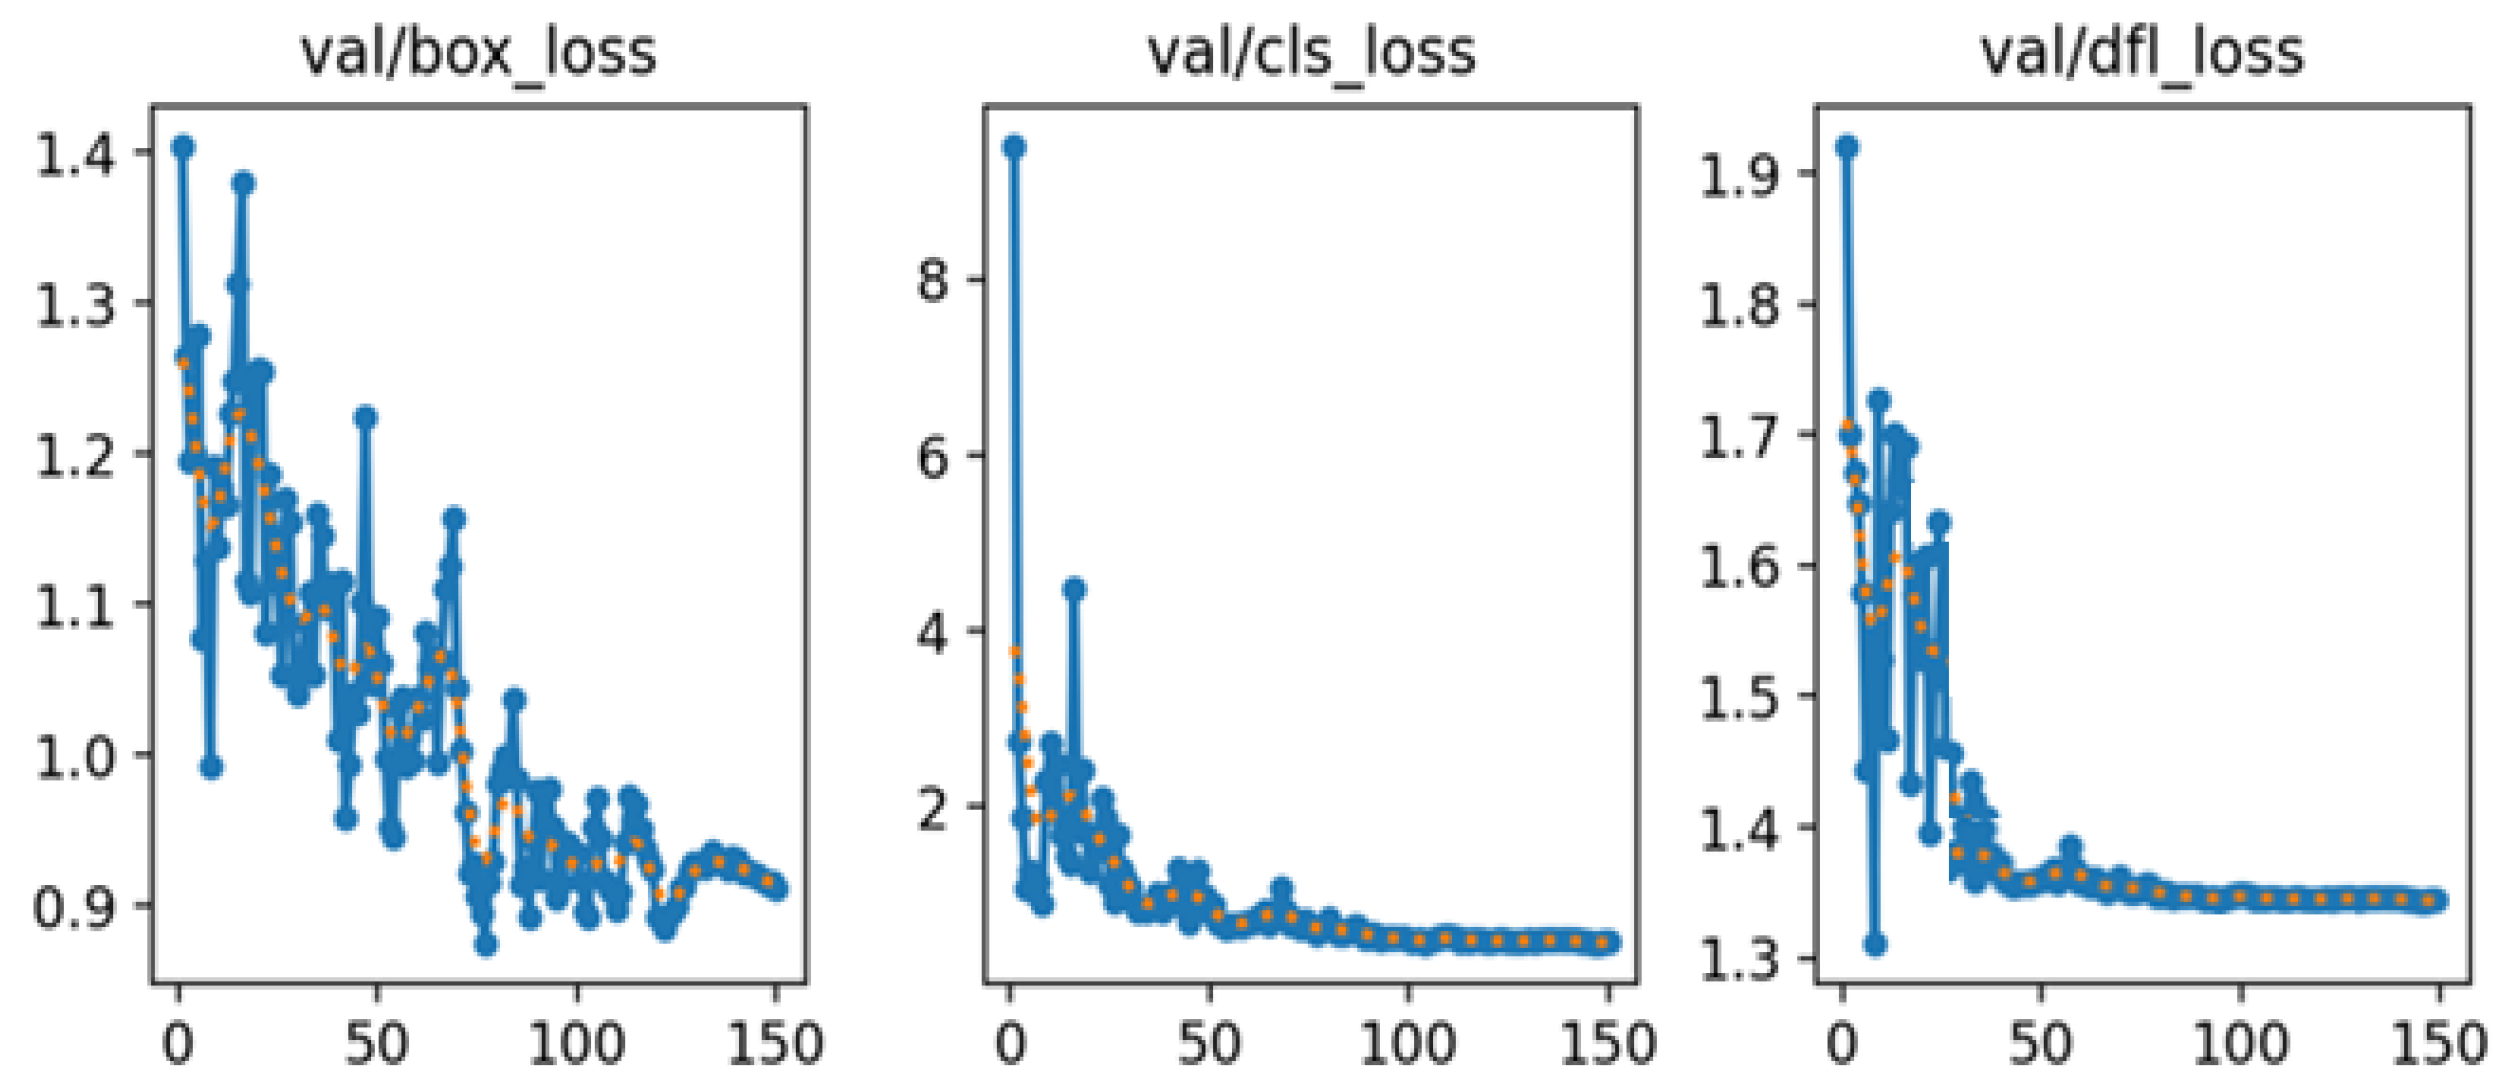
Figure 9.
T Precision and recall curves of the algorithm on the image dataset.
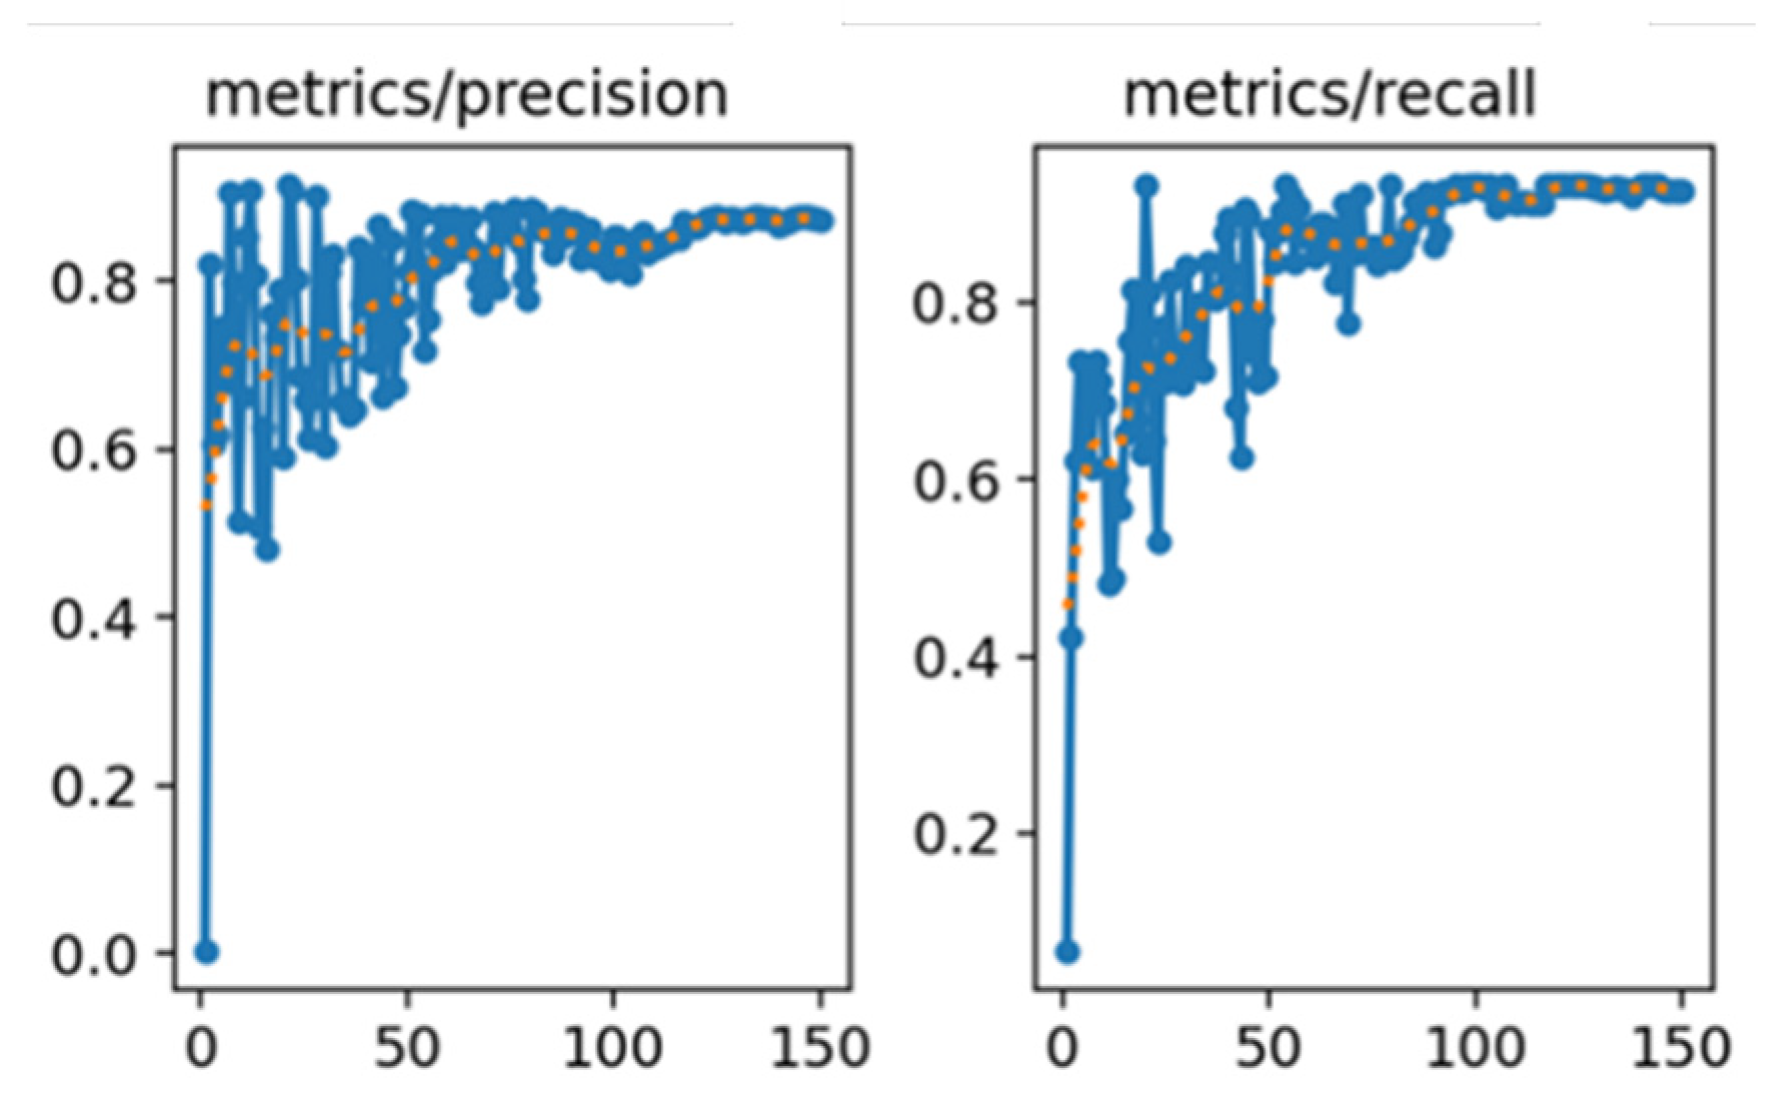
Figure 10.
mAP evaluation curves at IoU[0.5] and IoU[0.5:0.95] on the image dataset.
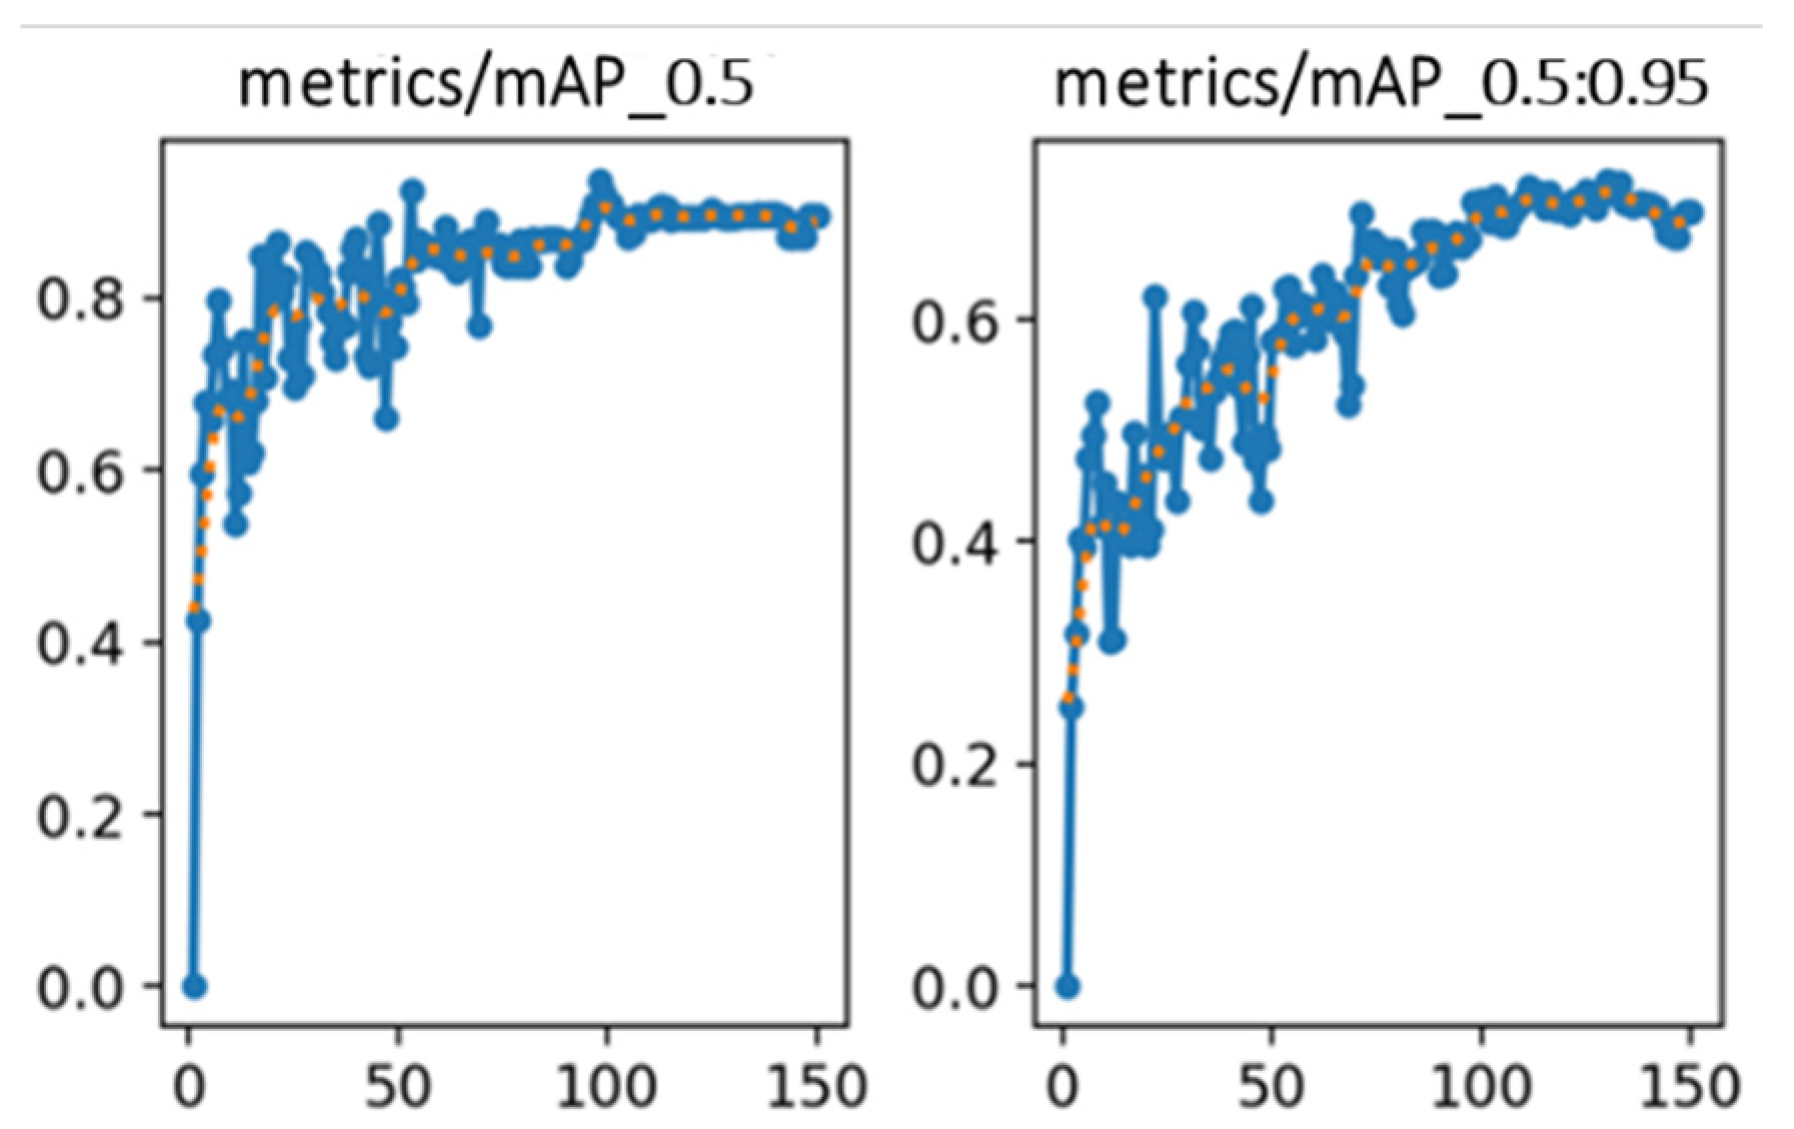
Figure 11.
Practical detection of stationary construction vehicle and sign, roadside warning sign, and electric flag bearer.
Figure 11.
Practical detection of stationary construction vehicle and sign, roadside warning sign, and electric flag bearer.
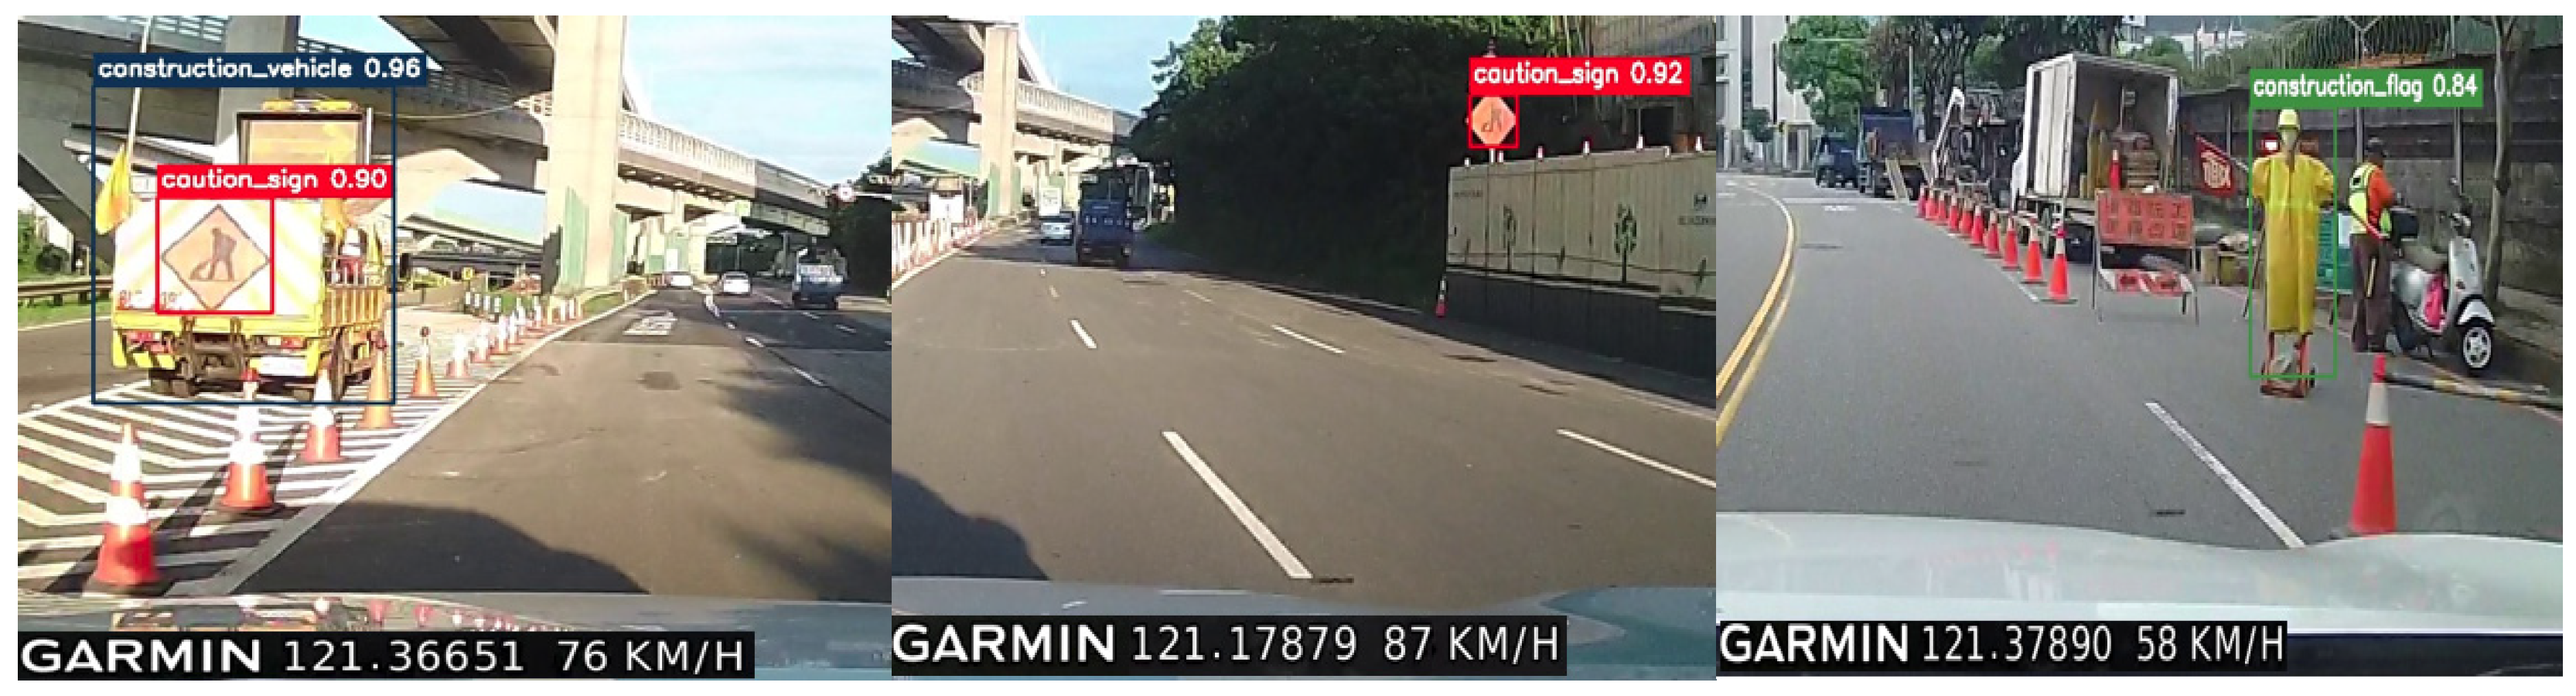
Figure 12.
Detection and recognition of a moving construction vehicle and sign driving speeds of (a) 56 km/h and (b) 98 km/h.
Figure 12.
Detection and recognition of a moving construction vehicle and sign driving speeds of (a) 56 km/h and (b) 98 km/h.
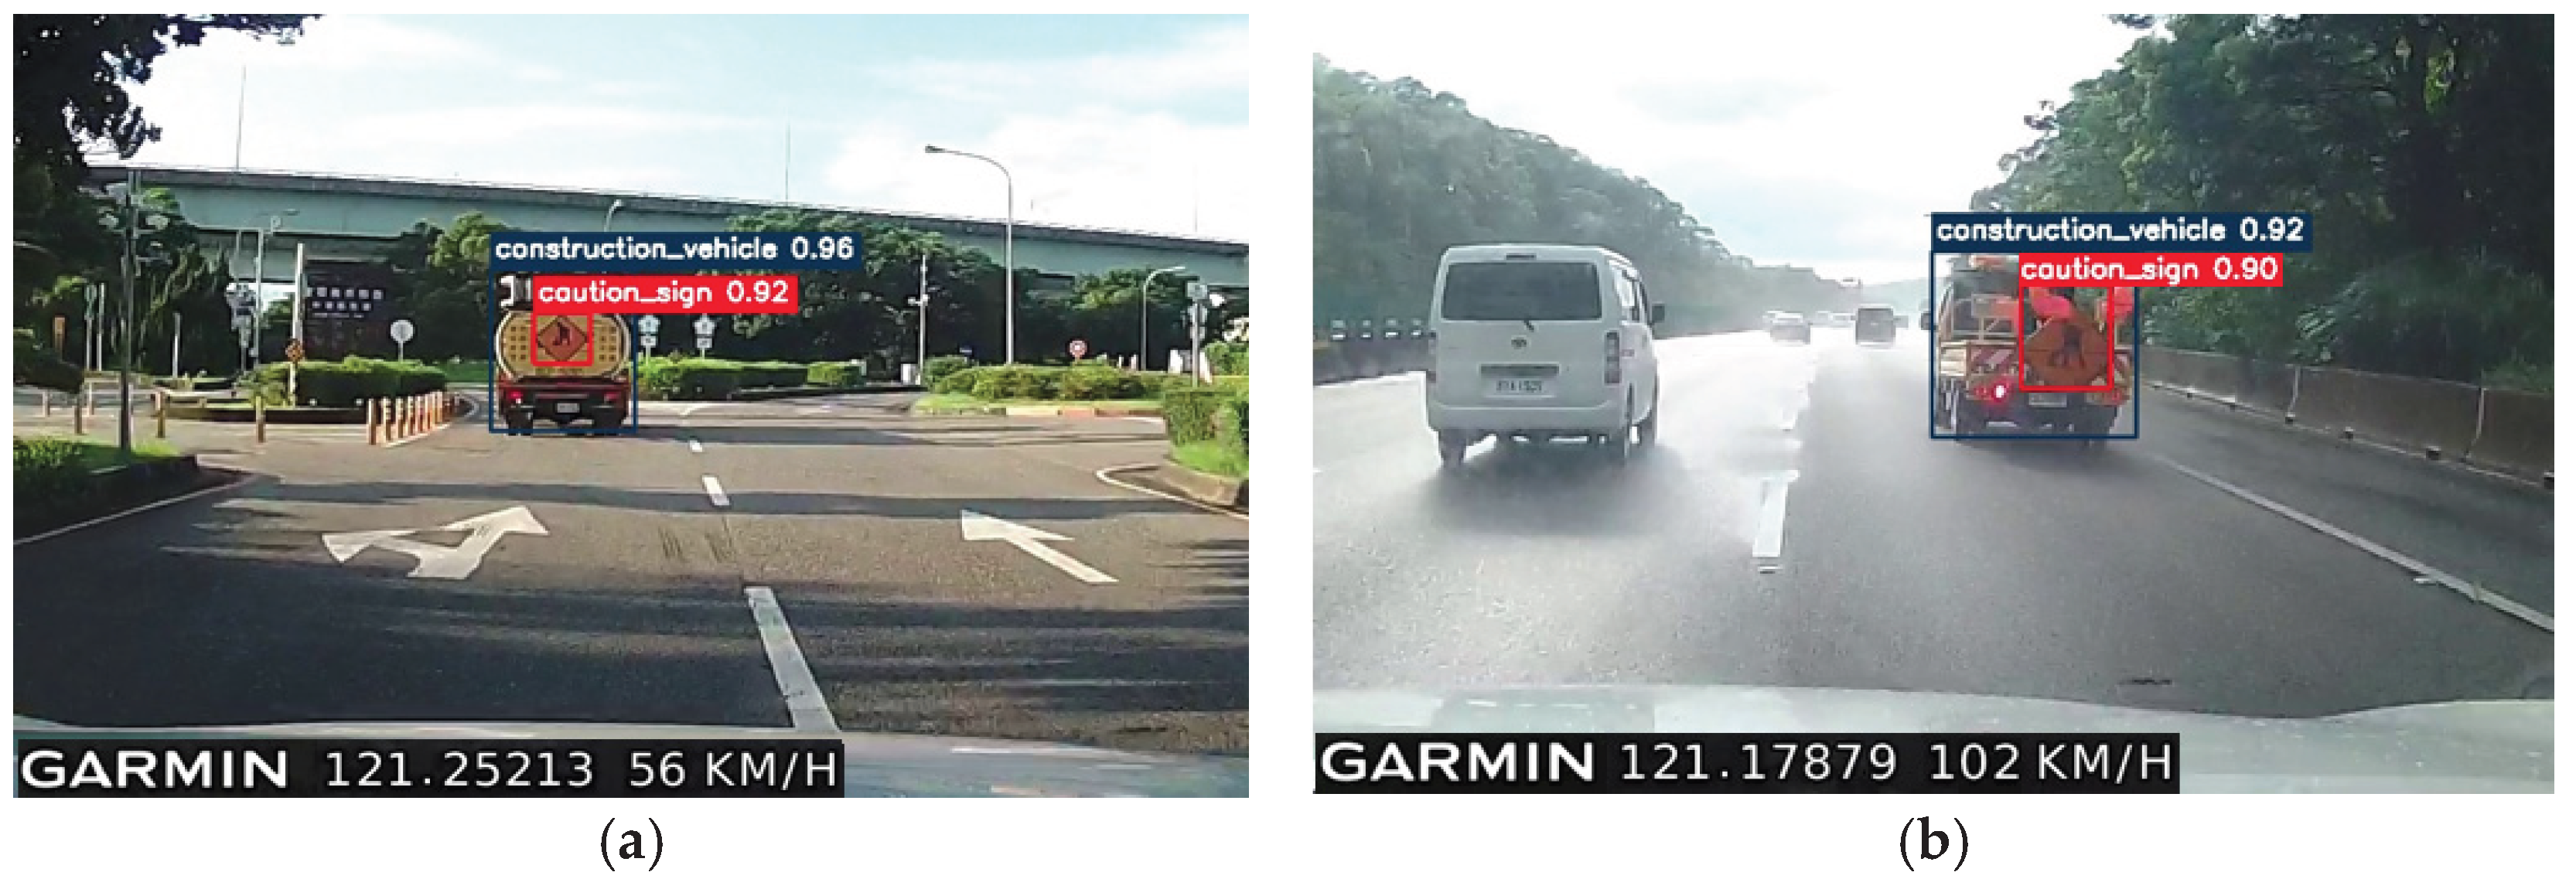

Table 1.
Experimental environment.
| Item | Specification |
|---|---|
| CPU/Memory | 6-Core AMD Ryzen 5 7500F 64 bit Processor 3.7 GHz/32GB RAM |
| GPU/Memory | GPU NVDIA GeForce RTX 5080/32 GB Video RAM |
| Deep learning framework | Pytorch 2.1.2 |
| CUDA toolkit | 11.8 |
| Python | 3.13.2 |
| Operating system | Microsoft Windows 11 Home |
Table 2.
The specifications of NVIDIA Jetson Nano.
| Item | Specification |
|---|---|
| CPU | Quad-core ARM A57 @ 1.43 GHz |
| GPU | GPU 128-core Maxwell |
| Memory | 8 GB 64-bit LPDDR4 25.6 GB/s |
| Ubuntu | 22.04 |
| Connectivity | Gigabit Ethernet, M.2 Key E |
| Interface | USB 4x USB 3.0, USB 2.0 Micro-B |
| Operating system | Jetson Linux 36.4.4 |
Table 3.
Parameters setting for image data augmentation processing.
| No. | Image data augmentations | Parameter adjustment range |
|---|---|---|
| 1 | Contrast | Color ranges from 1-21 |
| 2 | Mixing | Mix images with one another |
| 3 | Brightness | Between -50% and +50% |
| 4 | Grayscale | Colorful to Grayscale |
| 5 | Saturation | Colorfulness: 0.5 to 1.5X |
| 6 | Blur | Up to 4.0px |
| 7 | Hue | Between -55° and +55° |
| 8 | Noise | Add noise up to 10% of pixels |
Table 4.
Evaluation data after model training.
| Class | Precision rate | Recall rate | mAP (IoU[0.5]) | mAP( IoU [0.5: 0.95]) |
|---|---|---|---|---|
| all | 91.12 ± 0.70% | 89.30 ± 0.69% | 90.09 ± 0.51% | 71.13 ± 0.82% |
| construction | 97.91 ± 0.30% | 95.10 ± 0.37% | 94.85 ± 0.25% | 76.30 ± 0.60% |
| warning sign person |
90.85± 0.60% 84.60 ± 1.20% |
88.87± 0.36% 83.96 ± 1.35% |
89.63± 0.30% 85.80 ± 0.98% |
71.85± 0.72% 65.24 ± 1.15% |
Table 5.
Comparison of Identification Results for Different Loss Functions.
| Methods | Precision rate | Recall Rate | mAP (IoU[0.5]) | mAP( IoU [0.5: 0.95]) |
|---|---|---|---|---|
| GIoU | 91.12% | 89.30% | 90.09% | 71.13% |
| CIoU | 91.80% | 88.20% | 90.77% | 70.20% |
| EIoU | 88.10% | 91.40% | 83.80% | 70.10% |
Disclaimer/Publisher’s Note: The statements, opinions and data contained in all publications are solely those of the individual author(s) and contributor(s) and not of MDPI and/or the editor(s). MDPI and/or the editor(s) disclaim responsibility for any injury to people or property resulting from any ideas, methods, instructions or products referred to in the content. |
© 2025 by the authors. Licensee MDPI, Basel, Switzerland. This article is an open access article distributed under the terms and conditions of the Creative Commons Attribution (CC BY) license (http://creativecommons.org/licenses/by/4.0/).
Copyright: This open access article is published under a Creative Commons CC BY 4.0 license, which permit the free download, distribution, and reuse, provided that the author and preprint are cited in any reuse.


