
Submitted:
25 September 2024
Posted:
26 September 2024
You are already at the latest version
Abstract
Introduction: The care of dependent people is eminently family-oriented, and often, there is a high level of dedication to this family care. Constant and continuous care leads to a series of negative psychological consequences. Social support has been related to improved mental health in family caregivers. We found heterogeneous results regarding the relationship between the types of social support received and the perceived level of support. In addition, to our knowledge, no reviews analyze this relationship among family caregivers. Therefore, we aimed to systematically syn-thesize the relationships between perceived and received social support in informal caregivers. Methodology: We have carried out a quantitative systematic review with meta-analysis, regis-tered in PROSPERO (id: CRD42023470047); the systematic search was carried out in the following databases: PubMed, CINAHL, PsycINFO, and Scopus, until November 2023. After the selection and review of the results, 12 studies were obtained, two of which were eliminated due to a high risk of classification bias. Regarding the results, a medium size positive statistical association was found (r = 0.43). The results were consistent, accurate, and robust. The Trim and Fill test showed a vari-ation of 7%. Subgroup analysis indicated no differences in the age group of the people cared for (adults or children), selection bias, and confounding bias. In conclusion, perceived social support is related to more social support received by family caregivers.
Keywords:
Perceived social support
; received social support
; informal caregivers
; meta-analysis
1. Introduction
Social support is defined by Cohen et al. [1] as “social resources that people perceive as available or that are actually provided by non-professionals in the context of both formal support groups and informal helping relationships.”
Types of social support vary depending on the source (family, friends, neighbours), the type of transfer that is carried out (emotional, instrumental, informational) [2], and the type of support (received or received) [3]. Perceived social support assesses subjective aspects, satisfaction, and perception of the availability of support, while social support received is associated with transaction frequency [3].
Numerous studies link social support with better mental health [4]. Thus, those with a higher level of social support may have better physical or psychological health levels than those who are more socially isolated [3].
Social support has been specifically analyzed in different populations, with family caregivers being one of the most studied because the context of family care offers good conditions for analyzing the relationships between social support and emotional consequences [5].
The care of dependent people is eminently family-oriented, and a high level of dedication to this family care is common [6]. Permanent care for a dependent family member has significant emotional repercussions [7,8,9]. Among these problems, subjective overload, depression, and anxiety stand out [7,8,9]. An important aspect that has been studied in the literature on caregivers has been the relationships between social support, overload, anxiety, and depression [10,11,12].
The Stress-Dampening Theory of Lazarus & Folkman [13] explains how social support acts as a buffer against the physical and mental effects of stress. This theory suggests that the relationship between received and perceived support should be relatively strong and that both positive perceptions of support and receipt of support should have stress-dampening effects.
With respect to the relationship between received and perceived support, we find polar opposites. Thus, some studies indicate that both supports are related, with perceived support arising from that received [14]. We also have studies that indicate that both supports are independent, as the correlation between them is weak [15].
It should be noted that very few studies look at the effects of both supports together [15]. Different authors point out the positive relationship between perceived social support with respect to health [15,16,17]. However, the relationship between social support received and health is very ambiguous. This may contribute to more studies focusing on perceived support [15].
Implementing interventions to improve social support is necessary to prevent or improve the burden of informal caregivers [12]. However, we do not know what relationship there is between both types of support and thus need to direct the interventions to a more specific point since we have found original studies on the subject but not systematic reviews. Thus, this study aims to systematically synthesize the relationships between perceived and received social support in informal caregivers.
2. Materials and Methods
2.1. Design
To meet the first objective, we conducted a quantitative systematic review with meta-analysis, following the recommendations of PRISMA [18] and the Cochrane Handbook [19].
This review has been registered in PROSPERO [20] with Id no. CRD42023470047.
2.2. Search Strategy
We conducted a systematic search of using the following databases: PubMed, CINAHL, PsycINFO, and Scopus, up to November 2023. Table S1 shows the search strings used in the different databases.
2.3. Eligibility Criteria
The inclusion criteria established were (1) original studies, (2) with reports on the relationship between perceived support and support received, (3) informal caregivers (4) of dependent people (with no age limit), (5) that presented statistical data on the magnitude of the association between perceived and received social support.
2.4. Data Extraction
For data extraction, two review authors (BGS and RdPC) extracted data from articles independently using a standardized form.
The following were collected: author and year, type of design, sample size, age group of caregivers (children or adults), mean age, length of care, percentage of female caregivers, percentage of caregiver spouses, scale of perceived social support, scale of social support received, cause of dependence of the people cared for and size of association
2.5. Quality Assessment of Included Studies
To assess the methodological quality of the included studies, selection, classification, and confounding biases were assessed following the criteria proposed by Viswanathan et al. [21] and Boyle [22]. The criteria were: (1) type of sampling (use or not of probability sampling; for selection bias); (2) validity and reliability of the measures used (content validity and internal consistency of the questionnaires in the target population or similar), this criterion being mandatory for inclusion in the review (for classification bias) and (3) control for confounding bias (control for the size of the support network and the age and sex of informal caregivers).
We consider that there is control of confounding bias for any of the aforementioned variables when allocation mechanisms that guarantee the formation of groups that are comparable according to those variables (e.g., through stratification, matching, or propensity scores) or when statistical adjustment mechanisms are used for these variables (e.g., stratified or multivariate analysis) [21]. In the statistical adjustment, we consider that there is no confounding bias when the variation between the size of the crude effect and the adjusted effect is less than 10% [23]
Two authors (BGS and RdPC) independently reviewed the quality criteria of the different studies.
2.6. Assessing the Quality of the Evidence
Following the recommendations of the System for the Evaluation, Development and Evaluation of Recommendations (GRADE) [24], we assessed the quality of the evidence using the methodological quality of the included studies (described in the previous paragraph), inconsistency (degree of heterogeneity), imprecision, and publication bias.
Inconsistency refers to the variation of the effect estimates after excluding the main causes of this variation (e.g., sampling bias), which allows us to investigate heterogeneity. The imprecision allows us to study the effects of sample size through the amplitude of confidence intervals, sample size, and number of events. Publication bias indicates the probability of unreported studies and was assessed using the funnel chart and the tests explained in the Analysis section.
To assess inconsistency, we evaluated the number of studies included in each meta-analysis (being small: <5 studies, medium: 5 to 10 studies, and adequate: >10 studies) and finally the average sample size (low: <100 participants, intermediate: 100–300 participants, and high: >300 participants.
2.6. Analysis
A random-effects model was used for the meta-analysis to allow the findings to be generalized to any population of informal caregivers of dependent people [25].
For the analysis of heterogeneity, we performed the Q test and the degree of Higgins inconsistency. The Q test indicates heterogeneity when the “p” value is greater than 0.1. The degree of inconsistency (I2) of Higgins et al. [26] is the proportion of the variability observed in the effect of the intervention that is due to differences between studies and not random. The values range from 0% (absence of heterogeneity) to 100% (maximum heterogeneity), with the cut-off points being 25% for low heterogeneity, 50% for moderate, and 75% for high [26].
We use several methods to assess publication bias, following the recommendations of Guyatt et al. [27]. The methods used were inspection of the degree of asymmetry of the funnel chart, test of Egger et al. [28], and the Trim and Fill method [29].
The Egger test is the graphical representation of the regression line between the accuracy of the studies and the standardized effect. If the slope of the regression is equal (no publication bias) or different (there is) 0, with a p-value greater than 0.1 indicating a low risk of publication bias [28]. The Trim and Fill method calculates the value of the combined effect considering possible publication bias, eliminating small studies that cause asymmetry and imputation of the missing studies needed [29].
To investigate the robustness of our findings, we conducted several meta-analyses, eliminating one study at a time. Subgroup analyses were also performed to study the robustness of our results and the possible effect of the moderating variables: age group (adults or children) and different quality criteria (selection, classification and confounding).
All analyses were performed using the comprehensive meta-analysis program 3.3. (Biostat, Englewood, New Jersey, USA).
3. Results
3.1. Description of the Search Results
We obtained a total of 87 results from the different databases, of which we eliminated eight studies because they were duplicates. Of the remaining 79, 49 were eliminated because they were not relevant to the topic studied, leaving 30 studies to be reviewed in full text. Of these 30, 18 were eliminated according to the different inclusion criteria (eight for not relating the support received and received, one for analyzing formal support, seven for studying populations other than those of caregivers, one for providing adjusted data, and one for containing unclassifiable support). The quality of the 12 selected studies was reviewed, eliminating two due to classification bias, leaving a final sample of ten studies (Figure 1).
3.2. Description of the Characteristics of the Studies
As can be seen in Table 1, the ten studies included were cross-sectional descriptive, one of them being repeated measures, but with cross-sectional correlations. 70% of the studies (n= 7) were conducted in the United States. 50% of the samples were obtained by non-probability sampling. The total sample was 2,142 people, with a range of between 17 and 637 caregivers. The year of publication ranged from 1994 to 2023. With respect to care recipients, half of the studies (n= 5) were adults. The most frequent causes of dependence were dementia (n= 3) and autism (n= 2).
3.3. Description of the Quality of the Studies
Table 2 shows the results of the quality assessment of the ten included studies. Eight studies present had non-probability samples and two studies controlled for confounding variables.
3.4. Description of Meta-Analysis Results
Ten studies reported the relationship between perceived and received social support, showing a positive statistical association with median effect size (r = 0.43, confidence interval [CI] = 0.28; 0.56, N = 2,142; Mean N = 214.2; Figure 2). All studies reported positive correlations, although in one study, the correlation was not statistically significant.
The results were consistent (I2 = 0.0; p-value for the Q test: 0.84), accurate, and robust (maximum percent change in combined effect for sensitivity analysis by deleting one study at a time: = 18.6%).
The funnel plot (Figure 3) appeared somewhat asymmetrical, but no greater magnitude of association was observed in small studies or studies with extreme magnitude of association. In addition, in the Egger test, a value of p = 0.81 was obtained. The Trim & Fill test indicates a value of 0.46 (7% variation from the actual combined effect). Thus, there is a risk of publication bias, but such bias could have a very small impact on the outcome of the meta-analysis.
Subgroup analysis indicated no statistically significant difference in effect size when comparing the age group of people cared for (adults: r = 0.47; 95% CI = 0.19, 0.68; 5 studies; children: r = 0.4; 95% CI = 0.27, 0.52; 5 studies). With regard to quality criteria, no differences were found according to the type of sampling (studies with non-probability samples: r = 0.49; 95% CI = 0.26, 0.67; 5 studies; studies with probability samples: r = 0.38; 95% CI = 0.23; 0.51; 5 studies), and between those studies that controlled for confounding bias (r = 0.43; 95% CI = 0.33; 0.52; 2 studies) and those that did not control (r = 0.5; 95% CI = 0.46; 0.53; 8 studies).
4. Discussion
To our knowledge, our review is the first to study the relationship between perceived social support and social support received by family caregivers. We found that higher levels of perceived social support are associated with higher levels of social support received from family caregivers.
The results obtained indicated a value of the size of the median effect and were consistent, accurate, and robust. After subgroup analysis, no differences were found according to the age group of the person cared for (adults or children) or according to quality criteria (selection bias and confounding bias).
We found similar results, but with a higher magnitude of association, in the systematic review of Haber et al. [39], which analyses the relationship between social support received (measured by the Inventory of Socially Supportive Behaviours scale (ISSB) [40]) and perceived social support (measured by the Interpersonal Support Evaluation List (ISEL) and Social Support Questionnaire scales (SSQ) [41]) in the adult population. Another study carried out by [42] in the adult population obtained the same results—a positive statistical association between perceived social support and received social support.
According to the existing literature on family caregivers of children diagnosed with autism spectrum disorder [43], both perceived social support and received social support play a key role in reducing stress levels in this population, demonstrating that both concepts are related with values very similar to ours [36]. Such an association increases when support needs are considered, i.e., the number of times support is received when needed [3]. Social support acts as a modulating variable in the negative health consequences according to the theory of the “Buffer Effect Hypothesis” [1].
Perceived social support and social support received have been studied in various contexts and in relation to different negative consequences of care [7,8,9]. Evidence so far has provided mixed results on the relationship between perceived and received social support. From studies that indicate that they act differently and that they are distinct concepts, to studies that support that both are interrelated [14]. The correlation obtained between perceived social support and received social support supports the theory that, although they are related, they are different constructs.
Various studies have shown that both types of support are related differently to the different negative consequences of caregiving, with the possible protective effect of perceived support being greater than that received with respect to subjective overload [17], anxiety [11] and depression [10]. Our results support that both types of support are different constructs, and together with previous results that show a possible greater protective effect of perceived support, support prioritizing action on perceived social support over the support received, if necessary, when planning interventions aimed at promoting social support.
This study has limitations. Firstly, the low number of included studies, which is due to the scarcity of research on the subject and the establishment as a mandatory inclusion criterion of the validity and reliability of measures used to measure social support, although this last aspect increases the quality of the results. Secondly, all the studies included in the meta-analysis have a cross-sectional descriptive design, which prevents establishing causal relationships. And thirdly, most of the studies included in the meta-analysis have non-probabilistic samples and do not control for potential confounding variables, although in the sensitivity analyses there were no significant differences in the combined effect according to these quality criteria.
5. Conclusions
This study provides the first quantitative synthesis of the relationship between perceived social support and social support received in family caregivers. The results obtained indicate that perceived social support is related to more social support received by family caregivers. Although both types of support are related, the magnitude of the association between them supports the argument that they are different constructs. When planning interventions to promote social support, it may be appropriate to prioritize actions aimed at perceived social support over support received, where necessary.
Further longitudinal studies will be needed in future research to investigate the possible causal relationships between perceived social support and received social support.
Supplementary Materials
The following supporting information can be downloaded at: Preprints.org, Table S1: Search strategy.
Author Contributions
Conceptualization, B.G.-S and R.d.-P.-C.; methodology, R.d.-P.-C.;; software, H.d.-S.-D.; validation, B.G.-S., H.d.-S.-D. and C.L.-M.; formal analysis, B.G.-S.; investigation, C.L.-M.; resources H.d.-S.-D data curation R.d.-P.-C writing—original draft preparation, B.G.-S.; writing—review and editing, R.d.-P.-C.; visualization C.L.-M.; supervision, R.d.-P.-C.; project administration, B.G.-S.
Funding
This research received no external funding.
Institutional Review Board Statement
Not applicable
Informed Consent Statement
Not applicable.
Data Availability Statement
All data are available from the authors upon reasonable request.
Public Involvement Statement
No public involvement in any aspect of this research
Guidelines and Standards Statement
Not applicable.
Use of Artificial Intelligence
AI or AI-assisted tools were not used in drafting any aspect of this manuscript.
Conflicts of Interest
The authors declare no conflicts of interest.
References
- Cohen S, Gottlieb BH, Underwood LG. Social relationships and health. In: Cohen S, Underwood LG, Gottlieb BH, editors. Social support measurement and intervention: A guide for health and social scientists. New York, NY: Oxford University Press; 2000. p. 3-25.
- Barrera, M. Distinctions between social support concepts, measures, and models. Am J Community Psychol. 1986;14(4):413-45. [CrossRef]
- Melrose KL, Brown GDA, Wood AM. When is received social support related to perceived support and well-being? When it is needed. Pers Individ Dif. 2015;77:97-105.
- Wang J, Mann F, Lloyd-Evans B, Ma R, Johnson S. Associations between loneliness and perceived social support and outcomes of mental health problems: a systematic review. BMC Psychiatry. 2018;18(1):156.
- Smerglia VL, Miller NB, Sotnak DL, Geiss CA. Social support and adjustment to caring for elder family members: A multi-study analysis. Aging and Mental Health. 2007;11(2):205-17.
- Organisation for Economic Co-operation and Development. Health at a Glance 2021: OECD indicators. Paris: OECD Publishing; 2021.
- Liu B, Lee K, Sun C, Wu D, Lim PY. Systematic review on factors associated with self-perceived burden among cancer patients. Support Care Cancer. 2022;30(10):8417-28.
- Loh AZ, Tan JS, Zhang MW, Ho RC. The Global Prevalence of Anxiety and Depressive Symptoms Among Caregivers of Stroke Survivors. J Am Med Dir Assoc. 2017;18(2):111-6.
- Sallim AB, Sayampanathan AA, Cuttilan A, Chun-Man Ho R. Prevalence of Mental Health Disorders Among Caregivers of Patients With Alzheimer Disease. J Am Med Dir Assoc. 2015;16(12):1034-41.
- Gutiérrez-Sánchez B, Orgeta V, López-Martínez C, del-Pino-Casado R. Association between Social Support and Depressive Symptoms in Informal Caregivers of Adult and Older Dependents: A Systematic Review and Meta-Analysis. Journal of Clinical Medicine. 2023;12(20).
- Priego-Cubero E, Orgeta V, López-Martínez C, del-Pino-Casado R. The Relationship between Social Support and Anxiety Symptoms in Informal Carers: A Systematic Review and Meta-Analysis. Journal of Clinical Medicine. 2023;12:1244. [CrossRef]
- Del-Pino-Casado R, Frias-Osuna A, Palomino-Moral PA, Ruzafa-Martinez M, Ramos-Morcillo AJ. Social support and subjective burden in caregivers of adults and older adults: A meta-analysis. PLoS One. 2018;13(1):e0189874.
- Lazarus RS, Folkman S. Estrés y procesos cognitivos. 1986.
- Robinson, SM. Understanding social support for parents of individuals with Autism Spectrum Disorders. 2019.
- Maríñez-Lora AM, Cua G, Frazier SL, Shernoff ES, Atkins MS. Caregiver strain, social support, and mental health service use among urban African American mothers. Journal of child and family studies. 2021;30(7):1633-49.
- Nurullah, AS. Received and provided social support: A review of current evidence and future directions. American Journal of Health Studies. 2012;27(3):173-88.
- Raad, J.H.; Tulsky, D.S.; Lange, R.T.; Brickell, T.A.; Sander, A.M.; Hanks, R.A.; French, L.; Miner, J.A.; Kisala, P.A.; Carlozzi, N.E. Establishing the Factor Structure of a Health-Related Quality of Life Measurement System for Caregivers of Persons Living with Traumatic Brain Injury. Arch. Phys. Med. Rehabil. 2020, 101, 1220–1232 Page MJ, McKenzie JE, Bossuyt PM, Boutron I, Hoffmann TC, Mulrow CD, et al. The PRISMA 2020 statement: an updated guideline for reporting systematic reviews. Bmj. 2021;372:n71.
- Deeks JJ, Bossuyt PM, Leeflang MM, Takwoingi Y. Cochrane handbook for systematic reviews of diagnostic test accuracy: John Wiley & Sons; 2023.
- Booth A, Clarke M, Dooley G, Ghersi D, Moher D, Petticrew M, et al. The nuts and bolts of PROSPERO: an international prospective register of systematic reviews. Syst Rev. 2012;1:2. [CrossRef]
- Viswanathan M, Berkman ND, Dryden DM, Hartling L. AHRQ Methods for Effective Health Care. Assessing Risk of Bias and Confounding in Observational Studies of Interventions or Exposures: Further Development of the RTI Item Bank. Rockville (MD): Agency for Healthcare Research and Quality (US); 2013.
- Boyle, MH. Guidelines for evaluating prevalence studies. BMJ Ment Health. 1998;1(2):37-9.
- Rothman KJ, Greenland S, Lash TL. Modern epidemiology: Wolters Kluwer Health/Lippincott Williams & Wilkins Philadelphia; 2008.
- Meader N, King K, Llewellyn A, Norman G, Brown J, Rodgers M, et al. A checklist designed to aid consistency and reproducibility of GRADE assessments: development and pilot validation. Syst Rev. 2014;3:82.
- Cooper H, Hedges LV, Valentine JC. The handbook of research synthesis and meta-analysis: Russell Sage Foundation; 2019.
- Higgins JP, Thompson SG, Deeks JJ, Altman DG. Measuring inconsistency in meta-analyses. Bmj. 2003;327(7414):557-60.
- Guyatt G, Oxman AD, Akl EA, Kunz R, Vist G, Brozek J, et al. GRADE guidelines: 1. Introduction—GRADE evidence profiles and summary of findings tables. Journal of clinical epidemiology. 2011;64(4):383-94. [CrossRef]
- Egger M, Smith GD, Schneider M, Minder C. Bias in meta-analysis detected by a simple, graphical test. Bmj. 1997;315(7109):629-34.
- Duval S, Tweedie R. Trim and fill: a simple funnel-plot–based method of testing and adjusting for publication bias in meta-analysis. Biometrics. 2000;56(2):455-63.
- Benson PR, Karlof KL. Anger, stress proliferation, and depressed mood among parents of children with ASD: a longitudinal replication. Journal of Autism & Developmental Disorders. 2009;39(2):350-62.
- Burton AM, Haley WE, Small BJ, Finley MR, Dillinger-Vasille M, Schonwetter R. Predictors of well-being in bereaved former hospice caregivers: the role of caregiving stressors, appraisals, and social resources. Palliative & Supportive Care. 2008;6(2):149-58.
- Dolcini-Catania LG. Caregiver Social Support and Engagement in the Family Check-Up Across Early and Middle Childhood: University of Pittsburgh; 2021.
- Falzarano F, Moxley J, Pillemer K, Czaja SJ. Family Matters: Cross-Cultural Differences in Familism and Caregiving Outcomes.
- Kaul M, Lakey B. Where is the support in perceived support? The role of generic relationship satisfaction and enacted support in perceived support’s relation to low distress. Journal of Social and Clinical Psychology. 2003;22(1):59-78.
- Losada A, Márquez-González M, Knight BG, Yanguas J, Sayegh P, Romero-Moreno R. Psychosocial factors and caregivers’ distress: effects of familism and dysfunctional thoughts. Aging & Mental Health. 2010;14(2):193-202.
- Robinson S, Weiss JA. Examining the relationship between social support and stress for parents of individuals with autism. Research in Autism Spectrum Disorders. 2020;74:101557. Disclaimer/Publisher’s Note: The statements, opinions and data contained in all publications are solely those of the individual author(s) and contributor(s) and not of MDPI and/or the editor(s). MDPI and/or the editor(s) disclaim responsibility for any injury to people or property resulting from any ideas, methods, instructions or products referred to in the content.
- Robinson KM, Kaye J. The relationship between spiritual perspective, social support, and depression in caregiving and noncaregiving wives. Sch Inq Nurs Pract. 1994;8(4):375-89; discussion 91-6.
- Xu L, Li Y, Min J, Chi I. Worry about not having a caregiver and depressive symptoms among widowed older adults in China: the role of family support. Aging Ment Health. 2017;21(8):879-88. [CrossRef]
- Haber MG, Cohen JL, Lucas T, Baltes BB. The relationship between self-reported received and perceived social support: A meta-analytic review. American journal of community psychology. 2007;39:133-44.
- Robinson K, Austin JK. Wife caregivers’ and supportive others’ perceptions of the caregivers’ health and social support. Research in Nursing & Health. 1998;21(1):51-7.
- Chiò A, Gauthier A, Montuschi A, Calvo A, Di Vito N, Ghiglione P, et al. A cross sectional study on determinants of quality of life in ALS. Journal of Neurology, Neurosurgery & Psychiatry. 2004;75(11):1597-601.
- Eagle DE, Hybels CF, Proeschold-Bell RJ. Perceived social support, received social support, and depression among clergy. Journal of Social and Personal Relationships. 2019;36(7):2055-73. [CrossRef]
- Gottlieb BH, Bergen AE. Social support concepts and measures. Journal of psychosomatic research. 2010;69(5):511-20.
Figure 1.
Flow diagram of the review on the relationship between perceived and received social support.
Figure 1.
Flow diagram of the review on the relationship between perceived and received social support.
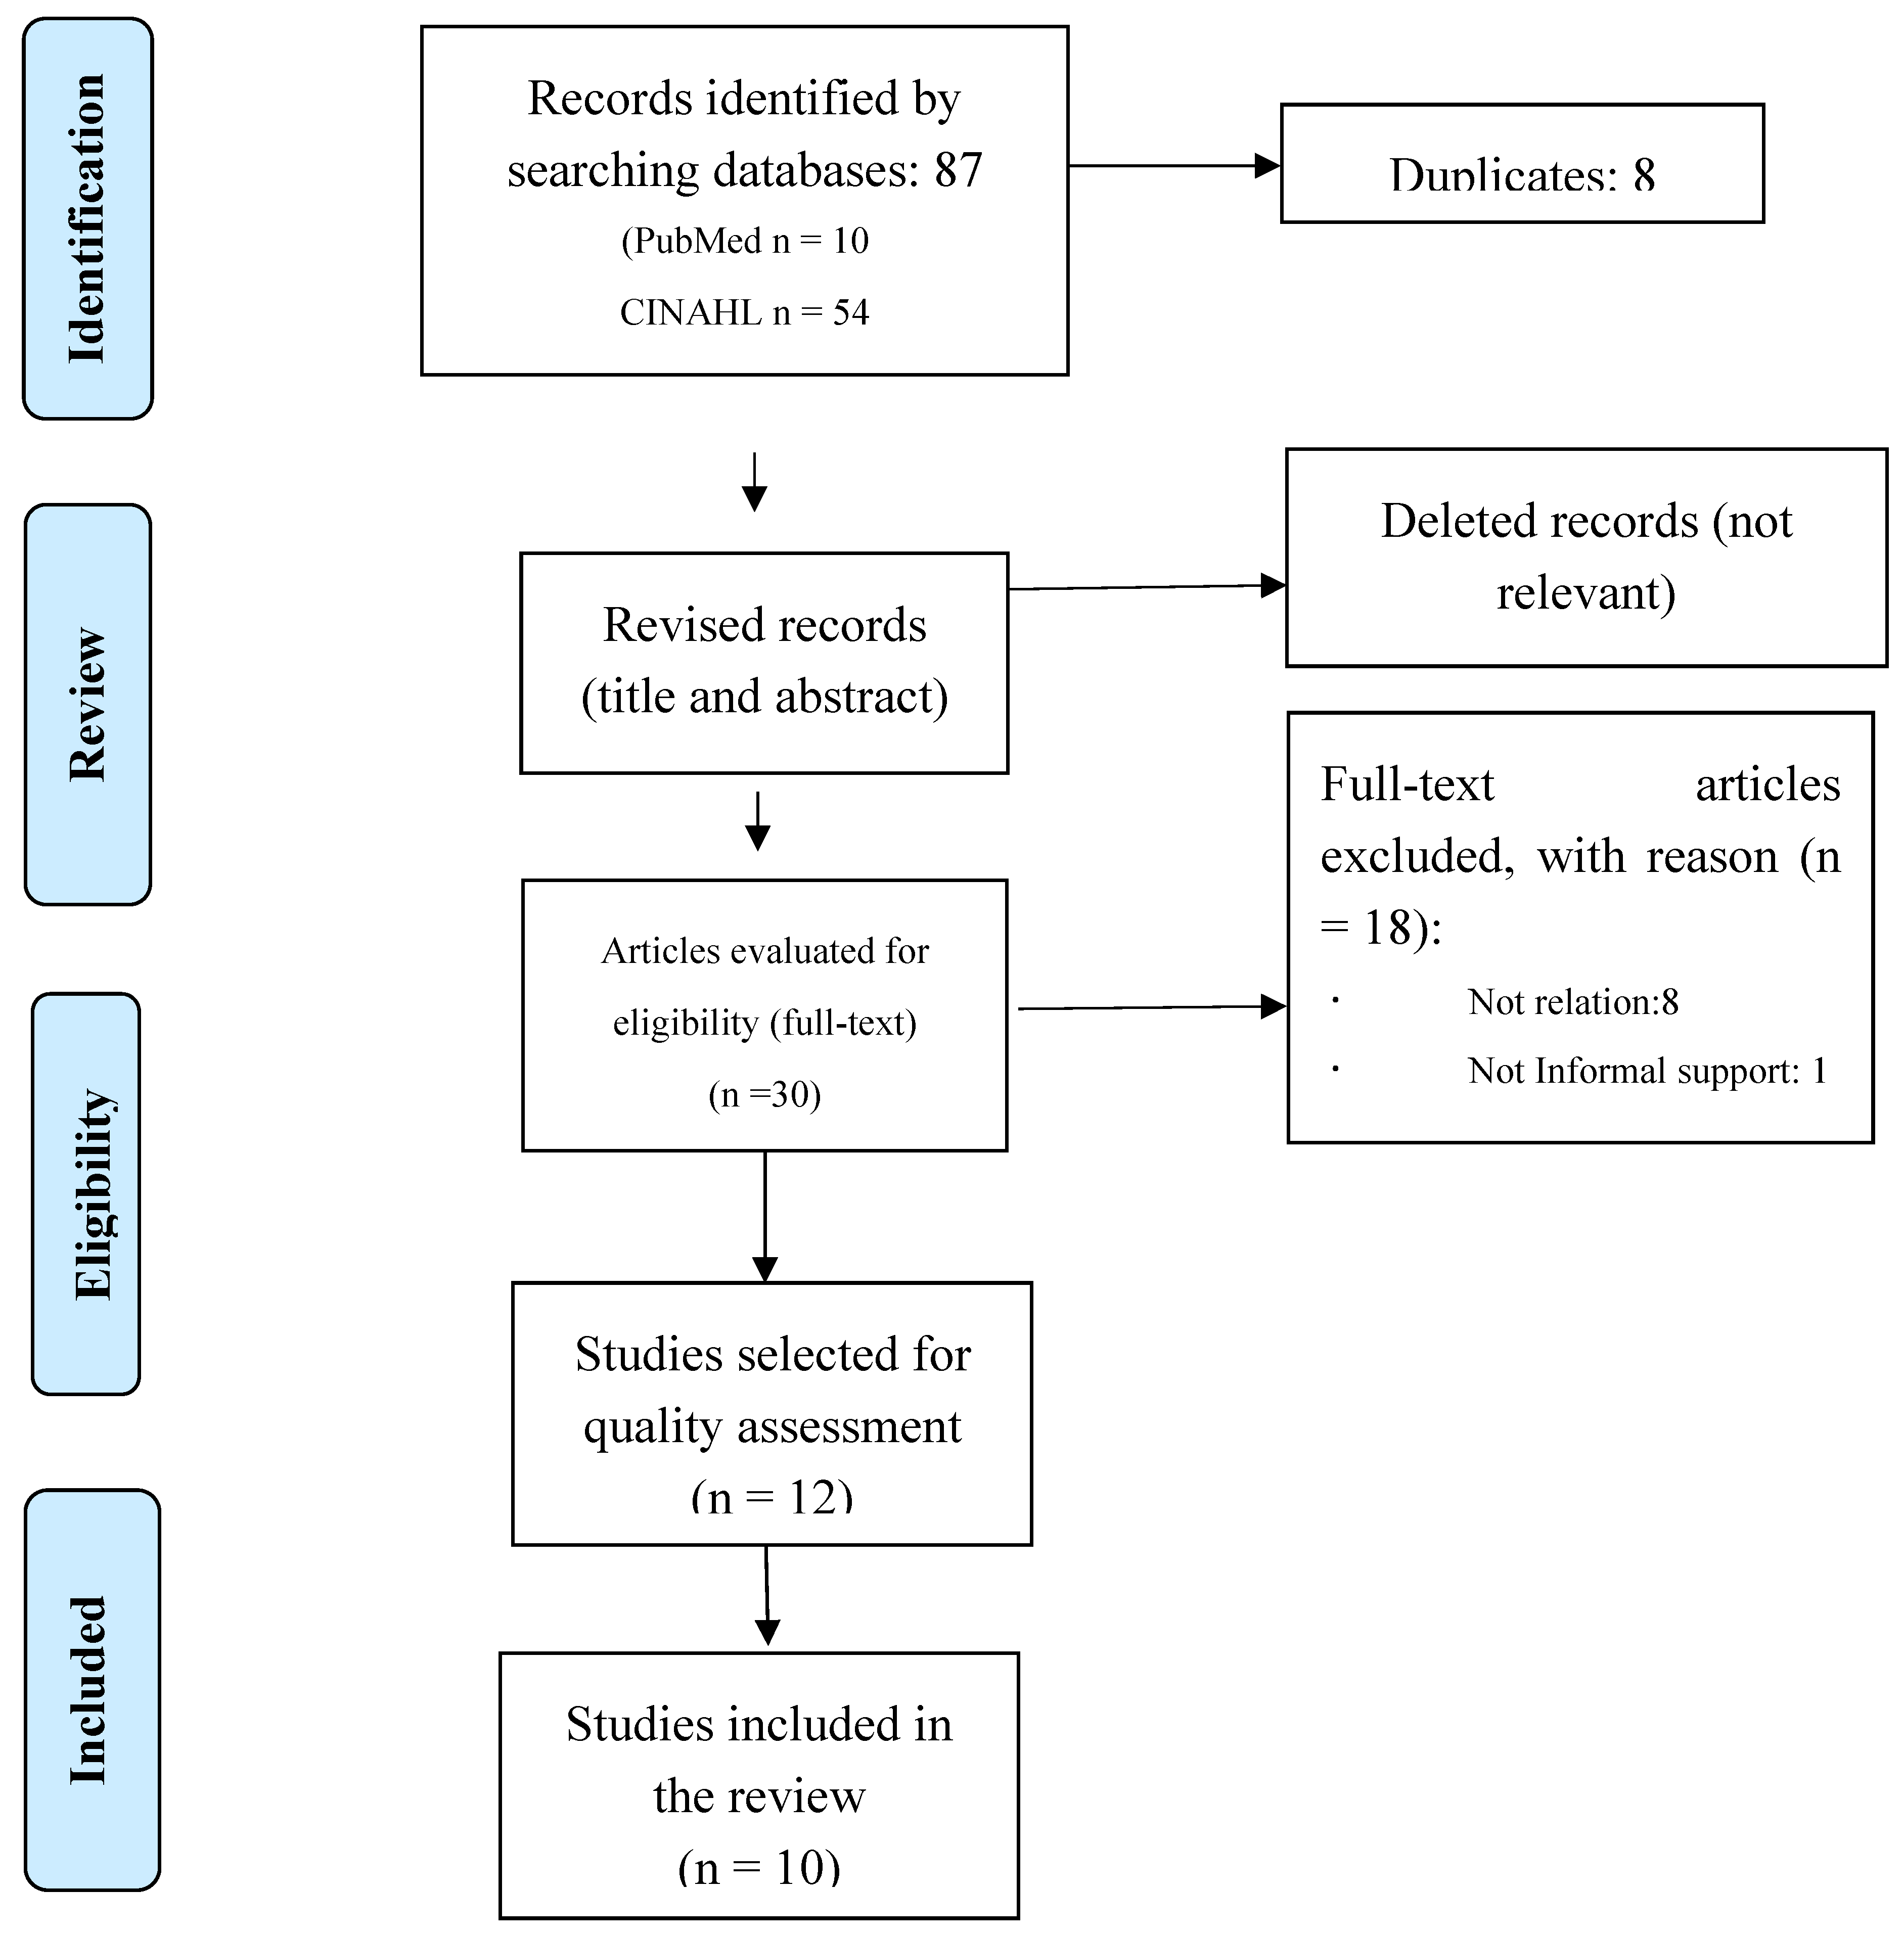
Figure 2.
Forest plot.
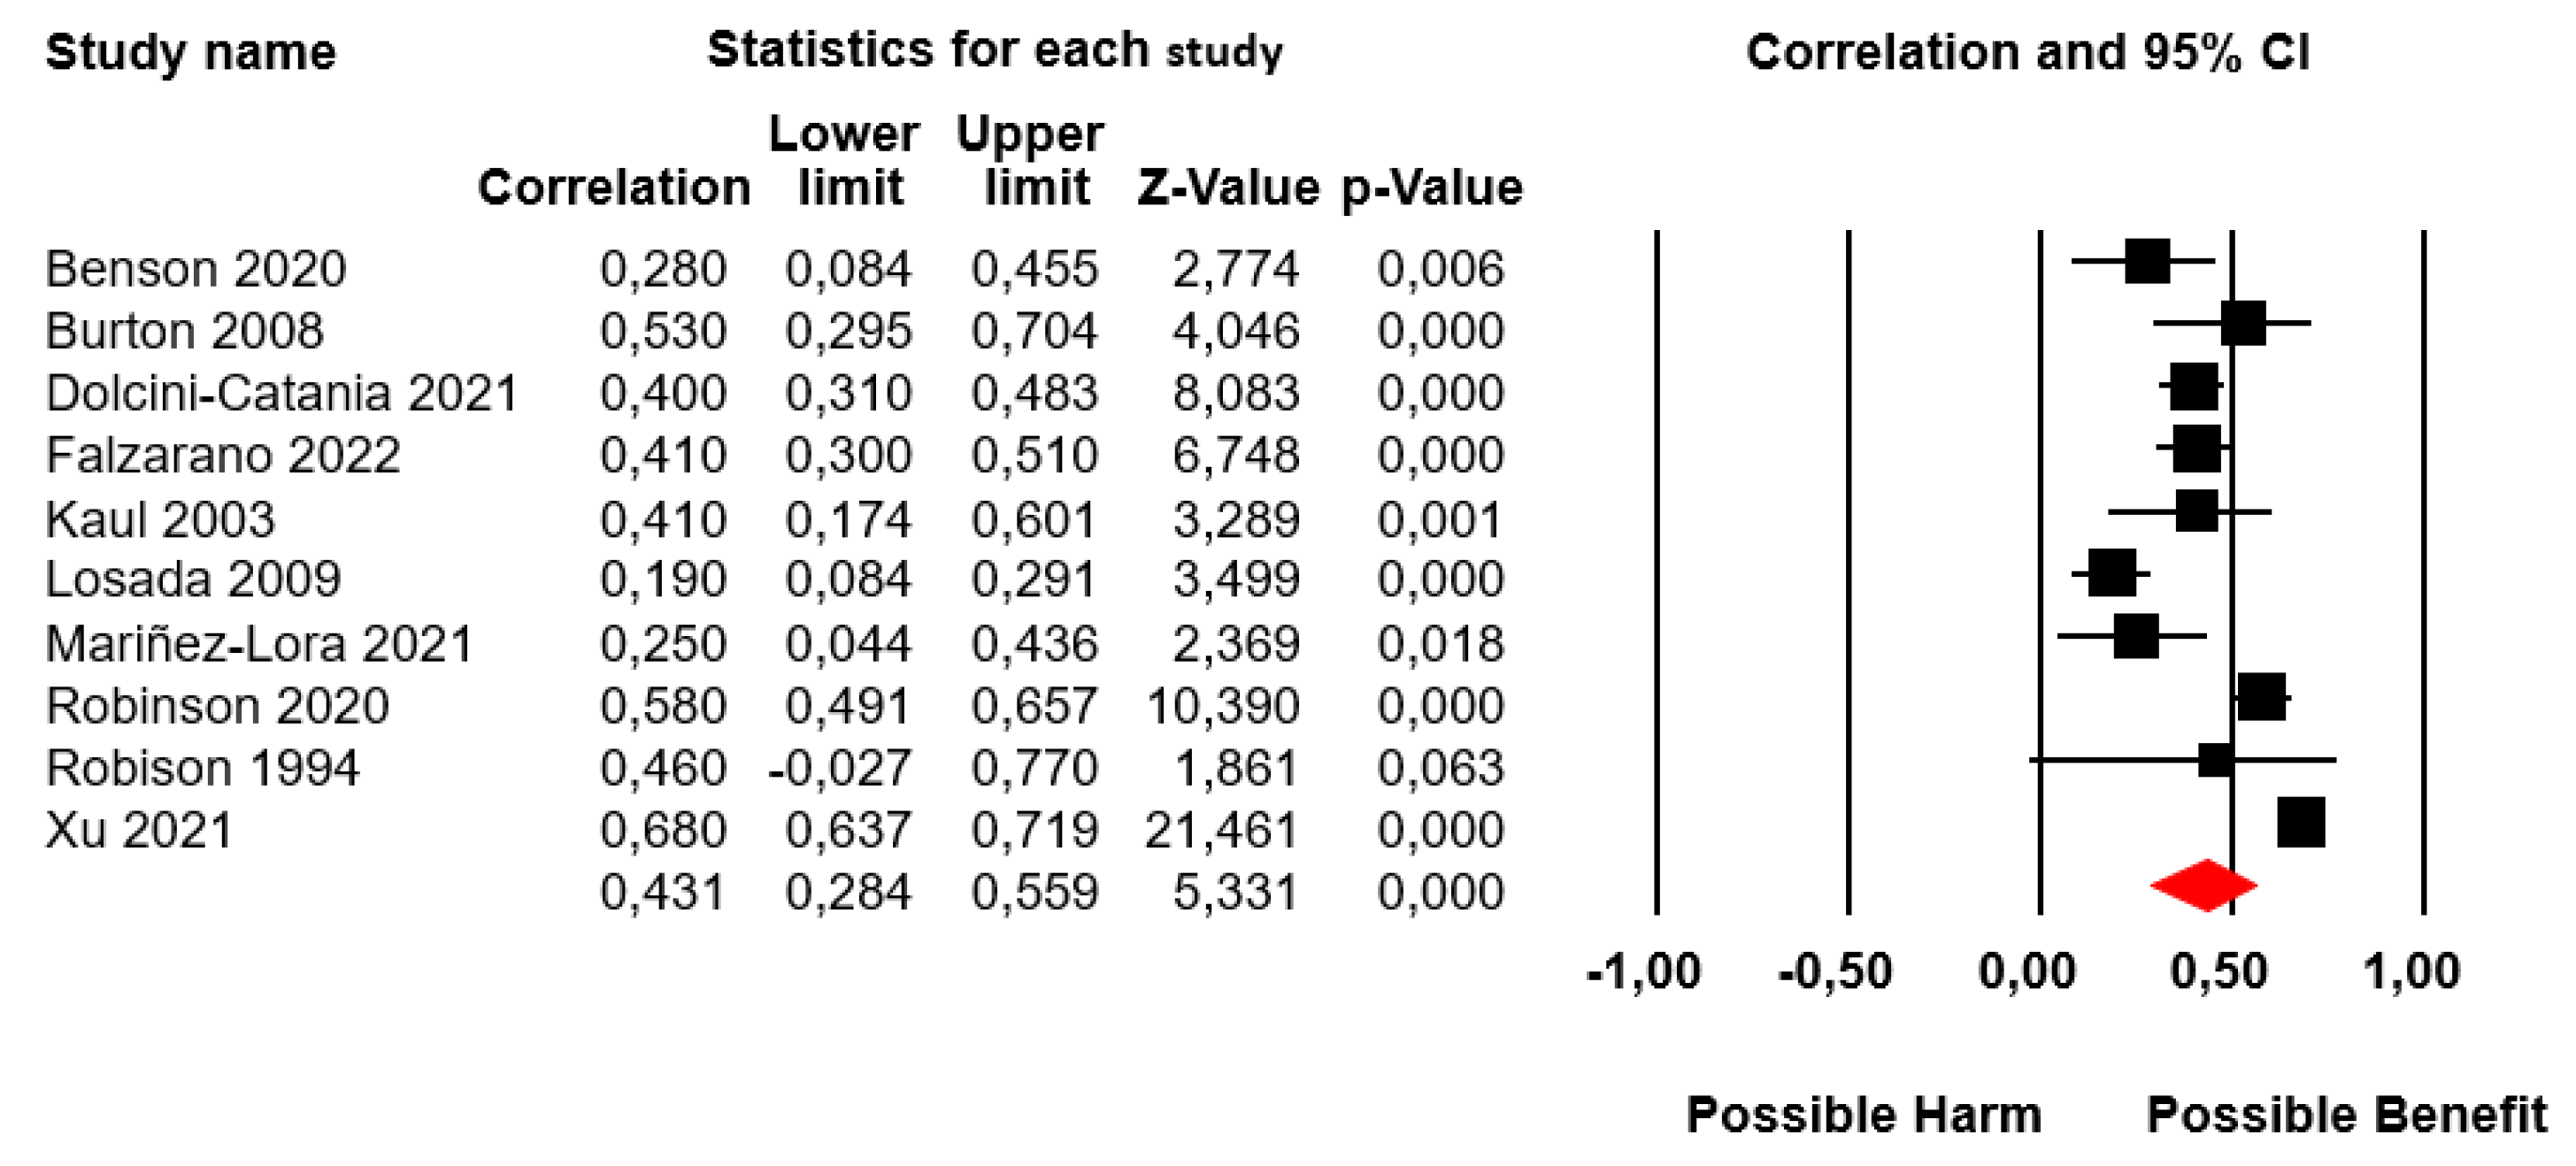
Figure 3.
Funnel plot for perceived social support and received social support.


Table 1.
Characteristics of the included studies.
| Study (Author-Year) Country |
N | Mean Age (SD) and Range |
Percentage of Female (%) |
Design | Recipients of Care |
Measure of Perceived Social Support * |
Measure of Received Social Support** |
|---|---|---|---|---|---|---|---|
| Benson 2020 [30] USA |
96 | 41.9 (5.04) 30-55 |
100 | Repeated measures with cross-sectional correlations | Autism Children |
MSPSS | ISSB |
| Burton 2008 [31] USA |
50 | 72.8 (10.2) NA |
80 | Cross-sectional | Cancer and dementia Adult |
Borrowski-cark | Krause |
| Dolcini-Catania 2021 [32] USA |
367 | NA | 95 | Cross-sectional | behavioral problems Children |
GLS | GLS |
| Falzarano 2022 [33] USA |
243 | 60.97 (11.91) 20-95 |
NA | Cross-sectional | Frail older people Adult |
Krausse | ISSB |
| Kaul 2003 [34] USA |
60 | 28 (NA) NA |
100 | Cross-sectional | Heart problems Children |
SPS | ISSB |
| Losada 2009 [35] Spain |
334 | 58.6 (12.9) 28-85 |
77.8 | Cross-sectional | Dementia Adults |
PSQ | PSQ |
| Mariñez-Lora 2021 [15] USA |
89 | 32 (7.9) 20-53 |
100 | Cross-sectional | Mental illness Children |
NSSQ | ISSQ |
| Robinson 2020 [36] Canada |
249 | 44 (6.2) 27-64 |
95.6 | Cross-sectional | Autism Children |
SPS | ISSB |
| Robison 1994 [37] Georgia |
17 | 63.5 (NA) 52-80 |
100 | Cross-sectional | Dementia Adults |
GSS | SNL-A |
| Xu 2023 [38] USA |
637 | 60.5 (13.3) 23-90 |
82.9 | Cross-sectional | Dementia Adults |
Lubben | Ad-hoc |
*MSPSS: Multidimensional Scale of Perceived Social Support, GLS: General Life Satisfaction, SPS: Social Provisions Scale, PSQ: Psychosocial Support Questionnaire, NSSQ: Norbeck Social Support Questionnaire at baseline, GSS: Global Satisfaction Scale. **Inventory of Socially Supportive Behaviors, PSQ: Psychosocial Support Questionnaire, ISSQ: Inventory of Socially Supportive Behaviors, GLS: General Life Satisfaction, SNL-A: Social Network list (current contact).
Table 2.
Quality evaluation.
| Author and year | Selection | Classification | Confounding |
|---|---|---|---|
| Benson 2020 [30] | - | + | - |
| Burton 2008 [31] | - | + | + |
| Dolcini-Catania 2021 [32] | + | + | - |
| Falzarano 2022 [33] | - | + | + |
| Kaul 2003 [34] | - | + | - |
| Losada 2009 [35] | - | + | - |
| Mariñez-Lora 2021 [15] | + | + | - |
| Robinson 2020 [36] | - | + | - |
| Robison 1994 [37] | - | + | - |
| Xu 2023 [38] | - | + | - |
Disclaimer/Publisher’s Note: The statements, opinions and data contained in all publications are solely those of the individual author(s) and contributor(s) and not of MDPI and/or the editor(s). MDPI and/or the editor(s) disclaim responsibility for any injury to people or property resulting from any ideas, methods, instructions or products referred to in the content. |
© 2024 by the authors. Licensee MDPI, Basel, Switzerland. This article is an open access article distributed under the terms and conditions of the Creative Commons Attribution (CC BY) license (http://creativecommons.org/licenses/by/4.0/).
Copyright: This open access article is published under a Creative Commons CC BY 4.0 license, which permit the free download, distribution, and reuse, provided that the author and preprint are cited in any reuse.


