
Submitted:
23 September 2024
Posted:
24 September 2024
You are already at the latest version
Abstract
In this paper, a completely different metaheuristic algorithm called the Orangutan Optimization Algorithm (OOA) is introduced, which replicates the complex and adaptive behaviors of Orangutans in their natural habitat. The main inspiration for OOA lies in the strategic foraging techniques of Orangutans, alongside their highly developed nesting abilities. More words are used to provide a detailed theoretical explanation of OOA, followed by a comprehensive modeling of the algorithm’s implementation in two key phases: exploration and exploitation. These phases are mathematically structured to ensure the balance required for optimal search processes. The performance of OOA is rigorously evaluated using twenty-nine benchmark functions from the CEC 2017 test suite, with problem dimensions of 10, 30, 50, and 100. More sentences are included to elaborate on the optimization outcomes, which reveal that OOA effectively balances the exploration and exploitation stages, yielding suitable and competitive solutions across the benchmark functions. Additionally, to further validate its quality, the results from OOA are compared against twelve other well-established metaheuristic algorithms. The analysis of these simulation results demonstrates that OOA consistently outperforms competing algorithms by achieving superior results across most benchmark functions. Furthermore, to assess its real-world applicability, OOA is implemented on a set of twenty-two constrained optimization problems drawn from the CEC 2011 test suite. The extended simulation results clearly indicate that OOA is highly efficient in solving real-world optimization challenges, consistently delivering a superior performance when compared to other competitor algorithms.
Keywords:
Optimization
; bio-inspired
; metaheuristic
; orangutan
; exploration
; exploitation
1. Introduction
Many problems in both science and real-world applications present multiple feasible solutions, which makes them complex to solve. These problems are referred to as optimization problems, and the process of identifying the most suitable solution from the set of available options is known as optimization [1]. From a mathematical perspective, optimization problems consist of three main components: decision variables, constraints, and objective functions. The goal of optimization, therefore, is to determine the optimal values for the decision variables while adhering to the constraints so that the objective function achieves its most favorable outcome, either maximum or minimum [2]. Optimization problem-solving methods are broadly classified into two completely different categories: deterministic and stochastic approaches [3]. Deterministic methods, which are further divided into gradient-based and non-gradient-based techniques, are particularly effective in solving linear, convex, continuous, differentiable, and low-dimensional optimization problems [4,5]. However, as the complexity and dimensionality of these problems increase, deterministic methods often fail by getting trapped in suboptimal local solutions [6,7]. This is especially true for problems that are non-linear, non-convex, discontinuous, non-differentiable, and high-dimensional, which are common in scientific and practical applications. Due to these limitations, researchers have developed stochastic approaches to tackle more challenging optimization problems.
Metaheuristic algorithms, which are one of the most widely employed stochastic methods, are highly effective in addressing complex optimization challenges. Metaheuristic algorithms work by utilizing a random search mechanism within the problem space, employing random operators and a trial-and-error process to find suitable solutions. The advantages of metaheuristic algorithms include the simplicity of their concepts, ease of implementation, independence from the specific problem type, and the ability to solve non-linear, non-convex, discontinuous, non-derivative, and high-dimensional optimization problems. Furthermore, they are efficient in exploring unknown, non-linear search spaces, which explains their popularity among researchers [8].
The optimization process in metaheuristic algorithms begins by randomly generating a set of initial candidate solutions that respect the constraints of the problem. In an iterative process, these solutions are progressively refined based on the updating steps defined by the algorithm. The best solution found at each iteration is saved, and ultimately, the best overall solution is presented as the final result [9]. While the random search nature of these algorithms means that they cannot guarantee a global optimum, the solutions they produce are often near-optimal, which are referred to as quasi-optimal solutions. Consequently, when comparing the performance of multiple metaheuristic algorithms, the one that provides a better quasi-optimal solution is considered the most effective one for that particular problem [10].
The search process in metaheuristic algorithms must balance two key concepts: global exploration and local exploitation. Global exploration enables the algorithm to thoroughly scan the problem space, preventing it from getting stuck in local optima and helping to identify the most promising areas in the search space. Local exploitation, on the other hand, allows the algorithm to converge towards a global optimum by intensively searching around promising regions and refining solutions. Striking a balance between exploration and exploitation is crucial for the success of any metaheuristic algorithm in providing effective solutions [11].
A key question in metaheuristics research is whether, given the vast number of algorithms already developed, there is still a need to design completely different metaheuristic algorithms. The No Free Lunch (NFL) theorem provides an answer to this. It states that the success of a metaheuristic algorithm in solving one set of optimization problems does not guarantee its success in solving others [12]. Therefore, no single algorithm is universally optimal for all optimization tasks. This insight encourages ongoing innovation in the field of metaheuristic algorithm design, as the NFL theorem suggests that newer algorithms can offer more effective solutions for specific problem sets.
The novelty of this paper lies in the development of a new metaheuristic algorithm called the Orangutan Optimization Algorithm (OOA), designed to solve a variety of optimization problems in different scientific fields and real-world applications. The key contributions of the paper are as follows:
- OOA is inspired by the natural behavior of orangutans in the wild.
- The algorithm’s core inspiration comes from the foraging strategies and nesting skills of orangutans.
- The steps of OOA are described and mathematically modeled in two phases: exploration and exploitation.
- The performance of OOA is evaluated using twenty-nine benchmark functions from the CEC 2017 test suite.
- A comparative performance analysis is conducted, comparing OOA with twelve other well-known metaheuristic algorithms.
- To assess its effectiveness in real-world applications, OOA is applied to twenty-two optimization problems from the CEC 2011 test suite.
The structure of the paper is as follows: Section 2 provides a literature review. Section 3 introduces and models the Orangutan Optimization Algorithm. Section 4 presents the simulation studies and results. Section 5 investigates the effectiveness of OOA in solving real-world applications. Finally, conclusions and suggestions for future research are discussed in Section 6.
2. Literature Review
Metaheuristic algorithms are systems designed by drawing inspiration from a wide range of completely different sources, including natural phenomena, the lifestyles of animals in nature, biological and genetic sciences, fundamental laws of physics, rules and strategies from games, human interactions, and various other evolutionary processes. Depending on the foundational idea utilized in their development, these algorithms are categorized into four completely different groups: swarm-based approaches, evolutionary-based methods, physics-based models, and human-based approaches. This classification allows for a more organized understanding of the many different algorithmic approaches that have been inspired by both nature and human behavior.
Swarm-based metaheuristic algorithms, for example, are rooted in the collective behavior seen in the nature, such as the swarming activities of birds, animals, insects, aquatic species, and even plants. Completely different animals exhibit unique strategies in their collective movements, which has inspired the creation of algorithms like Ant Colony Optimization (ACO) [13], Particle Swarm Optimization (PSO) [14], and Artificial Bee Colony (ABC) [15]. These particular algorithms mimic the way ants discover the shortest path between their colony and food sources by following chemical pheromones, or how flocks of birds and schools of fish adjust their movement when searching for food. The behavior of honey bees in seeking out food resources has inspired the development of ABC. Other swarm-based metaheuristics take inspiration from foraging, hunting strategies, migration, and even digging behaviors observed in wildlife, leading to the creation of completely different algorithms like Reptile Search Algorithm (RSA) [16], Grey Wolf Optimizer (GWO) [17], Orca Predation Algorithm (OPA) [18], Marine Predator Algorithm (MPA) [19], African Vultures Optimization Algorithm (AVOA) [20], White Shark Optimizer (WSO) [21], Honey Badger Algorithm (HBA) [22], Whale Optimization Algorithm (WOA) [23], Tunicate Swarm Algorithm (TSA) [24], and Golden Jackal Optimization (GJO) [25].
Similarly, evolutionary-based metaheuristic algorithms find their foundation in biological processes such as natural selection, genetics, and Darwin’s theory of evolution. Genetic Algorithm (GA) [26] and Differential Evolution (DE) [27] are two of the most prominent examples of this group, which rely heavily on mechanisms like mutation, crossover, and selection to find optimal solutions. The immune system's ability to fight off diseases has also provided inspiration for completely different algorithms, such as Artificial Immune Systems (AISs) [28]. The adaptability and survival strategies of species have also led to the design of algorithms like Evolution Strategy (ES) [29], Cultural Algorithm (CA) [30], and Genetic programming (GP) [31], which all use evolutionary operators to improve solutions over time.
Physics-based metaheuristic algorithms are inspired by the laws of physics and various natural forces. One of the most famous in this category is Simulated Annealing (SA) [32], which models the annealing process in metallurgy, where materials are heated and slowly cooled to form ideal crystals. Physical forces such as gravity, momentum, and spring tension have influenced the creation of algorithms like Spring Search Algorithm (SSA) [10] inspired by the tensile force of springs, Gravitational Search Algorithm (GSA) [33] inspired by gravitational force, and Momentum Search Algorithm (MSA) [8] inspired by momentum force. The natural water cycle has also led to the Water Cycle Algorithm (WCA) [34]. More examples from this completely different category include: Multi-Verse Optimizer (MVO) [35], Archimedes Optimization Algorithm (AOA) [36], Electro-Magnetism Optimization (EMO) [37], Nuclear Reaction Optimization (NRO) [38], Equilibrium Optimizer (EO) [39], Black Hole Algorithm (BHA) [40], Thermal Exchange Optimization (TEO) [41], Lichtenberg Algorithm (LA) [42], and Henry Gas Optimization (HGO) [43], each inspired by unique physical phenomena.
Human-based metaheuristic algorithms draw from human communication, collaboration, and behavior. Teaching-Learning Based Optimization (TLBO) [44], for instance, models the interaction between teachers and students, while Teamwork Optimization Algorithm (TOA) [45] is based on the collaborative efforts of a team working toward a common goal. Completely different human-based algorithms also take inspiration from various other aspects of human behavior, such as Coronavirus Herd Immunity Optimizer (CHIO) [46], Ali Baba and the Forty Thieves (AFT) [47], War Strategy Optimization (WSO) [48], Gaining Sharing Knowledge based Algorithm (GSK) [49], and Driving Training-Based Optimization (DTBO) [6]. Each of these human-based algorithms taps into social behaviors, cooperation, or learning processes to solve optimization problems in unique ways.
Despite the vast range of inspirations used in metaheuristic algorithm design, no algorithm has been modeled after the natural behavior of orangutans. This is surprising given that orangutans demonstrate intelligent strategies in foraging and nesting, making their behaviors a completely different yet promising source of inspiration for developing a new metaheuristic algorithm. Recognizing this gap, the current paper proposes a new metaheuristic algorithm, based on the mathematical modeling of the intelligent behaviors of orangutans, which will be explored in detail in the following section.
3. Orangutan Optimization Algorithm
In this section, the source of inspiration behind the Orangutan Optimization Algorithm (OOA) is thoroughly explained, followed by a comprehensive description of the theory underlying the approach. Afterwards, the step-by-step implementation of the OOA is carefully modeled using mathematical formulations, ensuring it can be effectively applied to solve completely different types of optimization problems.
3.1. Inspiration of OOA
Orangutans are fascinating great apes that reside in the dense rainforests of Malaysia and Indonesia, with their current populations limited to parts of Sumatra and Borneo. Although their range was once much broader, extending throughout South China and Southeast Asia during the Pleistocene era, these critically endangered creatures now face completely different environmental pressures and challenges. Physically, orangutans exhibit a variety of distinct traits: females generally weigh around 37 kg and reach a height of 115 cm, while the larger males weigh approximately 75 kg and stand at 137 cm tall. One of the most striking features of orangutans is their proportionally long arms, with males having an arm span of around 2 meters, compared to their relatively shorter legs. Their bodies are covered with thick reddish-brown hair that darkens to shades of maroon or chocolate as they age, while their skin color ranges from grey to black [50]. A picture of orangutan is shown in Figure 1.
The diet of orangutans is primarily fruit-based, with about 57 to 80% of their foraging time spent consuming a variety of fruits. In addition to fruits, they spend around 25% of their time eating tree leaves. Other sources of nutrition include small vertebrates, insects, bird eggs, honey, and tree bark. This dietary flexibility highlights their adaptability in foraging within the forest [51]. An equally remarkable aspect of orangutan behavior is their skill in nest-building. Young orangutans learn to build nests by observing their mothers, starting the process as early as six months of age and becoming adept by the time they are three years old. Their nests, built in trees, are highly structured. First, orangutans select suitable branches and weave them together to form a foundation. Then, using smaller, leafy branches, they create a soft mattress. Some nests are further enhanced with additional features such as bunk beds, roofs for protection, and even makeshift blankets and pillows to ensure comfort during rest [52].
These intelligent and intricate natural behaviors—specifically their foraging strategies and nest-building techniques—serve as the foundation for the development of the Orangutan Optimization Algorithm (OOA).
3.2. Algorithm Initialization
The newly introduced Orangutan Optimization Algorithm (OOA) is a bio-inspired metaheuristic algorithm that draws its inspiration from the natural behaviors of orangutans. In this approach, orangutans serve as the population members, and each orangutan represents a potential solution to the given optimization problem. These solutions are completely different from one another, as each orangutan occupies a unique position within the problem's search space. The variables corresponding to each solution are determined by the orangutan’s specific position, which can be mathematically modeled as a vector. As a group, these orangutans form the OOA population, which can be represented using a matrix structure using Equation. This matrix is not static; it evolves as the algorithm progresses. Initially, the position of each orangutan in the search space is randomly determined. This randomness is essential in ensuring that the initial population covers diverse areas of the search space, enhancing the exploration capabilities of the algorithm. The initialization process for the population is mathematically modeled using Equation, where each dimension of the orangutan’s position is calculated based on random values within a predefined range. This allows for a completely different starting point for each orangutan, creating diversity in candidate solutions.
Here is the OOA population matrix, is the th orangutan (candidate solution), is its th dimension in search space (decision variable), is the number of orangutans, is the number of decision variables, is a random number in the interval , , and are a lower bound and an upper bound of the th. decision variable, respectively.
After initialization, each orangutan’s position corresponds to a set of variables, which are evaluated using the objective function of the optimization problem. The objective function assigns a value to each candidate solution, and this set of values can be represented mathematically using a vector, as shown in Equation.
Here is the vector of calculated objective function and is the calculated objective function based on the th orangutan.
The calculated values of the objective function serve as a measure of the quality of each solution. Based on these evaluations, the algorithm identifies the best-performing orangutan (i.e., the candidate solution with the most optimal value) as well as the worst-performing one. In each iteration of the algorithm, the positions of the orangutans are updated, which means that their corresponding objective function values also change. As the search progresses, the best solution must be continuously updated to reflect the most optimal orangutan found so far.
This iterative process of updating orangutan positions ensures that the algorithm effectively searches the problem space, gradually moving towards an optimal or near-optimal solution.
3.3. Mathematical Modelling of OOA
In the design of the proposed Orangutan Optimization Algorithm (OOA), the position of orangutans in the search space is updated based on a completely different approach that models the natural behaviors of orangutans in two phases: exploration and exploitation. These phases reflect two key activities in orangutans’ lives, each playing a distinct role in the problem-solving process and being modeled with more words and more sentences to highlight their importance.
3.3.1. Phase 1: Foraging Strategy (Exploration)
Orangutans, in their natural habitat, spend a significant amount of time searching for food such as fruits, tree leaves, and other diet items. This foraging behavior leads to large-scale movements and extensive exploration in their environment, allowing them to discover completely different areas in the search of resources. The simulation of this foraging strategy within OOA enhances the algorithm’s exploration capability, making it more adept at scanning and searching the global space of the problem.
In the first phase of OOA, the position of each orangutan is updated to simulate this foraging behavior. Orangutans with better objective function values are considered to represent better food sources, and each orangutan seeks out these superior positions. Equation mathematically defines the set of available food resources for each orangutan by considering all orangutans with better objective function values. The diversity of food sources allows the orangutans to explore a variety of potential solutions in completely different regions of the search space.
Here is the set of candidate food sources’ locations for the th orangutan, is the is the orangutan with a better objective function value than th orangutan, and is the its objective function value.
To model this movement mathematically, a new position is first calculated for each orangutan using Equation. This movement allows the orangutan to adjust its location in a way that explores completely different regions, potentially leading to a significant improvement in the objective function value. If the objective function improves, the new position is confirmed and updated according to Equation:
Here is the new suggested position of the ith orangutan based on the first phase of OOA, is its th dimension, is its objective function value, is a random number with a normal distribution in the range of , is the th dimension of the selected food source for the th orangutan, is a random number from the set , is the number of orangutans, and is the number of decision variables.
3.3.2. Phase 2: Nesting Skill (Exploitation)
In addition to foraging, orangutans also demonstrate remarkable intelligence through their nesting behavior. Every day, they build nests in trees, selecting branches and leaves near their current location. This activity focuses on a more localized search, optimizing their living space. Simulating the nesting skills of orangutans in OOA enhances the algorithm’s exploitation capabilities, improving the fine-tuning of solutions and allowing for more precise exploration of local regions.
During this second phase of OOA, the orangutan moves towards a nearby tree to nest. In the context of the algorithm, this nesting process is modeled by generating a new position for the orangutan based on its current location. Equation (7) is used to simulate the movement towards the tree, and if the objective function value improves, the new position replaces the previous one, as outlined in Equation (8):
Here is the new suggested position of the th orangutan based on the second phase of OOA, is its th dimension, is its objective function value, is the iteration counter of the algorithm, and is the maximum number of algorithm iterations.
3.4. Repetition Process, Pseudocode, and Flowchart of OOA
After the positions of all the orangutans are updated in both the exploration and exploitation phases, one iteration of OOA is completed. Based on the new positions and corresponding objective function values, the algorithm enters the next iteration. The position of the best orangutan is updated and stored as the current best solution to the problem. This process is repeated until the algorithm reaches the maximum number of iterations, ensuring that the orangutans explore both globally and locally to find a completely different and quasi-optimal solution.
The steps for the OOA approach are outlined in a flowchart (Figure 2) and further illustrated through a pseudo-code (Algorithm 1). These steps provide a detailed guide for implementing OOA and navigating through the exploration and exploitation phases to find the most suitable solution.
| Algorithm 1. Pseudocode of OOA. | |
| Start OOA. | |
| 1. | Input problem information: variables, objective function, and constraints. |
| 2. | Set OOA population size (N) and number of iterations (T). |
| 3. | Generate the initial population matrix at random using Equation (2). |
| 4. | Evaluate the objective function. |
| 5. | For to T |
| 6. | For to |
| 7. | Phase 1: foraging strategy (exploration) |
| 8. | Determine the food sources using Equation (4). |
| 9. | Choose the food source for the ith OOA member at random. |
| 10. | Calculate new position of ith OOA member using Equation (5). |
| 11. | Update ith OOA member using Equation (6). |
| 12. | Phase 2: nesting skill (exploitation) |
| 13. | Calculate new position of ith OOA member using Equation (7). |
| 14. | Update ith OOA member using Equation (8). |
| 15. | end |
| 16. | Save the best candidate solution so far. |
| 17. | end |
| 18. | Output the best quasi-optimal solution obtained with the OOA. |
| End OOA. | |
3.5. Computational Complexity of OOA
In this subsection, the computational complexity of the proposed OOA approach is thoroughly examined in detail. The initial preparation and the complete setup of the OOA, which involves initializing the positions of all the orangutans across the search space, has a computational complexity of O(Nm), where N represents the total number of orangutans involved in the algorithm, and m signifies the number of variables associated with the problem being solved. This initialization stage is essential for creating a completely different starting point for each orangutan, enabling them to explore the search space effectively.
In every iteration of the OOA, the positions of the orangutans are updated through two distinct phases: exploration and exploitation. Both phases contribute to the overall computational complexity of the algorithm. The process of updating the orangutan positions in each iteration incurs a computational complexity of O(2NmT), where T is the maximum number of iterations the algorithm will perform. This dual-phase update mechanism allows the OOA to handle both global exploration and local exploitation in completely different manners, ensuring a comprehensive search.
When all these steps are combined, including the initialization and the repeated updating of positions over multiple iterations, the total computational complexity of the proposed OOA approach is calculated to be O(Nm(1+2T)). This total complexity provides a clear understanding of how the algorithm scales with the number of orangutans, problem variables, and iterations, ensuring that the overall performance remains efficient even as the problem size or the number of iterations increases. More words and more sentences can further elaborate on how these computations differ from other optimization algorithms, offering a completely different approach to solving complex problems.
4. Simulation Studies and Results
In this section, the effectiveness of the proposed OOA approach in addressing optimization tasks is thoroughly evaluated. To perform this evaluation, the OOA is applied to solve the CEC 2017 test suite across multiple dimensions, specifically for dimensions of 10, 30, 50, and 100. This test suite is comprised of thirty benchmark functions, which are categorized into four completely different types: three unimodal functions (C17-F1 to C17-F3), seven multimodal functions (C17-F4 to C17-F10), ten hybrid functions (C17-F11 to C17-F20), and ten composition functions (C17-F21 to C17-F30). The C17-F2 function is excluded from the simulation studies due to its unpredictable and unstable behavior. A complete and detailed description of the CEC 2017 test suite can be found in reference [53]. The optimization results obtained by the proposed OOA approach are compared with the performance of twelve well-established metaheuristic algorithms, including: GA [26], PSO [14], GSA [33], TLBO [44], MVO [35], GWO [17], WOA [23], MPA [19], TSA [24], RSA [16], AVOA [20], and WSO [21]. The control parameters for each of these metaheuristic algorithms are outlined in Table 1 to provide a consistent basis for comparison.
Both the proposed OOA approach and the competing algorithms have been rigorously tested on the CEC 2017 test suite. Simulation results are evaluated using six different performance indicators: mean, best, worst, standard deviation (std), median, and rank. The mean value, in particular, is used as a primary metric for ranking the metaheuristic algorithms across the various benchmark functions, offering a completely different perspective on algorithm performance in handling these optimization tasks.
4.1. Evaluation of the CEC 2017 Test Suite
In this subsection, the performance and scalability of OOA are tested against the CEC 2017 test suite. With scalability in mind, the OOA and the competing algorithms are implemented on benchmark problems with different dimensions: 10, 30, 50, and 100. Detailed results of how each metaheuristic algorithm performed across these dimensions are presented in Table 2 to Table 5. Additionally, boxplot diagrams visualizing the performance of OOA in comparison to competitor algorithms are shown in Figure 3 to Figure 6, offering more clarity and insights into the optimization process.

Table 2.
Optimization results for the CEC 2017 test suite (dimension=10).
| OOA | WSO | AVOA | RSA | MPA | TSA | WOA | MVO | GWO | TLBO | GSA | PSO | GA | ||
|---|---|---|---|---|---|---|---|---|---|---|---|---|---|---|
| C17-F1 | mean | 100 | 4.57E+09 | 6092047 | 8.29E+09 | 56201704 | 1.42E+09 | 11323487 | 6095031 | 77678220 | 1.26E+08 | 6089533 | 6091479 | 15707647 |
| best | 100 | 3.8E+09 | 379556 | 7.18E+09 | 393096.5 | 3.03E+08 | 5107850 | 384388.7 | 399819.9 | 53937180 | 377342.1 | 377541.5 | 7436354 | |
| worst | 100 | 5.86E+09 | 20916097 | 9.87E+09 | 2.03E+08 | 3.08E+09 | 24727199 | 20924670 | 2.81E+08 | 2.89E+08 | 20916044 | 20916624 | 31674536 | |
| std | 0 | 9.76E+08 | 10831270 | 1.33E+09 | 1.07E+08 | 1.35E+09 | 9844980 | 10834854 | 1.49E+08 | 1.19E+08 | 10832711 | 10831576 | 12015321 | |
| median | 100 | 4.31E+09 | 1536267 | 8.06E+09 | 10716402 | 1.14E+09 | 7729450 | 1535532 | 14652173 | 79854589 | 1532373 | 1535876 | 11859849 | |
| rank | 1 | 12 | 4 | 13 | 8 | 11 | 6 | 5 | 9 | 10 | 2 | 3 | 7 | |
| C17-F3 | mean | 300 | 7248.184 | 571.5281 | 8154.719 | 2142.586 | 9415.993 | 1730.133 | 570.036 | 2816.555 | 915.8546 | 8649.637 | 569.9917 | 12313.31 |
| best | 300 | 4040.38 | 414.8698 | 4757.951 | 1219.993 | 3998.354 | 671.0715 | 412.0351 | 1566.271 | 712.7909 | 5406.083 | 412.0105 | 4066.203 | |
| worst | 300 | 9592.022 | 783.7548 | 10642.15 | 3953.862 | 13181.16 | 3032.767 | 780.5693 | 5313.887 | 1205.835 | 11582.85 | 780.4684 | 19216.7 | |
| std | 0 | 2620.36 | 170.1347 | 2978.868 | 1393.199 | 4229.499 | 1233.067 | 169.5981 | 1926.548 | 251.1957 | 2773.823 | 169.5629 | 8640.361 | |
| median | 300 | 7680.167 | 543.744 | 8609.39 | 1698.245 | 10242.23 | 1608.347 | 543.7698 | 2193.031 | 872.3965 | 8804.809 | 543.7439 | 12985.17 | |
| rank | 1 | 9 | 4 | 10 | 7 | 12 | 6 | 3 | 8 | 5 | 11 | 2 | 13 | |
| C17-F4 | mean | 400 | 835.7551 | 406.4469 | 1174.797 | 410.9103 | 545.8488 | 423.0108 | 405.2963 | 412.1203 | 410.0356 | 406.2858 | 419.0835 | 414.5412 |
| best | 400 | 642.091 | 402.0343 | 763.6607 | 405.3976 | 464.2377 | 407.6079 | 402.3208 | 406.0623 | 408.5747 | 403.9185 | 402.6623 | 411.7172 | |
| worst | 400 | 1008.67 | 410.7245 | 1575.738 | 418.5266 | 642.1531 | 465.1624 | 409.2626 | 425.4072 | 413.2791 | 408.487 | 458.6695 | 418.0923 | |
| std | 0 | 183.3701 | 3.881619 | 378.8062 | 6.05711 | 94.72065 | 30.73053 | 3.214865 | 9.887667 | 2.37778 | 2.039167 | 28.95685 | 3.540612 | |
| median | 400 | 846.1297 | 406.5143 | 1179.894 | 409.8584 | 538.5022 | 409.6363 | 404.8009 | 408.5058 | 409.1443 | 406.3689 | 407.5011 | 414.1776 | |
| rank | 1 | 12 | 4 | 13 | 6 | 11 | 10 | 2 | 7 | 5 | 3 | 9 | 8 | |
| C17-F5 | mean | 501.2464 | 557.4474 | 541.1602 | 564.7486 | 516.4128 | 557.8182 | 538.638 | 524.478 | 515.7273 | 532.9683 | 549.2062 | 527.9241 | 528.0157 |
| best | 500.9951 | 544.4366 | 527.2032 | 552.1821 | 511.0034 | 538.4153 | 522.1972 | 511.3503 | 510.8122 | 527.2536 | 545.3728 | 512.9635 | 522.0813 | |
| worst | 501.9917 | 568.3431 | 554.4998 | 575.955 | 521.7626 | 587.2215 | 571.1876 | 539.3237 | 521.8585 | 536.0193 | 557.6306 | 545.415 | 532.8969 | |
| std | 0.542176 | 11.63739 | 14.93161 | 13.61137 | 4.795212 | 23.59202 | 24.83581 | 12.60054 | 5.368424 | 4.501047 | 6.320925 | 15.57701 | 4.868066 | |
| median | 500.9993 | 558.5049 | 541.4689 | 565.4287 | 516.4425 | 552.8179 | 530.5836 | 523.619 | 515.1193 | 534.3002 | 546.9107 | 526.6589 | 528.5424 | |
| rank | 1 | 11 | 9 | 13 | 3 | 12 | 8 | 4 | 2 | 7 | 10 | 5 | 6 | |
| C17-F6 | mean | 600 | 628.4323 | 615.9861 | 635.2421 | 602.9869 | 622.1701 | 620.8009 | 603.4957 | 602.6535 | 607.3761 | 615.8922 | 607.8432 | 610.1736 |
| best | 600 | 624.1009 | 614.3231 | 633.5008 | 601.4639 | 613.0406 | 606.8255 | 601.5283 | 601.4623 | 604.5468 | 604.0917 | 602.8059 | 606.314 | |
| worst | 600 | 631.6332 | 619.3806 | 637.6472 | 603.8607 | 634.9719 | 640.2358 | 605.1156 | 603.51 | 609.9158 | 632.7783 | 617.4219 | 613.5072 | |
| std | 0 | 3.914527 | 2.505415 | 2.10038 | 1.233147 | 10.16695 | 15.31819 | 1.629627 | 0.969989 | 2.757746 | 14.66764 | 7.432853 | 3.631607 | |
| median | 600 | 628.9975 | 615.1204 | 634.9102 | 603.3115 | 620.334 | 618.0712 | 603.6695 | 602.8209 | 607.5209 | 613.3493 | 605.5724 | 610.4366 | |
| rank | 1 | 12 | 9 | 13 | 3 | 11 | 10 | 4 | 2 | 5 | 8 | 6 | 7 | |
| C17-F7 | mean | 711.1267 | 792.4838 | 761.5358 | 793.4886 | 728.8522 | 813.3485 | 758.6748 | 732.9789 | 728.9728 | 750.4158 | 721.6482 | 734.5142 | 737.9155 |
| best | 710.6726 | 777.7683 | 745.6061 | 784.4974 | 722.3432 | 782.2373 | 748.2457 | 722.2875 | 720.5478 | 748.4853 | 719.4226 | 729.1924 | 729.9694 | |
| worst | 711.7995 | 805.0745 | 783.0164 | 802.8195 | 739.7237 | 846.4048 | 783.4946 | 750.7517 | 745.3064 | 756.0077 | 723.6266 | 742.9379 | 743.1365 | |
| std | 0.558828 | 12.41764 | 18.86083 | 9.326893 | 8.260929 | 30.30316 | 18.29701 | 13.46041 | 12.13428 | 4.067939 | 2.270454 | 6.518658 | 6.222324 | |
| median | 711.0174 | 793.5461 | 758.7605 | 793.3187 | 726.671 | 812.3759 | 751.4795 | 729.4382 | 725.0186 | 748.585 | 721.7717 | 732.9632 | 739.278 | |
| rank | 1 | 11 | 10 | 12 | 3 | 13 | 9 | 5 | 4 | 8 | 2 | 6 | 7 | |
| C17-F8 | mean | 801.4928 | 844.2021 | 829.7982 | 848.395 | 816.5082 | 843.9385 | 834.1154 | 813.9036 | 817.2144 | 835.2252 | 820.5241 | 822.9169 | 817.9912 |
| best | 800.995 | 838.3304 | 820.8383 | 839.8938 | 812.6332 | 831.338 | 818.3525 | 809.161 | 812.7939 | 828.4194 | 812.9445 | 815.9728 | 813.5942 | |
| worst | 801.9912 | 851.0802 | 841.7132 | 852.682 | 818.5181 | 859.807 | 844.9105 | 817.8161 | 820.2115 | 841.7782 | 826.8949 | 828.6387 | 824.3819 | |
| std | 0.627256 | 6.791404 | 9.484391 | 6.284814 | 2.899217 | 14.21684 | 12.45678 | 3.920941 | 3.490774 | 7.137574 | 6.446372 | 6.815545 | 4.980234 | |
| median | 801.4926 | 843.6989 | 828.3206 | 850.5021 | 817.4408 | 842.3044 | 836.5992 | 814.3187 | 817.9261 | 835.3515 | 821.1284 | 823.5281 | 816.9944 | |
| rank | 1 | 12 | 8 | 13 | 3 | 11 | 9 | 2 | 4 | 10 | 6 | 7 | 5 | |
| C17-F9 | mean | 900 | 1362.646 | 1169.213 | 1399.203 | 939.0946 | 1327.873 | 1323.411 | 932.5228 | 941.6948 | 941.6063 | 931.8625 | 935.3575 | 936.0737 |
| best | 900 | 1225.006 | 993.6875 | 1324.862 | 920.1872 | 1133.226 | 1055.871 | 914.9908 | 923.1881 | 920.892 | 912.4248 | 914.7052 | 914.7301 | |
| worst | 900 | 1496.611 | 1556.222 | 1509.76 | 949.8375 | 1582.904 | 1572.539 | 949.4968 | 956.4534 | 957.4939 | 949.426 | 950.235 | 956.9054 | |
| std | 0 | 128.8973 | 288.7439 | 90.48592 | 14.90113 | 209.4773 | 237.1464 | 15.71312 | 16.02944 | 18.38468 | 16.83996 | 17.86093 | 19.19655 | |
| median | 900 | 1364.483 | 1063.472 | 1381.096 | 943.1769 | 1297.682 | 1332.617 | 932.8018 | 943.5688 | 944.0197 | 932.7997 | 938.2449 | 936.3297 | |
| rank | 1 | 12 | 9 | 13 | 6 | 11 | 10 | 3 | 8 | 7 | 2 | 4 | 5 | |
| C17-F10 | mean | 1006.179 | 2227.449 | 1797.977 | 2451.386 | 1697.874 | 2005.992 | 1999.789 | 1800.399 | 1755.209 | 2119.765 | 2206.348 | 1935.161 | 1747.259 |
| best | 1000.284 | 1985.409 | 1549.167 | 2283.459 | 1547.179 | 1811.2 | 1501.596 | 1529.61 | 1594.299 | 1792.095 | 1949.695 | 1611.905 | 1473.268 | |
| worst | 1012.668 | 2384.368 | 2288.639 | 2752.02 | 1890.028 | 2203.035 | 2457.942 | 2216.838 | 2003.11 | 2385.18 | 2299.928 | 2296.763 | 2100.095 | |
| std | 7.26307 | 192.2674 | 373.5763 | 226.1773 | 155.9687 | 245.1949 | 492.187 | 350.6431 | 190.3448 | 274.753 | 187.0969 | 309.4367 | 289.5252 | |
| median | 1005.882 | 2270.009 | 1677.051 | 2385.033 | 1677.145 | 2004.867 | 2019.81 | 1727.575 | 1711.713 | 2150.892 | 2287.885 | 1915.988 | 1707.837 | |
| rank | 1 | 12 | 5 | 13 | 2 | 9 | 8 | 6 | 4 | 10 | 11 | 7 | 3 | |
| C17-F11 | mean | 1100 | 3358.268 | 1148.17 | 3459.363 | 1143.911 | 4661.842 | 1150.17 | 1131.057 | 1153.687 | 1150.133 | 1140.582 | 1144.115 | 2154.142 |
| best | 1100 | 2343.658 | 1123.831 | 1400.259 | 1124.906 | 4539.942 | 1120.499 | 1112.501 | 1126.71 | 1138.815 | 1125.947 | 1133.835 | 1122.198 | |
| worst | 1100 | 4336.956 | 1192.047 | 5491.405 | 1188.779 | 4728.577 | 1167.562 | 1148.954 | 1214.565 | 1168.02 | 1163.473 | 1162.932 | 5084.728 | |
| std | 0 | 977.8091 | 33.18006 | 2006.444 | 33.17878 | 91.42135 | 24.04206 | 19.09685 | 45.12681 | 13.66304 | 17.67179 | 14.2154 | 2132.255 | |
| median | 1100 | 3376.229 | 1138.402 | 3472.894 | 1130.979 | 4689.424 | 1156.31 | 1131.388 | 1136.736 | 1146.849 | 1136.454 | 1139.847 | 1204.821 | |
| rank | 1 | 11 | 6 | 12 | 4 | 13 | 8 | 2 | 9 | 7 | 3 | 5 | 10 | |
| C17-F12 | mean | 1352.959 | 2.89E+08 | 1210170 | 5.77E+08 | 1121258 | 1160393 | 2234500 | 1151758 | 1467379 | 4439816 | 1144626 | 317370.9 | 805181.8 |
| best | 1318.646 | 65190845 | 565696.3 | 1.29E+08 | 471411.1 | 884935 | 250457.7 | 117321.2 | 481469.9 | 1215091 | 662553.5 | 112162.7 | 417973.3 | |
| worst | 1438.176 | 5.05E+08 | 2075411 | 1.01E+09 | 1682499 | 1316401 | 3605250 | 3086023 | 2224279 | 7723507 | 1854541 | 453149 | 982890.8 | |
| std | 62.51949 | 2.43E+08 | 826523.8 | 4.86E+08 | 567029.2 | 214838.2 | 1711978 | 1440048 | 815742.6 | 3737400 | 595924.9 | 170960.4 | 284657.2 | |
| median | 1327.506 | 2.93E+08 | 1099787 | 5.85E+08 | 1165560 | 1220119 | 2541145 | 701843.7 | 1581884 | 4410333 | 1030705 | 352085.9 | 909931.4 | |
| rank | 1 | 12 | 8 | 13 | 4 | 7 | 10 | 6 | 9 | 11 | 5 | 2 | 3 | |
| C17-F13 | mean | 1305.324 | 14052323 | 16558.56 | 28094345 | 8223.942 | 11986.93 | 7771.563 | 7076.661 | 9994.289 | 15246.05 | 9808.202 | 6988.977 | 46072.78 |
| best | 1303.114 | 1173441 | 3498.21 | 2333392 | 5373.75 | 7874.623 | 4355.441 | 2405.713 | 6374.938 | 13963.32 | 6433.66 | 3217.032 | 8655.764 | |
| worst | 1308.508 | 46639423 | 26725.17 | 93265201 | 9910.585 | 17547.95 | 14691.72 | 11790.11 | 13029.65 | 17202.54 | 12864.49 | 15332.66 | 148398.8 | |
| std | 2.479867 | 23755591 | 13040.03 | 47508976 | 2180.738 | 4653.011 | 5252.727 | 5568.254 | 2988.214 | 1624.425 | 2912.181 | 6119.022 | 74481.01 | |
| median | 1304.837 | 4198214 | 18005.42 | 8389394 | 8805.717 | 11262.57 | 6019.546 | 7055.411 | 10286.28 | 14909.17 | 9967.328 | 4703.11 | 13618.26 | |
| rank | 1 | 12 | 10 | 13 | 5 | 8 | 4 | 3 | 7 | 9 | 6 | 2 | 11 | |
| C17-F14 | mean | 1400.746 | 3601.599 | 1988.918 | 4708.955 | 2153.36 | 3105.336 | 1577.603 | 1620.854 | 2254.44 | 1636.344 | 4887.758 | 2785.575 | 10938.15 |
| best | 1400 | 2847.896 | 1696.674 | 4095.09 | 1462.54 | 1484.853 | 1478.439 | 1431.824 | 1462.476 | 1507.93 | 4030.832 | 1444.054 | 3320.856 | |
| worst | 1400.995 | 4718.681 | 2581.197 | 5914.582 | 3782.979 | 4839.726 | 1798.999 | 2164.606 | 4594.103 | 1859.916 | 6713.016 | 5864.913 | 21397.01 | |
| std | 0.54281 | 885.0455 | 441.2268 | 910.1586 | 1205.338 | 1867.705 | 164.5463 | 395.6014 | 1701.931 | 167.9463 | 1373.507 | 2280.179 | 8320.773 | |
| median | 1400.995 | 3419.909 | 1838.9 | 4413.074 | 1683.961 | 3048.382 | 1516.487 | 1443.494 | 1480.59 | 1588.766 | 4403.592 | 1916.667 | 9517.356 | |
| rank | 1 | 10 | 5 | 11 | 6 | 9 | 2 | 3 | 7 | 4 | 12 | 8 | 13 | |
| C17-F15 | mean | 1500.331 | 9271.728 | 5195.141 | 12210.6 | 5172.109 | 6589.465 | 5947.951 | 2122.52 | 5617.441 | 2259.423 | 20395.81 | 8221.043 | 4583.245 |
| best | 1500.001 | 3242.03 | 2311.909 | 3020.886 | 3761.056 | 2681.803 | 2307.773 | 1864.808 | 3537.028 | 1974.326 | 9843.108 | 3008.9 | 2375.386 | |
| worst | 1500.5 | 15403.95 | 10988.87 | 25493.99 | 6650.756 | 10879.16 | 12384.16 | 2643.353 | 6828.135 | 2680.072 | 30102.57 | 13486.13 | 7339.984 | |
| std | 0.256877 | 5615.625 | 4306.626 | 10760.16 | 1288.596 | 3749.994 | 4822.34 | 388.0722 | 1581.045 | 330.1566 | 10378.28 | 4746.181 | 2552.922 | |
| median | 1500.413 | 9220.466 | 3739.894 | 10163.75 | 5138.312 | 6398.449 | 4549.934 | 1990.96 | 6052.301 | 2191.647 | 20818.78 | 8194.569 | 4308.806 | |
| rank | 1 | 11 | 6 | 12 | 5 | 9 | 8 | 2 | 7 | 3 | 13 | 10 | 4 | |
| C17-F16 | mean | 1600.76 | 1982.417 | 1816.454 | 1985.627 | 1745.24 | 2010.88 | 1931.699 | 1821.91 | 1750.145 | 1707.946 | 2032.039 | 1909.746 | 1810.549 |
| best | 1600.356 | 1920.548 | 1697.212 | 1842.04 | 1678.099 | 1854.852 | 1769.843 | 1743.721 | 1653.185 | 1678.46 | 1924.123 | 1816.75 | 1759.747 | |
| worst | 1601.12 | 2099.114 | 1907.054 | 2199.342 | 1811.471 | 2151.582 | 2041.625 | 1889.957 | 1847.048 | 1769.939 | 2208.99 | 2037.857 | 1833.409 | |
| std | 0.344697 | 86.8275 | 95.45012 | 166.5573 | 59.88601 | 151.9123 | 141.7167 | 65.84902 | 86.46288 | 46.09586 | 142.6368 | 105.624 | 37.28496 | |
| median | 1600.781 | 1955.003 | 1830.774 | 1950.562 | 1745.694 | 2018.544 | 1957.664 | 1826.981 | 1750.174 | 1691.692 | 1997.521 | 1892.19 | 1824.52 | |
| rank | 1 | 10 | 6 | 11 | 3 | 12 | 9 | 7 | 4 | 2 | 13 | 8 | 5 | |
| C17-F17 | mean | 1700.099 | 1819.629 | 1764.615 | 1819.751 | 1767.447 | 1806.513 | 1838.996 | 1839.717 | 1778.972 | 1770.673 | 1842.983 | 1765.748 | 1768.709 |
| best | 1700.02 | 1801.836 | 1744.775 | 1811.427 | 1738.37 | 1788.707 | 1772.867 | 1778.876 | 1737.537 | 1759.735 | 1759.272 | 1753.767 | 1755.889 | |
| worst | 1700.332 | 1837.01 | 1799.529 | 1826.193 | 1842.651 | 1822.56 | 1894.563 | 1944.574 | 1880.043 | 1793.131 | 1963.088 | 1784.178 | 1786.741 | |
| std | 0.169302 | 15.8926 | 28.07609 | 6.909195 | 54.91478 | 15.25006 | 55.35931 | 85.10395 | 73.82753 | 16.86636 | 109.5243 | 15.6774 | 14.46863 | |
| median | 1700.022 | 1819.835 | 1757.077 | 1820.693 | 1744.384 | 1807.392 | 1844.277 | 1817.71 | 1749.155 | 1764.913 | 1824.787 | 1762.522 | 1766.104 | |
| rank | 1 | 9 | 2 | 10 | 4 | 8 | 11 | 12 | 7 | 6 | 13 | 3 | 5 | |
| C17-F18 | mean | 1805.36 | 2335204 | 13804.56 | 4652768 | 17577.58 | 13969.78 | 23146.27 | 21220.33 | 20371.01 | 28202.16 | 12055.37 | 21978.5 | 14585.91 |
| best | 1800.003 | 123557.4 | 8013.312 | 234187.2 | 9060.126 | 10152.12 | 6858.01 | 8695.712 | 9599.278 | 24132.94 | 6812.501 | 6411.055 | 6864.236 | |
| worst | 1820.451 | 6762049 | 19031.49 | 13501037 | 26661.37 | 17848.67 | 34427.23 | 33810.4 | 31465.07 | 32117.82 | 14748.25 | 36160.44 | 21386.16 | |
| std | 10.98033 | 3354924 | 4978.57 | 6707123 | 9742.101 | 3744.082 | 14795.6 | 12437.89 | 13500.23 | 4686.876 | 3899.459 | 17140.19 | 6513.132 | |
| median | 1800.492 | 1227605 | 14086.72 | 2437923 | 17294.4 | 13939.16 | 25649.92 | 21187.6 | 20209.85 | 28278.94 | 13330.38 | 22671.25 | 15046.62 | |
| rank | 1 | 12 | 3 | 13 | 6 | 4 | 10 | 8 | 7 | 11 | 2 | 9 | 5 | |
| C17-F19 | mean | 1900.445 | 326246.8 | 8176.982 | 576987.9 | 8123.921 | 105109.3 | 31100.32 | 4265.894 | 7096.304 | 6535.656 | 35683.8 | 23056.4 | 7748.04 |
| best | 1900.039 | 21270.18 | 4223.297 | 38220.34 | 3495.649 | 2472.429 | 7091.41 | 2412.043 | 3837.089 | 2597.264 | 14176.46 | 2983.403 | 6426.274 | |
| worst | 1901.559 | 685969.8 | 15922.87 | 1236278 | 14522.72 | 206802.8 | 57102.62 | 6675.377 | 16383.7 | 12794.42 | 48678.22 | 64976.7 | 10313.44 | |
| std | 0.812462 | 313076.4 | 5977.705 | 589916.7 | 5583.882 | 126664.2 | 22412.42 | 1937.333 | 6759.261 | 4945.329 | 17070.38 | 31183.43 | 1909.097 | |
| median | 1900.09 | 298873.6 | 6280.879 | 516726.7 | 7238.657 | 105581 | 30103.63 | 3988.078 | 4082.215 | 5375.468 | 39940.26 | 12132.76 | 7126.224 | |
| rank | 1 | 12 | 7 | 13 | 6 | 11 | 9 | 2 | 4 | 3 | 10 | 8 | 5 | |
| C17-F20 | mean | 2000.312 | 2208.805 | 2172.512 | 2215.316 | 2146.62 | 2202.551 | 2201.912 | 2147.22 | 2171.986 | 2092.106 | 2240.341 | 2171.222 | 2074.33 |
| best | 2000.312 | 2157.756 | 2056.338 | 2165.197 | 2129.282 | 2115.686 | 2110.998 | 2069.267 | 2147.075 | 2085.607 | 2184.168 | 2149.148 | 2060.189 | |
| worst | 2000.312 | 2275.808 | 2283.337 | 2257.945 | 2186.408 | 2304.88 | 2277.939 | 2244.941 | 2231.476 | 2098.215 | 2313.71 | 2206.913 | 2089.551 | |
| std | 0 | 53.56279 | 109.7486 | 53.87584 | 29.12888 | 87.30511 | 85.26482 | 79.24193 | 43.66266 | 5.640705 | 65.18882 | 29.90742 | 13.23554 | |
| median | 2000.312 | 2200.829 | 2175.187 | 2219.06 | 2135.394 | 2194.82 | 2209.355 | 2137.337 | 2154.696 | 2092.3 | 2231.744 | 2164.413 | 2073.79 | |
| rank | 1 | 11 | 8 | 12 | 4 | 10 | 9 | 5 | 7 | 3 | 13 | 6 | 2 | |
| C17-F21 | mean | 2200 | 2293.874 | 2229.15 | 2272.679 | 2292.324 | 2320.069 | 2307.568 | 2261.266 | 2310.373 | 2299.266 | 2355.293 | 2314.868 | 2298.025 |
| best | 2200 | 2252.79 | 2219.413 | 2242.24 | 2288.41 | 2232.782 | 2230.466 | 2216.358 | 2306.087 | 2225.718 | 2340.173 | 2307.436 | 2238.034 | |
| worst | 2200 | 2314.369 | 2254.533 | 2291.866 | 2297.611 | 2363.212 | 2342.797 | 2308.365 | 2314.986 | 2330.001 | 2367.011 | 2325.838 | 2325.459 | |
| std | 0 | 31.14894 | 18.54513 | 23.57032 | 4.723094 | 64.93348 | 56.60492 | 56.20072 | 4.639321 | 53.94494 | 13.36999 | 9.48029 | 44.08846 | |
| median | 2200 | 2304.168 | 2221.327 | 2278.304 | 2291.637 | 2342.141 | 2328.505 | 2260.17 | 2310.21 | 2320.672 | 2356.994 | 2313.098 | 2314.303 | |
| rank | 1 | 6 | 2 | 4 | 5 | 12 | 9 | 3 | 10 | 8 | 13 | 11 | 7 | |
| C17-F22 | mean | 2300.073 | 2658.071 | 2308.515 | 2804.316 | 2307.256 | 2639.297 | 2320.621 | 2289.556 | 2308.203 | 2317.167 | 2301.18 | 2312.018 | 2315.824 |
| best | 2300 | 2556.605 | 2306.656 | 2634.685 | 2298.448 | 2419.396 | 2317.356 | 2239.902 | 2298.584 | 2309.341 | 2297.549 | 2298.071 | 2309.828 | |
| worst | 2300.29 | 2773.729 | 2310.327 | 2931.611 | 2316.359 | 2811.163 | 2323.239 | 2306.538 | 2321.527 | 2328.799 | 2303.218 | 2338.871 | 2320.512 | |
| std | 0.158302 | 110.1861 | 2.263155 | 136.2506 | 7.982471 | 190.4072 | 3.159466 | 36.12051 | 10.75811 | 9.199088 | 2.726583 | 19.92629 | 4.904607 | |
| median | 2300 | 2650.976 | 2308.539 | 2825.484 | 2307.109 | 2663.315 | 2320.943 | 2305.892 | 2306.35 | 2315.264 | 2301.977 | 2305.565 | 2316.477 | |
| rank | 2 | 12 | 6 | 13 | 4 | 11 | 10 | 1 | 5 | 9 | 3 | 7 | 8 | |
| C17-F23 | mean | 2600.919 | 2684.825 | 2639.826 | 2687.708 | 2618.297 | 2706.393 | 2645.265 | 2621.941 | 2616.604 | 2640.215 | 2762.359 | 2641.641 | 2651.347 |
| best | 2600.003 | 2648.81 | 2629.687 | 2664.648 | 2615.182 | 2631.812 | 2629.23 | 2609.537 | 2612.404 | 2631.347 | 2707.433 | 2636.412 | 2635.05 | |
| worst | 2602.87 | 2704.636 | 2654.396 | 2720.963 | 2621.911 | 2743.753 | 2662.451 | 2631.445 | 2622.131 | 2648.494 | 2876.628 | 2652.399 | 2659.177 | |
| std | 1.440643 | 28.65226 | 12.77372 | 29.45997 | 3.146459 | 55.12318 | 19.38158 | 10.49306 | 4.992796 | 7.861448 | 86.17189 | 8.070403 | 12.33314 | |
| median | 2600.403 | 2692.927 | 2637.611 | 2682.61 | 2618.047 | 2725.004 | 2644.69 | 2623.391 | 2615.94 | 2640.51 | 2732.688 | 2638.876 | 2655.58 | |
| rank | 1 | 10 | 5 | 11 | 3 | 12 | 8 | 4 | 2 | 6 | 13 | 7 | 9 | |
| C17-F24 | mean | 2630.488 | 2770.389 | 2762.249 | 2829.591 | 2708.993 | 2680.964 | 2756.523 | 2693.263 | 2746.839 | 2752.613 | 2745.765 | 2760.576 | 2725.838 |
| best | 2516.677 | 2714.329 | 2740.462 | 2799.532 | 2679.923 | 2567.495 | 2721.397 | 2530.727 | 2713.364 | 2729.079 | 2550.576 | 2744.509 | 2577.537 | |
| worst | 2732.32 | 2841.573 | 2782.453 | 2885.682 | 2720.993 | 2804.118 | 2787.482 | 2761.175 | 2764.26 | 2766.999 | 2871.867 | 2783.134 | 2803.368 | |
| std | 127.1166 | 65.211 | 19.07885 | 41.91001 | 21.2623 | 143.1527 | 29.56212 | 118.7769 | 25.13303 | 18.2754 | 150.1475 | 17.74422 | 110.3649 | |
| median | 2636.477 | 2762.828 | 2763.04 | 2816.575 | 2717.527 | 2676.122 | 2758.607 | 2740.576 | 2754.867 | 2757.187 | 2780.309 | 2757.33 | 2761.224 | |
| rank | 1 | 12 | 11 | 13 | 4 | 2 | 9 | 3 | 7 | 8 | 6 | 10 | 5 | |
| C17-F25 | mean | 2932.639 | 3116.637 | 2915.062 | 3212.151 | 2928.118 | 3095.075 | 2910.197 | 2922.105 | 2935.676 | 2931.45 | 2922.244 | 2923.114 | 2946.754 |
| best | 2898.047 | 3045.65 | 2894.722 | 3160.945 | 2908.305 | 2913.735 | 2781.515 | 2893.096 | 2909.545 | 2905.358 | 2894.419 | 2907.767 | 2933.993 | |
| worst | 2945.793 | 3290.136 | 2949.055 | 3279.728 | 2939.089 | 3529.038 | 2957.801 | 2944.703 | 2946.48 | 2949.457 | 2942.376 | 2946.134 | 2960.285 | |
| std | 25.19385 | 127.3414 | 25.68891 | 55.61337 | 14.85483 | 318.0286 | 93.76283 | 28.79726 | 19.14448 | 23.31279 | 25.65604 | 20.25217 | 12.76888 | |
| median | 2943.359 | 3065.382 | 2908.236 | 3203.966 | 2932.539 | 2968.763 | 2950.736 | 2925.31 | 2943.339 | 2935.493 | 2926.091 | 2919.278 | 2946.369 | |
| rank | 8 | 12 | 2 | 13 | 6 | 11 | 1 | 3 | 9 | 7 | 4 | 5 | 10 | |
| C17-F26 | mean | 2900 | 3515.608 | 3007.385 | 3642.688 | 3140.201 | 3531.802 | 3173.614 | 2942.171 | 3240.953 | 3192.935 | 3728.882 | 2945.372 | 2939.773 |
| best | 2900 | 3259.133 | 2845.795 | 3402.733 | 2982.88 | 3149.328 | 2989.348 | 2922.016 | 3006.153 | 2939.584 | 2853.63 | 2890.991 | 2791.937 | |
| worst | 2900 | 3704.033 | 3177.206 | 3906.141 | 3536.327 | 4042.516 | 3517.445 | 2967.174 | 3791.159 | 3765.449 | 4152.713 | 3038.889 | 3093.388 | |
| std | 4.05E-13 | 231.225 | 198.9794 | 235.1629 | 288.8082 | 471.0027 | 260.8804 | 22.18356 | 402.1869 | 419.6982 | 650.5965 | 70.42932 | 161.8943 | |
| median | 2900 | 3549.632 | 3003.27 | 3630.939 | 3020.798 | 3467.682 | 3093.832 | 2939.747 | 3083.25 | 3033.353 | 3954.592 | 2925.804 | 2936.883 | |
| rank | 1 | 10 | 5 | 12 | 6 | 11 | 7 | 3 | 9 | 8 | 13 | 4 | 2 | |
| C17-F27 | mean | 3089.518 | 3195.49 | 3123.158 | 3214.078 | 3117.216 | 3171.862 | 3184.459 | 3099.941 | 3119.973 | 3119.139 | 3209.909 | 3136.308 | 3155.888 |
| best | 3089.518 | 3154.798 | 3101.985 | 3128.297 | 3100.891 | 3107.813 | 3174.234 | 3097.683 | 3101.473 | 3102.049 | 3198.905 | 3103.653 | 3121.857 | |
| worst | 3089.518 | 3254.568 | 3175.783 | 3370.273 | 3158.655 | 3205.385 | 3193.322 | 3101.618 | 3172.393 | 3164.049 | 3226.783 | 3177.805 | 3203.141 | |
| std | 2.86E-13 | 45.92707 | 38.38335 | 116.6041 | 30.24874 | 49.10097 | 8.550188 | 1.969086 | 38.16412 | 32.72923 | 12.96941 | 34.12506 | 37.16475 | |
| median | 3089.518 | 3186.296 | 3107.431 | 3178.872 | 3104.659 | 3187.126 | 3185.14 | 3100.231 | 3103.012 | 3105.23 | 3206.974 | 3131.887 | 3149.277 | |
| rank | 1 | 11 | 6 | 13 | 3 | 9 | 10 | 2 | 5 | 4 | 12 | 7 | 8 | |
| C17-F28 | mean | 3100 | 3564.236 | 3248.179 | 3692.02 | 3293.876 | 3534.345 | 3289.609 | 3250.32 | 3337.12 | 3320.895 | 3423.588 | 3305.022 | 3256.55 |
| best | 3100 | 3508.735 | 3156.491 | 3644.298 | 3202.862 | 3377.077 | 3164.756 | 3121.905 | 3202.333 | 3237.799 | 3397.497 | 3219.509 | 3160.8 | |
| worst | 3100 | 3618.44 | 3362.217 | 3725.321 | 3338.377 | 3724.854 | 3394.177 | 3393.76 | 3399.659 | 3393.957 | 3458.191 | 3362.392 | 3494.323 | |
| std | 0 | 51.28969 | 98.36261 | 40.7178 | 67.96787 | 194.9551 | 117.0799 | 160.4997 | 100.7499 | 77.04266 | 27.74621 | 68.98006 | 174.7305 | |
| median | 3100 | 3564.884 | 3237.005 | 3699.231 | 3317.132 | 3517.725 | 3299.752 | 3242.807 | 3373.244 | 3325.911 | 3419.332 | 3319.093 | 3185.539 | |
| rank | 1 | 12 | 2 | 13 | 6 | 11 | 5 | 3 | 9 | 8 | 10 | 7 | 4 | |
| C17-F29 | mean | 3132.241 | 3319.905 | 3284.13 | 3358.325 | 3248.02 | 3244.612 | 3336.794 | 3217.153 | 3268.299 | 3225.3 | 3334.331 | 3269.013 | 3245.428 |
| best | 3130.076 | 3300.07 | 3215.258 | 3291.717 | 3192.345 | 3191.768 | 3244.239 | 3159.686 | 3203.63 | 3186.914 | 3246.109 | 3180.47 | 3210.067 | |
| worst | 3134.841 | 3339.053 | 3354.8 | 3413.375 | 3313.929 | 3293.738 | 3461.603 | 3285.794 | 3365.352 | 3247.698 | 3570.954 | 3341.366 | 3277.406 | |
| std | 2.70854 | 19.48662 | 76.66374 | 66.83395 | 59.02525 | 45.52817 | 99.31632 | 57.20916 | 83.25541 | 31.52592 | 172.3924 | 78.19647 | 31.84393 | |
| median | 3132.023 | 3320.249 | 3283.231 | 3364.105 | 3242.904 | 3246.471 | 3320.668 | 3211.565 | 3252.108 | 3233.294 | 3260.131 | 3277.108 | 3247.12 | |
| rank | 1 | 10 | 9 | 13 | 6 | 4 | 12 | 2 | 7 | 3 | 11 | 8 | 5 | |
| C17-F30 | mean | 3418.734 | 1953229 | 384127.8 | 3138741 | 709801.2 | 644655.9 | 952310.9 | 390768.1 | 906420.5 | 193407.2 | 781676.3 | 459509.8 | 1388299 |
| best | 3394.682 | 1506631 | 144960 | 1078058 | 36146.78 | 181123.7 | 70453.51 | 21849.04 | 43153.57 | 39652.19 | 667033.1 | 22285.5 | 517999 | |
| worst | 3442.907 | 2731657 | 692344.1 | 4745919 | 1177267 | 1074371 | 3455229 | 1344617 | 1507210 | 467768.9 | 894054.8 | 714360.5 | 2850473 | |
| std | 30.30114 | 588518.1 | 277107.7 | 1669828 | 532265 | 461029.5 | 1821378 | 695269.5 | 684113 | 205814.3 | 109563.7 | 352376.6 | 1127637 | |
| median | 3418.673 | 1787315 | 349603.6 | 3365493 | 812895.6 | 661564.3 | 141780.3 | 98303.29 | 1037659 | 133103.9 | 782808.6 | 550696.7 | 1092361 | |
| rank | 1 | 12 | 3 | 13 | 7 | 6 | 10 | 4 | 9 | 2 | 8 | 5 | 11 | |
| Sum rank | 37 | 320 | 174 | 351 | 138 | 281 | 237 | 112 | 188 | 189 | 238 | 181 | 193 | |
| Mean rank | 1.275862 | 11.03448 | 6 | 12.10345 | 4.758621 | 9.689655 | 8.172414 | 3.862069 | 6.482759 | 6.517241 | 8.206897 | 6.241379 | 6.655172 | |
| Total rank | 1 | 12 | 4 | 13 | 3 | 11 | 9 | 2 | 6 | 7 | 10 | 5 | 8 | |
Table 3.
Optimization results for the CEC 2017 test suite (dimension=30).
| OOA | WSO | AVOA | RSA | MPA | TSA | WOA | MVO | GWO | TLBO | GSA | PSO | GA | ||
|---|---|---|---|---|---|---|---|---|---|---|---|---|---|---|
| C17-F1 | mean | 100 | 2.15E+10 | 2.16E+08 | 3.36E+10 | 2.16E+08 | 1.47E+10 | 1.59E+09 | 2.17E+08 | 1.57E+09 | 5.22E+09 | 2.25E+08 | 1.36E+09 | 3.61E+08 |
| best | 100 | 1.85E+10 | 1.04E+08 | 2.98E+10 | 1.04E+08 | 9.3E+09 | 1.19E+09 | 1.05E+08 | 3.27E+08 | 3.34E+09 | 1.04E+08 | 1.04E+08 | 2.31E+08 | |
| worst | 100 | 2.68E+10 | 4.58E+08 | 4.11E+10 | 4.58E+08 | 1.99E+10 | 2.17E+09 | 4.59E+08 | 4.53E+09 | 7.56E+09 | 4.63E+08 | 4.67E+09 | 5.84E+08 | |
| std | 8.93E-15 | 4.22E+09 | 1.79E+08 | 5.62E+09 | 1.79E+08 | 5.49E+09 | 5.05E+08 | 1.79E+08 | 2.16E+09 | 1.9E+09 | 1.8E+08 | 2.41E+09 | 1.67E+08 | |
| median | 100 | 2.04E+10 | 1.52E+08 | 3.16E+10 | 1.52E+08 | 1.49E+10 | 1.51E+09 | 1.52E+08 | 7.1E+08 | 4.99E+09 | 1.67E+08 | 3.22E+08 | 3.15E+08 | |
| rank | 1 | 12 | 2 | 13 | 3 | 11 | 9 | 4 | 8 | 10 | 5 | 7 | 6 | |
| C17-F3 | mean | 300 | 96614.41 | 53933.49 | 77366.61 | 18585.58 | 55958.1 | 205718.4 | 19131.16 | 51472.71 | 45809.84 | 95407.06 | 43547.71 | 153272.3 |
| best | 300 | 88996.04 | 39548.33 | 63712.4 | 16226.86 | 51683.78 | 170987.9 | 16830.62 | 47478.85 | 43809.8 | 82336.48 | 38319.08 | 120561.6 | |
| worst | 300 | 106524.6 | 62295.66 | 84695.4 | 20971.61 | 58288.34 | 235879.8 | 21002.04 | 53477.99 | 47780.24 | 103083 | 48636.89 | 208250.5 | |
| std | 0 | 9492.196 | 10861.79 | 10276.61 | 2134.522 | 3185.682 | 29329.65 | 1946.304 | 3005.516 | 1764.21 | 10708.3 | 5738.33 | 45101.23 | |
| median | 300 | 95468.51 | 56944.99 | 80529.33 | 18571.92 | 56930.14 | 208002.9 | 19345.98 | 52467.01 | 45824.67 | 98104.4 | 43617.44 | 142138.6 | |
| rank | 1 | 11 | 7 | 9 | 2 | 8 | 13 | 3 | 6 | 5 | 10 | 4 | 12 | |
| C17-F4 | mean | 458.5616 | 5350.397 | 539.4145 | 8089.186 | 521.9548 | 3807.993 | 817.0299 | 524.9005 | 585.8032 | 858.3046 | 604.3766 | 628.1991 | 780.6074 |
| best | 458.5616 | 3054.705 | 523.4544 | 5224.711 | 515.404 | 967.5568 | 760.4125 | 517.1595 | 535.2115 | 686.5093 | 590.4452 | 536.4024 | 740.8788 | |
| worst | 458.5616 | 7206.478 | 550.2992 | 11265.61 | 534.1434 | 6252.298 | 889.6414 | 530.3765 | 617.9659 | 1177.365 | 619.4999 | 783.7213 | 796.0334 | |
| std | 0 | 1871.912 | 13.03211 | 2727.29 | 9.092848 | 2429.097 | 64.88372 | 6.079095 | 38.78506 | 236.972 | 17.05345 | 124.3083 | 28.86259 | |
| median | 458.5616 | 5570.202 | 541.9521 | 7933.213 | 519.1358 | 4006.058 | 809.0328 | 526.033 | 595.0176 | 784.6721 | 603.7807 | 596.3364 | 792.7587 | |
| rank | 1 | 12 | 4 | 13 | 2 | 11 | 9 | 3 | 5 | 10 | 6 | 7 | 8 | |
| C17-F5 | mean | 502.4874 | 816.585 | 719.5219 | 848.4325 | 603.984 | 775.2252 | 799.006 | 633.4036 | 635.4277 | 756.0726 | 717.4144 | 644.1008 | 700.8081 |
| best | 500.995 | 799.1994 | 688.3874 | 826.0953 | 587.9209 | 750.8395 | 777.6683 | 618.6867 | 599.8995 | 739.9461 | 703.0501 | 621.5861 | 658.3407 | |
| worst | 503.9798 | 836.1958 | 764.645 | 878.4212 | 620.0451 | 804.8383 | 807.6101 | 664.2009 | 661.1234 | 774.8832 | 737.5871 | 683.1084 | 753.5 | |
| std | 1.397379 | 16.5293 | 37.13723 | 26.03724 | 15.10696 | 28.20919 | 15.53716 | 22.59738 | 32.74051 | 18.46433 | 17.95634 | 29.331 | 42.83256 | |
| median | 502.4874 | 815.4724 | 712.5276 | 844.6068 | 603.9851 | 772.6115 | 805.3727 | 625.3633 | 640.344 | 754.7306 | 714.5102 | 635.8544 | 695.6958 | |
| rank | 1 | 12 | 8 | 13 | 2 | 10 | 11 | 3 | 4 | 9 | 7 | 5 | 6 | |
| C17-F6 | mean | 600 | 671.8645 | 645.024 | 674.4263 | 609.8658 | 669.551 | 668.9306 | 626.9659 | 616.8448 | 642.285 | 652.9594 | 645.2092 | 631.6495 |
| best | 600 | 670.4622 | 642.8248 | 671.1038 | 608.833 | 656.5433 | 659.7693 | 616.8861 | 610.4155 | 637.8877 | 652.2821 | 636.7136 | 625.3622 | |
| worst | 600 | 673.3848 | 647.2092 | 679.2321 | 610.5577 | 677.7928 | 672.7284 | 638.6085 | 623.9538 | 651.085 | 653.7211 | 653.3163 | 635.0472 | |
| std | 7.14E-14 | 1.433896 | 2.015521 | 4.206224 | 0.808745 | 10.70667 | 6.669619 | 10.99308 | 6.058066 | 6.647049 | 0.73281 | 8.093386 | 4.67082 | |
| median | 600 | 671.8056 | 645.0311 | 673.6846 | 610.0362 | 671.934 | 671.6123 | 626.1845 | 616.505 | 640.0838 | 652.9172 | 645.4035 | 633.0942 | |
| rank | 1 | 12 | 7 | 13 | 2 | 11 | 10 | 4 | 3 | 6 | 9 | 8 | 5 | |
| C17-F7 | mean | 733.478 | 1245.794 | 1122.999 | 1278.85 | 880.073 | 1185.844 | 1253.075 | 886.0305 | 911.6808 | 1065.519 | 980.9371 | 905.745 | 977.9064 |
| best | 732.8186 | 1207.453 | 1027.182 | 1271.948 | 862.4656 | 1068.204 | 1216.101 | 847.0424 | 855.0212 | 992.1556 | 940.8225 | 892.8739 | 950.0423 | |
| worst | 734.5199 | 1272.678 | 1258.797 | 1296.025 | 922.0296 | 1304.724 | 1323.112 | 946.5276 | 948.7409 | 1127.53 | 1038.579 | 928.3516 | 1020.577 | |
| std | 0.820293 | 30.5378 | 111.7555 | 12.56992 | 30.57605 | 110.8795 | 54.41842 | 47.39518 | 43.42062 | 77.06954 | 45.57859 | 17.57207 | 32.69181 | |
| median | 733.2867 | 1251.522 | 1103.008 | 1273.715 | 867.8984 | 1185.224 | 1236.545 | 875.276 | 921.4806 | 1071.196 | 972.1733 | 900.8773 | 970.5031 | |
| rank | 1 | 11 | 9 | 13 | 2 | 10 | 12 | 3 | 5 | 8 | 7 | 4 | 6 | |
| C17-F8 | mean | 803.3298 | 1058.065 | 948.5071 | 1088.37 | 900.689 | 1037.026 | 1013.86 | 902.9144 | 901.8313 | 1007.554 | 958.1218 | 927.4182 | 978.136 |
| best | 801.2023 | 1047.635 | 927.1619 | 1069.187 | 893.6258 | 1004.164 | 966.3403 | 875.2901 | 893.4635 | 989.4507 | 941.5461 | 915.1568 | 963.4448 | |
| worst | 804.1574 | 1071.848 | 967.1707 | 1111.511 | 910.5728 | 1118.871 | 1051.081 | 925.5831 | 909.499 | 1037.685 | 978.3326 | 941.4581 | 992.1231 | |
| std | 1.545701 | 12.81537 | 19.36666 | 21.54123 | 7.840737 | 59.7159 | 39.42715 | 24.43217 | 7.139129 | 22.72103 | 17.49184 | 11.84809 | 15.27864 | |
| median | 803.9798 | 1056.387 | 949.8478 | 1086.391 | 899.2787 | 1012.534 | 1019.009 | 905.3923 | 902.1813 | 1001.541 | 956.3042 | 926.5289 | 978.4881 | |
| rank | 1 | 12 | 6 | 13 | 2 | 11 | 10 | 4 | 3 | 9 | 7 | 5 | 8 | |
| C17-F9 | mean | 900 | 10081.46 | 5101.467 | 9806.301 | 2069.207 | 10506.5 | 10131.77 | 5612.936 | 2874.474 | 5870.885 | 4497.761 | 4066.545 | 2238.248 |
| best | 900 | 8674.481 | 4115.659 | 9645.45 | 1830.887 | 6753.152 | 8060.012 | 4599.951 | 2484.507 | 4458.616 | 4087.39 | 2957.901 | 2028.884 | |
| worst | 900 | 11351.77 | 5672.734 | 9939.413 | 2218.791 | 13826.81 | 11905.03 | 7988.969 | 3400.575 | 8283.113 | 5220.916 | 5463.258 | 2460.82 | |
| std | 7.14E-14 | 1210.428 | 757.1536 | 144.6618 | 192.7325 | 3180.977 | 2131.48 | 1733.811 | 502.3072 | 1852.802 | 575.9914 | 1154.492 | 228.836 | |
| median | 900 | 10149.78 | 5308.739 | 9820.171 | 2113.576 | 10723.02 | 10281.02 | 4931.413 | 2806.408 | 5370.905 | 4341.369 | 3922.511 | 2231.644 | |
| rank | 1 | 11 | 7 | 10 | 2 | 13 | 12 | 8 | 4 | 9 | 6 | 5 | 3 | |
| C17-F10 | mean | 2293.267 | 6881.855 | 5445.848 | 7438.226 | 4257.329 | 6346.146 | 6294.493 | 4793.373 | 4906.424 | 7454.188 | 4954.637 | 5110.67 | 6007.258 |
| best | 1851.756 | 6503.624 | 4840.213 | 6834.203 | 3957.726 | 5306.802 | 5490.274 | 4555.776 | 4406.865 | 7148.075 | 4746.047 | 4829.285 | 5532.538 | |
| worst | 2525.027 | 7058.243 | 5930.547 | 7869.142 | 4716.564 | 6752.056 | 7472.411 | 5100.911 | 5269.169 | 7622.178 | 5209.384 | 5479.349 | 6562.458 | |
| std | 326.7738 | 279.2847 | 566.2276 | 475.6195 | 369.0798 | 756.3273 | 945.8514 | 256.6862 | 395.0874 | 227.8082 | 218.5099 | 294.6064 | 507.6167 | |
| median | 2398.142 | 6982.777 | 5506.315 | 7524.78 | 4177.514 | 6662.862 | 6107.644 | 4758.402 | 4974.83 | 7523.25 | 4931.559 | 5067.022 | 5967.018 | |
| rank | 1 | 11 | 7 | 12 | 2 | 10 | 9 | 3 | 4 | 13 | 5 | 6 | 8 | |
| C17-F11 | mean | 1102.987 | 6822.248 | 1745.516 | 7878.094 | 1673.799 | 4893.283 | 7076.081 | 1791.348 | 2507.27 | 2338.765 | 3078.954 | 1738.629 | 8176.406 |
| best | 1100.995 | 5637.663 | 1653.643 | 6443.573 | 1530.864 | 3681.247 | 5287.212 | 1651.827 | 1843.898 | 2013.563 | 2441.813 | 1649.955 | 3374.532 | |
| worst | 1105.977 | 7627.036 | 1945.118 | 8774.924 | 1858.768 | 6936.913 | 10315.56 | 1946.495 | 4247.063 | 3124.093 | 3623.673 | 1902.104 | 14911.18 | |
| std | 2.341679 | 1003.287 | 146.0792 | 1130.981 | 153.8407 | 1614.778 | 2415.797 | 136.0006 | 1265.008 | 571.6796 | 550.8356 | 122.9817 | 5372.792 | |
| median | 1102.487 | 7012.146 | 1691.651 | 8146.939 | 1652.781 | 4477.486 | 6350.775 | 1783.535 | 1969.059 | 2108.702 | 3125.165 | 1701.228 | 7209.959 | |
| rank | 1 | 10 | 4 | 12 | 2 | 9 | 11 | 5 | 7 | 6 | 8 | 3 | 13 | |
| C17-F12 | mean | 1744.553 | 5.73E+09 | 37041608 | 8.89E+09 | 20094778 | 4.14E+09 | 2.22E+08 | 29210711 | 62823790 | 2.66E+08 | 1.82E+08 | 22162355 | 26329511 |
| best | 1721.81 | 4.76E+09 | 11046828 | 7.92E+09 | 8675865 | 2.16E+09 | 60182802 | 12900846 | 13535696 | 1.66E+08 | 40693025 | 10717920 | 13974918 | |
| worst | 1764.937 | 7.28E+09 | 75615075 | 1.12E+10 | 34202179 | 5.42E+09 | 4.36E+08 | 39592150 | 1.18E+08 | 4.61E+08 | 5.51E+08 | 34408383 | 38512204 | |
| std | 21.92397 | 1.18E+09 | 30177935 | 1.69E+09 | 14150253 | 1.53E+09 | 1.89E+08 | 12440535 | 46444843 | 1.45E+08 | 2.68E+08 | 13200207 | 13435001 | |
| median | 1745.733 | 5.45E+09 | 30752264 | 8.23E+09 | 18750534 | 4.5E+09 | 1.95E+08 | 32174923 | 60019050 | 2.19E+08 | 68002949 | 21761559 | 26415462 | |
| rank | 1 | 12 | 6 | 13 | 2 | 11 | 9 | 5 | 7 | 10 | 8 | 3 | 4 | |
| C17-F13 | mean | 1315.791 | 4.65E+09 | 234475 | 8.58E+09 | 114340 | 1.19E+09 | 848348.1 | 186778.5 | 726743.2 | 71823934 | 142473.2 | 139130.8 | 9802230 |
| best | 1314.587 | 2.26E+09 | 112334.1 | 4.5E+09 | 43210.96 | 16088952 | 388963.5 | 77625.43 | 119097.2 | 49924732 | 65964.4 | 57684.87 | 2673834 | |
| worst | 1318.646 | 6.51E+09 | 353565.6 | 1.05E+10 | 240984 | 4.13E+09 | 1327049 | 273433.4 | 2144638 | 1.06E+08 | 263683.3 | 250402.8 | 21081475 | |
| std | 2.106458 | 1.91E+09 | 129203.1 | 3E+09 | 100849.1 | 2.15E+09 | 511048.8 | 108404.7 | 1046282 | 26301943 | 96404.67 | 89357.48 | 8585811 | |
| median | 1314.967 | 4.91E+09 | 236000.2 | 9.64E+09 | 86582.59 | 3.07E+08 | 838690.1 | 198027.5 | 321618.9 | 65792667 | 120122.5 | 124217.8 | 7726806 | |
| rank | 1 | 12 | 6 | 13 | 2 | 11 | 8 | 5 | 7 | 10 | 4 | 3 | 9 | |
| C17-F14 | mean | 1423.017 | 1718087 | 399037.4 | 1962627 | 179916.4 | 1132743 | 1984755 | 195263.3 | 611735.3 | 292356.5 | 1107748 | 193985.3 | 1809212 |
| best | 1422.014 | 1061406 | 132561.7 | 1008748 | 61125.47 | 742595.4 | 89121.17 | 72899.9 | 163245.4 | 167780.5 | 714968.1 | 80039.05 | 371627.1 | |
| worst | 1423.993 | 2389736 | 679300.5 | 2758135 | 442287.5 | 1459897 | 5958393 | 462069.6 | 1040164 | 571838.3 | 1500624 | 443698.1 | 2808801 | |
| std | 0.879206 | 636983.5 | 317464.3 | 845287.8 | 191863.2 | 321641.1 | 2931780 | 195299.3 | 412610.4 | 205434.1 | 470262.9 | 183056.2 | 1190488 | |
| median | 1423.03 | 1710604 | 392143.7 | 2041812 | 108126.3 | 1164240 | 945753.9 | 123041.7 | 621766 | 214903.5 | 1107700 | 126101.9 | 2028210 | |
| rank | 1 | 10 | 6 | 12 | 2 | 9 | 13 | 4 | 7 | 5 | 8 | 3 | 11 | |
| C17-F15 | mean | 1503.129 | 2.48E+08 | 1375822 | 4.87E+08 | 1346736 | 13013832 | 5440226 | 1380151 | 14192485 | 5512754 | 1358466 | 1349301 | 2121150 |
| best | 1502.462 | 2.18E+08 | 177100.7 | 4.24E+08 | 129052.6 | 7380528 | 316349.5 | 155012.3 | 283640.6 | 1128907 | 141037.9 | 134942.1 | 408683.1 | |
| worst | 1504.265 | 2.74E+08 | 4894040 | 5.36E+08 | 4868737 | 27325764 | 18162803 | 4887511 | 52968867 | 12712041 | 4879322 | 4871739 | 5009793 | |
| std | 0.930751 | 30351327 | 2551791 | 60423759 | 2554602 | 10424666 | 9296555 | 2544111 | 28133875 | 5439895 | 2553789 | 2554886 | 2200031 | |
| median | 1502.893 | 2.51E+08 | 216074.2 | 4.93E+08 | 194577.4 | 8674518 | 1640875 | 239039.2 | 1758716 | 4105034 | 206752.9 | 195262.5 | 1533061 | |
| rank | 1 | 12 | 5 | 13 | 2 | 10 | 8 | 6 | 11 | 9 | 4 | 3 | 7 | |
| C17-F16 | mean | 1663.469 | 4101.329 | 3031.898 | 4635.035 | 2241.54 | 3251.904 | 4041.201 | 2696.913 | 2661.031 | 3408.197 | 3572.045 | 2975.076 | 2990.448 |
| best | 1614.72 | 3807.969 | 2737.754 | 3978.845 | 2001.553 | 2908.494 | 3376.12 | 2482.418 | 2539.576 | 3251.758 | 3420.823 | 2753.289 | 2710.515 | |
| worst | 1744.118 | 4276.32 | 3407.61 | 5176.319 | 2516.773 | 3411.485 | 4801.345 | 2913.154 | 2829.105 | 3667.715 | 3691.182 | 3153.728 | 3343.812 | |
| std | 67.41864 | 234.0283 | 302.0019 | 676.0589 | 242.5108 | 251.8612 | 637.99 | 221.8501 | 145.2831 | 201.6661 | 121.8334 | 209.1785 | 322.4667 | |
| median | 1647.519 | 4160.513 | 2991.113 | 4692.488 | 2223.917 | 3343.819 | 3993.67 | 2696.04 | 2637.723 | 3356.658 | 3588.088 | 2996.644 | 2953.733 | |
| rank | 1 | 12 | 7 | 13 | 2 | 8 | 11 | 4 | 3 | 9 | 10 | 5 | 6 | |
| C17-F17 | mean | 1728.099 | 3204.184 | 2445.318 | 3451.547 | 1948.085 | 3094.792 | 2749.862 | 2125.927 | 2005.692 | 2218.34 | 2485.993 | 2332.979 | 2187.25 |
| best | 1718.761 | 2673.848 | 2350.034 | 3100.934 | 1867.475 | 2198.674 | 2318.895 | 2043.202 | 1889.97 | 2056.227 | 2364.45 | 2153.82 | 2156.169 | |
| worst | 1733.659 | 3820.327 | 2549.322 | 4023.651 | 2005.72 | 5345.294 | 3024.682 | 2272.116 | 2134.369 | 2470.026 | 2632.64 | 2661.365 | 2267.963 | |
| std | 7.297618 | 528.6384 | 89.51016 | 445.1187 | 71.30712 | 1636.126 | 332.5784 | 109.2024 | 134.6634 | 193.1037 | 131.3193 | 258.2104 | 58.77136 | |
| median | 1729.987 | 3161.279 | 2440.959 | 3340.802 | 1959.573 | 2417.6 | 2827.936 | 2094.196 | 1999.214 | 2173.554 | 2473.441 | 2258.365 | 2162.433 | |
| rank | 1 | 12 | 8 | 13 | 2 | 11 | 10 | 4 | 3 | 6 | 9 | 7 | 5 | |
| C17-F18 | mean | 1825.696 | 23516152 | 2597862 | 26971587 | 449288.9 | 29942772 | 5237635 | 967163.3 | 788246.3 | 1799905 | 865686.6 | 559110.2 | 3406739 |
| best | 1822.524 | 7042539 | 626271.2 | 8972491 | 157003.2 | 1237016 | 1769612 | 439399.9 | 219118.9 | 1025030 | 440176.2 | 287596.9 | 2707382 | |
| worst | 1828.42 | 45599259 | 4445437 | 52908094 | 800715.7 | 56693727 | 10685466 | 1845177 | 1272191 | 2261004 | 1211045 | 922395.8 | 4776390 | |
| std | 2.939396 | 18592179 | 2060642 | 20284915 | 288890.8 | 33335395 | 4150540 | 673195 | 471794.6 | 590154.2 | 364166.3 | 287799.8 | 1039578 | |
| median | 1825.92 | 20711405 | 2659870 | 23002881 | 419718.5 | 30920173 | 4247731 | 792038.2 | 830837.5 | 1956792 | 905762.4 | 513224.1 | 3071591 | |
| rank | 1 | 11 | 8 | 12 | 2 | 13 | 10 | 6 | 4 | 7 | 5 | 3 | 9 | |
| C17-F19 | mean | 1910.989 | 4.73E+08 | 1296419 | 7.96E+08 | 1243037 | 2.4E+08 | 12870427 | 2003950 | 4515071 | 5909591 | 1307840 | 1277590 | 2557263 |
| best | 1908.84 | 3.53E+08 | 293139.3 | 5.75E+08 | 240422.4 | 3206791 | 1752074 | 367290.5 | 1497855 | 3643788 | 308068.3 | 347028 | 1960284 | |
| worst | 1913.095 | 6.15E+08 | 1937459 | 1.21E+09 | 1816626 | 6.64E+08 | 21895052 | 3529380 | 12027809 | 8450739 | 1904376 | 1822176 | 3191310 | |
| std | 2.101811 | 1.43E+08 | 764927.9 | 3.04E+08 | 750238.1 | 3.31E+08 | 9869339 | 1494110 | 5493944 | 2731583 | 752848.6 | 698751.5 | 548249.5 | |
| median | 1911.01 | 4.61E+08 | 1477540 | 7.01E+08 | 1457550 | 1.47E+08 | 13917291 | 2059565 | 2267309 | 5771917 | 1509458 | 1470577 | 2538729 | |
| rank | 1 | 12 | 4 | 13 | 2 | 11 | 10 | 6 | 8 | 9 | 5 | 3 | 7 | |
| C17-F20 | mean | 2065.787 | 2852.05 | 2636.891 | 2896.093 | 2261.509 | 2812.046 | 2801.946 | 2611.987 | 2423.904 | 2769.729 | 2942.41 | 2564.666 | 2505.922 |
| best | 2029.521 | 2778.489 | 2515.082 | 2751.613 | 2145.565 | 2702.619 | 2646.95 | 2401.697 | 2260.383 | 2708.159 | 2644.76 | 2513.556 | 2445.026 | |
| worst | 2161.126 | 2924.641 | 2808.219 | 2965.309 | 2346.016 | 2915.11 | 2958.567 | 2955.98 | 2564.83 | 2871.895 | 3346.198 | 2680.918 | 2543.795 | |
| std | 69.24026 | 65.16107 | 137.6245 | 107.6394 | 91.9837 | 95.66384 | 142.0746 | 260.8481 | 136.0149 | 81.18477 | 320.9119 | 85.12862 | 47.3034 | |
| median | 2036.25 | 2852.534 | 2612.131 | 2933.724 | 2277.228 | 2815.228 | 2801.134 | 2545.137 | 2435.202 | 2749.43 | 2889.341 | 2532.096 | 2517.433 | |
| rank | 1 | 11 | 7 | 12 | 2 | 10 | 9 | 6 | 3 | 8 | 13 | 5 | 4 | |
| C17-F21 | mean | 2308.456 | 2596.762 | 2448.231 | 2643.694 | 2387.133 | 2525.165 | 2586.829 | 2418.922 | 2406.48 | 2492.791 | 2553.99 | 2442.966 | 2490.435 |
| best | 2304.034 | 2526.449 | 2257.85 | 2586.165 | 2378.506 | 2346.124 | 2516.104 | 2385.646 | 2370.12 | 2483.421 | 2534.95 | 2423.177 | 2459.35 | |
| worst | 2312.987 | 2652.414 | 2581.521 | 2712.368 | 2392.814 | 2639.573 | 2647.646 | 2450.321 | 2422.972 | 2506.051 | 2588.127 | 2461.006 | 2524.428 | |
| std | 4.850941 | 62.82122 | 148.2022 | 62.05312 | 7.047214 | 138.4952 | 70.23165 | 30.08598 | 26.60579 | 10.40937 | 26.17077 | 16.9696 | 29.07732 | |
| median | 2308.402 | 2604.093 | 2476.777 | 2638.122 | 2388.606 | 2557.482 | 2591.783 | 2419.861 | 2416.414 | 2490.847 | 2546.441 | 2443.841 | 2488.982 | |
| rank | 1 | 12 | 6 | 13 | 2 | 9 | 11 | 4 | 3 | 8 | 10 | 5 | 7 | |
| C17-F22 | mean | 2300 | 7416.278 | 5606.15 | 7217.578 | 2767.064 | 8062.805 | 6943.239 | 4118.651 | 3095.301 | 5534.882 | 6060.652 | 4879.829 | 3093.803 |
| best | 2300 | 7084.193 | 2589.959 | 6320.075 | 2589.259 | 7696.453 | 5982.982 | 2594.276 | 2812.261 | 3057.109 | 3979.755 | 3036.958 | 2959.648 | |
| worst | 2300 | 7992.923 | 6648.708 | 8208.241 | 2909.439 | 8295.31 | 7587.508 | 5936.695 | 3456.066 | 8044.654 | 6842.973 | 6624.719 | 3284.397 | |
| std | 0 | 447.0653 | 2188.073 | 850.4959 | 157.5029 | 294.8451 | 745.0711 | 1866.174 | 293.5383 | 2998.334 | 1511.723 | 1800.442 | 156.411 | |
| median | 2300 | 7293.999 | 6592.966 | 7170.999 | 2784.779 | 8129.728 | 7101.233 | 3971.816 | 3056.438 | 5518.882 | 6709.94 | 4928.821 | 3065.584 | |
| rank | 1 | 12 | 8 | 11 | 2 | 13 | 10 | 5 | 4 | 7 | 9 | 6 | 3 | |
| C17-F23 | mean | 2655.081 | 3134.082 | 2916.197 | 3179.248 | 2684.911 | 3138.091 | 3015.153 | 2760.249 | 2771.554 | 2897.243 | 3608.12 | 2894.462 | 2956.074 |
| best | 2653.745 | 3052.541 | 2831.729 | 3137.587 | 2546.881 | 3029.414 | 2858.446 | 2726.062 | 2757.65 | 2880.102 | 3508.173 | 2872.493 | 2937.475 | |
| worst | 2657.377 | 3203.731 | 3047.601 | 3249.515 | 2737.578 | 3302.897 | 3099.717 | 2789.67 | 2791.69 | 2940.924 | 3701.653 | 2925.754 | 2997.452 | |
| std | 1.798497 | 76.5529 | 102.9913 | 56.02015 | 100.244 | 128.9959 | 117.6717 | 29.73855 | 15.77988 | 31.77993 | 107.6621 | 27.71245 | 30.23767 | |
| median | 2654.6 | 3140.028 | 2892.728 | 3164.946 | 2727.593 | 3110.026 | 3051.225 | 2762.632 | 2768.439 | 2883.973 | 3611.326 | 2889.802 | 2944.683 | |
| rank | 1 | 10 | 7 | 12 | 2 | 11 | 9 | 3 | 4 | 6 | 13 | 5 | 8 | |
| C17-F24 | mean | 2831.409 | 3259.418 | 3140.517 | 3341.852 | 2903.733 | 3231.21 | 3095.648 | 2922.053 | 2934.549 | 3034.572 | 3299.789 | 3107.738 | 3186.227 |
| best | 2829.992 | 3230.675 | 3028.691 | 3270.724 | 2893.367 | 3144.047 | 3034.507 | 2874.181 | 2916.054 | 3017.56 | 3271.765 | 3047.614 | 3111.252 | |
| worst | 2832.366 | 3316.083 | 3271.067 | 3461.734 | 2911.236 | 3276.173 | 3120.213 | 2943.399 | 2943.03 | 3056.434 | 3334.012 | 3204.837 | 3254.053 | |
| std | 1.246245 | 41.79513 | 114.4207 | 96.12821 | 8.854297 | 64.85565 | 44.52533 | 35.0327 | 13.66786 | 17.53194 | 32.2566 | 73.77764 | 74.20735 | |
| median | 2831.64 | 3245.457 | 3131.155 | 3317.475 | 2905.165 | 3252.309 | 3113.936 | 2935.316 | 2939.556 | 3032.148 | 3296.688 | 3089.251 | 3189.801 | |
| rank | 1 | 11 | 8 | 13 | 2 | 10 | 6 | 3 | 4 | 5 | 12 | 7 | 9 | |
| C17-F25 | mean | 2886.698 | 3774.898 | 2925.976 | 4289.841 | 2911.644 | 3387.596 | 3068.493 | 2926.652 | 2995.621 | 3062.61 | 2997.379 | 2914.669 | 3089.732 |
| best | 2886.691 | 3469.485 | 2913.557 | 3796.919 | 2905.41 | 3075.541 | 3037.756 | 2904.458 | 2963.601 | 2967.819 | 2987.174 | 2907.939 | 3073.483 | |
| worst | 2886.707 | 4006.444 | 2955.788 | 4952.46 | 2919.105 | 3708.48 | 3088.721 | 2978.817 | 3058.703 | 3175.101 | 3006.087 | 2927.24 | 3098.003 | |
| std | 0.008274 | 243.4626 | 21.95218 | 524.1696 | 7.125738 | 335.2555 | 24.65864 | 38.32121 | 48.44319 | 109.0198 | 9.535606 | 9.848236 | 12.04774 | |
| median | 2886.698 | 3811.832 | 2917.28 | 4204.993 | 2911.031 | 3383.182 | 3073.748 | 2911.666 | 2980.09 | 3053.759 | 2998.128 | 2911.748 | 3093.722 | |
| rank | 1 | 12 | 4 | 13 | 2 | 11 | 9 | 5 | 6 | 8 | 7 | 3 | 10 | |
| C17-F26 | mean | 3578.65 | 8636.168 | 7115.835 | 9119.509 | 3517.931 | 8270.307 | 7976.609 | 5027.116 | 4844.627 | 5961.291 | 7235.355 | 5077.571 | 4704.075 |
| best | 3559.841 | 8275.362 | 6021.102 | 8393.15 | 3464.287 | 7862.205 | 7319.7 | 4705.307 | 4471.343 | 4771.815 | 6317.544 | 4143.274 | 4339.294 | |
| worst | 3607.686 | 9218.724 | 7874.733 | 10292.52 | 3655.212 | 8561.913 | 8816.14 | 5683.615 | 5485.035 | 6993.609 | 7822.497 | 6314.775 | 5039.848 | |
| std | 24.77834 | 451.0737 | 858.1697 | 927.3888 | 99.99068 | 319.7006 | 674.5303 | 498.4749 | 480.4831 | 1148.169 | 723.9013 | 1132.346 | 312.1846 | |
| median | 3573.536 | 8525.294 | 7283.752 | 8896.185 | 3476.113 | 8328.554 | 7885.298 | 4859.772 | 4711.065 | 6039.869 | 7400.69 | 4926.117 | 4718.579 | |
| rank | 2 | 12 | 8 | 13 | 1 | 11 | 10 | 5 | 4 | 7 | 9 | 6 | 3 | |
| C17-F27 | mean | 3207.018 | 3558.17 | 3348.028 | 3686.102 | 3232.057 | 3445.411 | 3407.476 | 3245.891 | 3261.073 | 3317.182 | 4679.337 | 3284.818 | 3433.969 |
| best | 3200.749 | 3513.715 | 3281.108 | 3464.475 | 3222.993 | 3333.514 | 3254.965 | 3217.709 | 3245.537 | 3251.877 | 4312.247 | 3262.488 | 3357.583 | |
| worst | 3210.656 | 3639.585 | 3420.281 | 3921.549 | 3247.201 | 3660.88 | 3521.243 | 3277.426 | 3277.837 | 3364.238 | 4948.385 | 3307.204 | 3475.831 | |
| std | 5.056308 | 60.6895 | 81.3752 | 211.586 | 11.97255 | 159.4864 | 124.2612 | 26.70273 | 16.15698 | 51.60339 | 334.4175 | 23.63649 | 57.41877 | |
| median | 3208.335 | 3539.69 | 3345.361 | 3679.193 | 3229.018 | 3393.626 | 3426.849 | 3244.215 | 3260.46 | 3326.307 | 4728.358 | 3284.79 | 3451.232 | |
| rank | 1 | 11 | 7 | 12 | 2 | 10 | 8 | 3 | 4 | 6 | 13 | 5 | 9 | |
| C17-F28 | mean | 3100 | 4549.007 | 3301.393 | 5298.552 | 3258.64 | 4036.604 | 3443.746 | 3293.81 | 3574.489 | 3634.18 | 3512.039 | 3353.589 | 3562.747 |
| best | 3100 | 4348.72 | 3282.68 | 5037.445 | 3236.84 | 3556.727 | 3373.986 | 3244.586 | 3390.627 | 3490.735 | 3433.812 | 3223.124 | 3528.7 | |
| worst | 3100 | 4754.485 | 3322.349 | 5560.625 | 3278.027 | 4536.902 | 3483.68 | 3322.828 | 4006.854 | 3948.647 | 3629.929 | 3518.183 | 3603.925 | |
| std | 2.86E-13 | 196.7029 | 18.5019 | 260.9731 | 23.02828 | 488.398 | 52.19947 | 38.39117 | 315.8185 | 230.9762 | 91.45297 | 138.501 | 34.63276 | |
| median | 3100 | 4546.411 | 3300.272 | 5298.07 | 3259.846 | 4026.393 | 3458.66 | 3303.912 | 3450.238 | 3548.67 | 3492.207 | 3336.525 | 3559.181 | |
| rank | 1 | 12 | 4 | 13 | 2 | 11 | 6 | 3 | 9 | 10 | 7 | 5 | 8 | |
| C17-F29 | mean | 3353.75 | 5213.215 | 4333.038 | 5394.511 | 3777.799 | 5082.723 | 4955.712 | 3930.648 | 3887.445 | 4480.829 | 4935.906 | 4198.769 | 4296.731 |
| best | 3325.385 | 4843.563 | 4044.383 | 4876.369 | 3636.029 | 4637.309 | 4717.357 | 3828.26 | 3803.77 | 4212.207 | 4695.177 | 4043.794 | 3983.394 | |
| worst | 3370.797 | 5617.331 | 4512.864 | 6113.132 | 3902.207 | 5823.289 | 5107.337 | 4015.974 | 3989.644 | 4882.639 | 5151.589 | 4403.887 | 4576.177 | |
| std | 21.41933 | 409.7053 | 227.4317 | 667.8421 | 126.4094 | 602.7249 | 181.7118 | 88.47312 | 86.709 | 314.1123 | 260.227 | 163.3035 | 291.7309 | |
| median | 3359.41 | 5195.983 | 4387.452 | 5294.272 | 3786.48 | 4935.147 | 4999.077 | 3939.179 | 3878.183 | 4414.234 | 4948.428 | 4173.698 | 4313.676 | |
| rank | 1 | 12 | 7 | 13 | 2 | 11 | 10 | 4 | 3 | 8 | 9 | 5 | 6 | |
| C17-F30 | mean | 5007.854 | 1.17E+09 | 4313339 | 2.31E+09 | 3155580 | 34515516 | 35156701 | 5674036 | 8355706 | 34049363 | 4996171 | 3371754 | 3722284 |
| best | 4955.449 | 8.65E+08 | 1403518 | 1.66E+09 | 998299.1 | 15004022 | 7376135 | 4053519 | 4080505 | 19564129 | 2605235 | 1027243 | 1806480 | |
| worst | 5086.396 | 1.29E+09 | 5543722 | 2.55E+09 | 4308484 | 77589428 | 55588937 | 7895164 | 18339730 | 65808775 | 6522255 | 4307400 | 5396223 | |
| std | 64.15759 | 2.23E+08 | 2120726 | 4.71E+08 | 1694195 | 31507516 | 21961834 | 1832212 | 7370893 | 23257021 | 1900134 | 1714722 | 1705773 | |
| median | 4994.785 | 1.27E+09 | 5153059 | 2.51E+09 | 3657767 | 22734307 | 38830866 | 5373731 | 5501295 | 25412274 | 5428596 | 4076187 | 3843216 | |
| rank | 1 | 12 | 5 | 13 | 2 | 10 | 11 | 7 | 8 | 9 | 6 | 3 | 4 | |
| Sum rank | 30 | 334 | 182 | 361 | 58 | 305 | 284 | 128 | 151 | 232 | 231 | 139 | 204 | |
| Mean rank | 1.034483 | 11.51724 | 6.275862 | 12.44828 | 2 | 10.51724 | 9.793103 | 4.413793 | 5.206897 | 8 | 7.965517 | 4.793103 | 7.034483 | |
| Total rank | 1 | 12 | 6 | 13 | 2 | 11 | 10 | 3 | 5 | 9 | 8 | 4 | 7 | |
Table 4.
Optimization results for the CEC 2017 test suite (dimension=50).
| OOA | WSO | AVOA | RSA | MPA | TSA | WOA | MVO | GWO | TLBO | GSA | PSO | GA | ||
|---|---|---|---|---|---|---|---|---|---|---|---|---|---|---|
| C17-F1 | mean | 100 | 4.95E+10 | 1.1E+09 | 7.69E+10 | 1.1E+09 | 3.19E+10 | 7.32E+09 | 1.1E+09 | 8.66E+09 | 1.79E+10 | 1.5E+10 | 3.14E+09 | 9.51E+09 |
| best | 100 | 4.41E+10 | 7.44E+08 | 6.72E+10 | 7.27E+08 | 2.99E+10 | 4.4E+09 | 7.27E+08 | 6.18E+09 | 1.23E+10 | 1.26E+10 | 2E+09 | 8.74E+09 | |
| worst | 100 | 5.34E+10 | 1.56E+09 | 8.44E+10 | 1.57E+09 | 3.39E+10 | 1.09E+10 | 1.56E+09 | 1.19E+10 | 2.42E+10 | 1.75E+10 | 3.92E+09 | 1.02E+10 | |
| std | 0 | 4.3E+09 | 3.84E+08 | 8.03E+09 | 3.94E+08 | 1.81E+09 | 3.29E+09 | 3.9E+08 | 2.6E+09 | 6.28E+09 | 2.21E+09 | 8.91E+08 | 8.27E+08 | |
| median | 100 | 5.02E+10 | 1.05E+09 | 7.8E+10 | 1.05E+09 | 3.19E+10 | 7.01E+09 | 1.05E+09 | 8.27E+09 | 1.75E+10 | 1.49E+10 | 3.33E+09 | 9.53E+09 | |
| rank | 1 | 12 | 4 | 13 | 3 | 11 | 6 | 2 | 7 | 10 | 9 | 5 | 8 | |
| C17-F3 | mean | 300 | 154396 | 144775.7 | 153921.7 | 40780 | 114495.5 | 215432.5 | 63673.5 | 131350.3 | 105750.1 | 170162.6 | 143305 | 239250.6 |
| best | 300 | 130935.1 | 116840.9 | 136841.4 | 35610.86 | 98555.96 | 164738.1 | 50699.94 | 113358.5 | 82476.83 | 150986.5 | 113745.4 | 199886.3 | |
| worst | 300 | 183241.2 | 166548.8 | 164931.7 | 53012.54 | 129952.4 | 324443.8 | 82406.44 | 153841 | 116468.6 | 188356.6 | 174868.7 | 265767.6 | |
| std | 0 | 24150.2 | 22863.42 | 13140.4 | 8961.981 | 13976.42 | 82028.55 | 14810.16 | 18310.5 | 17163.84 | 22179.7 | 31567.13 | 30630.41 | |
| median | 300 | 151703.8 | 147856.6 | 156956.9 | 37248.3 | 114736.8 | 186273.9 | 60793.82 | 129100.9 | 112027.6 | 170653.7 | 142303 | 245674.3 | |
| rank | 1 | 10 | 8 | 9 | 2 | 5 | 12 | 3 | 6 | 4 | 11 | 7 | 13 | |
| C17-F4 | mean | 470.3679 | 12184.46 | 816.0011 | 19457.87 | 681.4135 | 6971.561 | 1820.302 | 707.3102 | 1412.912 | 2511.357 | 2728.976 | 1073.423 | 1485.133 |
| best | 428.5127 | 9514.955 | 781.0024 | 12922.28 | 656.2968 | 5678.306 | 1207.196 | 644.4745 | 1114.656 | 1528.502 | 2319.866 | 803.94 | 1316.601 | |
| worst | 525.7252 | 13801.19 | 880.4744 | 23154.52 | 694.8483 | 8926.75 | 2130.731 | 812.7542 | 1716.417 | 4115.779 | 2931.851 | 1762.34 | 1589.352 | |
| std | 53.92841 | 2102.179 | 47.95718 | 5099.299 | 18.62806 | 1501.712 | 459.5216 | 79.82462 | 284.7839 | 1229.91 | 301.2068 | 501.5184 | 139.8851 | |
| median | 463.6168 | 12710.85 | 801.2638 | 20877.33 | 687.2544 | 6640.594 | 1971.641 | 686.0061 | 1410.286 | 2200.573 | 2832.093 | 863.7063 | 1517.289 | |
| rank | 1 | 12 | 4 | 13 | 2 | 11 | 8 | 3 | 6 | 9 | 10 | 5 | 7 | |
| C17-F5 | mean | 504.7261 | 1042.95 | 847.6477 | 1066.558 | 749.3764 | 1080.986 | 926.8785 | 751.4539 | 740.7157 | 961.5023 | 805.8724 | 792.0833 | 875.1166 |
| best | 503.9798 | 1013.374 | 816.5437 | 1061.377 | 676.9687 | 962.7314 | 893.7665 | 685.5776 | 712.1028 | 921.1337 | 756.8901 | 741.5352 | 844.3322 | |
| worst | 505.9698 | 1069.044 | 891.1425 | 1071.499 | 811.096 | 1166.444 | 950.6786 | 852.7761 | 773.689 | 983.4193 | 841.0368 | 843.6933 | 899.9478 | |
| std | 1.036324 | 27.21731 | 35.00028 | 5.69125 | 60.73609 | 106.8864 | 28.21668 | 81.0711 | 32.96958 | 30.09048 | 42.06955 | 45.51418 | 26.82066 | |
| median | 504.4773 | 1044.692 | 841.4523 | 1066.678 | 754.7205 | 1097.383 | 931.5345 | 733.731 | 738.5355 | 970.7282 | 812.7815 | 791.5524 | 878.0932 | |
| rank | 1 | 11 | 7 | 12 | 3 | 13 | 9 | 4 | 2 | 10 | 6 | 5 | 8 | |
| C17-F6 | mean | 600 | 686.6786 | 658.5233 | 688.3462 | 619.2303 | 682.4414 | 688.8653 | 640.3977 | 628.4489 | 661.7716 | 656.7135 | 653.2132 | 649.1582 |
| best | 600 | 683.956 | 653.561 | 686.3068 | 617.0439 | 667.7492 | 684.5972 | 631.1357 | 624.1073 | 650.8752 | 652.8177 | 650.715 | 637.678 | |
| worst | 600 | 689.5874 | 662.2555 | 692.3995 | 621.2137 | 694.7835 | 697.1782 | 661.4298 | 636.4458 | 667.6559 | 659.7741 | 657.7726 | 659.3786 | |
| std | 0 | 2.564667 | 4.113542 | 3.064662 | 2.433815 | 13.36965 | 6.255548 | 15.58106 | 6.01381 | 8.107078 | 3.221641 | 3.400265 | 10.15461 | |
| median | 600 | 686.5855 | 659.1383 | 687.3393 | 619.3317 | 683.6164 | 686.8428 | 634.5125 | 626.6213 | 664.2777 | 657.1311 | 652.1827 | 649.7881 | |
| rank | 1 | 11 | 8 | 12 | 2 | 10 | 13 | 4 | 3 | 9 | 7 | 6 | 5 | |
| C17-F7 | mean | 756.7298 | 1690.859 | 1588.857 | 1771.25 | 1075.378 | 1602.293 | 1622.731 | 1095.607 | 1105.13 | 1437.854 | 1383.321 | 1212.905 | 1299.674 |
| best | 754.7543 | 1670.615 | 1528.091 | 1705.897 | 1030.508 | 1476.164 | 1568.636 | 1067.488 | 1087.362 | 1337.764 | 1248.408 | 1080.822 | 1236.369 | |
| worst | 758.3522 | 1717.492 | 1642.381 | 1851.318 | 1114.134 | 1723.89 | 1695.087 | 1120.156 | 1120.405 | 1488.694 | 1487.485 | 1401.47 | 1341.989 | |
| std | 1.689848 | 21.74419 | 52.67291 | 67.87609 | 42.83676 | 124.6629 | 63.58271 | 24.65415 | 15.78024 | 73.8405 | 118.2269 | 149.7953 | 51.14959 | |
| median | 756.9065 | 1687.665 | 1592.477 | 1763.893 | 1078.435 | 1604.558 | 1613.601 | 1097.392 | 1106.376 | 1462.479 | 1398.695 | 1184.664 | 1310.17 | |
| rank | 1 | 12 | 9 | 13 | 2 | 10 | 11 | 3 | 4 | 8 | 7 | 5 | 6 | |
| C17-F8 | mean | 805.721 | 1362.398 | 1124.105 | 1384.668 | 1032.391 | 1376.424 | 1285.685 | 1041.59 | 1051.264 | 1283.624 | 1136.983 | 1069.467 | 1231.684 |
| best | 802.9849 | 1309.251 | 1084.806 | 1352.051 | 1005.624 | 1294.353 | 1170.851 | 1014.615 | 1021.474 | 1241.854 | 1129.802 | 1033.19 | 1203.054 | |
| worst | 810.9445 | 1401.525 | 1167.702 | 1400.527 | 1057.147 | 1488.554 | 1379.566 | 1102.659 | 1075.243 | 1333.975 | 1153.925 | 1115.698 | 1254.588 | |
| std | 3.890137 | 45.90234 | 46.06279 | 23.96893 | 27.67453 | 92.5422 | 93.65706 | 44.66053 | 27.00846 | 42.24419 | 12.44165 | 41.79212 | 23.26472 | |
| median | 804.4773 | 1369.408 | 1121.956 | 1393.047 | 1033.396 | 1361.394 | 1296.161 | 1024.543 | 1054.169 | 1279.333 | 1132.102 | 1064.49 | 1234.547 | |
| rank | 1 | 11 | 6 | 13 | 2 | 12 | 10 | 3 | 4 | 9 | 7 | 5 | 8 | |
| C17-F9 | mean | 900 | 32893 | 14489.41 | 33048.09 | 6476.341 | 34318.2 | 30367.44 | 19625.77 | 9331.297 | 23147.87 | 12386.16 | 12080.08 | 14096.86 |
| best | 900 | 32012.24 | 14052.6 | 31573.96 | 5145.79 | 31605.69 | 28736.98 | 12085.61 | 8284.278 | 18375.71 | 11832.99 | 11289.35 | 12513.65 | |
| worst | 900 | 35391.89 | 15481.94 | 34309.71 | 7499.48 | 37659.76 | 34695.5 | 24942.59 | 10395.17 | 26861.39 | 12891.38 | 13421.7 | 15870.92 | |
| std | 1.01E-13 | 1813.192 | 724.5416 | 1351.066 | 1064.184 | 2774.951 | 3152.076 | 6649.26 | 999.4261 | 3827.95 | 610.4995 | 1090.988 | 1965.735 | |
| median | 900 | 32083.93 | 14211.56 | 33154.35 | 6630.047 | 34003.68 | 29018.63 | 20737.44 | 9322.868 | 23677.19 | 12410.14 | 11804.64 | 14001.44 | |
| rank | 1 | 11 | 7 | 12 | 2 | 13 | 10 | 8 | 3 | 9 | 5 | 4 | 6 | |
| C17-F10 | mean | 4347.157 | 12297.65 | 8533.281 | 13280.88 | 7089.713 | 11311.92 | 11318.18 | 7996.932 | 8807.23 | 13109.85 | 8753.29 | 8101.21 | 11254.8 |
| best | 3555.132 | 11605.91 | 8403.143 | 12767.17 | 6333.566 | 10727.15 | 10020.91 | 6651.02 | 6939.843 | 12249.56 | 8402.124 | 7681.211 | 10764.36 | |
| worst | 5099.795 | 12872.86 | 8683.367 | 13570.06 | 7560.938 | 12147.75 | 12217.51 | 8843.609 | 13337.62 | 13918.05 | 9615.519 | 8869.181 | 12175.62 | |
| std | 701.4234 | 575.7262 | 146.9278 | 386.58 | 575.5683 | 711.9956 | 1022.132 | 1107.675 | 3313.016 | 821.9168 | 628.3406 | 571.2351 | 683.767 | |
| median | 4366.851 | 12355.92 | 8523.306 | 13393.14 | 7232.173 | 11186.4 | 11517.15 | 8246.549 | 7475.726 | 13135.89 | 8497.759 | 7927.225 | 11039.61 | |
| rank | 1 | 11 | 5 | 13 | 2 | 9 | 10 | 3 | 7 | 12 | 6 | 4 | 8 | |
| C17-F11 | mean | 1128.435 | 13254.8 | 2116.688 | 17775.28 | 1833.42 | 11266.11 | 4936.627 | 2086.933 | 5771.513 | 4949.467 | 12290.05 | 2170.136 | 20218.83 |
| best | 1121.25 | 12087.39 | 1830.939 | 15713.24 | 1641.984 | 10172.69 | 4393.008 | 1852.248 | 3603.077 | 4503.232 | 11434.11 | 1889.802 | 11967.98 | |
| worst | 1133.132 | 13732.8 | 2422.918 | 19153.88 | 2233.299 | 13218.48 | 6347.39 | 2506.348 | 9794.399 | 5791.665 | 13632.1 | 2324.625 | 26693.06 | |
| std | 5.92135 | 849.4603 | 263.3627 | 1631.104 | 301.5769 | 1486.826 | 1028.431 | 319.4048 | 3105.372 | 641.2799 | 1031.46 | 214.7852 | 6643.792 | |
| median | 1129.678 | 13599.51 | 2106.447 | 18117 | 1729.199 | 10836.65 | 4503.056 | 1994.568 | 4844.288 | 4751.485 | 12046.99 | 2233.059 | 21107.15 | |
| rank | 1 | 11 | 4 | 12 | 2 | 9 | 6 | 3 | 8 | 7 | 10 | 5 | 13 | |
| C17-F12 | mean | 2905.102 | 3.54E+10 | 2.11E+08 | 5.78E+10 | 1.63E+08 | 2.11E+10 | 1.22E+09 | 2.15E+08 | 9.26E+08 | 4.24E+09 | 1.91E+09 | 1.45E+09 | 3.17E+08 |
| best | 2527.376 | 2.98E+10 | 1.1E+08 | 4.22E+10 | 95831759 | 8.91E+09 | 9.68E+08 | 1.51E+08 | 2.07E+08 | 2.5E+09 | 7.26E+08 | 2.09E+08 | 2.26E+08 | |
| worst | 3168.37 | 4.24E+10 | 2.66E+08 | 7.91E+10 | 2.11E+08 | 3.54E+10 | 1.6E+09 | 2.53E+08 | 1.64E+09 | 8.22E+09 | 3.24E+09 | 3.84E+09 | 3.86E+08 | |
| std | 297.7638 | 6.2E+09 | 74870996 | 1.85E+10 | 53591181 | 1.19E+10 | 2.98E+08 | 51817338 | 7.64E+08 | 2.94E+09 | 1.13E+09 | 1.85E+09 | 73242431 | |
| median | 2962.331 | 3.48E+10 | 2.33E+08 | 5.49E+10 | 1.73E+08 | 2E+10 | 1.16E+09 | 2.29E+08 | 9.3E+08 | 3.12E+09 | 1.83E+09 | 8.76E+08 | 3.27E+08 | |
| rank | 1 | 12 | 3 | 13 | 2 | 11 | 7 | 4 | 6 | 10 | 9 | 8 | 5 | |
| C17-F13 | mean | 1340.1 | 1.99E+10 | 29140050 | 3.49E+10 | 29032641 | 8.19E+09 | 1.06E+08 | 29214686 | 3.18E+08 | 5.03E+08 | 44018606 | 4.15E+08 | 62625395 |
| best | 1333.781 | 1.15E+10 | 15082176 | 1.76E+10 | 14999822 | 4.36E+09 | 72744405 | 15106499 | 1.46E+08 | 4.04E+08 | 15009940 | 15025904 | 36890666 | |
| worst | 1343.015 | 2.72E+10 | 64128728 | 5.02E+10 | 64116553 | 1.27E+10 | 1.46E+08 | 64286770 | 7.91E+08 | 6.67E+08 | 73484293 | 9.95E+08 | 1.03E+08 | |
| std | 4.658645 | 7.5E+09 | 25452500 | 1.49E+10 | 25520623 | 3.84E+09 | 32892364 | 25514545 | 3.43E+08 | 1.27E+08 | 33816482 | 5.06E+08 | 31425996 | |
| median | 1341.801 | 2.05E+10 | 18674648 | 3.59E+10 | 18507094 | 7.85E+09 | 1.02E+08 | 18732738 | 1.68E+08 | 4.7E+08 | 43790095 | 3.26E+08 | 55307580 | |
| rank | 1 | 12 | 3 | 13 | 2 | 11 | 7 | 4 | 8 | 10 | 5 | 9 | 6 | |
| C17-F14 | mean | 1429.458 | 21419208 | 1382812 | 39595412 | 393518.5 | 2568787 | 4254329 | 546854.7 | 1325055 | 1093309 | 12662683 | 857145.1 | 9473280 |
| best | 1425.995 | 7220942 | 751383.8 | 12376432 | 326677.5 | 927699.9 | 3772080 | 450691.6 | 398040.1 | 930817.6 | 3226584 | 519753.6 | 4821344 | |
| worst | 1431.939 | 41607808 | 2712100 | 79818751 | 447530.2 | 3898450 | 5035760 | 625505.6 | 2244600 | 1255133 | 20593207 | 1069999 | 16073840 | |
| std | 2.851678 | 15781750 | 977068.1 | 31202565 | 67876.67 | 1342318 | 593266.1 | 78710.78 | 820976.9 | 196648.1 | 8552318 | 256936.7 | 5172877 | |
| median | 1429.95 | 18424041 | 1033882 | 33093232 | 399933.1 | 2724500 | 4104737 | 555610.7 | 1328791 | 1093643 | 13415470 | 919413.9 | 8498968 | |
| rank | 1 | 12 | 7 | 13 | 2 | 8 | 9 | 3 | 6 | 5 | 11 | 4 | 10 | |
| C17-F15 | mean | 1530.66 | 2.11E+09 | 1057529 | 3.39E+09 | 1028580 | 1.38E+09 | 9064409 | 1125076 | 5846302 | 58192649 | 1.61E+08 | 1035542 | 7974295 |
| best | 1526.359 | 1.5E+09 | 129732.7 | 2.65E+09 | 74782.39 | 4.76E+08 | 813893.6 | 219713.3 | 107340.5 | 34902841 | 783143 | 90330.99 | 4244923 | |
| worst | 1532.953 | 2.77E+09 | 1909492 | 4.02E+09 | 1886011 | 3.01E+09 | 16390082 | 1924768 | 14578094 | 75179730 | 6.21E+08 | 1886309 | 15151372 | |
| std | 3.191893 | 6.5E+08 | 837170.9 | 6.59E+08 | 851654.6 | 1.28E+09 | 7569081 | 814458.4 | 6721675 | 18326818 | 3.34E+08 | 845990.3 | 5405843 | |
| median | 1531.664 | 2.09E+09 | 1095445 | 3.45E+09 | 1076763 | 1.02E+09 | 9526831 | 1177912 | 4349887 | 61344012 | 11307332 | 1082764 | 6250442 | |
| rank | 1 | 12 | 4 | 13 | 2 | 11 | 8 | 5 | 6 | 9 | 10 | 3 | 7 | |
| C17-F16 | mean | 2062.891 | 5865.586 | 4302.479 | 6920.014 | 3004.84 | 4535.478 | 5224.679 | 3470.57 | 3468.218 | 4456.184 | 3979.612 | 3481.424 | 3945.63 |
| best | 1728.6 | 5246.472 | 4000.657 | 5435.58 | 2856.044 | 4127.203 | 4325.669 | 3337.527 | 3065.361 | 4182.74 | 3763.431 | 3124.763 | 3496.144 | |
| worst | 2242.663 | 7192.11 | 4702.332 | 9876.553 | 3131.765 | 4763.08 | 5825.538 | 3649.578 | 4004.577 | 4750.92 | 4288.477 | 3769.133 | 4355.434 | |
| std | 253.3831 | 995.1847 | 351.5548 | 2208.632 | 142.48 | 304.3711 | 722.4993 | 169.7208 | 491.0068 | 257.8711 | 261.4972 | 359.8899 | 439.383 | |
| median | 2140.15 | 5511.882 | 4253.462 | 6183.962 | 3015.775 | 4625.815 | 5373.755 | 3447.587 | 3401.466 | 4445.538 | 3933.271 | 3515.9 | 3965.471 | |
| rank | 1 | 12 | 8 | 13 | 2 | 10 | 11 | 4 | 3 | 9 | 7 | 5 | 6 | |
| C17-F17 | mean | 2021.151 | 6848.083 | 3556.425 | 9629.557 | 2746.348 | 3879.805 | 4346.813 | 3161.055 | 3078.243 | 4035.004 | 3768.66 | 3388.37 | 3577.713 |
| best | 1900.43 | 5301.597 | 3126.73 | 7139.453 | 2620.494 | 3174.823 | 3897.119 | 2645.258 | 2947.105 | 3448.757 | 3433.271 | 3161.766 | 3422.149 | |
| worst | 2138.267 | 8279.961 | 3984.3 | 12346.15 | 2826.921 | 4287.61 | 4563.699 | 3597.312 | 3336.306 | 4343.917 | 4016.635 | 3694.363 | 3711.093 | |
| std | 146.025 | 1337.246 | 433.6566 | 2332.841 | 96.16517 | 530.519 | 333.5717 | 430.4672 | 198.7397 | 441.2389 | 265.75 | 274.7319 | 152.2354 | |
| median | 2022.954 | 6905.386 | 3557.334 | 9516.314 | 2768.989 | 4028.394 | 4463.216 | 3200.825 | 3014.781 | 4173.671 | 3812.368 | 3348.676 | 3588.805 | |
| rank | 1 | 12 | 6 | 13 | 2 | 9 | 11 | 4 | 3 | 10 | 8 | 5 | 7 | |
| C17-F18 | mean | 1830.62 | 64809056 | 5394677 | 94478124 | 3461290 | 31856563 | 40065124 | 5580678 | 8080372 | 10088485 | 10257555 | 4108187 | 11118482 |
| best | 1822.239 | 53686283 | 3034887 | 46889386 | 963105.3 | 3514353 | 10878963 | 2221244 | 1894241 | 5532501 | 4183491 | 1244859 | 5015440 | |
| worst | 1841.673 | 74629822 | 8158394 | 1.27E+08 | 5983500 | 87143499 | 72254917 | 7349171 | 13443774 | 15199380 | 18698186 | 6398631 | 23037213 | |
| std | 8.860434 | 9422472 | 2461765 | 43284200 | 2456575 | 41161815 | 32747100 | 2581672 | 5815218 | 4557307 | 7084462 | 2492722 | 8998228 | |
| median | 1829.285 | 65460058 | 5192714 | 1.02E+08 | 3449276 | 18384199 | 38563309 | 6376148 | 8491736 | 9811030 | 9074271 | 4394628 | 8210638 | |
| rank | 1 | 12 | 4 | 13 | 2 | 10 | 11 | 5 | 6 | 7 | 8 | 3 | 9 | |
| C17-F19 | mean | 1925.185 | 2.21E+09 | 1054101 | 3.11E+09 | 845238.3 | 2.17E+09 | 6390103 | 4998182 | 1786352 | 41942343 | 1209978 | 1162654 | 1647542 |
| best | 1924.437 | 1.05E+09 | 738624.6 | 2.1E+09 | 479903.4 | 8519676 | 1312499 | 3754874 | 1053878 | 35483791 | 688976.4 | 480615.3 | 1335633 | |
| worst | 1926.121 | 3.69E+09 | 1666936 | 3.85E+09 | 1480789 | 6.33E+09 | 14551966 | 5976860 | 2928702 | 52668431 | 2282084 | 1928568 | 2108001 | |
| std | 0.860892 | 1.21E+09 | 452664.5 | 8.47E+08 | 486851.6 | 3.08E+09 | 6201332 | 1091078 | 873486.8 | 8248080 | 794827.7 | 687967.2 | 368268.7 | |
| median | 1925.091 | 2.05E+09 | 905421.7 | 3.25E+09 | 710130.5 | 1.17E+09 | 4847973 | 5130496 | 1581415 | 39808575 | 934426.5 | 1120716 | 1573266 | |
| rank | 1 | 12 | 3 | 13 | 2 | 11 | 9 | 8 | 7 | 10 | 5 | 4 | 6 | |
| C17-F20 | mean | 2160.172 | 3717.027 | 3260.069 | 3934.224 | 2768.725 | 3397.451 | 3653.399 | 3271.387 | 2739.715 | 3674.026 | 3889.794 | 3278.828 | 3180.586 |
| best | 2104.423 | 3399.714 | 2780.017 | 3661.976 | 2495.224 | 2984.482 | 3366.909 | 3075.111 | 2531.75 | 3598.109 | 3661.096 | 2973.788 | 3082.251 | |
| worst | 2323.891 | 3876.484 | 3706.835 | 4075.833 | 3025.157 | 3574.253 | 4142.691 | 3678.268 | 2912.856 | 3770.385 | 4143.729 | 3435.552 | 3297.711 | |
| std | 118.748 | 236.1103 | 422.9268 | 202.4307 | 240.6307 | 301.4758 | 371.4289 | 305.6783 | 211.1036 | 81.05394 | 215.029 | 225.3384 | 96.41896 | |
| median | 2106.186 | 3795.955 | 3276.712 | 3999.544 | 2777.259 | 3515.536 | 3551.997 | 3166.085 | 2757.128 | 3663.805 | 3877.175 | 3352.986 | 3171.19 | |
| rank | 1 | 11 | 5 | 13 | 3 | 8 | 9 | 6 | 2 | 10 | 12 | 7 | 4 | |
| C17-F21 | mean | 2314.895 | 2937.035 | 2744.131 | 2968.401 | 2494.788 | 2908.633 | 2901.223 | 2595.904 | 2553.318 | 2798.183 | 2814.628 | 2665.284 | 2739.49 |
| best | 2309.045 | 2907.981 | 2635.865 | 2873.81 | 2470.541 | 2833.317 | 2798.883 | 2564.953 | 2499.752 | 2771.335 | 2768.232 | 2597.611 | 2711.195 | |
| worst | 2329.683 | 2965.668 | 2897.153 | 3036.496 | 2518.032 | 3037.663 | 2990.677 | 2638.091 | 2599.768 | 2832.034 | 2844.164 | 2752.389 | 2752.7 | |
| std | 10.75568 | 30.30095 | 119.9531 | 82.1574 | 25.9814 | 97.40959 | 88.69152 | 37.28297 | 45.20868 | 31.1184 | 37.98088 | 74.47153 | 21.27125 | |
| median | 2310.426 | 2937.246 | 2721.753 | 2981.649 | 2495.29 | 2881.776 | 2907.667 | 2590.287 | 2556.876 | 2794.682 | 2823.058 | 2655.568 | 2747.032 | |
| rank | 1 | 12 | 7 | 13 | 2 | 11 | 10 | 4 | 3 | 8 | 9 | 5 | 6 | |
| C17-F22 | mean | 3095.169 | 14196.49 | 11073.38 | 15228.71 | 6365.453 | 13188.11 | 13128.51 | 9326.867 | 9225.422 | 14779.99 | 11310.18 | 9944.648 | 9192.805 |
| best | 2300 | 14033.76 | 9238.502 | 15114.45 | 3957.065 | 12798.56 | 12696.98 | 7576.304 | 8329.12 | 14295.42 | 11127.2 | 9372.921 | 5375.858 | |
| worst | 5480.678 | 14422.32 | 12439.08 | 15345.02 | 8916.005 | 13782.15 | 13512.81 | 10456.98 | 9653.614 | 15328.41 | 11476.98 | 10434.23 | 13124.4 | |
| std | 1730.112 | 177.7323 | 1594.41 | 114.417 | 3009.992 | 456.5786 | 364.2617 | 1347.328 | 657.65 | 520.0407 | 155.678 | 485.9433 | 4619.211 | |
| median | 2300 | 14164.93 | 11307.97 | 15227.68 | 6294.371 | 13085.86 | 13152.13 | 9637.091 | 9459.477 | 14748.06 | 11318.28 | 9985.72 | 9135.48 | |
| rank | 1 | 11 | 7 | 13 | 2 | 10 | 9 | 5 | 4 | 12 | 8 | 6 | 3 | |
| C17-F23 | mean | 2743.354 | 3724.426 | 3291.2 | 3786.62 | 2962.218 | 3661.4 | 3663.478 | 3043.413 | 3068.776 | 3282.921 | 4490.356 | 3361.173 | 3349.272 |
| best | 2729.988 | 3651.404 | 3214.739 | 3763.304 | 2950.353 | 3480.618 | 3505.094 | 3003.293 | 2995.842 | 3209.205 | 4323.322 | 3297.887 | 3234.048 | |
| worst | 2752.657 | 3820.757 | 3357.126 | 3812.399 | 2977.75 | 3955.284 | 3762.599 | 3095.901 | 3199.533 | 3332.588 | 4647.288 | 3423.377 | 3462.453 | |
| std | 10.89685 | 79.31584 | 78.73805 | 23.68215 | 13.81755 | 243.1923 | 122.3033 | 49.32064 | 97.49427 | 57.4981 | 144.2477 | 66.24321 | 101.5076 | |
| median | 2745.387 | 3712.771 | 3296.468 | 3785.388 | 2960.385 | 3604.849 | 3693.109 | 3037.229 | 3039.864 | 3294.945 | 4495.408 | 3361.715 | 3350.294 | |
| rank | 1 | 11 | 6 | 12 | 2 | 9 | 10 | 3 | 4 | 5 | 13 | 8 | 7 | |
| C17-F24 | mean | 2919.043 | 4072.237 | 3498.98 | 4298.729 | 3131.011 | 3903.337 | 3759.355 | 3188.425 | 3240.714 | 3445.651 | 4213.279 | 3457.812 | 3623.196 |
| best | 2909.046 | 3875.562 | 3400.823 | 3910.882 | 3099.847 | 3815.82 | 3660.966 | 3148.663 | 3151.149 | 3374.956 | 4177.74 | 3318.947 | 3583.166 | |
| worst | 2924.412 | 4533.876 | 3643.691 | 5273.47 | 3154.145 | 4020.03 | 3816.771 | 3213.778 | 3360.872 | 3486.057 | 4270.343 | 3588.304 | 3696.369 | |
| std | 7.423833 | 336.7661 | 112.0349 | 713.2005 | 29.28155 | 97.02285 | 75.51448 | 33.15498 | 95.74172 | 56.75356 | 47.40451 | 134.0236 | 54.55307 | |
| median | 2921.358 | 3939.754 | 3475.702 | 4005.282 | 3135.025 | 3888.748 | 3779.842 | 3195.629 | 3225.417 | 3460.796 | 4202.516 | 3461.998 | 3606.624 | |
| rank | 1 | 11 | 7 | 13 | 2 | 10 | 9 | 3 | 4 | 5 | 12 | 6 | 8 | |
| C17-F25 | mean | 2983.145 | 7736.397 | 3291.959 | 10470.34 | 3201.645 | 5609.915 | 4091.272 | 3190.91 | 3992.635 | 4270.928 | 4191.957 | 3245.437 | 4004.664 |
| best | 2980.235 | 6497.419 | 3272.926 | 8548.133 | 3192.781 | 4694.464 | 3744.106 | 3168.794 | 3826.505 | 3882.895 | 3912.58 | 3196.721 | 3927.118 | |
| worst | 2991.831 | 8512.499 | 3340.567 | 11642.69 | 3223.01 | 6474.448 | 4354.968 | 3214.121 | 4148.014 | 4763.265 | 4721.396 | 3292.152 | 4093.46 | |
| std | 6.299384 | 975.905 | 35.37121 | 1587.925 | 15.55327 | 831.0924 | 281.0726 | 20.53635 | 182.5845 | 487.4691 | 412.5417 | 53.3023 | 74.3482 | |
| median | 2980.257 | 7967.836 | 3277.172 | 10845.26 | 3195.394 | 5635.374 | 4133.007 | 3190.361 | 3998.011 | 4218.777 | 4066.927 | 3246.438 | 3999.039 | |
| rank | 1 | 12 | 5 | 13 | 3 | 11 | 8 | 2 | 6 | 10 | 9 | 4 | 7 | |
| C17-F26 | mean | 3776.432 | 13205.47 | 10651.35 | 14013.71 | 4370.807 | 12005.93 | 12984.15 | 6393.223 | 6988.245 | 9622.975 | 11120.28 | 8309.269 | 9019.51 |
| best | 3748.807 | 13022.2 | 10285.51 | 13559.53 | 4259.443 | 10277.96 | 12142.67 | 6044.941 | 6671.316 | 8969.807 | 10843.64 | 7757.049 | 7493.217 | |
| worst | 3793.643 | 13367.83 | 11084.66 | 14807.67 | 4530.472 | 12969.02 | 14457 | 6623.689 | 7302.684 | 10164.01 | 11506.39 | 8783.881 | 10932.4 | |
| std | 21.15984 | 165.6016 | 362.9509 | 598.9201 | 144.6035 | 1289.455 | 1101.72 | 287.1685 | 367.9791 | 555.7698 | 315.598 | 503.3726 | 1795.318 | |
| median | 3781.639 | 13215.92 | 10617.63 | 13843.83 | 4346.657 | 12388.36 | 12668.47 | 6452.131 | 6989.491 | 9679.043 | 11065.54 | 8348.074 | 8826.211 | |
| rank | 1 | 12 | 8 | 13 | 2 | 10 | 11 | 3 | 4 | 7 | 9 | 5 | 6 | |
| C17-F27 | mean | 3251.26 | 4632.85 | 3854.307 | 4788.267 | 3471.181 | 4559.232 | 4354.733 | 3453.597 | 3681.731 | 3838.248 | 7333.892 | 3686.23 | 4342.006 |
| best | 3227.701 | 4328.511 | 3773.16 | 4436.845 | 3411.396 | 4002.067 | 3839.574 | 3377.73 | 3601.578 | 3720.803 | 7114.652 | 3426.734 | 4208.145 | |
| worst | 3313.631 | 4783.274 | 3949.134 | 5010.243 | 3595.186 | 4938.377 | 4869.363 | 3540.929 | 3764.048 | 3949.409 | 7587.147 | 3859.067 | 4503.043 | |
| std | 45.37533 | 233.1427 | 78.9762 | 290.4065 | 91.91125 | 457.6084 | 529.238 | 82.49883 | 89.95059 | 104.576 | 249.9642 | 216.5245 | 132.2133 | |
| median | 3231.854 | 4709.807 | 3847.468 | 4852.99 | 3439.071 | 4648.242 | 4354.998 | 3447.865 | 3680.649 | 3841.39 | 7316.884 | 3729.559 | 4328.418 | |
| rank | 1 | 11 | 7 | 12 | 3 | 10 | 9 | 2 | 4 | 6 | 13 | 5 | 8 | |
| C17-F28 | mean | 3258.849 | 7925.265 | 3711.316 | 9933.583 | 3513.464 | 6715.312 | 4719.398 | 3458.998 | 4375.884 | 5070.13 | 4915.08 | 3940.269 | 4898.891 |
| best | 3258.849 | 7254.886 | 3587.253 | 8825.367 | 3426.931 | 5606.324 | 4162.72 | 3414.919 | 4097.004 | 4583.099 | 4875.165 | 3702.38 | 4686.733 | |
| worst | 3258.849 | 9693.952 | 3792.688 | 12723.47 | 3587.135 | 7876.996 | 4947.471 | 3498.231 | 4692.255 | 5556.052 | 4957.328 | 4360.403 | 5076.712 | |
| std | 0 | 1288.362 | 104.4625 | 2029.42 | 71.96829 | 1233.812 | 406.4701 | 42.95225 | 295.6242 | 432.1752 | 42.80497 | 313.9815 | 183.2972 | |
| median | 3258.849 | 7376.111 | 3732.663 | 9092.748 | 3519.895 | 6688.964 | 4883.7 | 3461.421 | 4357.138 | 5070.684 | 4913.914 | 3849.147 | 4916.06 | |
| rank | 1 | 12 | 4 | 13 | 3 | 11 | 7 | 2 | 6 | 10 | 9 | 5 | 8 | |
| C17-F29 | mean | 3263.038 | 12353.01 | 5686.251 | 17168.73 | 4529.902 | 6833.893 | 8592.371 | 5140.407 | 5171.216 | 6534.254 | 7882.215 | 5143.118 | 6217.421 |
| best | 3247.132 | 8563.049 | 5585.325 | 9645.742 | 4033.354 | 6484.723 | 5966.858 | 4791.469 | 4837.655 | 5587.564 | 6811.608 | 4750.136 | 5769.616 | |
| worst | 3278.787 | 16324.7 | 5871.373 | 26271.47 | 4737.879 | 7445.224 | 11074.86 | 5640.57 | 5436.431 | 7527.257 | 9978.992 | 5380.845 | 6722.844 | |
| std | 18.99097 | 3941.317 | 143.3559 | 8087.715 | 361.9768 | 459.4859 | 2287.018 | 410.6392 | 320.8973 | 950.287 | 1608.105 | 296.6048 | 427.0937 | |
| median | 3263.116 | 12262.14 | 5644.153 | 16378.85 | 4674.188 | 6702.812 | 8663.883 | 5064.794 | 5205.39 | 6511.097 | 7369.13 | 5220.746 | 6188.612 | |
| rank | 1 | 12 | 6 | 13 | 2 | 9 | 11 | 3 | 5 | 8 | 10 | 4 | 7 | |
| C17-F30 | mean | 623575.2 | 2.68E+09 | 41437213 | 4.48E+09 | 25041630 | 1.37E+09 | 1.52E+08 | 80896757 | 1.37E+08 | 2.67E+08 | 1.73E+08 | 27601219 | 71121782 |
| best | 582411.6 | 2.07E+09 | 27769756 | 2.75E+09 | 18070418 | 1.96E+08 | 1.04E+08 | 74219322 | 71683636 | 1.87E+08 | 1.45E+08 | 20098612 | 56637848 | |
| worst | 655637.4 | 3.64E+09 | 55051138 | 7.02E+09 | 32054014 | 2.75E+09 | 2.08E+08 | 85086201 | 1.98E+08 | 3.38E+08 | 2.27E+08 | 35355967 | 83831645 | |
| std | 35536.86 | 7.42E+08 | 15457701 | 2E+09 | 8620851 | 1.43E+09 | 57672201 | 5099895 | 70355384 | 67902860 | 40022492 | 8158633 | 12419998 | |
| median | 628125.9 | 2.51E+09 | 41463979 | 4.07E+09 | 25021044 | 1.27E+09 | 1.49E+08 | 82140752 | 1.39E+08 | 2.72E+08 | 1.61E+08 | 27475149 | 72008818 | |
| rank | 1 | 12 | 4 | 13 | 2 | 11 | 8 | 6 | 7 | 10 | 9 | 3 | 5 | |
| Sum rank | 29 | 335 | 166 | 367 | 64 | 294 | 269 | 112 | 144 | 248 | 254 | 150 | 207 | |
| Mean rank | 1 | 11.55172 | 5.724138 | 12.65517 | 2.206897 | 10.13793 | 9.275862 | 3.862069 | 4.965517 | 8.551724 | 8.758621 | 5.172414 | 7.137931 | |
| Total rank | 1 | 12 | 6 | 13 | 2 | 11 | 10 | 3 | 4 | 8 | 9 | 5 | 7 | |
Table 5.
Optimization results for the CEC 2017 test suite (dimension=100).
| OOA | WSO | AVOA | RSA | MPA | TSA | WOA | MVO | GWO | TLBO | GSA | PSO | GA | ||
|---|---|---|---|---|---|---|---|---|---|---|---|---|---|---|
| C17-F1 | mean | 100 | 1.43E+11 | 1.08E+10 | 1.97E+11 | 8.12E+09 | 1.1E+11 | 5.85E+10 | 7.75E+09 | 5.4E+10 | 8.16E+10 | 1.18E+11 | 2.39E+10 | 5.32E+10 |
| best | 100 | 1.39E+11 | 9.2E+09 | 1.93E+11 | 7.8E+09 | 9.72E+10 | 5.6E+10 | 7.33E+09 | 4.78E+10 | 7.83E+10 | 1.09E+11 | 1.86E+10 | 5.07E+10 | |
| worst | 100 | 1.47E+11 | 1.17E+10 | 1.98E+11 | 8.44E+09 | 1.22E+11 | 6.46E+10 | 8.01E+09 | 6.04E+10 | 8.93E+10 | 1.26E+11 | 3E+10 | 5.93E+10 | |
| std | 1.26E-14 | 3.33E+09 | 1.2E+09 | 2.32E+09 | 2.95E+08 | 1.13E+10 | 4.45E+09 | 3.29E+08 | 6.58E+09 | 5.64E+09 | 7.69E+09 | 6.54E+09 | 4.49E+09 | |
| median | 100 | 1.43E+11 | 1.11E+10 | 1.97E+11 | 8.12E+09 | 1.1E+11 | 5.68E+10 | 7.84E+09 | 5.39E+10 | 7.94E+10 | 1.19E+11 | 2.36E+10 | 5.13E+10 | |
| rank | 1 | 12 | 4 | 13 | 3 | 10 | 8 | 2 | 7 | 9 | 11 | 5 | 6 | |
| C17-F3 | mean | 300 | 451046.4 | 368624.4 | 365517.8 | 232072.1 | 398693.7 | 743396.8 | 481715.7 | 402444.6 | 344084.1 | 382345.2 | 542289.3 | 571803.4 |
| best | 300 | 415657.7 | 356641.4 | 358496.6 | 197477.5 | 335586 | 659039.2 | 411984.4 | 371309.4 | 334398.3 | 366869.9 | 431473.7 | 548010.5 | |
| worst | 300 | 472183.2 | 379770.7 | 375732.1 | 264148.4 | 434715.5 | 849656.6 | 561323.9 | 435992.9 | 353420.3 | 413817.3 | 713381.9 | 592229.4 | |
| std | 0 | 26725.61 | 11798.75 | 8201.517 | 29932.45 | 47632.7 | 87812.76 | 78194.62 | 37769.45 | 9748.12 | 23163.56 | 140245.3 | 22448.33 | |
| median | 300 | 458172.3 | 369042.8 | 363921.3 | 233331.1 | 412236.5 | 732445.6 | 476777.3 | 401238 | 344258.9 | 374346.9 | 512150.8 | 573486.7 | |
| rank | 1 | 9 | 5 | 4 | 2 | 7 | 13 | 10 | 8 | 3 | 6 | 11 | 12 | |
| C17-F4 | mean | 602.1722 | 37102.42 | 2294.782 | 61849.41 | 1860.959 | 13996.28 | 9894.146 | 1651.801 | 4652.86 | 9732.592 | 28652.08 | 3038.059 | 8489.017 |
| best | 592.0676 | 34057.31 | 2222.33 | 55989.75 | 1747.744 | 9497.259 | 8411.188 | 1489.046 | 3643.242 | 9152.241 | 23151.2 | 2402.387 | 8054.664 | |
| worst | 612.2769 | 40612.43 | 2456.32 | 68829.08 | 2111.872 | 18424.71 | 10795.7 | 1796.243 | 6628.828 | 10596.27 | 32270.17 | 3595.684 | 9110.992 | |
| std | 12.6933 | 3069.679 | 118.0367 | 5770.233 | 183.6471 | 3997.274 | 1120.559 | 151.4474 | 1458.355 | 712.2235 | 4838.803 | 559.3681 | 545.0467 | |
| median | 602.1722 | 36869.97 | 2250.238 | 61289.4 | 1792.109 | 14031.57 | 10184.85 | 1660.957 | 4169.685 | 9590.929 | 29593.49 | 3077.083 | 8395.206 | |
| rank | 1 | 12 | 4 | 13 | 3 | 10 | 9 | 2 | 6 | 8 | 11 | 5 | 7 | |
| C17-F5 | mean | 512.9345 | 1849.015 | 1309.375 | 1824.647 | 1238.466 | 1971.239 | 1726.6 | 1246.823 | 1204.711 | 1754.424 | 1326.904 | 1388.776 | 1522.935 |
| best | 510.9445 | 1832.77 | 1289.071 | 1803.544 | 1131.464 | 1947.724 | 1643.663 | 1148.939 | 1148.666 | 1721.95 | 1294.324 | 1302.797 | 1395.175 | |
| worst | 514.9244 | 1870.179 | 1328.839 | 1841.719 | 1305.988 | 1989.255 | 1864.962 | 1320.012 | 1260.571 | 1772.504 | 1365.707 | 1521.331 | 1592.194 | |
| std | 1.976192 | 16.92763 | 17.72822 | 20.77925 | 86.88884 | 19.45261 | 104.9591 | 81.19712 | 51.05139 | 25.62091 | 40.07086 | 107.2337 | 101.0663 | |
| median | 512.9345 | 1846.556 | 1309.794 | 1826.662 | 1258.205 | 1973.989 | 1698.887 | 1259.17 | 1204.804 | 1761.622 | 1323.792 | 1365.488 | 1552.185 | |
| rank | 1 | 12 | 5 | 11 | 3 | 13 | 9 | 4 | 2 | 10 | 6 | 7 | 8 | |
| C17-F6 | mean | 600 | 697.5095 | 662.3688 | 696.1405 | 643.0508 | 701.1107 | 695.5302 | 672.4315 | 645.3117 | 677.6633 | 664.0424 | 662.021 | 663.3134 |
| best | 600 | 696.1278 | 658.7847 | 693.2983 | 639.655 | 692.4216 | 687.4218 | 668.1534 | 641.1509 | 670.4929 | 661.6138 | 657.3741 | 657.2851 | |
| worst | 600 | 699.3058 | 665.2544 | 697.9734 | 647.9631 | 707.6217 | 710.2691 | 677.0231 | 651.3684 | 682.915 | 668.4325 | 666.2978 | 667.3333 | |
| std | 0 | 1.631232 | 2.911396 | 2.22489 | 3.938934 | 8.091524 | 11.21622 | 4.256612 | 4.847844 | 6.14604 | 3.298814 | 4.844511 | 5.252931 | |
| median | 600 | 697.3022 | 662.718 | 696.6452 | 642.2925 | 702.1997 | 692.2149 | 672.2748 | 644.3637 | 678.6226 | 663.0617 | 662.2061 | 664.3176 | |
| rank | 1 | 12 | 5 | 11 | 2 | 13 | 10 | 8 | 3 | 9 | 7 | 4 | 6 | |
| C17-F7 | mean | 811.392 | 3337.98 | 2919.302 | 3429.704 | 1942.299 | 3200.316 | 3315.168 | 2072.342 | 2084.564 | 2932.351 | 2952.401 | 2442.358 | 2519.737 |
| best | 810.0205 | 3273.163 | 2799.475 | 3361.862 | 1902.705 | 3052.784 | 3213.368 | 1937.963 | 1941.242 | 2821.94 | 2855.288 | 2225.082 | 2434.182 | |
| worst | 813.1726 | 3425.951 | 3019.773 | 3485.678 | 2001.302 | 3341.383 | 3461.669 | 2176.892 | 2199.832 | 3020.888 | 3118.909 | 2541.185 | 2701.024 | |
| std | 1.589565 | 69.39864 | 124.7716 | 60.37223 | 48.67643 | 138.8142 | 121.2854 | 108.0829 | 116.4936 | 90.17365 | 125.5836 | 160.9562 | 133.1111 | |
| median | 811.1874 | 3326.404 | 2928.979 | 3435.638 | 1932.594 | 3203.548 | 3292.818 | 2087.257 | 2098.591 | 2943.287 | 2917.703 | 2501.582 | 2471.871 | |
| rank | 1 | 12 | 7 | 13 | 2 | 10 | 11 | 3 | 4 | 8 | 9 | 5 | 6 | |
| C17-F8 | mean | 812.437 | 2252.668 | 1715.54 | 2295.784 | 1474.727 | 2234.763 | 2171.736 | 1493.381 | 1541.767 | 2120.39 | 1785.009 | 1690.75 | 1946.815 |
| best | 808.9546 | 2197.101 | 1655.867 | 2260.803 | 1322.369 | 2174.674 | 1995.986 | 1381.774 | 1442.764 | 2078.187 | 1703.036 | 1642.296 | 1889.142 | |
| worst | 816.9143 | 2309.409 | 1761.054 | 2321.314 | 1582.188 | 2312.968 | 2316.634 | 1660.906 | 1661.656 | 2146.659 | 1897.294 | 1789.432 | 1996.681 | |
| std | 3.697116 | 57.91902 | 50.78528 | 28.75944 | 119.2271 | 65.34701 | 176.6718 | 129.1747 | 112.1691 | 32.29819 | 97.20606 | 73.37746 | 55.76106 | |
| median | 811.9395 | 2252.081 | 1722.619 | 2300.51 | 1497.175 | 2225.705 | 2187.161 | 1465.421 | 1531.323 | 2128.358 | 1769.854 | 1665.636 | 1950.719 | |
| rank | 1 | 12 | 6 | 13 | 2 | 11 | 10 | 3 | 4 | 9 | 7 | 5 | 8 | |
| C17-F9 | mean | 900 | 81161.25 | 31377.83 | 71098.2 | 28205.81 | 104895.4 | 70717.55 | 56988.28 | 38781.24 | 68886.9 | 29093.76 | 36368.58 | 46627.7 |
| best | 900 | 72932.37 | 29130.49 | 68926.32 | 26834.05 | 87246.36 | 56948.01 | 49058.87 | 27898.07 | 66269.65 | 28722.56 | 31733.83 | 42824.19 | |
| worst | 900 | 93336.1 | 33573.27 | 73976.47 | 29759.44 | 129436.5 | 87584.54 | 64582.54 | 48245.72 | 71162.38 | 29674.14 | 40523.97 | 50515.68 | |
| std | 1.01E-13 | 9596.367 | 1978.602 | 2384.171 | 1320.54 | 19311.19 | 16529.67 | 6912.151 | 10531.96 | 2224 | 445.1952 | 4050.232 | 3576.52 | |
| median | 900 | 79188.26 | 31403.77 | 70745.01 | 28114.87 | 101449.4 | 69168.83 | 57155.85 | 39490.59 | 69057.79 | 28989.17 | 36608.26 | 46585.46 | |
| rank | 1 | 12 | 4 | 11 | 2 | 13 | 10 | 8 | 6 | 9 | 3 | 5 | 7 | |
| C17-F10 | mean | 11023.04 | 27933.01 | 16622.37 | 28980.38 | 14973.69 | 27214.57 | 26392.24 | 17428.73 | 16007.78 | 28988.01 | 17613.36 | 17493.08 | 24630.72 |
| best | 9625.608 | 27652.61 | 14618.74 | 28225 | 14364.8 | 26729.76 | 25708.76 | 16870.74 | 15072.66 | 27952.24 | 16173.88 | 16144.07 | 24175.53 | |
| worst | 11858.81 | 28262.62 | 18379.39 | 29449.1 | 15732.57 | 27910.52 | 27595.69 | 17906.53 | 16426.6 | 29843 | 18375.97 | 18473.24 | 25158.41 | |
| std | 1054.018 | 288.4128 | 1802.248 | 596.7115 | 630.0595 | 594.7952 | 937.4496 | 490.4926 | 688.4886 | 853.3036 | 1123.417 | 1062.368 | 440.9406 | |
| median | 11303.87 | 27908.4 | 16745.67 | 29123.71 | 14898.69 | 27108.99 | 26132.26 | 17468.83 | 16265.92 | 29078.4 | 17951.79 | 17677.52 | 24594.46 | |
| rank | 1 | 11 | 4 | 12 | 2 | 10 | 9 | 5 | 3 | 13 | 7 | 6 | 8 | |
| C17-F11 | mean | 1162.329 | 149568 | 69828.1 | 182882.2 | 22716.4 | 70817.28 | 184408.9 | 22555.74 | 88145.51 | 75900.56 | 156108.1 | 60242.48 | 129524.6 |
| best | 1139.568 | 114846.1 | 59194.46 | 138888.4 | 17131.19 | 50522.8 | 110432.1 | 16618.66 | 70952.41 | 68433.09 | 127769.2 | 32235.93 | 109653.7 | |
| worst | 1220.662 | 167720.5 | 77624.56 | 247784 | 30456.36 | 95455.46 | 293732.2 | 30619.61 | 95127.79 | 86110.74 | 181252.7 | 111381.2 | 173704.3 | |
| std | 42.46663 | 26735.73 | 9010.771 | 51903.2 | 7078.385 | 20170.86 | 93192.7 | 7101.506 | 12544.43 | 8046.173 | 25401.83 | 38324.65 | 32735.39 | |
| median | 1144.542 | 157852.8 | 71246.7 | 172428.1 | 21639.03 | 68645.43 | 166735.7 | 21492.35 | 93250.92 | 74529.21 | 157705.3 | 48676.38 | 117370.1 | |
| rank | 1 | 10 | 5 | 12 | 3 | 6 | 13 | 2 | 8 | 7 | 11 | 4 | 9 | |
| C17-F12 | mean | 5974.805 | 8.54E+10 | 2.1E+09 | 1.38E+11 | 1.78E+09 | 4.67E+10 | 1.21E+10 | 1.84E+09 | 1.07E+10 | 1.9E+10 | 5.47E+10 | 9.59E+09 | 1.14E+10 |
| best | 5383.905 | 6.1E+10 | 1.85E+09 | 1.03E+11 | 1.61E+09 | 2.46E+10 | 9.94E+09 | 1.61E+09 | 7.66E+09 | 1.51E+10 | 4.77E+10 | 2.41E+09 | 1.04E+10 | |
| worst | 6570.199 | 9.51E+10 | 2.4E+09 | 1.6E+11 | 2.06E+09 | 7.67E+10 | 1.38E+10 | 2.1E+09 | 1.27E+10 | 2.54E+10 | 6.43E+10 | 1.67E+10 | 1.3E+10 | |
| std | 537.9317 | 1.77E+10 | 2.75E+08 | 2.82E+10 | 2.15E+08 | 2.37E+10 | 1.76E+09 | 2.21E+08 | 2.32E+09 | 5.01E+09 | 7.55E+09 | 7.1E+09 | 1.21E+09 | |
| median | 5972.559 | 9.27E+10 | 2.07E+09 | 1.44E+11 | 1.72E+09 | 4.28E+10 | 1.22E+10 | 1.82E+09 | 1.12E+10 | 1.77E+10 | 5.33E+10 | 9.64E+09 | 1.11E+10 | |
| rank | 1 | 12 | 4 | 13 | 2 | 10 | 8 | 3 | 6 | 9 | 11 | 5 | 7 | |
| C17-F13 | mean | 1407.28 | 2.22E+10 | 92705799 | 3.4E+10 | 92704726 | 1.71E+10 | 5.08E+08 | 92909190 | 8.46E+08 | 2.33E+09 | 7.03E+09 | 1.5E+09 | 2.32E+08 |
| best | 1371.145 | 1.94E+10 | 35778021 | 2.63E+10 | 35755981 | 1.23E+10 | 3.37E+08 | 35985369 | 1.15E+08 | 1.6E+09 | 4.47E+09 | 3.52E+08 | 1.96E+08 | |
| worst | 1439.935 | 2.46E+10 | 1.98E+08 | 3.85E+10 | 1.98E+08 | 2.04E+10 | 7.01E+08 | 1.98E+08 | 2.19E+09 | 2.8E+09 | 8.95E+09 | 2.57E+09 | 3.15E+08 | |
| std | 37.80433 | 2.94E+09 | 79765863 | 6.11E+09 | 79848507 | 3.75E+09 | 1.91E+08 | 79806622 | 1.05E+09 | 6.28E+08 | 2.04E+09 | 1.22E+09 | 60812858 | |
| median | 1409.02 | 2.25E+10 | 68676712 | 3.56E+10 | 68624578 | 1.78E+10 | 4.97E+08 | 68850376 | 5.4E+08 | 2.47E+09 | 7.36E+09 | 1.53E+09 | 2.08E+08 | |
| rank | 1 | 12 | 3 | 13 | 2 | 11 | 6 | 4 | 7 | 9 | 10 | 8 | 5 | |
| C17-F14 | mean | 1467.509 | 37877947 | 7030862 | 65154615 | 1789028 | 8800333 | 13302701 | 4132558 | 9375532 | 12792370 | 10872498 | 2365705 | 10080431 |
| best | 1458.803 | 32644101 | 4836376 | 59274295 | 1451673 | 4633128 | 8085077 | 2137713 | 6252979 | 9660718 | 8670929 | 1724020 | 6088320 | |
| worst | 1472.733 | 42717300 | 10230438 | 70853221 | 2449331 | 15229629 | 18266273 | 5754127 | 13910468 | 15767450 | 16160007 | 2961405 | 13934641 | |
| std | 6.576739 | 4963041 | 2644356 | 6244886 | 502925 | 4923552 | 4527378 | 1623783 | 3621921 | 3171801 | 3856890 | 735855.9 | 3656357 | |
| median | 1469.25 | 38075194 | 6528317 | 65245472 | 1627554 | 7669288 | 13429726 | 4319195 | 8669341 | 12870655 | 9329528 | 2388697 | 10149383 | |
| rank | 1 | 12 | 5 | 13 | 2 | 6 | 11 | 4 | 7 | 10 | 9 | 3 | 8 | |
| C17-F15 | mean | 1609.893 | 1.23E+10 | 36148098 | 1.88E+10 | 36125523 | 9.64E+09 | 91903589 | 36181669 | 4.35E+08 | 9.85E+08 | 1.02E+09 | 3.02E+08 | 46185681 |
| best | 1551.154 | 1.14E+10 | 4620645 | 1.34E+10 | 4600463 | 2.97E+08 | 35638382 | 4652118 | 30734893 | 3.22E+08 | 4.01E+08 | 4596634 | 11063176 | |
| worst | 1652.294 | 1.38E+10 | 98030172 | 2.34E+10 | 98018720 | 1.8E+10 | 1.38E+08 | 98121965 | 1.29E+09 | 2.06E+09 | 1.31E+09 | 1.15E+09 | 1.06E+08 | |
| std | 48.04352 | 1.13E+09 | 46426465 | 5.4E+09 | 46426649 | 8.37E+09 | 58260804 | 46461525 | 6.35E+08 | 8.24E+08 | 4.65E+08 | 6.13E+08 | 44890477 | |
| median | 1618.063 | 1.2E+10 | 20970788 | 1.92E+10 | 20941454 | 1.01E+10 | 97112930 | 20976297 | 2.08E+08 | 7.81E+08 | 1.19E+09 | 27775652 | 34071994 | |
| rank | 1 | 12 | 3 | 13 | 2 | 11 | 6 | 4 | 8 | 9 | 10 | 7 | 5 | |
| C17-F16 | mean | 2711.795 | 16956.42 | 7552.816 | 19908.63 | 6270.614 | 13471.55 | 14803.2 | 7124.848 | 6730.714 | 11026.59 | 10677.43 | 7035.656 | 10268.09 |
| best | 2171.69 | 16007.51 | 6709.001 | 16133.46 | 5919.695 | 11490.42 | 12128.13 | 6250.449 | 6032.372 | 10331.36 | 9600.774 | 6791.042 | 9538.753 | |
| worst | 3397.326 | 17485.94 | 8251.32 | 22115.6 | 6491.927 | 15887.83 | 16307.44 | 7634.981 | 7341.49 | 11961.13 | 12131.25 | 7278.783 | 11023.86 | |
| std | 554.7769 | 716.5046 | 741.4654 | 2883.213 | 269.5269 | 1972.259 | 2042.204 | 673.9321 | 689.516 | 758.3312 | 1324.658 | 243.6691 | 798.3217 | |
| median | 2639.081 | 17166.11 | 7625.471 | 20692.72 | 6335.418 | 13253.97 | 15388.61 | 7306.98 | 6774.497 | 10906.93 | 10488.85 | 7036.4 | 10254.87 | |
| rank | 1 | 12 | 6 | 13 | 2 | 10 | 11 | 5 | 3 | 9 | 8 | 4 | 7 | |
| C17-F17 | mean | 2716.564 | 3365610 | 6430.282 | 6619405 | 5476.521 | 176124.7 | 15353.45 | 5732.037 | 6159.788 | 8742.176 | 38771.89 | 6632.116 | 7475.817 |
| best | 2275.021 | 987545.6 | 5834.403 | 1795159 | 4954.032 | 9823.899 | 9680.716 | 4946.827 | 5222.365 | 8212.171 | 26862.3 | 6275.044 | 7169.382 | |
| worst | 3429.127 | 7655924 | 7244.689 | 15230014 | 6446.831 | 464683.5 | 25617.31 | 6831.876 | 8313.246 | 9720.505 | 61502.54 | 7427.666 | 8170.364 | |
| std | 559.6669 | 3419822 | 734.3657 | 6876178 | 720.5443 | 216152.4 | 7812.729 | 915.3856 | 1590.62 | 727.9721 | 16885.01 | 585.2986 | 513.0574 | |
| median | 2581.054 | 2409486 | 6321.018 | 4726223 | 5252.611 | 114995.7 | 13057.88 | 5574.723 | 5551.77 | 8518.013 | 33361.35 | 6412.876 | 7281.761 | |
| rank | 1 | 12 | 5 | 13 | 2 | 11 | 9 | 3 | 4 | 8 | 10 | 6 | 7 | |
| C17-F18 | mean | 1903.746 | 48321455 | 4006624 | 83925434 | 1946085 | 13642201 | 11330387 | 5674461 | 10499161 | 14680584 | 11134106 | 6893096 | 6574933 |
| best | 1881.15 | 22849837 | 2969936 | 33647437 | 1493217 | 6725159 | 8873986 | 4057958 | 3911427 | 11373385 | 6174512 | 5013791 | 5644819 | |
| worst | 1919.921 | 85359823 | 5004943 | 1.51E+08 | 2403941 | 25438717 | 13611211 | 8329885 | 16395523 | 20018055 | 21997169 | 9149896 | 9243974 | |
| std | 21.08244 | 28950727 | 1089465 | 53911503 | 406115.7 | 9242429 | 2391759 | 2032840 | 5588730 | 4133768 | 8093266 | 2379436 | 1936009 | |
| median | 1906.955 | 42538079 | 4025808 | 75327659 | 1943590 | 11202463 | 11418175 | 5155001 | 10844848 | 13665447 | 8182372 | 6704350 | 5705468 | |
| rank | 1 | 12 | 3 | 13 | 2 | 10 | 9 | 4 | 7 | 11 | 8 | 6 | 5 | |
| C17-F19 | mean | 1972.839 | 1.02E+10 | 34605426 | 1.79E+10 | 32532429 | 4.06E+09 | 1.39E+08 | 45583318 | 3.2E+08 | 5.66E+08 | 1.29E+09 | 2.47E+08 | 42519521 |
| best | 1967.139 | 9.03E+09 | 6396950 | 1.31E+10 | 5896170 | 1.82E+09 | 47932771 | 13260051 | 8310619 | 2.68E+08 | 2.32E+08 | 57827018 | 12977414 | |
| worst | 1977.869 | 1.19E+10 | 83541290 | 2.22E+10 | 81285149 | 8.08E+09 | 2.2E+08 | 1.02E+08 | 9.46E+08 | 1.31E+09 | 2.39E+09 | 5.47E+08 | 86450536 | |
| std | 4.935585 | 1.44E+09 | 38700445 | 4.09E+09 | 38678074 | 3.02E+09 | 1E+08 | 45816907 | 4.77E+08 | 5.43E+08 | 1.16E+09 | 2.52E+08 | 35326744 | |
| median | 1973.174 | 9.88E+09 | 24241732 | 1.81E+10 | 21474198 | 3.17E+09 | 1.44E+08 | 33367906 | 1.63E+08 | 3.44E+08 | 1.28E+09 | 1.93E+08 | 35325068 | |
| rank | 1 | 12 | 3 | 13 | 2 | 11 | 6 | 5 | 8 | 9 | 10 | 7 | 4 | |
| C17-F20 | mean | 3192.04 | 7067.911 | 6178.745 | 7270.696 | 4831.952 | 6861.097 | 6871.169 | 5886.822 | 6097.235 | 7035.009 | 6294.737 | 5534.794 | 6255.772 |
| best | 2806.762 | 6963.225 | 5892.118 | 7085.342 | 4728.794 | 6409.075 | 6520.18 | 5543.496 | 5010.259 | 6435.384 | 5937.328 | 4965.732 | 5814.332 | |
| worst | 3662.121 | 7223.823 | 6433.779 | 7349.966 | 4907.249 | 7493.326 | 7093.428 | 6345.297 | 6851.618 | 7341.828 | 6529.328 | 6242.25 | 6668.691 | |
| std | 477.9749 | 120.9072 | 250.015 | 136.2455 | 81.48558 | 504.9362 | 283.8104 | 364.0394 | 986.9628 | 448.3479 | 301.3688 | 582.4701 | 423.2851 | |
| median | 3149.639 | 7042.298 | 6194.542 | 7323.739 | 4845.883 | 6770.993 | 6935.534 | 5829.248 | 6263.532 | 7181.413 | 6356.147 | 5465.597 | 6270.032 | |
| rank | 1 | 12 | 6 | 13 | 2 | 9 | 10 | 4 | 5 | 11 | 8 | 3 | 7 | |
| C17-F21 | mean | 2342.155 | 4107.347 | 3613.51 | 4206.109 | 2948.993 | 3975.75 | 4057.837 | 3271.189 | 3062.898 | 3646.286 | 4448.096 | 3546.05 | 3415.095 |
| best | 2338.689 | 4048.41 | 3454.946 | 4155.703 | 2891.822 | 3858.2 | 3795.254 | 3214.039 | 2995.281 | 3527.922 | 4000.757 | 3406.32 | 3384.779 | |
| worst | 2346.015 | 4175.581 | 3735.804 | 4230.58 | 2988.511 | 4065.745 | 4255.801 | 3374.645 | 3117.728 | 3772.276 | 4785.364 | 3842.932 | 3433.946 | |
| std | 3.664912 | 63.42392 | 130.1479 | 37.98541 | 44.35334 | 115.5379 | 224.8005 | 79.25473 | 57.21167 | 112.4554 | 358.8079 | 219.8794 | 24.2828 | |
| median | 2341.959 | 4102.699 | 3631.645 | 4219.077 | 2957.82 | 3989.527 | 4090.147 | 3248.037 | 3069.292 | 3642.474 | 4503.132 | 3467.473 | 3420.827 | |
| rank | 1 | 11 | 7 | 12 | 2 | 9 | 10 | 4 | 3 | 8 | 13 | 6 | 5 | |
| C17-F22 | mean | 11739 | 29898.52 | 20723.87 | 31226.03 | 19479.55 | 29094.17 | 27786.26 | 18352.58 | 23181.46 | 31127.91 | 21446.15 | 22056.4 | 27515.54 |
| best | 11119.08 | 29779.68 | 19403.39 | 30624.66 | 18073.66 | 28753.28 | 27172.83 | 17200.8 | 19021.39 | 30932.2 | 20641.6 | 20699.52 | 26594.62 | |
| worst | 12601.6 | 30072.48 | 22835.22 | 31555.68 | 20746.51 | 29671.42 | 28448.76 | 18827.71 | 32749.7 | 31322.09 | 22254.89 | 23255.43 | 27954.62 | |
| std | 710.0872 | 137.6461 | 1642.807 | 467.8853 | 1327.767 | 434.0159 | 650.6848 | 838.5643 | 7057.712 | 191.0211 | 717.5738 | 1310.133 | 676.3022 | |
| median | 11617.67 | 29870.95 | 20328.44 | 31361.88 | 19549.01 | 28975.99 | 27761.73 | 18690.91 | 20477.36 | 31128.68 | 21444.07 | 22135.31 | 27756.46 | |
| rank | 1 | 11 | 4 | 13 | 3 | 10 | 9 | 2 | 7 | 12 | 5 | 6 | 8 | |
| C17-F23 | mean | 2877.697 | 5083.185 | 4099.507 | 5084.927 | 3445.26 | 5180.355 | 4933.073 | 3596.027 | 3703.763 | 4180.782 | 7139.788 | 4708.375 | 4222.911 |
| best | 2872.107 | 4880.681 | 4031.935 | 4869.153 | 3436.297 | 4562.197 | 4813.676 | 3523.051 | 3678.968 | 4138.966 | 6660.243 | 4287.196 | 4166.74 | |
| worst | 2884.013 | 5319.135 | 4165.456 | 5253.542 | 3467.429 | 6012.232 | 5051.596 | 3689.202 | 3738.927 | 4242.374 | 7478.419 | 4936.314 | 4277.171 | |
| std | 5.674312 | 214.7523 | 68.13705 | 173.2897 | 16.22498 | 705.6868 | 124.5086 | 75.93265 | 31.57676 | 47.59334 | 402.3209 | 316.4086 | 66.44188 | |
| median | 2877.334 | 5066.461 | 4100.319 | 5108.507 | 3438.657 | 5073.495 | 4933.51 | 3585.927 | 3698.579 | 4170.894 | 7210.245 | 4804.994 | 4223.866 | |
| rank | 1 | 10 | 5 | 11 | 2 | 12 | 9 | 3 | 4 | 6 | 13 | 8 | 7 | |
| C17-F24 | mean | 3327.407 | 7832.289 | 5280.149 | 9428.317 | 3940.217 | 6330.598 | 6094.752 | 4144.531 | 4408.258 | 4778.634 | 9682.62 | 5755.812 | 5282.543 |
| best | 3295.518 | 6318.452 | 5072.135 | 6625.419 | 3871.199 | 5942.583 | 5721.691 | 4099.353 | 4184.416 | 4636.807 | 9162.84 | 5499.274 | 5178.783 | |
| worst | 3357.991 | 8916.686 | 5398.615 | 11283.6 | 4042.393 | 6565.008 | 6665.087 | 4204.902 | 4608.176 | 4977.78 | 11047.88 | 6114.686 | 5432.351 | |
| std | 32.22323 | 1339.285 | 161.2017 | 2472.511 | 78.98107 | 298.5116 | 449.4729 | 47.99135 | 244.0951 | 156.4488 | 992.5122 | 315.6741 | 117.0508 | |
| median | 3328.059 | 8047.008 | 5324.923 | 9902.123 | 3923.637 | 6407.401 | 5996.115 | 4136.935 | 4420.219 | 4749.974 | 9259.878 | 5704.645 | 5259.52 | |
| rank | 1 | 11 | 6 | 12 | 2 | 10 | 9 | 3 | 4 | 5 | 13 | 8 | 7 | |
| C17-F25 | mean | 3185.232 | 13441.03 | 4443.825 | 18340.92 | 4076.777 | 9566.79 | 7002.676 | 3852.339 | 6297.608 | 8299.907 | 10017.95 | 4444.685 | 7475.466 |
| best | 3137.371 | 12788.33 | 4148.351 | 17065.23 | 3981.421 | 9083.304 | 6454.379 | 3818.204 | 6150.753 | 7347.374 | 9371.909 | 4238.015 | 6853.024 | |
| worst | 3261.571 | 14882.91 | 4781.288 | 21161.43 | 4160.817 | 9890.5 | 7363.442 | 3920.764 | 6674.264 | 9619.146 | 11213.94 | 4749.399 | 8116.028 | |
| std | 65.17161 | 1063.367 | 283.5038 | 2099.322 | 84.54413 | 392.097 | 441.8134 | 51.57319 | 273.7552 | 1151.349 | 898.1687 | 256.0706 | 702.2793 | |
| median | 3170.992 | 13046.44 | 4422.831 | 17568.52 | 4082.435 | 9646.678 | 7096.442 | 3835.193 | 6182.708 | 8116.554 | 9742.967 | 4395.662 | 7466.406 | |
| rank | 1 | 12 | 4 | 13 | 3 | 10 | 7 | 2 | 6 | 9 | 11 | 5 | 8 | |
| C17-F26 | mean | 5757.621 | 35939.59 | 23924.36 | 40742.7 | 13415.09 | 30933.67 | 31440.72 | 13583.9 | 17645.72 | 23303.5 | 31361.56 | 20750.51 | 22604.74 |
| best | 5645.905 | 35548.93 | 21519.99 | 38728.13 | 12678.8 | 30094.95 | 28449.35 | 12535.81 | 16023.04 | 19694.71 | 30412.4 | 19056.98 | 21134.85 | |
| worst | 5844.642 | 36256.6 | 26144.4 | 41924.66 | 14210.3 | 31631.99 | 34028.09 | 15434.23 | 18791.4 | 27827.19 | 32752.15 | 22281.77 | 23407.49 | |
| std | 91.29453 | 325.3611 | 2174.656 | 1641.219 | 742.9473 | 694.5191 | 2975.907 | 1383.242 | 1311.335 | 3658.25 | 1108.06 | 1527.681 | 1120.315 | |
| median | 5769.969 | 35976.42 | 24016.53 | 41159 | 13385.62 | 31003.87 | 31642.73 | 13182.78 | 17884.23 | 22846.05 | 31140.83 | 20831.64 | 22938.31 | |
| rank | 1 | 12 | 8 | 13 | 2 | 9 | 11 | 3 | 4 | 7 | 10 | 5 | 6 | |
| C17-F27 | mean | 3309.493 | 8431.434 | 4245.826 | 10830.78 | 3735.776 | 6225.732 | 5741.618 | 3808.567 | 4180.276 | 4380.606 | 12263.89 | 4174.087 | 5319.714 |
| best | 3278.01 | 7287.439 | 4130.044 | 8379.161 | 3696.869 | 6036.76 | 5126.757 | 3737.831 | 4066.466 | 4114.816 | 11941.21 | 3968.903 | 5067.482 | |
| worst | 3344.5 | 9603.069 | 4440.188 | 13398.73 | 3788.708 | 6487.562 | 6434.152 | 3851.909 | 4346.426 | 4779.704 | 12543.36 | 4380.956 | 5598.337 | |
| std | 30.85754 | 1373.966 | 153.5838 | 2948.229 | 50.38312 | 211.3833 | 761.9438 | 56.95285 | 148.3301 | 307.8837 | 297.9776 | 213.8605 | 240.7252 | |
| median | 3307.732 | 8417.614 | 4206.535 | 10772.62 | 3728.764 | 6189.302 | 5702.781 | 3822.264 | 4154.107 | 4313.953 | 12285.49 | 4173.246 | 5306.519 | |
| rank | 1 | 11 | 6 | 12 | 2 | 10 | 9 | 3 | 5 | 7 | 13 | 4 | 8 | |
| C17-F28 | mean | 3322.242 | 18427.35 | 5290.668 | 24374.42 | 4531.476 | 14208.35 | 9888.159 | 4277.979 | 8992.637 | 10535.78 | 16722.64 | 7673.922 | 10790.4 |
| best | 3318.742 | 17179.28 | 5187.751 | 21860.15 | 4306.165 | 11382.88 | 8533.639 | 4163.251 | 7759.643 | 8466.624 | 14500.96 | 5548.003 | 9922.928 | |
| worst | 3327.816 | 20738.38 | 5348.282 | 27509.58 | 4695.913 | 16434.78 | 10751.85 | 4402.695 | 10785.38 | 12427.83 | 18227.73 | 10992.5 | 11860.48 | |
| std | 4.767125 | 1774.959 | 81.43107 | 2583.4 | 180.0406 | 2558.827 | 1038.94 | 128.0624 | 1399.433 | 1944.961 | 1727.46 | 2645.011 | 1057.399 | |
| median | 3321.205 | 17895.86 | 5313.32 | 24063.98 | 4561.913 | 14507.86 | 10133.57 | 4272.986 | 8712.762 | 10624.33 | 17080.94 | 7077.593 | 10689.1 | |
| rank | 1 | 12 | 4 | 13 | 3 | 10 | 7 | 2 | 6 | 8 | 11 | 5 | 9 | |
| C17-F29 | mean | 4450.696 | 150667.3 | 9925.685 | 284879.7 | 7708.141 | 17070.72 | 15531.35 | 9164.636 | 8858.751 | 12194.96 | 22326.86 | 9135.355 | 11715.06 |
| best | 4169.151 | 86958.94 | 9107.309 | 154059.3 | 6882.332 | 13623.67 | 13145.33 | 8445.7 | 8560.049 | 11341.48 | 18688.33 | 8732.014 | 11418.94 | |
| worst | 4829.521 | 204859.3 | 10389.87 | 394703.9 | 8233.202 | 21287.32 | 17715.52 | 9910.691 | 9331.518 | 12617.52 | 28480.41 | 9708.153 | 11992.34 | |
| std | 307.1569 | 54599.95 | 611.7269 | 111549.6 | 630.288 | 3496.398 | 2416.324 | 662.3035 | 360.0082 | 647.0171 | 4882.893 | 491.2947 | 258.21 | |
| median | 4402.056 | 155425.5 | 10102.78 | 295377.8 | 7858.514 | 16685.93 | 15632.28 | 9151.076 | 8771.719 | 12410.43 | 21069.36 | 9050.626 | 11724.48 | |
| rank | 1 | 12 | 6 | 13 | 2 | 10 | 9 | 5 | 3 | 8 | 11 | 4 | 7 | |
| C17-F30 | mean | 5407.166 | 1.89E+10 | 2.43E+08 | 3.07E+10 | 2.24E+08 | 1.1E+10 | 1.43E+09 | 3.03E+08 | 1.7E+09 | 3.28E+09 | 6.16E+09 | 7.09E+08 | 7.58E+08 |
| best | 5337.48 | 1.67E+10 | 1.49E+08 | 2.87E+10 | 1.38E+08 | 6.83E+09 | 1.13E+09 | 2.17E+08 | 7.43E+08 | 1.4E+09 | 4.47E+09 | 2.53E+08 | 6.84E+08 | |
| worst | 5557.155 | 2.05E+10 | 2.86E+08 | 3.31E+10 | 2.68E+08 | 1.37E+10 | 1.91E+09 | 3.61E+08 | 2.19E+09 | 5.8E+09 | 7.43E+09 | 1.78E+09 | 8.33E+08 | |
| std | 110.0477 | 1.76E+09 | 68900930 | 2.04E+09 | 63226580 | 3.23E+09 | 3.63E+08 | 72223274 | 7.11E+08 | 2.43E+09 | 1.37E+09 | 7.81E+08 | 88084792 | |
| median | 5367.014 | 1.93E+10 | 2.68E+08 | 3.05E+10 | 2.45E+08 | 1.18E+10 | 1.35E+09 | 3.18E+08 | 1.94E+09 | 2.96E+09 | 6.36E+09 | 4.02E+08 | 7.57E+08 | |
| rank | 1 | 12 | 3 | 13 | 2 | 11 | 7 | 4 | 8 | 9 | 10 | 5 | 6 | |
| Sum rank | 29 | 336 | 140 | 355 | 65 | 293 | 265 | 114 | 156 | 249 | 272 | 162 | 203 | |
| Mean rank | 1 | 11.58621 | 4.827586 | 12.24138 | 2.241379 | 10.10345 | 9.137931 | 3.931034 | 5.37931 | 8.586207 | 9.37931 | 5.586207 | 7 | |
| Total rank | 1 | 12 | 4 | 13 | 2 | 11 | 9 | 3 | 5 | 8 | 10 | 6 | 7 | |
Figure 3.
Boxplot diagrams of OOA and the competitor algorithms performances for the CEC 2017 test suite (dimension=10).
Figure 3.
Boxplot diagrams of OOA and the competitor algorithms performances for the CEC 2017 test suite (dimension=10).
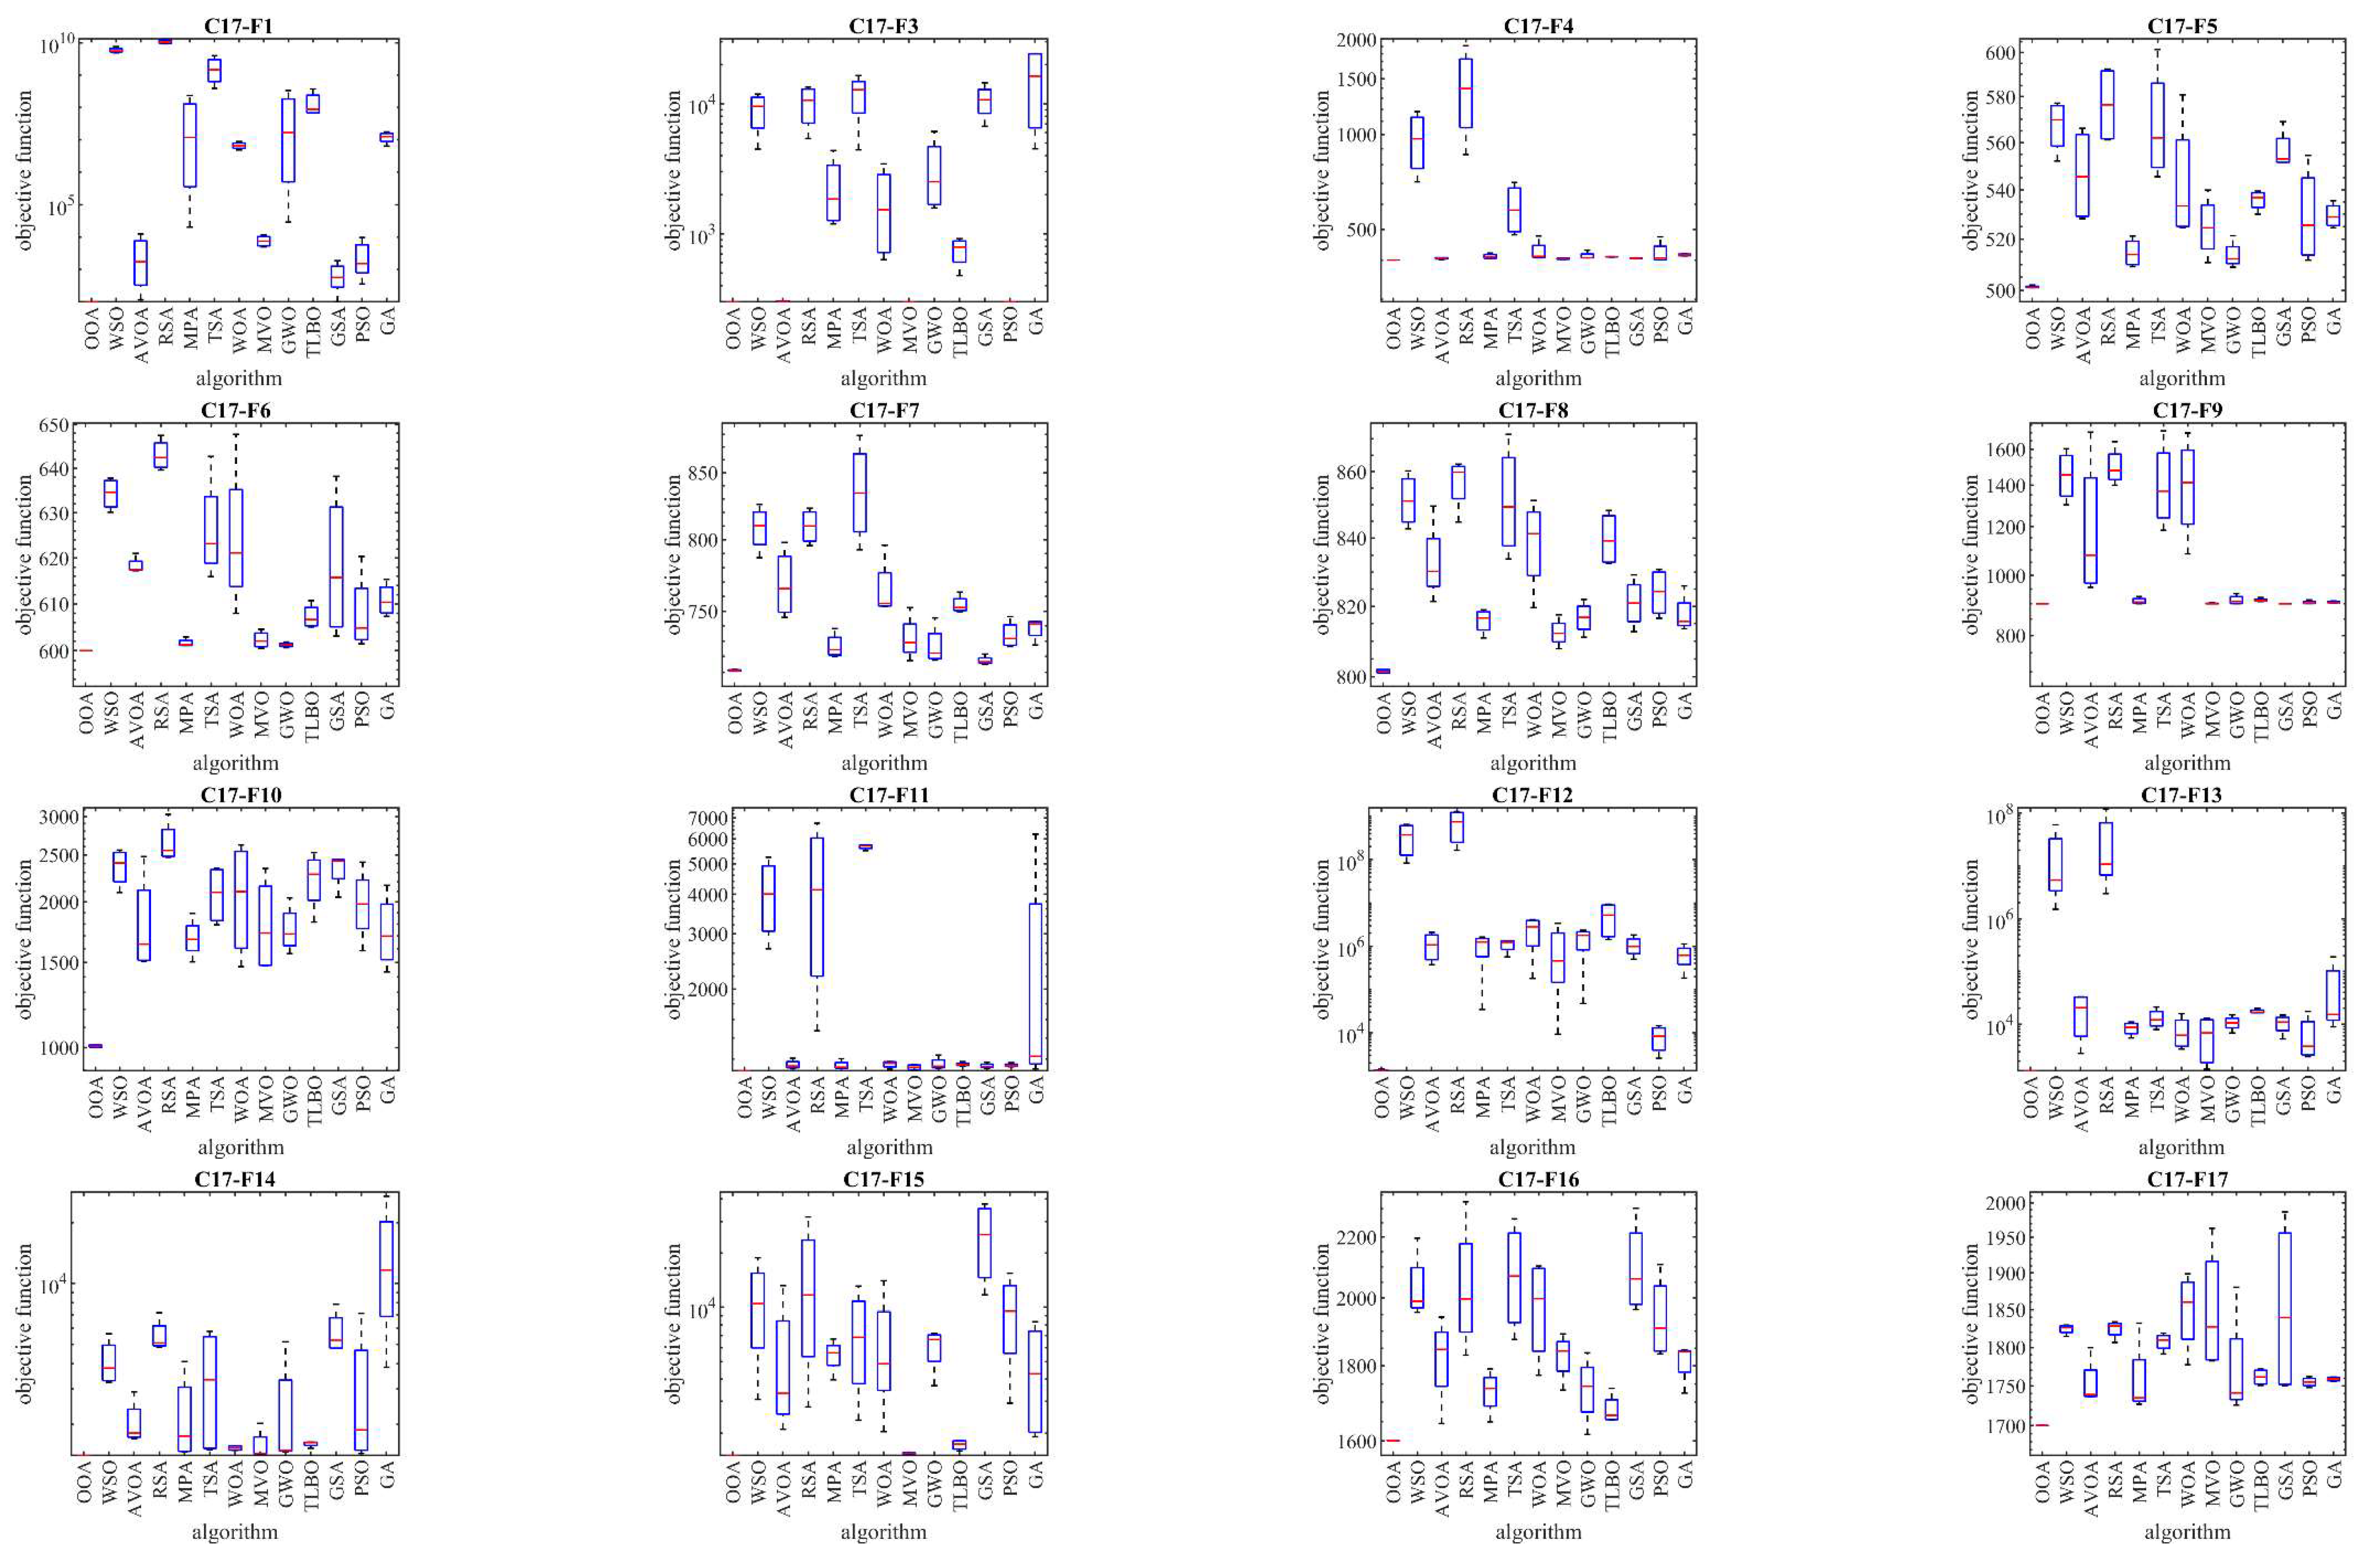
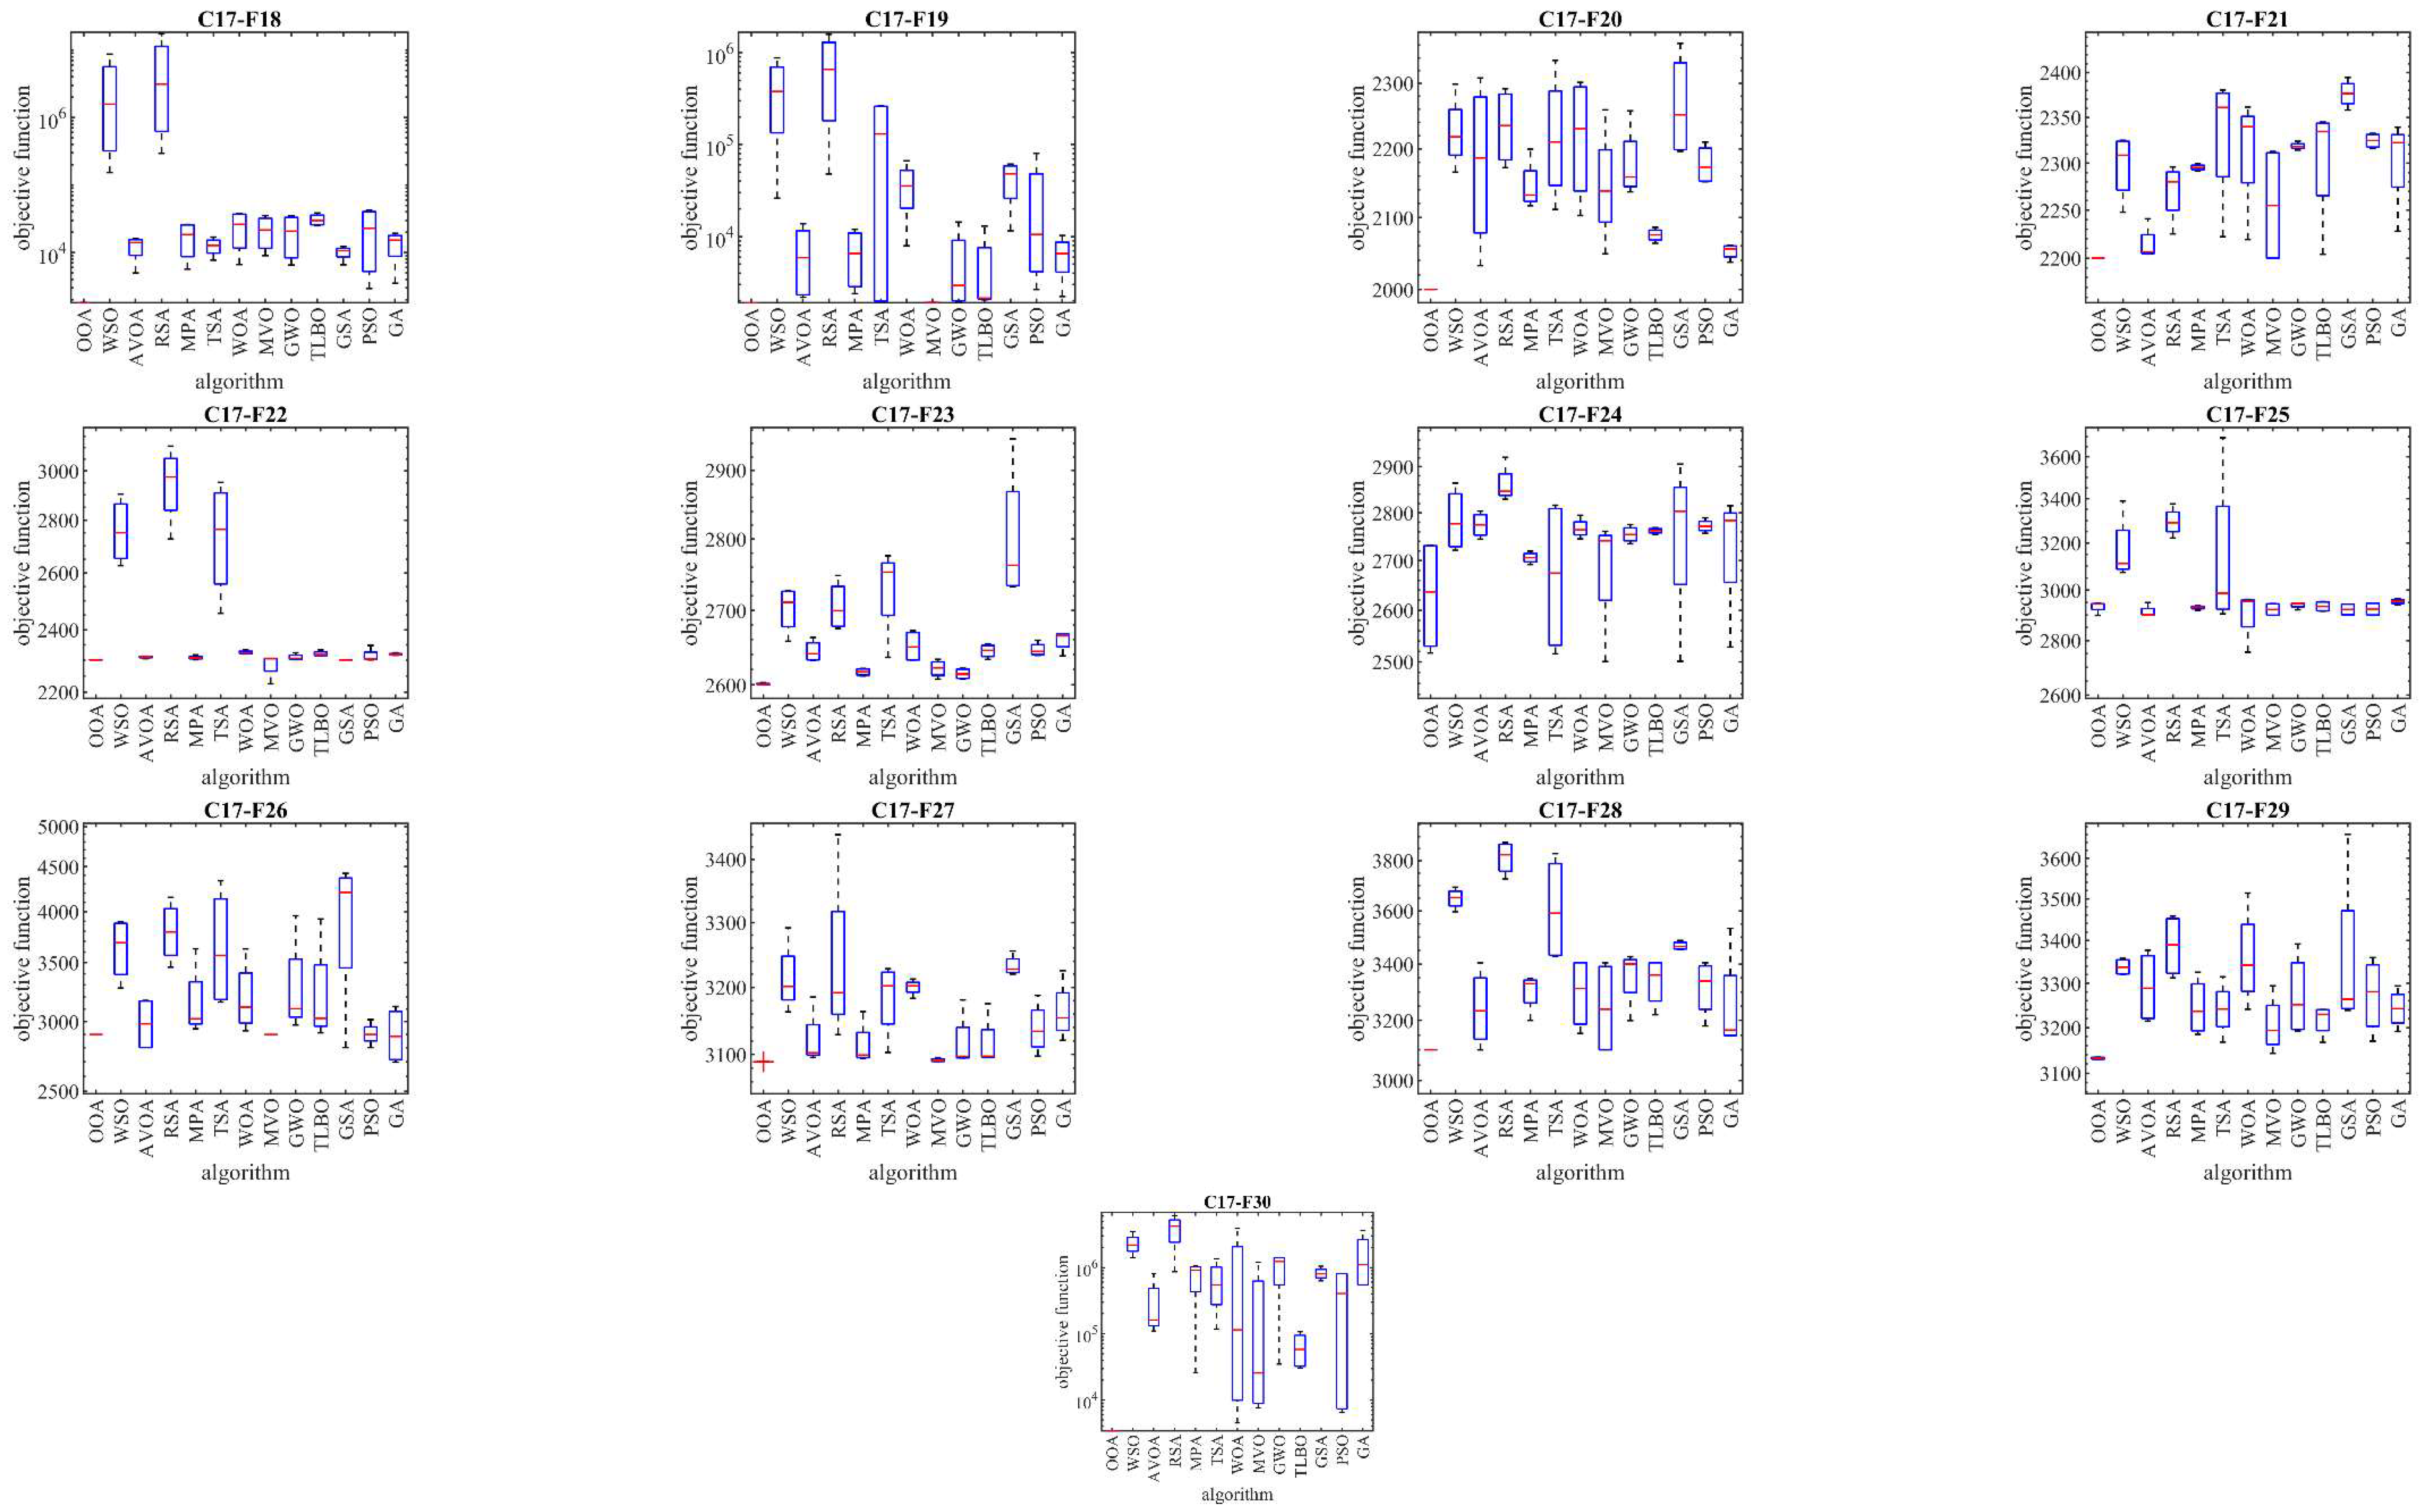
Figure 4.
Boxplot diagrams of OOA and the competitor algorithms performances for the CEC 2017 test suite (dimension=30).
Figure 4.
Boxplot diagrams of OOA and the competitor algorithms performances for the CEC 2017 test suite (dimension=30).
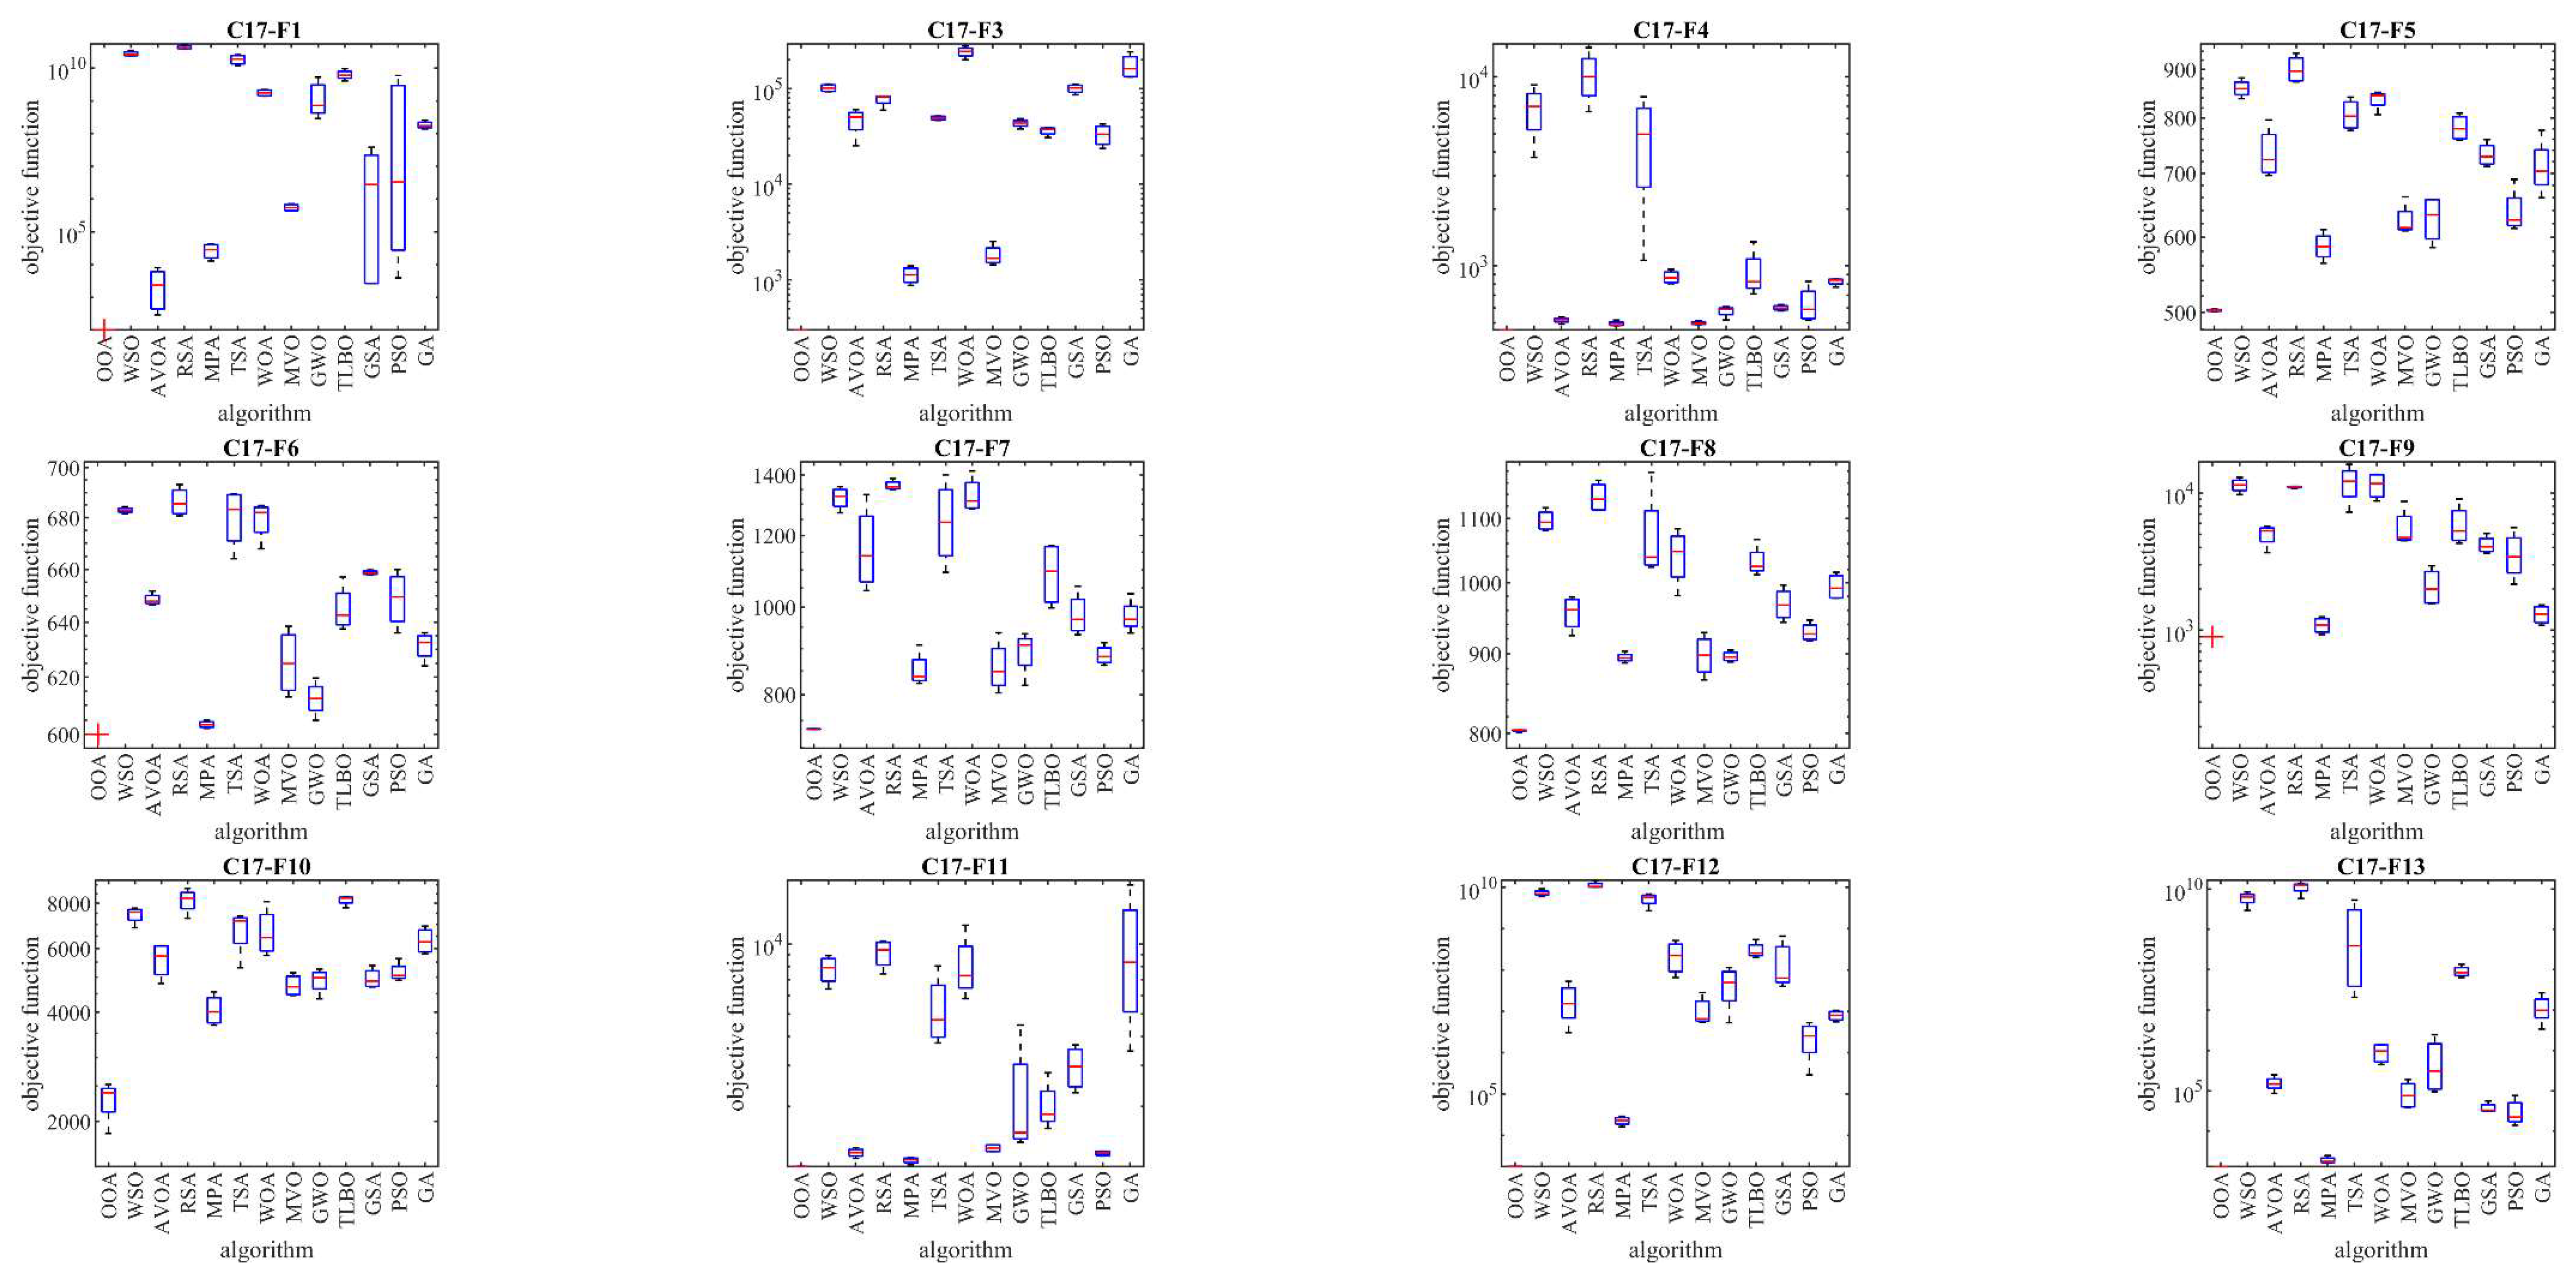
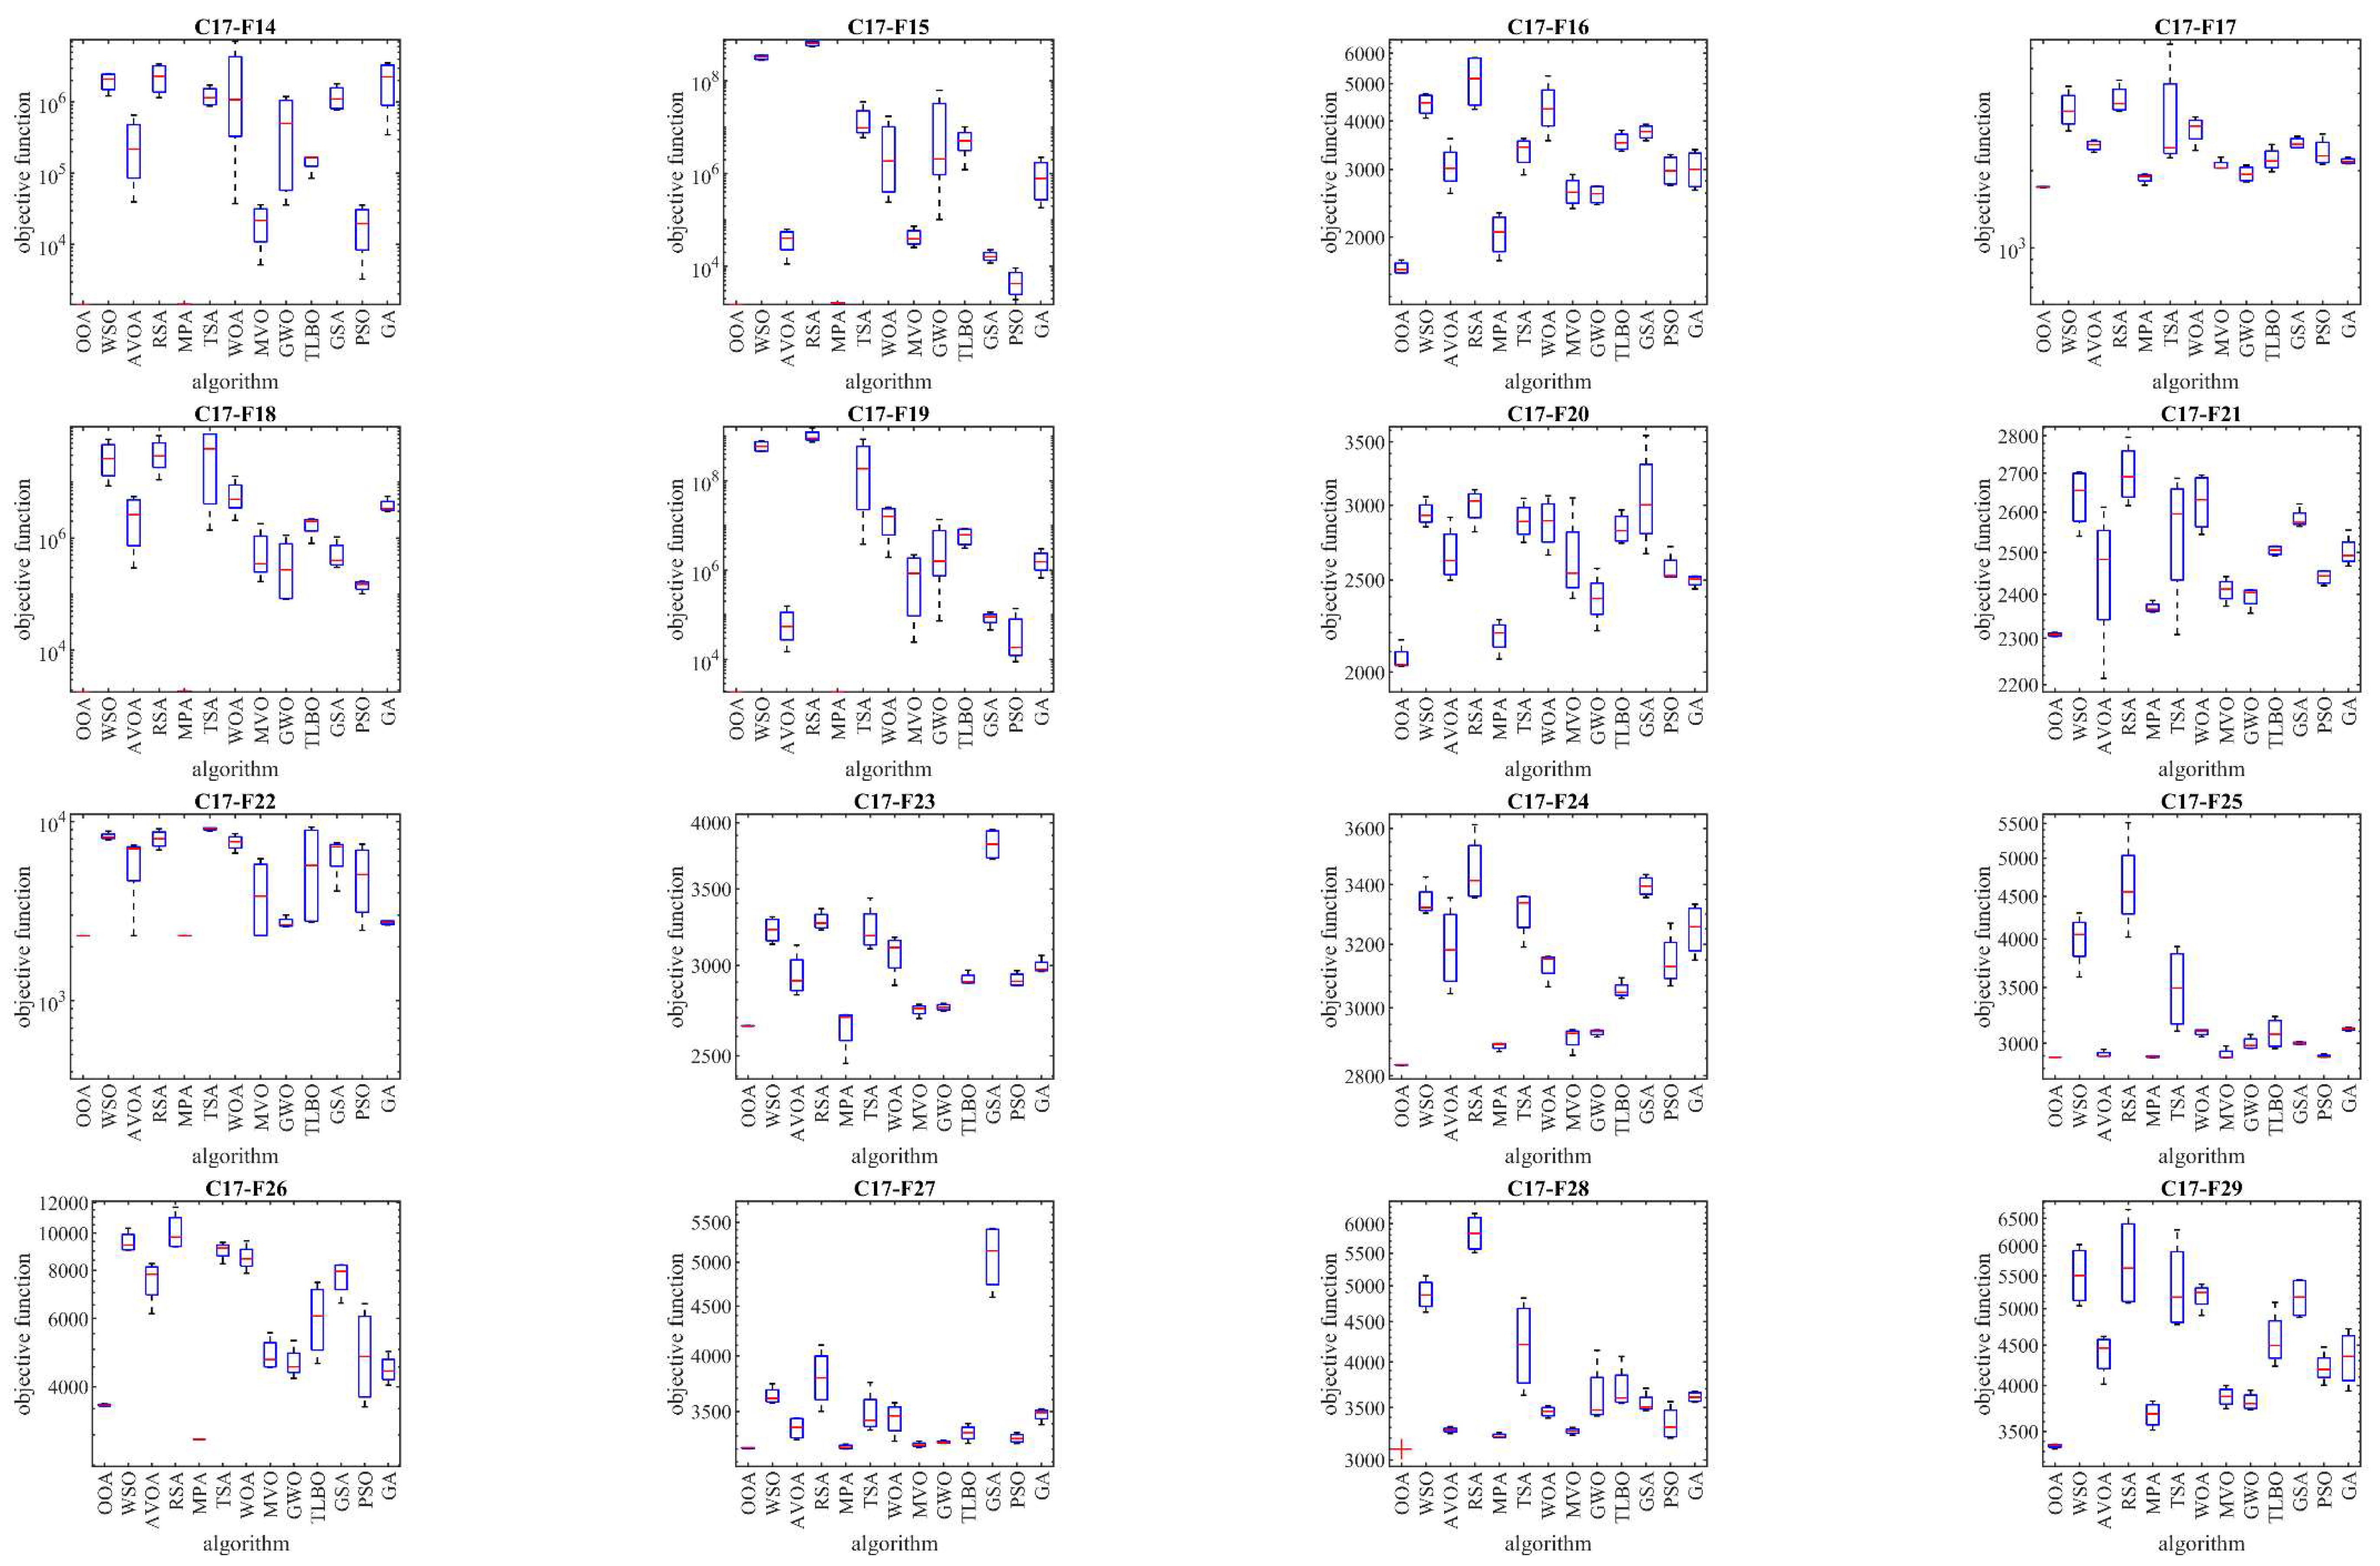
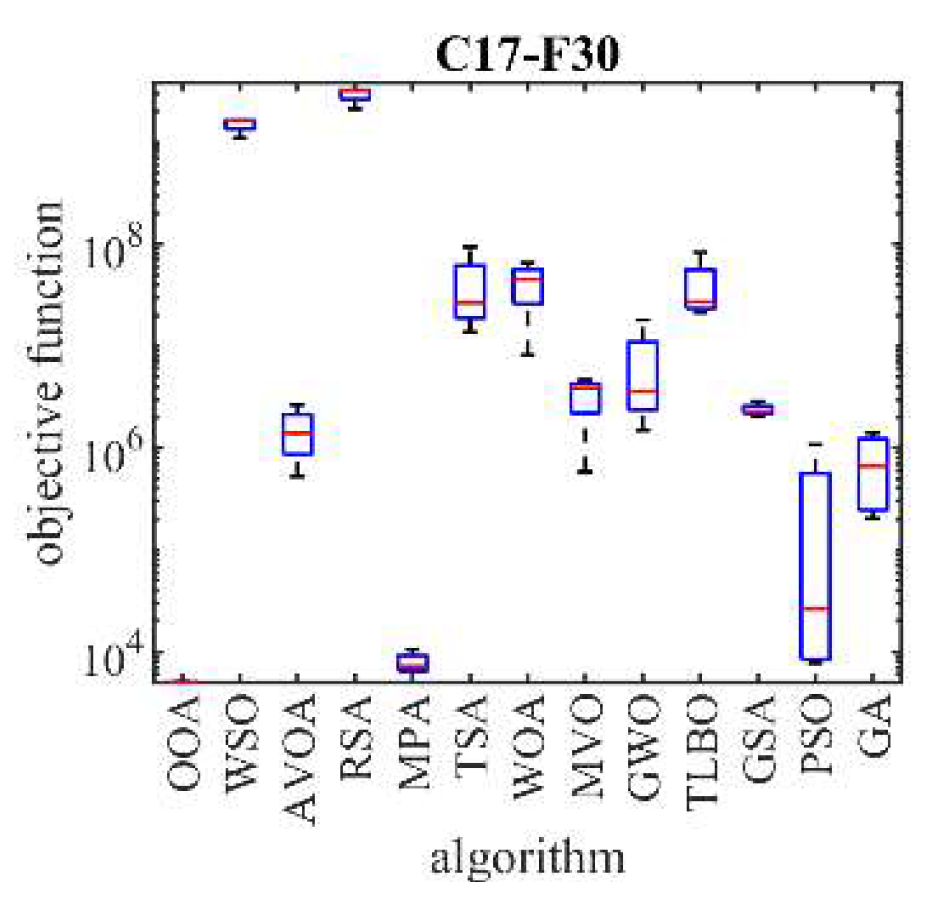
Figure 5.
Boxplot diagrams of OOA and the competitor algorithms performances for the CEC 2017 test suite (dimension=50).
Figure 5.
Boxplot diagrams of OOA and the competitor algorithms performances for the CEC 2017 test suite (dimension=50).
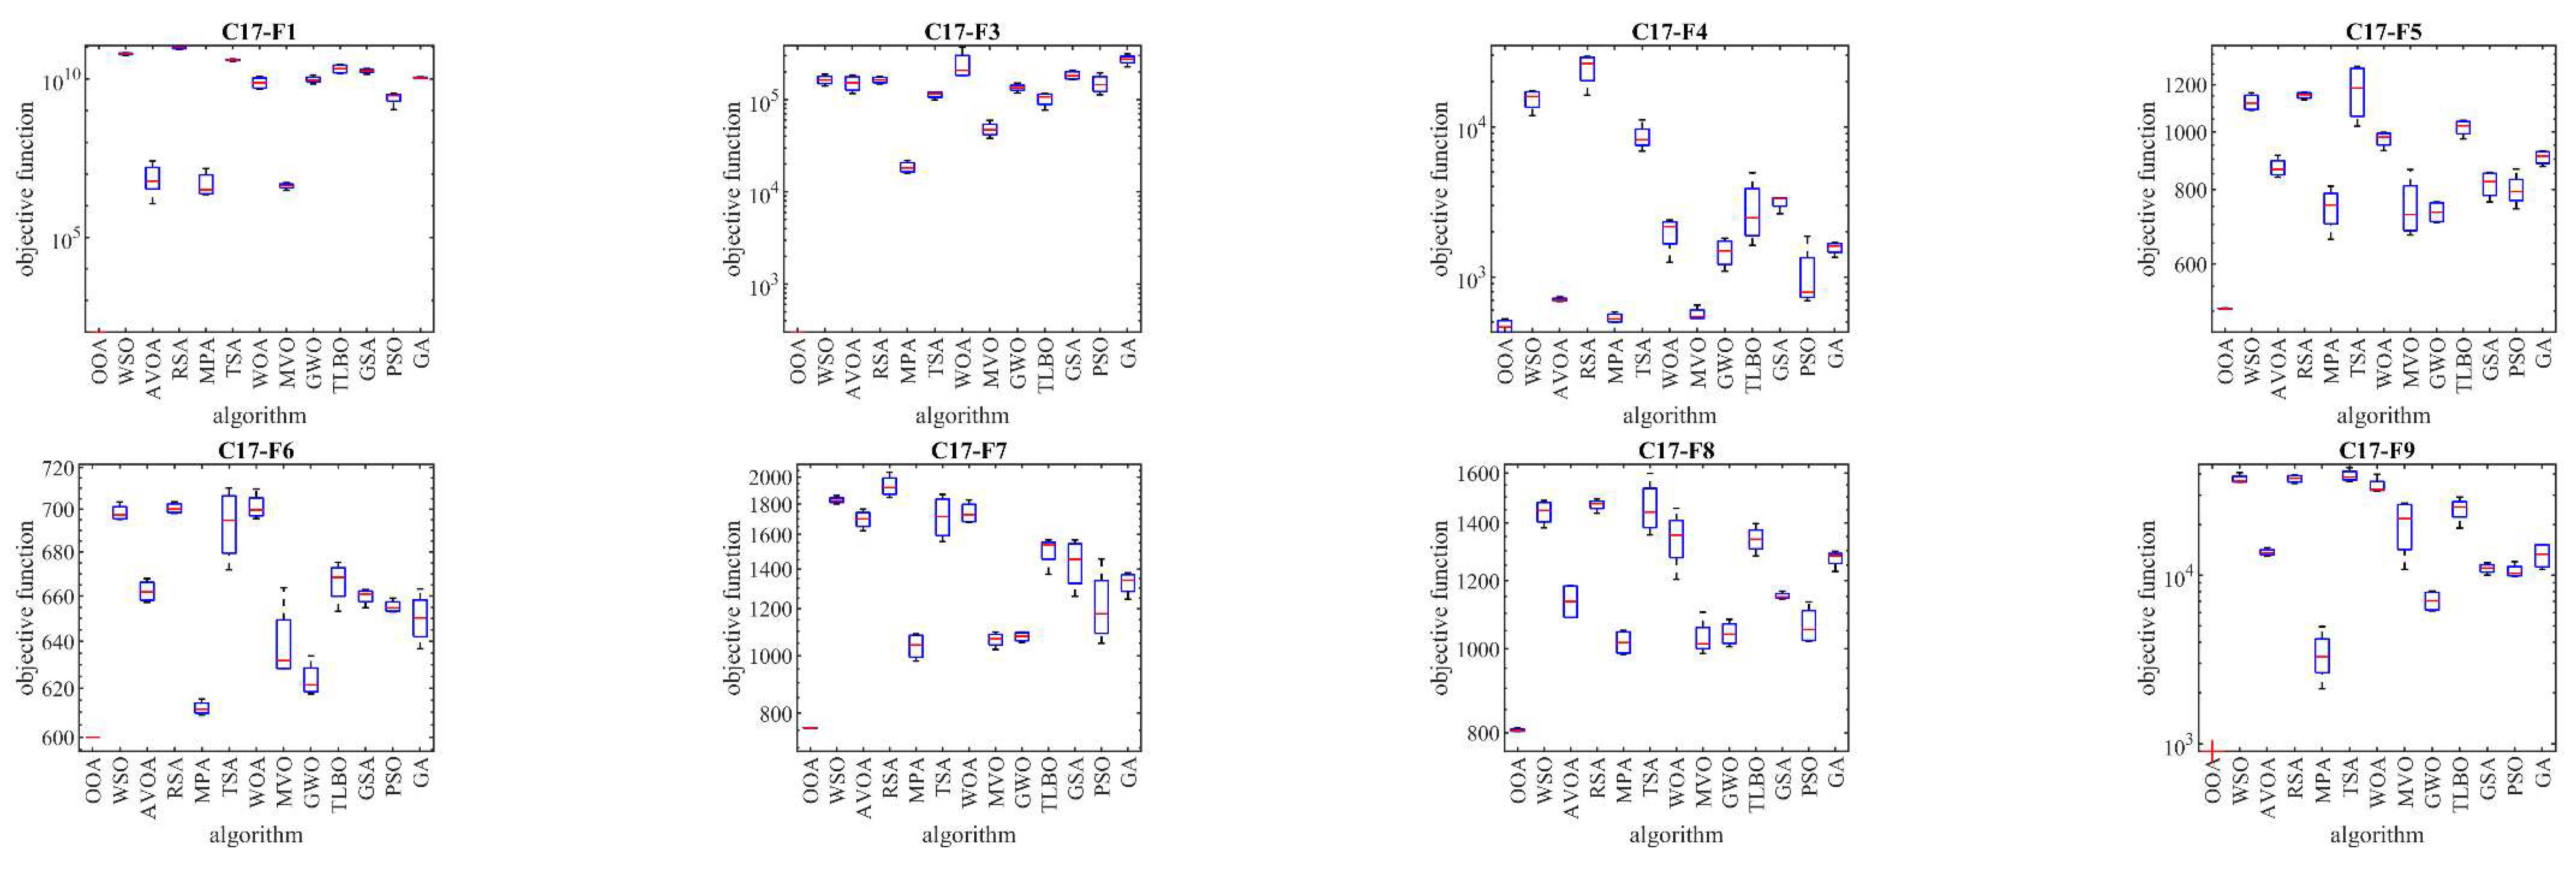
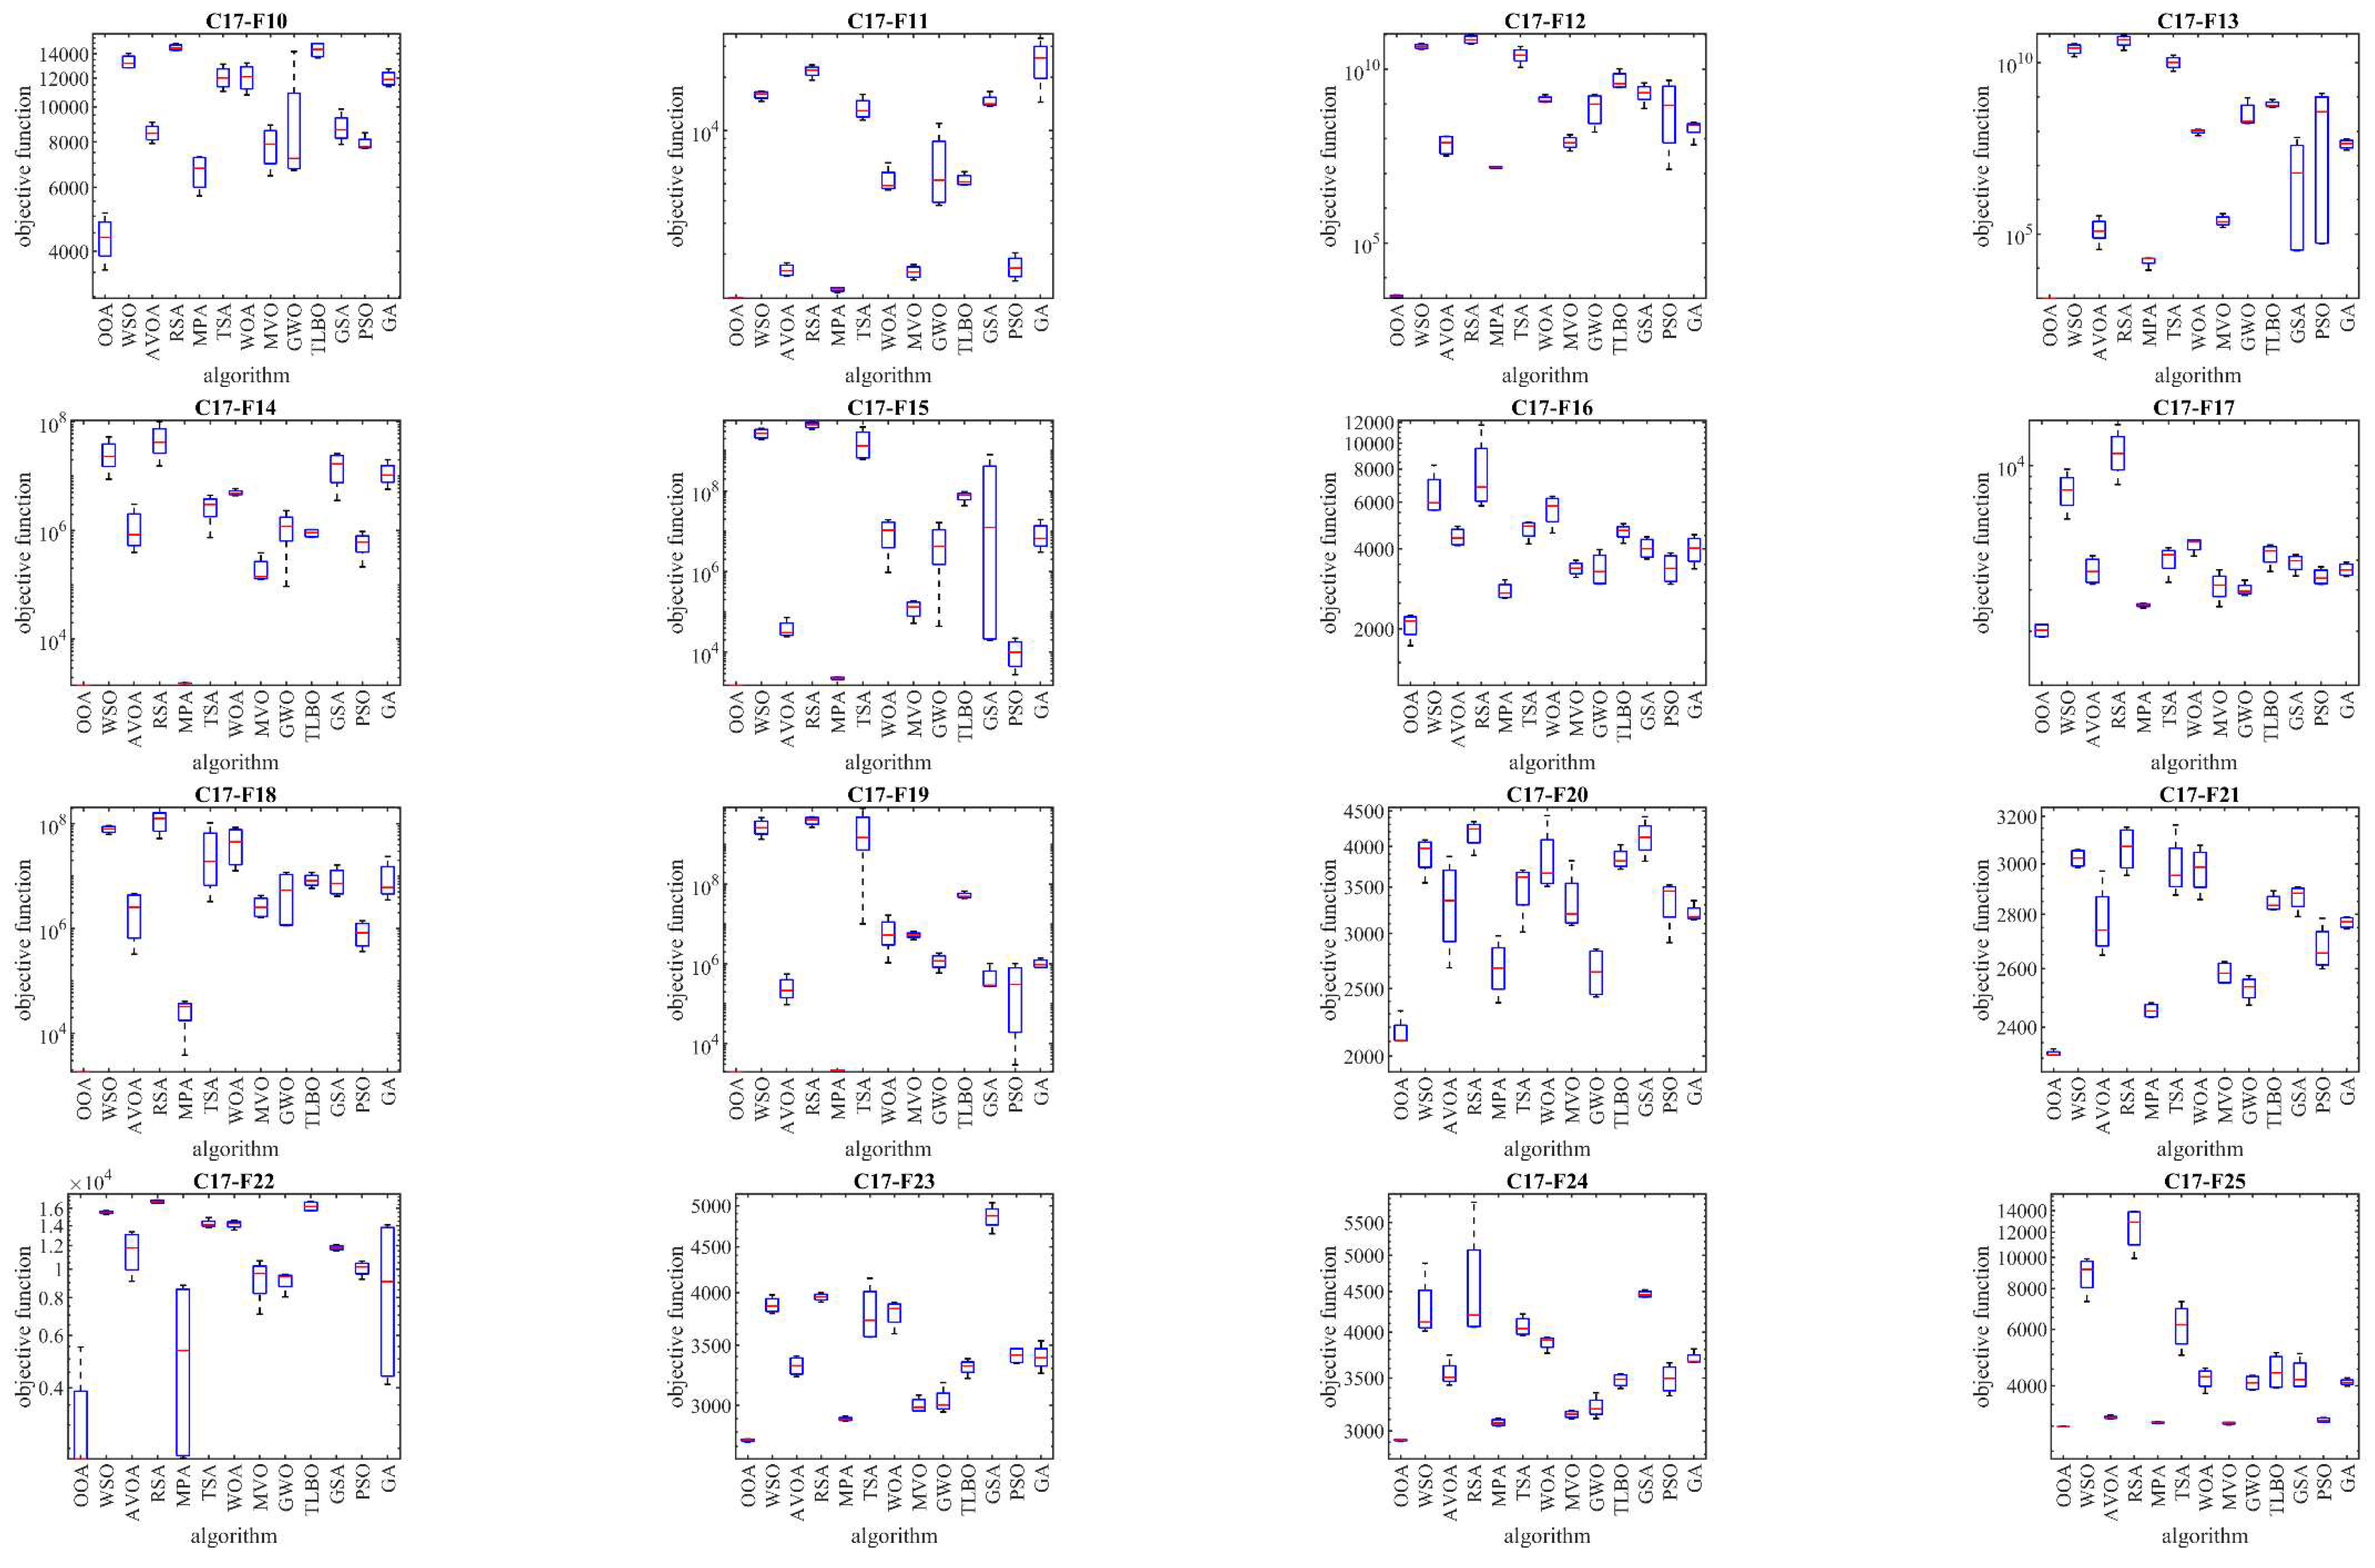
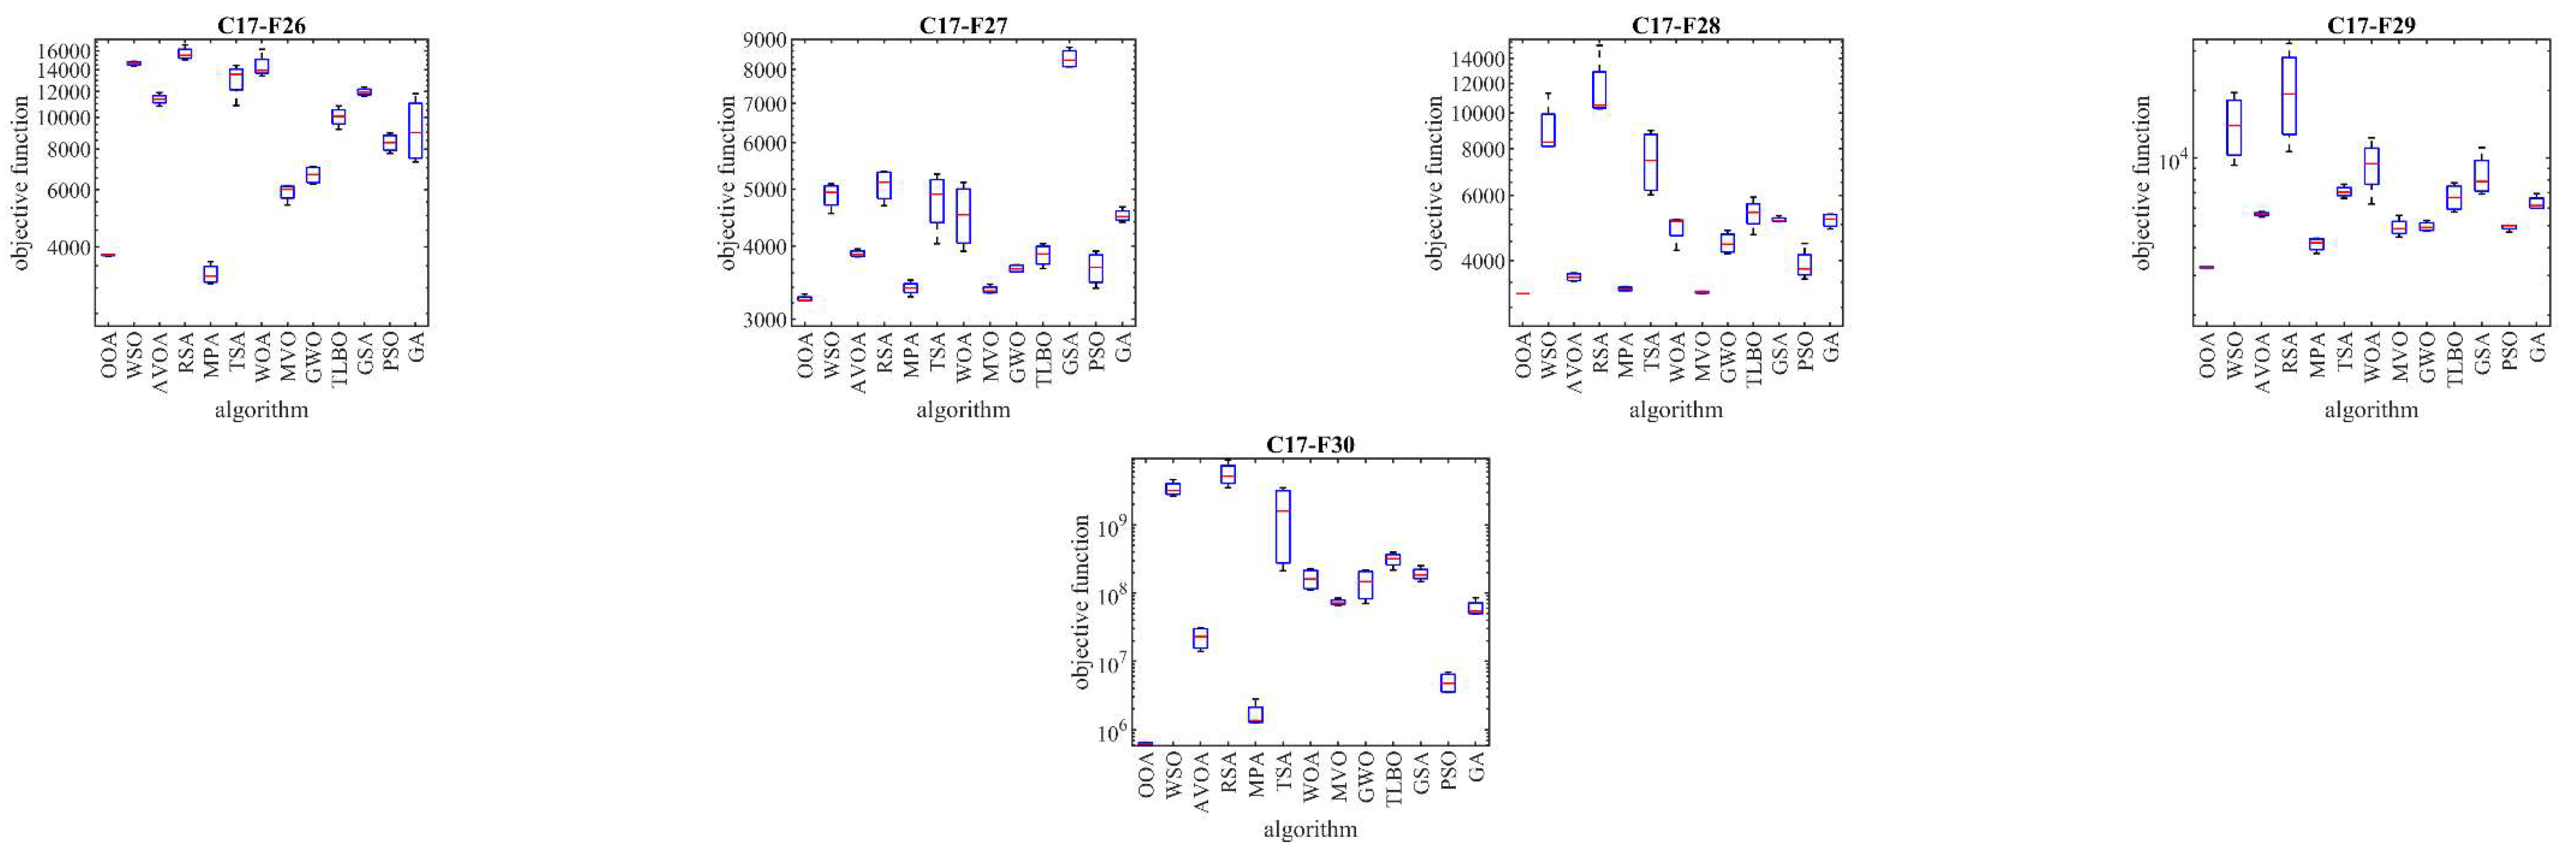
Figure 6.
Boxplot diagrams of OOA and the competitor algorithms performances for the CEC 2017 test suite (dimension=100).
Figure 6.
Boxplot diagrams of OOA and the competitor algorithms performances for the CEC 2017 test suite (dimension=100).
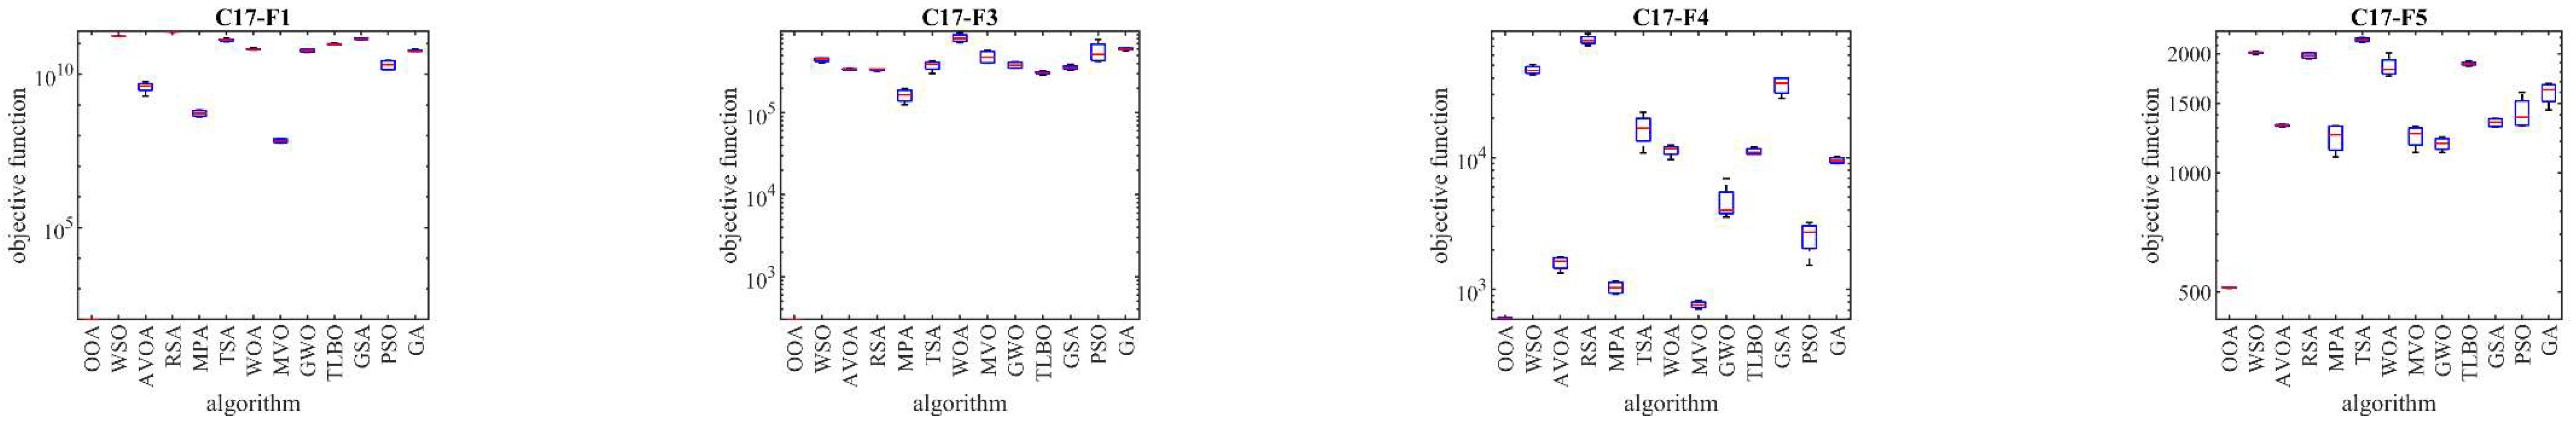
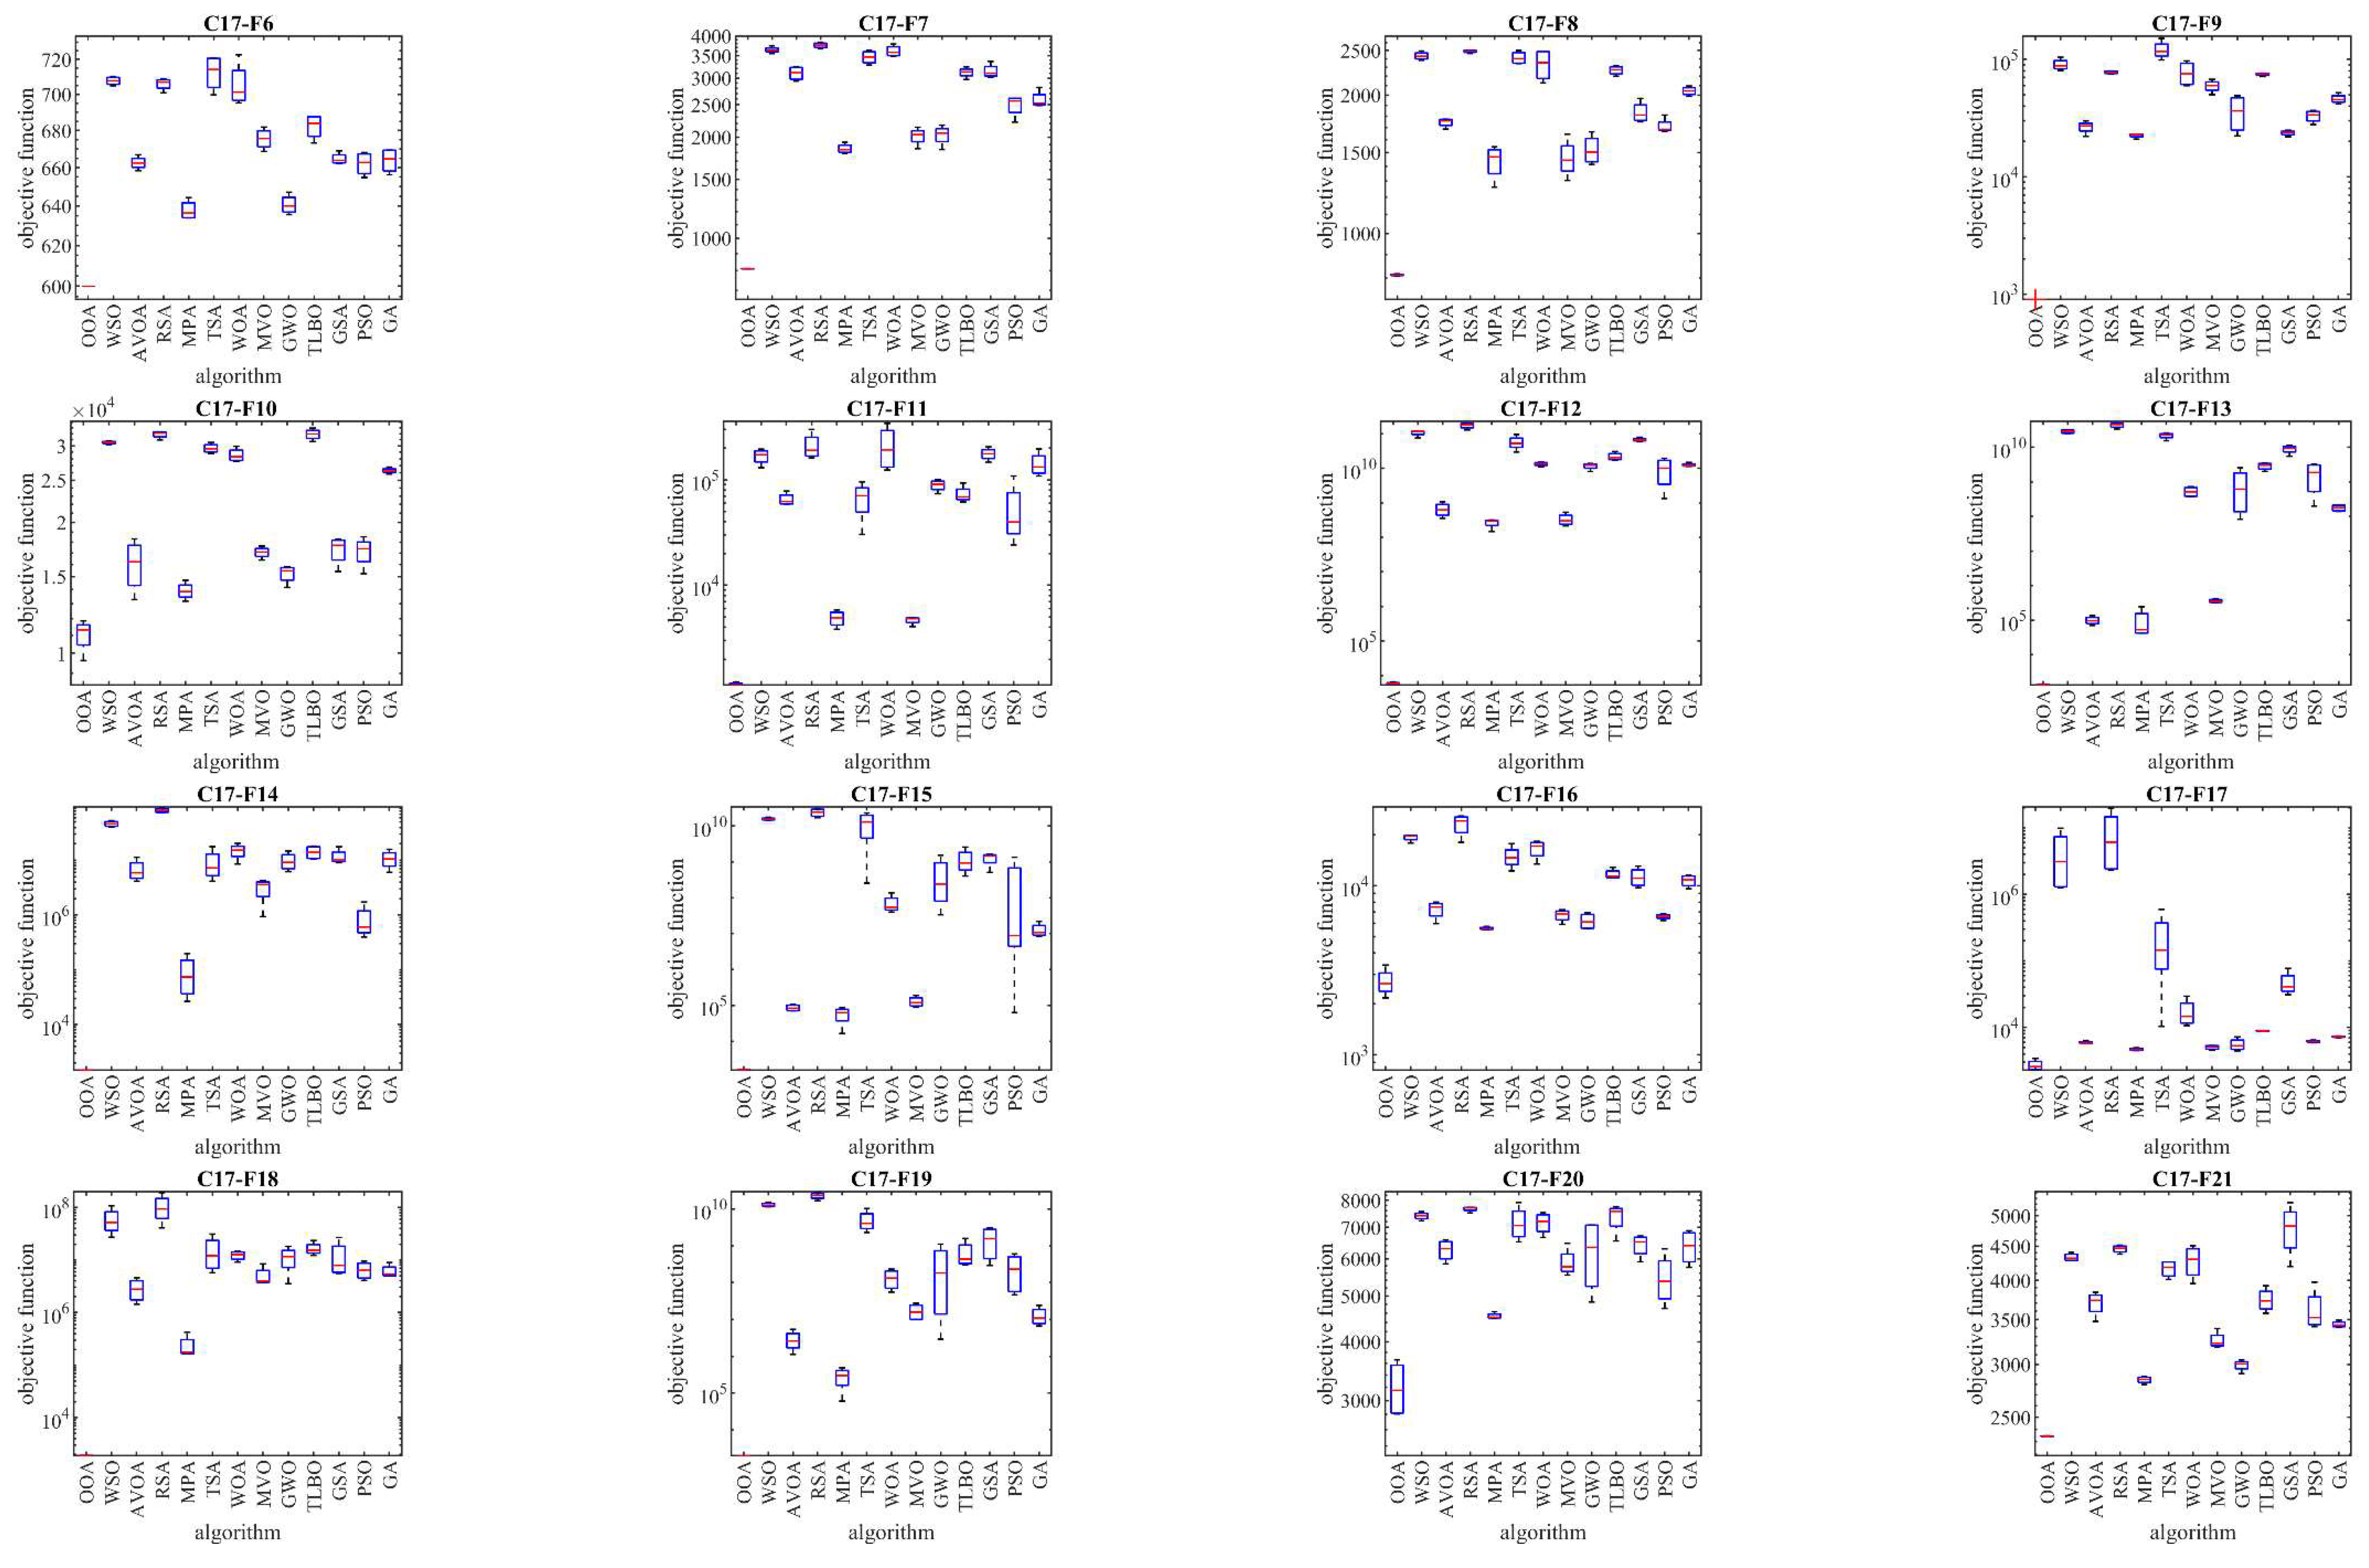
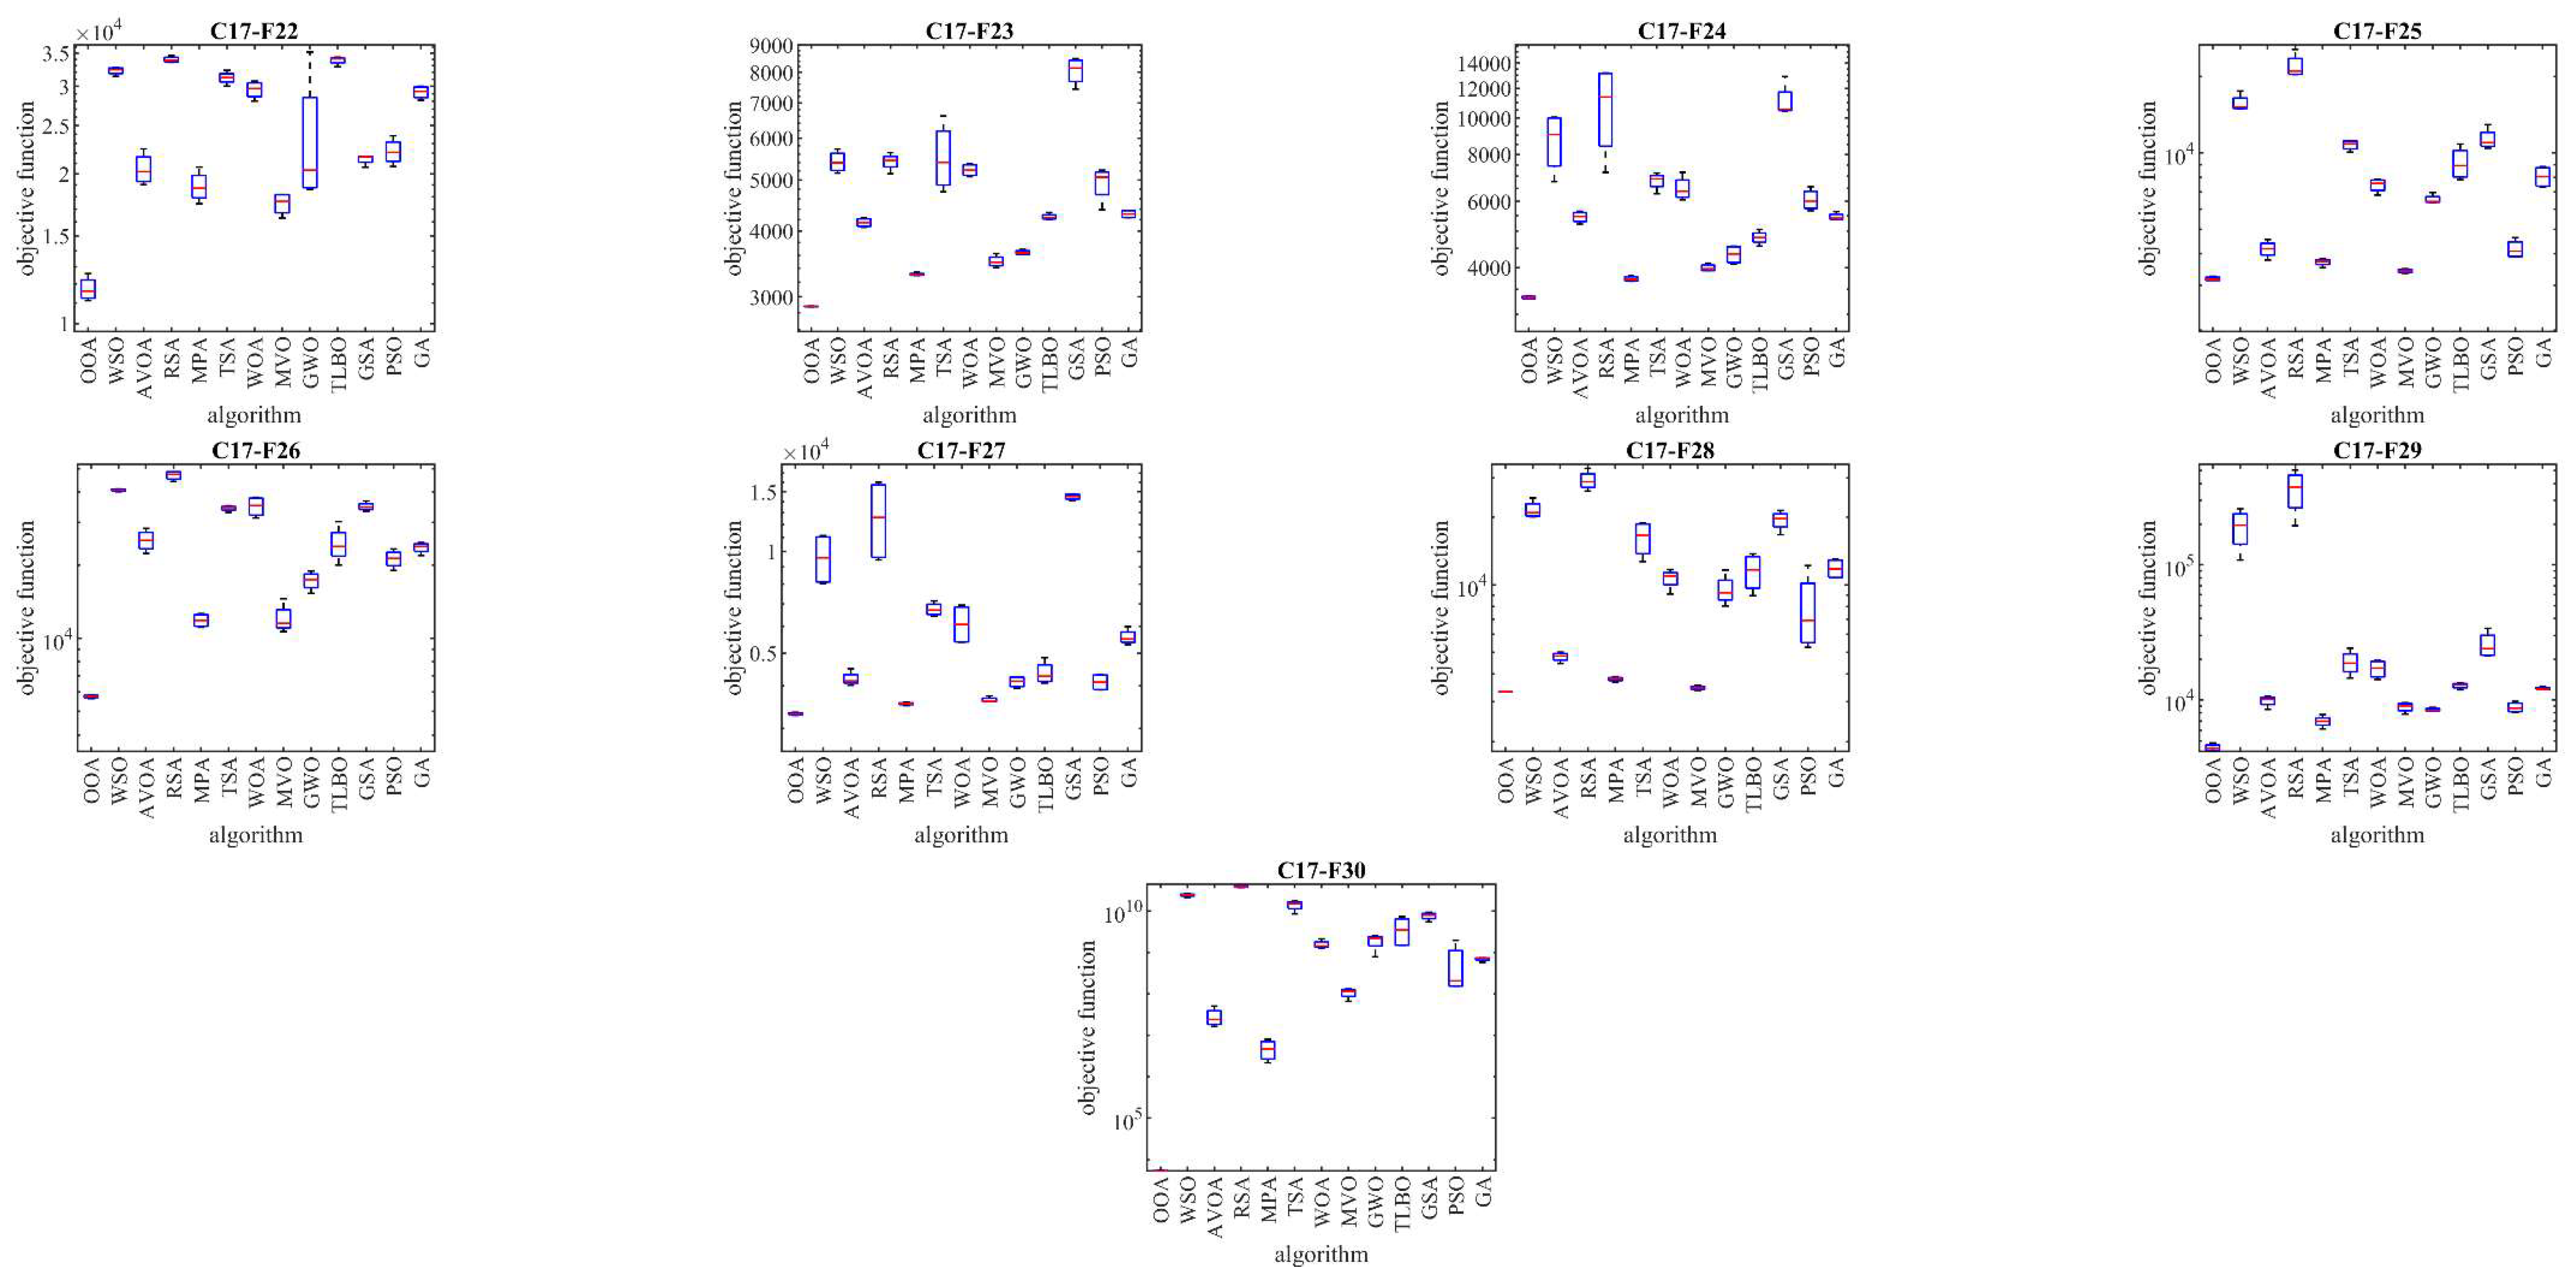
The analysis of the simulation results for the dimension equal to 10 demonstrates that the OOA is the best optimizer for the benchmark functions C17-F1, C17-F3 to C17-F24, and C17-F27 to C17-F30. For the dimension equal to 30, OOA emerges as the top optimizer for the functions C17-F1, C17-F3 to C17-F5, C17-F7, C17-F12 to C17-F14, C17-F16 to C17-F18, and C17-F21 to C17-F29. As the dimension increases to 50, OOA remains the best optimizer for the functions C17-F1, C17-F3 to C17-F25, and C17-F27 to C17-F30. Finally, for the dimension equal to 100, OOA excels as the top performer for the functions C17-F1 and C17-F3 to C17-F30.
The simulation results clearly indicate that the OOA approach is capable of providing high-quality solutions for the CEC 2017 test suite. OOA demonstrates a strong ability to explore the search space comprehensively, exploit the best solutions effectively, and strike a completely different balance between exploration and exploitation compared to its competitor algorithms. Additionally, a comparison of the overall performance shows that the OOA outperforms most competing metaheuristic algorithms in solving the CEC 2017 test suite for the various problem dimensions of 10, 30, 50, and 100. This confirms the robustness and scalability of the OOA approach in handling different optimization challenges efficiently.
4.2. Statistical Analysis
To thoroughly assess and compare the performance of various metaheuristic algorithms, statistical indicators such as the mean, best, worst, standard deviation (std), median, and rank are typically utilized. These indicators provide valuable insights into the quality and performance of the algorithms, helping to highlight which approach demonstrates superiority over others. However, relying solely on these indicators may not fully capture the statistical significance of the differences between algorithms. Therefore, it is essential to conduct more detailed statistical analyses to verify whether the observed superiority of the proposed OOA approach is truly significant in comparison to competing algorithms.
In this section, we perform a completely different statistical analysis using the Wilcoxon rank-sum test [54], a non-parametric method specifically designed to evaluate whether there is a significant difference between two data samples. The Wilcoxon rank-sum test is particularly useful when the data does not follow a normal distribution, making it a robust choice for analyzing the performance differences between the OOA and other metaheuristic algorithms. By applying this test, we aim to determine whether the OOA's performance advantages are not just random but statistically significant.
The results of applying the Wilcoxon rank-sum test to compare the OOA with competing algorithms are summarized in Table 6. These results include the p-values for each comparison, and based on statistical convention, a p-value less than 0.05 indicates a significant difference. In the cases when the p-value is below this threshold, it can be concluded that the proposed OOA approach exhibits a statistically significant superiority over the corresponding competitor algorithm. This additional statistical validation offers a completely different and more robust understanding of the OOA's competitive edge, reinforcing the confidence in its optimization capabilities.
In conclusion, using more words and sentences in conjunction with statistical tests like the Wilcoxon rank-sum test provides a comprehensive and reliable evaluation of the OOA's performance. This ensures that the OOA's observed superiority is not just apparent but also statistically validated, offering deeper insights into its effectiveness when compared to other algorithms.
5. OOA for Real-World Applications
In this section, the effectiveness of the proposed OOA approach in addressing optimization challenges in real-world applications is thoroughly examined. To achieve this, the CEC 2011 test suite, which comprises twenty-two constrained optimization problems derived from practical applications, has been employed. A comprehensive description and full details of the CEC 2011 test suite are available in [55]. The results of the OOA implementation, along with competitor algorithms, when applied to the CEC 2011 test suite, are summarized in Table 7. Additionally, the comparative performance of OOA and the other algorithms is illustrated through boxplots in Figure 7.
From a detailed comparison of the simulation results, it becomes clear that the OOA approach consistently outperforms the competitors, emerging as the top optimizer across all the problems ranging from C11-F1 to C11-F22. This clearly highlights OOA's robustness and effectiveness in dealing with real-world optimization problems. Notably, the simulation results indicate that OOA ranks as the best optimizer in the majority of the optimization problems from the CEC 2011 test suite, showcasing its superior performance when compared to the other algorithms.
Moreover, the statistical analysis conducted using the Wilcoxon rank-sum test further reinforces the advantage of the OOA approach. The results demonstrate a significant statistical superiority for OOA over the competing algorithms, confirming its enhanced ability to optimize the CEC 2011 test suite more effectively.
5. Conclusions and Future Works
In this paper, a completely different bio-inspired metaheuristic algorithm called the Orangutan Optimization Algorithm (OOA) was introduced, showcasing its capability in solving optimization problems across a variety of scientific disciplines and real-world applications. This novel approach is inspired by two distinct natural behaviors of orangutans: their foraging strategies for obtaining food and their nesting behavior for resting. These behaviors formed the foundation for the design of OOA, which was mathematically structured into two key phases—exploration and exploitation.
The performance of OOA was rigorously tested on twenty-nine standard benchmark functions from the CEC 2017 test suite, where the results demonstrated that OOA excels in balancing exploration and exploitation throughout the search process. When compared to twelve other widely-recognized metaheuristic algorithms, OOA showed a superior performance, producing better optimization results for most benchmark functions. Additionally, OOA was applied to twenty-two optimization problems from the CEC 2011 test suite, further validating its effectiveness in solving real-world optimization challenges.
Moreover, the introduction of OOA opens several new avenues for future research. One of the most promising directions is the development of binary and multi-objective versions of OOA. Furthermore, expanding the application of OOA to address optimization challenges in completely different scientific fields and a broader range of real-world scenarios provides exciting opportunities for future studies.
Author Contributions
Conceptualization, T.H. and K.E.; methodology, M.D. and Z.M.; software, T.H. and B.B.; validation, Z.M. and M.D.; formal analysis, B.B.; investigation, K.E..; resources, F.W.; data curation, Z.M.; writing—original draft preparation, T.H.; writing—review and editing, F.W.; visualization, B.B..; supervision, M.D.; project administration, F.W.; funding acquisition, K.E. All authors have read and agreed to the published version of the manuscript.
Funding
This research received no external funding.
Data Availability Statement
Not applicable.
Conflicts of Interest
The authors declare no conflicts of interest.
References
- Zhao, S.; Zhang, T.; Ma, S.; Chen, M. Dandelion Optimizer: A nature-inspired metaheuristic algorithm for engineering applications. Engineering Applications of Artificial Intelligence 2022, 114, 105075. [Google Scholar] [CrossRef]
- Sergeyev, Y.D.; Kvasov, D.; Mukhametzhanov, M. On the efficiency of nature-inspired metaheuristics in expensive global optimization with limited budget. Scientific reports 2018, 8, 1–9. [Google Scholar] [CrossRef]
- Liberti, L.; Kucherenko, S. Comparison of deterministic and stochastic approaches to global optimization. International Transactions in Operational Research 2005, 12, 263–285. [Google Scholar] [CrossRef]
- Qawaqneh, H. New contraction embedded with simulation function and cyclic (α, β)-admissible in metric-like spaces. International Journal of Mathematics and Computer Science 2020, 15, 1029–1044. [Google Scholar]
- Hamadneh, T.; Athanasopoulos, N.; Ali, M. In Minimization and positivity of the tensorial rational Bernstein form, 2019 IEEE Jordan International Joint Conference on Electrical Engineering and Information Technology (JEEIT - Proceedings), IEEE: 2019; pp 474-479, 8717503.
- Dehghani, M.; Trojovská, E.; Trojovský, P. A new human-based metaheuristic algorithm for solving optimization problems on the base of simulation of driving training process. Scientific Reports 2022, 12, 9924. [Google Scholar] [CrossRef]
- Hamadneh, T.; Wisniewski, R. In The Barycentric Bernstein Form for Control Design, 2018 Annual American Control Conference (ACC), 27-29 June 2018; 2018; pp 3738-3743. 29 June.
- Dehghani, M.; Samet, H. Momentum search algorithm: A new meta-heuristic optimization algorithm inspired by momentum conservation law. SN Applied Sciences 2020, 2, 1–15. [Google Scholar] [CrossRef]
- de Armas, J.; Lalla-Ruiz, E.; Tilahun, S.L.; Voß, S. Similarity in metaheuristics: a gentle step towards a comparison methodology. Natural Computing 2022, 21, 265–287. [Google Scholar] [CrossRef]
- Dehghani, M.; Montazeri, Z.; Dhiman, G.; Malik, O.; Morales-Menendez, R.; Ramirez-Mendoza, R.A.; Dehghani, A.; Guerrero, J.M.; Parra-Arroyo, L. A spring search algorithm applied to engineering optimization problems. Applied Sciences 2020, 10, 6173. [Google Scholar] [CrossRef]
- Matoušová, I.; Trojovský, P.; Dehghani, M.; Trojovská, E.; Kostra, J. Mother optimization algorithm: a new human-based metaheuristic approach for solving engineering optimization. Scientific Reports 2023, 13, 10312. [Google Scholar] [CrossRef]
- Wolpert, D.H.; Macready, W.G. No free lunch theorems for optimization. IEEE transactions on evolutionary computation 1997, 1, 67–82. [Google Scholar] [CrossRef]
- Dorigo, M.; Maniezzo, V.; Colorni, A. Ant system: optimization by a colony of cooperating agents. IEEE Transactions on Systems, Man, and Cybernetics, Part B (Cybernetics) 1996, 26, 29–41. [Google Scholar] [CrossRef] [PubMed]
- Kennedy, J.; Eberhart, R. In Particle swarm optimization, Proceedings of ICNN'95 - International Conference on Neural Networks, Perth, WA, Australia, 27 Nov.-1 Dec. 1995; IEEE: Perth, WA, Australia, 1995; pp 1942-1948 vol.4.
- Karaboga, D.; Basturk, B. In Artificial bee colony (ABC) optimization algorithm for solving constrained optimization problems, International fuzzy systems association world congress, Springer: 2007; pp 789-798.
- Abualigah, L.; Abd Elaziz, M.; Sumari, P.; Geem, Z.W.; Gandomi, A.H. Reptile Search Algorithm (RSA): A nature-inspired meta-heuristic optimizer. Expert Systems with Applications 2022, 191, 116158. [Google Scholar] [CrossRef]
- Mirjalili, S.; Mirjalili, S.M.; Lewis, A. Grey Wolf Optimizer. Advances in Engineering Software 2014, 69, 46–61. [Google Scholar] [CrossRef]
- Jiang, Y.; Wu, Q.; Zhu, S.; Zhang, L. Orca predation algorithm: A novel bio-inspired algorithm for global optimization problems. Expert Systems with Applications 2022, 188, 116026. [Google Scholar] [CrossRef]
- Faramarzi, A.; Heidarinejad, M.; Mirjalili, S.; Gandomi, A.H. Marine Predators Algorithm: A nature-inspired metaheuristic. Expert Systems with Applications 2020, 152, 113377. [Google Scholar] [CrossRef]
- Abdollahzadeh, B.; Gharehchopogh, F.S.; Mirjalili, S. African vultures optimization algorithm: A new nature-inspired metaheuristic algorithm for global optimization problems. Computers & Industrial Engineering 2021, 158, 107408. [Google Scholar]
- Braik, M.; Hammouri, A.; Atwan, J.; Al-Betar, M.A.; Awadallah, M.A. White Shark Optimizer: A novel bio-inspired meta-heuristic algorithm for global optimization problems. Knowledge-Based Systems 2022, 108457. [Google Scholar] [CrossRef]
- Hashim, F.A.; Houssein, E.H.; Hussain, K.; Mabrouk, M.S.; Al-Atabany, W. Honey Badger Algorithm: New metaheuristic algorithm for solving optimization problems. Mathematics and Computers in Simulation 2022, 192, 84–110. [Google Scholar] [CrossRef]
- Mirjalili, S.; Lewis, A. The whale optimization algorithm. Advances in engineering software 2016, 95, 51–67. [Google Scholar] [CrossRef]
- Kaur, S.; Awasthi, L.K.; Sangal, A.L.; Dhiman, G. Tunicate Swarm Algorithm: A new bio-inspired based metaheuristic paradigm for global optimization. Engineering Applications of Artificial Intelligence 2020, 90, 103541. [Google Scholar] [CrossRef]
- Chopra, N.; Ansari, M.M. Golden Jackal Optimization: A Novel Nature-Inspired Optimizer for Engineering Applications. Expert Systems with Applications 2022, 116924. [Google Scholar] [CrossRef]
- Goldberg, D.E.; Holland, J.H. Genetic Algorithms and Machine Learning. Machine Learning 1988, 3, 95–99. [Google Scholar] [CrossRef]
- Storn, R.; Price, K. Differential evolution–a simple and efficient heuristic for global optimization over continuous spaces. Journal of global optimization 1997, 11, 341–359. [Google Scholar] [CrossRef]
- De Castro, L.N.; Timmis, J.I. Artificial immune systems as a novel soft computing paradigm. Soft computing 2003, 7, 526–544. [Google Scholar] [CrossRef]
- Beyer, H.-G.; Schwefel, H.-P. , Evolution strategies–a comprehensive introduction. Natural computing 2002, 1, 3–52. [Google Scholar] [CrossRef]
- Reynolds, R.G. In An introduction to cultural algorithms, Proceedings of the third annual conference on evolutionary programming, World Scientific: 1994; pp 131-139.
- Koza, J.R.; Koza, J.R. Genetic programming: on the programming of computers by means of natural selection. MIT press: 1992; Vol. 1.
- Kirkpatrick, S.; Gelatt, C.D.; Vecchi, M.P. Optimization by simulated annealing. science 1983, 220, 671–680. [Google Scholar] [CrossRef]
- Rashedi, E.; Nezamabadi-Pour, H.; Saryazdi, S. GSA: a gravitational search algorithm. Information sciences 2009, 179, 2232–2248. [Google Scholar] [CrossRef]
- Eskandar, H.; Sadollah, A.; Bahreininejad, A.; Hamdi, M. Water cycle algorithm–A novel metaheuristic optimization method for solving constrained engineering optimization problems. Computers & Structures 2012, 110, 151–166. [Google Scholar]
- Mirjalili, S.; Mirjalili, S.M.; Hatamlou, A. Multi-verse optimizer: a nature-inspired algorithm for global optimization. Neural Computing and Applications 2016, 27, 495–513. [Google Scholar] [CrossRef]
- Hashim, F.A.; Hussain, K.; Houssein, E.H.; Mabrouk, M.S.; Al-Atabany, W. Archimedes optimization algorithm: a new metaheuristic algorithm for solving optimization problems. Applied Intelligence 2021, 51, 1531–1551. [Google Scholar] [CrossRef]
- Cuevas, E.; Oliva, D.; Zaldivar, D.; Pérez-Cisneros, M.; Sossa, H. Circle detection using electro-magnetism optimization. Information Sciences 2012, 182, 40–55. [Google Scholar] [CrossRef]
- Wei, Z.; Huang, C.; Wang, X.; Han, T.; Li, Y. Nuclear reaction optimization: A novel and powerful physics-based algorithm for global optimization. IEEE Access 2019, 7, 66084–66109. [Google Scholar] [CrossRef]
- Faramarzi, A.; Heidarinejad, M.; Stephens, B.; Mirjalili, S. Equilibrium optimizer: A novel optimization algorithm. Knowledge-Based Systems 2020, 191, 105190. [Google Scholar] [CrossRef]
- Hatamlou, A. Black hole: A new heuristic optimization approach for data clustering. Information sciences 2013, 222, 175–184. [Google Scholar] [CrossRef]
- Kaveh, A.; Dadras, A. A novel meta-heuristic optimization algorithm: thermal exchange optimization. Advances in Engineering Software 2017, 110, 69–84. [Google Scholar] [CrossRef]
- Pereira, J.L. J.; Francisco, M.B.; Diniz, C.A.; Oliver, G.A.; Cunha Jr, S.S.; Gomes, G.F. Lichtenberg algorithm: A novel hybrid physics-based meta-heuristic for global optimization. Expert Systems with Applications 2021, 170, 114522. [Google Scholar] [CrossRef]
- Hashim, F.A.; Houssein, E.H.; Mabrouk, M.S.; Al-Atabany, W.; Mirjalili, S. Henry gas solubility optimization: A novel physics-based algorithm. Future Generation Computer Systems 2019, 101, 646–667. [Google Scholar] [CrossRef]
- Rao, R.V.; Savsani, V.J.; Vakharia, D. Teaching–learning-based optimization: a novel method for constrained mechanical design optimization problems. Computer-Aided Design 2011, 43, 303–315. [Google Scholar] [CrossRef]
- Dehghani, M.; Trojovský, P. Teamwork Optimization Algorithm: A New Optimization Approach for Function Minimization/Maximization. Sensors 2021, 21, 4567. [Google Scholar] [CrossRef]
- Al-Betar, M.A.; Alyasseri, Z.A. A.; Awadallah, M.A.; Abu Doush, I. Coronavirus herd immunity optimizer (CHIO). Neural Computing and Applications 2021, 33, 5011–5042. [Google Scholar]
- Braik, M.; Ryalat, M.H.; Al-Zoubi, H. A novel meta-heuristic algorithm for solving numerical optimization problems: Ali Baba and the forty thieves. Neural Computing and Applications 2022, 34, 409–455. [Google Scholar] [CrossRef]
- Ayyarao, T.L.; RamaKrishna, N.; Elavarasam, R.M.; Polumahanthi, N.; Rambabu, M.; Saini, G.; Khan, B.; Alatas, B. War Strategy Optimization Algorithm: A New Effective Metaheuristic Algorithm for Global Optimization. IEEE Access 2022. [CrossRef]
- Mohamed, A.W.; Hadi, A.A.; Mohamed, A.K. Gaining-sharing knowledge based algorithm for solving optimization problems: a novel nature-inspired algorithm. International Journal of Machine Learning and Cybernetics 2020, 11, 1501–1529. [Google Scholar] [CrossRef]
- Payne, J.; Prudente, J.C. Orang-utans: behaviour, ecology and conservation. New Holland Publishers: 2008.
- Rijksen, H.D.; Meijaard, E. Our vanishing relative: the status of wild orang-utans at the close of the twentieth century. Springer: 1999.
- Wich, S.A.; Setia, T.M.; van Schaik, C.P. Orangutans: geographic variation in behavioral ecology and conservation. OUP Oxford: 2010.
- Awad, N.; Ali, M.; Liang, J.; Qu, B.; Suganthan, P.; Definitions, P. Evaluation criteria for the CEC 2017 special session and competition on single objective real-parameter numerical optimization. Technology Report 2016.
- Wilcoxon, F. Individual comparisons by ranking methods. In Breakthroughs in statistics, Springer: 1992; pp 196-202.
- Das, S.; Suganthan, P.N. Problem definitions and evaluation criteria for CEC 2011 competition on testing evolutionary algorithms on real world optimization problems. Jadavpur University, Nanyang Technological University, Kolkata 2010, 341-359.
Figure 1.
Orangutan taken from: free media Wikimedia Commons.
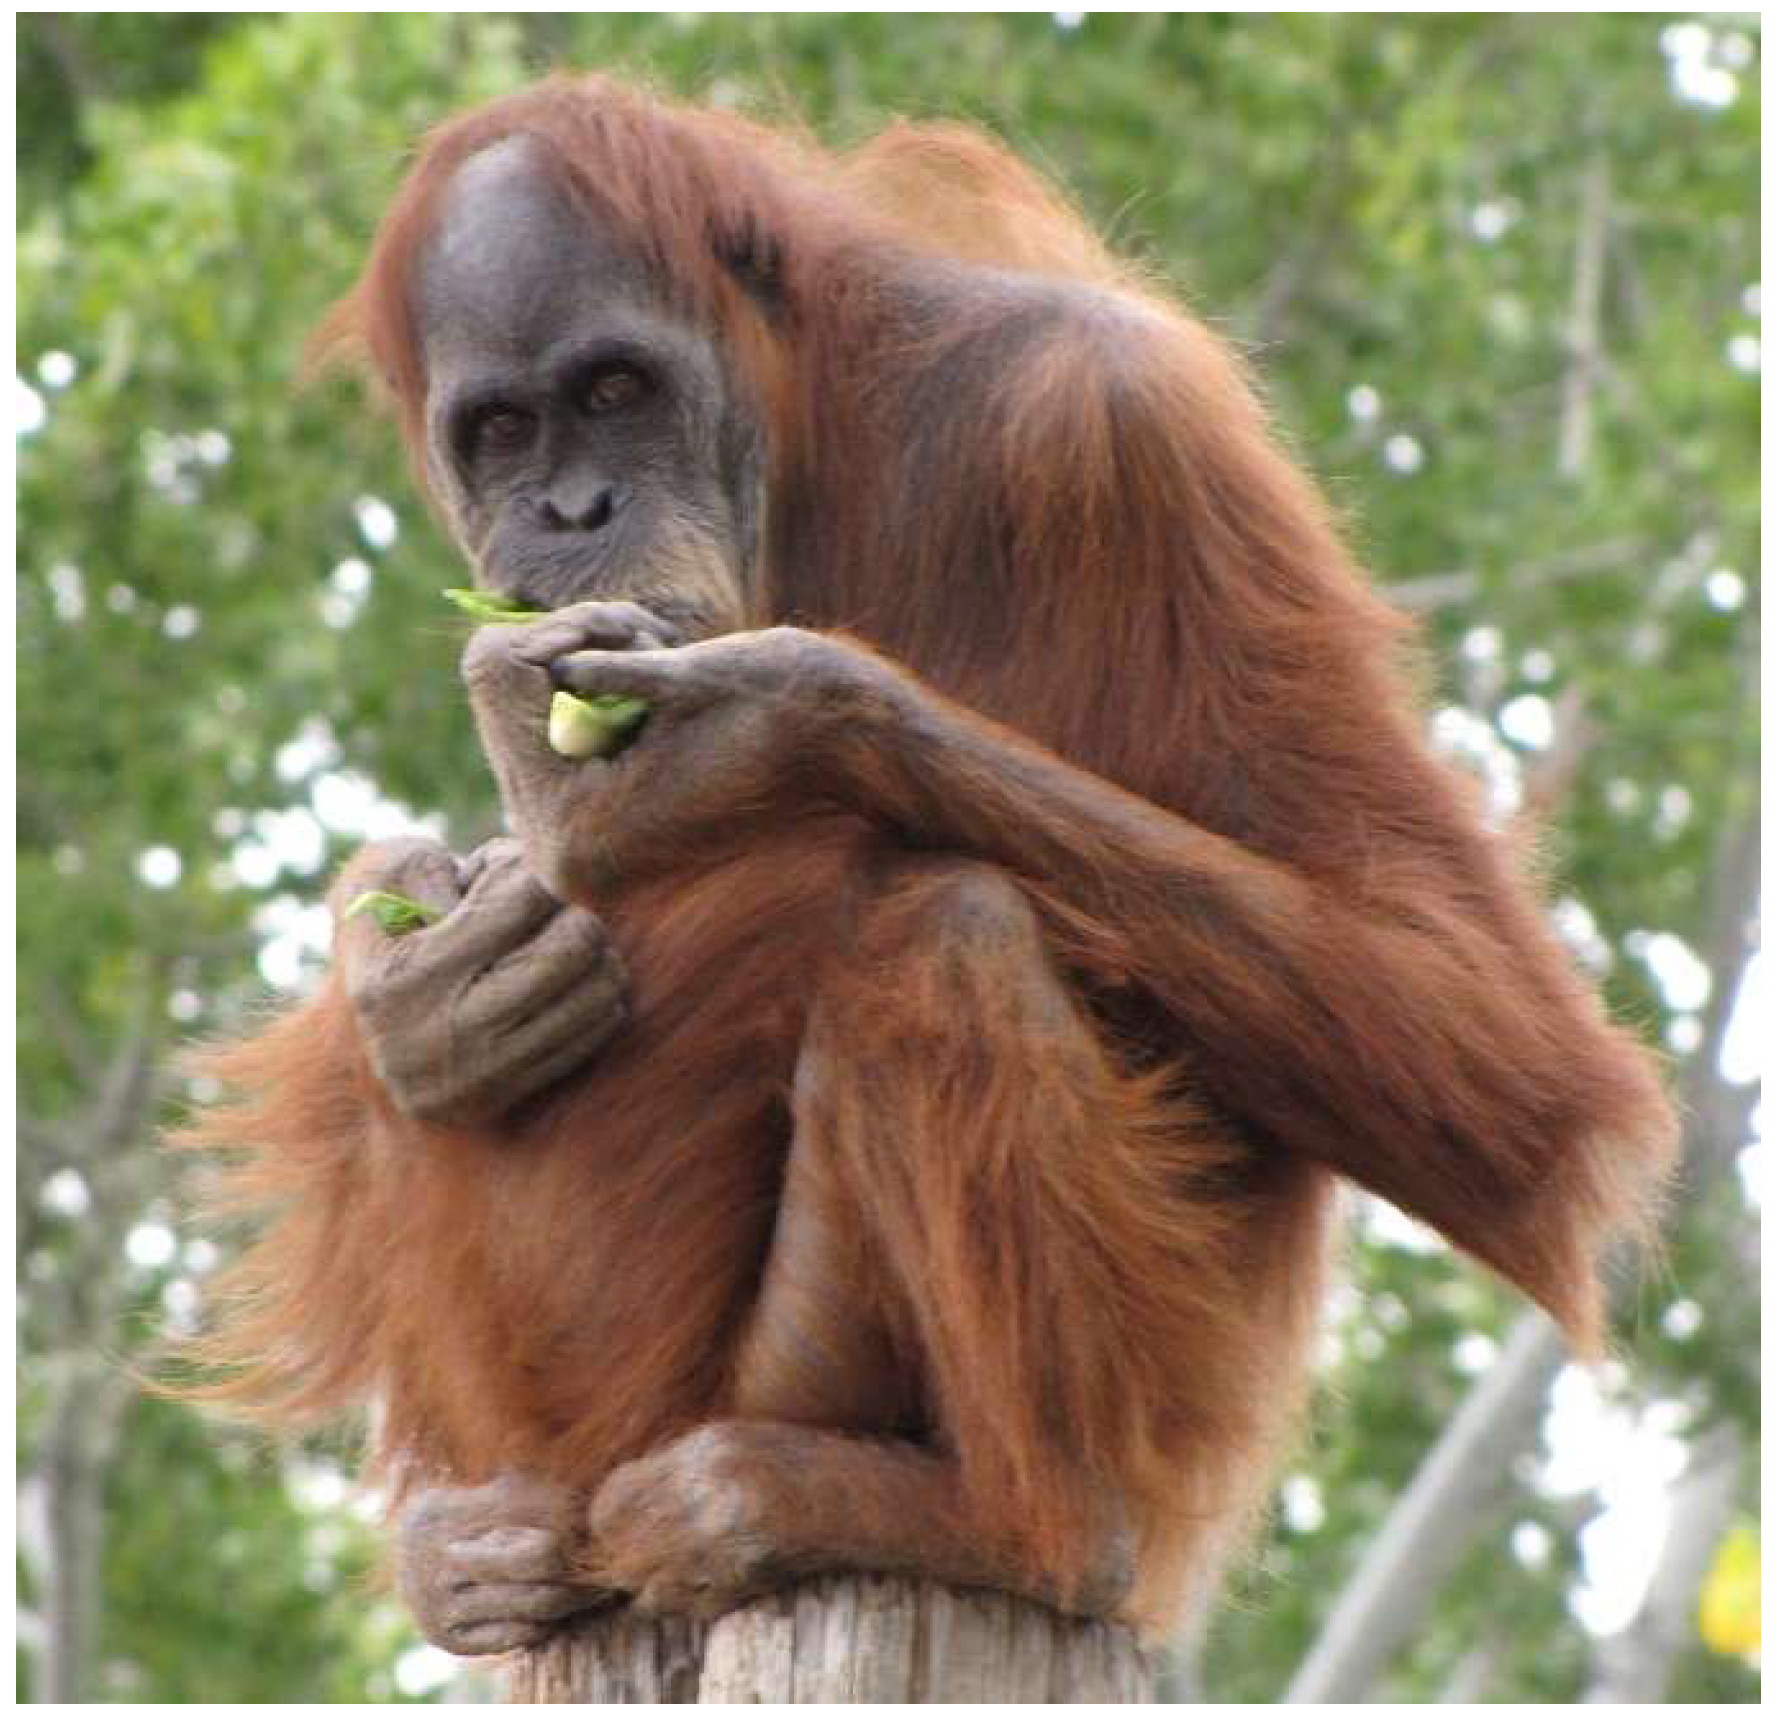
Figure 2.
Flowchart of OOA.
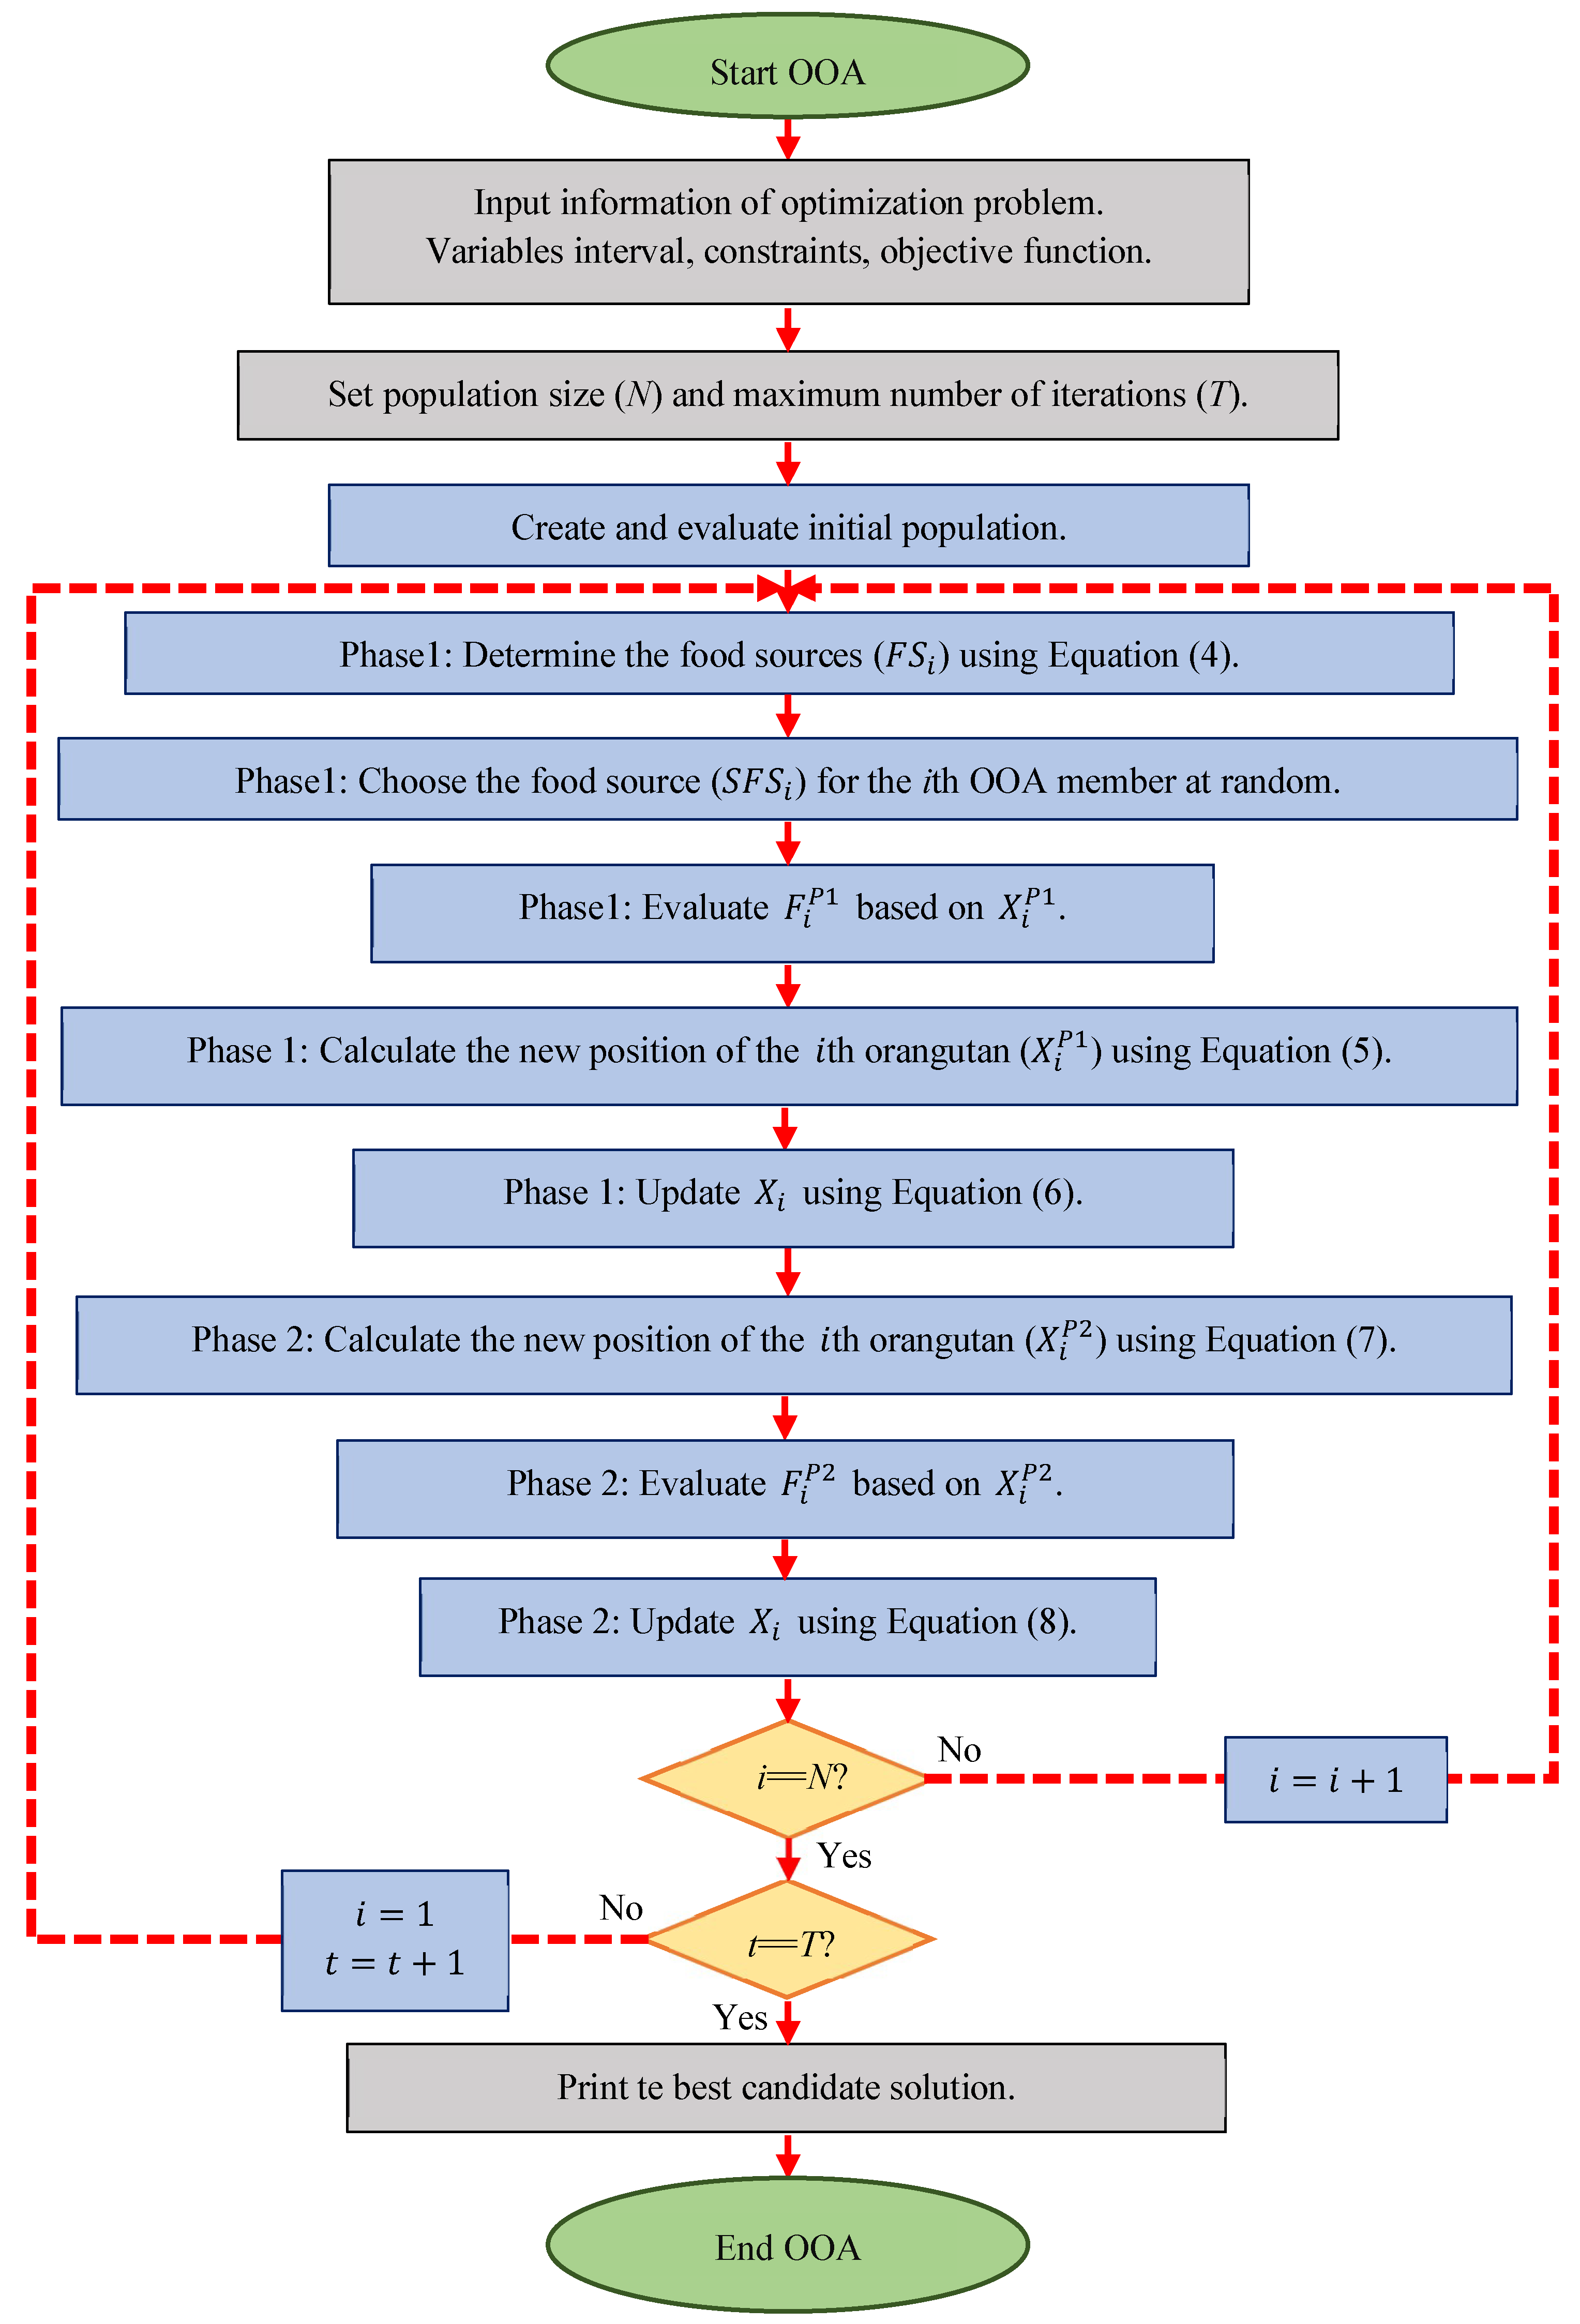
Figure 7.
Boxplot diagrams of OOA and the competitor algorithms performances for the CEC 2011 test suite.
Figure 7.
Boxplot diagrams of OOA and the competitor algorithms performances for the CEC 2011 test suite.
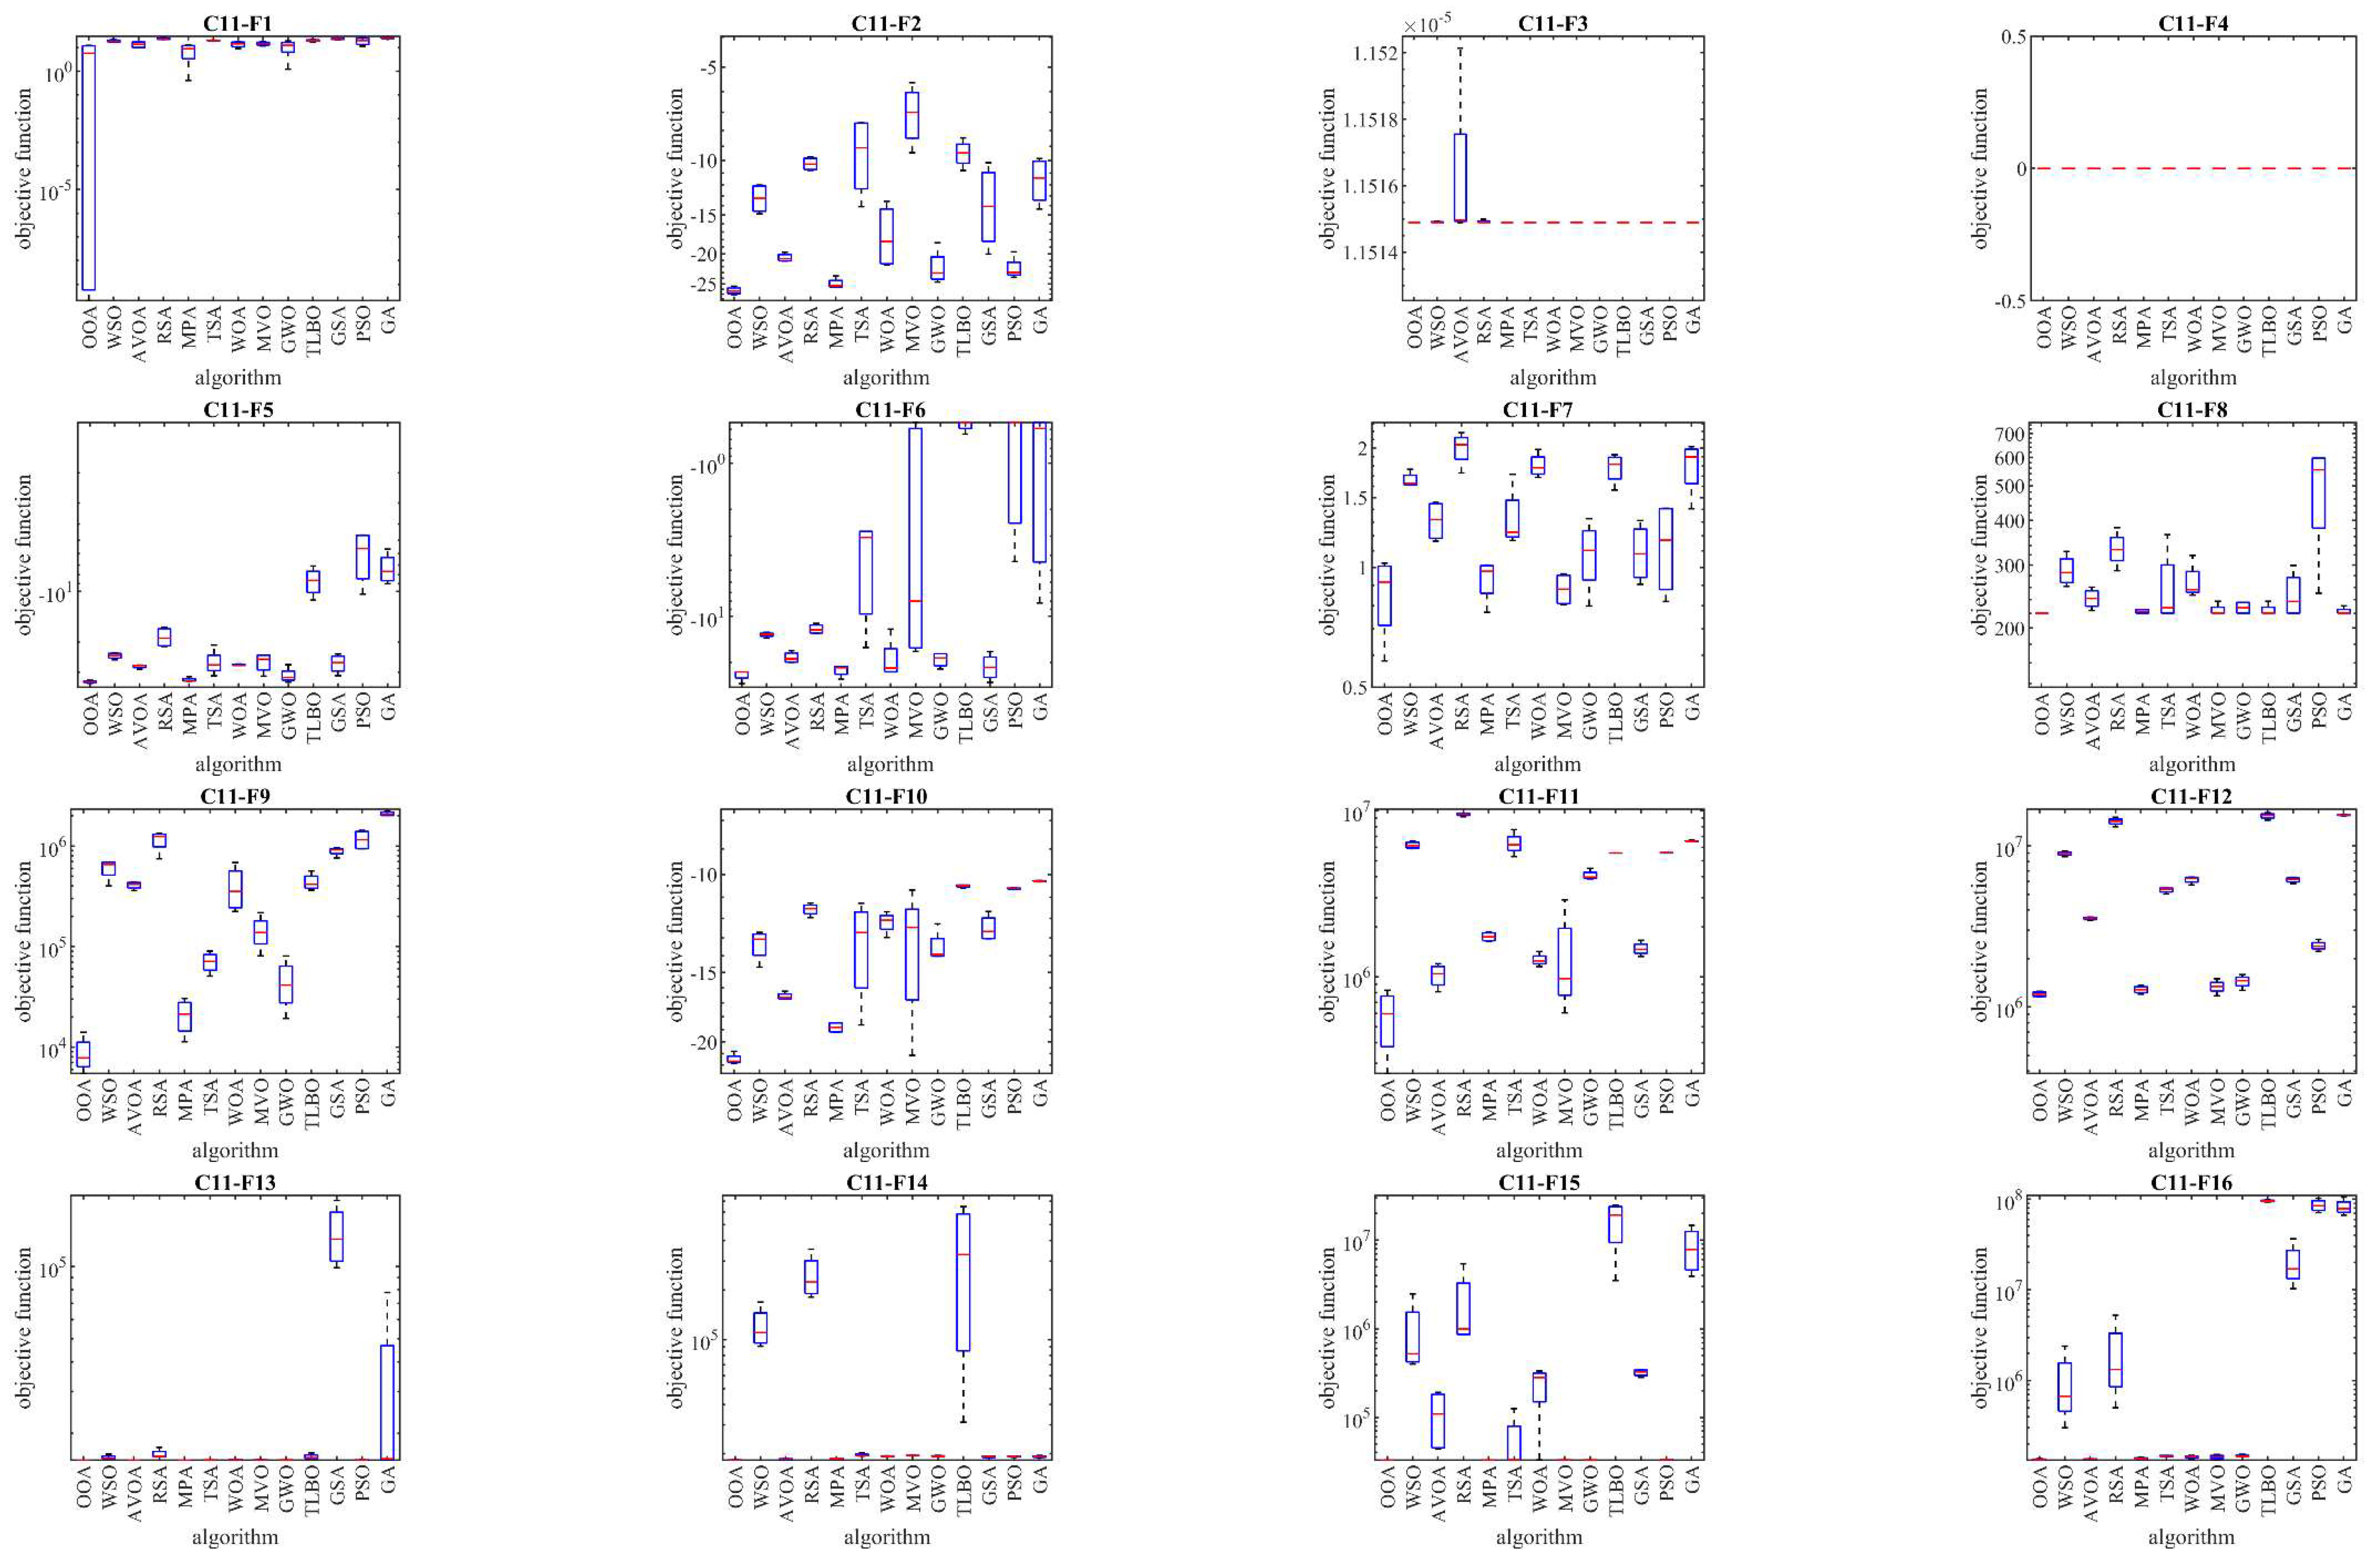
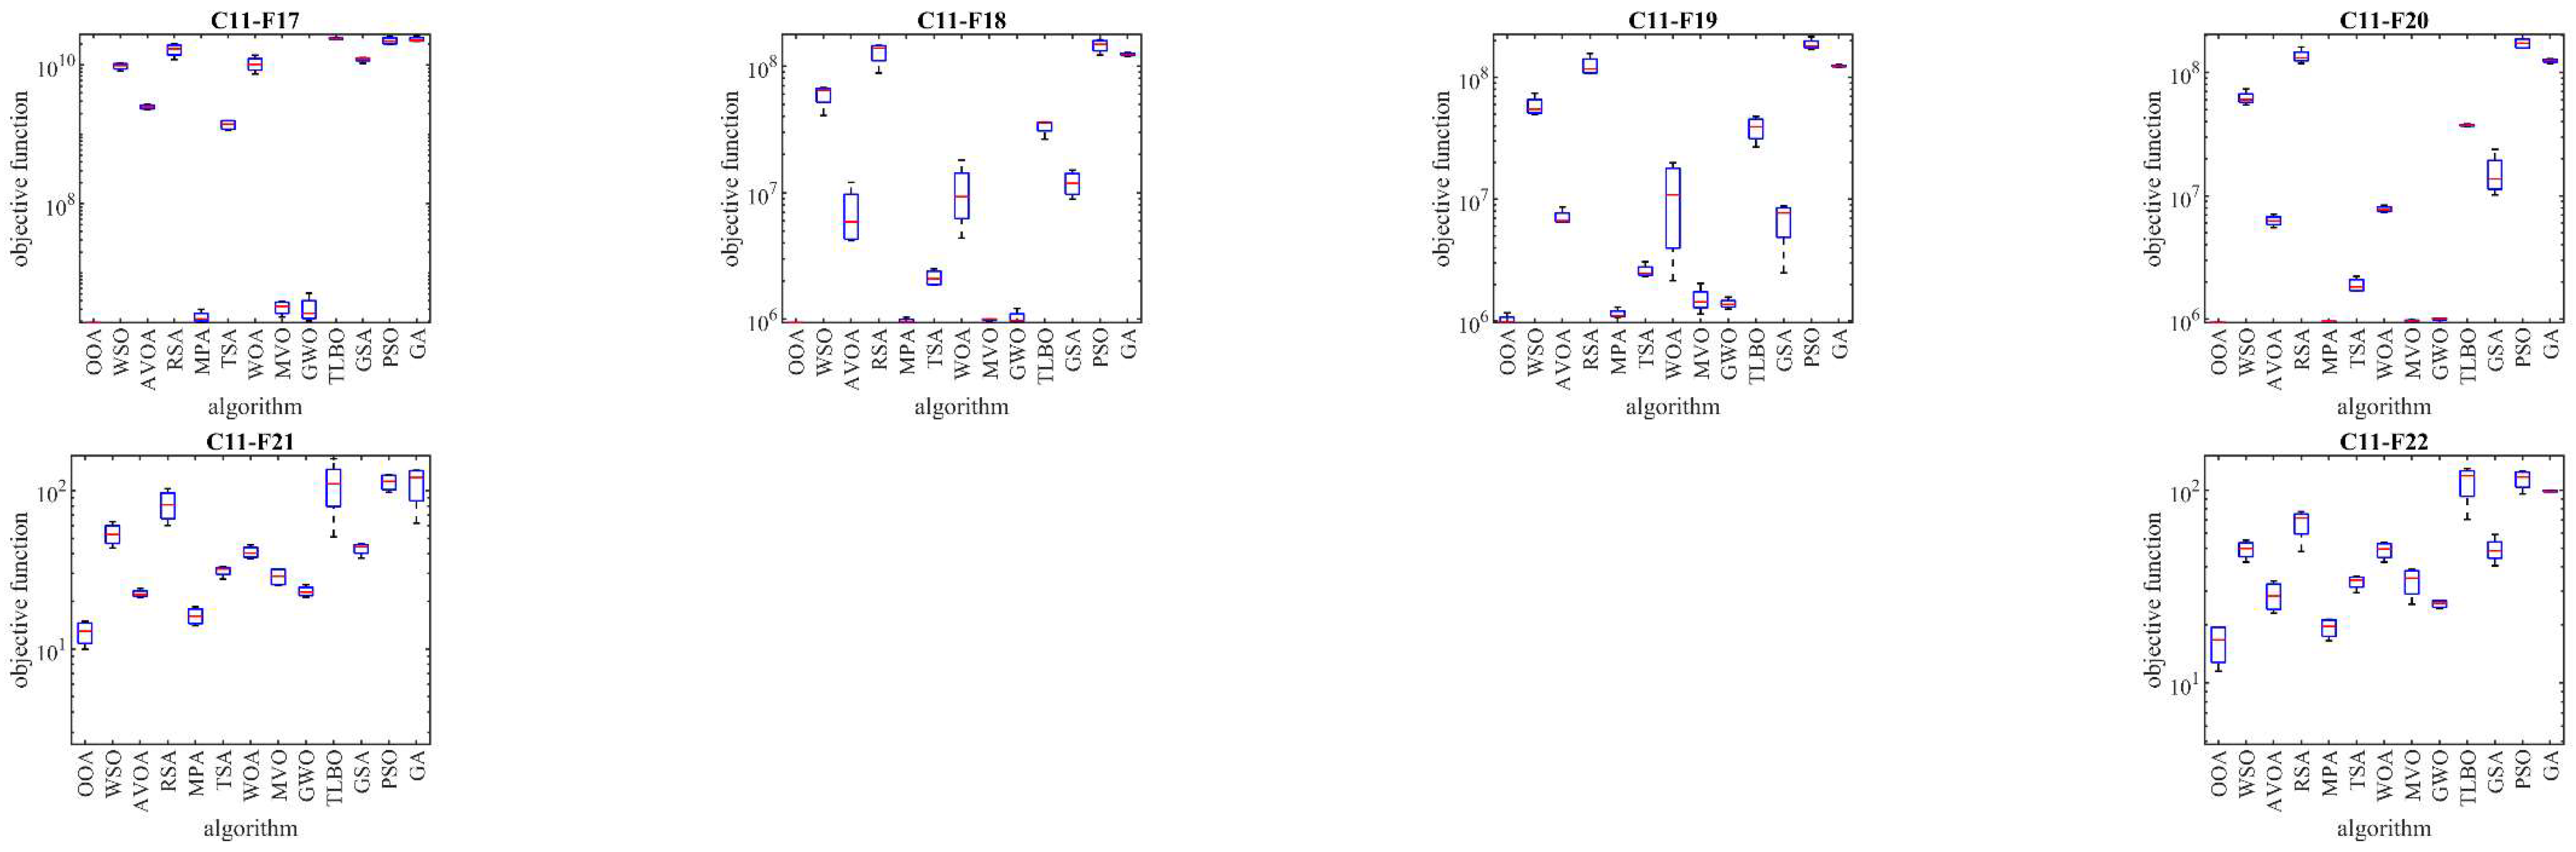
Table 1.
Control parameters values.
| Algorithm | parameter | value |
| GA | ||
| Type | Real coded | |
| Selection | Roulette wheel (Proportionate) | |
| Crossover | Whole arithmetic (Probability = 0.8, ) | |
| Mutation | Gaussian (Probability = 0.05) | |
| PSO | ||
| Topology | Fully connected | |
| Cognitive and social constant | (C1, C2) | |
| Inertia weight | Linear reduction from 0.9 to 0.1 | |
| Velocity limit | 10% of dimension range | |
| GSA | ||
| Alpha, G0, Rnorm, Rpower | 20, 100, 2, 1 | |
| TLBO | ||
| TF: teaching factor | TF = round | |
| random number | rand is a random number between | |
| GWO | ||
| Convergence parameter (a) | a: Linear reduction from 2 to 0. | |
| MVO | ||
| wormhole existence probability (WEP) | Min(WEP) = 0.2 and Max(WEP)=1. | |
| Exploitation accuracy over the iterations (p) | . | |
| WOA | ||
| Convergence parameter (a) | a: Linear reduction from 2 to 0. | |
| r is a random vector in | ||
| l is a random number in | ||
| TSA | ||
| Pmin and Pmax | 1, 4 | |
| c1, c2, c3 | random numbers lie in the range of | |
| MPA | ||
| Constant number | P=0.5 | |
| Random vector | R is a vector of uniform random numbers in | |
| Fish Aggregating Devices (FADs) | FADs=0.2 | |
| Binary vector | U= 0 or 1 | |
| RSA | ||
| Sensitive parameter | ||
| Sensitive parameter | ||
| Evolutionary Sense (ES) | ES: randomly decreasing values between 2 and −2 | |
| AVOA | ||
| L1, L2 | 0.8, 0.2 | |
| w | 2.5 | |
| P1, P2, P3 | 0.6, 0.4, 0.6 | |
| WSO | ||
| Fmin and Fmax | 0.07, 0.75 | |
| τ, ao, a1, a2 | 4.125, 6.25, 100, 0.0005 |
Table 6.
Wilcoxon rank sum test results.
| Compared algorithm | Objective function type | |||
| CEC 2017 | ||||
| D=10 | D=30 | D=50 | D=100 | |
| OOA vs. WSO | 8.41E-24 | 8.21E-24 | 8.21E-24 | 8.21E-24 |
| OOA vs. AVOA | 1.57E-21 | 1.26E-23 | 8.21E-24 | 8.21E-24 |
| OOA vs. RSA | 8.21E-24 | 8.21E-24 | 8.21E-24 | 8.21E-24 |
| OOA vs. MPA | 3.93E-22 | 6.50E-19 | 2.76E-20 | 8.21E-24 |
| OOA vs. TSA | 3.96E-23 | 8.21E-24 | 8.21E-24 | 8.21E-24 |
| OOA vs. WOA | 3.96E-23 | 8.21E-24 | 8.21E-24 | 8.21E-24 |
| OOA vs. MVO | 3.76E-21 | 8.87E-24 | 8.21E-24 | 8.21E-24 |
| OOA vs. GWO | 2.18E-23 | 8.21E-24 | 8.21E-24 | 8.21E-24 |
| OOA vs. TLBO | 1.54E-23 | 8.21E-24 | 8.21E-24 | 8.21E-24 |
| OOA vs. GSA | 6.66E-21 | 8.41E-24 | 8.21E-24 | 8.21E-24 |
| OOA vs. PSO | 6.41E-22 | 9.79E-24 | 8.21E-24 | 8.21E-24 |
| OOA vs. GA | 1.13E-21 | 8.21E-24 | 8.21E-24 | 8.21E-24 |
Table 7.
Optimization results for the CEC 2011 test suite.
| OOA | WSO | AVOA | RSA | MPA | TSA | WOA | MVO | GWO | TLBO | GSA | PSO | GA | ||
|---|---|---|---|---|---|---|---|---|---|---|---|---|---|---|
| C11-F1 | mean | 5.920103 | 17.39022 | 13.33731 | 21.05706 | 8.715436 | 18.01704 | 13.58734 | 14.23293 | 11.54006 | 18.04442 | 20.81796 | 17.62171 | 22.26941 |
| best | 2E-10 | 14.61193 | 9.495939 | 18.71472 | 1.804603 | 17.30358 | 8.520687 | 12.06721 | 2.440182 | 16.94885 | 18.26611 | 11.98458 | 21.09797 | |
| worst | 12.30606 | 19.66117 | 16.68954 | 23.05217 | 13.19969 | 19.09799 | 16.93418 | 16.75519 | 17.9142 | 20.10811 | 22.0111 | 23.14246 | 24.25607 | |
| std | 7.196379 | 2.400987 | 4.013324 | 1.99914 | 5.368972 | 0.818959 | 4.018352 | 2.542719 | 6.891004 | 1.494681 | 1.835857 | 5.329393 | 1.456657 | |
| median | 5.687176 | 17.6439 | 13.58188 | 21.23068 | 9.928723 | 17.8333 | 14.44725 | 14.05466 | 12.90292 | 17.56037 | 21.49731 | 17.67991 | 21.8618 | |
| rank | 1 | 7 | 4 | 12 | 2 | 9 | 5 | 6 | 3 | 10 | 11 | 8 | 13 | |
| C11-F2 | mean | -26.3179 | -14.2624 | -19.9064 | -11.8736 | -23.3368 | -11.6356 | -17.8532 | -9.528 | -21.2568 | -11.3023 | -15.241 | -21.2983 | -13.0262 |
| best | -27.0676 | -15.7508 | -20.5241 | -12.1168 | -23.9079 | -15.1534 | -21.0988 | -11.2824 | -23.3867 | -12.0527 | -19.2658 | -22.4767 | -15.3514 | |
| worst | -25.4328 | -13.1382 | -19.3344 | -11.5246 | -22.093 | -9.58355 | -14.2074 | -8.10438 | -18.0907 | -10.7637 | -11.6643 | -19.023 | -11.3361 | |
| std | 0.738935 | 1.333128 | 0.544996 | 0.26244 | 0.884624 | 2.715589 | 3.570128 | 1.384544 | 2.41029 | 0.60266 | 3.68196 | 1.640456 | 1.953962 | |
| median | -26.3856 | -14.0804 | -19.8835 | -11.9266 | -23.6732 | -10.9027 | -18.0533 | -9.36262 | -21.775 | -11.1964 | -15.0169 | -21.8468 | -12.7086 | |
| rank | 1 | 8 | 5 | 10 | 2 | 11 | 6 | 13 | 4 | 12 | 7 | 3 | 9 | |
| C11-F4 | mean | 1.15E-05 | 1.15E-05 | 1.15E-05 | 1.15E-05 | 1.15E-05 | 1.15E-05 | 1.15E-05 | 1.15E-05 | 1.15E-05 | 1.15E-05 | 1.15E-05 | 1.15E-05 | 1.15E-05 |
| best | 1.15E-05 | 1.15E-05 | 1.15E-05 | 1.15E-05 | 1.15E-05 | 1.15E-05 | 1.15E-05 | 1.15E-05 | 1.15E-05 | 1.15E-05 | 1.15E-05 | 1.15E-05 | 1.15E-05 | |
| worst | 1.15E-05 | 1.15E-05 | 1.15E-05 | 1.15E-05 | 1.15E-05 | 1.15E-05 | 1.15E-05 | 1.15E-05 | 1.15E-05 | 1.15E-05 | 1.15E-05 | 1.15E-05 | 1.15E-05 | |
| std | 2E-19 | 1.86E-11 | 2.13E-09 | 4.18E-11 | 6.64E-14 | 5.81E-14 | 6.62E-14 | 9E-13 | 6.7E-14 | 1.08E-13 | 6.62E-14 | 6.62E-14 | 6.62E-14 | |
| median | 1.15E-05 | 1.15E-05 | 1.15E-05 | 1.15E-05 | 1.15E-05 | 1.15E-05 | 1.15E-05 | 1.15E-05 | 1.15E-05 | 1.15E-05 | 1.15E-05 | 1.15E-05 | 1.15E-05 | |
| rank | 1 | 11 | 13 | 12 | 6 | 8 | 4 | 10 | 7 | 9 | 3 | 2 | 5 | |
| C11-F4 | mean | 0 | 0 | 0 | 0 | 0 | 0 | 0 | 0 | 0 | 0 | 0 | 0 | 0 |
| best | 0 | 0 | 0 | 0 | 0 | 0 | 0 | 0 | 0 | 0 | 0 | 0 | 0 | |
| worst | 0 | 0 | 0 | 0 | 0 | 0 | 0 | 0 | 0 | 0 | 0 | 0 | 0 | |
| std | 0 | 0 | 0 | 0 | 0 | 0 | 0 | 0 | 0 | 0 | 0 | 0 | 0 | |
| median | 0 | 0 | 0 | 0 | 0 | 0 | 0 | 0 | 0 | 0 | 0 | 0 | 0 | |
| rank | 1 | 1 | 1 | 1 | 1 | 1 | 1 | 1 | 1 | 1 | 1 | 1 | 1 | |
| C11-F5 | mean | -34.1274 | -25.2175 | -27.9963 | -21.1342 | -32.3358 | -27.1746 | -27.5944 | -27.0569 | -30.9071 | -13.3897 | -27.3571 | -11.5656 | -12.2902 |
| best | -34.7494 | -26.0919 | -28.9217 | -22.8513 | -32.8473 | -30.8993 | -27.7615 | -31.0961 | -33.1007 | -15.1957 | -30.9286 | -14.6193 | -13.5569 | |
| worst | -33.3862 | -24.4915 | -27.632 | -19.2053 | -31.2781 | -22.7089 | -27.2665 | -25.0029 | -27.5749 | -12.0369 | -24.7099 | -10.0326 | -10.9043 | |
| std | 0.589989 | 0.736666 | 0.651398 | 2.066682 | 0.751817 | 3.543313 | 0.235926 | 3.016868 | 2.471951 | 1.43243 | 2.882071 | 2.246734 | 1.211154 | |
| median | -34.1871 | -25.1432 | -27.7158 | -21.2401 | -32.609 | -27.5451 | -27.6749 | -26.0642 | -31.4763 | -13.1632 | -26.8949 | -10.8052 | -12.3498 | |
| rank | 1 | 9 | 4 | 10 | 2 | 7 | 5 | 8 | 3 | 11 | 6 | 13 | 12 | |
| C11-F6 | mean | -24.1119 | -14.0897 | -18.2974 | -13.2521 | -21.3104 | -8.63171 | -19.0738 | -10.2921 | -18.8022 | -4.21747 | -20.6998 | -4.94712 | -5.71111 |
| best | -27.4298 | -14.764 | -19.1411 | -14.6227 | -23.6053 | -16.0875 | -22.4303 | -17.7564 | -20.7928 | -4.93827 | -24.3079 | -7.0585 | -9.74747 | |
| worst | -23.0059 | -13.5426 | -17.602 | -12.2858 | -19.8721 | -5.52345 | -13.0723 | -3.7729 | -17.0597 | -3.7729 | -16.9161 | -3.7729 | -4.0188 | |
| std | 2.324951 | 0.65053 | 0.809346 | 1.065169 | 1.807309 | 5.248737 | 4.379777 | 7.752062 | 1.994112 | 0.529975 | 3.477442 | 1.570632 | 2.860723 | |
| median | -23.0059 | -14.026 | -18.2232 | -13.0499 | -20.8821 | -6.45794 | -20.3964 | -9.81963 | -18.6782 | -4.07935 | -20.7876 | -4.47854 | -4.53909 | |
| rank | 1 | 7 | 6 | 8 | 2 | 10 | 4 | 9 | 5 | 13 | 3 | 12 | 11 | |
| C11-F7 | mean | 0.860699 | 1.558108 | 1.288623 | 1.820738 | 0.99202 | 1.303556 | 1.673227 | 0.951373 | 1.107406 | 1.65236 | 1.117491 | 1.15425 | 1.670577 |
| best | 0.582266 | 1.521316 | 1.182697 | 1.605716 | 0.862127 | 1.172989 | 1.588548 | 0.885728 | 0.881194 | 1.479679 | 0.968488 | 0.897931 | 1.35767 | |
| worst | 1.025027 | 1.635861 | 1.394596 | 1.96165 | 1.059349 | 1.59616 | 1.803919 | 1.02631 | 1.309296 | 1.756946 | 1.298184 | 1.369651 | 1.829346 | |
| std | 0.211503 | 0.055246 | 0.118873 | 0.159565 | 0.095148 | 0.206503 | 0.098956 | 0.075607 | 0.186797 | 0.131117 | 0.158446 | 0.258564 | 0.224931 | |
| median | 0.91775 | 1.537629 | 1.2886 | 1.857793 | 1.023301 | 1.222537 | 1.650222 | 0.946726 | 1.119568 | 1.686408 | 1.101647 | 1.17471 | 1.747647 | |
| rank | 1 | 9 | 7 | 13 | 3 | 8 | 12 | 2 | 4 | 10 | 5 | 6 | 11 | |
| C11-F8 | mean | 220 | 278.3988 | 241.0229 | 312.3393 | 225.8807 | 255.1568 | 262.5186 | 227.2504 | 229.9897 | 227.2504 | 245.9581 | 433.4045 | 225.9188 |
| best | 220 | 255.5256 | 226.2458 | 277.3029 | 222.2252 | 222.2252 | 243.9974 | 222.2252 | 222.2252 | 222.2252 | 222.2252 | 246.7904 | 222.2252 | |
| worst | 220 | 310.8709 | 258.4594 | 348.7748 | 231.2187 | 340.1051 | 304.4945 | 236.4643 | 239.4366 | 240.8062 | 288.7436 | 521.1187 | 231.5722 | |
| std | 0 | 25.63005 | 14.43071 | 31.00166 | 4.442577 | 59.87582 | 29.60888 | 6.826963 | 9.25062 | 9.508314 | 32.95358 | 135.3033 | 4.579606 | |
| median | 220 | 273.5994 | 239.6932 | 311.6397 | 225.0395 | 229.1484 | 250.7913 | 225.156 | 229.1484 | 222.985 | 236.4317 | 482.8545 | 224.9389 | |
| rank | 1 | 11 | 7 | 12 | 2 | 9 | 10 | 5 | 6 | 4 | 8 | 13 | 3 | |
| C11-F9 | mean | 8789.286 | 504826.7 | 354448.5 | 929153.6 | 53342.71 | 92037.41 | 351366.3 | 148488.9 | 72528.14 | 379914.4 | 728516.7 | 946357 | 1669534 |
| best | 5457.674 | 345338.8 | 322389.6 | 615208 | 32194.85 | 74383.89 | 197262.9 | 112757.3 | 38425.67 | 333470.8 | 624500.4 | 753374.8 | 1597320 | |
| worst | 14042.29 | 584496.9 | 381767.1 | 1088516 | 65230.14 | 119930.5 | 582900.7 | 201975.7 | 104307.5 | 472974.3 | 768053.7 | 1146793 | 1778056 | |
| std | 3889.181 | 117306.7 | 26662.14 | 223901 | 15947.1 | 21113.5 | 183601 | 41402.58 | 28515.35 | 66519.34 | 73166.54 | 216193.9 | 88492.94 | |
| median | 7828.591 | 544735.5 | 356818.6 | 1006445 | 57972.91 | 86917.64 | 312650.8 | 139611.4 | 73689.68 | 356606.2 | 760756.3 | 942629.9 | 1651381 | |
| rank | 1 | 9 | 7 | 11 | 2 | 4 | 6 | 5 | 3 | 8 | 10 | 12 | 13 | |
| C11-F10 | mean | -21.4889 | -13.6607 | -16.1383 | -12.2399 | -17.9061 | -14.0129 | -12.7392 | -14.2748 | -13.7729 | -11.4072 | -12.9746 | -11.491 | -11.2428 |
| best | -21.8299 | -14.3725 | -16.7205 | -12.4723 | -18.5767 | -17.4621 | -13.2762 | -20.137 | -14.5805 | -11.9091 | -13.8309 | -11.9553 | -11.6709 | |
| worst | -20.7878 | -13.1969 | -15.7944 | -11.9599 | -17.3594 | -11.938 | -12.3829 | -11.2489 | -12.4952 | -11.0793 | -12.0186 | -11.1889 | -10.9583 | |
| std | 0.498616 | 0.527305 | 0.445566 | 0.266005 | 0.585583 | 2.52099 | 0.409228 | 4.184379 | 0.941716 | 0.371762 | 0.818242 | 0.343631 | 0.318359 | |
| median | -21.669 | -13.5366 | -16.0191 | -12.2637 | -17.8442 | -13.3258 | -12.6488 | -12.8566 | -14.0078 | -11.3203 | -13.0246 | -11.4099 | -11.171 | |
| rank | 1 | 7 | 3 | 10 | 2 | 5 | 9 | 4 | 6 | 12 | 8 | 11 | 13 | |
| C11-F11 | mean | 571712.3 | 5272454 | 1232488 | 7839331 | 1793336 | 5392008 | 1420866 | 1498856 | 3618899 | 4774892 | 1585228 | 4784193 | 5541427 |
| best | 260837.9 | 5107868 | 1058371 | 7600047 | 1728921 | 4633051 | 1360288 | 859467.4 | 3495887 | 4729579 | 1539942 | 4748182 | 5463937 | |
| worst | 828560.9 | 5525958 | 1352575 | 7967240 | 1875084 | 6379519 | 1525324 | 2772377 | 3928789 | 4846534 | 1677837 | 4846534 | 5679235 | |
| std | 260922.1 | 207728.9 | 130596.6 | 180776.5 | 64144.21 | 762344.6 | 75885.36 | 906932.5 | 217780.3 | 52692.61 | 67680.62 | 45577.61 | 99412.38 | |
| median | 598725.2 | 5227994 | 1259503 | 7895018 | 1784669 | 5277731 | 1398926 | 1181790 | 3525459 | 4761727 | 1561566 | 4771028 | 5511268 | |
| rank | 1 | 10 | 2 | 13 | 6 | 11 | 3 | 4 | 7 | 8 | 5 | 9 | 12 | |
| C11-F12 | mean | 1199805 | 7567324 | 3356778 | 11634817 | 1593020 | 4745383 | 5404660 | 1637420 | 1718522 | 12552409 | 5383533 | 2465510 | 12687503 |
| best | 1155937 | 7280380 | 3293066 | 10848229 | 1533606 | 4529257 | 5016677 | 1473502 | 1584886 | 11856053 | 5104008 | 2332813 | 12602758 | |
| worst | 1249353 | 7835976 | 3423927 | 12340363 | 1669648 | 4877249 | 5583985 | 1780806 | 1844952 | 13104339 | 5562149 | 2663064 | 12761027 | |
| std | 47157.58 | 247077.4 | 56234.99 | 642185.6 | 59426.91 | 173011 | 280042.1 | 132583.4 | 112208.9 | 553507.6 | 211689.3 | 148250.5 | 68583.36 | |
| median | 1196965 | 7576470 | 3355059 | 11675339 | 1584414 | 4787514 | 5508990 | 1647685 | 1722125 | 12624622 | 5433988 | 2433081 | 12693114 | |
| rank | 1 | 10 | 6 | 11 | 2 | 7 | 9 | 3 | 4 | 12 | 8 | 5 | 13 | |
| C11-F13 | mean | 15444.2 | 15805.61 | 15461.49 | 16185.9 | 15474.24 | 15496.94 | 15534.98 | 15511.81 | 15506.11 | 15869.08 | 110296.6 | 15497.48 | 27688.41 |
| best | 15444.19 | 15647.1 | 15457.78 | 15842.51 | 15469.61 | 15485.91 | 15494.82 | 15491.36 | 15497.6 | 15609.61 | 80421.19 | 15480.31 | 15478.16 | |
| worst | 15444.21 | 16179.68 | 15467.86 | 17050.98 | 15479.23 | 15508.27 | 15590.66 | 15550.36 | 15512.72 | 16342.08 | 150810.9 | 15524.7 | 64042.27 | |
| std | 0.009091 | 264.6824 | 4.630429 | 611.0784 | 4.134745 | 13.28135 | 46.60689 | 28.12276 | 6.737851 | 348.5 | 33308.79 | 20.1553 | 25474.47 | |
| median | 15444.2 | 15697.84 | 15460.17 | 15925.06 | 15474.06 | 15496.79 | 15527.22 | 15502.77 | 15507.06 | 15762.32 | 104977.1 | 15492.45 | 15616.61 | |
| rank | 1 | 9 | 2 | 11 | 3 | 4 | 8 | 7 | 6 | 10 | 13 | 5 | 12 | |
| C11-F14 | mean | 18295.35 | 97633.27 | 18682.8 | 195620.9 | 18757.09 | 19533.06 | 19276.3 | 19439.01 | 19282.13 | 264278.7 | 19164.53 | 19191.89 | 19181.17 |
| best | 18241.58 | 75011.44 | 18613.02 | 144878.1 | 18661.23 | 19307.69 | 19122.12 | 19329.12 | 19134.19 | 28547.81 | 18912.02 | 19044.6 | 18932.51 | |
| worst | 18388.08 | 135292.4 | 18772.36 | 280518.7 | 18827.98 | 20021.3 | 19404.44 | 19534.56 | 19465.07 | 507229.8 | 19316.17 | 19321.83 | 19459.96 | |
| std | 71.59938 | 28333.14 | 85.39038 | 63854.81 | 80.72001 | 345.4167 | 134.2456 | 91.02157 | 152.7497 | 241544.1 | 188.2708 | 122.2792 | 227.9891 | |
| median | 18275.87 | 90114.63 | 18672.9 | 178543.3 | 18769.57 | 19401.62 | 19289.31 | 19446.17 | 19264.63 | 260668.5 | 19214.96 | 19200.56 | 19166.11 | |
| rank | 1 | 11 | 2 | 12 | 3 | 10 | 7 | 9 | 8 | 13 | 4 | 6 | 5 | |
| C11-F15 | mean | 32883.58 | 781176.2 | 108312 | 1627642 | 45341.41 | 63506.54 | 201447.2 | 45468.92 | 45450.31 | 12983382 | 269689.6 | 45627.01 | 6690553 |
| best | 32782.17 | 319976.9 | 43595.67 | 678569 | 32904.1 | 33271.47 | 33021.41 | 33026.54 | 33051.55 | 2736525 | 228340.9 | 33253.65 | 3042549 | |
| worst | 32956.46 | 1941570 | 171262.9 | 4224324 | 51625.56 | 123795.5 | 287013.3 | 51781.2 | 51703.43 | 19358805 | 291640.4 | 51902.61 | 11460012 | |
| std | 76.94696 | 816676.8 | 70280.06 | 1822751 | 8897.118 | 42920.58 | 120525.5 | 8899.828 | 8868.206 | 7940200 | 30947.35 | 8853.229 | 4054593 | |
| median | 32897.86 | 431579.1 | 109194.6 | 803837.2 | 48417.99 | 48479.6 | 242877.1 | 48533.97 | 48523.12 | 14919100 | 279388.6 | 48675.9 | 6129825 | |
| rank | 1 | 10 | 7 | 11 | 2 | 6 | 8 | 4 | 3 | 13 | 9 | 5 | 12 | |
| C11-F16 | mean | 133550 | 817900.7 | 136863 | 1662172 | 138948.3 | 145227.4 | 142736.4 | 142437.6 | 145854.6 | 74771248 | 15765094 | 66926236 | 64261251 |
| best | 131374.2 | 264960.8 | 136069.7 | 420357.3 | 137599.1 | 143439.6 | 136665.8 | 134044.7 | 142569.7 | 72863394 | 8018850 | 55365044 | 51941418 | |
| worst | 136310.8 | 1901072 | 137623.9 | 4096895 | 142513 | 147081.2 | 147681.1 | 150317.3 | 150973.4 | 76922213 | 28504369 | 79970878 | 82187377 | |
| std | 2392.2 | 773155 | 895.5159 | 1737676 | 2504.36 | 1601.356 | 4827.072 | 7126.149 | 3777.487 | 1787965 | 9310709 | 11148097 | 13504451 | |
| median | 133257.5 | 552785 | 136879.1 | 1065717 | 137840.5 | 145194.4 | 143299.4 | 142694.1 | 144937.6 | 74649692 | 13268579 | 66184512 | 61458106 | |
| rank | 1 | 8 | 2 | 9 | 3 | 6 | 5 | 4 | 7 | 13 | 10 | 12 | 11 | |
| C11-F17 | mean | 1926615 | 8.18E+09 | 2.59E+09 | 1.37E+10 | 6.48E+08 | 1.72E+09 | 8.8E+09 | 6.49E+08 | 6.49E+08 | 1.94E+10 | 1.01E+10 | 1.82E+10 | 1.9E+10 |
| best | 1916953 | 7.28E+09 | 2.23E+09 | 1.02E+10 | 4.63E+08 | 1.35E+09 | 6.28E+09 | 4.64E+08 | 4.63E+08 | 1.89E+10 | 8.88E+09 | 1.6E+10 | 1.79E+10 | |
| worst | 1942685 | 8.82E+09 | 2.73E+09 | 1.64E+10 | 8.61E+08 | 2.09E+09 | 1.17E+10 | 8.61E+08 | 8.62E+08 | 2E+10 | 1.07E+10 | 2.07E+10 | 2.13E+10 | |
| std | 12003.53 | 7.26E+08 | 2.55E+08 | 2.79E+09 | 1.76E+08 | 3.26E+08 | 2.4E+09 | 1.76E+08 | 1.76E+08 | 5.05E+08 | 8.76E+08 | 2.17E+09 | 1.7E+09 | |
| median | 1923412 | 8.32E+09 | 2.71E+09 | 1.41E+10 | 6.35E+08 | 1.73E+09 | 8.61E+09 | 6.35E+08 | 6.36E+08 | 1.93E+10 | 1.04E+10 | 1.8E+10 | 1.85E+10 | |
| rank | 1 | 7 | 6 | 10 | 2 | 5 | 8 | 4 | 3 | 13 | 9 | 11 | 12 | |
| C11-F18 | mean | 942057.5 | 46968550 | 6246568 | 1E+08 | 1551619 | 2458384 | 8789489 | 1565381 | 1601545 | 26802059 | 10091478 | 1.14E+08 | 97052378 |
| best | 938416.2 | 32165899 | 3860025 | 69122918 | 1166395 | 2105030 | 3833110 | 1208053 | 1185497 | 21028845 | 7729212 | 95817548 | 93529199 | |
| worst | 944706.9 | 53337276 | 10680388 | 1.14E+08 | 2092481 | 2764259 | 15367297 | 2036921 | 2235896 | 29424540 | 13030136 | 1.26E+08 | 1E+08 | |
| std | 2774.139 | 10456522 | 3372738 | 22297257 | 413798.4 | 297588.8 | 5119786 | 368195.2 | 475034.6 | 4090135 | 2516208 | 14506058 | 3013638 | |
| median | 942553.5 | 51185512 | 5222930 | 1.09E+08 | 1473799 | 2482124 | 7978775 | 1508275 | 1492394 | 28377426 | 9803282 | 1.17E+08 | 97106275 | |
| rank | 1 | 10 | 6 | 12 | 2 | 5 | 7 | 3 | 4 | 9 | 8 | 13 | 11 | |
| C11-F19 | mean | 1025341 | 46337780 | 6425512 | 98329374 | 1785097 | 2899712 | 9420437 | 2070008 | 1974259 | 30755816 | 6098260 | 1.46E+08 | 97467953 |
| best | 967927.7 | 39329617 | 5431525 | 84714139 | 1177061 | 2367354 | 1993479 | 1210246 | 1380176 | 21455451 | 3147832 | 1.33E+08 | 94730931 | |
| worst | 1167142 | 59275780 | 8194119 | 1.24E+08 | 2340168 | 3422486 | 16978182 | 3061406 | 2544052 | 38744416 | 8333924 | 1.68E+08 | 1.01E+08 | |
| std | 99675.04 | 9379552 | 1288187 | 19079537 | 614570.1 | 483548.6 | 7410517 | 845585.3 | 632984 | 7705989 | 2276422 | 16187798 | 2637573 | |
| median | 983146.6 | 43372862 | 6038202 | 92318587 | 1811579 | 2904504 | 9355044 | 2004190 | 1986404 | 31411698 | 6455643 | 1.41E+08 | 97257575 | |
| rank | 1 | 10 | 7 | 12 | 2 | 5 | 8 | 4 | 3 | 9 | 6 | 13 | 11 | |
| C11-F20 | mean | 941250.4 | 48967515 | 5532949 | 1.06E+08 | 1385714 | 2114060 | 6700575 | 1396197 | 1417828 | 29648330 | 12578064 | 1.35E+08 | 97487351 |
| best | 936143.2 | 43137685 | 4951268 | 92693847 | 1359767 | 1937660 | 6319847 | 1377810 | 1385798 | 28996475 | 8553436 | 1.23E+08 | 92859483 | |
| worst | 946866.6 | 57917146 | 6133039 | 1.26E+08 | 1422491 | 2356836 | 7209610 | 1424318 | 1451737 | 30311072 | 19190127 | 1.46E+08 | 1.01E+08 | |
| std | 5013.552 | 6621981 | 512099.1 | 14830816 | 29465.74 | 198216.7 | 400304.6 | 23341.83 | 32784.24 | 576825.8 | 4891126 | 13500555 | 3641038 | |
| median | 940995.9 | 47407614 | 5523745 | 1.02E+08 | 1380299 | 2080873 | 6636421 | 1391330 | 1416889 | 29642886 | 11284346 | 1.35E+08 | 98019702 | |
| rank | 1 | 10 | 6 | 12 | 2 | 5 | 7 | 3 | 4 | 9 | 8 | 13 | 11 | |
| C11-F21 | mean | 12.71443 | 47.65386 | 23.5954 | 69.70586 | 18.79433 | 30.4773 | 38.01922 | 28.5535 | 24.21289 | 90.0843 | 39.62681 | 94.3193 | 91.6871 |
| best | 9.974206 | 40.21741 | 22.58455 | 53.28962 | 17.08664 | 27.83265 | 35.2891 | 25.60463 | 22.88643 | 45.69564 | 35.56843 | 81.89725 | 54.46949 | |
| worst | 14.97499 | 55.7929 | 25.17928 | 86.27352 | 20.76606 | 31.91199 | 41.59334 | 31.2056 | 26.23347 | 130.3305 | 41.73212 | 104.4449 | 110.8826 | |
| std | 2.412667 | 7.133006 | 1.166637 | 15.39462 | 1.711693 | 1.90116 | 3.027254 | 3.198601 | 1.538292 | 36.44639 | 3.002921 | 11.57281 | 27.60483 | |
| median | 12.95425 | 47.30257 | 23.30889 | 69.63015 | 18.66231 | 31.08228 | 37.59723 | 28.70189 | 23.86583 | 92.15553 | 40.60334 | 95.46753 | 100.6981 | |
| rank | 1 | 9 | 3 | 10 | 2 | 6 | 7 | 5 | 4 | 11 | 8 | 13 | 12 | |
| C11-F22 | mean | 16.12513 | 45.62653 | 29.33206 | 59.65088 | 22.29539 | 33.27953 | 45.2224 | 33.41087 | 27.26913 | 92.56565 | 45.52291 | 95.95859 | 84.12789 |
| best | 11.50133 | 40.43442 | 24.92922 | 44.92083 | 19.89289 | 29.90147 | 39.94322 | 26.60935 | 26.82319 | 61.62802 | 39.50369 | 81.4849 | 83.34725 | |
| worst | 19.55286 | 50.76417 | 34.23744 | 68.2016 | 24.26827 | 35.40932 | 49.68618 | 38.15783 | 27.77753 | 108.4826 | 52.56221 | 105.311 | 85.4577 | |
| std | 4.197797 | 4.567446 | 4.678654 | 10.69338 | 2.342326 | 2.483074 | 4.622637 | 5.34673 | 0.464144 | 22.23837 | 5.653775 | 11.1633 | 0.993915 | |
| median | 16.72317 | 45.65375 | 29.08079 | 62.74054 | 22.51019 | 33.90365 | 45.63009 | 34.43814 | 27.2379 | 100.076 | 45.01286 | 98.51922 | 83.8533 | |
| rank | 1 | 9 | 4 | 10 | 2 | 5 | 7 | 6 | 3 | 12 | 8 | 13 | 11 | |
| Sum rank | 22 | 192 | 110 | 232 | 55 | 147 | 146 | 119 | 98 | 222 | 158 | 199 | 224 | |
| Mean rank | 1 | 8.727273 | 5 | 10.54545 | 2.5 | 6.681818 | 6.636364 | 5.409091 | 4.454545 | 10.09091 | 7.181818 | 9.045455 | 10.18182 | |
| Total rank | 1 | 9 | 4 | 13 | 2 | 7 | 6 | 5 | 3 | 11 | 8 | 10 | 12 | |
| Wilcoxon: p-value | 2.00E-14 | 3.54E-17 | 7.12E-18 | 7.97E-06 | 2.23E-17 | 2.40E-17 | 7.29E-14 | 8.79E-15 | 1.52E-17 | 3.67E-17 | 7.12E-18 | 1.04E-17 | ||
Disclaimer/Publisher’s Note: The statements, opinions and data contained in all publications are solely those of the individual author(s) and contributor(s) and not of MDPI and/or the editor(s). MDPI and/or the editor(s) disclaim responsibility for any injury to people or property resulting from any ideas, methods, instructions or products referred to in the content. |
© 2024 by the authors. Licensee MDPI, Basel, Switzerland. This article is an open access article distributed under the terms and conditions of the Creative Commons Attribution (CC BY) license (http://creativecommons.org/licenses/by/4.0/).
Copyright: This open access article is published under a Creative Commons CC BY 4.0 license, which permit the free download, distribution, and reuse, provided that the author and preprint are cited in any reuse.


