
Submitted:
22 September 2024
Posted:
24 September 2024
You are already at the latest version
Abstract
In this study, we provided an empirical testability of the FF3FM against the co-moment-augmented FF3FM using the Newey–West GMM methods to account for potential endogeneity. The results showed that value risk is not significantly priced, and systematic skewness and systematic kurtosis play more important roles in explaining asset return than market and size factors. We discovered that there is much to gain in moving from the incumbent FF3FM to the co-moment-augmented FF3FM. By extending this study to Nigeria and using out-of-sample data that span across the recent COVID-19 period, the study has contributed to existing knowledge significantly. The study concludes that the co-moment-augmented FF3FM is superior to the incumbent FF3FM in pricing assets, and the anomalies associated with the return-size risk factor relationship are reduced by accounting for systematic skewness and systematic kurtosis in the FF3FM. Therefore, we recommend that investors should take a long position in size-hedged portfolios and hold systematic skewness and kurtosis as constant, and vice visa.
Keywords:
long position
; factor zoo
; risk premium
; test portfolios
; patterns
; hedged portfolios
1. Introduction
The notion that beta is sufficient to capture variations in return has been debated largely in many scholarly articles such as Ross (1976), Roll and Ross (1977), Chen et al. (1986), and Fama and French (1992). Recently, in a series of papers by Abdel and Al-Afeef (2017), Nyangara et al. (2016), and Wibowo and Darmanto (2020), beta systematic risk failed to explain much of the changes in expected return. This means that the noble argument1 issued by Fama and French (1992) still approximately holds to a large extent, which led to the so-called Fama–French Three-Factor Model, simply referred to FF3FM2. The authors engaged in explaining the proportions of average return that were unexplained by beta, and they discovered that size and value factors contributed more to return variations than the beta risk factor. Subsequently, Chowdhury (2017) and Ajayi et al. (2019) confirmed that expected return is significantly driven by size, but weakly influenced by value. The study by Li and Duan (2021) provided evidence in support of Chowdhury and established that the pricing factors in the FF3FM were strong determinants of return before the COVID pandemic; during the pandemic, they appeared to be stronger.
This position becomes contestable with the results yielded by Sobti (2016), confirming that there is no discernable value effect. In another study by Claesson (2021), it was established that the size effect is redundant, while Kostin et al. (2023) argued that there is no definite pattern for the size effect. This shows that the simplicity intuition and empirical philosophy of Fama and French (1993) indicate that the returns of small firms with small capitalization outperform the returns of firms with big capitalization, or that the view wherein value firms perform better than growth firms is no longer defendable in most stock markets. We have the view that the risk–return relationship anomaly, described by the low-volatility anomaly, is closely associated with the FF3FM. In the presence of dynamics and variations in prices induced by financial crises, credit clutches, and the virus pandemic, the pricing factors of the FF3FM are becoming largely insignificant in explaining cross-sectional variations in portfolios returns, as stated by (Abd-Alla and Sobh 2020) and Ajayi et al. (2021). The patterns of the FF3FM pricing factors are inconsistent and insufficient after the aftermath of the novel COVID-19 pandemic, as revealed in the study by Ragab et al. (2020). Thus, pricing assets with FF3FM has yielded “unwanted” anomalies, which suggests either that the FF3FM is discredited or that the market participants are irrational.
The pervasive variations in the returns of market portfolio remain a good reason for the fault of the FF3FM, since such variations induce additional risk factors that need to be accounted for in order to curtail the anomalies associated with the FF3FM factors. This has given birth to the co-moment-augmented FF3FM that includes systematic skewness and systematic kurtosis. The inclusion of these factors has reduced the pricing error and aligned a consistent pattern for size and value risks. Some appealing studies such as Roma et al. (2016) have pointed out that systematic skewness and systematic kurtosis capture some variances in the asset returns beyond the size, value, and momentum factors. Anghel et al. (2022) argued that systematic skewness risk is priced, and they seemed to have prettily explained variations in average return better than with size and value.
However, it appears that evidence on whether anomalies associated with size and value risk premium can be eliminated by controlling for high-order co-moment systematic factors is scarce in the literature with respect to African emerging stock markets. In view of this quandary, we aim to investigate if the co-skewness and co-kurtosis, which capture large variations in stock prices, suffice to increase the proportion of changes in cross-sectional returns exerted by size and value factors. To achieve this objective/goal, we motivated and expanded the methodology of Fama and French (1993) to include two undiversifiable risk factors, co-skewness and co-kurtosis risk factors, originally assumed by Kraus and Litzenberger (1976) to command significant premiums. Our innovation in this study is the augmented Fama–French Three-Factor Model with systematic skewness and systematic kurtosis as priced factors. This is a five-factor model with the potential to improve on the explanatory power of the FF3FM by reducing its pricing errors. Therefore, the question of whether the FF3FM fails due to high variations in the market or whether investors are rewarded for taking systematic skewness and kurtosis risks are addressed in this study. This question is tractable by explaining the merit of pricing assets in a unique form using the high-order moment preference FF3FM. The intercepts of this proposed model are apparently presupposed to be more insignificantly different from zero, so that the number of pricing portfolios with an anomaly tendency can be considerably reduced. The model was estimated for 2 × 3 × 3 sorting in left-hand-side portfolios and 2 × 3 sorting in right-hand-side portfolios.
Our test results with the traditional FF3FM reveal that few of the intercept coefficients were not statistically different from zero. This is consistent with the recent study by Gumanti et al. (2017). The market factor does not command a significant risk premium, which is in tandem with Fama and French (1993). The size factor has most of its coefficients as positive, but few are significant, while the coefficients associated with the value factor appear to be negative. Thus, we document that the anomalies of the FF3FM are mostly traceable to market and value factors. This is aptly due to the inability of the model to capture large variations in return and its lack of ability to explain the risk premium from a negatively skewed return. Considering these factors, we estimated the proposed skewness-preference five-factor model. The results show a better improved asset pricing model since the coefficients of the intercepts are insignificant, while the market and value anomalies are suppressed with an increase in the number of coefficients of these factors that are positively significant. Furthermore, we have evidence that investors are rewarded for taking risk exposures relating to co-skewness and co-kurtosis. This is supported by the findings of Chen et al. (2015). In this context, we conclude that the high-order co-moment expanded FF3FM using the triple sorting method of 2 × 3 × 3 empirically performs better than the incumbent FF3FM in the Nigerian stock market.
This study provides an additional contribution to the existing studies in two ways. First, very many studies on the FF3FM with high-order moments have concentrated on advanced markets. For example, the study by Karehnke (2022) was based on the US stock market, while in emerging markets, few studies such as Man (2017), Kashif et al. (2018), and Chaudhary et al. (2020) have been conducted and, until date, to best of our knowledge, the co-moment-augmented FF3FM has not been tested in Sub-Saharan African stock markets. Therefore, the extension of this study to the Nigerian stock market is a fresh contribution to the literature on asset pricing models. Secondly, our study is diverse from these studies because we use an out-of-sample size that is prone to large variations in returns due to the recent “dragon king” that bedevils the global financial markets and the sorting framework adopted to address the industry-specific changes in the Nigerian stock market.
The remainder of the paper proceeds as follows: Section 2 provides studies on relevant theories and an empirical review; Section 3 sets out the methodology and data collection procedure and discusses the superiority of the co-moment augment FF3FM to the traditional FF3FM; Section 4 presents results; and lastly, Section 5 offers the conclusion and recommendations.
2. Literature Review
The review of this study is divided into two important subsections. Firstly, we provide a review of closely related theories, and secondly, we give an empirical review of existing studies.
2.1. Theoretical Underpinning
This study is associated with three asset pricing theories: The Capital Asset Pricing Model (CAPM), the Fama–French Three-Factor Model (FF3FM), and the Skewness Preference Model. The rationale for choosing these theories is that they provide the premise for the high-order co-moment expanded FF3FM, which is the focus of this study.
2.1.1. The Capital Asset Pricing Model
Sharpe (1964) developed the well-celebrated CAPM as a single-factor model that shows the relationship between excess return and market risk premium. In the world of the CAPM, beta systematic risk is only risk factor that influences the average return of an asset or portfolio. Specifically, the CAPM is defined with a linear expression that relates the expected rate of return to the risk-free rate of return, the expected return of the market, and the sensitivity of the expected excess asset return to the expected excess market return. This model postulates that the company risk and the market risk are related by a variable called “Beta”. This relationship can be expressed using the following linear equation:
where is the expected return of security I, is the risk-free rate of return, is the beta of the security i, is the expected return on market, and is a market premium or market factor. The CAPM affirms that the expected return of a security or a portfolio equals the rate of return on a risk-free rate plus a risk premium. This model offers a simple tool for investors to evaluate their investments. If this expected return does not meet or beat the required return, then the investment should not be undertaken.
2.1.2. Fama and French Three-Factor Model
Fama and French (1992), in their research “Common Risk Factors in the Returns on Stocks and Bonds”, proposed a new Capital Asset Pricing Model with a size factor (SMB) and value factor (HML) referred to as the three-factor model. The three-factor model is an extension of the single-factor model (CAPM) and it is an appropriate substitute to the Arbitrage Pricing Theory (APT). They pointed out that the proportion of stock returns which were not explained by the CAPM’s beta factor could be captured by a firm’s specific characteristics such as size, earning/price, cash flow/price, book-to-market ratio, and other similar features. Therefore, the expected pricing error of asset j can be defined as
where is the expected return on asset j, is the risk-free rate, is the expected return on the market, is the sensitivity of asset j returns to market returns, is the expected return of the portfolio of assets with small-cap intersection with big cap, is the sensitivity of return of asset j to the return of SMB portfolio, is the expected return of the portfolio with a high B/M ratio intersection with a low B/M ratio, is the sensitivity of the asset returns to the return of the portfolio.
The FF3FM affirms that the expected return of a security or a portfolio equals the rate of return on a risk-free rate plus market risk premium, size risk premium, and value risk premium.
2.1.3. Skewness Preference-Augmented CAPM
The failure of beta to capture significant variations in asset returns was critically addressed in the study by Kraus and Litzenberger (1976), and even Fang and Lai (1997) made an immense contribution. These authors relaxed the assumption of assigning beta to be the only systematic risk that the market recommended premium for and then extended the cubic and quadratic market factors to extract systematic skewness and systematic kurtosis, respectively. Therefore, they stated that the market factors that influence variations in expected returns are covariance, co-skewness, and co-kurtosis. Their argument is based on the premise that the proportion of the variations in expected return that is not captured by beta systematic risk can be explained by systematic skewness and systematic kurtosis.
2.1.4. Multifractal Analysis in Asset Pricing Models
Fractal analysis is premised on the power law, which is a reflection of a nonlinear relationship. Specifically, such a relationship shows the dependency of a variable on the power of another. Thus, the power law is a scale invariant relationship that can be used to determine the fractality tendency of a time series variable. For instance, the process of a random variable, lets say with equal increments , is said to be fractal if it follows a scaling/power law defined as
where, according to Bacry et al. (2001) and Morales et al. (2013), is an indication of expectation and is the intercept. If is linear in p, the process has single scaling (H) and it is referred to as monofractal. In contradiction, if is nonlinear in p, the process is multifractal (Morales et al. 2013). Some sources in finance have termed the scaling function a generalized Hurst exponent that can be expressed as . If is nonlinear, it means that is nonlinear too and the process is multifractal.
This nonlinearity or multifractality can also be analyzed using frequency domain, which is based on different timescales. Multifractality reinforces the principle of heterogeneity or heterogeneous behavior in a typical financial market. Morales et al. (2013) claimed that multifractality provides precise but logical interpretation of the behavior of an economic agent over different timescales. Scaling behavior is a measure of heterogeneity that speaks volumes on the efficiency of the market. There are two classes of investors in the market: the information traders and noise traders/trend followers. The former are the fundamentalists who have a homogenous view and make identical decisions at all times, while the later follow a trading strategy that allows their decisions to vary at different timescales. The canonical CAPM and its subsequent versions are encapsulated by the attitude of homogeneity. Therefore, they fail to address the issue of heterogeneity and the scaling behavior of traders. This egregious shortcoming can be effectively tractable by applying multifractal analysis to asset pricing models. This analysis involves two broad stages. In stage one, the raw stock prices are decomposed to different timescales—low frequency, moderate frequency and high frequency—using the Maximum Overlapping Discrete Wavelet Transform (MODWT) method. In stage two, tests of the models are conducted in each of the frequency domains. This type of multifractal analysis accounts for the heterogeneous pricing of each of the factors in the “factor zoo” of the underlying asset pricing model. That means, for example, that we could have a size effect in a high-frequency domain, and such an effect can be absent in a low timescale. Thus, the merit of this analysis is that it provides a comprehensive framework for generalizing asset pricing models to incorporate the heterogeneous attitudes of investors in the stock market.
2.2. Empirical Review
Theory holds a fundamental reality of positive risk–return trade-off; yet, many empirical tests have not been fair. Besides the anomalies associated with the CAPM, the FF3FM and its expanded versions have failed in some many instances to provide a designable description of the cross-sectional variations in asset returns. However, there is evidence from few studies that considerable changes in portfolio returns are governed by the risk factors allotted to either the FF3M or its expanded multifactor counterparts.
Thus, several findings have taken inconclusive positions. Fama and French (1992) were the first to address empirical regularity, which the CAPM had failed to capture. The authors introduced the so-called FF3FM to capture two additional risk factors originally excluded from the CAPM. They documented that size and value can be combined to explain significant variations in returns of cross-section of portfolios sorted by the size-to-book-to-market ratio. By conclusion, they claimed that the FF3FM improved the explanatory ability of the CAPM.
Subsequent studies have proved to be successful; in most recent time, Su and Taltavull (2021) extended the empirical test of the FF3FM to the Spanish real estate investment market using the ARDL approach. Their findings suggest that there is a presence of a positive/significant size effect, while the value factor is paradoxically found to be negative. Despite this, the authors concluded that the FF3FM has a better description of asset return in the Spanish real estate market than the CAPM. Abbas et al. (2015) conducted an empirical test based on the FF3FM for Palestinian equity market. They estimated the slopes of small-size firms and big-size firms differently and confirmed that the slope of small-size firms is significantly higher than that of big-size firms. The authors maintained a position in support of Fama and French (1992) and claimed that the FF3FM does a better job of explaining cross-section variations in portfolio return than the CAPM. The study by Kashif et al. (2018) also employed data from the Palestinian equity market, and it was considered as an out-of-sample test. They provided estimation results using the GMM method to show that the size premium has a mandatory designable pattern. Thus, the authors could not trace any size anomaly in the Palestinian stock market. In strident contradiction, Abd-Alla and Sobh (2020) revalidated the empirical stance of the FF3FM in the Egyptian stock market using a limited sample size of just 50 stocks. The authors could not trace a designable pattern for size risk and value risk factors, and they adjudged the market of anomalies such that growth firms have higher return than value firms. Likewise, big capitalized firms have higher returns than small capitalized firms. The study by Karp and Vuuren (2017) was based on the South African stock market. The authors selected 46 companies continuously listed in the Johannesburg Stock Exchange (JSE) to test the superiority of the FF3FM to the CAPM. The authors could not defend the null hypothesis, since the value premium was found to capture larger variations in portfolio returns than the size premium. However, they claimed that both models outrightly perform poorly due to the fact that a typical emerging market is characterized by volatility, liquidity restrictions, unpriced risk factors, and inadequate measure for market proxy.
Since the FF3FM appears to be questionable in some markets, another strand of the literature focuses on the extension of the FF3FM with Carhart, investment, profitability, systematic co-skewness, and systematic co-kurtosis factors. Boamah (2015) considered improving the applicability of the FF3FM for the South African stock market by adding the Carhart or momentum factor to it. This is commonly referred to as the Fama–French–Carhart four-factor model. The test results confirm that the risk factors, market premium, size premium, value premium, and momentum premium are able to describe the returns on size-book-to-market-sorted portfolios, while the factors fail to explain the returns on momentum-sorted portfolios. However, the author concluded that the momentum-augmented FF3FM provides a superior description of cross-sectional asset returns to the canonical CAPM or the FF3FM. The basic criticism of the FF3FM is that it does not capture two important empirical regularities: profitability and investment. Titman et al. (2004) as well as Anderson and Garcia-Feijóo (2006) advocated for a sustainable inverse relationship between changes in investment and asset return. Along the same vein, Novy-Marx (2013) established a positive relationship between profitability and return. In this context, Fama and French (2015) introduced the five-factor model doubled Fama–French Five-Factor Model (FF5FM). The inclusion of investment risk premium and profitability risk premium to the FF3FM has yielded certain good results. Though Fama and French (2015) claimed that the value risk is redundant, subsequent studies such as Foye (2018) have provided strong evidence overwhelmingly supporting the validity of the FF5FM for a sample of emerging markets. The study was the first to test the FF5FM using a broad range of emerging markets, selected from 18 countries belonging to three different regions, Asia, Eastern Europe, and Latin America, respectively. The model seems to have performed very well, and it is found to be superior to the FF3FM in Eastern Europe and Latin America. However, in the Asian region, a designable pattern for profitability and investment is not found, suggesting the existence of anomalies from these factors and a failure of the FF5FM to provide a significant description of asset returns in this region. Hanauer and Lauterbach (2019) tested the FF5FM with an alternative definition of the underlying factors for a sample of 28 emerging markets. Unlike Foye, the markets were not split into regions and the study was based on a broader range of anomaly variables. First, the authors documented that the pervasiveness of the anomalies associated with cash flow-to-price, gross profitability, composite equity issuance, and momentum is shown in the cross-sectional regression as well as the time series regressions with respect to both equal- and value-weighted portfolio sorts. Second, they revealed that the alternative factor definitions are more robust to the factor definitions of the FF5FM. Furthermore, the cross-sectional regression test result does not support a positive trade-off between risk and return, and this is contradictory to theory. Finally, the authors claimed that in the out-of-sample prediction, return forecasts derived from the alternative factor definitions are superior to those obtained from the factor definitions of the FF5FM. Arkol and Azimli (2024) included policy uncertainty in the FF5FM, an extension that is classified as the policy-augmented FF5FM. The study was conducted to explain the impact of economic policy uncertainty on the cross-section of expected returns for a sample of emerging market stocks. The study established that after controlling for the factor zoo embedded in the FF5FM, economic policy uncertainty is found to be reductant, and the FF5FM does not statistically or economically perform better with the inclusion of the policy variable. Kostin et al. (2023) employed a sample of only oil-producing companies from both advanced and emerging markets during COVID-19. They compared the FF3FM to the FF5FM over this period using the GRS test. The test result rejects the null hypothesis, implying that the risk factors in both models are not sufficient to explain the variations in the returns of these company stocks.
Another class of studies are those that include co-skewness and co-kurtosis risk factors in the FF3FM. In this context, (Ajayi et al. 2019) and Karehnke (2022) estimated the four-factor model with systematic skewness using all the common stocks listed on the NYSE, AMEX, and NASDAQ. The author confirmed that there is presence of size and momentum effects, and that systematic skewness is an important determinant of cross-sectional portfolios’ expected returns. Likewise, the study acclaimed that the systematic skewness factor provides a possible justification for including size and momentum in the cross-sectional regressions and factor models.
Chaudhary et al. (2020) also attempted to augment the CAPM with conditional high-order co-moments for a sample of 69 quoted companies belonging to the Indian National Stock Exchange (NSE). Even though this study is susceptible to survivorship bias, it provides evidence that in the normal Indian economic phase, co-variance, co-skewness, and co-kurtosis are significantly priced, suggesting that the inclusion of co-skewness and co-kurtosis to the second-moment model provides balance in both the up and down markets. Thus, the authors concluded that in the construction of optimal portfolios, managers should consider systematic skewness and kurtosis along with other risks as important pricing factors. Man (2017) explored the impact of high moments on the stock returns of companies listed in the Ho Chi Minh Stock Exchange (HOSE) of Vietnam. The study focused on the relevance of high moments in explaining variations in portfolio returns using a limited sample size after excluding delisted companies, exchange switching companies, listed companies which are halted over a long period, or companies which cannot meet the required length of data. The author revealed that the anomaly can be traced to co-kurtosis, while a significant relationship exists between co-skewness and the returns of portfolios. Yanchuk and Khromets (2019) considered including high-order moments in the canonical CAPM to describe the cross-sectional variations in portfolios returns. The results showed that investors are rewarded with high returns for bearing high co-variance, co-skewness, and co-kurtosis risks, meaning that these factors influence the investors’ behavior and their expected returns. Finally, they confirmed that there exists empirical evidence that investors’ conduct changed significantly after the financial crisis of 2008, which signalizes the necessity of improving current asset pricing theory or matching together the asset pricing models. In the light of this, and particularly as a result of the non-normality distribution pattern and pulling of volatility exhibited by returns, we introduce the co-moment factors of Kraus and Litzenberger (1976) to the FF3FM and control for persistent foreign exchange volatility. This extension is referred to as the volatility-regulated high-order moment FF3FM or the FF3FM with high-order co-moments and foreign exchange volatility. The model is capable of explaining the impact of additional systematic risks on expected returns by holding volatility constant. The literature has revealed that tests of the CAMP and its augmented versions focused on advanced countries’ stock markets and Asian emerging markets, with very few studies conducted on African emerging markets, except possibly Egypt and South Africa. The Nigerian stock market, which is the biggest stock market in Africa, mostly with the features of risk–return anomalies and low-volatility anomalies, is almost completely left out. The investors in this market cannot explain the anomaly that is associated with expected return and their priced risk premiums. For this purpose, our study focuses on the Nigerian emerging stock market and hypothesizes that size and value factors have designable patterns after systematic skewness and kurtosis risk factors have been accounted for using the co-moment-augmented FF3FM. This hypothesis aligns with the research question of whether investors are rewarded with premiums for holding portfolios that are hedged with big cap or low B/M after controlling for systematic skewness and kurtosis.
3. Data and Model Specification
3.1. Data
The data employed in this study are the raw stock prices of 100 companies that are continuously listed in the Nigerian Stock Exchange (NSE). Our sample size spans from January 2013 to December 2022. The value-weighted adjusted stock returns of these companies are taken to be the return on the market, while the return on federal government bonds serves as the risk-free rate. The calculation of returns does not include dividend income because a substantial number of the companies do not pay dividends promptly. Dead stocks are excluded from our sample, and this means that we do not account for survivorship bias, which is mostly associated with emerging markets where data inconsistencies are strongly pronounced (Bekaert and Harvey 2000). Survivorship bias was remarked in the study by Elton et al. (1996), and this concern may be reduced by decreasing the sample size to an optimum size3. The study period started from January 2013 so that a reasonable number of companies could be added to the sample, and to reduce the potential survivorship bias with an optimum sample size. The price data are quoted in naira and sourced from www.investing.com. Accounting data relating to an outstanding number of shares, liability, and total assets were collected from the annual financial statement of each of the companies. Market capitalization is the product of an outstanding number of shares and price, book value is the difference between total assets and liability, and book-to-market ratio is the book value to market capitalization. These variables are used to break the stocks into small cap, big cap, high book value, medium book value, and low book value, respectively. Annualized skewness and kurtosis are calculated using the monthly stock returns based on these formulas.
where and are the skewness and kurtosis values, respectively.
Like the capitalization and B/M ratio are used to break the stocks into different categories, and are also used for the same purpose.
3.2. Test Portfolio Formation
The literature has revealed that there are two major methods for sorting left-hand-side (LHS) portfolios. We explored 25 5 × 5 double-sorted portfolios and 32 2 × 4 × 4 triple-sorted portfolios (see Fama and French 2015). In contradiction to this, we followed the approach of Arkol and Azimli (2024). Our sorting involved 18 2 × 3 × 3 triple-sorted portfolios. This approach is adequate for this study due to the incessant thin trading in the NSE and the resulting small sample size. Period (t) portfolios are formed using the accounting data, and and values of December of year t are used because accounting information is assumed to be incorporated by the market for the previous year (Fama and French 2015). Then, the expected returns of portfolios are distinctly calculated every year, and we rebalance the portfolios in the same manner. To sort based on size, we use the breakpoint of the region median capitalization value (i.e., 50th and 50th percentile breakpoint). In this case, the stocks/companies are arranged in ascending order; the first 50 percent of the companies are considered big, while the remaining 50 percent are small-cap companies. We applied the 30th and 70th percentile breakpoints for the B/M, skewness, and kurtosis. For the B/M-sorted portfolios, the first 30 percent of companies with the highest B/M ratio are called high-B/M companies, the 30 percent of low-B/M companies have the smallest B/M ratios, and the remaining 40 percent are called medium-B/M companies. For the skewness and kurtosis sorting, the companies were divided into three groups using 30th, 40th, and 30th percentiles. The first division comprises the 30 percent of stocks with the highest scores, the second division is the 40 percent of the companies with moderate scores, and the remaining 30 percent are the companies with the lowest scores. An illustration is shown in Table 1.
3.3. Factor Formation
Factor-mimicking portfolios are formed using a method akin to Fama and French (2015) and are analogously referred to as hedged portfolios. The identified hedged portfolios for this study are SMB (small-cap stock minus big-cap stock), (high skewness minus low skewness), and (high kurtosis minus low kurtosis). For combing investments in both small-cap and big-cap portfolios, investors can take a long position in small-cap stocks, which have higher returns, and a short position in big-cap stocks with smaller returns. No matter the amount of diversification by spreading investments across an SMB portfolio, investors cannot eliminate the inherent risk of small-cap stocks, and so they must receive a premium/reward. Therefore, for taking a long position in small-cap stocks, investors earn rewards provided that other factors such as B/M, systematic skewness, and systematic kurtosis are held constant. Likewise, spreading investments across highly/positively skewed and less/negatively skewed stocks, investors cannot avoid the risk associated with a negatively skewed market4, and they must be rewarded. Investments in high- and low-kurtosis stocks induce risks that cannot be eliminated by diversification. So, investors need to receive premiums for taking a long position in highly leptokurtic stocks by holding other risk factors constant. Right-hand-side (RHS) or hedging portfolios are usually constructed using 2 × 3 sorting. Therefore, the calculation of SMB, systematic skewness, and systematic kurtosis risk factors is presented in Table 2.
3.4. Model Specification
The baseline model for this study is the high-order moment-augmented FF3 model that regressed the market, size, value, systematic skewness, and kurtosis risk factors on the ith portfolios’ excess returns.
The spirit behind this specification is to verify whether patterns in average return can be explained by this FF3 augmented model. Thus,
In this equation, denotes the index return on 18 LHS portfolios at time t6, is the market risk factor at time t, is the size risk factor at time t, is the value risk factor at time t, is the systematic skewness risk factor at time t, and is the systematic kurtosis risk factor at time t; is the ith constant coefficient, are the ith loadings/premiums for market, size, value, systematic skewness, and systematic kurtosis risk factors. For the market to reward investors, all or most of these coefficients must be positive and significant; the constant coefficient does not need to be significant. We may have size anomalies or value anomalies if most of the coefficients associated with the size factor () or value factors () are negative and insignificant. The same thing is applicable to systematic skewness () and systematic kurtosis (). The implication of these coefficients being positive is that the portfolios are on the efficient frontiers; therefore, investors are mean variance maximizers7. If the coefficients do not follow consistent patterns, it will not be possible to explain the average portfolio return using asset pricing models, referred to as an anomaly. Generally, before testing any asset pricing model with the origin of the FF3 model, Fama and MacBeth (1973) cross-sectional regression has to be first run to test the predictability of the risk factors on average return. The Fama–MacBeth equation is defined as follows:
In the equation, is the single sorting average return across units/companies, are the factor loadings or risk premiums across units, and associated cross-sectional regression coefficients are assumed to be positive and significant, as claimed by the CAPM slope hypothesis.
3.5. FF3FM vs. Co-Moment-Augmented FF3FM
The superiority of the FF3FM was compared to the co-moment augmentation version using two criteria: the GRS-F-statistic (Gibbons et al. 1989) and the Sharpe ratio (SR). According to Merton (1973), he asserted that a good asset pricing model is one with an insignificant constant. This was confirmed by using the GRS test to determine the F-statistic, as stated below:
where T denotes number of observations, N stands for number of portfolios, L signifies the number of independent variables, ‘a’ represents the vector of the constants of the portfolio regressions, ∑ means the covariance matrix of the residuals of the portfolio regressions, ʋ denotes the vector of the mean of the explanatory variables, and Ω represents the covariance matrix of the explanatory variables. The GRS test has an F-statistic distribution with a degree of freedom of T-N-L, and a null hypothesis that all the regression constants are not different from zero.
where ‘a’ is the vector of the constants of the portfolio regressions and S denotes the covariance matrix of the residuals of the portfolio regressions. The smaller the SR, the better the asset pricing model. Some other parameters used to determine which model is better are adjusted R2, average standard error, and mean absolute value of the constants.
4. Results and Discussion
The first important aspect of this study is to provide descriptive analyses of the systematic risk factors, and market, size, value, co-skewness, and co-kurtosis are included here. We use the most familiar parameters for these analyses, and the results are reported in Table 3.
It is observed that during the period 2013 to 2022, approximately 120 months, the average monthly return of the market portfolio was 1%, skewness-hedged portfolio was 1%, and kurtosis-hedged portfolio was 2%. This is an indication that the co-moment and market factors compensate investors with premiums. It is advantageous for investors to invest in risky assets during this period rather than treasury bill or other risk-free assets. Differently, the average return of size (SMB)-hedged portfolios is −1% per month. This implies that companies with large market capitalization perform better than companies with small capitalization. On the contrary, the value-hedged portfolio yields an average return of 1% per month for the period, suggesting that the value companies (companies with a high B/M ratio) outperform the growth companies (companies with a low B/M ratio). The B/M portfolio has a higher return than the SBM portfolio, but the kurtosis-hedged portfolio has a better return than them. However, all the portfolios have negative minimum values. The return of the market portfolio appears to be more volatile than the returns of the SMB and HML portfolios. All the returns of these portfolios are skewed, highly leptokurtic, and anti-Gaussian, suggesting that they do not follow a normal distribution. Since these are our right-hand variables and our sample size is relatively large, anti-Gaussianity does not pose any threat to a meaningful regression analysis. This can only be a violation to CLRM assumption associated with the prediction error.
The descriptive results are substantiated with correction analysis, with a view to check for potential collinearity among these pricing factors. The distribution patterns of these portfolio returns are shown in Figure 1.
In Figure 1, we present the trajectories of the five portfolio returns over the sample period. The returns on the size and value portfolios seem to be relatively stable over the period from Jan 2013 to Dec 2022. The returns of the market are found to be negative or zero in some of the months, meaning that investors have the opportunity to diversify from the market portfolio to more stable portfolios that guarantee positive returns.
We reported the outputs of the correlation matrix in Table 4. The systematic skewness and systematic kurtosis (high-order co-moments) factors are positively associated with the market factor. Specifically, the systematic skewness is strongly correlated, and the size and value factors are inversely correlated with the market factor. The co-skewness factor and, consequently, also the co-moment factors are negatively correlated with the value factor. The size and value factors are positively/strongly related, while systematic kurtosis is negatively correlated with the value factor but positively related with the size and systematic skewness factors. In general, there is a pretty weak correlation between each peer of the pricing factors, except for the value and size factors. These correlation results were corroborated by a factor spanning test. However, the potential endogeneity issue is tractable using the Newey–West GMM.
We constructed 18 portfolios, generally classified as the left-hand-side (LHS) variables, by dividing the stocks into two groups based on their capitalizations, and another separate three groups based on their B/M ratios, skewness, kurtosis; then, we sorted the 18 interactions, referred to as the 18 LHS portfolios. The monthly average excess return of each of the portfolios is presented in Table 5. From the B/M columns, the pattern of returns is seen to be inconsistent across the portfolios. This implies that there is no definite pattern for the size effects. In the size row, the pattern of returns is also inconsistent, and there is no definite pattern for the value effect.
We tried to investigate the trending tendency of the data sets for the returns of both left-hand-side and right-hand-side portfolios by employing the ADF technique. The summary results are found in Table 6.
We have evidence that the critical value at 1 percent is far less than the observed ADF statistic in respect to any of the portfolio returns, either on the left-hand side or the right-hand side. Therefore, all our variables of interest are stationary at raw. This simply means that our data set significantly supports a level or static relationship, which is in tandem with the underlying asset pricing models stated for this study. This is shown in Table 7
The constant coefficient () is approximately 0% and insignificant, suggesting that the risk premiums are sufficient to explain significant variation in the average portfolio returns. The systematic skewness risk premium () and systematic kurtosis risk premium () play a significant role in predicting asset return, similar to the market risk premium () and value risk premium (). However, there is no significant size risk premium (). Therefore, based on the Fama–MacBeth cross-sectional pricing identification, there is no size effect in the Nigerian stock market. A possible size anomaly is present. This is confirmed by the Fama–French time series regression results displayed in Table 9. Prior to this, we conducted a factor spanning test, as shown in Table 8.
The test provides evidence that a significant relationship exists between size and the other factors, while there are no significant interactions among the other three factors. By implication, this means that the size factor is reductant. This contradicts Fama and French’s (2015) five-factor asset pricing model, in which the value factor was pronounced as reductant.
In line with the global financial dragon king theory and the recent COVID-19 pandemic simultaneously distorting the trajectory of stock prices in many stock markets, Nigeria inclusive, we propose to test the validity of the FF3F model and confirm whether there is a presence of anomalies in the direction of the relationship between risk and return; we also explore if the market, size, and value systematic factors suffice to explain cross-sectional variations in return by holding systematic skewness and kurtosis factors constant. The estimated linear regression equation outputs for these tests are summarized in Table 9.
The table shows that three intercept parameters were statistically and significantly different from zero. This is akin to the study of Gumanti et al. (2017)9, where 18 intercepts were significant, and Merton (1973), where most of the intercepts of the 25 regression equations appeared to be significant. Since the intercept term plays a significant role, it means that the market, size, and value factors do not suffice to explain all the variations in portfolio returns. All the coefficients of the market factor are positive and significant. This sharply contradicts Fama and French (1993), in tandem with Gumanti et al. (2017), where most of the market factor coefficients were positive and they established that the market factor has a positive impact on cross-sectional average return. It appears that a definite pattern can be observed from the market factor; this means we have enough evidence to assert that the market factor captures sufficient variations in returns. This finding is consistent with Halliwell et al. (1999).
The size factor has four coefficients that are positive, and only two negative coefficients, implying that the size factor has a positive impact on portfolio return. Only three of these coefficients are significant. Thus, there is not enough evidence to claim that there is a presence of size effects. There are three coefficients of the value factor that are negative. This suggests that the value systematic risk factor is negatively related to return. This finding dovetails with the syndrome called low-volatility anomaly. We confirm that the market factor only explains 6/6, size 2/6, and value marginally explains 1/6 of the variations in the returns of the 6 portfolios10; therefore, the FF3FM has potentially failed to provide a resounding explanation of the variations in portfolio return in the Nigerian stock market. We anticipate that these anomalies emanating from the patterns or inconsistency in the size and value factors in explaining variations in returns can be traced from the exclusion of the co-moments. In view of this, we attempt to reintroduce and estimate the high-order co-moment-augmented FF3FM. The regression outputs of this model are summarized in Table 10.
From the table, up to 14 coefficients of the intercepts are insignificant. This suggests that the co-moment-augmented FF3FM with five explanatory variables, which include market, size, value, systematic skewness, and systematic kurtosis factors, provides a better explanation of the variations in expected portfolio excess returns than the incumbent FF3FM. Specifically, in explaining what is missing moving from the FF3FM to the co-moment FF3FM, and to address the anomaly of the FF3FM; we notice that the market risk factor still has all its coefficients as positive and is more strongly significant. This means that the market systematic factor remains significant after controlling for co-moments. Therefore, market co-variance risk now plays a more important role in predicting expected portfolio returns and, as such, investors receive premiums for all the 18 portfolios for their exposure with co-variance non-diversifiable risk. There are many changes with respect to the size factor because the number of negative coefficients reduces to one, and out of the 18 coefficients, 11 are significant. The number of negative coefficients for the value factor has increased drastically. However, most of the coefficients are still positive after controlling for systematic skewness and systematic kurtosis, respectively. Furthermore, we found that the coefficients of the systematic skewness risk are positive (except very few) and significant at 1%, 5%, and 10% alpha values, respectively. This is in consonant with the claim of Kraus and Litzenberger (1976), and Harvey and Siddique (2000), that investors prefer positive/high skewness to negative/low skewness. Negative skewness is an indication that two assets simultaneously have lower returns than the return of the market portfolio, while positive skewness is an indication that two assets simultaneously have higher returns than the return of the market portfolio. Positive skewness increases the risk of a portfolio and, consequently, heightens the expected return or risk premium. Thus, we have evidence that investors are compensated for taking systematic skewness risk. The coefficients of co-kurtosis are positive and significant at 1%, 5%, and 10% alpha values, respectively. Positive/high co-kurtosis implies that investors receive premiums for holding assets with large uncertainty or volatility. This evidence is established in this study and is in tandem with the findings of Chen et al. (2015). In this context, our findings confirm that market and size factors have the prescribed pattern and significantly explain cross-sectional variations in returns, meaning that investors holding these portfolios receive significant premiums. The value risk factor follows the prescribed pattern, but most of the coefficients are not important. We have evidence that there is no observed low-volatility anomaly associated with the risk–return relationship. Thus, the significantly priced risk factors with the right sign are the market, size, systematic kurtosis, and skewness. These four factors are more important than the value factors in pricing assets in the Nigerian stock market. These results contradict the results yielded by Fama and MacBeth’s cross-sectional regression, where the size risk premium has a negative sign.
4.1. Model Performance Tests
The results presented in Table 11 show that the FF3FM has an average adjusted R-square of 96.7%, while the average adjusted R-square of the FF3FM with systematic skewness and systematic kurtosis is 96.8%. This means that the co-moment-augmented FF3FM captures additional variations in expected returns that are missing in the traditional or incumbent FF3FM (see, Gumanti et al. 2017). The average absolute intercepts for the FF3FM appear to be larger than that of the FF3FM with system skewness and systematic kurtosis. This still supports the position that the co-moment-augmented FF3FM has better explanatory factors that the FF3FM. The GRS statistic is significant at 1 percent for the co-moment-augmented FF3FM and insignificant for the FF3FM. In addition, the Sharpe ratio is higher for the augmented version, and only the standard errors of the two models are the same. There are indications that the co-moment-augmented FF3FM is superior to the FF3FM using the average adjusted R-squared and the average absolute value of the intercept. The anomalies of size become passive in the Nigerian stock market after accounting for systematic skewness and systematic kurtosis.
4.2. Discussion of Findings
This study reveals the potential strength and superiority of the high-order moment FF3FM in comparison to the canonical FF3FM. In the FF3FM, larger variations in expected returns are not captured by the risk factors, while evidence shows that the factor zoo in the co-moment-augmented FF3M provides a better explanation of expected returns. Specifically, covariance risk appears to be more significant across portfolios with the inclusion of high-moment factors in the FF3FM. Similarly, the size premium becomes more definite and designable when we control for systematic skewness and kurtosis, meaning that the size anomaly that was noticed with the test result of the FF3FM slowly disappears to a large extent.
The two models unanimously agree that there is no size anomaly; by implication, investors receive premiums/rewards for investing in risky small-cap stocks. However, the systematic skewness anomaly is also not found to be pervasive throughout the sorted portfolios, while the value anomaly is highly pronounced in our study.
Studies such as those by Harvey et al. (2016) and Bali et al. (2017) have explored extensions of the FF3FM, incorporating higher-order moments to address its limitations. The findings of these studies align with their assertion that a richer model incorporating these moments can better capture variations in covariance risk. Pástor and Stambaugh (2003) introduced liquidity as an additional factor, which indirectly implies that higher-order moments could play a role in explaining asset returns. Ang and Bekaert’s research (Ang and Bekaert 2004) on conditional risk and covariance suggests that traditional models may overlook complex risk factors, including those related to higher-order moments. This aligns with their assertion that a richer model incorporating these moments can better capture variations in covariance risk. The studies of Novy-Marx (2012) support the idea that including higher-order moments might reduce the size anomaly observed with simpler models. Hou et al. (2015) propose an alternative model that incorporates profitability and investment factors and that still recognizes the persistence of the value anomaly. Our results complement their findings, suggesting that while value anomalies remain pronounced, additional risk factors might further elucidate their persistence.
5. Conclusions and Recommendation
The fulcrum of this study is to confirm whether risk–return or asset pricing anomalies are traceable to the FF3FM pricing factors, and if there were associated anomalies, would co-skewness and co-kurtosis be capable of explaining the variations in return not captured by these factors. In view of this, our study concludes that value risk is not significantly priced and is the major source of anomalies in the FF3FM. Investors are not compensated for bearing value risk by investing more in stocks with a high B/M ratio rather than stocks with a low B/M ratio. This anomaly of not receiving premiums for investing in high-B/M stocks was reduced after accounting for co-skewness and co-kurtosis. Thus, we conclude that co-moment systematic risk factors are more important in pricing assets than value risk in the Nigerian stock market. However, systematic covariance and size factors are significantly priced, and investors receive high expected returns for bearing these risks. Gumanti et al. (2017) also established that investors are compensated for taking market and size risks. Finally, we conclude that the co-moment-augmented FF3FM is superior to the incumbent FF3FM in Nigeria. Therefore, we recommend that investors should not invest on the basis of a large B/M ratio; rather, size should be more important to them. In diversification, investors should think of holding assets with small capitalization and low book value. In dealing with value anomalies, investors should include co-moments in their pricing model, especially in frontier markets where returns are negatively skewed.
6. Limitations and Future Research
This study is country-specific, with a sample size of one hundred stocks continuously traded throughout the investigation; no consideration was given to the dead stocks. Therefore, this study is limited in scope and is susceptible to survivorship bias. The originality of our pricing identification suggests that certain risk premiums were not captured and explained, leaving a gap for further research. Addressing this quandary, the proposed high-order moment FF3FM should be augmented with investment and profitability risk premiums. We also suggest that further studies on comparative analysis between different African countries or industries in the Nigeria Exchange Group could also be considered.
Author Contributions
Conceptualization, A.S.A. and A.A.; methodology, A.A.; software, A.A.; validation, A.S.A., J.E.O. and A.A.; formal analysis, A.A.; investigation, A.F.; resources, J.E.O.; data curation, A.F.; writing—original draft preparation, A.A.; writing—review and editing, A.S.A.; visualization, A.F.; supervision, A.S.A.; and A.A., project administration, A.F. All authors have read and agreed to the published version of the manuscript.
Funding
This research received no external funding.
Institutional Review Board Statement
Not applicable.
Informed Consent Statement
Not applicable.
Data Availability Statement
In this study, we collected data through www.investing.com on the raw stock prices of 100 companies continuously listed in the Nigerian Stock Exchange, bond prices, and all share index over the period from January 2013 to December 2022.
Conflicts of Interest
The authors declare no conflict of interest.
| 2 | Beta alone is not enough to explain cross-sectional variations in average return. Therefore, factors such as size and value play important roles in predicting average returns. |
| 3 | Fama–French Three-Factor Model. |
| 4 | The optimum sample size is a sample size with a reasonable number of years and a limited number of dead stocks. |
| 5 | It assumed that when a stock is positively skewed, it is skewed toward high return; conversely, the market is negatively skewed with corresponding high risk, which diversification cannot eliminate or reduce. |
| 6 | |
| 7 | This means 18 regressions are run against the risk factors to give 18 constant coefficients, 18 market risk factor premiums, 18 size risk factor premiums, 18 value risk factor premiums, 18 systematic skewness risk factor premiums, and 18 systematic kurtosis risk factor premiums. |
| 8 | Return is maximized for any level of risk, or risk is minimized for any level of return. |
| 9 | However, the sorting is now single sorting for the test portfolios. This means the returns are no longer index portfolio returns but rather returns of a single asset. |
| 10 | Though their sorting is 5 × 5. |
| 11 | Note that in the counting of significant coefficients, we ignore negative ones. |
References
- Abbas, Nahzat, Jahanzeb Khan, Rabia Aziz, and Zain Sumrani. 2015. A study to check the applicability of Fama and French, Three-Factor Model on KSE 100-Index from 2004–2014. International Journal of Financial Research 6: 90–100. [CrossRef]
- Abd-Alla, Mustafa Hussein, and Mahmoud. Sobh. 2020. Empirical Test of Fama and French three-factor model in the Egyptian stock exchange. Financial Assets and Investing 11: 5–18. [CrossRef]
- Mohammad AbdelMohsen Al-Afeef. 2017. Capital asset pricing model, theory and practice: Evidence from USA. International Journal of Business and Management 12: 182–92.
- Ajayi Samuel Abiodun, Oloyede John Adebayo, Omankhanlen Alexander. Ehimare., Ajibola Arewa., Adeyeye Patrick Olufemi., & Iseolorunkanmi Joseph Ojo., 2019. An Examination of the Existence of Momentum Profit in the Nigerian Market using the Modified Cahart Four-Factor Model WSEAS. Transactions on Business and Economics 16(47): 424–432.
- Ajayi, Samuel. Abiodun., Omankhanlen Alexander. Ehimare., Ajibola, Arewa. Adeyeye, Patrick. Olufemi., Falaye Adebanjo. & Iseolorunkanmi Josrph. Ojo., (2019). Explanatory Power of CAPM and Multi-Factor Models in the Nigerian Capital Market, Proceedings of the 33nd International Business Information Management Association Conference. 9843-9856 ISBN: 978-0-9998551-.
- Ajayi, Samuel. Abiodun., Omankhanlen Alexander Ehimare, Patrick Olufemi Adeyeye, and Adebanjo Falaye. 2021. Evidence of Momentum and Non-Factor Profits in the Nigerian Equity Market. Journal of Quantitative Finance and Economics 3: 21–35.
- Anderson Christopher. and. Garcia-Feijóo Luis. 2006. Empirical Evidence on Capital Investment, Growth Options, and Security Returns. Journal of Finance. 61(1); 171–194. [CrossRef]
- Andrew Ang and Geert Bekaert. 2004. How regimes affect asset allocation. Financial Analysts Journal 60: 86–99.
- Anghel, Dan Gabriel., Petre. Caraiani, Alina. Rosu, and Ioanid. Rosu. 2022. Asset Pricing with Systematic Skewness: Two Decades Later HEC Paris Research Paper No. FIN-2021-1432. Available online: https://ssrn.com/abstract=3872128.
- Arkol, Orbay, and Asil. Azimli. 2024. Pricing the Common Stocks in Emerging Markets: The Role of Economic Policy Uncertainty. Modern Finance 2: 31–50. [CrossRef]
- Bacry, Emmanuel., Jean. Delour, and Jean-François Muzy. 2001. Multifractal Random Walk. Physical Review E 64: 026103. [CrossRef]
- Bali, Turan. G., Stephen. J. Brown, and Yi. Tang. 2017. Is economic uncertainty priced in the cross-section of stock returns?. Journal of Financial Economics 126: 471–89. [CrossRef]
- Bekaert, Geert., and Campbell. Harvey. 2000. Foreign speculators and Emerging Equity Markets. The Journal of Finance 55: 565–613. [CrossRef]
- Boamah, Nicholas Addai. 2015. Robustness of the Carhart four-factor and the Fama-French three-factor models on the South African stock market. Review of Accounting and Finance 14: 413–30. [CrossRef]
- Chaudhary, Rashmi, Dheeraj Misra, and Priti Bakhshi. 2020. Conditional relation between return and co-moments: An empirical study for emerging Indian stock market. Investment Management and Financial Innovations 17: 308–19. [CrossRef]
- Chen, Nai-Fu., Richard. Roll, and Stephen. A. Ross. 1986. Economic forces and the stock market. Journal of Business 59: 383–403. [CrossRef]
- Chen, Ming-Chi., Hsiu-Jung. Tsai, Tien Foo. Sing, and Chih-Yuan. Yang. 2015. Contagion and downside risk in the REIT market during the subprime mortgage crisis. International Journal of Strategic Property Management 19, 42–57. [CrossRef]
- Chowdhury, Emon Kalyan. 2017. Functioning of Fama-French three-factor model in emerging stock markets: An empirical study on chittagong stock exchange, Bangladesh. Journal of Financial Risk Management 6: 352. [CrossRef]
- Claesson, Henrik. 2021. The Fama-French Asset Pricing Models: Emerging Markets. Unpublished Master’s thesis, Uppsala University, Uppsala, Sweden.
- Elton, Edwin. J., Martin. J. Gruber, and Christopher. Blake. 1996. Survivorship bias and mutual fund performance. The Review of Financial Studies 9: 1097–120. [CrossRef]
- Engle, Robert., and Turan. Bali. 2010. Resurrecting the Conditional CAPM with Dynamic Conditional Correlations. Working Paper. New York: New York University.
- Fama, Eugene F., and Kenneth R. French. 1992. The cross-section of expected stock returns. The Journal of Finance 47: 427–65.
- Fama, Eugene F., and Kenneth R. French. 1993. Common risk factors in the returns on stocks and bonds. Journal of Financial Economics 33: 3–56. [CrossRef]
- Fama, Eugene., and Kenneth. French. 2015. A five factor asset pricing model. Journal of Financial Economics 116: 1–22. [CrossRef]
- Fama, E. F., and J. D. MacBeth. 1973. Risk, return, and equilibrium: Empirical tests. Journal of Political Economy 81: 607–36. [CrossRef]
- Fang, Hsing., and Tsong-Yue. Lai. 1997. Co-kurtosis and capital asset pricing. The Financial Review 32: 293–307. [CrossRef]
- Foye, James. 2018. A comprehensive test of the Fama-French five-factor model in emerging markets. Emerging Markets Review 37: 199–222. [CrossRef]
- Gibbons, Michael R., Stephen A. Ross, and Jay Shanken. 1989. A test of the efficiency of a given portfolio. Econometrica 57: 1121–52. [CrossRef]
- Gumanti, T.A., B. Sutrisno, A. Andreas, and D. Bernardus. 2017. Empirical Study of Fama-French Three-Factor Model and Carhart Four-Factor Model in Indonesia. Available online: https://ssrn.com/abstract=3314684 17 Jan 2019 (accessed on).
- Halliwell, J., J. Heaney, and J. Sawicki. 1999. Size and book to market effects in Australian share markets: A time series analysis. Accounting Research Journal 12: 122–37.
- Hanauer, Matthias.X., and Jochim.B. Lauterbach. 2019. The cross-section of emerging market stock returns. Emerging Markets Review 38: 265–86. [CrossRef]
- Harvey, Campbell.R., and Akhtar. Siddique. 2000. Conditional skewness in asset pricing tests. Journal of Finance, American Finance Association 55: 1263–95. [CrossRef]
- Campbell R. Harvey, Yan Liu, Heqing Zhu, … and the Cross-Section of Expected Returns, The Review of Financial Studies, Volume 29, Issue 1, January 2016, Pages 5–68. [CrossRef]
- Hou, Kewei., Chen. Xue, and Lu. Zhang. 2015. Digesting anomalies: An investment approach. The Review of Financial Studies 28: 650–705. [CrossRef]
- Karehnke, Paul. 2022. Systematic Skewness and Stock Returns. Available online: https://ssm.com/abstract=3720746 October 28, 2020 (accessed on).
- Karp, Adam., and Gary van. Vuuren. 2017. The Capital Asset Pricing Model and Fama-French Three Factor Model in an Emerging Market Environment. International Business & Economics Research Journal 16: 231–56.
- ashif, Muhammad, Aleena Ilyas, Raja Rehan, and Imran Umer Chhapra. 2018. Asset pricing and the size effect: Empirical evidence from Karachi stock exchange. Academy of Accounting and Financial Studies Journal 22: 1–18.
- Kostin, Konstantin.B., Philippe. Runge, and Leyla.E. Mamedova. 2023. Validity of the Fama-French three- and five-factor models in crisis settings at the example of select energy-sector companies during the COVID-19 pandemic. Mathematics 11: 49. [CrossRef]
- Kraus, Alan., and Robert.H. Litzenberger. 1976. Skewness preference and the valuation of risk assets. The Journal of Finance 31: 1085–94.
- Li, Kanlong., and Yanjun. Duan. 2021. Research on the application of Fama and French three-factor and five-factor models in American industry. Journal of Physics: Conference Series 1865: 042105. [CrossRef]
- Man, Nguyen Doan. 2017. The impact of higher moments on the stock returns of listed companies in Vietnam. Banking Technology Review 2: 221–38.
- Morales, Raffaello., T. Di Matteo, and Tomaso. Aste. 2013. Non-stationary multifractality in stock returns. Physica A: Statistical Mechanics and Its Applications 392: 6470–83. [CrossRef]
- Newey, Whitney. K., and Kenneth. D. West. 1987. A simple, positive semi-definite, heteroscedasticity and autocorrelation consistent covariance matrix. Econometrica 55: 703–8. [CrossRef]
- Novy-Marx, Robert. 2012. Is Momentum Really Momentum? Journal of Financial Economics 103: 429–53. [CrossRef]
- Novy-Marx Robert.. 2013. The other side of value: The gross profitability premium, Journal of Financial Economics, 108(1): 1–28, 2013.
- Nyangara, Melody., Davis. Nyangara, Godfrey. Ndlovu, and Takawira. Tyavambiza. 2016. An empirical test of the validity of the capital asset pricing model on the Zimbabwe stock exchange. International Journal of Economics and Financial Issues 6: 365–79.
- Pástor, Lubos., and Robert. Stambaugh. 2003. Liquidity risk and expected stock returns. Journal of Political Economy 111: 642–85. [CrossRef]
- Ragab, Nada.S., Rabab.K. Abdou, and Ahmed.M. Sakr. 2020. A comparative study between the Fama and French three-factor model and the Fama and French five-factor model: Evidence from the Egyptian stock market. International Journal of Economics and Finance 12: 53–69. [CrossRef]
- Roll, Richard., and Stephen A. Ross. 1977. Comments on qualitative results for investment proportions. Journal of Financial Economics 5: 265–68. [CrossRef]
- Ross, Stephen. 1976. The arbitrage theory of capital asset pricing. Journal of Economic Theory 13: 341–60. [CrossRef]
- Sharpe, William. F. 1964. Capital asset prices: A theory of market equilibrium under conditions of risk. Journal of Finance 19: 425–42. [CrossRef]
- Sobti, Neharika. 2016. Revisiting CAPM and Fama French three factor model in Indian equity market. Business Analyst 37: 31–46.
- Su, Zhenyu., and Paloma. Taltavull. 2021. Applying the Fama and French three-factor model to analyze risk/reward in the Spanish REITs: An ARDL approach. Journal of European Real Estate Research 14: 189–208. [CrossRef]
- Wibowo, Agung., and Susetyo. Darmanto. 2020. Empirical test of the capital asset pricing model (CAPM): Evidence from Indonesia capital market. SSRG International Journal of Economics and Management Studies 7: 172–77.
- Yanchuk, Valeriia., and Anastasiia. Khromets. 2019. The effects of skewness and kurtosis on excess return based on CAPM. Journal of Financial Economics 60: 95–110.
- Titman S, Wei KCJ, Xie F. 2004, Capital Investments and Stock Returns. Journal of Financial and Quantitative Analysis.;39(4):677-700. [CrossRef]
Figure 1.
Distribution patterns of the five portfolio returns.
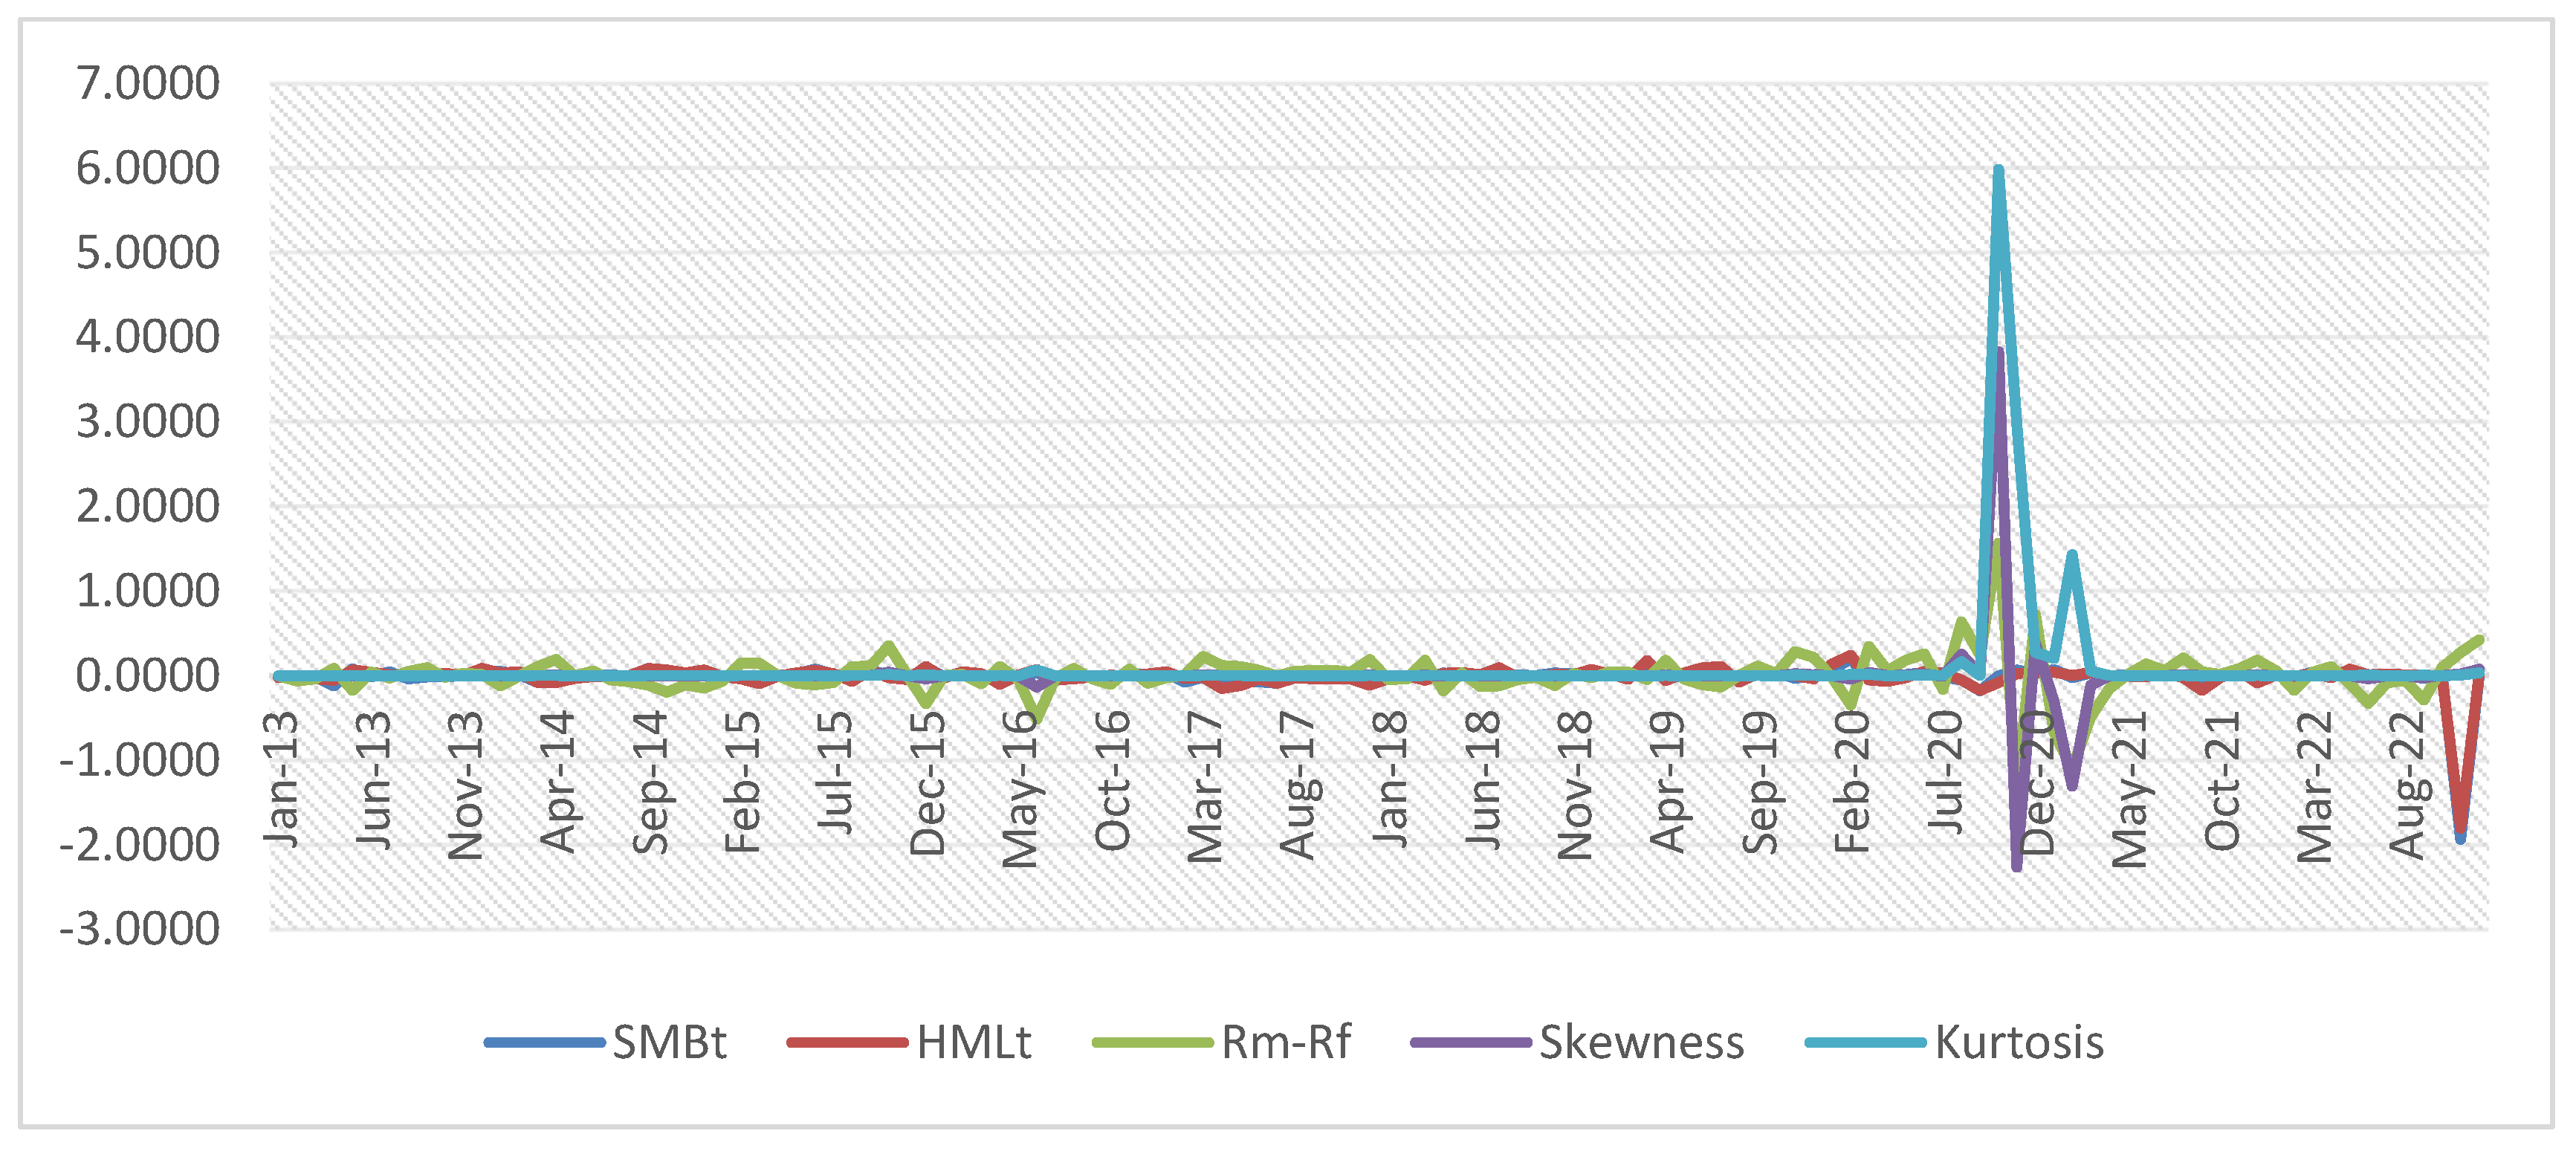

Table 1.
Portfolios formed based on the intersection of two sizes with three sorting groups by B/M, skewness, and kurtosis.
Table 1.
Portfolios formed based on the intersection of two sizes with three sorting groups by B/M, skewness, and kurtosis.
| Characteristics/Value | B/M | |||||||||
| H | M | L | ||||||||
| Size | S | SH | SM | SL | ||||||
| B | BH | BM | BL | |||||||
Note that the table shows the intersections of two size categories against the three groups of B/M ratio, , and to form 18 portfolios. This implies that these various categories either have small caps or big caps.
Table 2.
Estimation of factor risks.
| Sorting Types | Breakpoint | Formulas |
| 1 × 1 | Single | |
| 2 × 3 | B/M; 30th and 70th percentile | |
| 2 × 3 | ; 30th and 70th percentile | |
| 2 × 3 | ; 30th and 70th percentile | |
| 2 × 3 | size; 50th and 50th percentile | |
| B/M; 30th and 70th percentile | ||
| 2 × 3 | size; 50th and 50th percentile | |
| ; 30th and 70th percentile | ||
| 2 × 3 | size; 50th and 50th percentile | |
| ; 30th and 70th percentile | ||
Note that the computation of these portfolio returns is based on actual returns (value-weighted and equally weighted) over the sample period.
Table 3.
Statistics summary for monthly factors.
| SMB | HML | ||||
| Mean | 0.01 | −0.01 | 0.01 | 0.01 | 0.02 |
| Median | 0.01 | 0.00 | 0.01 | 0.00 | 0.00 |
| Maximum | 1.56 | 0.09 | 1.27 | 1.12 | 1.81 |
| Minimum | −1.31 | −1.10 | −0.15 | −0.13 | −0.09 |
| Std. Dev. | 0.28 | 0.11 | 0.13 | 0.11 | 0.17 |
| Skewness | 0.12 | −9.31 | 8.39 | 8.75 | 10.11 |
| Kurtosis | 15.38 | 96.82 | 84.81 | 89.04 | 107.82 |
| Jarque–Bera | 766.39 | 45,742.04 | 34,870.19 | 38,549.47 | 56,983.64 |
| Probability | 0.00 | 0.00 | 0.00 | 0.00 | 0.00 |
| Observations | 120 | 120 | 120 | 120 | 120 |
Source: Authors.
Table 4.
Correlation between the pricing factors.
| SMB | HML | ||||
| 1 | |||||
| SMB | −0.20 | 1 | |||
| HML | 0.15 | −0.94 | 1 | ||
| 0.16 | −0.97 | 0.91 | 1 | ||
| 0.12 | −0.98 | 0.93 | 0.96 | 1 |
Source: the authors.
Table 5.
Average monthly excess returns for the 18 portfolios.
| H | M | L | |||||||
| Small | −0.0090 | 0.0032 | −0.0010 | −0.0124 | −0.0022 | 0.0010 | −0.0023 | −0.0027 | −0.0123 |
| Big | −0.0007 | 0.0074 | 0.0201 | 0.0114 | 0.0055 | −0.0009 | −0.0004 | 0.0046 | 0.0200 |
Table 6.
Unit root test results by augmented Dickey–Fuller test.
| Panel (A): Right-Hand-Side Variables | |||||||||
| −5.92 a | |||||||||
| SMB | −11.01 a | ||||||||
| HML | −11.70 a | ||||||||
| −11.08 a | |||||||||
| −10.72 a | |||||||||
| Panel (B): Excess Return of 18 Portfolios | |||||||||
| H | M | L | |||||||
| S | −6.59 a | −6.39 a | −6.38 a | −12.95 a | −6.53 a | −6.43 a | −12.94 a | −6.37 a | −6.06 a |
| B | −11.83 a | −6.17 a | −12.01 a | −11.88 a | −6.11 a | −6.24 a | −12.26 a | −12.49 a | −11.97 a |
Note that the test is conducted at Level One the values in panel (A) and panel (B) are the ADF statistics, and a implies significance at all levels of significance. Source: the authors.
Table 7.
Fama–Macbeth cross-sectional regression result.
| Regressors | Coefficients | p-Value |
| 0.00 | 0.95 | |
| 0.97 a | 0.00 | |
| −0.01 b | 0.01 | |
| 0.01 a | 0.00 | |
| 0.01 b | 0.03 | |
| 0.01 b | 0.01 |
Note that the regressors are the loading factors or risk premiums obtained from the time series regression of Equation (3)8 and the associated coefficients are presupposed to be positive/significant. a and b imply significance at 1% and 5%, respectively.
Table 8.
Spanning test results.
| SMB | HML | |||
| SMB | −0.20 a | −0.18 a | −0.09 a | |
| HML | −2.53 a | −0.04 | −0.15 | |
| −1.56 a | −0.03 | 0.18 | ||
| −0.90 a | −0.12 | 0.21 |
Note that the test is conducted at a 1% significant level and a implies significance at 1%.
Table 9.
Regression results yielded by the FF3FM.
| 1 | 2 | 3 | 1 | 2 | 3 | 1 | 2 | 3 | |
| S | −0.01 a | 0.00 | −0.01 c | 0.96 a | 0.94 a | 0.98 a | 0.12 a | 0.03 | 0.04 |
| B | −0.01 a | 0.00 | 0.00 | 0.98 a | 0.96 a | 0.94 a | 0.32 a | −0.04 | −0.18 a |
| 1 | 2 | 3 | 1 | 2 | 3 | ||||
| S | −0.13 a | 0.06 | −0.02 c | 0.98 | 0.97 | 0.97 | |||
| B | 1.39 a | −0.09 | 0.39 | 0.95 | 0.96 | 0.97 | |||
Note that Equation (3) was run without accounting for systematic skewness and kurtosis risk factors; is the regression intercept, whereas , , and are the coefficients of market factors, size, and value, respectively; 1, 2, and 3 imply 30th, 40th; and 30th percentile breakpoints, a, b, and c denote 1%, 5%, and 10% levels of significance, respectively. Source: the authors.
Table 10.
Regression results yielded by co-moment-augmented FF3FM.
| S | −0.01 | 0.00 | 0.00 | 0.00 | 0.00 | 0.00 | −0.01 | −0.01 b | 0.01 c |
| B | −0.01 c | 0.00 | 0.00 | 0.00 | 0.00 | 0.00 | −0.01 b | 0.00 | 0.01 |
| S | 1.00 a | 0.98 a | 1.00 a | 1.00 a | 0.99 a | 0.97 a | 1.01 a | 0.98 a | 0.98 a |
| B | 1.00 a | 0.96 a | 1.00 a | 1.00 a | 0.98 a | 0.97 a | 1.02 a | 0.98 a | 0.98 a |
| S | 1.47 | 1.36 | 1.22 a | 0.44 | 2.08 a | 1.55 a | 1.09 a | 1.78 a | 2.01 a |
| B | 2.06 a | −0.27 | 0.94 b | 0.74 c | 0.41 | 1.46 a | 0.26 | 0.36 | 2.75 a |
| S | −0.13 | 0.11 | −0.07 | 0.01 | 0.14 | −0.04 | 0.06 | 0.03 | −0.06 |
| B | 1.14 a | 0.01 | 0.50 a | −0.03 | 0.06 | 0.19 | −0.06 | −0.10 | −0.01 |
| S | 0.52 | 0.23 | 0.44 b | −0.90 b | 0.80 a | 0.37 | −0.18 | 0.04 | 1.12 a |
| B | 0.81 a | −0.14 | 0.24 | 0.64 a | −0.15 | 0.69 a | 0.29 | 0.39 b | 0.91 a |
| S | 0.21 | 0.56 | 0.41 a | 0.14 | 0.54 a | 0.68 a | −0.57 a | 0.02 a | 0.01 a |
| B | −0.07 | −0.01 | 0.96 a | 0.60 a | 0.40 b | 0.40 b | 0.02 | 0.01 | 2.00 a |
| S | 0.98 | 0.98 | 0.97 | 0.95 | 0.98 | 0.97 | 0.96 | 0.98 | 0.98 |
| B | 0.95 | 0.96 | 0.97 | 0.97 | 0.97 | 0.97 | 0.97 | 0.98 | 0.95 |
Note that Equation (3) was run by accounting for systematic skewness and kurtosis risk factors; is the regression intercept, whereas , , , and are the coefficients of market factors, size, value, systematic skewness, and systematic kurtosis respectively; 30th, 40th, and 30th percentile breakpoints are applied; a, b, and c denote 1%, 5%, and 10% levels of significance, respectively. Source: Author.
Table 11.
Model performance test results.
| GRS | SR(a) | |α| | s(α) | ||
|---|---|---|---|---|---|
| FF3FM | 0.033 | 0.001 | 0.006 | 0.004 | 0.967 |
| FF3FM with co-moments | 3.212 a | 0.002 | 0.004 | 0.004 | 0.968 |
Note that a denotes significance at 1%, GRS is Gibbons et al. (1989) statistic, SR(a) is the Sharpe ratio for intercept, |α| is the average absolute value of the intercept, s(α) is the average standard error of the intercept, and is average adjusted R-squared. Source: the authors.
Disclaimer/Publisher’s Note: The statements, opinions and data contained in all publications are solely those of the individual author(s) and contributor(s) and not of MDPI and/or the editor(s). MDPI and/or the editor(s) disclaim responsibility for any injury to people or property resulting from any ideas, methods, instructions or products referred to in the content. |
© 2024 by the authors. Licensee MDPI, Basel, Switzerland. This article is an open access article distributed under the terms and conditions of the Creative Commons Attribution (CC BY) license (https://creativecommons.org/licenses/by/4.0/).
Copyright: This open access article is published under a Creative Commons CC BY 4.0 license, which permit the free download, distribution, and reuse, provided that the author and preprint are cited in any reuse.


