

Submitted:
20 June 2024
Posted:
02 July 2024
You are already at the latest version
Abstract
The extent of correlation or co-movement among the returns of developed and/or emerging stock markets remains pivotal for efficiently diversifying global portfolios. This correlation is prone to variation over time as a consequence of escalating economic interdependence fostered by international trade and financial markets. In this study, we analyzed the time-varying correlation and co-movement between the JSE.JO stock market of South Africa and its developed and developing stock market partners. The Dynamic Conditional Correlation - Exponential Generalized Autoregressive Conditional Heteroscedasticity (DCC-EGARCH) methodology is employed with different multivariate distributions to explore the time-varying correlation and volatilities between the JSE.JO stock market and its partners. Based on the conditional correlation results, the JSE.JO stock market is integrated and co-moves with its partners, and the conditional correlation for all markets exhibit time-variant behavior. The conditional volatility results show that the JSE.JO stock market behaves differently from other markets, especially after 2015, indicating a positive sign for investors to diversify between JSE.JO and its partners. The highest value of conditional volatility for markets was in 2020 during the COVID-19 pandemic, representing the riskiest period that investors should avoid due to the lack of diversification opportunities during crises.
Keywords:
Multivariate GARCH
; DCC model
; EGARCH model
; Time-varying correlation
; volatility
; Stock market
; portfolio diversification
1. Introduction
Stock market synchronization denotes the phenomenon where national stock markets exhibit substantial simultaneous movements. The level of correlation or co-movement between the returns of national stock markets remains crucial for diversifying international portfolios effectively. This correlation is subject to fluctuations over time due to increasing economic interdependence facilitated by international trade and financial markets [1]. The liberalization of capital flows, the expansion of foreign direct investment, and the internationalization of equity (stock) markets all contributed to the growing interdependence of markets [2,3,4,5]. Comprehending the inter-market volatility within and/or between markets is crucial for financial policy and regulation formulation across financial markets, financial asset pricing and trading, and financial hedge construction, particularly across asset classes [2].
The study of spillover volatility offers important insights into the information flow between markets for different asset classes, both within countries and between local markets. For instance, information can be transferred from the market for underlying assets to the market for derivatives created on those assets. Additionally, there may be spillovers from one trading time zone to another or from developed markets to emerging markets [2]). The connection between developed and emerging markets, as well as the implications for financial liberalization and global integration, have drawn the attention of financial economists [6,7,8,9]. Modeling and forecasting volatility and correlations have taken center stage in financial econometrics for derivative pricing, portfolio optimization, risk management, and hedging strategies because of its precise estimates [7].
Numerous generalized autoregressive conditional heteroscedasticity (GARCH) [10] models such as exponential GARCH [11], threshold GARCH [12], and Nonsymmetric GARCH [13] among others, and multivariate GARCH models such as BEKK [14], constant conditional correlation (CCC) [15], dynamic conditional correlation (DCC) [16] and their variants are proposed to investigate volatility and correlation among stock markets. It has been demonstrated that these models are highly effective at simulating and predicting the volatility of financial return series. Additionally, there is a chance that financial assets will be correlated, and these correlations are significant when it comes to financial management tasks like portfolio construction [17].
Numerous studies have employed Multivariate GARCH models to investigate the dynamic conditional variance and correlation among assets [18,19,20]. [21] utilized the Dynamic Conditional Correlation (DCC) multivariate GARCH model to examine the transmission of financial shocks across financial firms in both Australia and the US, along with their sensitivity to local and foreign interest rates. The authors observed that the conditional correlation between US and Australian financial stock returns fluctuated over time. Additionally, they found an increase in cross-correlation between banks and financial stock returns during the global financial crisis, diminishing the benefits of diversified international portfolios and exacerbating financial instability. Furthermore, the authors reported that, during contractionary periods in the US business cycle, the conditional correlation between returns of Australian and US financial firms increased, whereas it decreased during expansionary phases. Similarly, [22] investigated time-varying conditional correlations among weekly index returns of seven emerging stock markets in Central and Eastern Europe, as well as US and German stock returns, using Engle’s (2002) Dynamic Conditional Correlation (DCC) multivariate GARCH model. Their findings revealed a statistically significant increase in conditional correlations between US and German stock returns and CEE stock returns, particularly during the 2007-2009 financial crises. This suggests that these emerging markets are susceptible to external shocks, with a notable regime shift in conditional correlation. Furthermore, [22] highlighted the substantial impact of both domestic and foreign monetary variables, along with exchange rate movements, on conditional correlations. Additionally, they demonstrated that during the 2007-2009 financial crisis, macroeconomic fundamentals played a significant role in explaining these conditional connections. Majdoub (2014) investigated the conditional correlations among a sample of five emerging Islamic markets — Turkey, Indonesia, Pakistan, Qatar, and Malaysia — and the US market. Given the strict inclusion criteria of the MSCI (Morgan Stanley Capital International) Islamic equity index, it serves as the basis for the empirical design. Three multivariate models — BEKK, CCC, and DCC — were employed, and the results revealed a weak temporal correlation between the US and Islamic emerging equity markets. There is insufficient evidence to suggest that the US market influences emerging Islamic equities markets, as indicated by the results.
The studies mentioned above show the ability and efficiency of various multivariate GARCH models in investigating dynamic conditional volatility and correlation between stock markets. Therefore, the symmetric and asymmetric DCC-GARCH models with different multivariate distributions were used in this work to explore dynamic conditional volatility and co-movement between JSE.JO stock market of South Africa and four of its partners as developed and emerging stock markets.
Although a body of literature has been written about the dynamic conditional correlation between stock markets, especially in the context of developed and developing economies, there is still a lack of knowledge regarding the particular dynamics between the South African Johannesburg Stock Exchange (JSE) market and its partner markets, which include the US, UK, India, and Malaysia. Previous research frequently ignores these markets’ distinct features and interactions, such as their varying degrees of economic development and currency influences. Thus, empirical studies that utilize sophisticated modeling methods—like DCC-GARCH models with different multivariate distributions—are required to fully examine the changing correlation patterns and account for the possible influence of exchange rate fluctuations. Closing this gap will help investors, policymakers, and financial practitioners by offering insightful information about the interdependence and mechanisms of risk transmission among these markets.
The following questions aim to address the aforementioned gap: Are there volatilities in the studied stock market returns? Does the correlation between the stock market returns change over time? Are correlations higher during periods of increased volatility, particularly during crises? To answer these questions, symmetric and asymmetric DCC-EGARCH models are employed with two different multivariate distributions.
Most studies in the literature have focused on Asian stock markets, particularly those in China [23], India [24], and Pakistan [25,26], as well as European markets like those in Central and Eastern Europe [27], and American markets such as the S& P 500. These studies typically encompass both developed and emerging markets. The main contribution of this study is to provide valuable insights into the co-movement and significance of African stock markets, specifically the JSE.JO of South Africa, in relation to both developed and developing stock markets by using both symmetric and asymmetric DCC-EGARCH models. Additionally, it presents the effects of different leptokurtic multivariate distributions, such as the Student-t and Laplace distributions, in analyzing dynamic volatility and correlation.
The remainder of this paper is formed as follows, in Section 2, a literature view is presented, and the methodology used in this work is shown in Section 3. Section 4 consists of data and empirical results while the discussion and conclusion of the study are presented in Section 5 and 6 respectively.
2. Literature Review
Since the Autoregressive Conditional Heteroskedasticity (ARCH) model was first introduced in Engle’s seminal paper in 1982, there has been much interest in modeling volatility in financial time series. The ARCH model has since been the subject of several extensions and modifications [28]. Univariate and multivariate models have occupied significant extensions and modifications in the literature. Understanding the co-movements of financial returns is crucial from a practical standpoint, even though modeling the volatility of the returns has received the majority of attention [28]. Therefore, many studies have been conducted to model time-varying volatility and correlation among stock market returns, between stock market returns and commodities such as the international oil market, and between sectors of a stock market as well. In the following, several studies that utilized univariate and multivariate models for investigating volatility and correlation between stock markets, between stock market sectors, and between stock markets and other markets are reported. In univariate modeling, [29] use Univariate and bivariate GARCH models to examine volatility among the Central and Eastern European (CEE) stock markets and their correlation with developed markets. According to the results of the univariate approach, the persistence of the GARCH effect exists. The results of the bivariate approach present that the CEE stock markets correlated with emerging markets rather than developed ones. The author stated that conditional correlation is considered and constant conditional correlation is rejected. The author concluded that the conditional correlation among the CEE stock markets is time-varying and reaches its significantly high value during the crisis period. Symmetric and asymmetric univariate volatility models were employed by [30] to explore volatility in the Indian stock market, specifically the S&P CNX Nifty Index. Based on the Akaike Information Criterion (AIC) and Schwarz Information Criterion (SIC), their findings indicate that the GARCH(1,1) model is the most suitable for capturing symmetric volatility in the data, while the TGARCH(1,1) model excels in handling asymmetry.
In multivariate modeling for investigating volatility and correlation between stock markets returns, [31] used the DCC-GARCH model as the best model among four models based on the residual error diagnostic test for modeling dynamic conditional correlations and volatility spillovers between Chinese and five Southeast Asian stock markets. The authors use the DCC-GARCH model in building hedge ratios and portfolio weights. The results revealed that the Asian financial crisis, the US subprime crisis, and the stock market crash 2015 affected the conditional correlation between China and Southeast Asian stock markets. The conditional correlation reached its highest value during the crisis. The co-movement between China and Southeast Asian stock markets was noticed clearly after the CAFTA. Moreover, return and volatility spillovers among EAGLEs stock markets have been examined for 2002 - 2017 sample period. The sample is split into three periods: pre-crisis, crisis, and post-crisis, and two models are used for evaluating volatility spillover, namely DCC and BEKK-GARCH models. Besides evaluating volatility spillover among EAGLE’s stock markets, the effect of developed markets has also been investigated. Based on the results, [27] reported a significant and positive spillover effect among the EAGLEs stock markets in pre- and post-crisis periods. Also, the authors stated that the US stock market is the only developed market that has an effect on volatility transmission on most of the Eagle stock markets.
Ref. [32] employed the DCC-EGARCH model, as [33] to investigate the correlation between the return volatilities of cryptocurrencies and global stock market indices, focusing on the spillover effects of the COVID-19 pandemic, as well as Value-at-Risk measurements. The results from these studies show that the conditional volatilities of both asset portfolios increase significantly after positive news and respond well to previous shocks. Consequently, financial assets have low unconditional volatility and minimal risk when there are no external disruptions.
In addition, the Pakistan Stock Exchange (PSX) conditional co-movements and dynamic conditional correlation with other stock markets are also examined and evaluated in this study using the DCC-GARCH model. According to [25], the Pakistani Stock Exchange (PSX) is much more volatile than the two carefully chosen stock markets. The study’s information criteria led to the selection the DCC-GARCH (1, 1) model for in-sample fitting. In contrast, the criteria such as MAPE and RMSFE used for out-of-sample forecast evaluation selected the DCC (2,1)-GARCH (1,1). And, [34] investigated the dynamic relationship between the Indian stock market and five emerging Asian stock markets, three developed Asian markets, and the US market. DCC and ADCC models have examined the conditional volatility and correlation between the Indian stock market and the considered markets. The DCC model was the most suitable fit model for the data based on the value of BIC. The results showed different levels of conditional correlation between the Indian stock market and the selected markets. High diversification chances exist for Indian investors in Malaysian, Chinese, and Japanese stock markets, and fewer opportunities exist in other markets.
For modeling volatility and correlation between stock markets and commodities, three types of DCC-GARCH models are used to investigate the relationship and volatility between Brent crude oil returns and stock market returns in India at both aggregate (BSE-SENSEX) and sector levels (seven sectors) for the 2006 to 2015 sample period. Both symmetric and asymmetric for each type of DCC-GARCH model are considered to model the conditional correlation. [35] reported that the volatility spillover from the international oil market to the Indian stock market (aggregate level) is insignificant. In comparison, it is significant at the sector level. The authors also stated that the volatility shocks persist among the studied sectors, and the time-varying correlation of BSE-SENSEX and different sectors with Brent crude oil fluctuates during the study period affected by GFC in 2008. Additionally, [36] Use VAR-GARCH, VAR-AGARCH, and DCC-GARCH models to investigate the volatility transmission between oil and stock market returns in Ghana and Nigeria. According to their findings, there is a greater indication of volatility transmission from oil to stocks in Ghana than from stocks to oil. They also determine the ideal weights and hedge ratios for the Ghanaian and Nigerian oil portfolios. According to their findings, hedging works better in Ghana. In examining volatility between stock market sectors, and between commodities, [37] used symmetric-DCC and asymmetric-DCC multivariate GARCH models to explore the dynamics of returns co-movements between some economic sectors in South Africa, and he found that there are leverage effects in the dynamics of co-movements between the sector pairs. Katzke presented that the ability of investors to diversify across local sectors has declined due to the increased co-movements between the sectors, while [38] examined the interconnections between agricultural commodity prices and energy prices in South Africa using the Bayesian DCC-MGARCH model with Markov chain Monte Carlo (MCMC) algorithm for estimating parameters. The model allows for observing the evolution of conditional correlations between pairs of commodities over time. By utilizing the MCMC approach instead of ML, the study extends previous research that demonstrated similar co-movements between agricultural and energy prices. The findings indicated that the correlations between these markets are dynamic and time-varying.
In the above review, co-movement and integration between different types of markets - emerging and developed - and different sectors of a market have been noticed. Also, the effect of the international oil market on the stock markets is examined by various GARCH models. Therefore, the GARCH model and its extensions - univariate and multivariate are useful and important in modeling conditional volatility and correlation among assets.
To the best of our knowledge, few studies in the literature have utilized both symmetric and asymmetric DCC models for modeling volatility among stock markets. Typically, the standard GARCH model is used as the univariate model for stock markets within the DCC framework. This study employs both symmetric and asymmetric DCC models with the EGARCH model as the univariate model for individual stock markets. Additionally, it considers two different multivariate distributions: multivariate Student-t and multivariate Laplace. This approach distinguishes the study from existing research by providing a more comprehensive analysis of dynamic volatility and correlations. Furthermore, it incorporates an African stock market to investigate its co-movement with developed and developing stock markets, highlighting its significance in the international stock market and the potential for investors’ diversification.
3. Materials and Methods
3.1. Data Source and Description
The data was downloaded from the Yahoo Finance website (https://www.finance.yahoo.com), and it consists of 5 stock markets, namely, JSE.JO of South Africa, BSESN of India, KLSE of Malaysia as developing countries, FTSE-100 of UK, and S&P 500 of USA as developed countries. Considering these markets is based on the historical relationship between South Africa India and the UK, while taking the US into account as one of the developed markets and Malaysia as one of the emerging markets. The logarithmic of returns from adjusted prices of 3396 instances is calculated and used in analyzing dynamic conditional correlations among the stock markets. The data is employed as daily data for the period 1st of January 2010 to 30 December 2022.
3.2. Methods
In financial management tasks such as portfolio construction, risk management, and hedging strategies, modeling and analyzing asset correlation and volatility have been the main topics of discussion. The literature on stock market correlation demonstrates that different approaches are used depending on the study’s goal and the data that is available. Numerous econometric techniques, including correlation, VAR, VECM, Gangers causality, impulse response, and the GARCH model, were employed in studies on stock market integration to examine the relationships between various markets [39]. In addition to the other techniques, the studies have made extensive use of the GARCH family models. The Generalized Autoregressive Conditional Heteroscedasticity (GARCH) model [10] was developed as a result of the introduction of the ARCH model [40] The univariate GARCH model assumes that variable volatilities are constant over time. Correlations between several time series are not captured by it [41]. Although the univariate GARCH model’s drawbacks have been eliminated by the constant conditional correlation (CCC)-GARCH [15] model, it is not a realistic model because it also takes into account the correlation constant, which is dynamic. Based on the CCC model, [16] created a dynamic model that takes the conditional correlation into account as a time-varying factor. Currently, the volatilities and correlation of stock market returns are being studied using a variety of GARCH model variations.
The standard GARCH model cannot capture volatility asymmetries based on the sign of previous shocks [11], whereas the EGARCH model addresses this by allowing for asymmetric effects between positive and negative asset returns. The DCC-EGARCH model directly parameterizes conditional correlation and examines it in two steps: first, by estimating univariate EGARCH series, and second, by estimating the correlation [16]. This could be considered as an advantage and disadvantage as well. It is advantageous due to the relative ease of estimating parameters in two steps, making it more practical for use [42]. In addition to that, its time-varying correlation parameters allow for the analysis of correlation behavior during financial crises and stable periods [43], and that is crucial for portfolio optimization which necessitates the covariance and standard deviation data of financial assets [44]. It is a disadvantage because the number of parameters to be examined in the correlation procedure is independent of the number of variables to be correlated, making it possible to compute multiple matrices [16,45].
3.2.1. Model Specification
The relative easiness of the DCC model to use in practice comes from its method of estimating parameters in two steps [42]. The first step concerns building a conditional mean model for the returns series which might be the VAR(p) model, while the second step concentrates on building the DCC model. The following steps provide more details about how to specify and build the DCC model.
-
Specify a conditional mean model for the stocks returns series (JSE.JO stock market of South Africa and its partners) which can be a constant or a VAR(p) model and the simplest one is VAR (1) is formed as follows:Where is a vector of JSE.JO stock market of South Africa and its four considered partners of 5-dimensional, and is a 5-dimensional constant vector and is a matrix and is a sequence of independent and identically distributed (iid) random vectors with mean zero and covariance matrix , which is positive-definite.
-
Obtain the residuals of the conditional mean model from step 1 for five stock returns and use them to check the existence of the volatility effect. There are many tests for checking the volatility such as the Lagrange Multiplier test, the multivariate Portmanteau test and its robust version with 5% upper tail trimming, and rank-based test.The hypothesis (states no serial correlation in the series) that should be tested to check the existence of volatility effect in the residuals series is , for some i satisfying, where m is a positive integer, and is the lag-i of cross-correlation matrix of . The test statistic of the multivariate Portmanteau Test is defined as:where T is the sample size, is the dimension of , and with being the lag-j of sample cross-correlation matrix of . Under the null hypothesis that has no conditional heteroscedasticity, is asymtotically distributed as . For more information about the test statistic of the Lagrange Multiplier, the robust version of the Portmanteau test, and the rank-based test see [46] and references therein.
- Employ univariate volatility models, such as GARCH, EGARCH, and GJR-GARCH model, to each component residuals series from step 1. Check [47] for more details about univariate volatility models.
-
Suppose the estimate of the volatility series is , standardize the innovations of univariate volatility models via and fit a DCC model as in equation (4) bellow to .The DCC model of Engle (2002) is defined as in the following equations, where equation (3) represents the general form of the conditional mean model, equation (4) is residuals that univariate volatility models are applied, and equation (5) is the form of DCC model.whereis a vector of expected value of , is a vector of identical independent distribution (i.i.d) of errors with and and is a diagonal matrix of square roots of the conditional covariance matrix from univariate models, and which forms the symmetric DCC model.are non-negative real numbers and satisfying , and is the lagged function of the standardized residuals. is unconditional covariance matrix of and is the unconditional variance between series, i and j.The conditional covariances are given bywhereThe that forms the asymmetric version of the DCC model is as followswhere , is the maximum eigenvalue of , , , is a indicator function that takes the value 1 if the argument is true and 0 otherwise, and ∘ represents the elementwise operations notation.
- The performance of fitted models is checked and compared by information criteria AIC and BIC to select the best model.
4. Results
Figure 1. shows the time plot of the adjusted close prices series. Trend and fluctuation are the obvious characteristics of these series. A simultaneous decline around 2020 can be noticed in all indexes as a response to the COVID-19 crisis. The stock markets series are not following the same trend because the BSESN (India) and S&P 500 (USA) trend is higher than the other series, indicating low correlation. It is noticeable that JSE.JO stock market of South Africa descended twice before 2020 in 2017 and 2019 and that is because of the economic recession as https://www.statssa.gov.za/ reported. Figure 2. presents the time plot of the log return series. It is clear that the log return series has volatility clusters for some periods and varies within some fixed ranges, which statistically means it is stationary. The volatility clusters are remarkably high around 2020. Thus, the preliminary results indicate that the DCC-GRACH models would suit the series data.
Descriptive statistics and preliminary tests are reported in Table 1 before diving into volatility analysis. The table shows that the variation between the stock markets is tiny, as the standard deviation shows. The skewness values are all negative and most significantly differ from zero. And that means the distributions of the stock markets are skewed to the left. It is noticeable that the kurtosis values - representing the fatness of the tail of the distribution - are greater than three, which means the stock markets are not normally distributed, and that has been confirmed by the statistic values of the Jarque Bera test for normality and its p-values, which are less than 0.05. Based on the summary of descriptive statistics and the normality test, it would be suitable to use a multivariate fat tail distribution for the stock markets in modeling its volatilities and dynamic correlations such as multivariate Student-t distribution or Laplace multivariate distribution.
Table 2. shows the correlations between the stock market series. All correlations are positive, which means the stock markets move in the same direction and range between 0.132 and 0.584. The lowest correlation is between KSLE of Malaysia and S&P 500 of the USA, while the highest is between FTSE-100 of the UK and S&P 500 of the USA. That means the correlation between developed countries is high, and the correlation between developed markets and emerging markets is low.
The existence of the ARCH effect should be checked before starting modeling. For this purpose, the Lagrange Multiplier test, Ljung-Box (Portmanteau) test, rank-based test, and Robust version of the Portmanteau test with 5% upper tail trimming were used. All tests reject the null hypothesis of no serial correlation in each series with p-values less than 0.05 as the results show in Table 3, so the ARCH effect exists and the dynamic conditional correlation (DCC) model can be built to the data.
4.1. DCC-EGARCH Models
Based on the preliminary results, which indicate that the stock market series exhibit non-normal distributions, the Laplace and Student-t distributions as potential candidates for constructing dynamic conditional correlation (DCC) models are explored. Four DCC-EGARCH models have been constructed: symmetric and asymmetric models using the multivariate Laplace distribution, and two additional models using the multivariate Student-t distribution. Table 4 presents the number of parameters for each model along with their corresponding values of AIC and BIC. From the AIC and BIC values, it is evident that the asymmetric DCC-EGARCH model with a multivariate Student-t distribution possesses the lowest values for both AIC and BIC, while also having the fewest parameters. Furthermore, upon considering the significance of the and estimates, along with the log-likelihood values for each model in Table 5, it is notable that nearly all estimates are statistically significant. Moreover, the asymmetric DCC-EGARCH (MVT) model demonstrates the highest log-likelihood value, which is deemed suitable for the data given the data’s distribution with high kurtosis (heavy-tailed) values.
The estimated coefficients of the asymmetric DCC-EGARCH model are significant and the significance of the and implies the rejection of the null hypothesis that each parameter is zero. Additionally, the summation of and being less than one () confirms the validity of the DCC model. This suggests that the correlations between the index returns evolve over time, thereby rejecting the constancy of the conditional correlations.
4.2. Unconditional Volatilities and Correlations
The unconditional volatilities are the diagonal elements of the covariance matrix. The values of unconditional volatility for all considered markets are close to 1, which indicates high volatility in returns. These results are different from the findings of [48] study that investigates the correlations between the Turkish stock index returns and the returns of the stock indices of its major trading partners, specifically Egypt, Lebanon, and Oman. The findings have implications for potential diversification benefits for Turkish investors, particularly during periods of global financial crisis and regional political crises. In line with the results of [48,49] uses the multivariate GARCH-DCC model to explore the time-varying linkages between selected conventional and Islamic Asian and international stock index returns with Malaysian stock index returns.
Table 6 reports the estimated values for unconditional volatility ranking in which the US market shows the highest unconditional volatility. In contrast, the UK market shows the lowest unconditional volatility, which indicates stability in the UK stock market compared to the other stock markets. However, the results do not show any remarkable difference in volatilities between developed and emerging markets since the volatility values are not significantly different.
The unconditional correlations estimated by the t-DCC-EGARCH model are presented in Table 7. The pairs of unconditional correlation describes the co-movement between the markets. Our concentration is on JSE.JO of South Africa’s correlation with the other markets. The correlation values of the markets are close, and the highest correlation is 0.1785 between JSE.JO of South Africa and FTSE-100 of the UK which indicates that changes in FTSE-100 will affect JSE.JO more than any other market of the considered markets. while the lowest correlation is 0.1278 between JSE.JO of South Africa and S&P 500 of USA. The above-mentioned findings differ significantly from [49], which reported ranges of unconditional correlation between 0.379 and 0.799 for the selected conventional indices and 0.376 to 0.770 for the Islamic indices. In general, the low level of correlation is a good indication for portfolio diversification.
4.3. Conditional volatility and correlation plots
Figure 3a exhibits the volatility values for JSE.JO and its partners. The plotted values show that volatility evolves with time, and all markets present close movement most of the time, except for JSE.JO of South Africa, which behaves slightly differently from the other markets, especially after 2015. Thus, this behavior indicates a positive sign for investors to diversify between the JSE.JO stock market and its partners.
In consistency with [32,33,44,50] the volatility values reached their highest point in 2020 during COVID-19, which means that the crisis affected stock markets by making them move together more than in any other period. For more details about the COVID-19 effects on different financial aspects for individuals, firms, enterprises, countries, and financial markets, the reader is recommended to review [32,50,51] and the references therein. This result agrees with the findings of many studies [21,22,29,31,52,53,54] and confirms the assertion that stock markets tend to close during downturn periods (crises) rather than during stable periods. The markets are more integrated and move closely together in 2020, reducing the benefits of diversification. The risk of investing increased due to the closest movement of the markets.
The conditional correlations between JSE.JO of South Africa and its considered stock market partners are presented in Figure 3b, and their values are positive, similar to the unconditional correlation values. Moreover, the correlations indicate the co-movement of the stock markets. The highest conditional correlation values are between JSE.JO of South Africa and FTSE-100 of the UK, showing higher co-movement and fewer opportunities for diversification. On the other hand, the lowest conditional correlation values are between JSE.JO and S&P 500 of the US, and this result is inconsistent with [33] in terms of high correlation between US stock markets and emerging markets, indicating low co-movement and high opportunities for diversification between developed stock markets and emerging markets as the findings of [24] reported.
4.4. Asymmetric DCC-EGARCH (MVT) Forecasts
The asymmetric DCC-EGARCH model is employed for forecasting 509 days. Figure 4 exhibits the fitted and forecasted conditional correlation between JSE.JO of South Africa and its respective partners. In this figure, the green line represents the estimated unconditional correlation, the blue line represents the conditional correlation fitted by the model, and the red line represents the conditional correlation forecasted by the model.
It is evident from the plots that the fitted and forecasted correlations fluctuate around the unconditional correlation. Additionally, the conditional correlation forecast mirrors the movement of the fitted correlation and appears to converge to the unconditional correlation over the long term.
5. Discussion
The examination of volatility values for JSE.JO and its developed and emerging partner markets indicate changing patterns over time. The JSE.JO market in South Africa exhibited marginally distinct behavior, especially after 2015. This implies that investors have a good chance to diversify their holdings outside of the JSE.JO stock market and its partners. During the COVID-19 crisis in 2020, the volatility peaked, indicating a reduction in the benefits of diversification and an increase in market integration. The conditional correlations also show significant co-movement among stock markets and its higher values indicate fewer opportunities for diversification.
Generally, the conditional correlations between the JSE.JO stock market and its partners are low, less than 0.5, offering promising opportunities for investors to diversify between developed and developing stock markets. This is consistent with the findings of [24], which highlight the pivotal role of switching between different investment regimes for effective portfolio diversification.
The analysis underscores substantial volatility and correlations among global markets, emphasizing the need for understanding market dynamics for effective diversification, particularly during crises like COVID-19. The asymmetric DCC-EGARCH model proves robust in capturing these complex relationships, providing valuable insights for investors and researchers alike.
6. Conclusions
The DCC model stands out as one of the premier models for capturing dynamic volatility and correlation among financial assets and stock market returns across various domestic and international markets. The model’s capture of conditional correlations provides valuable insights for investors, signaling opportunities for diversification across markets and aiding in risk management when constructing portfolios. Additionally, volatility insights aid in steering clear of investments during periods of crisis.
Based on the findings, investors should leverage low correlations between specific markets, such as JSE.JO and S&P 500, to diversify their portfolios and lighten risk. In addition to that, they should prepare for increased market synchronization during global crises, which can reduce the benefits of diversification, while Policymakers should focus on enhancing market stability through effective regulations and coordinated international responses during crises, as well as ensuring transparency and timely information to help investors navigate volatile periods.
More detailed studies are needed to examine the impact of the COVID-19 pandemic on stock markets. This can be achieved by incorporating COVID-19 as a dummy variable and/or dividing the study period into three phases: pre-crisis, crisis, and post-crisis. For enhanced accuracy, it is preferable to customize a GARCH-type model for each stock market return, rather than assuming a uniform GARCH model for all stock market returns, before integrating them through the DCC model.
Author Contributions
Conceptualization, A.E.A.M.; methodology, A.E.A.M.; software, A.E.A.M.; validation, A.E.A.M., H.M., and B.O.; formal analysis, A.E.A.M.; investigation, A.E.A.M.; resources, A.E.A.M.; data curation, A.E.A.M.; writing—original draft preparation, A.E.A.M.; writing—review and editing, A.E.A.M., H.M., and B.O; visualization, A.E.A.M.; supervision, H.M and B.O.; project administration, A.E.A.M. All authors have read and agreed to the published version of the manuscript.
Funding
This research received no external funding.
Data Availability Statement
The stock market dataset that used in this work can be found at https://www.finance.yahoo.com.
Conflicts of Interest
`The authors declare no conflicts of interest.’
Abbreviations
The following abbreviations are used in this manuscript:
| GARCH | Generalized Autoregressive Conditional Heteroscedasticity |
| EGARCH | Exponential Generalized Autoregressive Conditional Heteroscedasticity |
| TGARCH | Threshold Generalized Autoregressive Conditional Heteroscedasticity |
| BEKK | Baba, Engle, Kraft and Kroner |
| CCC | Constant Conditional Correlation |
| DCC | Dynamic Conditional Correlation |
References
- Wälti, S. Stock market synchronization and monetary integration. Journal of International Money and Finance 2011, 30, 96–110. [Google Scholar] [CrossRef]
- Niel, O. Spillover Volatility, Contagion and Information. Available online: https://financialmarketsjournal.co.za/oldsite/10thedition/printedarticles/volatility.htm.2023-12-17.
- Shehzad, K.; Liu, X.; Tiwari, A.; Arif, M.; Rauf, A. Analysing time difference and volatility linkages between China and the United States during financial crises and stable period using VARX-DCC-MEGARCH model. International Journal of Finance & Economics 2021, 26, 814–833. [Google Scholar]
- Pan, Q.; Mei, X.; Gao, T. Modeling dynamic conditional correlations with leverage effects and volatility spillover effects: Evidence from the Chinese and US stock markets affected by the recent trade friction. The North American Journal of Economics and Finance 2022, 59, 101591. [Google Scholar] [CrossRef]
- Righi, M.B.; Ceretta, P.S. Multivariate GARCH Modeling of Sector Volatility Transmission: A DCC Model Approach. Accessed December 2011, 2, 2013. [Google Scholar] [CrossRef]
- Bhuyan, R.; Robbani, M.G.; Talukdar, B.; Jain, A. Information transmission and dynamics of stock price movements: An empirical analysis of BRICS and US stock markets. International Review of Economics & Finance 2016, 46, 180–195. [Google Scholar]
- Bala, D.A.; Takimoto, T. Stock markets volatility spillovers during financial crises: A DCC-MGARCH with skewed-t density approach. Borsa Istanbul Review 2017, 17, 25–48. [Google Scholar] [CrossRef]
- Labidi, C.; Rahman, M.L.; Hedström, A.; Uddin, G.S.; Bekiros, S. Quantile dependence between developed and emerging stock markets aftermath of the global financial crisis. International review of financial analysis 2018, 59, 179–211. [Google Scholar] [CrossRef]
- Dash, S.R.; Maitra, D. The relationship between emerging and developed market sentiment: A wavelet-based time-frequency analysis. Journal of Behavioral and Experimental Finance 2019, 22, 135–150. [Google Scholar] [CrossRef]
- Bollerslev, T. Generalized autoregressive conditional heteroskedasticity. Journal of econometrics 1986, 31, 307–327. [Google Scholar] [CrossRef]
- Nelson, D.B. Conditional heteroskedasticity in asset returns: A new approach. Econometrica: Journal of the econometric society 1991, pp. 347–370.
- Glosten, L.R.; Jagannathan, R.; Runkle, D.E. On the relation between the expected value and the volatility of the nominal excess return on stocks. The journal of finance 1993, 48, 1779–1801. [Google Scholar] [CrossRef]
- Engle, R.F.; Ng, V.K. Measuring and testing the impact of news on volatility. The journal of finance 1993, 48, 1749–1778. [Google Scholar] [CrossRef]
- Engle, R.F.; Kroner, K.F. Multivariate simultaneous generalized ARCH. Econometric theory 1995, 11, 122–150. [Google Scholar] [CrossRef]
- Bollerslev, T. Modelling the coherence in short-run nominal exchange rates: a multivariate generalized ARCH model. The review of economics and statistics 1990, pp. 498–505.
- Engle, R. Dynamic conditional correlation: A simple class of multivariate generalized autoregressive conditional heteroskedasticity models. Journal of Business & Economic Statistics 2002, 20, 339–350. [Google Scholar]
- Zhang, K.; Chan, L. Efficient factor garch models and factor-dcc models. Quantitative Finance 2009, 9, 71–91. [Google Scholar] [CrossRef]
- Hassan, S.A.; Malik, F. Multivariate GARCH modeling of sector volatility transmission. The quarterly review of economics and finance 2007, 47, 470–480. [Google Scholar] [CrossRef]
- Malik, F.; Ewing, B.T. Volatility transmission between oil prices and equity sector returns. International Review of Financial Analysis 2009, 18, 95–100. [Google Scholar] [CrossRef]
- Sadorsky, P. Correlations and volatility spillovers between oil prices and the stock prices of clean energy and technology companies. Energy economics 2012, 34, 248–255. [Google Scholar] [CrossRef]
- Akhtaruzzaman, M.; Shamsuddin, A.; Easton, S. Dynamic correlation analysis of spill-over effects of interest rate risk and return on Australian and US financial firms. Journal of International Financial Markets, Institutions and Money 2014, 31, 378–396. [Google Scholar] [CrossRef]
- Syllignakis, M.N.; Kouretas, G.P. Dynamic correlation analysis of financial contagion: Evidence from the Central and Eastern European markets. International Review of Economics & Finance 2011, 20, 717–732. [Google Scholar]
- Do, A.; Powell, R.; Yong, J.; Singh, A. Time-varying asymmetric volatility spillover between global markets and China’s A, B and H-shares using EGARCH and DCC-EGARCH models. The North American Journal of Economics and Finance 2020, 54, 101096. [Google Scholar] [CrossRef]
- Yadav, N.; Singh, A.B.; Tandon, P. Volatility spillover effects between Indian stock market and global stock markets: A DCC-GARCH model. FIIB Business Review 2023, p. 23197145221141186.
- Pirzado, A.A.; Qureshi, N.A.; Jaoti, I.K.; Arain, K.; Buriro, R.A. MODELLING THE CONDITIONAL CO-MOVEMENTS OF PAKISTAN AND INTERNATIONAL STOCK MARKETS.
- Joyo, A.S.; Lefen, L. Stock market integration of Pakistan with its trading partners: A multivariate DCC-GARCH model approach. Sustainability 2019, 11, 303. [Google Scholar] [CrossRef]
- Umer, U.M.; Coskun, M.; Kiraci, K. Time-varying return and volatility spillover among eagles stock markets: A multivariate garch analysis. Journal of Finance and Economics Research 2018, 3, 23–42. [Google Scholar] [CrossRef]
- Andersen, T.G.; Davis, R.A.; Kreiß, J.P.; Mikosch, T.V. Handbook of financial time series; Springer Science & Business Media, 2009.
- Boţoc, C.; others. Univariate and bivariate volatility in Central European stock markets. Prague Economic Papers 2017, 26, 127–141.
- Banumathy, K.; Azhagaiah, R. Modelling Stock Market Volatility: Evidence from India. Managing Global Transitions: International Research Journal 2015, 13. [Google Scholar]
- Zhong, Y.; Liu, J. Correlations and volatility spillovers between China and Southeast Asian stock markets. The Quarterly Review of Economics and Finance 2021, 81, 57–69. [Google Scholar] [CrossRef]
- Ampountolas, A. The effect of COVID-19 on cryptocurrencies and the stock market volatility: a two-stage DCC-EGARCH model analysis. Journal of Risk and Financial Management 2023, 16, 25. [Google Scholar] [CrossRef]
- Nguyen, T.N.; Phan, T.K.H.; Nguyen, T.L. Financial contagion during global financial crisis and covid–19 pandemic: The evidence from DCC–GARCH model. Cogent Economics & Finance 2022, 10, 2051824. [Google Scholar]
- Seth, N.; Panda, L. Time-varying Correlation between Indian Equity Market and Selected Asian and US Stock Markets. Global Business Review 2020, 21, 1354–1375. [Google Scholar] [CrossRef]
- Singhal, S.; Ghosh, S. Returns and volatility linkages between international crude oil price, metal and other stock indices in India: Evidence from VAR-DCC-GARCH models. Resources Policy 2016, 50, 276–288. [Google Scholar] [CrossRef]
- Lin, B.; Wesseh Jr, P.K.; Appiah, M.O. Oil price fluctuation, volatility spillover and the Ghanaian equity market: Implication for portfolio management and hedging effectiveness. Energy Economics 2014, 42, 172–182. [Google Scholar] [CrossRef]
- Katzke, N.; others. South African Sector Return Correlations: using DCC and ADCC Multivariate GARCH techniques to uncover the underlying dynamics. South African Sector Return Correlations: using DCC and ADCC Multivariate GARCH techniques to uncover the underlying dynamics 2013, pp. 10–17.
- Shiferaw, Y.A. Time-varying correlation between agricultural commodity and energy price dynamics with Bayesian multivariate DCC-GARCH models. Physica A: Statistical Mechanics and Its Applications 2019, 526, 120807. [Google Scholar] [CrossRef]
- Sharma, A.; Seth, N. Literature review of stock market integration: a global perspective. Qualitative Research in Financial Markets 2012, 4, 84–122. [Google Scholar] [CrossRef]
- Engle, R.F. Autoregressive conditional heteroscedasticity with estimates of the variance of United Kingdom inflation. . Econometrica: Journal of the econometric society 1982, pp. 987–1007.
- Najeeb, S.F.; Bacha, O.; Masih, M. Does heterogeneity in investment horizons affect portfolio diversification? Some insights using M-GARCH-DCC and wavelet correlation analysis. Emerging Markets Finance and Trade 2015, 51, 188–208. [Google Scholar] [CrossRef]
- Peters, T. Forecasting the covariance matrix with the DCC GARCH model; Matematisk statistik, Stockholms universitet, 2008.
- Ahmad, W.; Sehgal, S.; Bhanumurthy, N. Eurozone crisis and BRIICKS stock markets: Contagion or market interdependence? Economic Modelling 2013, 33, 209–225. [Google Scholar] [CrossRef]
- Liu, X.; Shehzad, K.; Kocak, E.; Zaman, U. Dynamic correlations and portfolio implications across stock and commodity markets before and during the COVID-19 era: A key role of gold. Resources Policy 2022, 79, 102985. [Google Scholar] [CrossRef] [PubMed]
- Bauwens, L.; Laurent, S.; Rombouts, J.V. Multivariate GARCH models: a survey. Journal of applied econometrics 2006, 21, 79–109. [Google Scholar] [CrossRef]
- Tsay, R.S. Multivariate time series analysis: with R and financial applications; John Wiley & Sons, 2013.
- Tsay, R.S. An introduction to analysis of financial data with R; John Wiley & Sons, 2014.
- Buriev, A.A.; Dewandaru, G.; Zainal, M.P.; Masih, M. Portfolio diversification benefits at different investment horizons during the Arab uprisings: Turkish perspectives based on MGARCH–DCC and wavelet approaches. Emerging Markets Finance and Trade 2018, 54, 3272–3293. [Google Scholar] [CrossRef]
- Saiti, B.; Noordin, N.H. Does Islamic equity investment provide diversification benefits to conventional investors? Evidence from the multivariate GARCH analysis. International Journal of Emerging Markets 2018, 13, 267–289. [Google Scholar] [CrossRef]
- Valaskova, K.; Gajdosikova, D.; Lazaroiu, G. Has the COVID-19 pandemic affected the corporate financial performance? A case study of Slovak enterprises. Equilibrium. Quarterly Journal of Economics and Economic Policy 2023, 18, 1133–1178. [Google Scholar] [CrossRef]
- Bhattacharjee, A.; Nandy, M.; Lodh, S. COVID-19 and persistence in the stock market: a study on a leading emerging market. Journal of Disclosure and Governance 2024, pp. 1–12.
- Song, W.; Park, S.Y.; Ryu, D. Dynamic conditional relationships between developed and emerging markets. Physica A: Statistical Mechanics and its Applications 2018, 507, 534–543. [Google Scholar] [CrossRef]
- Yilmaz, K. Return and volatility spillovers among the East Asian equity markets. Journal of Asian Economics 2010, 21, 304–313. [Google Scholar] [CrossRef]
- Nagy, M.; Valaskova, K.; Kovalova, E.; Macura, M. Drivers of S&P 500’s Profitability: Implications for Investment Strategy and Risk Management. Economies 2024, 12, 77. [Google Scholar] [CrossRef]
Figure 1.
Time plot of daily adjusted close price series.
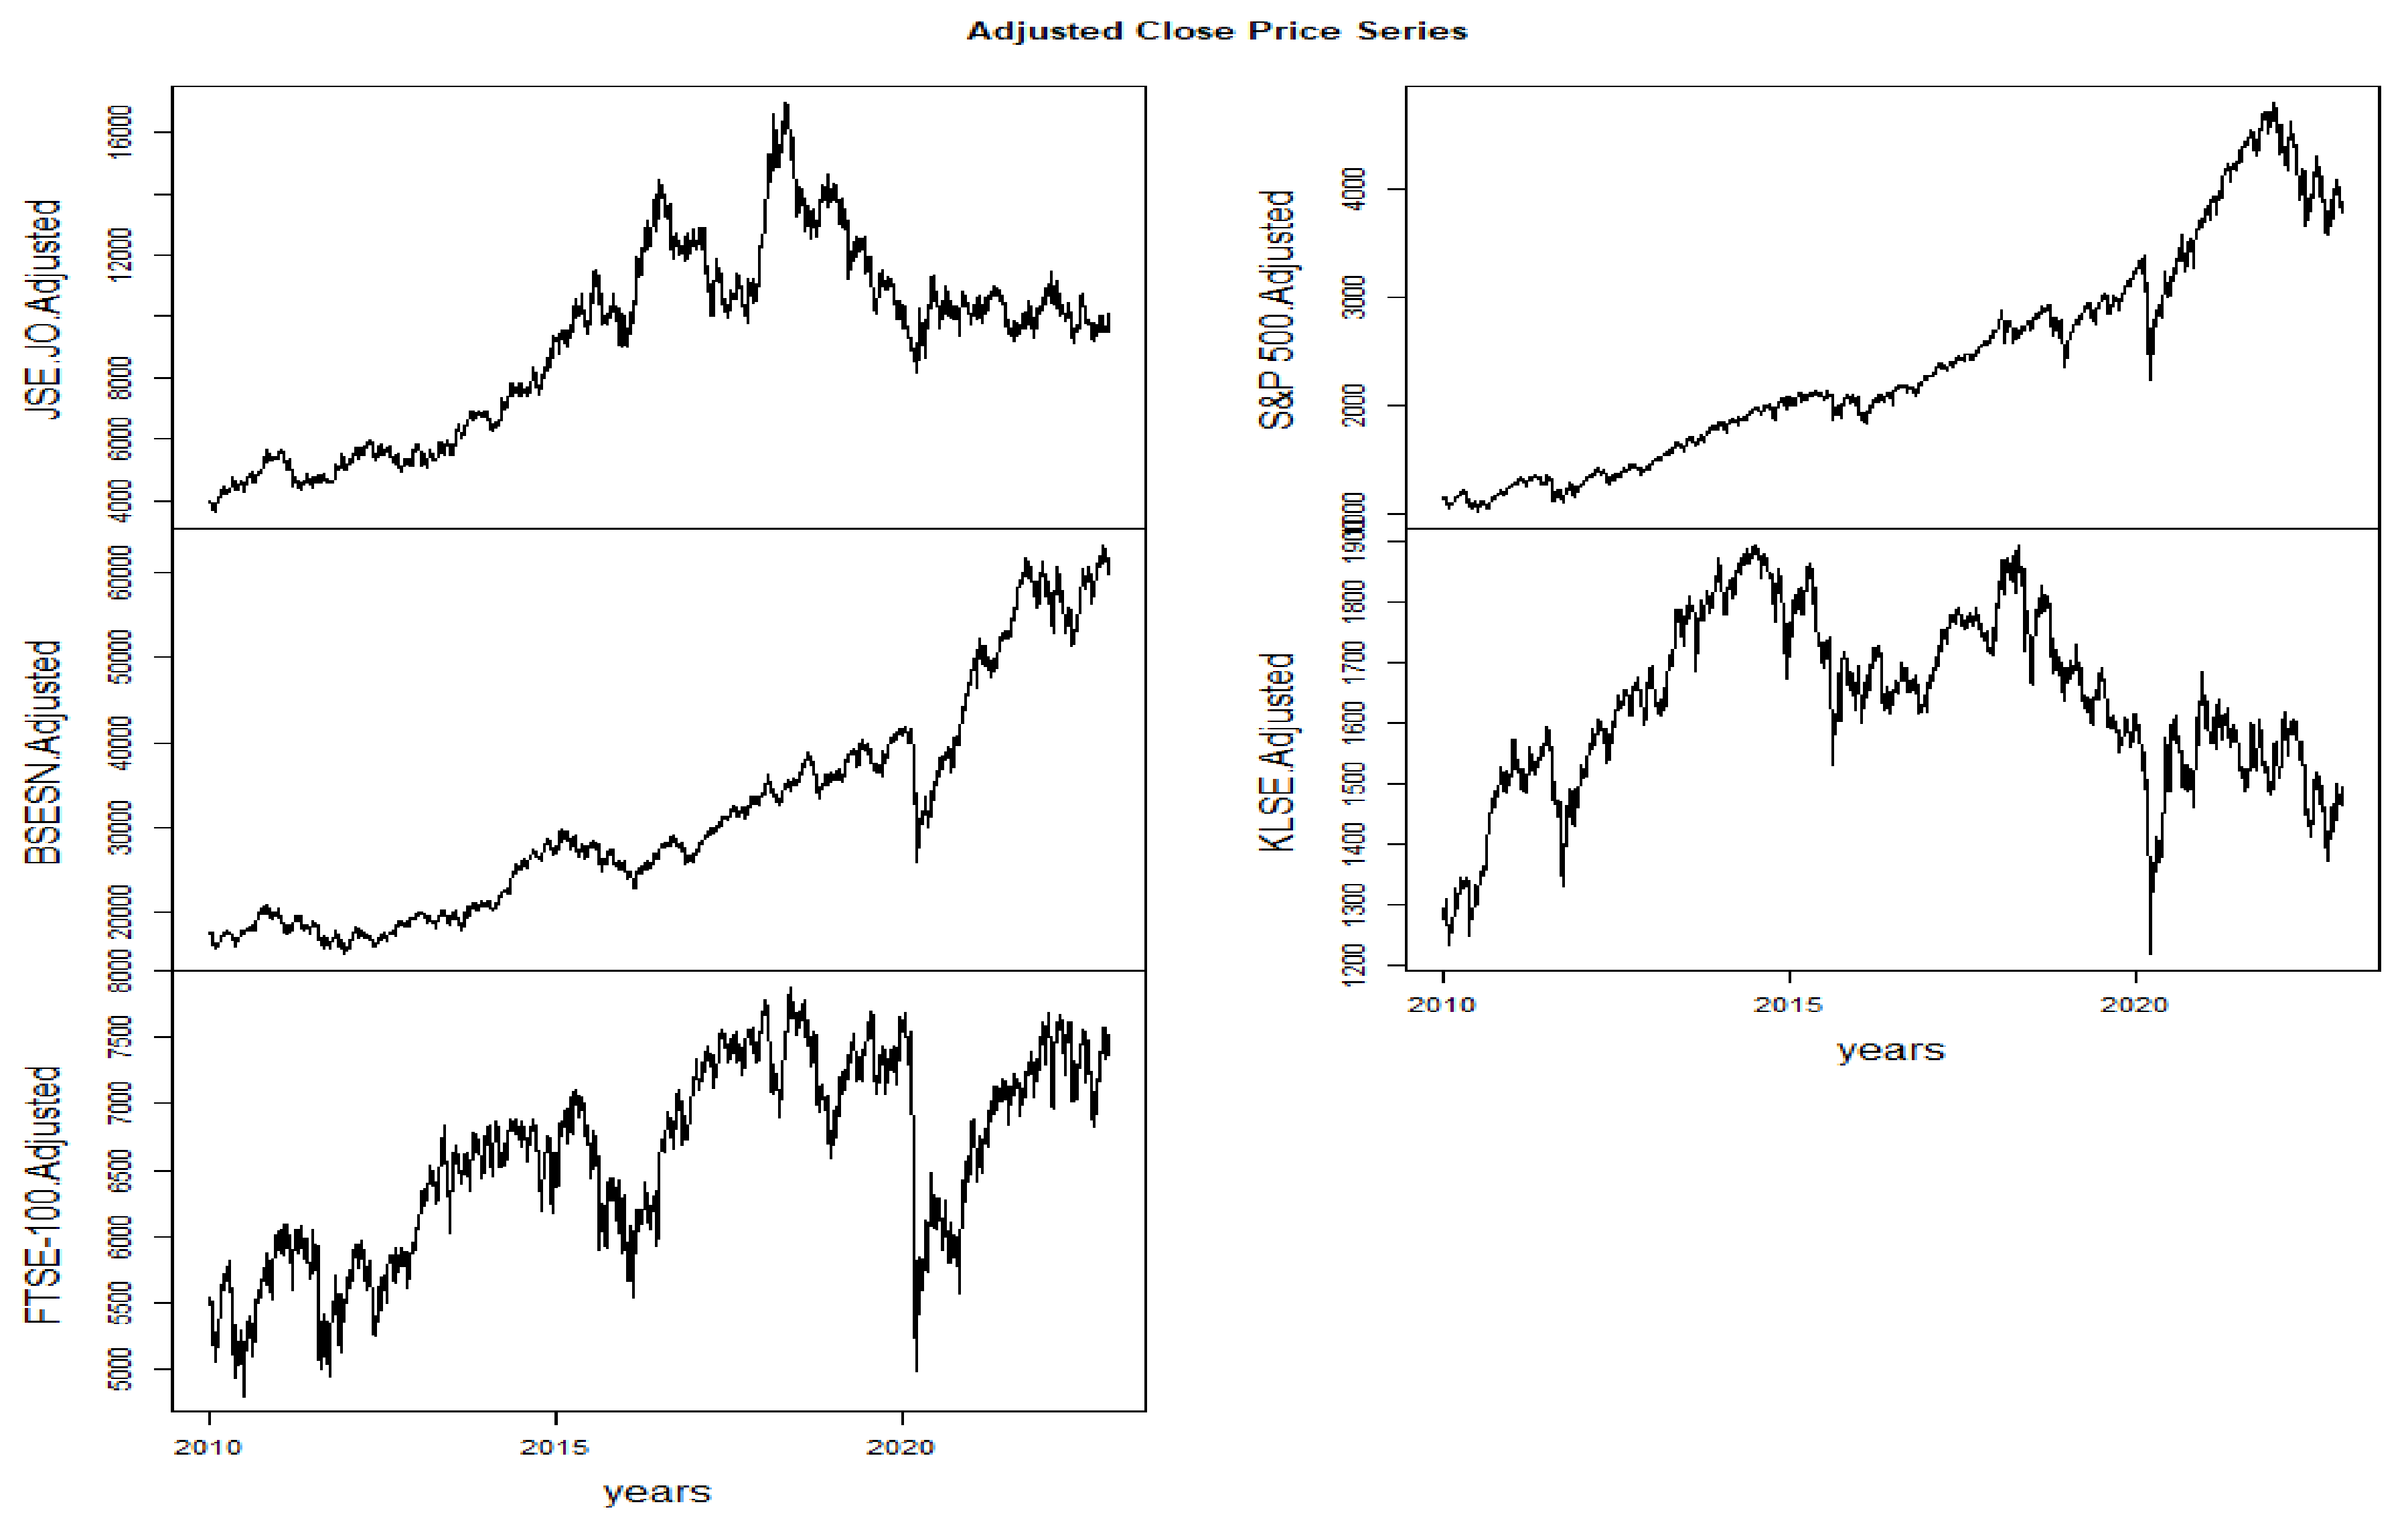
Figure 2.
Time plot of log return series.
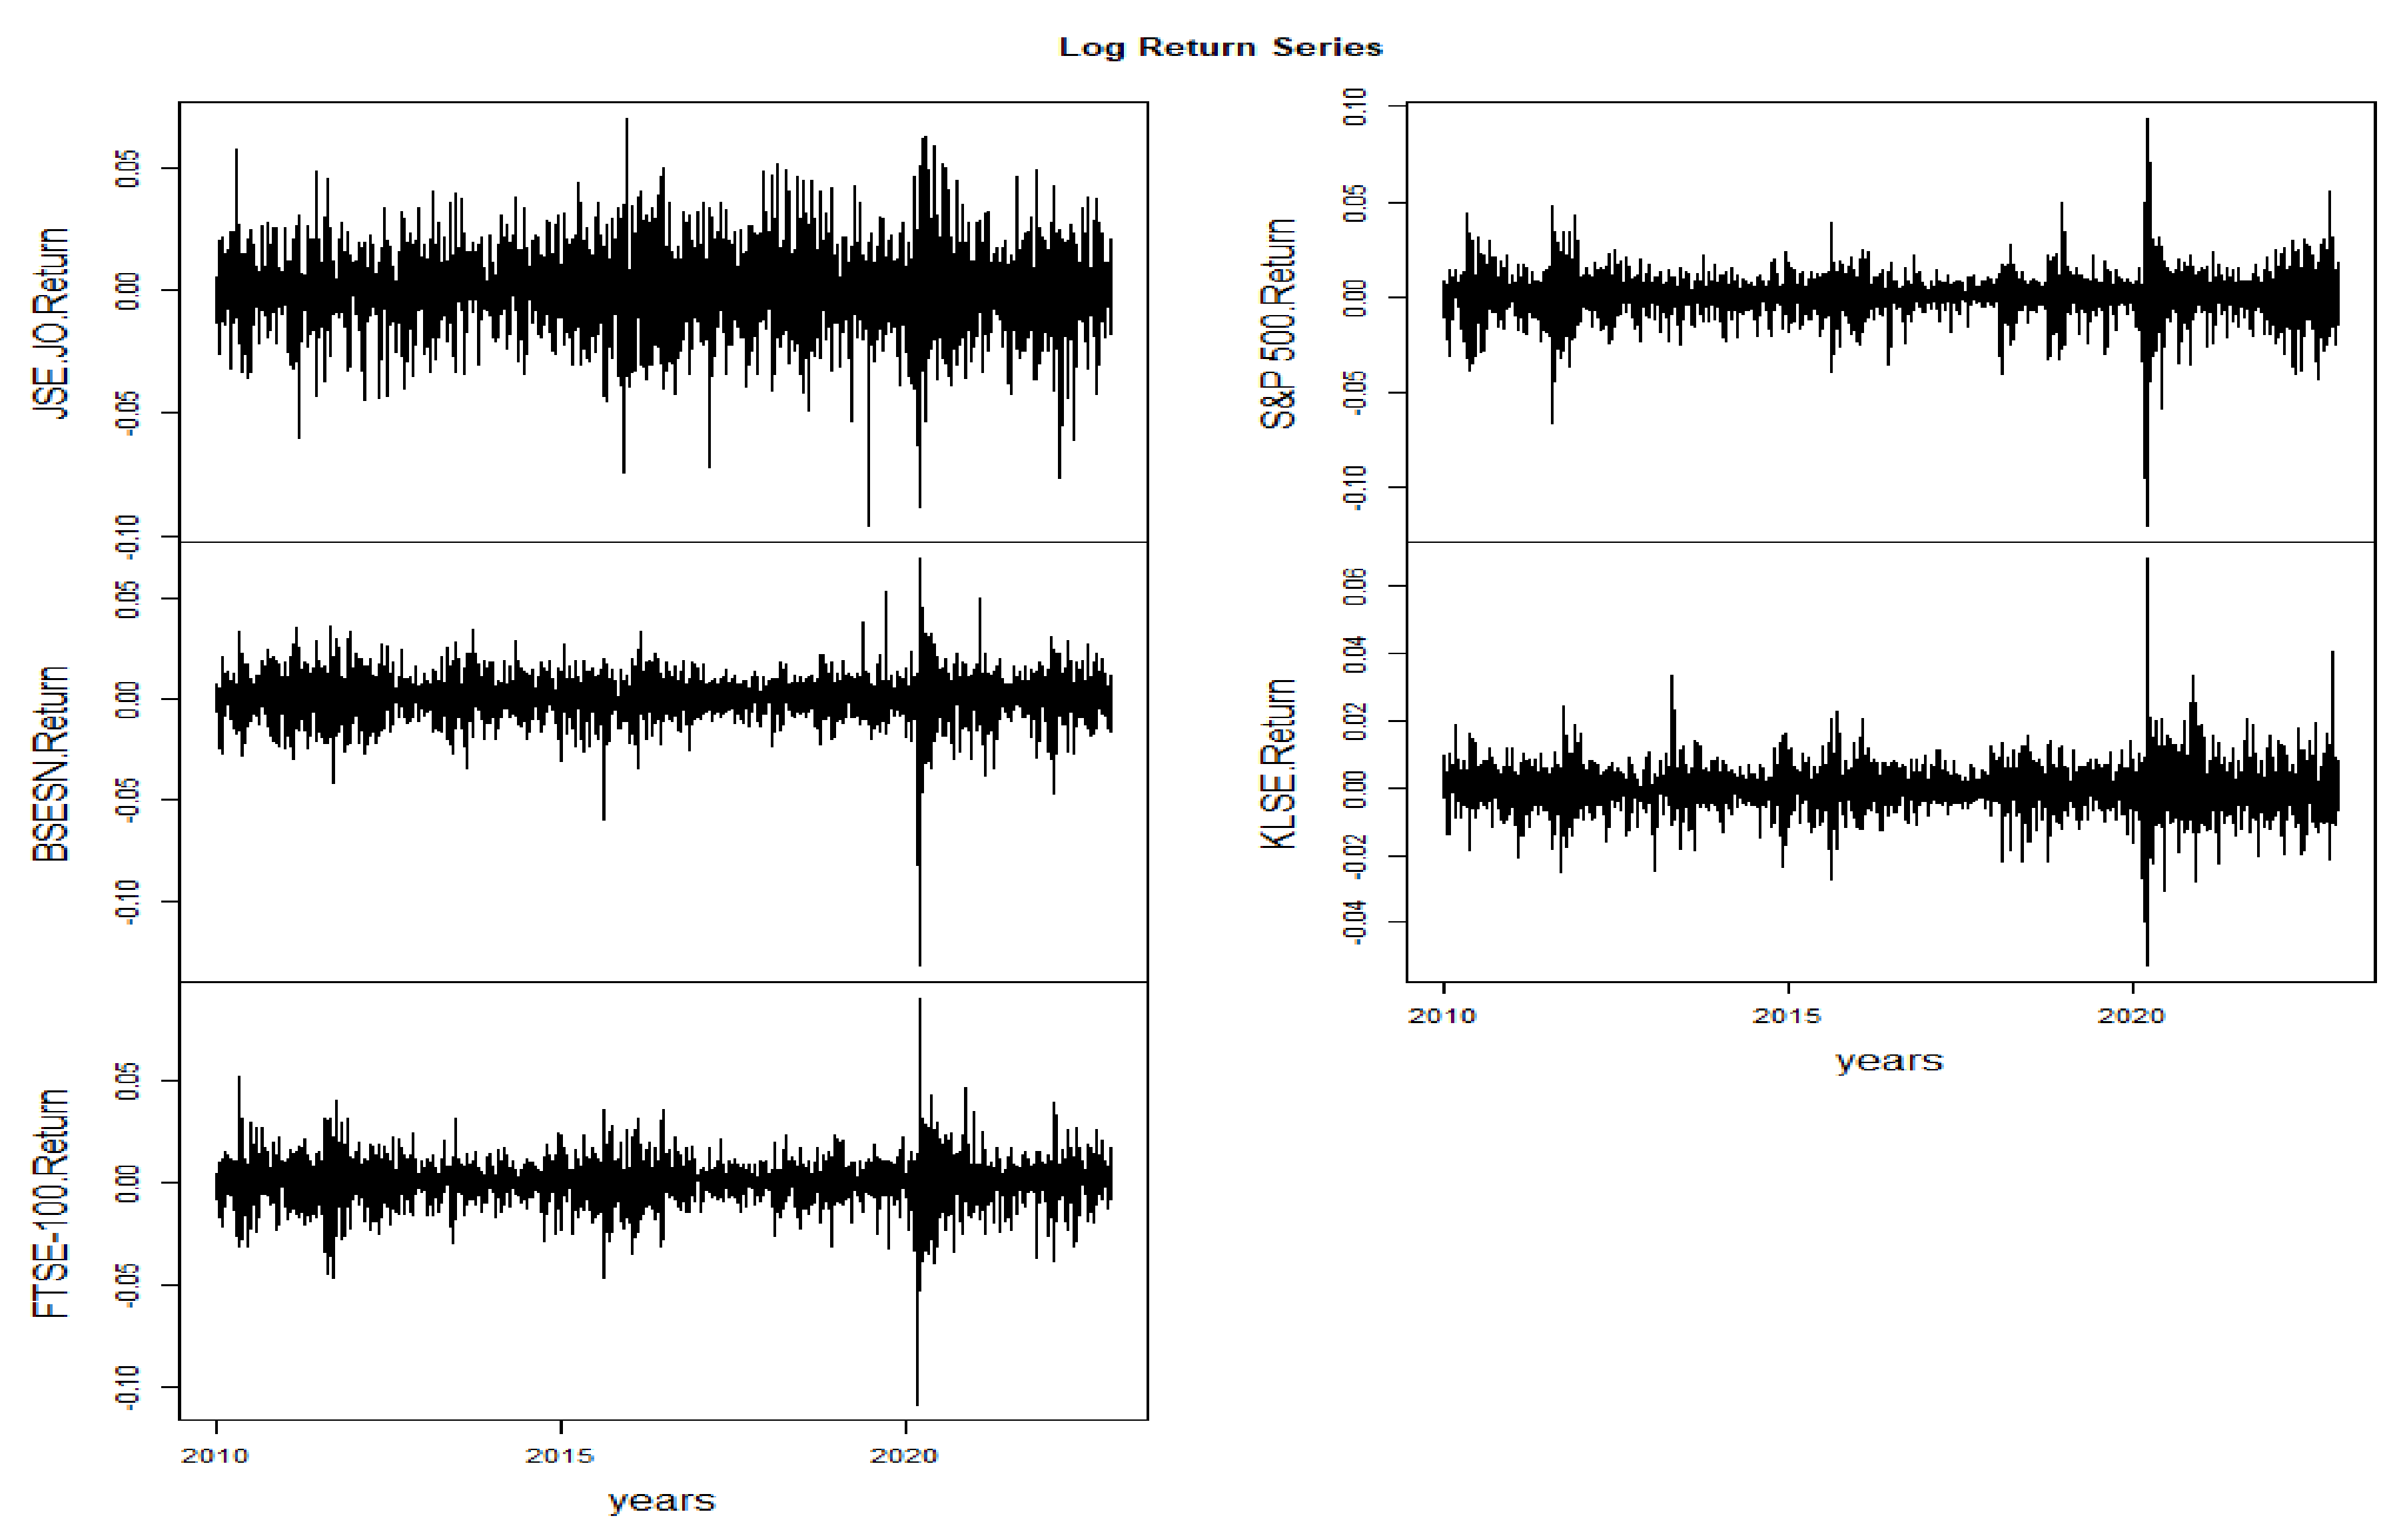
Figure 3.
(a) Conditional volatility for the Stock markets. (b) Conditional correlation between JSE.JO stock markets and its partners.
Figure 3.
(a) Conditional volatility for the Stock markets. (b) Conditional correlation between JSE.JO stock markets and its partners.
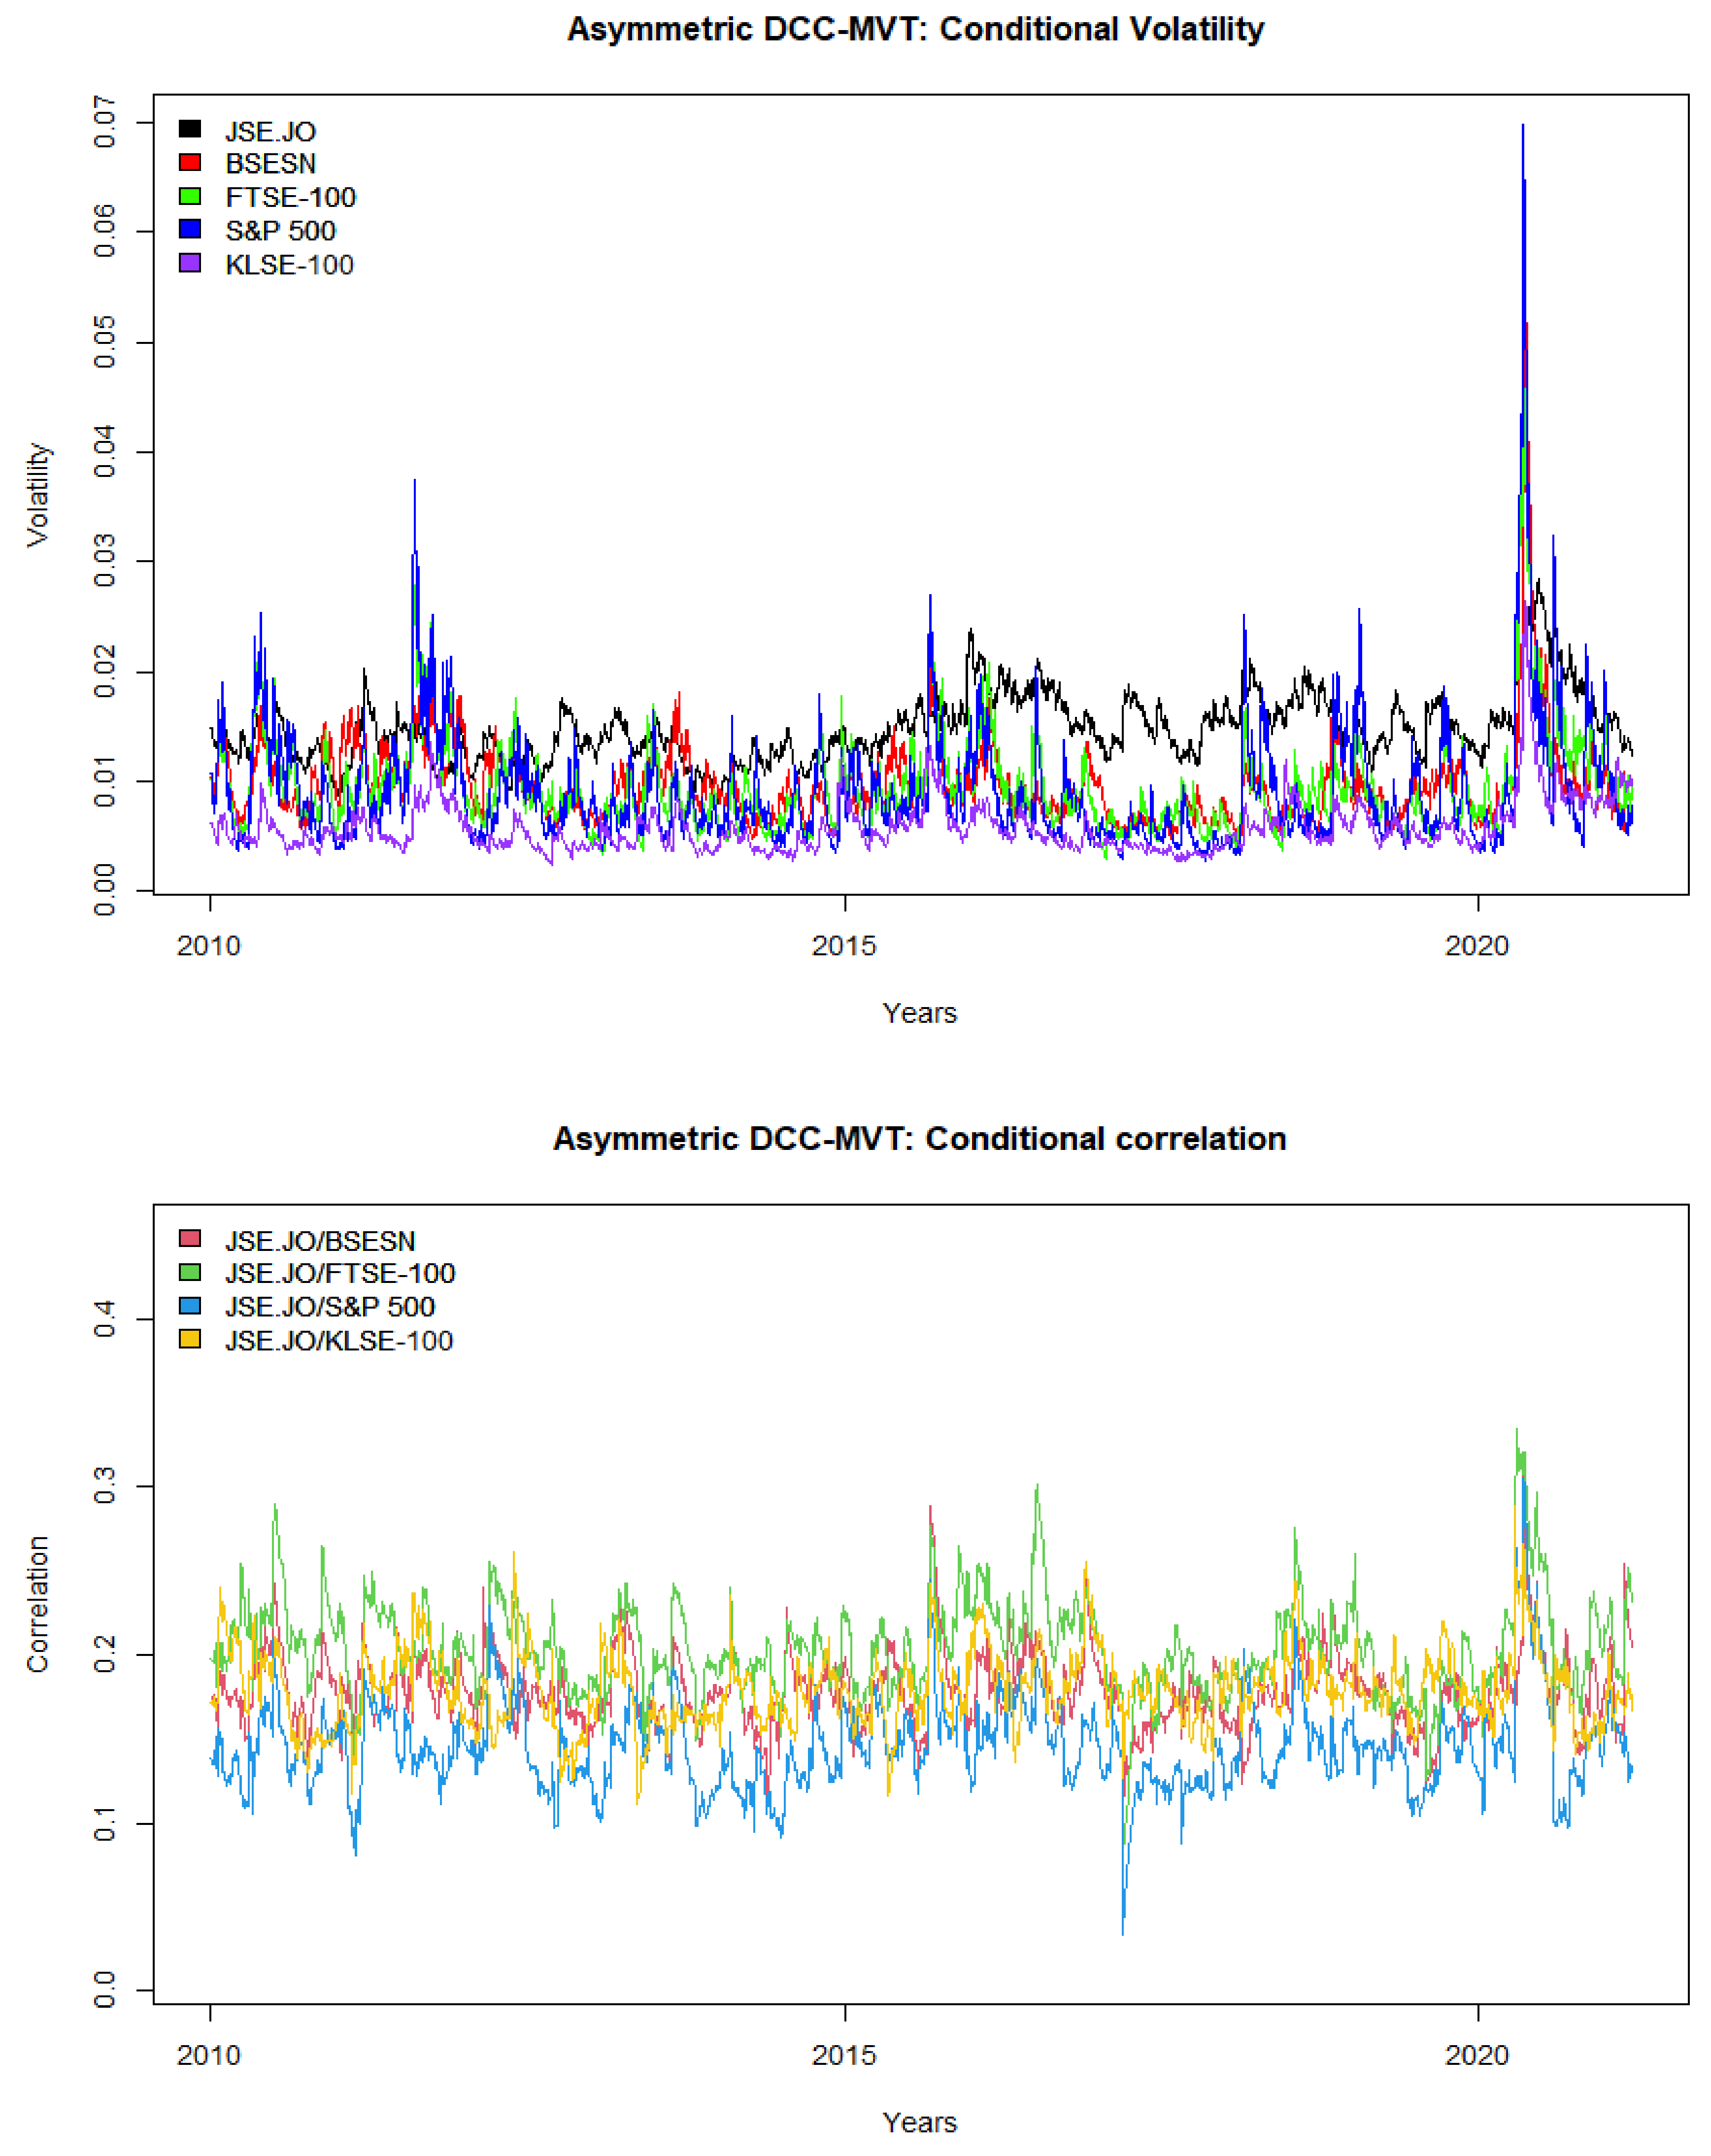
Figure 4.
Fitted and forecast conditional correlation between JSE.JO stock market of South Africa and its partners. The green line is the unconditional correlation estimated by the model. The blue line is the fitted conditional correlation, and the red is the conditional correlation that the model forecasts.
Figure 4.
Fitted and forecast conditional correlation between JSE.JO stock market of South Africa and its partners. The green line is the unconditional correlation estimated by the model. The blue line is the fitted conditional correlation, and the red is the conditional correlation that the model forecasts.
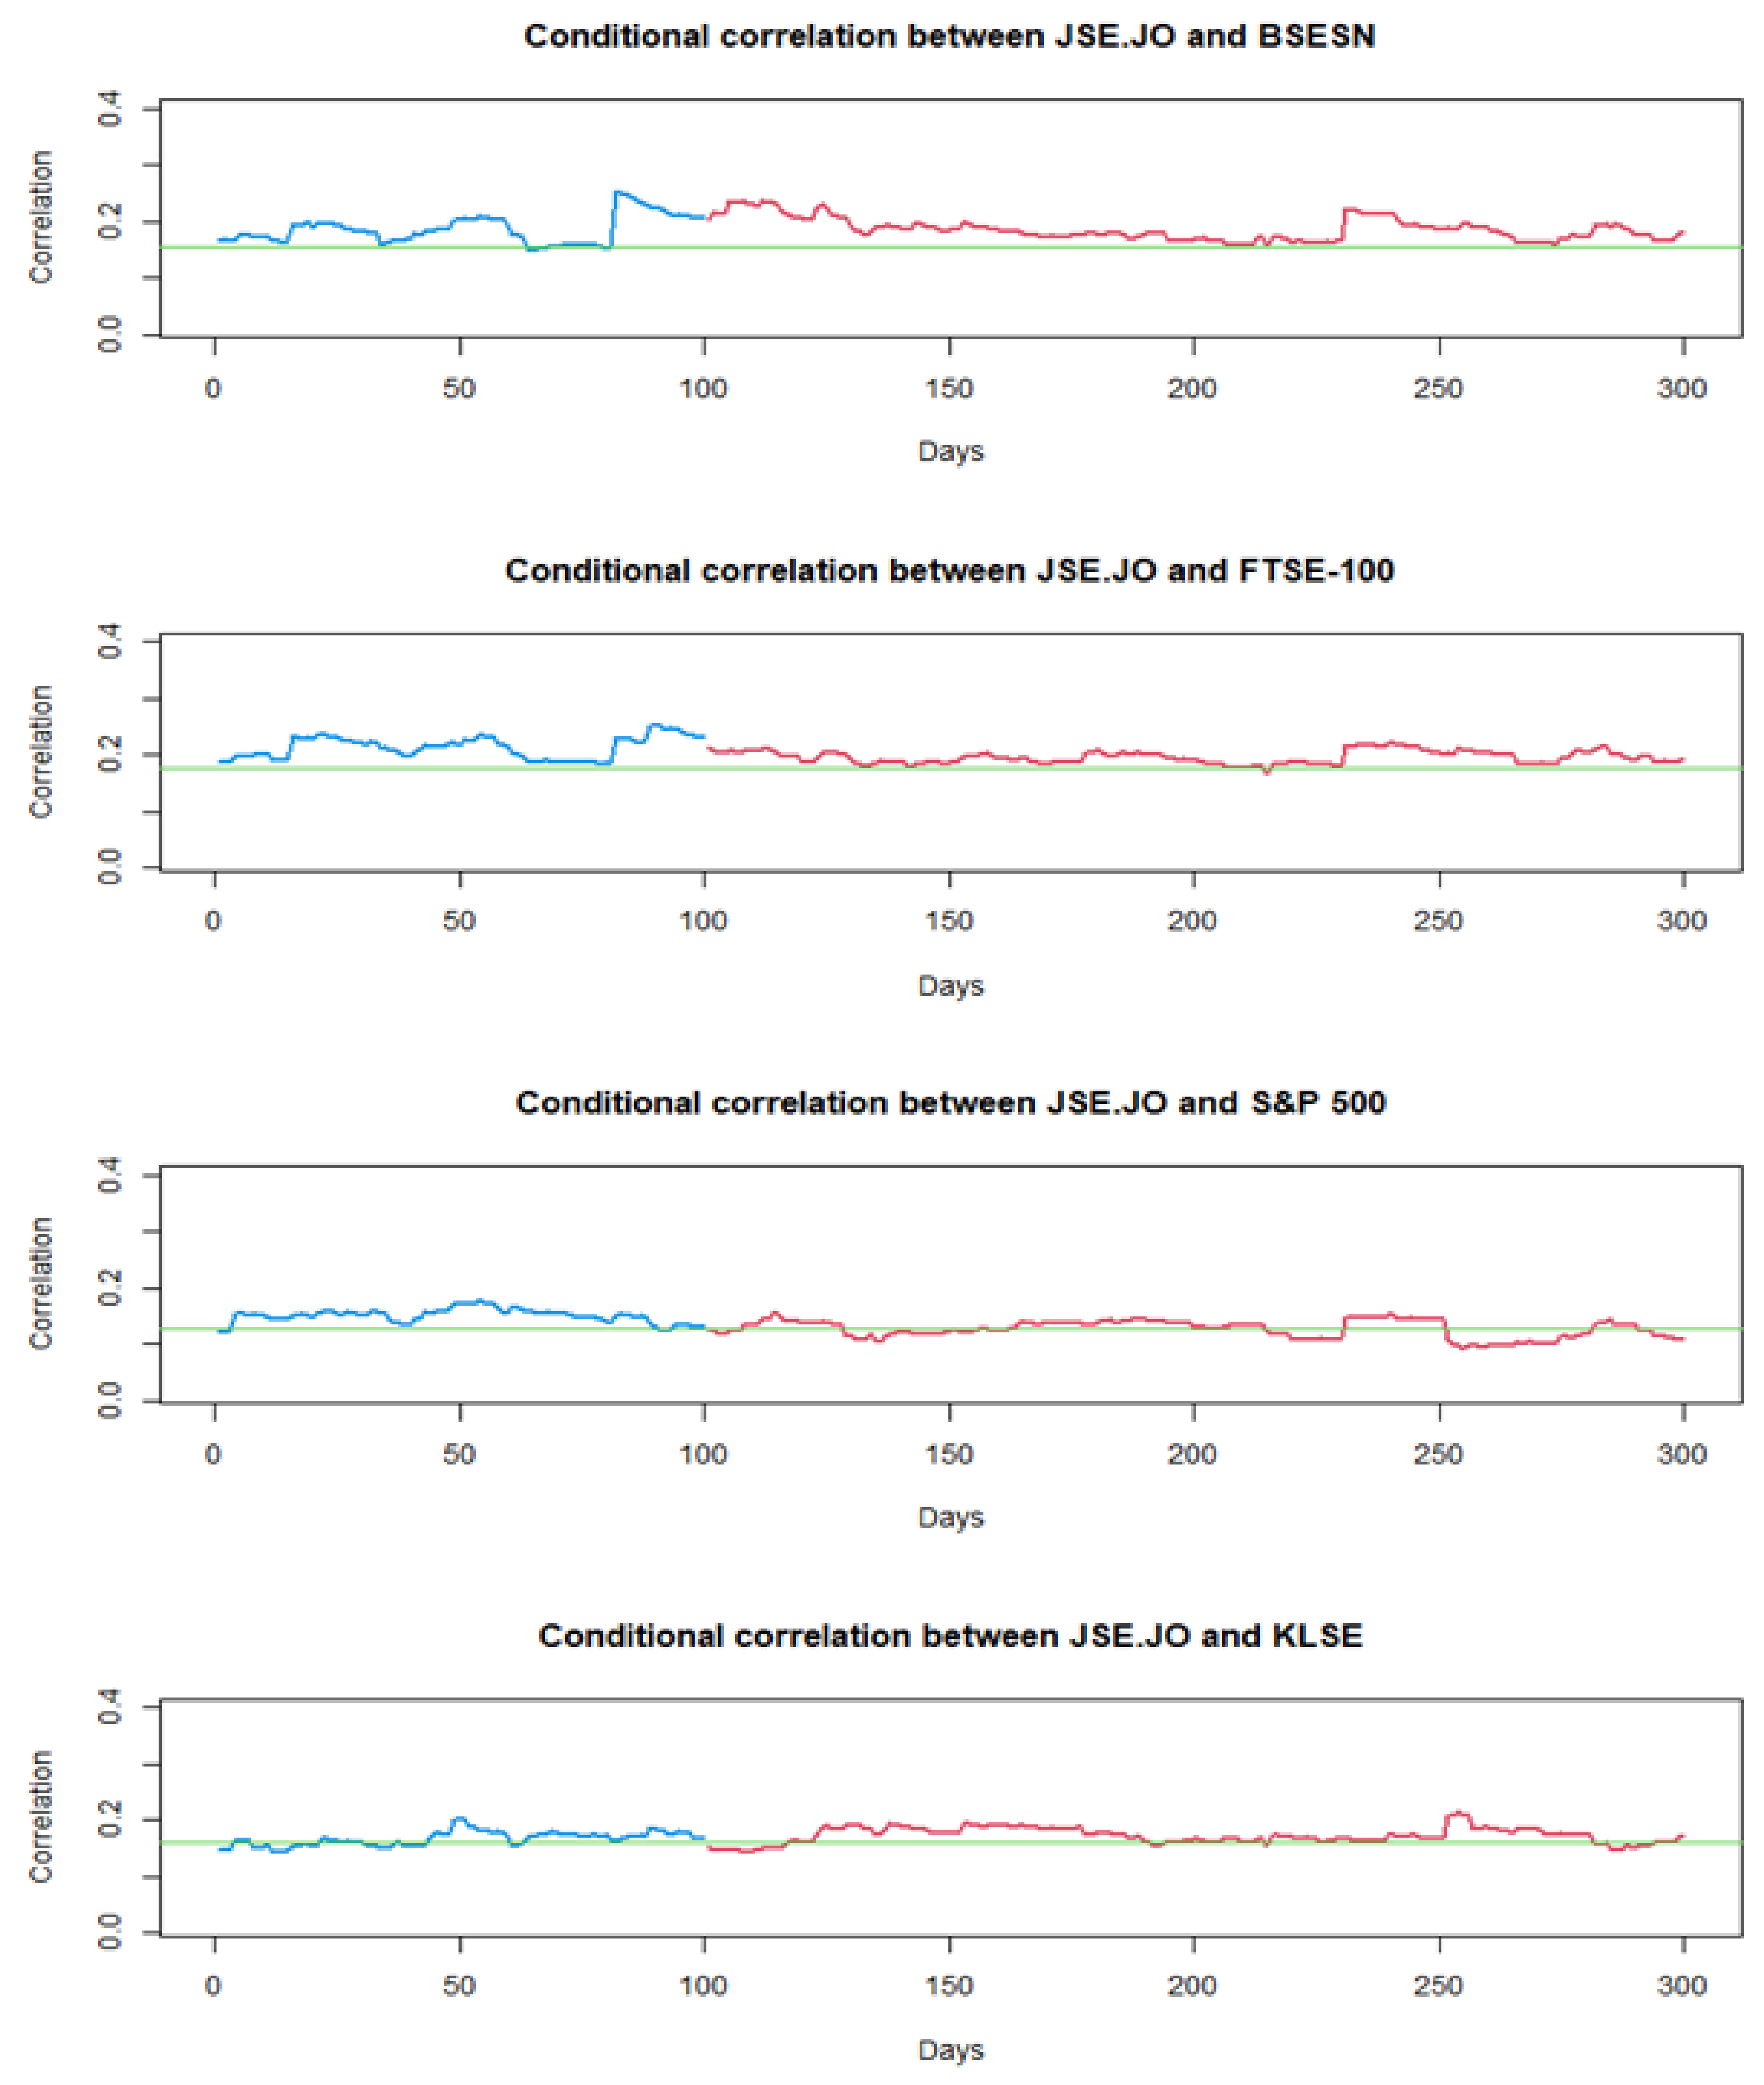

Table 1.
Summary of descriptive statistics of return series.
| Stock Market | No. of obs | Min | Max | Mean | Std | Skewness | Kurtosis | Statistic | p-value |
|---|---|---|---|---|---|---|---|---|---|
| JSE.JO | 3396 | -0.09569 | 0.07001 | 0.000386 | 0.014853 | -0.1455 | 5.730 | 1066.595 | <0.05 |
| BSESN | 3396 | -0.13153 | 0.06980 | 0.000419 | 0.010310 | -0.8641 | 15.853 | 23799.128 | <0.05 |
| FTSE-100 | 3396 | -0.10874 | 0.09053 | 0.000140 | 0.010017 | -0.4928 | 12.265 | 12283.849 | <0.05 |
| S&P 500 | 3396 | -0.11984 | 0.09383 | 0.000420 | 0.010943 | -0.5043 | 16.168 | 24678.412 | <0.05 |
| KLSE | 3396 | -0.05261 | 0.06851 | 0.000067 | 0.006330 | -0.0544 | 12.030 | 11539.456 | <0.05 |
Table 2.
Correlation coefficients for the stock markets.
| Stock market | JSE.JO | BSESN | FTSE-100 | S&P 500 | KLSE |
| JSE.JO | 1 | 0.1820 | 0.2253 | 0.1474 | 0.1624 |
| BSESN | 1 | 0.4563 | 0.3051 | 0.3764 | |
| FTSE-100 | 1 | 0.5840 | 0.2806 | ||
| S&P 500 | 1 | 0.1322 | |||
| KLSE | 1 |
Table 3.
ARCH effect test (volatility test).
| Test | Test Statistic | p-value |
|---|---|---|
| Langrange Multiplier Test | 5332.461 | <0.05 |
| Ljunk-Box Test | 11299.34 | <0.05 |
| Rank-based Test | 1891.802 | <0.05 |
| Robust Test (5%) | 2000.2 | <0.05 |
Table 4.
Information Criteria for DCC models.
| Criteria/ Parameters | DCC (MVLAPLACE) | DCC (MVT) | aDCC (MVLAPLACE) | aDCC (MVT) |
|---|---|---|---|---|
| No. of parameters | 45 | 40 | 46 | 42 |
| AIC | -34.07941 | -34.31268 | -34.08033 | -34.31424 |
| BIC | -33.98639 | -34.22999 | -33.98524 | -34.26473 |
Table 5.
Asymmetric DCC model coefficients and log-likelihood values.
| Coefficient | DCC-MVL | aDCC-MVL | DCC-T | aDCC-T |
|---|---|---|---|---|
| a | 0.00728*** | 0.00579*** | 0.00544** | 0.00438** |
| b | 0.96525*** | 0.95889*** | 0.96805*** | 0.95322*** |
| g | 0.00522 | 0.00692* | ||
| Log Likelihood | 49238.63 | 49240.95 | 49570.35 | 49628.46 |
*: 10% level of significance, **: 5% level of significance, ***: 1% level of significance.
Table 6.
Rank of estimated unconditional volatilities.
| Rank | Countries | Indexes | Unconditional volatility |
| 1 | USA | S&P 500 | 0.9984 |
| 2 | South Africa | JSE.JO | 0.9970 |
| 3 | Malaysia | KLSE-100 | 0.9638 |
| 4 | India | BSESN | 0.9126 |
| 5 | UK | FTSE-100 | 0.9109 |
Table 7.
Asymmetric DCC estimated unconditional correlations between the stock markets.
| Stock market | JSE.JO | BSESN | FTSE-100 | S&P 500 | KLSE |
|---|---|---|---|---|---|
| JSE.JO | 0.9970 | ||||
| BSESN | 0.1545 | 0.9126 | |||
| FTSE-100 | 0.1787 | 0.3384 | 0.9109 | ||
| S&P 500 | 0.1278 | 0.2507 | 0.5351 | 0.9984 | |
| KLSE | 0.1592 | 0.2778 | 0.2219 | 0.1348 | 0.9638 |
Disclaimer/Publisher’s Note: The statements, opinions and data contained in all publications are solely those of the individual author(s) and contributor(s) and not of MDPI and/or the editor(s). MDPI and/or the editor(s) disclaim responsibility for any injury to people or property resulting from any ideas, methods, instructions or products referred to in the content. |
© 2024 by the authors. Licensee MDPI, Basel, Switzerland. This article is an open access article distributed under the terms and conditions of the Creative Commons Attribution (CC BY) license (http://creativecommons.org/licenses/by/4.0/).
Copyright: This open access article is published under a Creative Commons CC BY 4.0 license, which permit the free download, distribution, and reuse, provided that the author and preprint are cited in any reuse.


