Submitted:
19 September 2024
Posted:
19 September 2024
You are already at the latest version
Abstract
This study introduces a novel predictive model for atomization droplet size, developed through comprehensive data collected under elevated temperature and pressure conditions using a twin swirl airblast nozzle. The model, grounded in flow instability theory, has been meticulously parameterized using the Particle Swarm Optimization (PSO) algorithm. Through rigorous analysis, including analysis of variance (ANOVA), the model has demonstrated robust reliability and precision, with a maximum relative error of 19.3% and an average relative error of 6.8%. Compared to the classical atomization model by Rizkalla and Lefebvre, this model leverages theoretical insights and incorporates a range of interacting variables, enhancing its applicability and accuracy. Spearman correlation analysis reveals that air pressure and the air pressure drop ratio significantly negatively impact droplet size, whereas the fuel-air ratio (FAR) shows a positive correlation. Experimental validation at ambient conditions shows that the model is applicable with a reliability threshold of ≥0.13 and highlight the predominance of the pressure swirl mechanism over aerodynamic atomization at higher fuel flow rates (q > 1.25 kg/h). This research effectively bridges theoretical and practical perspectives, offering critical insights for the optimization of airblast nozzle design.
Keywords:
Twin swirl airblast nozzle
; Sauter mean diameter
; Atomization
; Prediction model
; Elevated conditions
1. Introduction
Modern aeroengines predominantly utilize liquid fuels due to their exceptional energy density per unit volume. The efficient atomization and subsequent evaporation of liquid fuel are critical for combustion [1,2,3]. As performance demands on combustion chambers increase, it has become evident that conventional single-pressure swirl nozzles are increasingly inadequate. This limitation has prompted the development and widespread adoption of airblast nozzles, which combine a pressure swirl nozzle or a prefilming nozzle with multiple concentric swirlers. These advanced nozzles leverage aerodynamic forces to achieve superior atomization and rapid air-fuel mixing [4,5,6,7,8,9].
Extensive research has been conducted on the flow field structure, spray distribution, and atomized particle size of twin swirl airblast nozzles, offering essential insights for nozzle design [10,11,12,13,14,15,16,17,18,19,20]. The particle size of atomized liquid fuel has been identified as a vital factor, with a direct impact on ignition and extinction performance, combustion efficiency and outlet temperature distribution. A thorough examination of the literature on the subject of atomization particle size reveals a clear focus on the question of its determinants [21,22,23]. The geometric parameters of the nozzle have a direct impact on the atomization particle size [24,25,26]. More studies, however, focus on the operating conditions. In particular, air velocity and pressure is of great importance due to its impact on aerodynamic forces, thereby playing a crucial role in airblast atomization dynamics [27]. Viscosity, a critical property of fuel, is significantly influenced by temperature and plays a crucial role in the break-up mechanism [28,29,30]. Mir et al. have conducted a comprehensive analysis of the interplay between multiple influencing variables, which encompass air-to-liquid ratio, pressure drop ratio, and surface tension etc., providing valuable insights for guiding engineering applications [31].
The Sauter mean diameter (SMD) is a commonly employed metric for assessing the quality of atomization, as it provides an indication of the surface area of liquid fuel particles of equal mass. A variety of approaches have been employed for the purpose of predicting the SMD, including the utilization of numerical simulation methods [32,33,34,35]. Furthermore, some studies have integrated theoretical analysis with experimental techniques. For example, Liu ed al. [36] introduced the finite stochastic breakage model (FSBM), which offers a novel perspective on atomization mechanisms. Other researchers, including Senecal et al. [37], Su et al. [38] and Reitz et al.[39], have simplified the atomization process to a two-dimensional planar problem, developing theoretical models based on flow instability theory and validating their models through experimental data. Their studies have provided researchers with robust mathematical frameworks, enhancing the capability for in-depth analysis of atomization mechanisms and the development of atomization models [40,41,42,43]. Chen et al.[21] and Rizkalla et al.[27] develop a comprehensive multi-factor model for predicting SMD based on extensive experimental data, respectively. Although these model offers several advantages, including simplicity and high accuracy, they lack a detailed representation of atomization mechanisms and provides limited physical insight.
The combustion chamber of an aeroengine, distinguished by its confined space, extreme temperatures, pressures, and high-velocity flows, exhibits complex flow characteristics that are significantly different from ambient conditions. The research conducted by Zhang et al.[44] and Varga et al.[45], which closely simulates extreme conditions, reveals that the aerodynamic Weber number is the primary factor determining atomization droplet size. The Varga’s finding indicates that the breakup mechanism of liquid jets in high-speed air flows is analogous to that of droplets subjected to sudden exposure to high-speed gas streams. Given the difficulties inherent in spray testing under elevated pressure, there is a dearth of experimental research on atomization particle size in pressurized environments. It is noteworthy that there is a limited number of studies providing data on droplet sizes under heating and pressurization conditions, such as those by Rizkalla [27] and Zheng [46]. This scarcity underscores the urgent need for a comprehensive modeling study that examines droplet size in twin swirl airblast nozzles operating under heated and pressurized conditions, encompassing various influencing factors.
This study adopted a combined method of theoretical analysis and atomization experiments to investigate the prediction model of nozzle atomization particle size. The primary goal of the present paper is to establish a physics-based prediction model for the atomization particle size of twin swirl airblast nozzles operating under pressurized conditions. Comprehensive effects of various factors, including air pressure, temperature, pressure drop ratio, fuel properties, and fuel-to-air ratio, on the atomization particle size of kerosene have been obtained. Notably, the maximum air pressure reached up to 0.8 MPa. Furthermore, a thorough evaluation of the rationality and applicability of the prediction model is conducted.
2. Experimental Setup
2.1. Test System
The schematic diagram of the experimental system is illustrated in Figure 1. Air is supplied by an adjustable air compressor, with its flow rate measured by a vortex shedding flowmeter, achieving an accuracy of 1%. Downstream of the flowmeter, the air is heated by an electric heater. The air temperature is measured using a K-type thermocouple at the inlet measurement section, with an error margin of 1°C. The air pressure is also monitored via a total pressure sensor at the inlet measurement section, ensuring a pressure measurement error of 1%. To determine the pressure drop ratio across the airblast nozzle, differential pressure is measured between two pressure sensors located at the inlet measurement and outlet measurement sections. The pressure drop ratio, mathematically denoted as , is recognized as intimately linked to air flow velocity and has been studied as a crucial parameter influencing atomized particle size. In the outlet measurement section, water spray nozzles are used to cool down the mixture, facilitating the sedimentation of fuel components within it. Prior to discharge, the liquid phase is separated by a cyclone separator.
The Chinese RP-3 aviation kerosene is being used in the experiment. The fuel supply is facilitated by a plunger pump, and its mass flow rate is precisely measured by a Coriolis flowmeter, with an error margin of 0.5%. The fuel-to-air ratio (FAR) is determined with an error of 1.12%. Prior to the experiment, a temperature-controlled cabinet, capable of accommodating 8 liters of fuel, is preset to the desired temperature. Upon activation of the fuel pump, the pre-heated fuel is smoothly propelled into the nozzle. To effectively reduce heat exchange between the incoming hot air and the fuel within the test chamber’s fuel line, multiple layers of thermal insulation envelop the exterior of the fuel line. The fuel temperature measurement point is strategically located at the terminus of the fuel line, ensuring proximity to the nozzle outlet as feasible as possible.
The twin swirl airblast nozzle is illustrated in Figure 2. The nozzle is composed of a central pressure swirl nozzle, a two-stage air swirler, a Venturi tube, and a sleeve. The Venturi tube has an outlet diameter of 13.20 mm, while the sleeve features an initial diameter of 15.20 mm, a length of 6.40 mm, and a half-cone angle of 14°. The primary swirler is designed with eight slanted apertures, each with a diameter of 2.2 mm, while the secondary swirler incorporates ten radial vortex channels. The Swirl Number (SN), a quantitative measure of the swirl intensity generated by the swirler, is calculated for radial swirlers in accordance with the methodology originally developed by Sheen et al. [47].
where is axial velocity; is the tangential velocity; and is the outer radius of the Venturi exit. The SN of the inner and outer swirlers is 1.800 and 1.146, respectively.
The Malvern laser particle size analyzer, utilizing a 638 nm laser with 20 mW power and a 15 mm beam diameter, is designated for precise measurement of spray particles diameters from 0.1 μm to 2080 μm. Strategically placed on either side of a viewing window, the analyzer aligns its laser’s central axis 30 mm downstream of the nozzle outlet, perpendicular to the fuel spray cone’s central axis, as depicted in Figure 2. Leveraging laser diffraction, it efficiently captures scattering patterns from the beam traversing the sample, facilitating particle size determination. When confronted with large sample volumes, this methodology surpasses phase Doppler particle analyzer (PDPA) systems in terms of efficiency and convenience. Notably, the SMD represents the diameter of a sphere that mirrors the same volume-to-surface-area ratio as the particle distribution. It is calculated based on the particle size probability density function, denoted by the symbol f(D):
Prior to the initiation of the experiments, the Malvern instrument undergoes a thorough calibration process to ensure that the particle size measurement error is maintained below 1%. Subsequently, multiple tests are conducted for each operating condition, and the final results are averaged across these tests, aiming at mitigating the influence of random errors and enhancing the accuracy of the outcomes.
2.2. Experimental Condition
The experimental design encompasses a comprehensive range of conditions based on the operational range and pre-experimental data outlined in Table 1. The study specifically investigates seven intake air pressure settings (0.1 MPa, 0.2 MPa, 0.25 MPa, 0.3 MPa, 0.4 MPa, 0.45 MPa, 0.5 MPa), three swirler pressure drop ratio conditions (2%, 4%, 6%), and five air temperature settings (303 K, 340 K, 350 K, 410 K, 450 K). Furthermore, four fuel temperature conditions (301 K, 316 K, 331 K, 346 K) and three FAR conditions (0.02, 0.04, 0.06) are subjected to examination. Taking into account the cross-effects of these parameters on the atomization particle size, 40 experimental conditions are designed, as presented in Table 1. It is noteworthy that the prediction model for particle size is calibrated based on data from these 40 experimental conditions. Additionally, several additional conditions are designed in subsequent research to evaluate the applicability of the model, with the actual maximum air pressure reaching up to 0.8 MPa.
3. Semi-Empirical Prediction Model for SMD
3.1. Atomization Process of Twin Swirl Airblast Nozzle
The atomization process within a twin swirl airblast nozzle is distinguished by a complex interplay of flow and fragmentation dynamics. In the initial phase, fuel is expelled from the pressure swirl nozzle, with a portion of it impacting and fragmenting into droplets upon collision with the surface of the venturi. The remaining fuel adheres to the venturi wall. The fuel that adheres to the wall is subsequently discharged as a liquid film at the venturi exit. The liquid film then undergoes interactions with the surrounding gas, resulting in the induction of Kelvin-Helmholtz instabilities and Rayleigh-Taylor ring waves on its surface, which are influenced by inertial centrifugal forces. Concurrently, the film is subjected to shear and disruptive forces from the high-speed swirling air generated by the dual-stage swirlers. The combined effect of these factors results in the fragmentation of the liquid film into liquid belts, thereby initiating the primary stage of atomization. As these liquid belts progress downstream, aerodynamic forces exert further deformation and fragmentation, ultimately resulting in the formation of fine liquid droplets through secondary atomization.
In the context of this study, which was conducted under conditions of elevated temperature and pressure, the aerodynamic influence of swirling air plays a pivotal role in the atomization process. Accordingly, the theoretical modelling presented herein focuses on the analysis of the liquid film in proximity to the venturi outlet, deliberately excluding a detailed examination of the pressure swirl nozzles and the film-forming flow along the venturi wall. The impact of droplet clustering resulting from collisional fragmentation at the wall surface will be addressed in future work through the optimization of relevant parameters.
3.2. Semi-Empirical Prediction Models
In the atomization process of a twin swirl airblast nozzle, the liquid film of fuel ejected through the venturi is fragmented into liquid belts as a result of surface instabilities and aerodynamic shear forces. In a two-dimensional planar analysis, the dimensions of these liquid belts are primarily determined by the wavelength of the surface waves at rupture [37] and the thickness of the liquid film [48]. In light of the fact that the maximum unstable wave number is directly correlated with the wavelength, dimensionless parameters are assessed on the basis of the maximum unstable wave number at rupture and the liquid film thickness. Although the aerodynamic impact is clearly significant, it is also considered in order to enhance the overall understanding of the atomization process.
Firstly, a two-dimensional viscous jet liquid film with a thickness of 2h is considered, being injected into a static inviscid unpressurized air medium with a velocity of . The liquid film has a density of , a kinematic viscosity of ,and a surface tension coefficient of . The density of the air is . The liquid kinematic viscosity is defined as . The surface wave dispersion equations for a high-speed viscous jet are mainly based on the study of Senecal [37].
where the complex growth rate , wave number , represents the surface wave wavelength, , represents the ratio of gas-liquid density. High-speed jet conditions surface waves will be dominated by short waves , that is , so you can get the simplified solution of the equation (3):
When has a maximum value , the liquid film ruptures. At this time there is a corresponding maximum unstable wave number and maximum unstable wavelength , which satisfies .
The form of the solution of Equation (4) under the inviscid condition is deterministic:
Let be obtained:
Since the analytical solution of Equation (6) is too complex to be used for modelling, the model with viscous conditions is constructed on the basis of Equations (5) and (6):
Considering the thickness at the liquid film breakup, the model of Xiao’s [25] mass conservation is chosen:
While t is the fuel film thickness at the outlet of the venturi, the relation can be obtained from Kim’s [49] equation:
The is the fuel pressure meets . The is pressure swirl nozzle diameter. The semi liquid fog cone angle θ can be referred to Lefebvre’s [6] results:
They can be roughly assumed:
Han’s [41] research has:
It can be obtained by making , where denotes the effective area of the nozzle:
Summarizing, the size model of the liquid blocks formed by the breaking of the liquid film is consistent with :
Then it can be obtained:
In the preceding discussion, the stationary air environment was considered due to the inherent difficulty of solving control equations for viscous jets subjected to high-velocity air. The complex swirling flow generated by the swirler represents an additional challenge in deriving analytical solutions for these equations. Consequently, the impact of the swirling airflow is examined from a macroscopic standpoint. Figure 3a demonstrates a notable power function relationship, and linearization yields a Pearson’s correlation coefficient of r = -0.882 (b).
This indicates a robust correlation between the Weber number (We), which characterizes the air-liquid interaction, and the SMD. Consequently, a dimensionless number is introduced to directly represent the aerodynamic impact.
Based on Equation (16) the following three dimensionless factors can be extracted:
In addition, because the dimensionless factor will form the model as a product of power functions, the relationship between air density and fuel density is already included. Also, for the sake of simplicity and unity of the model, the density ratio q is not included as a factor in the model.
Build the model as follows:
Dombrowski and Johns’ study [50] has:
The is the Ohnesorge number. Because of the significant positive correlation between SMD and the initial size of droplets formed by the breaking of liquid belts, and also for ease of differentiation, SMD is rewritten by substituting (22):
Similarly, they can be obtained by changing into :
where the four A, B, C, D are coefficients to be determined .
4. Evaluation of the Model
4.1. The Validation of the Predictive Model
Based on Equations (23) to (25) and using the 40 experimental data sets listed in Table 1, the four unknown coefficients were determined in Table 2 through optimization via the Particle Swarm Optimization (PSO) algorithm.
In an ideal scenario, model residuals should exhibit a normal distribution of random variation, which can be attributed to the experimental process. In order to assess the validity of the model, a normal probability plot of the residuals was constructed. Figure 4a illustrates this plot for the SMD residuals, with data points situated within the 0.95 confidence interval and exhibiting a distribution that closely aligns with a normal distribution. This conformity provides evidence that the predictive model is valid.
In order to ascertain whether the model is subject to any systematic influence as a result of the sequence of experimental runs, an examination was conducted of the relationship between model residuals and run order. Figure 4b illustrates the correlation between the SMD residuals and the order of the experimental runs. The analysis indicates the absence of significant grouping or discernible trends, thereby suggesting that the residuals are not subject to any systematic effects resulting from the sequence of runs.
In order to evaluate the efficacy of the regression model, residuals for the SMD were plotted against the corresponding experimental SMD values. This plot allows for a visual assessment of the model’s unbiasedness and adherence to constant error assumptions. Figure 4c illustrates that the data points are randomly distributed around the horizontal line (residual value = 0), which indicates the absence of systematic bias. The predictions neither consistently exceed nor fall below the experimental values. Furthermore, the residuals do not display a notable trend with increasing experimental values, indicating that the error variance remains constant and thus satisfying the assumption of homoskedasticity in regression analysis. Furthermore, the absence of a discernible pattern in the residuals serves to confirm the suitability of the predictive model.
Figure 4d presents a linear plot of model predictions in comparison to experimental values. The plot demonstrates that all model predictions fall within a relative error band of 19.3%, with an average relative error of 6.8%. These findings corroborate those of the analysis of variance (ANOVA) section, indicating that the prediction model is an accurate estimator of the SMD.
It is crucial to assess the predictive model’s performance on operating points that lie outside the training set but within the operational range. This allows for the assessment of overfitting, the model’s generalization capability, and its overall reliability. Overfitting occurs when a model captures noise rather than the underlying data patterns, which renders it ineffective if it performs well on the training set but fails to generalize to new data. The model was evaluated using six data sets from Table 3 as the test set. As illustrated in Figure 5, the model exhibits optimal performance on the test set, with no indication of overfitting and robust generalization capabilities, thereby confirming its reliability. Moreover, the results of tests 1 and 3 in Table 3 demonstrate that the model retains its robustness in high-temperature and high-pressure conditions, thereby extending its applicability beyond the original training data.
4.2. Comparison with Other SMD Prediction Model
The study by Rizkalla and Lefebvre [27], which incorporated multiple influencing factors into a pneumatic atomization prediction model and performed experimental validation under heated and pressurized conditions, provides a suitable basis for comparison with the prediction model developed in this work.
The coefficients F and G for both models are determined using PSO algorithm to complete the respective models. For clarity, the model developed in this study is designated as the ‘Pre’ model, while the model (26) investigated by Rizkalla and Lefebvre is referred to as the ‘R-L’ model.
Figure 6 elucidates two salient issues pertaining to the residual distributions of the ‘R-L’ model. Firstly, the residual values demonstrate a decreasing trend as the true SMD increases, thereby exhibiting a clear negative correlation. Secondly, the residuals are predominantly positive when the true SMD is below 15 and predominantly negative when it exceeds 15 . These issues, analogous to those identified in the ‘Pre’ model in the preceding section, indicate the presence of substantial systematic errors in both models. In light of these findings, it can be concluded that the current model structures are unsuitable for the study presented here.
Figure 7 illustrates the normal probability distributions for the ‘R-L’ model, accompanied by a 0.95 confidence interval that is consistent with the findings for the ‘Pre’ model. However, it should be noted that not all data points lie within the confidence interval boundaries. Furthermore, the overall slope of the data points is steeper than that of the reference line, indicating the presence of outliers and a skewed data distribution. In comparison to Figure 4, this suggests that the ‘R-L’ model’s validity is questionable, while the ‘Pre’ model exhibits markedly superior performance.
The data presented in Figure 8a,b demonstrate that the ‘Pre’ model exhibits a lower relative prediction error and higher prediction accuracy in comparison to the ‘R-L’ model. In particular, the ‘Pre’ model demonstrates superior performance to the classical ‘R-L’ model in regression analysis, offering a significant improvement in the precision of SMD forecasting.
The preceding analysis indicates that the overall performance of the “R-L” model is suboptimal. In consideration of the preceding research by Rizkalla and Lefebvre on this model [51], the issues can be broadly attributed to two main categories. Firstly, the structure of the “R-L” model was not derived from theoretical analysis, but rather based on empirical data. Secondly, the experimental setup did not take into account the interactions between the experimental variables. This reliance on empirical data has resulted in structural deficiencies in the model, which has led to poor performance in multivariate predictions. In contrast, the model presented in this study, “Pre” is derived from theoretical foundations and incorporates aspects of the Design of Experiments (DOE) methodology in its experimental design, thereby accounting for the interactions between variables.
4.3. The Spearman Analysis of the Experimental Variables.
Spearman’s rank correlation analysis was employed to examine the relationship between the SMD and the experimental variables. As illustrated in Figure 9, the analysis reveals that the swirler pressure drop ratio exerts the most substantial influence on SMD, followed by inlet air pressure. These findings are in accordance with those of previous aerodynamic modelling, which indicate that both pressure drop ratio and inlet pressure are negatively correlated with the atomized SMD. An increase in swirler pressure drop ratio has a significant effect on airflow velocity, which in turn enhances the interaction between the gas and liquid phases, thereby reducing the SMD. This process can be characterized by the dimensionless number .
The impact of fuel temperature on atomization, as a consequence of its influence on fuel viscosity and surface tension, has been the subject of considerable debate in the literature [28,29,30]. The intake air temperature exerts an indirect influence on the physical properties of the fuel by modifying the ambient temperature during atomization. Although the effect of inlet air temperature is relatively minor, it affects gas density primarily through the mechanisms of heat transfer. The aforementioned temperature variation exerts an influence on fuel temperature during the atomization process, thereby enhancing evaporation pressure within the fine droplets. As a result, these effects play a significant role in droplet evaporation, which in turn leads to a reduction in the SMD.
In the experiment, the FAR was controlled by maintaining a constant airflow while varying the fuel mass rate. In these circumstances, the unchanging airflow ensures that the aerodynamic forces remain relatively stable. The increase in fuel flow rate enhances the fuel jet’s resistance to aerodynamic breakup while simultaneously increasing the spatial density of droplets, thereby raising the probability of droplet collision and coalescence. Consequently, there is a positive correlation between the SMD and the FAR, as indicated by a positive Spearman correlation coefficient. In the study by Lefebvre [6], a constant fuel flow rate was maintained while varying the air intake to adjust the fuel-air ratio, resulting in outcomes comparable to those presented here. This phenomenon can be approximately characterized by the ratio . The relationship between aerodynamic effects and fuel flow rate will be discussed in further detail in the following section.
The predictive model not only accurately captures the qualitative effects of each experimental variable on the SMD but also exhibits a strong correlation with the experimental data. This agreement serves to reinforce the model’s robust physical properties and its reliability in reflecting the underlying phenomena.
4.4. The Discussion at Ambient Temperature and Pressure Conditions
Figure 9 demonstrates that the predictive model “Pre” markedly overestimates the impact of pressure drop ratio across the swirl injector. When considered alongside the parameters of We from Table 2, this suggests a robust inverse relationship between SMD and We in the present predictive model. It is anticipated that these issues will significantly impair, or even render unsuitable, the performance of the model under standard ambient conditions (101 KPa, 295 K).
As previously discussed, the ratio is employed as a preliminary indicator of the relationship between aerodynamic effects and fuel flow rate. Figure 10 presents a comparison between experimental and model-predicted values under pressure drop ratio conditions of 3% and 5%. It is observed that when ≥0.13, the discrepancy between the model predictions and experimental values is within an acceptable range, thereby indicating the validity of the model. However, when < 0.13, the experimental values do not diverge with decreasing as the predictions suggest; instead, they exhibit a turning point and a converging trend. In the preceding analysis, the atomization model was simplified under pressurized conditions by neglecting the influence of the central pressure swirl nozzle. However, this simplification is not valid under atmospheric pressure conditions, where the impact of the pressure swirl nozzle becomes critical for maintaining effective atomization. Furthermore, elevated temperatures can facilitate the evaporation of droplet clusters, leading to a slight expansion in the applicability range of the predictive model with respect to .
Lefebvre [6] demonstrated that increasing fuel pressure enhances atomization efficiency in pressure swirl nozzles by increasing the fuel flow rate and thus enhancing the inertial centrifugal forces. Accordingly, the inflection point observed in Figure 10 is attributed to the dominance of the pressure swirl nozzle in atomization. To ascertain the fuel flow rate at which the pressure swirl nozzle becomes the dominant factor in atomization under ambient temperature and pressure conditions, experiments were conducted varying the fuel flow rate under 1%, 3%, and 5% swirler pressure drop ratio conditions, as illustrated in Figure 11. A noteworthy inflection in SMD was observed at a fuel flow rate of q=1.25kg/h. This suggests that, at ambient temperature and pressure, a fuel flow rate of q=1.25kg/h attains a critical fuel pressure, beyond which the rise in SMD due to aerodynamic decay is counterbalanced, and further increases in fuel flow rate result in enhanced atomization.
The twin swirl airblast nozzle, which incorporates both pressure swirl and aerodynamic impact atomization mechanisms, achieves a synergistic enhancement of the respective strengths and weaknesses of each atomization method. This results in superior atomization performance across a broad operational range. Consequently, this type of nozzle is extensively used in aerospace engine combustion chambers to accommodate complex and variable operational environments. Due to the potential issue of viewport contamination under ambient temperature and pressure conditions, this study has conducted only a limited set of experiments to illustrate this phenomenon. Further research is needed to refine predictive models for ambient conditions and to explore the competitive mechanisms between the two atomization modes.
5. Conclusions
This study presents a predictive model for atomization droplet size derived from data collected under conditions of elevated temperature and pressure using a twin swirl airblast nozzle, incorporating multi-parameter cross-influences. The model is founded upon the principles of flow instability theory and has been parameterized with the assistance of the PSO algorithm. The principal conclusions are as follows:
1. The results of the ANOVA indicate that the model structure is both reliable and reasonable, demonstrating high prediction accuracy and robust generalization capabilities. The maximum relative error in predictions is 19.3%, while the average relative error is 6.8%.
2. In comparison to the classic atomization model proposed by Rizkalla and Lefebvre, the model presented here is founded upon theoretical analysis and incorporates the effects of various interacting variables that were considered during the experimental design. This results in superior applicability and precision.
3. The results of the Spearman analysis indicate that the model accurately reflects the qualitative impacts and correlations of variables on atomization droplet size. Among the variables, the most significant negative impact on droplet size is observed for air pressure and air pressure drop ratio, while FAR shows a positive correlation with droplet size.
4. Experiments conducted at ambient temperature and pressure indicate that the model’s applicability falls within the range defined by ≥0.13. The twin swirl airblast nozzle exhibits competing mechanisms of aerodynamic and pressure swirl atomization. At ambient conditions and a fuel flow rate of q>1.25kg/h, the pressure swirl mechanism is observed to predominate over the aerodynamic mechanism.
This study integrates theoretical analysis with experimental data to develop a predictive model that accounts for real-world engineering conditions and the interaction of multiple variables. The findings offer significant insights that can inform the design of airblast nozzle design.
Data availability
The data that support the findings of this study are available from the corresponding author upon reasonable request.
Acknowledgments
The work at Southern University of Science and Technology was financially supported by the National Science and Technology Major Project of China (Grant No. J2019-III-0005-0048, No. J2019-III-0002-0045) and Science, Technology, and Innovation Commission of Shenzhen Municipality (Grant No. ZDSYS20220527171405012).
Declaration of competing interest
The authors declare that they have no known competing financial interests or personal relationships that could have appeared to influence the work reported in this paper.
References
- Bayvel, L. P., and Z. Orzechowski. 1993. Liquid Atomization. Washington, D.C.: Taylor & Francis.
- Birouk, M., and I. Gokalp. 1993. “Current Status of Droplet Evaporation in Turbulent Flows.” Progress in Energy and Combustion Science 32: 408-23.
- Chiu, H. H., and T. M. L1u. 1977. “Group Combustion of Liquid Droplets.” Combustion Science and Technology 17 (3–4): 127–42. [CrossRef]
- Chiu, H. H., H. Y. Kim, and E. J. Croke. 1982. “INTERNAL GROUP COMBUSTION OF LIQUID DROPLETS.” In Spray Combustion 1982, 971-980.
- Glassman, I., and R. A. Yetter. 2008. Combustion. 4th ed. San Diego: Academic Press.
- Lefebvre, A. H. 1989. Atomization and Sprays. London: Hemisphere.
- Lorcher, M., Schmidt, F., & Mewes, D. (2005). Effervescent Atomization of Liquids. *Atomization and Sprays*, 15, 145-168.
- Bachalo, W. D. 2000. “Spray Diagnostics for the Twenty-First Century.” *Atomization and Sprays* 10 (3–5): 439–74. [CrossRef]
- Hong, Yan. 2020. “Review on Fuel Atomization in Aeroengine.” *Journal of Propulsion*. [CrossRef]
- San-Mou Jeng, Nicholas Flohre, and Hukam Mongia. “Swirl Cup Modeling - Part IX: Liquid Atomization Modeling”, 42nd AIAA Aerospace Sciences Meeting and Exhibit (2004).
- HY WANG, VG MCDONELL, and S SAMUELSEN. “Influence of Hardware Design on the Flow Field Structures and the Patterns of Droplet Dispersion: Part I—Mean Quantities”, Journal of Engineering for Power 117.2 (1995): 282-289.
- Rui Ma, Bo Dong, Zhongqiang Yu, Tao Zhang, Yong Wang, and Weizhong Li. “An experimental study on the spray characteristics of the air-blast atomizer”, Applied Thermal Engineering 88. (2015): 149.0-156.0.
- Shanwu Wang, Vigor Yang, George Hsiao, Shihyang Hsieh, and Hukam C Mongia. “Large-eddy simulations of gas-turbine swirl injector flow dynamics”, Journal of Fluid Mechanics 583. (2007): 99-122.
- A. Ateshkadi, V. McDonell, and G. Samuelsen. “Effect of Mixer Geometry on Fuel Spray Distribution, Emissions and Stability”, 36th AIAA Aerospace Sciences Meeting and Exhibit (1998).
- Chaussonnet, G., A. Mueller, S. Holz, R. Koch, and H.-J. Bauer. 2017. “Time-Response of Recent Prefilming Airblast Atomization Models in an Oscillating Air Flow Field.” Journal of Engineering for Gas Turbines and Power 139, no. 12: 1-10.
- Liu, Cunxi. 2012. “Investigations of Spray Characteristics and Optical Measuring Methods for Multi-Swirl Air-Blast Atomizer.” PhD diss., Institute of Engineering Thermophysics, Chinese Academy of Sciences, November.
- Fan, Xiongjie. 2021. “Study on Interaction Mechanism of Aero-Engine Atomizers.” PhD diss., Institute of Engineering Thermophysics, Chinese Academy of Sciences, June.
- Fang, Chuanyu, Yushuai Liu, Shaolin Wang, Cunxi Liu, Fuqiang Liu, Jinhu Yang, Kaixing Wang, Yong Mu, Gang Xu, and Junqiang Zhu. 2023. “Aerodynamic Effect on Atomization Characteristics in a Swirl Cup Airblast Fuel Injector.” Physics of Fluids 35, no. 10. [CrossRef]
- Gurubaran, R. Kumara, R. I. Sujith, and S. R. Chakravarthy. 2008. “Characterization of a Prefilming Airblast Atomizer in a Strong Swirl Flowfield.” Journal of Propulsion and Power 24, no. 5: 1124-1132. [CrossRef]
- Xu, Hang, Zhihui Guo, and Shanjian Gu. 1997. “Spray Characteristics of a New Air-Assisted Atomizer.” Journal of Aerospace Power, July.
- Chen, Longfei, Zhixin Liu, Penghao Sun, and Weiye Huo. 2015. “Formulation of a Fuel Spray SMD Model at Atmospheric Pressure Using Design of Experiments (DoE).” Fuel 153 (August): 355–60. [CrossRef]
- Liu, Hai Feng, Xin Gong, Wei Feng Li, Fu Chen Wang, and Zun Hong Yu. 2006. “Prediction of Droplet Size Distribution in Sprays of Prefilming Air-Blast Atomizers.” Chemical Engineering Science 61 (6): 1741–47. [CrossRef]
- Gao, Zhao, Liu Yuying, Zhang Quan, et al. 2024. “Semi-Theoretical Prediction of SMD for Liquid Spray in Centrifugal Nozzles Based on Instability Theory.” Journal of Aerospace Power. 1-12. Accessed August 29, 2024. [CrossRef]
- Roudini, M., and G. Wozniak. 2018. “Experimental Investigation of Spray Characteristics of Pre-Filming Air-Blast Atomizers.” Journal of Applied Fluid Mechanics 11, no. 6: 1455-1469. [CrossRef]
- Xiao, Wei, and Yong Huang. 2014. “Improved Semiempirical Correlation to Predict Sauter Mean Diameter for Pressure-Swirl Atomizers.” Journal of Propulsion and Power 30, no. 6: 1628-1635. [CrossRef]
- Ronceros Rivas, Julio R., Amilcar Porto Pimenta, Jusceline Sumara Lessa, and Gustavo A. Ronceros Rivas. 2022. “An Improved Theoretical Formulation for Sauter Mean Diameter of Pressure-Swirl Atomizers Using Geometrical Parameters of Atomization.” Propulsion and Power Research 11, no. 2: 240-252. [CrossRef]
- Rizkalla, A. A., and A. H. Lefebvre. 1975. “Influence of Air and Liquid Properties on Airblast Atomization.” Journal of Fluids Engineering 97, no. 3: 316-20.
- Urbán, András, Milan Malý, Viktor Józsa, and Jan Jedelský. 2019. “Effect of Liquid Preheating on High-Velocity Airblast Atomization: From Water to Crude Rapeseed fuel.” Experimental Thermal and Fluid Science 102: 137-151. [CrossRef]
- Moon, Seoksu, Choongsik Bae, Essam F. Abo-Serie, and Jaejoon Choi. 2007. “Internal and Near-Nozzle Flow of a Pressure-Swirl Atomizer Under Varied Fuel Temperature.” Atomization and Sprays 17, no. 6: 529-550. [CrossRef]
- Davanlou, Ashkan, Joshua D. Lee, Saptarshi Basu, and Ranganathan Kumar. 2015. “Effect of Viscosity and Surface Tension on Breakup and Coalescence of Bicomponent Sprays.” Chemical Engineering Science 131: 243-255. [CrossRef]
- Mir, Muhammad Tareq, Reza Alidoost Dafsari, Seungchae Jung, and Jeekeun Lee. 2020. “Effect of the Physical Properties of Liquid and ALR on the Spray Characteristics of a Pre-Filming Airblast Nozzle.” International Journal of Multiphase Flow 126: 103150. [CrossRef]
- Zhang, Qun, Xin Wang, Rui Kou, Chaochao Li, Peng Zhang, Han Hai, Chenghao Li, Fuzheng Yang, Qiang Liu, and Tingting Cao. 2019. “Numerical Study on Pre-Film Atomization Mechanism and Characteristics by a Coaxial Swirl Injector.” Proceedings of the Institution of Mechanical Engineers, Part A: Journal of Power and Energy 233 (8): 1022–38. [CrossRef]
- Holz, Simon, Samuel Braun, Geoffroy Chaussonnet, Rainer Koch, and Hans Jörg Bauer. 2019. “Close Nozzle Spray Characteristics of a Prefilming Airblast Atomizer.” Energies 12 (14). [CrossRef]
- Juan Supervisor, Liu, and Wang Zhenguo. n.d. “Experimental and Numerical Simulation of the Breakup Process of Swirling Conical Liquid Sheet.”.
- Fokaides, P., M. Weiß, M. Kern, and N. Zarzalis. 2009. “Experimental and Numerical Investigation of Swirl Induced Self-Excited Instabilities at the Vicinity of an Airblast Nozzle.” Flow, Turbulence and Combustion 83 (4): 511–33. [CrossRef]
- Liu, Hai Feng, Xin Gong, Wei Feng Li, Fu Chen Wang, and Zun Hong Yu. 2006. “Prediction of Droplet Size Distribution in Sprays of Prefilming Air-Blast Atomizers.” Chemical Engineering Science 61 (6): 1741–47. [CrossRef]
- Senecal, P K, D P Schmidt, I Nouar, C J Rutland, R D Reitz, and M L Corradini. n.d. “Modeling High-Speed Viscous Liquid Sheet Atomization.” www.elsevier.com/locate/ijmulflow.
- Su, Ke, and Zhu Huimin. 1994. “Research on Theoretical Models and Computational Methods for Fuel Spray Particle Size.” Aviation Engines (04): 34-39.
- Reitz, R. D., and F. V. Bracco. 1982. “Mechanism of Atomization of a Liquid Jet.” Physics of Fluids 25, no. 10: 1730-1742.
- Zhao, Hui, Zhao Wei Wu, Wei Feng Li, Jian Liang Xu, and Hai Feng Liu. 2018. “Nonmonotonic Effects of Aerodynamic Force on Droplet Size of Prefilming Air-Blast Atomization.” Industrial and Engineering Chemistry Research 57 (5): 1726–32. [CrossRef]
- Han, Zhiyu, S. E. Parrish, Patrick V. Farrell, and Rolf D. Reitz. 1997. “Modeling Atomization Processes of Pressure-Swirl Hollow-Cone Fuel Sprays.” Atomization and Sprays 7, no. 6: 663-684.
- Zhao, Qishu, and Gan Xiaohua. 1985. “Study on the Liquid Film Thickness in Air Atomizing Nozzles.” Journal of Engineering Thermophysics 6, no. 4: 378-384.
- Yang, Jianhui, Fan Weijun, and Yang Maolin. 2003. “Calculation of Atomization Parameters for Centrifugal Nozzles.” Journal of Aerospace Power 18, no. 6: 799-802. [CrossRef]
- Zhang, Juxing, Di Dong, Ping Zhang, et al. 2022. “Initial Atomization Experiments of a Flat-Plate Pre-Membrane Nozzle Under High Temperature and Pressure.” Journal of Aerospace Power 37, no. 1: 55-66. [CrossRef]
- Varga, C. M., J. C. Lasheras, and E. J. Hopfinger. 2003. “Initial Breakup of a Small-Diameter Liquid Jet by a High-Speed Gas Stream.” Journal of Fluid Mechanics 497: 405-434. [CrossRef]
- Ke Zheng, Zhiwen Gan, Xinyao Wang, Xuesong Han, Tianqi Zheng, and Jianchen Wang. “Experimental Study on Spray Characteristics of Aviation Kerosene from a Pressure-Swirl Nozzle in High-Speed Airflow with Elevated Temperatures”, PHYSICS OF FLUIDS 36.2 (2024).
- H.J. Sheen, W.J. Chen, S.Y. Jeng, and T.L. Huang. “Correlation of swirl number for a radial-type swirl generator”, Experimental Thermal and Fluid Science 12.4 (1996): 444-451.
- Carvalho, I. S., and M. V. Heitor. 1998. “Liquid Film Break-Up in a Model of a Prefilming Airblast Nozzle.” Experiments in Fluids 24, nos. 5-6: 408-415.
- Kim, Sunghyuk, Taeock Khil, Dongjun Kim, and Youngbin Yoon. 2010. “Effect of Geometric Parameters on the Liquid Film Thickness and Air Core Formation in a Swirl Injector.” Measurement Science and Technology 21, no. 3: 035403. [CrossRef]
- Dombrowski, N., and W. R. Johns. 1963. “The Aerodynamic Instability and Disintegration of Viscous Liquid Sheets.” Chemical Engineering Science 18, no. 3: 203-14.
- AA RIZKALLA, and AH LEFEBVRE. “Influence of Liquid Properties on Airblast Atomizer Spray Characteristics”, Journal of Engineering for Power 97.2 (1975): 173-177.
Figure 1.
The experiment system schematic diagram.
Figure 2.
Detail structure of twin swirl airblast nozzle.
Figure 3.
Effects of swirling air characterized by : (a)The scatter plot SMD-We; (b) The scatter plot after linearization ln(SMD)-ln(We),Pearson’s correlation coefficient r=-0.882.
Figure 3.
Effects of swirling air characterized by : (a)The scatter plot SMD-We; (b) The scatter plot after linearization ln(SMD)-ln(We),Pearson’s correlation coefficient r=-0.882.
Figure 4.
Analytical evaluation figures for the regression model: (a) the normal probability plot of residuals with 0.95 confidence interval; (b) the testing the influence of run order on residuals;(c) the plot of residual variance;(d) distribution of predicted SMD values with relative error 19.3% and average relative error 6.8%.
Figure 5.
The test of the model’s ability to generalize.
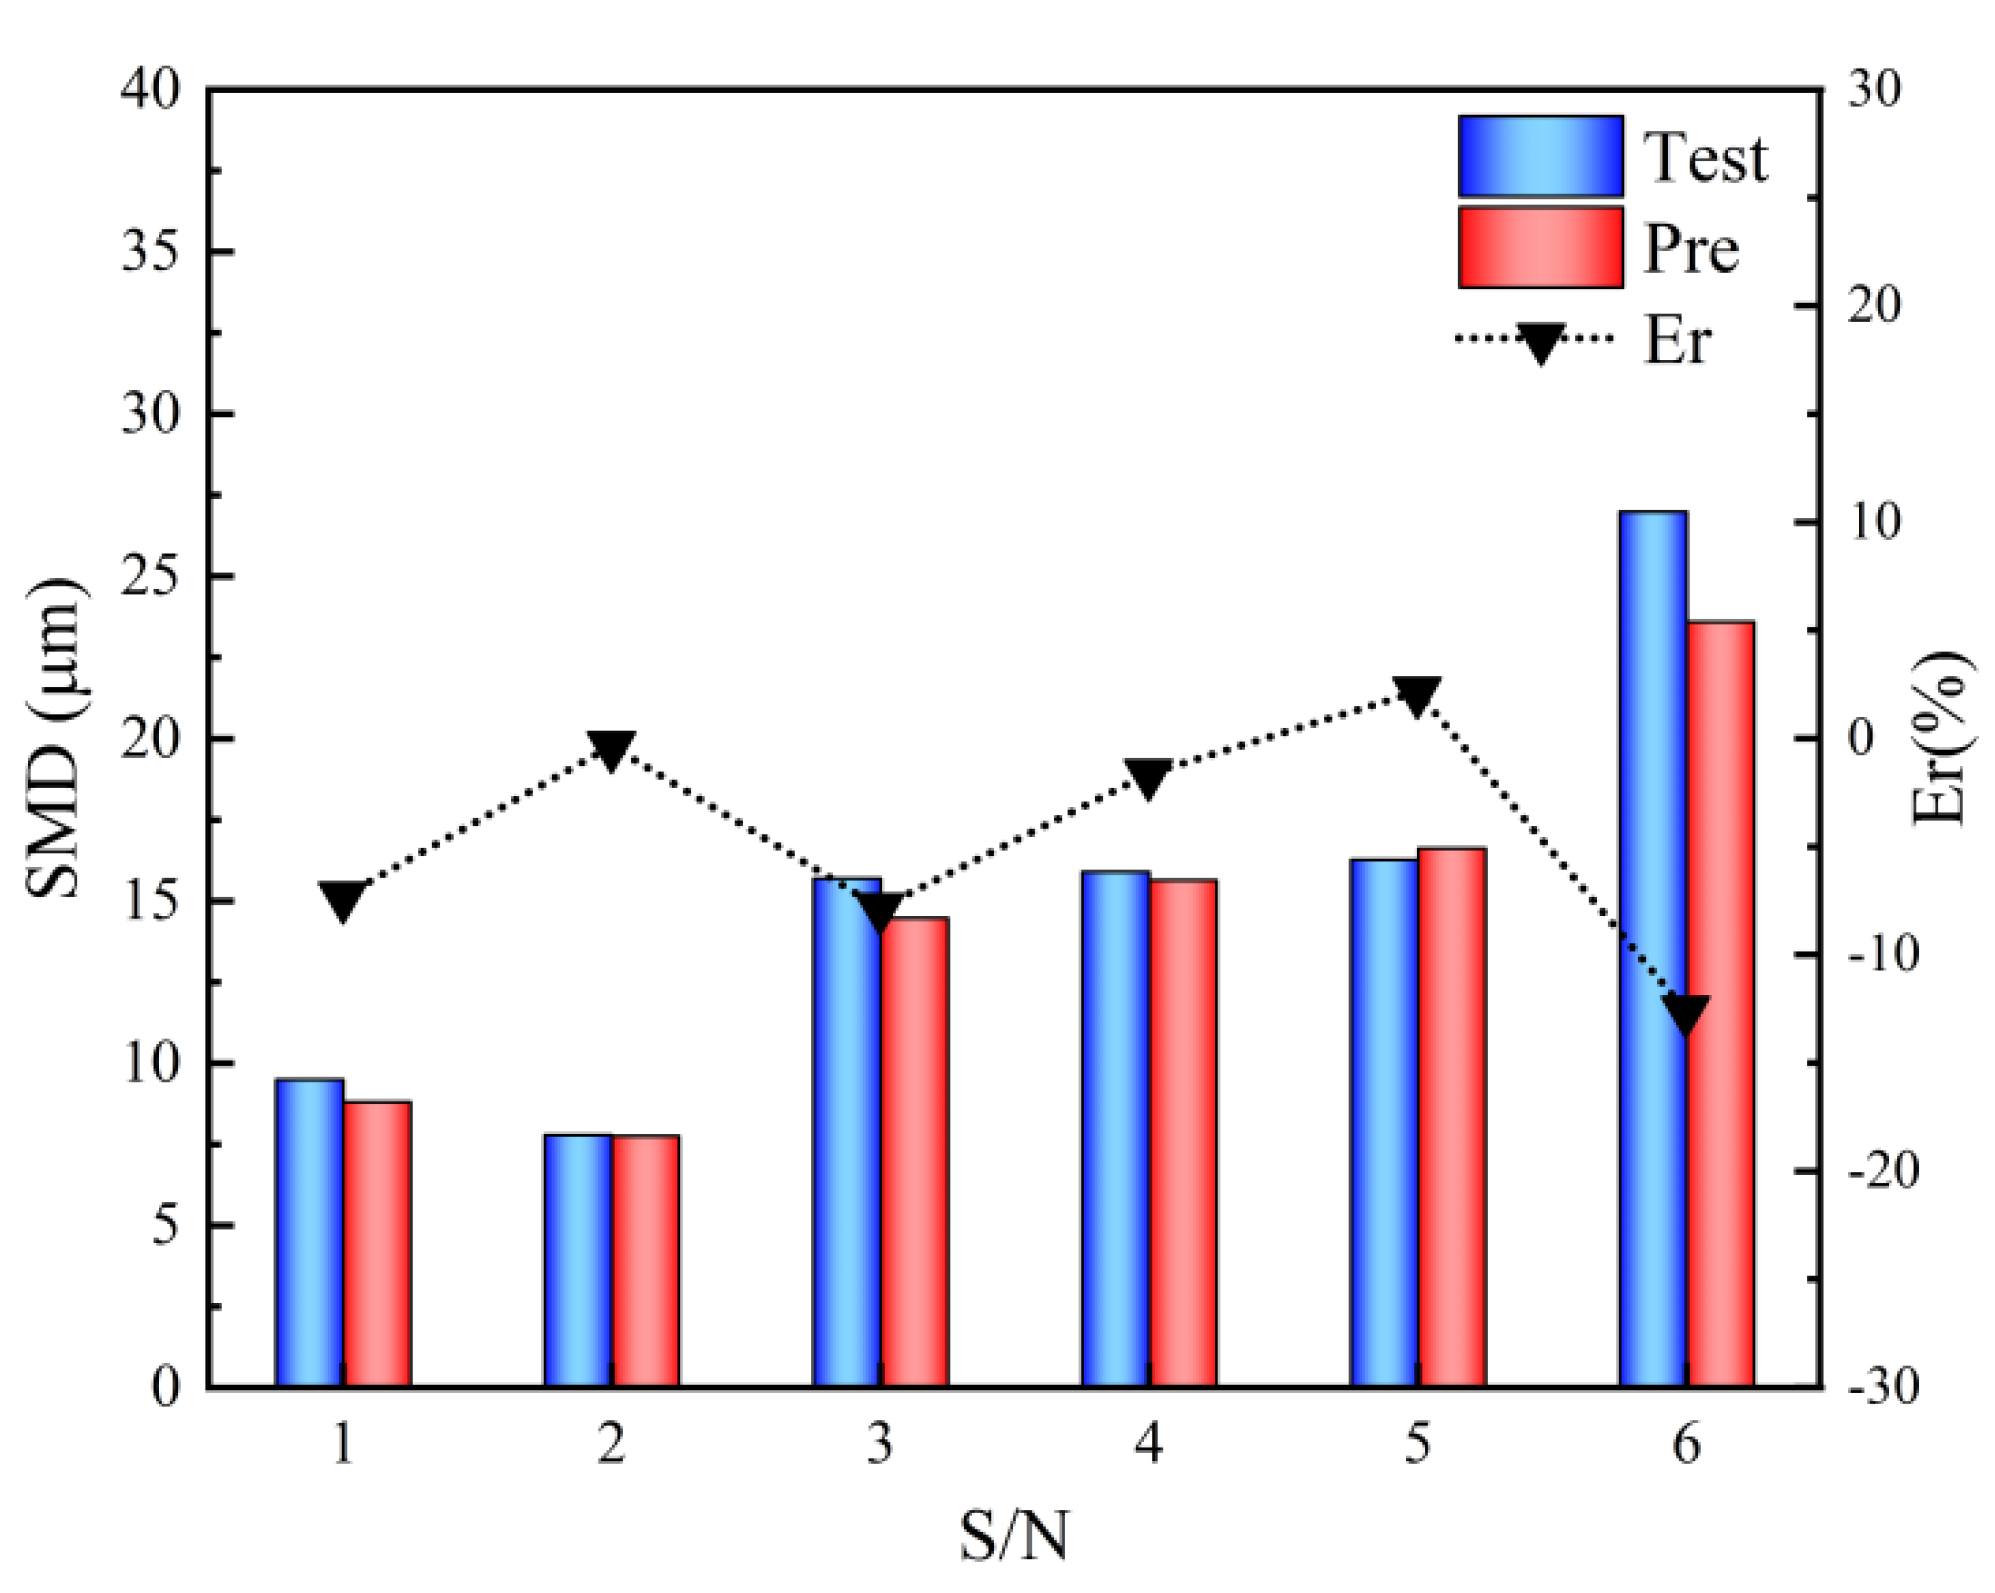
Figure 6.
The residual distribution plots for the three models discussed.

Figure 7.
’R-L’ model’s normal probability plots of residuals with 0.95 confidence interval.
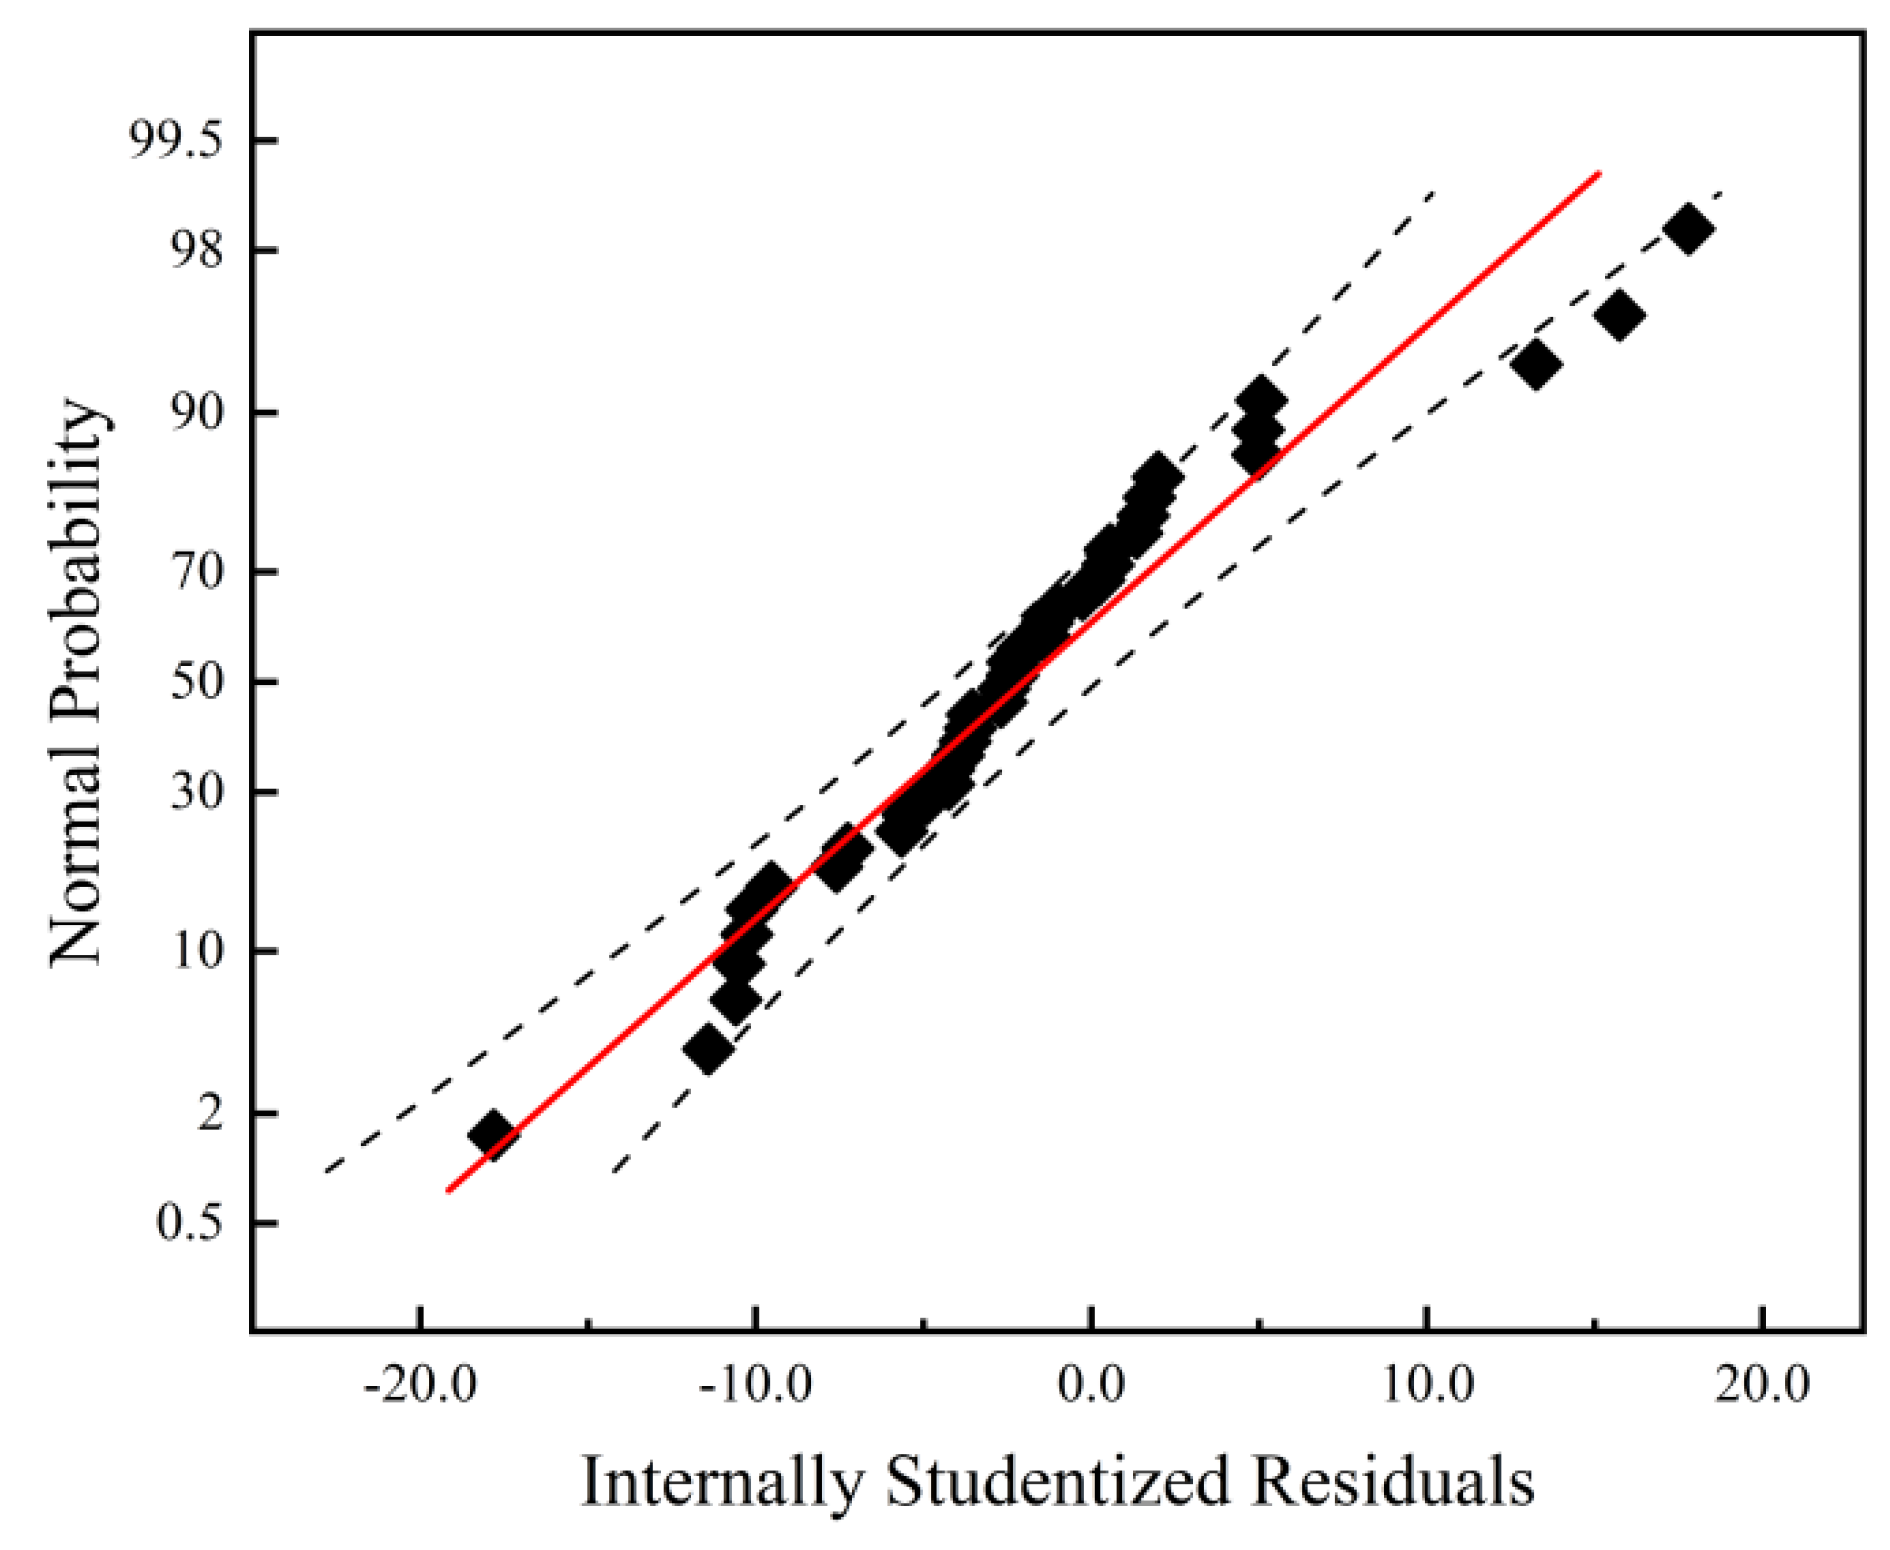
Figure 8.
Comparison of two prediction models: (a) The distribution of predicted SMD values for the two models discussed;(b)The distribution of relative errors for the models.
Figure 8.
Comparison of two prediction models: (a) The distribution of predicted SMD values for the two models discussed;(b)The distribution of relative errors for the models.
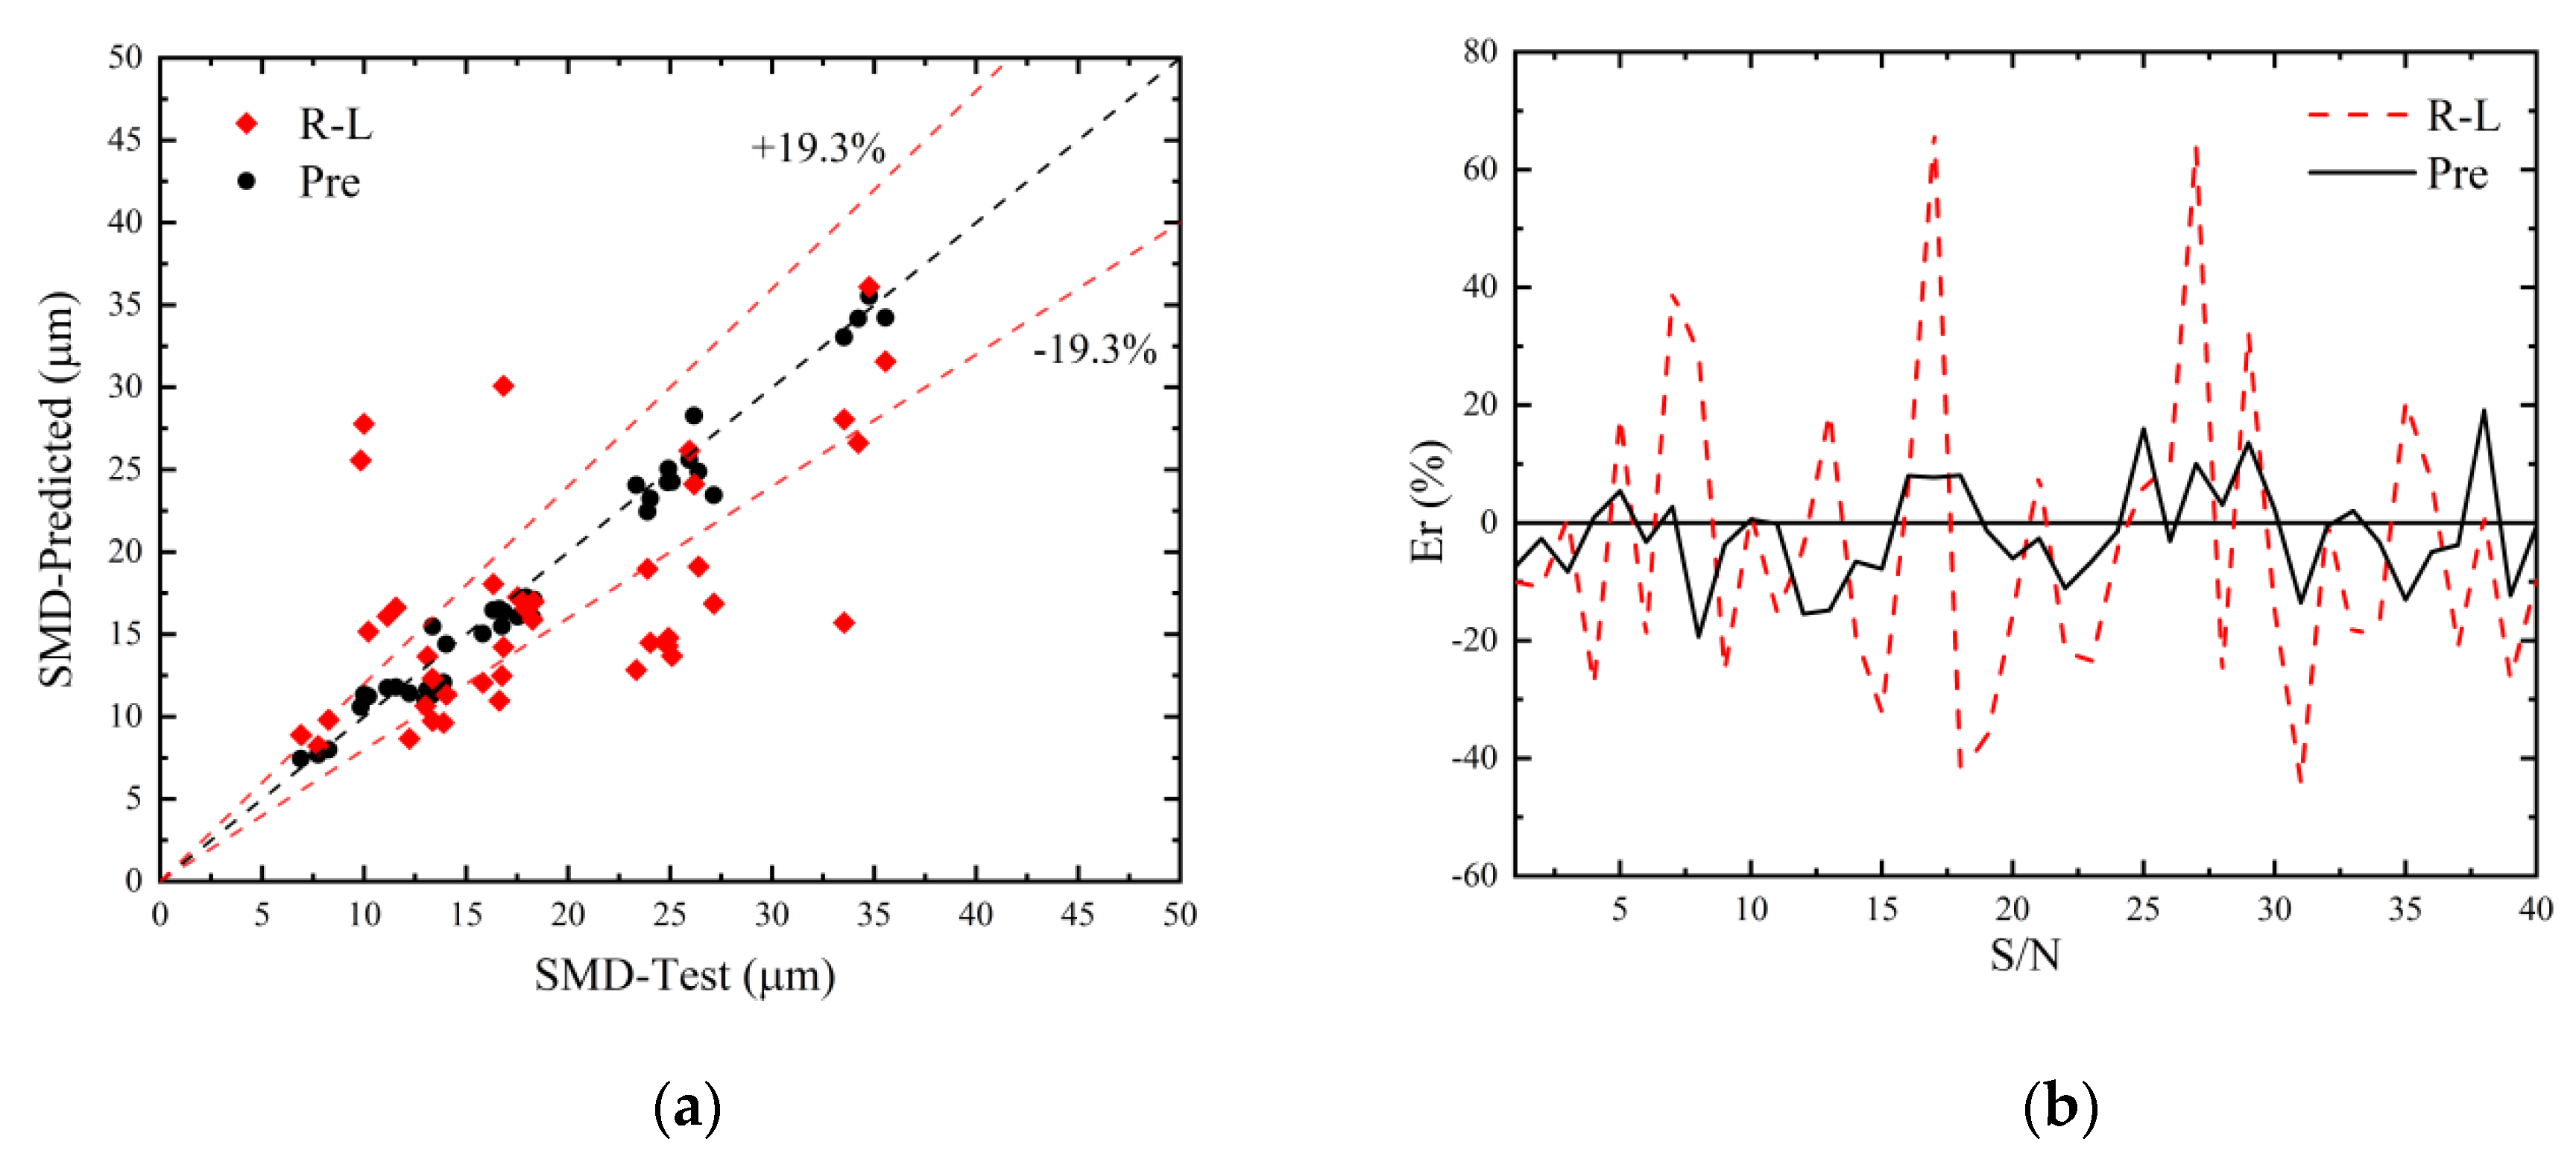
Figure 9.
Spearman analysis of SMD for experimental variables.
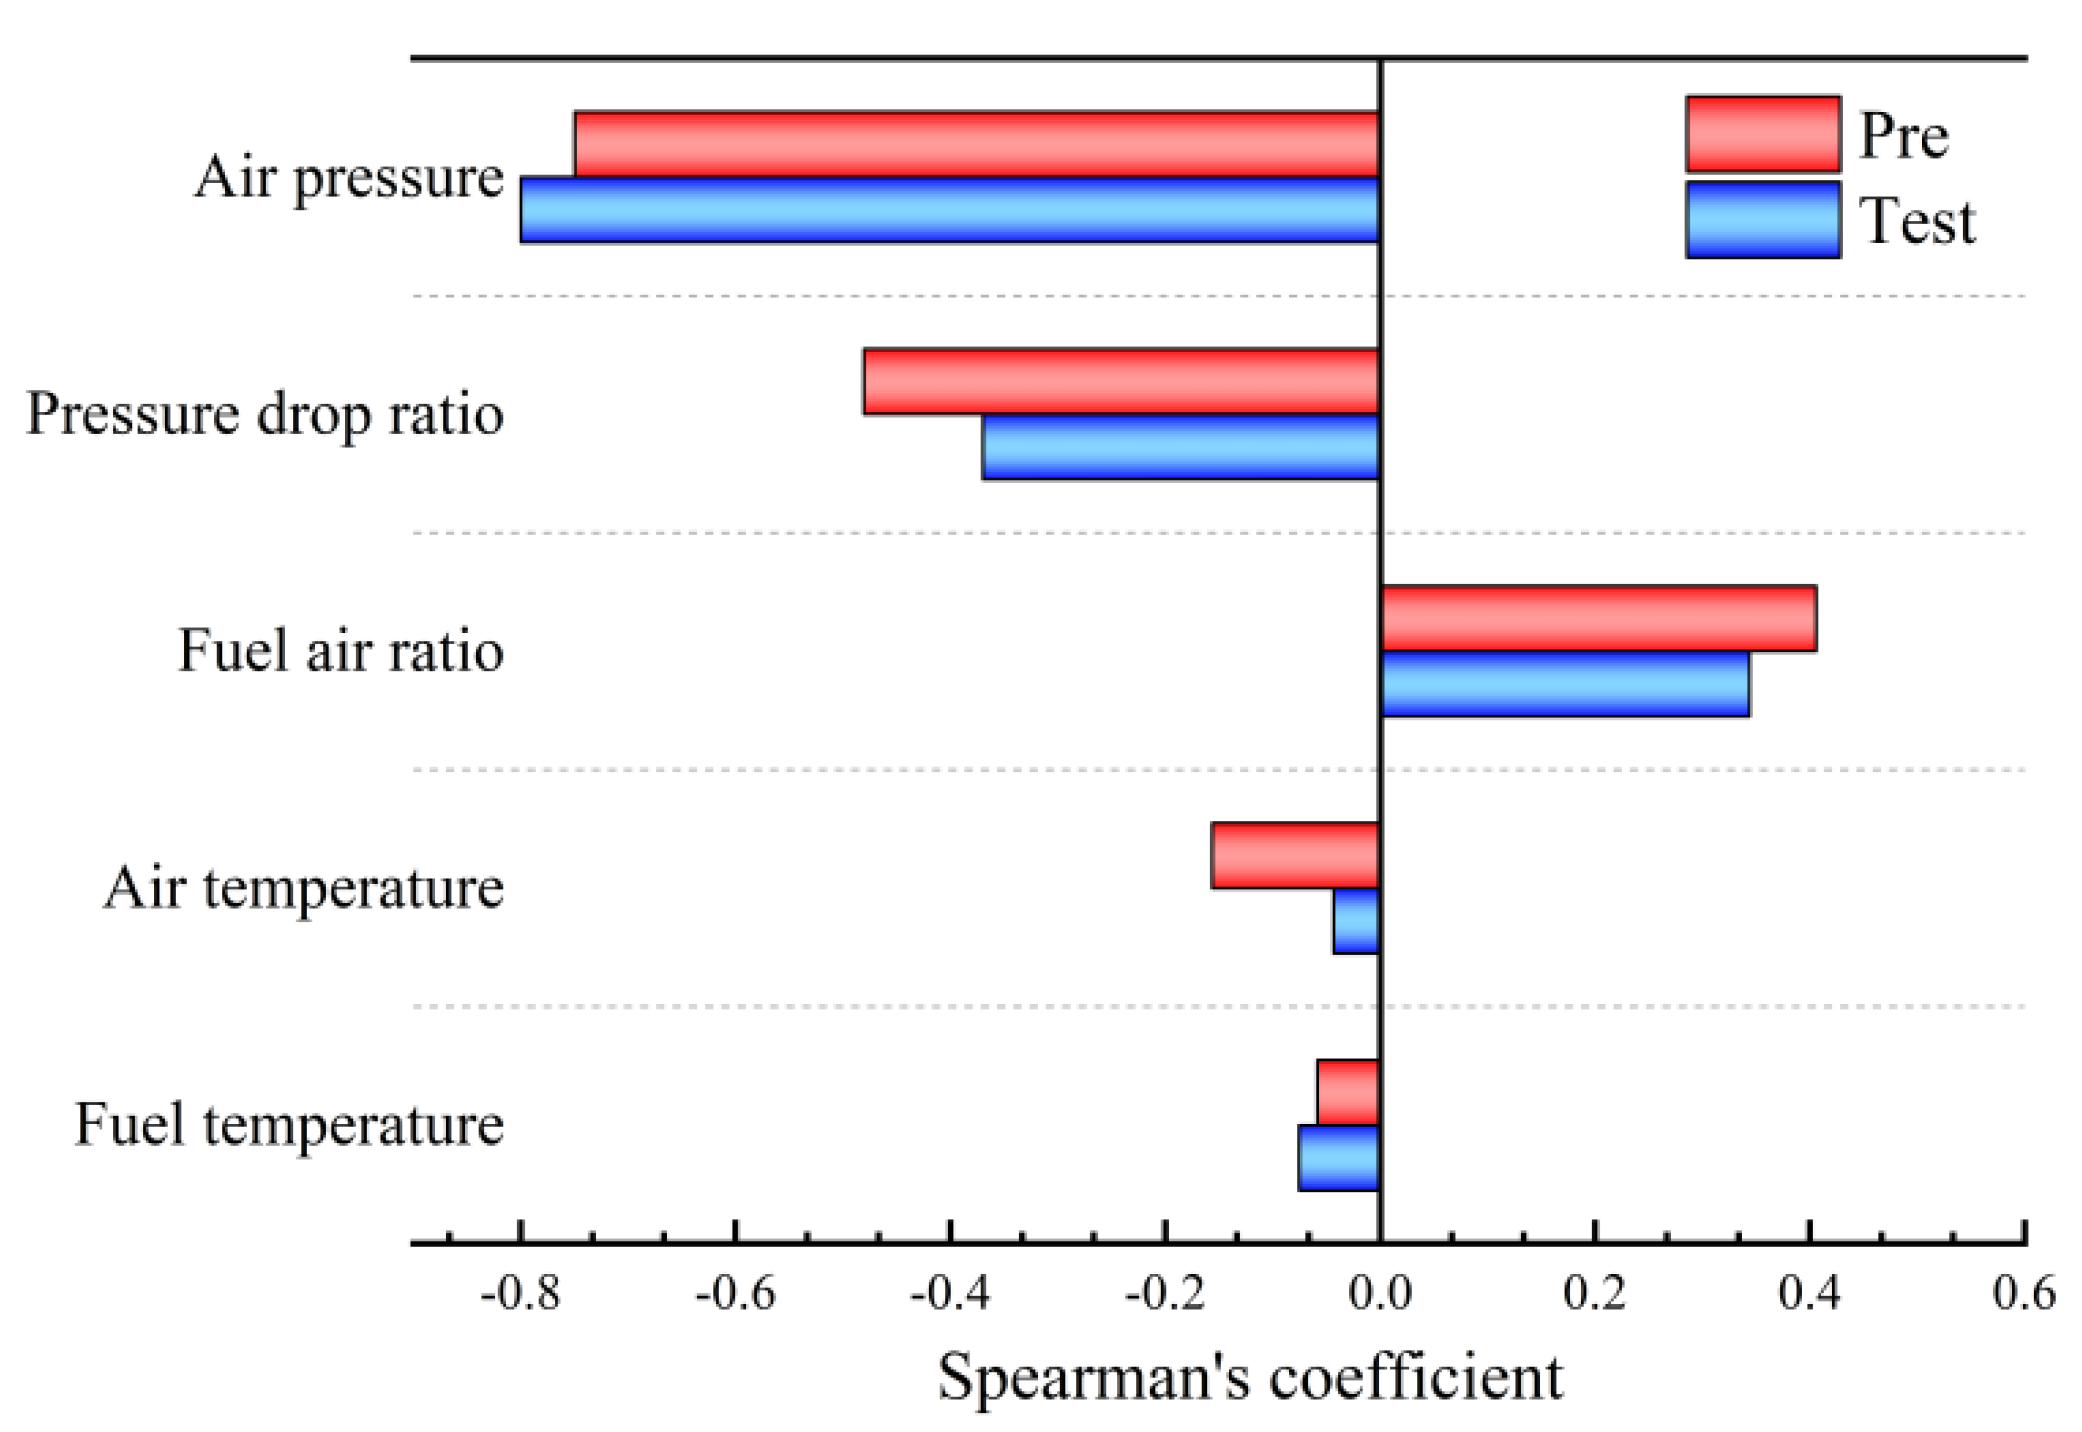
Figure 10.
The Comparison of measured and predicted SMD values with swirler pressure drop ratio 3% and 5% at Ambient Temperature and Pressure .
Figure 10.
The Comparison of measured and predicted SMD values with swirler pressure drop ratio 3% and 5% at Ambient Temperature and Pressure .
Figure 11.
The Relationship between SMD and fuel flow rate q with swirler pressure drop ratio 1%, 3% and 5% at ambient temperature and pressure.
Figure 11.
The Relationship between SMD and fuel flow rate q with swirler pressure drop ratio 1%, 3% and 5% at ambient temperature and pressure.

Table 1.
The operating conditions for particle size test.
| S/N | (MPa) | (%) | (K) | (K) | FAR |
| 1 | 0.3 | 4 | 450 | 316 | 0.04 |
| 2 | 0.3 | 4 | 450 | 346 | 0.04 |
| 3 | 0.3 | 6 | 450 | 316 | 0.04 |
| 4 | 0.3 | 4 | 450 | 316 | 0.02 |
| 5 | 0.3 | 4 | 450 | 316 | 0.06 |
| 6 | 0.1 | 4 | 450 | 316 | 0.04 |
| 7 | 0.4 | 6 | 490 | 331 | 0.02 |
| 8 | 0.4 | 6 | 490 | 331 | 0.06 |
| 9 | 0.2 | 6 | 490 | 331 | 0.06 |
| 10 | 0.4 | 2 | 490 | 301 | 0.02 |
| 11 | 0.4 | 6 | 410 | 301 | 0.02 |
| 12 | 0.2 | 2 | 410 | 301 | 0.06 |
| 13 | 0.4 | 2 | 490 | 301 | 0.06 |
| 14 | 0.2 | 2 | 410 | 301 | 0.02 |
| 15 | 0.4 | 2 | 410 | 331 | 0.06 |
| 16 | 0.4 | 2 | 410 | 301 | 0.06 |
| 17 | 0.2 | 2 | 490 | 301 | 0.06 |
| 18 | 0.2 | 6 | 490 | 301 | 0.06 |
| 19 | 0.4 | 2 | 490 | 331 | 0.02 |
| 20 | 0.4 | 6 | 410 | 301 | 0.06 |
| 21 | 0.4 | 6 | 410 | 331 | 0.02 |
| 22 | 0.2 | 2 | 490 | 331 | 0.02 |
| 23 | 0.2 | 2 | 410 | 331 | 0.06 |
| 24 | 0.2 | 6 | 490 | 301 | 0.02 |
| 25 | 0.4 | 6 | 490 | 301 | 0.06 |
| 26 | 0.4 | 2 | 490 | 331 | 0.06 |
| 27 | 0.2 | 2 | 410 | 331 | 0.02 |
| 28 | 0.4 | 2 | 410 | 301 | 0.02 |
| 29 | 0.1 | 4 | 303 | 316 | 0.04 |
| 30 | 0.2 | 4 | 340 | 316 | 0.04 |
| 31 | 0.45 | 4 | 500 | 316 | 0.04 |
| 32 | 0.25 | 4 | 450 | 316 | 0.04 |
| 33 | 0.5 | 4 | 450 | 316 | 0.04 |
| 34 | 0.3 | 4 | 350 | 316 | 0.04 |
| 35 | 0.3 | 2 | 450 | 316 | 0.04 |
| 36 | 0.4 | 6 | 410 | 331 | 0.06 |
| 37 | 0.2 | 6 | 410 | 301 | 0.02 |
| 38 | 0.2 | 6 | 490 | 331 | 0.02 |
| 39 | 0.2 | 2 | 490 | 331 | 0.06 |
| 40 | 0.4 | 2 | 410 | 331 | 0.02 |
Table 2.
Values of the parameters and the variance
| ..A | B | C | D | E | R2 |
| 1249 | -0.8645 | 0.1551 | -0.0113 | 0.0148 | 0.967 |
Table 3.
Generalization capability test conditions.
| S/N | (MPa) | ΔP(%) | (K) | (K) | FAR |
| 1 | 0.8 | 4 | 550 | 316 | 0.02 |
| 2 | 0.4 | 6 | 490 | 301 | 0.02 |
| 3 | 0.3 | 4 | 550 | 316 | 0.04 |
| 4 | 0.3 | 4 | 450 | 286 | 0.04 |
| 5 | 0.2 | 6 | 410 | 301 | 0.06 |
| 6 | 0.2 | 2 | 490 | 301 | 0.02 |
Disclaimer/Publisher’s Note: The statements, opinions and data contained in all publications are solely those of the individual author(s) and contributor(s) and not of MDPI and/or the editor(s). MDPI and/or the editor(s) disclaim responsibility for any injury to people or property resulting from any ideas, methods, instructions or products referred to in the content. |
© 2024 by the authors. Licensee MDPI, Basel, Switzerland. This article is an open access article distributed under the terms and conditions of the Creative Commons Attribution (CC BY) license (http://creativecommons.org/licenses/by/4.0/).
Copyright: This open access article is published under a Creative Commons CC BY 4.0 license, which permit the free download, distribution, and reuse, provided that the author and preprint are cited in any reuse.


