
Submitted:
18 September 2024
Posted:
19 September 2024
You are already at the latest version
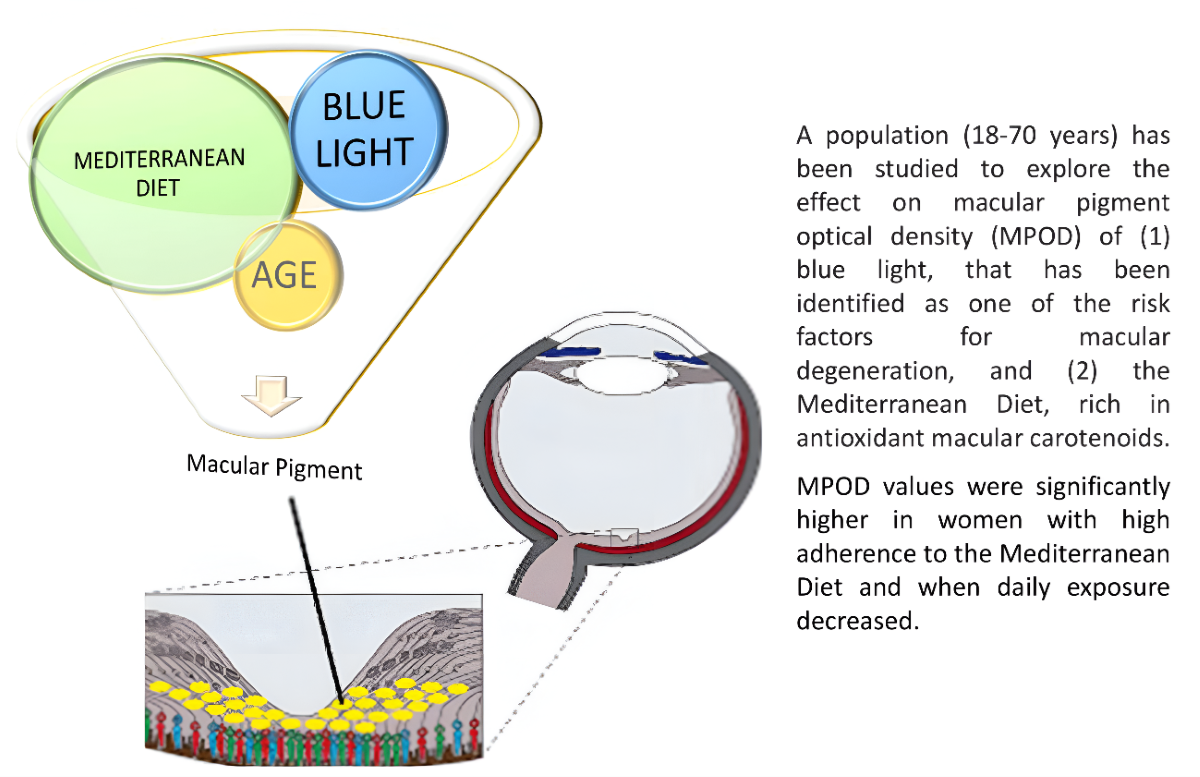
Abstract
Objective: To explore the effect of time exposure to flat screen electronic devices with LED 14 lighting and the Mediterranean diet on macular pigment optical density (MPOD). Methods: MPOD 15 was measured by heterochromatic flicker photometry in 164 eyes (47 of young women 20-31 years 16 and 35 adult women 42-70 years). Exclusion criteria: evidence of macular degeneration and eyes 17 with cataracts. Data on the use of electronic devices and Mediterranean diet adherence were col- 18 lected through a survey. Nonparametric analysis of variance and independent sample t-tests were 19 used to compare subjects. Results: Significant differences (p<0.01) were found in total time of expo- 20 sure to LEDs (hours per day) between both groups (9.31 ± 3.74 young women vs 6.33 ± 3.64 old 21 women). The MPOD values for the young and adult populations were significantly different: 0.38 ± 22 0.16 and 0.47 ± 0.15 (p<0.01), respectively. When comparing both groups for the same time of expo- 23 sure to LEDs, differences were obtained between MPOD values of both populations: For total expo- 24 sures greater than 6 hours per day, the MPOD values were lower in young women than in adult 25 ones (0.37 ± 0.14 vs 0.50 ± 0.14, p<0.01). On the other hand, a significantly higher adherence was 26 found in the old women in comparison with the young women (OW 9.23± 2.50 vs YW 7.70 ± 2.08, 27 p<0.01), with higher MPOD values, (OW (0.52 ± 0.14) vs (YW (0.34 ± 0.18). Conclusions: Higher 28 MPOD values are observed with decreasing exposure time to electronic devices with LED lighting 29 screens and high adherence to the Mediterranean diet.
Keywords:
macular pigment optical density
; blue light exposured
; exposure to LEDs
; Mediterranean diet
; Catorenoids
Introduction
The development of illumination systems based on light emitting diodes (LEDs) is spread worldwide. Today, more than 90% of all light sources are SSL (Solid state lighting), LED technology, with different display configurations of light emitting diodes (OLED, AMOLED...). LEDs are more energy-efficient and have a smaller size, which makes them suitable for any small electronic device such as cell phones, tablets, and for flat-screen televisions and computer monitors. The spectral emission of LEDS is mainly white light, including a proportion of light at wavelengths of 435 to 440 nm, which are included in the ‘blue light hazard’ (BLH) assessment. BLH is defined as the photochemical risk to the retinal tissues of the eye or photomaculopathy, which occurs when looking at bright sources, such as the sun [1]. Although the BLH irradiances emitted by electronic devices with visual displays is far from that emitted by the sun [2], the extensive usage of electronic devices (time of exposure) is a matter of growing public concern because we are gradually being exposed to more sources of blue light and for longer periods of time [3].
The negative effects of the extended usage of these devices, such as computer vision syndrome (CVS) [4] is becoming a major public health issue with eye strain symptoms that could be caused by poor refractive compensation [5] and / or excessive time of exposure (TE) [6]. CVS is influenced by the observation distance or angle and by a decrease in the quality or frequency of blinking [7]. Blue light also plays a key role in physiological functions, such as in the regulation of circadian rhythms of sleep and wakefulness [8]. The relationship between TE to SSL screen displays (380-780 nm) [6] and circadian rhythm disorders has also been explored [8,9]. In young human eyes it has been reported that short-term exposure to blue light resulted in inhibition of axial elongation, which may have an impact on myopia control that needs to be explored [10]. Blue light has long been known to be phototoxic to the retina [11]. Several studies have been conducted in retinal cell culture and mice exposed to LED illumination to investigate the effect of SSL screens on retinal damage. The negative effect of visual blue light is due to a decrease in mitochondrial function associated with retinal ganglion cells and photooxidative damage of photoreceptor cells, leading to the appearance of reactive oxygen species with cellular apoptosis [12]. The main two carotenoids, lutein (L) and zeaxanthin (Z), found in the retina and known as macular pigment (MP), are selectively concentrated in the macula lutea (or central 1.5 mm of the macula) and the levels decrease exponentially to a concentration of zero with 6-8 degrees of eccentricity [13]. MP density is a measurement of the level of these xanthophylls in the retina [14] that can be measured by different techniques ‘in vivo’, with heterochromatic flicker photometry (HFP) being one of the most used methods among the psychophysical techniques [15]. MP is considered to protect the retina by filtering blue light [16] and has recently been related with visual quality [17], while low levels are associated with macular degeneration [18]. The macular carotenoids L and Z cannot be synthesized by humans and fruits and vegetables are the main dietary sources [16]. The Mediterranean diet (MD) is characterized by a high consumption of fruits and vegetables and its protective role on the progression of age-related macular diseases has been evaluated by the Mediterranean diet score, showing that a higher adherence may play a protective role against age-related macular degeneration [19]. Besides diet, other internal and external factors have been investigated in relation to MPOD such as age [20], sex and body mass index or fat percentage [21], iris color or ethnicity [22], and also other lifestyle factors such as smoking, alcohol consumption, exercise [17] and time exposure to ultraviolet light [8] however, correlation with time exposure to blue light from electronic devices has been scarcely investigated so far.
We hypothesized that a longer exposure time to electronic devices and a lower adherence to the Mediterranean diet could be related to a lower density in the MP evaluation as optical density. The aim of this work was to collect information about time of exposure to electronic devices based on LED technology (LED / OLED / AMOLED) and adherence to the Mediterranean diet in a group of healthy women of different ages and explore the relationship with MP density evaluated by HFP.
Materials and Method
Subjects and Protocol
The study protocol (DENPIGMA-0831-N-17-f) was approved by the local ethics committee (“Comité Coordinador de Ética de la Investigación Biomédica de Andalucía”) and the experimental procedures adhered to the Declaration of Helsinki. 86 women were enrolled in a cross-sectional observational study conducted in the Optometry Clinic of the Faculty of Pharmacy of the University of Seville. The study was advertised for women over 18 years of age among students, faculty personnel, and patients who visited the Optometry Clinic.
To reduce the variability related with race, gender or some systemic illnesses, only Caucasian healthy, non-smoking women were recruited. Exclusion criteria included evidence of AMD, evaluated with an Amsler grid [23], or lens opacity (cataract) explored with a slit lamp. All recruited participants were aware of the experimental hypothesis and informed consent was obtained before starting the experiment.
The participants were divided into two groups according to their age considering that the use of electronic devices started in Spain in the 1990s. The young women group (YW) included women 20 to 31 years of age, and the older women group (OW) included women 42 to 70 years of age.
Height and weight were also recorded to calculate the body mass index (BMI) which was classified according to OMS [24] as: underweight < 18.5 kg/m2; normal weight ≥ 18.5–24.9 kg/m2; overweight 25.0–29.9 kg/m2; obesity 30.0 kg/m2
Macular Pigment Optical Density (MPOD) Evaluation
MPOD was measured using HFP [25,26] with a MPS II (Macular Pigment Screener II) by Elektron Technology UK Ltd. (Cambridge, UK).
MP absorbs selectively in the blue region of the visible spectrum, at 460 nm, and it is present only in the central 8 degrees of the macula. HFP is performed for central fixation where MP is maximal. The MPS II uses low intensity light of two specific wavelengths (460 nm and 540 nm) at calibrated intensities to gauge a patient’s heterochromatic flicker response. Two measurements are taken, one with the patient looking directly at the stimulus target (using the central region of the macula, 0.25º - 0.5º of eccentricity) (absolute MPOD values) and another where the patient fixates peripherally on a point 8º to the side of the stimulus light (so it is viewing the stimulus where MP density is minimum) [27]. Both measurements lead to estimated MPOD values. The MPOD was measured in density units (du) and ranged from 0 to 1.
Screen Time Usage during Daytime
All participants completed a structured questionnaire with open-ended questions. They were asked about the electronic devices they usually use (such as television, tablet, PC, laptop, eBook, or mobile phone) and the average time participants spent on screen-based activities per day. In addition, they were asked about the brand and model of each device. This questionnaire was completed at home and the answers were checked at the delivery. The light sources of the electronic devices were then searched for in the technical datasheet of the instruments or obtained from the companies when necessary.
According to the daily time of exposure (TE) to LEDs two main groups were considered, those with 0-6 hours/daily versus those with >6 hours, considering that during working hours, PC and computer screens are used, and mobile phones are consulted. This classification was made considering a distribution of 24 hours a day that allows sleeping around 8 hours, working another 8 and the remaining 8 to eat and do leisure activities.
Adherence to the Mediterranean Diet: The Mediterranean Diet Score (MEs)
The volunteers completed 14 questions validated questionnaire to evaluate the adherence to the Mediterranean Diet [28]. The score range 0 to 14 as a result of evaluating with 1 point the consumption of key food items, such as olive oil as main fat fruit, vegetables or salad, wine, fish, legumes or nuts, preferentially consumption of white meat vs red meat and consumption of sauté and low consumption of: red meat or meat products. We applied the following criteria for categorization of the adherence to the MD: weak adherence, ≤5; moderate to fair adherence, 6–9; good or very good adherence ≥10 [28].
Statistical Analyses
The Shapiro–Wilk test and Kolmogorov-Smirnov test were used for normality. For the normally distributed data, independent sample t-tests were used to make comparisons between population subgroups. p<0.05 was considered statistically significant. Nonparametric analysis of variance by Kruskal Wallis and U de Mann-Whitney test were conducted. All statistical analyses were performed with StatGraphics Centurion and SPSS v.23.
Results
86 women were initially enrolled in the study but only 82 completed all the requested data and met the inclusion criteria. Table 1 shows the descriptive statistic and MPOD values in the group of volunteers participating in the study and by age groups.
MPOD, absolute and estimated values, were measured in both eyes of the participants. Due to a certain degree of difficulty in concluding the measurement with the technique of HFP employed by the MPS II instrument, only 158 eyes completed the evaluation of MPOD (absolute and estimated value). The mean absolute and estimated MPOD values that were measurable were similar (RE 0.41 ± 0.16 and LE 0.42± 0.16 and RE 0.43 ± 0.16 and LE 0.43± 0.16 respectively) with no significant difference, therefore, the measures were randomized from both eyes.
The inter-ocular correlation coefficient between subjects’ fellow eyes was 0.63 (P<0.01) for absolute values and 0.72 (P<0.01) for estimated values. Absolute values for each participant were considered for further statistical treatments.
Mean age of the participants was 36.8±16.2 (range 20 - 70 years). The young women group (YW) (n=47) included women from 20 to 31 years old and mean age of 23.6 ± 2.2. The old women group (OW) (n=35) included women from 42 to 70 with a mean age of 54.7±7.5. YW group showed significantly lower values for MPOD than the older group (OW): 0.38 ± 0.15 (range 0.12-0.70) vs 0.47 ± 0.16 (range 0.17-0.89) (p<0.01) respectively.
Mean BMI of the participants was 22.9 ±3.9 (range 16.3-35.4). YW and OW BMI were significantly different (21.9±3.5 YW vs 24.1±4.2 OW) (p≤0.01). A higher prevalence of weight excess in the OW group (23.8% vs 13%) was observed. There was no significant difference in MPOD among the different BMI categories (Table 1).
Light Sources of the Electronic Devices and Time of Exposure by Age Groups
To assess the TE to LEDs, the different devices reported by the volunteers were investigated for the source of light in the instruction manuals. In tablets, laptops and PCs 100% of the light sources were based on LEDs while in mobile phones 82.10% were LED, and 17.09% were OLED / AMOLED. In the televisions (TVs), the vast majority of the reported devices had LED as light source (64.9%), 24.6% (flat TVs without LED) had Cold Cathode Fluorescent Lamp, only 7% had Cathode Ray Tube and 3.5% had Plasma Display Panel. Total time of Exposure (TE) to different devices by age groups is shown in Figure 1. It can be observed that young women have a higher use of LEDs than the older ones (TE > 9 hours/day: 40.4% YW vs 17.6% OW) and (TE < 3 hours/day: 2.1% YW vs 28.6% OW).
Devices reported in this study are shown in Table 2, together with the TE by age group. Among all electronic devices, computers (laptop plus PC) were those with the highest time of usage with a mean of 3.57 ± 2.82 hours/day, followed by mobile phone 3.29 ± 2.41 hours/day, TV (2.05 ± 1.32), tablets and e-books 0.58 ± 1.05 and 0.01 ± 0.11 hours/day, respectively. In the young women group (YW), the most widely used device was the mobile phone while personal computers were the most popular in the old women group (OW).
Time of Exposure to LEDs and MPOD
Out of the 158 eyes studied for MPOD, 94 belong to YW and 64 to OW. The mean value for (YW+OW) MPOD was 0.42 ± 0.16 (range 0.02 - 0.89).
When the sample was grouped by age, a significant difference in MPOD values was observed. The YW group showed significantly lower values than the older group: 0.38 ± 0.16 (range 0.02-0.74) and 0.47 ± 0.15 (range 0.17-0.89) (p<0.01).
Considering an exposure to LEDs >6 hours/day, a significant difference in MPOD values were observed in age groups: (YW 0.37 ± 0.14 vs OW 0.50 ± 0.14) (p<0.01) (Table 1)(Figure 2).
No significant differences in MPOD values are found between young and adult women when the exposure time is less than 6 hours (Figure 3).
Mediterranean Diet
In relation to the adherence to the Mediterranean diet (MD) (Table 1), a significantly higher adherence was found in the OW group in comparison with the YW (YW 7.70 ± 2.08 vs OW 9.23± 2.50, p<0.01), with 48.6% of participants with very good adherence in the OW group vs only 19.1% in YW group. All the participants used olive oil as the main dietary fat and 71% reported consuming more than 4 spoons a day. This proportion was even higher (80%) among the OW. MPOD was also significantly higher in the women with good or particularly good adherence compared to those with moderate adherence in the total sample. The same trend towards increasing MPOD with increasing adherence to the MD was also observed in YW, although in this case these differences did not reach a significant level. From the 14-item tool of adherence to the Mediterranean Diet, we analyzed in detail the two questions related to consumption of fruits, vegetables and fish. 38% of the participants referred consuming three or more units of fruit per day and 56% two servings or more of vegetables a day. The OW group was over this value compared to the YW group. Similar trend was observed with fish consumption, reveling the better dietary habits in the OW group compared to the YW. A higher value for MPOD was found in the total sample for those consuming three or more units of fruit per day.
MPOD values were studied, considering groups by age and high-low adherence to Mediterranean Diet, 24 YW (0.34 ± 0.18) – 23 YW (0.40 ± 0.16), and 18 OW (0.52 ± 0.14) - 17 OW (0.41 ± 0.11).
In addition, MPOD values were analyzed according to consuming three or more pieces of fruit and not did it respectively: (14 YW (0.44±0.12) - 33 YW (0.34±0.18), p<0.05,) – (17 OW (0.48±0.17) – 18 OW (0.45±0.10), p>0.05,). Furthermore, there were differences MPOD values between YW and OW whose intake of fruit is lower than three pieces per day ((0.34 ± 0.18 YW) – (0.46 ± 0.14 OW), p<0.05).
In addition, assuming the positive effect of fruits and vegetables, both are rich in L and Z, the intake of three or more pieces of fruit plus two serving/day vegetables or salad was considered. It is observed differences among YW and OW (p<0.05), when fruits or vegetables are consumed. In addition, the percentage consumption of fruits and vegetables is different (p<0.05) among age groups (Table 1).
Discussion
We evaluated the adherence to the Mediterranean diet and time of exposure to LEDs light in a group of healthy women to explore its connection with MPOD measured by HFP. Also, other factors such as age and body mass index were analyzed in the studied group.
The absolute MPOD mean value for the total sample (0.42±0.16; range 0.12-0.89) was higher than previously published values for Spanish women measured with the same methodology and in a similar age interval (20 - 65 years) 0.342 ± 0.155 [29], although the authors do not indicate if that value corresponded to absolute or estimated measures. To obtain the absolute value both foveal and para-foveal data must be obtained, and it is a time-consuming process, for that reason most studies use the more simplified value, namely, the estimated value of MPOD from only the foveal data calculated with the manufacture’s empirical algorithm which considers the subject’s age [30]. Previous studies have shown that estimated values in healthy aged populations are lower than absolute values, however absolute and estimated values were not differents [31], in accordance with our findings. The values for MPOD obtained in the population included in this study are consistent with recent published data including Caucasian women [32].
MPOD increased significantly with age, with OW having a significantly higher MPOD value than YW. This is a striking result since an inverse association between MPOD and age has been established in different populations [33,34]. However, the relationship between age and MPOD is not straightforward. For instance, Pipis et al. [35], in a Central European population using fundus reflectometry, reported an increase in MPOD with age, along with a more eccentric distribution of MP profiles. Lima et al. 20 using a dual-wavelength autofluorescence method in healthy subjects, reported that MPOD values were highest near the foveal center and that those values increased during adulthood (peak at 45–50 years), followed by a gradual reduction after 60 years of age [36]. Berendschot and Van Norren, compared five different methods to measure MPOD including fundus reflectance spectroscopy and HFP and reported significant (p<0,001) bivariate correlation coefficients among them. After exploring the association of MPOD with age using these techniques, they concluded that there was no age effect in the MPOD. Only MPOD values obtained with HFP showed a small, but significant decrease with age that could be caused by an increase in the parafoveal data, suggesting that the central MPOD is unchanged with age [37].
In our study, we also found a significant positive association between MPOD and BMI for the total sample. Hammond et al. [38] established and inverse relationship between MPOD and BMI (n = 680, r = -0.12, P < 0.0008) and percentage of body fat, assessed by bioelectric impedance (n = 400, r = -0.12, P < 0.01). A competitive uptake of MP into the body fat and the retinal tissue was postulated by Johnson et al. [39]. However, Ji et al. [40], in a sample of 281 healthy Chinese individuals, including 96 males and 185 females, with ages ranging from 17 to 85 years reported no statistically significant association of MPOD with BMI. In the study by Hammond et al. [38] the higher body fat percentage was related to lower serum carotenoid levels and to lower dietary carotenoid intake. Thus, a factor to consider is diet, since it is known that a diet rich in the macular carotenoids L and Z favors the increase of MPOD [41]. In a recent study on a Spanish population, Olmedilla-Alonso et al. [29] reported that MPOD shows age-specific correlations with fruit and vegetable intake, with intake being higher in older subjects compared to younger ones. This is in accordance with our results related to the Mediterranean diet score and fruit consumption. MPOD were significantly higher in women with high adherence (with 10 points or over) to the Mediterranean diet, which were 48.6% in the OW vs only 19.1 % of the YW. The volunteers included in this study were all from the south of Spain (Seville and surroundings) and this area is very influenced by the Mediterranean diet, characterized among other foods, by the consumption of fruits and vegetables. Estevez-Santiago et al. [42] identified vegetables and green foods of plant origin as the major contributors to L + Z intake in the Spanish diet, while red/orange foods and fruits showed the strongest relationship to MPOD in the participants of 45-65 years of age. In accordance with our findings, higher (p<0.05) MPOD value found in the participants reporting intake of 3 or more units of fruit a day, which were 51.4% in the OW group vs only 29.8% in the YW group.
Another factor to be considered is the time of exposure to LEDs. YW reported a higher (p<0.01) exposure to electronic devices, that probably is sustained over time compared to that of adult women, since YW (23.6 ± 2.2 years) have developed their activity from early ages exposed to electronic devices while for OW (54.5±7.5 years) they not only reported lower TE to electronic devices but also the use of them corresponds only to the last period of their lives. Few studies have evaluated the spectral emission of electronic devices and compared them to exposure conditions with international exposure limits, and with the exposure likely to be received from staring at a blue sky. None of the sources assessed approached the exposure limits, even for extended viewing times. However, in other recent investigations in rodents [43] blue light exposure (LEDs, 450–500 lux, 400 to 490 nm) during 28 days on a 12:12 h light–dark cycle induced a significant hazard to the visual system resulting in damage to the retina with the associated remodeling of visual cortex neurons. Similarly, in human adult retinal epithelial cells [44] illuminated using display devices with different blue light wavelength ranges, 449 nm, 458 nm, and 470 nm, they reported an increased production of reactive oxygen species (ROS) and apoptosis in retinal cells for the display with a blue light peak at a shorter wavelength.
Therefore, in this population, three important facts can be highlighted: on the one hand, an increase in MPOD with increasing age and as a justification, greater adherence to the Mediterranean diet, with greater fruit consumption, in the older population, which aligns with numerous studies linking increased MPOD with the consumption of L and Z; and on the other hand, lower use of electronic devices in the older population, supported by scientific evidence from studies on rodents exposed to extreme conditions.
Conclusions
The main conclusion could be that the most important factor in MPOD level is a diet rich in L and Z, rather than age or the use of electronic devices.
In addition, could be considered that almost all electronic devices are based on LEDs technology, and YW are heavier users than the older ones. The YW group showed a tendency to decrease the MPOD with increasing time exposure to electronic devices with SSL lighting screens, although no statistically significant differences were obtained. Considering over 6 daily hours of exposure, there were significant differences in MPOD values between the populations of young and adult women, with higher MPOD values for OW group. Finally, MPOD values were significantly higher in women with high adherence to the Mediterranean diet. MPOD values are higher when a representative amount of fruit is consumed. The OW group had better dietary habits compared to the YW.
Author Contributions
M-C. García-Romera: Conceptualization; Data curation; Formal analysis; Investigation; Methodology; Roles/Writing - original draft, Supervision Writing - review & editing. V. Ponce-García: Conceptualization; Roles/Writing - original draft, Supervision Writing - review & editing. U. Torres-Parejo: Statistical analyses, Roles/Writing, Supervision Writing - review & editing. A. López Muñoz: Conceptualization; Roles/Writing - original draft, Supervision Writing - review & editing.
Institutional Review Board Statement
The study protocol was approved by the ethics committee from Andalucía, Spain, following the tenets of the Declaration of Helsinki. All participants were informed about study purposes, methods and data analysis and an informed consent was signed.
Informed Consent Statement
All participants have confirmed consent for publication.
Acknowledgments
The authors appreciate the support offered by the members of the Department of Physics of Condensed Matter, Faculty of Physics, University of Seville. In addition, the authors also appreciate the technical support offered by the members and facilities of the Faculty of Pharmacy, University of Seville. The authors thank Prof. Dr.: JC Martínez for his critical reading of the manuscript.
Conflicts of Interest
The authors have no conflicts of interests to be declared. There are no monetary interests to disclose.
Glossary
(L)= Lutein
(Z)= Zeaxanthin
(BLH)= blue light hazard
(MP)= macular pigment
(MPOD)= macular pigment optical density
(LEDs)= light emitting diodes
(CVS)= computer vision syndrome
(AMD)= age-related macular degeneration
(YW)= young women group
(OW)= old women group
(HFP)= heterochromatic flicker photometer
(MPS II) = Macular Pigment Screener II
(TTE)= Total time of Exposure
References
- Sliney, D.H.; Bergman, R.; O’Hagan, J. Photobiological Risk Classification of Lamps and Lamp Systems—History and Rationale. LEUKOS - Journal of Illuminating Engineering Society of North America 2016, 12, 213–234. [Google Scholar] [CrossRef]
- Moyano, D.B.; Sola, Y.; González-Lezcano, R.A. Blue-Light Levels Emitted from Portable Electronic Devices Compared to Sunlight. Energies 2020, 13. [Google Scholar] [CrossRef]
- Jaadane, I.; Boulenguez, P.; Chahory, S.; Carré, S.; Savoldelli, M.; Jonet, L.; Behar-Cohen, F.; Martinsons, C.; Torriglia, A. Retinal Damage Induced by Commercial Light Emitting Diodes (LEDs). Free Radic Biol Med 2015, 84, 373–384. [Google Scholar] [CrossRef] [PubMed]
- Randolph, S.A. Computer Vision Syndrome. Workplace Health & Safety 2017, 65, 328–328. [Google Scholar] [CrossRef]
- Wiggins, N.P.; Daum, K.M. Visual Discomfort and Astigmatic Refractive Errors in VDT Use. Journal of the American Optometric Association 1991, 62, 680–684. [Google Scholar] [PubMed]
- Gowrisankaran, S.; Sheedy, J.E. Computer Vision Syndrome: A Review. Work 2015, 52, 303–314. [Google Scholar] [CrossRef]
- Chu, C.A.; Rosenfield, M.; Portello, J.K. Blink Patterns: Reading from a Computer Screen versus Hard Copy. Optometry and Vision Science 2014, 1. [Google Scholar] [CrossRef]
- Tosini, G.; Ferguson, I.; Tsubota, K. Effects of Blue Light on the Circadian System and Eye Physiology. Molecular vision 2016, 22, 61–72. [Google Scholar]
- Chu, C.A.; Rosenfield, M.; Portello, J.K. Blink Patterns. Optometry and Vision Science 2014, 91, 1. [Google Scholar] [CrossRef]
- Thakur, S.; Dhakal, R.; Verkicharla, P.K. Short-Term Exposure to Blue Light Shows an Inhibitory Effect on Axial Elongation in Human Eyes Independent Of. 2021.
- Johannessen, S.; Høgsbro, M. Eclipse Retinopathy. Ugeskrift for laeger 2014, 176. [Google Scholar]
- Alaimo, A.; Liñares, G.G.; Bujjamer, J.M.; Gorojod, R.M.; Alcon, S.P.; Martínez, J.H.; Baldessari, A.; Grecco, H.E.; Kotler, M.L. Toxicity of Blue Led Light and A2E Is Associated to Mitochondrial Dynamics Impairment in ARPE-19 Cells: Implications for Age-Related Macular Degeneration. Archives of Toxicology 2019, 93, 1401–1415. [Google Scholar] [CrossRef] [PubMed]
- Arunkumar, R.; Calvo, C.M.; Conrady, C.D.; Bernstein, P.S. What Do We Know about the Macular Pigment in AMD: The Past, the Present, and the Future. Eye (Basingstoke) 2018, 32, 992–1004. [Google Scholar] [CrossRef] [PubMed]
- Thurnham, D.I. Macular Zeaxanthins and Lutein -- a Review of Dietary Sources and Bioavailability and Some Relationships with Macular Pigment Optical Density and Age-Related Macular Disease. Nutrition research reviews 2007, 20, 163–179. [Google Scholar] [CrossRef] [PubMed]
- Wilson, L.M.; Tharmarajah, S.; Jia, Y.; Semba, R.D.; Schaumberg, D.A.; Robinson, K.A. The Effect of Lutein/Zeaxanthin Intake on Human Macular Pigment Optical Density: A Systematic Review and Meta-Analysis. Advances in nutrition (Bethesda, Md.) 2021, 12, 2244–2254. [Google Scholar] [CrossRef]
- Widomska, J.; Paul Sangiovanni, J.; Subczynski, W.K. Why Is Zeaxanthin the Most Concentrated Xanthophyll in the Central Fovea? Nutrients 2020, 12. [Google Scholar] [CrossRef]
- Wilson, M.R.; Sandberg, K.A.; Foutch, B.K. Macular Pigment Optical Density and Visual Quality of Life. Journal of Optometry 2021, 14, 92–99. [Google Scholar] [CrossRef]
- Dietzel, M.; Zeimer, M.; Heimes, B.; Claes, B.; Pauleikhoff, D.; Hense, H.W. Determinants of Macular Pigment Optical Density and Its Relation to Age-Related Maculopathy: Results from the Muenster Aging and Retina Study (MARS). Investigative Ophthalmology and Visual Science 2011, 52, 3452–3457. [Google Scholar] [CrossRef]
- Keenan, T.D.; Agrón, E.; Mares, J.; Clemons, T.E.; van Asten, F.; Swaroop, A.; Chew, E.Y. Adherence to the Mediterranean Diet and Progression to Late Age-Related Macular Degeneration in the Age-Related Eye Disease Studies 1 and 2. In Proceedings of the Ophthalmology; Elsevier Inc., November 2020; Vol. 127, pp. 1515–1528.
- Lima, V.C.; Rosen, R.B.; Prata, T.S.; Dorairaj, S.; Spielberg, L.; Maia, M.; Sallum, J.M. Association of Age and Macular Pigment Optical Density Using Dual-Wavelength Autofluorescence Imaging. Clin Ophthalmol 2013, 7, 685–690. [Google Scholar] [CrossRef]
- Nolan, J.; O’Donovan, O.; Kavanagh, H.; Stack, J.; Harrison, M.; Muldoon, A.; Mellerio, J.; Beatty, S. Macular Pigment and Percentage of Body Fat. Investigative ophthalmology & visual science 2004, 45, 3940–3950. [Google Scholar] [CrossRef]
- Wolf-Schnurrbusch, U.E.K.; Röösli, N.; Weyermann, E.; Heldner, M.R.; Höhne, K.; Wolf, S. Ethnic Differences in Macular Pigment Density and Distribution. Investigative ophthalmology & visual science 2007, 48, 3783–3787. [Google Scholar] [CrossRef]
- Isaac, D.L.C.; de Ávila, M.P.; Cialdini, A.P. Comparison of the Original Amsler Grid with the Preferential Hyperacuity Perimeter for Detecting Choroidal Neovascularization in Age-Related Macular Degeneration. Arquivos Brasileiros de Oftalmologia 2007, 70, 771–776. [Google Scholar] [CrossRef] [PubMed]
- WHO Consultation on Obesity (1999: Geneva S.; Organization W.H. Obesity: preventing and managing the global epidemic: report of a WHO consultation; WHO technical report series; 894; World Health Organization: Geneva PP - Geneva, 2000.
- Murray, I. Measuring Macular Pigment. 32–34.
- Abell, R.G.; Hewitt, A.W.; Andric, M.; Allen, P.L.; Verma, N. The Use of Heterochromatic Flicker Photometry to Determine Macular Pigment Optical Density in a Healthy Australian Population. Graefe’s Archive for Clinical and Experimental Ophthalmology 2014, 252, 417–421. [Google Scholar] [CrossRef] [PubMed]
- Van Der Veen, R.L.P.; Berendschot, T.T.J.M.; Hendrikse, F.; Carden, D.; Makridaki, M.; Murray, I.J. A New Desktop Instrument for Measuring Macular Pigment Optical Density Based on a Novel Technique for Setting Flicker Thresholds. Ophthalmic and Physiological Optics 2009, 29, 127–137. [Google Scholar] [CrossRef] [PubMed]
- Miguel Angel Martínez-González, Ana García-Arellano, Estefanía Toledo, et al. A 14-Item Mediterranean Diet Assessment Tool and Obesity Indexes among High-Risk Subjects: The PREDIMED Trial. PLoS ONE 7(8): e43134. 2012. [CrossRef]
- Olmedilla-Alonso, B.; Beltrán-de-Miguel, B.; Estévez-Santiago, R.; Cuadrado-Vives, C. Markers of Lutein and Zeaxanthin Status in Two Age Groups of Men and Women: Dietary Intake, Serum Concentrations, Lipid Profile and Macular Pigment Optical Density. Nutrition Journal 2014, 13, 52. [Google Scholar] [CrossRef]
- Pokorny, J.; Smith, V.C.; Lutze, M. Aging of the Human Lens. Applied Optics 1987, 26, 1437. [Google Scholar] [CrossRef]
- Ozawa, Y.; Shigeno, Y.; Nagai, N.; Suzuki, M.; Kurihara, T.; Minami, S.; Hirano, E.; Shinoda, H.; Kobayashi, S.; Tsubota, K. Absolute and Estimated Values of Macular Pigment Optical Density in Young and Aged Asian Participants with or without Age-Related Macular Degeneration. BMC Ophthalmology 2017, 17, 1–6. [Google Scholar] [CrossRef]
- Scott, T.M.; Rasmussen, H.M.; Chen, O.; Johnson, E.J. Avocado Consumption Increases Macular Pigment Density in Older Adults: A Randomized, Controlled Trial. Nutrients 2017, 9, 919. [Google Scholar] [CrossRef]
- Nolan, J.M.; Kenny, R.; O’Regan, C.; Cronin, H.; Loughman, J.; Connolly, E.E.; Kearney, P.; Loane, E.; Beatty, S. Macular Pigment Optical Density in an Ageing Irish Population: The Irish Longitudinal Study on Ageing. Ophthalmic research 2010, 44, 131–139. [Google Scholar] [CrossRef]
- Hong, I.H.; Jung, W.H.; Lee, J.H.; Chang, I.B. Macular Pigment Optical Density in the Korean Population: A Cross Sectional Study. Journal of Korean Medical Science 2020, 35. [Google Scholar] [CrossRef]
- Pipis, A.; Touliou, E.; Augustin, A.J. Macular Pigment Optical Density in a Central European Population. Ophthalmic Surgery, Lasers and Imaging Retina 2013, 44, 260–267. [Google Scholar] [CrossRef]
- Obana, A.; Gohto, Y.; Asaoka, R.; Gellermann, W.; Bernstein, P.S. Lutein and Zeaxanthin Distribution in the Healthy Macula and Its Association with Various Demographic Factors Examined in Pseudophakic Eyes. Antioxidants 2021, 10. [Google Scholar] [CrossRef] [PubMed]
- Berendschot, T.T.J.M.; Van Norren, D. On the Age Dependency of the Macular Pigment Optical Density. Experimental Eye Research 2005, 81, 602–609. [Google Scholar] [CrossRef] [PubMed]
- Hammond, J.; Ciulla, T.A.; Snodderly, D.M. Macular Pigment Density Is Reduced in Obese Subjects. Investigative Ophthalmology and Visual Science 2002, 43, 47–50. [Google Scholar] [PubMed]
- Johnson, E.J.; Hammond, B.R.; Yeum, K.J.; Qin, J.; Wang, X.D.; Castaneda, C.; Snodderly, D.M.; Russell, R.M. Relation among Serum and Tissue Concentrations of Lutein and Zeaxanthin and Macular Pigment Density. The American journal of clinical nutrition 2000, 71, 1555–1562. [Google Scholar] [CrossRef]
- Yu, J.; Johnson, E.J.; Shang, F.; Lim, a.; Zhou, H.; Cui, L.; Xu, J.; Snellingen, T.; Liu, X.; Wang, N.; et al. Measurement of Macular Pigment Optical Density in a Healthy Chinese Population Sample. Investigative Ophthalmology & Visual Science 2012, 53, 2106–2111. [Google Scholar] [CrossRef]
- Wilson, L.M.; Tharmarajah, S.; Jia, Y.; Semba, R.D.; Schaumberg, D.A.; Robinson, K.A. The Effect of Lutein/Zeaxanthin Intake on Human Macular Pigment Optical Density: A Systematic Review and Meta-Analysis. Advances in Nutrition 2021, 12, 2244–2254. [Google Scholar] [CrossRef]
- Estévez-Santiago, R.; Olmedilla-Alonso, B.; Beltrán-de-Miguel, B.; Cuadrado-Vives, C. Lutein and Zeaxanthin Supplied by Red/Orange Foods and Fruits Are More Closely Associated with Macular Pigment Optical Density than Those from Green Vegetables in Spanish Subjects. Nutrition Research 2016, 36, 1210–1221. [Google Scholar] [CrossRef]
- Theruveethi, N.; Bui, B.V.; Joshi, M.B.; Valiathan, M.; Ganeshrao, S.B.; Gopalakrishnan, S.; Kabekkodu, S.P.; Bhat, S.S.; Surendran, S. Blue Light-Induced Retinal Neuronal Injury and Amelioration by Commercially Available Blue Light-Blocking Lenses. Life 2022, 12. [Google Scholar] [CrossRef]
- Moon, J.; Yun, J.; Yoon, Y.D.; Park, S. Il; Seo, Y.J.; Park, W.S.; Chu, H.Y.; Park, K.H.; Lee, M.Y.; Lee, C.W.; et al. Blue Light Effect on Retinal Pigment Epithelial Cells by Display Devices. Integrative Biology (United Kingdom) 2017, 9, 436–443. [Google Scholar] [CrossRef]
Figure 1.
Time of exposure to SSL screens vs population (YW: young women, OW: old women). A significant difference in the TE to all kind of screens between the two age groups was observed, with YW having a significantly higher TE (p<0.01) to LEDs than the OW group (9.31 ± 3.74 vs 6.33 ± 3.64).
Figure 1.
Time of exposure to SSL screens vs population (YW: young women, OW: old women). A significant difference in the TE to all kind of screens between the two age groups was observed, with YW having a significantly higher TE (p<0.01) to LEDs than the OW group (9.31 ± 3.74 vs 6.33 ± 3.64).
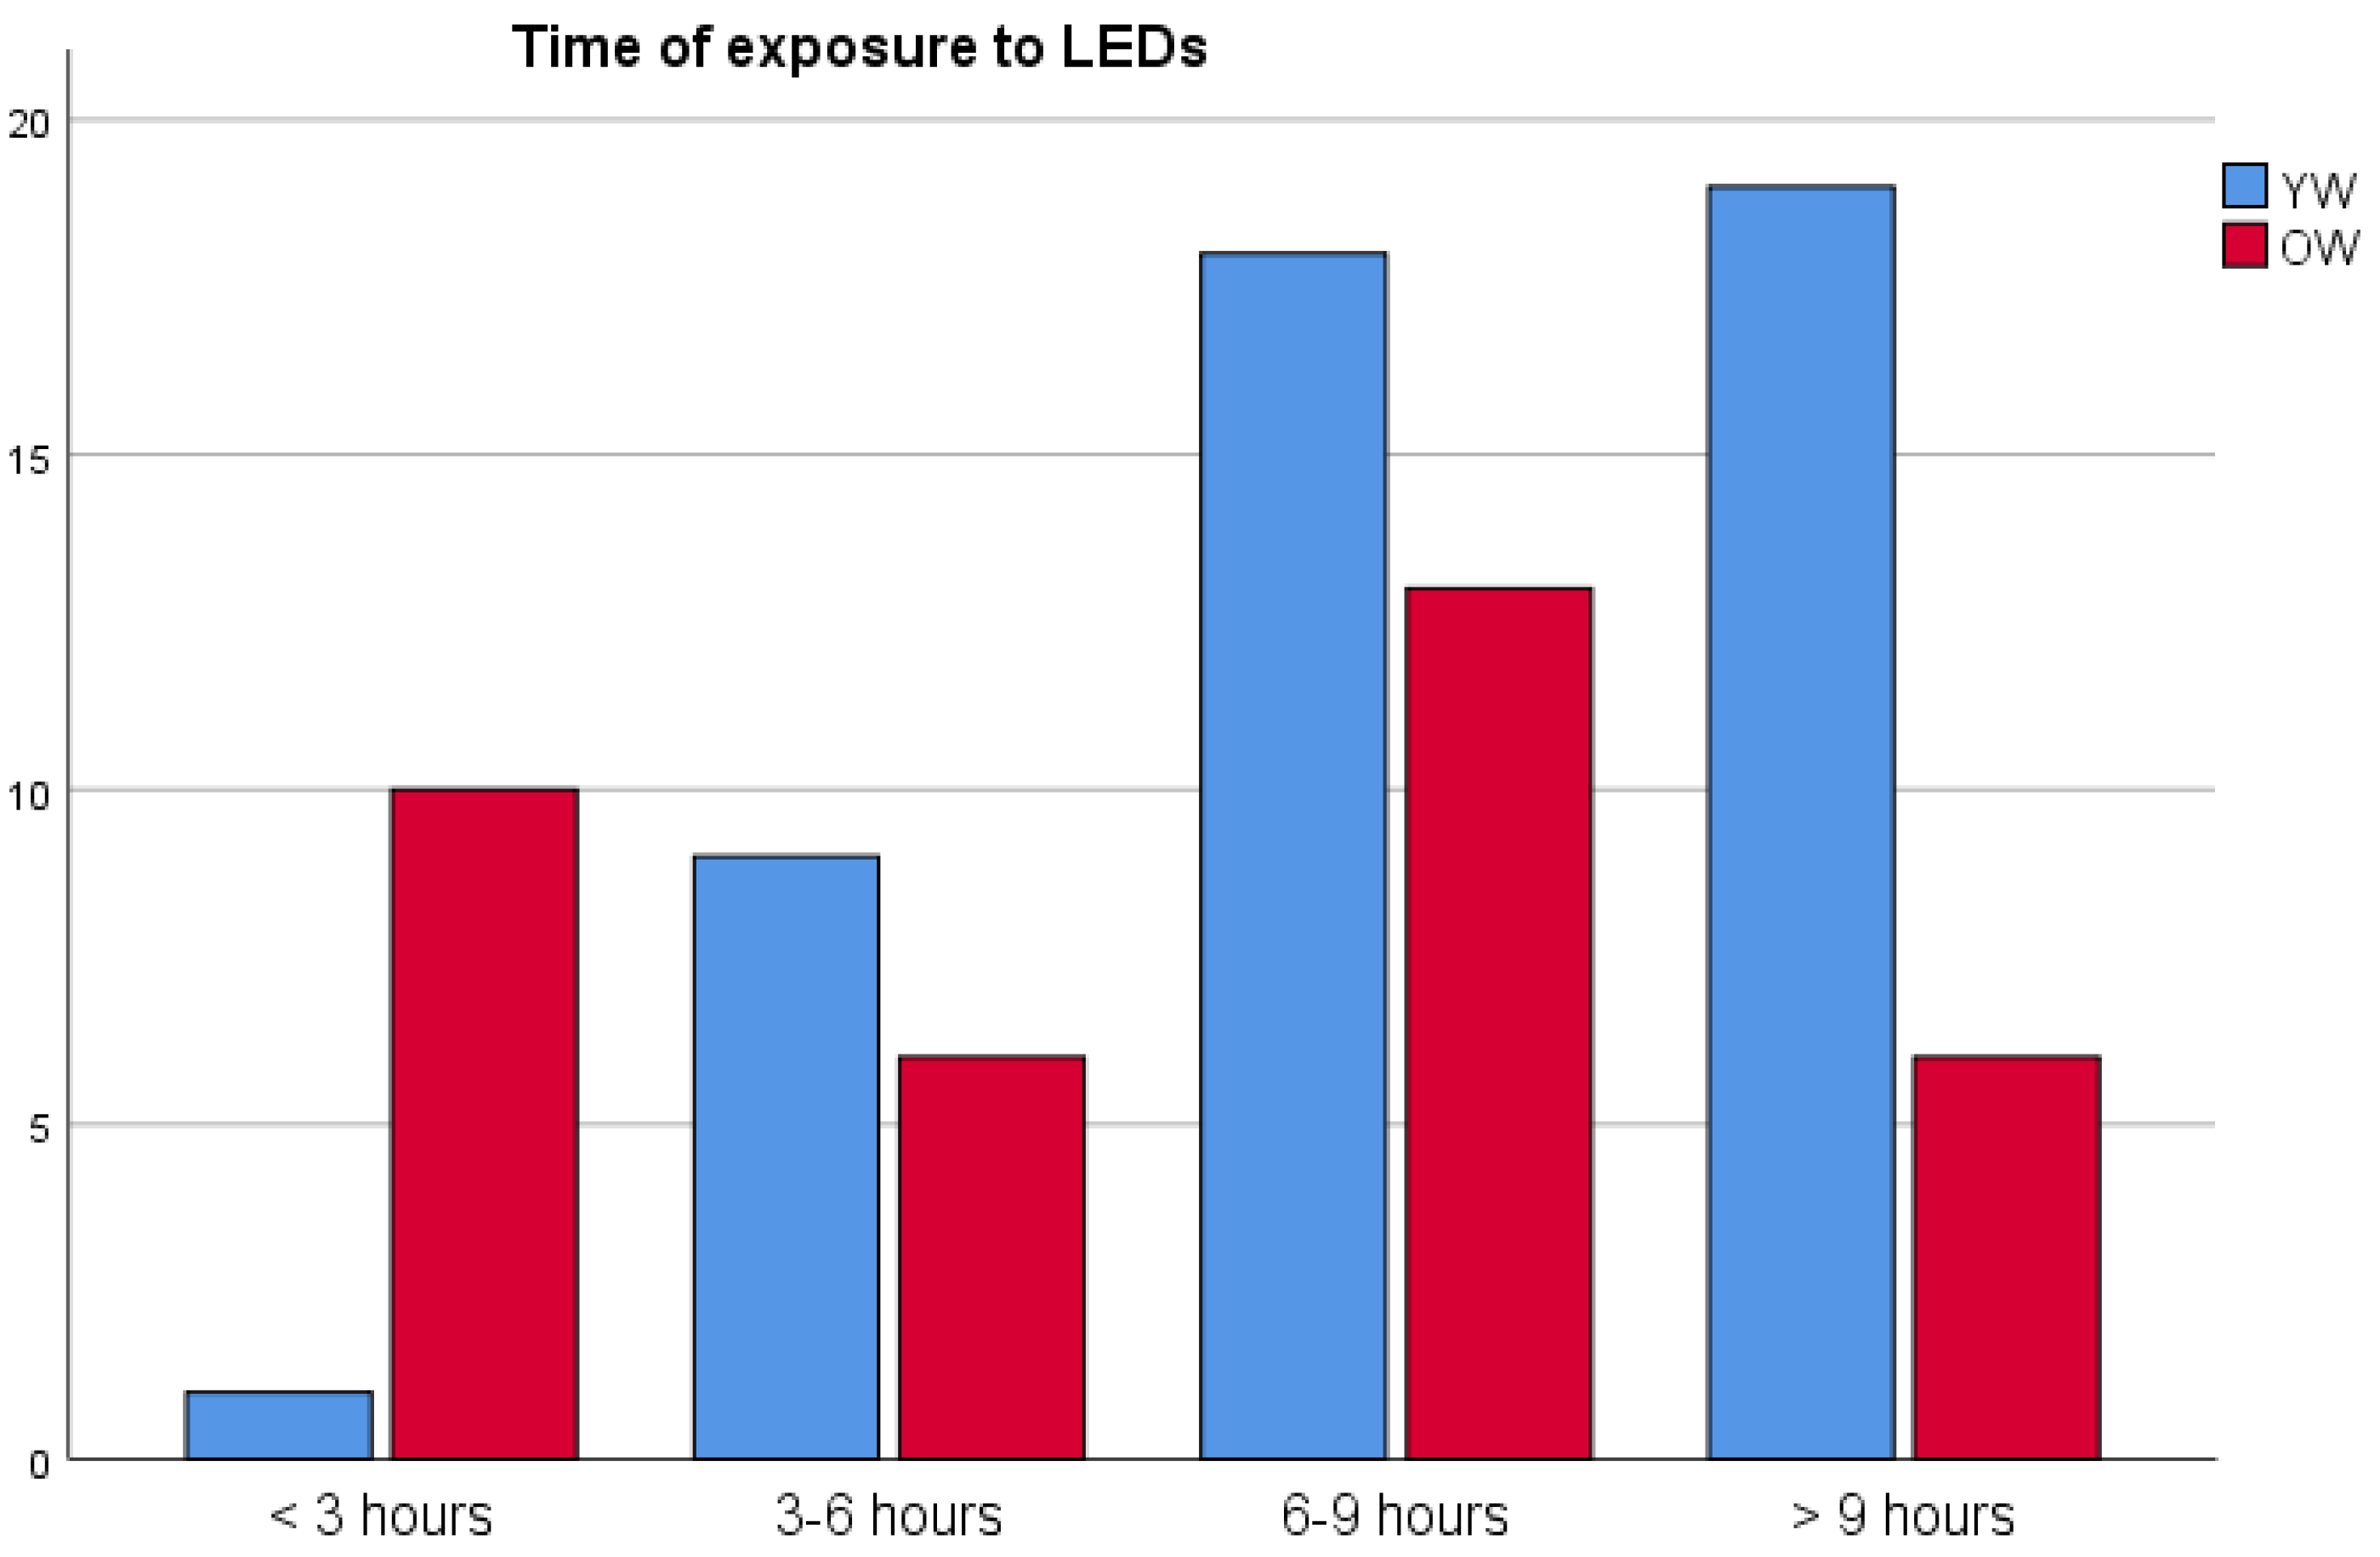
Figure 2.
Macular pigment optical density (MPOD) (mean ± 95% confidence interval) in relation to time of exposure to SSL screens (hours/day), grouped by age. (YW: young women, OW: old women).
Figure 2.
Macular pigment optical density (MPOD) (mean ± 95% confidence interval) in relation to time of exposure to SSL screens (hours/day), grouped by age. (YW: young women, OW: old women).
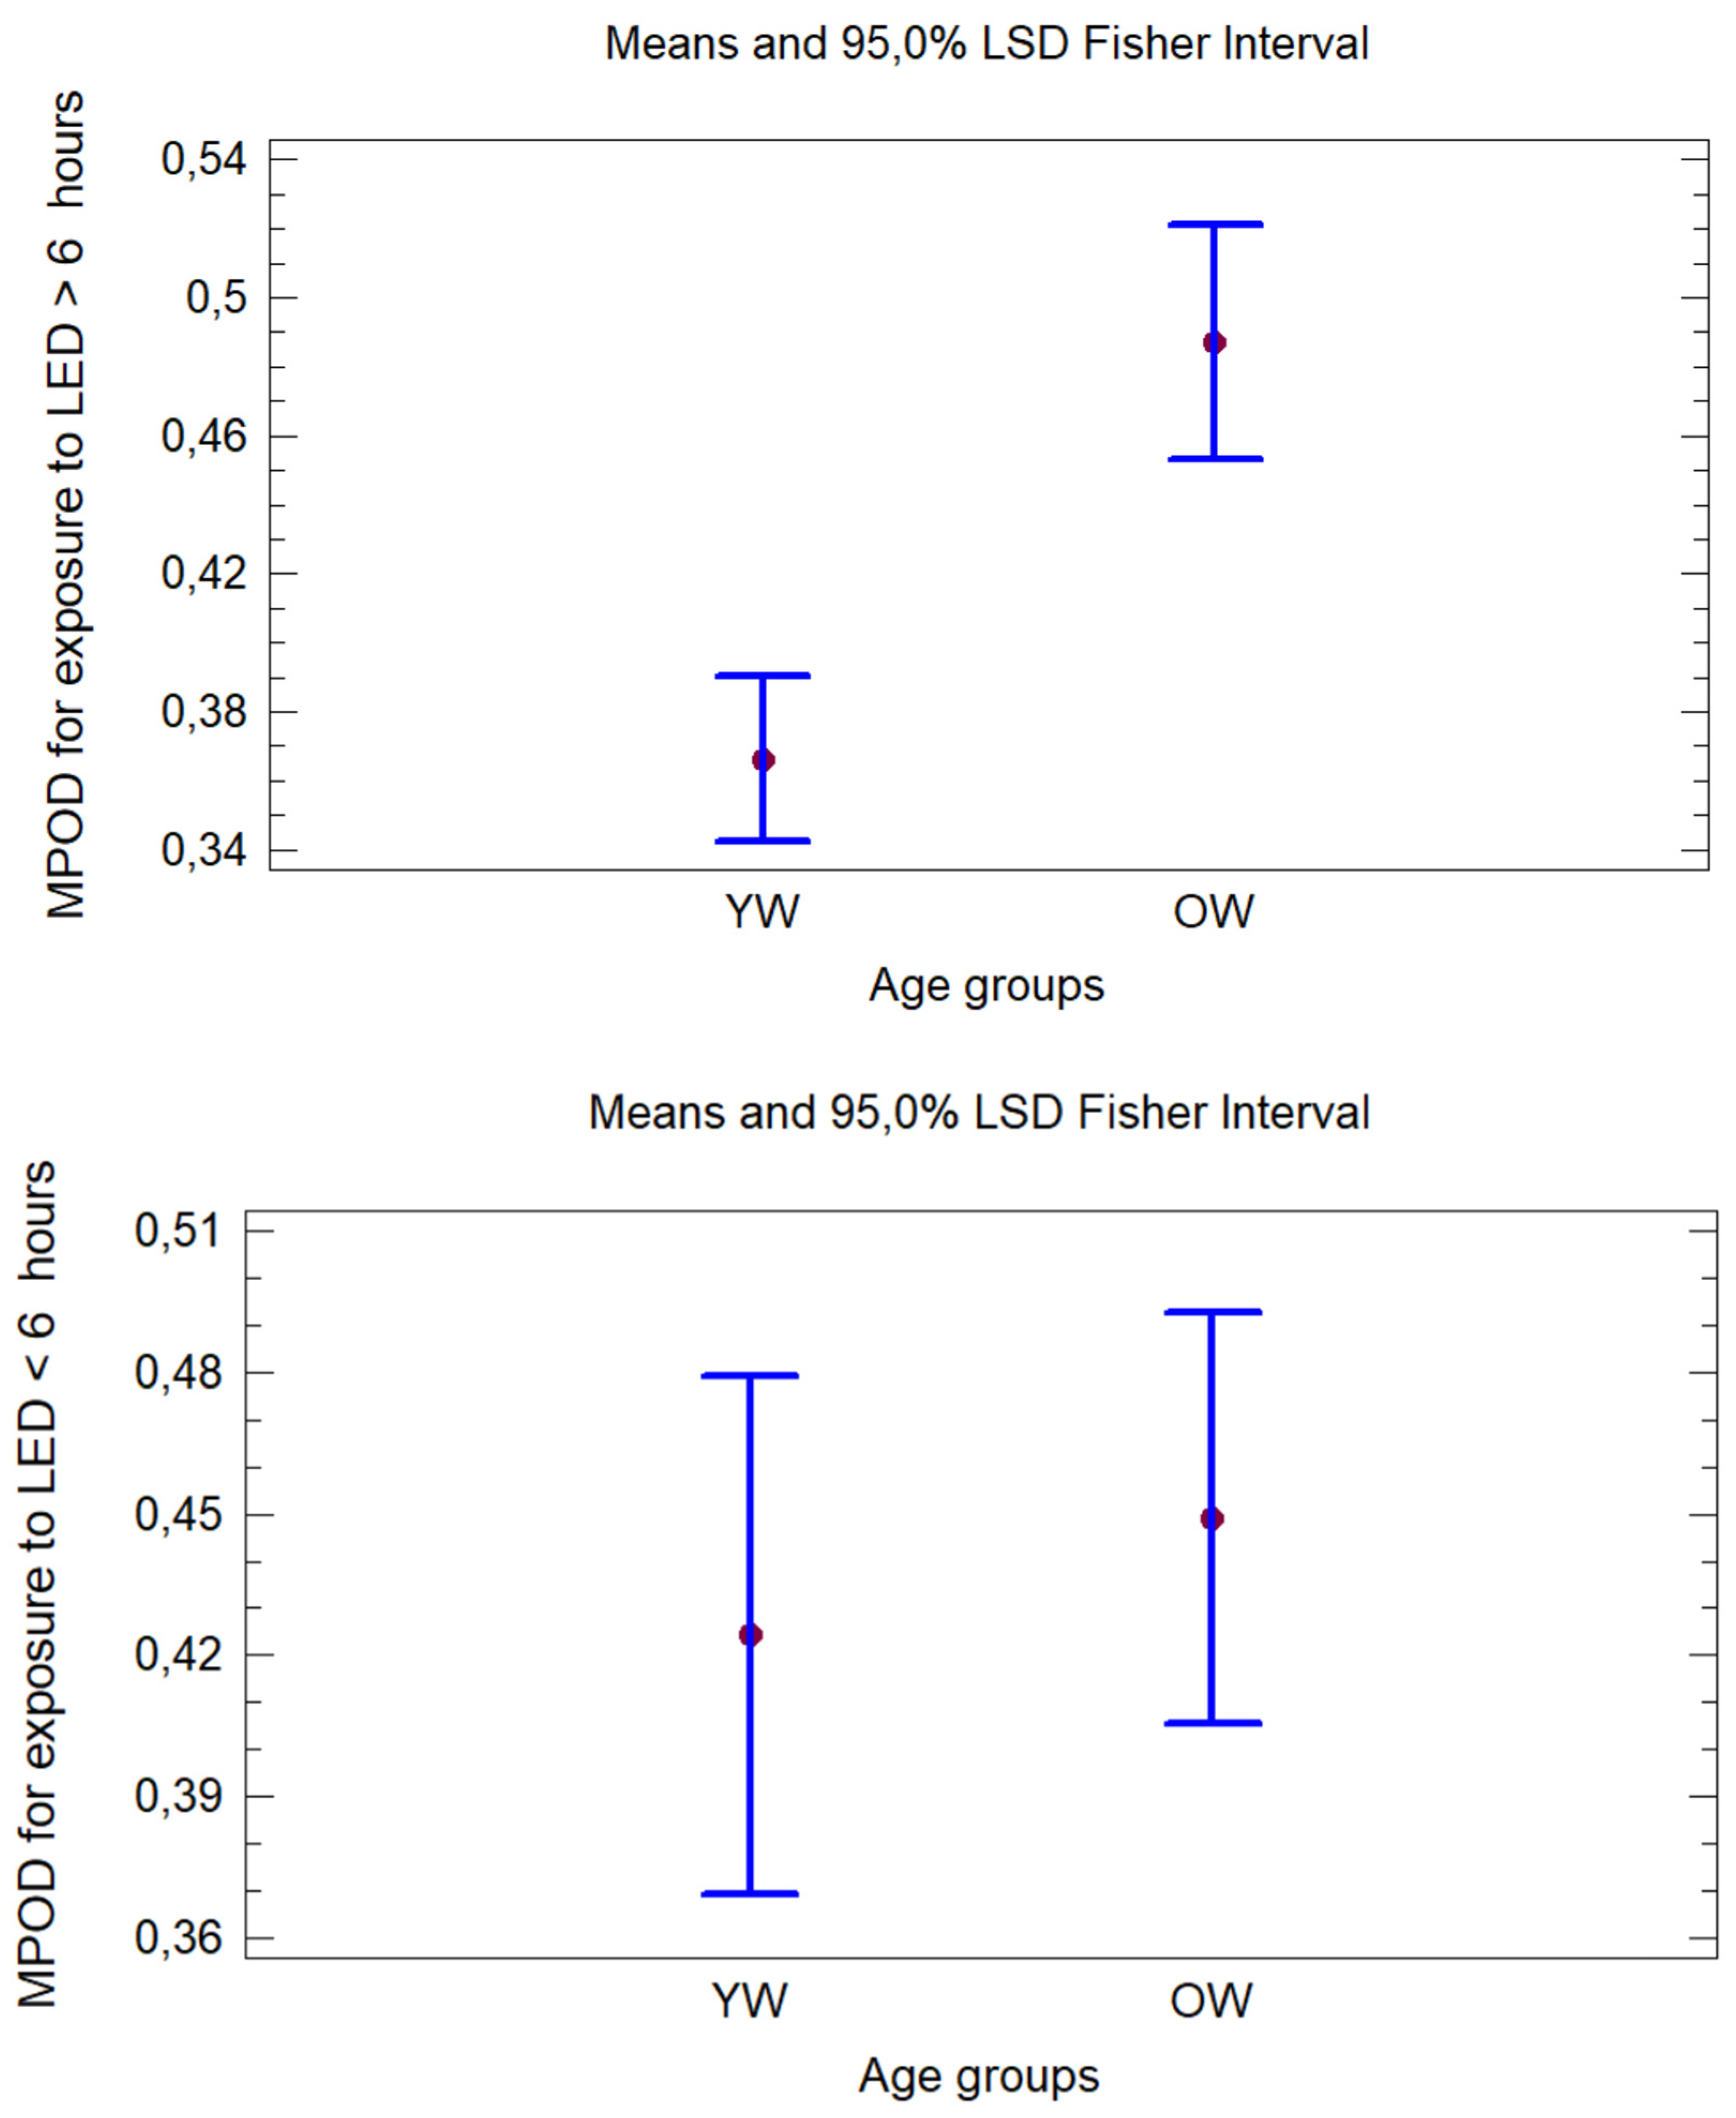

Table 1.
Analysis of the macular pigment optical density (MPOD) values considering population characteristics, such as age, body mass index (BMI), time of exposure to LEDs devices, Mediterranean Diet or Dietary background.
Table 1.
Analysis of the macular pigment optical density (MPOD) values considering population characteristics, such as age, body mass index (BMI), time of exposure to LEDs devices, Mediterranean Diet or Dietary background.
| Factors (mean±sd) | Absolute MPOD (mean±sd) | Estimated MPOD (mean±sd) | |||||||
| Total Sample (n=82) | Young Women (YW) (n=47) | Old Women (OW) (n=35) | Total Sample | YW | OW | Total Sample | YW | OW | |
| Age (y) Range (min-max) |
36.8 ± 16,2 20-70 |
23,6 ± 2,2a 20-31 |
54,5 ± 7,5b 42-70 |
0,42 ± 0,16 (0,12 – 0,89) |
0,38 ± 0,15a (0,12-0,70) |
0,47 ± 0,16b (0,17-0,89) |
0,43 ± 0,16 (0,10–0,86) |
0,39 ± 0,15a (0,12-0,86) |
0,47 ± 0,15b (0,10-0,72) |
| BMI (kg/m2) Range (min-max) BMI distribution (n (%)) Underweight Normal weight Weight excess (overweight + obesity) |
22,9 ± 3,9 16,3-35,4 7 (8,5%) 54 (65,9%) 19 (23,2%) |
21,9 ± 3,5a 16,7-34,3 4 (8,7%) 36 (78,3%) 6 (13,0%) |
24,1±4,2b 16,3-35,4 3 (8,8%) 18 (52,9%) 13 (23,8%) |
0,39 ± 0,16 0,40 ± 0,17 0,48 ± 0,11 |
0,31 ± 0,19 0,38 ± 0,15 0,46 ± 0,09 |
0,48 ± 0,02 0,46 ± 0,20 0,49 ± 0.11 |
0,43 ± 0,14 0,43 ± 0,16 0,43 ± 0,15 |
0,37 ± 0,16 0,40 ± 0,16 0,41 ± 0,16 |
0,51 ± 0,06 0,49 ± 0,16 0,43 ± 0,16 |
| Time of exposure hour/day (h/d) to Leds < 6 h/d > 6 h/d |
8,0 ± 4,0 26 (31,7%) 56 (68,3%) |
9,3 ± 3,7a 10 (21,3%) 37 (78,7%) |
6,3 ± 3,6b 16 (45,7%) 19 (54,3%) |
0,45 ± 0,17 0,41 ± 0,15 |
0,46 ± 0,15 0,37 ± 0,14a |
0,45 ± 0,18 0,50 ± 0,14b |
0,43 ± 0,17 0,42 ± 0,15 |
0,44 ± 0,15 0,38 ± 0,16a |
0,43 ± 0,18 0,50 ± 0,12b |
| Mediterranean diet score (14 points) Range (min-max) weak adherence ≤5 n, (%) moderate to fair adherence 6–9, n (%) good or very good adherence ≥10, n (%) |
8,4 ± 2,4 1-13 9 (11,0%) 47 (57,3%) 26 (31,7%) |
7,7 ± 2,1a 2-11 7 (14,9%) 31 (66,0%) 9 (19,1%) |
9,2 ± 2,5b 1-13 2 (5,7%) 16 (45,7%) 17 (48,6%) |
0,45 ± 0.181,2 0,38 ± 0.151 0,49 ± 0.142 |
0,43 ± 0,18 0,36 ± 0,15 0,44 ± 0,10 |
0,53 ± 0,24 0,43 ± 0,15 0.48 ± 0,16 |
0,46 ± 0,15 0,39 ± 0,16 0,47 ± 0,13 |
0,42 ± 0,15 0,37 ± 0,16 0,44 ± 0,14 |
0,57 ± 0,06 0,42 ± 0,18 0,49 ± 0,12 |
| Dietary background (rations per day or week) Olive oil (≥4 d) YES NO Fruit (≥ 3 d) YES NO Vegetable (≥2 d) YES NO Fruit (≥ 3 d) and vegetable (≥2 d) YES One of two things NO Fish consumption (≥3 w) YES NO |
58 (70,7%) 24 (29,3%) 31 (37,8%) 51 (62,2%) 46 (56,1%) 36 (43,9%) 23 (28%) 31 (37,8%) 28 (34.1%) 28 (34,1%) 54 (65,9%) |
30 (63,8%) 17 (36,2%) 14 (29,8%) 33 (70,2%) 23 (48,9 %) 24 (51,1%) 8 (17%)a 21 (44.7%)a 18 (38,3%)a 13 (27,7%) 34 (72,3%) |
28 (80,0%) 7 (20,0%) 18 (51,4%) 17 (48,6%) 23 (65,7%) 12 (34,3%) 15 (42,9%)b 10 (28.6%)b 10 (28.6%)b 15 (42,9%) 20 (57,1%) |
0,42 ± 0,16 0,42 ± 0,15 0,46 ± 0,141 0,38 ± 0.172 0,44 ± 0,15 0,40 ± 0,17 0,46 ± 0,15 0,38 ± 0,17 0,41 ± 0,15 0,44 ± 0,15 0,42 ± 0,16 |
0,37 ± 0,14 0,40 ± 0,15 0,44 ± 0,121 0,34 ± 0,182.a 0,39 ± 0,12 0,37 ± 0,17 0,45 ± 0,13 0,33 ± 0,18a 0,39 ± 0,16 0,40 ± 0,12 0,37 ± 0,17 |
0,48 ± 0,16 0,47 ± 0,16 0,48 ± 0,15 0,46 ± 0,14b 0,48 ± 0,16 0,46 ± 0,16 0,47 ± 0,17 0,48 ± 0,10b 0,44 ± 0,13 0,46 ± 0,14 0,49 ± 0,18 |
0,43 ± 0,15 0,42 ± 0,16 0,44 ± 0,13 0,41 ± 0,17 0,43 ± 0,13 0,41 ± 0,18 0,45 ± 0,17 0,42 ± 0,17 0,42 ± 0,14 0,46 ± 0,16 0,41 ± 0,15 |
0,37 ± 0,15 0,44 ± 0,15 0,43 ± 0,11 0,38 ± 0,17a 0,40 ± 0,13 0,39 ± 0,18 0,46 ± 0,15 0,37 ± 0,15a 0,41 ± 0,15 0,40 ± 0,13 0,39 ± 0,18 |
0,48 ± 0,15 0,43 ± 0,16 0,45 ± 0,14 0,48 ± 0,16b 0,47 ± 0,13 0,46 ± 0,18 0,45 ± 0,18 0,53 ± 0,16b 0,45 ± 0,15 0,45 ± 0,13 0,48 ± 0,16 |
For each variable, different letters indicate significant differences (p<0.05) between YW and OW columns, and, different numbers indicate significant difference among rows in the same column for each variable.
Table 2.
Time of exposure (mean ± standard deviation) in hours/day for different devices containing LEDs as light source, for the two groups of women: the younger group (YW) and the older group (OW).
Table 2.
Time of exposure (mean ± standard deviation) in hours/day for different devices containing LEDs as light source, for the two groups of women: the younger group (YW) and the older group (OW).
| Device | YW | OW |
| Mobile phone | 4.60±2.28 | 1.57±1.17** |
| Laptop | 2.73±2.32 | 1.08±1.60** |
| TV | 1.95±1.24 | 2.20±1.44 |
| Tablet | 0.76±1.21 | 0.31±0.69 |
| PC | 0.59±1.67 | 3.00±3.23* |
| Total LEDs | 9.31± 3.74 | 6.33± 3.64* |
*(p<0.05) ** (p<0.01).
Disclaimer/Publisher’s Note: The statements, opinions and data contained in all publications are solely those of the individual author(s) and contributor(s) and not of MDPI and/or the editor(s). MDPI and/or the editor(s) disclaim responsibility for any injury to people or property resulting from any ideas, methods, instructions or products referred to in the content. |
© 2024 by the authors. Licensee MDPI, Basel, Switzerland. This article is an open access article distributed under the terms and conditions of the Creative Commons Attribution (CC BY) license (https://creativecommons.org/licenses/by/4.0/).
Copyright: This open access article is published under a Creative Commons CC BY 4.0 license, which permit the free download, distribution, and reuse, provided that the author and preprint are cited in any reuse.


