
Submitted:
17 September 2024
Posted:
18 September 2024
You are already at the latest version
Abstract
Background: Synovial sarcoma is a rare soft tissue tumor that constitutes 5-10% of all soft tissue sarcomas. Early diagnosis and risk stratification are essential for effective management. This study leverages machine learning models to improve the risk stratification of mortality in synovial sar-coma patients.
Methods: This retrospective cohort study utilized data from the Surveillance, Epidemiology, and End Results (SEER) database to analyze patients diagnosed with synovial sarcoma between 2004 and 2015, as well as a validation cohort diagnosed from 2018 onward. The dataset encompassed demographic data, clinical characteristics, staging, treatment modalities, and outcomes. Four ma-chine learning models—support vector classifier (SVC), k-nearest neighbors (KNN), Gaussian naive Bayes, and gradient boosting—were trained and evaluated. Model performance was assessed using sensitivity, specificity, AUC-ROC, and Brier score. SHAP analysis was performed to determine the most influential features impacting model predictions. The top-performing model was validated using the 2018+ cohort.
Results: The study included a total of 762 patients, with an average age of 39.4 years. The support vector classifier (SVC) outperformed the other models, achieving an AUC-ROC of 0.8153 (95% CI: 0.7578 to 0.8677) and a Brier score of 0.1715. Upon external validation with the 2018+ cohort, the SVC model yielded an AUC-ROC of 0.8179 (95% CI: 0.7632 to 0.8666). Key prognostic factors identified through SHAP analysis included tumor size, patient age, presence of metastasis, tumor differentiation, and cancer stage.
Conclusion: Machine learning models can be used to stratify the risk of death in synovial sarcoma patients effectively, with the support vector classifier showing the most promise.
Keywords:
Machine Learning
; Synovial Sarcoma
; Artificial Intelligence
; Mortality
1. Introduction
Synovial sarcoma (SS) is a rare type of soft tissue sarcoma (STS) that accounts for 5 to 10% of all STS cases [1]. Despite the combination of surgery, radiotherapy, and chemotherapy, the 5-year survival rate for patients has not improved over the past three decades and remains at approximately 60% [2]. Risk factors for the recurrence of the primary tumor include larger tumor size, poorly differentiated tumors, positive surgical margins, and previous recurrence [3,4]. Early diagnosis and risk stratification of patients are crucial for proper management.
The SEER (Surveillance, Epidemiology, and End Results) database is a large dataset that gathers information about patients diagnosed with various types of cancer, including their demographics, clinicopathologic details, and survival data. This dataset is frequently used for survival analysis, particularly for rare diseases [5]. The availability of extensive data from the SEER database allows machine learning to identify patterns and predict patient survival.
The role of machine learning in clinical decision-making is growing. Unlike traditional models, machine learning algorithms can capture complex patterns in the data and have been successfully used to predict various outcomes [6]. They have been largely used in the field of oncology for cancer diagnosis, prognostication, and treatment [7,8].
The aim of this study was to develop and validate a machine learning model for the risk stratification of mortality in patients with synovial sarcoma. Insights from this study can lead to better detection of high-risk patients and a more individualized approach to their treatment.
2. Materials and Methods
2.1. Study Population and Data
This retrospective cohort study analyzed data from a database, focusing on patients who were diagnosed with any type of SS at any anatomical location between 2004 and 2015 and 2018 onward. The data collected for each patient included demographic information, clinical characteristics, staging information, treatment modalities, and patient outcomes.
The demographic variables included age, sex, and race. Age was represented in 5-year intervals in the SEER dataset, with the midpoint of each interval used to calculate the patient’s age. Sex was categorized as male or female, and race was represented as white, black or other.
Clinical characteristics included tumor size, primary tumor site, tumor grade, stage, and histological type. Tumor size was measured in millimeters. The primary tumor site was categorized into the lower limb and hip, trunk, upper limb, head/face/neck, heart, retroperitoneum, or anterior mediastinum. Tumor grades were recorded as well differentiated (Grade I), moderately differentiated (Grade II), poorly differentiated (Grade III), undifferentiated/anaplastic (Grade IV), or not otherwise specified (Grade NOS). The histological types included synovial sarcoma not otherwise specified (NOS), biphasic synovial sarcoma, and spindle cell synovial sarcoma. Staging information was determined using the TNM classification, and overall stage was recorded accordingly. Data on whether patients received surgery, radiation therapy, or chemotherapy were also collected. Survival time posttreatment was recorded in months. Patients’ status was encoded as either dead or alive. Thus, the study evaluated overall survival of SS.
Only patients with complete data were included in the analysis, and patients with missing data were excluded to ensure the integrity and accuracy of the study.
2.2. Statistical Analysis and Model Training
All statistical analysis and machine learning implementation was done using python programming language and Scikit learn and SciPy frameworks.
The data were analyzed using descriptive statistics to summarize the demographics and clinical characteristics of the study population. Continuous variables were expressed as the mean and standard deviation (SD), while categorical variables are presented as frequencies and percentages.
Categorical data were encoded using one-hot encoding [9], and numerical data were normalized using a standard scaler.
Outcome of patient who died of any cause was encoded as 1 and for alive patients as 0.
Four machine learning models were developed and evaluated using the collected data to predict patient outcomes: support vector classifier (SVC), k-nearest neighbors (k-NN) classifier, Gaussian naive Bayes classifier, and gradient boosting model. These models represent four distinct algorithms, providing varied approaches to the data.
The four machine learning models developed for predicting patient outcomes employ distinct methodologies. The Support Vector Classifier (SVC) identifies the optimal hyperplane to separate data points into different classes, making it suitable for scenarios with well-defined class boundaries [10]. The k-Nearest Neighbors (k-NN) classifier bases its predictions on the majority class among the nearest neighbors in the feature space, which can be effective for local pattern recognition but is computationally intensive for large datasets [11]. Gaussian Naive Bayes relies on the assumption that features follow a Gaussian distribution and uses Bayes’ theorem to calculate class probabilities, offering a fast, probabilistic approach, though it may be less accurate in cases of feature dependency or non-normality [12]. Gradient Boosting is an ensemble technique that iteratively constructs decision trees, each focused on correcting errors made by the previous trees, allowing for high predictive accuracy but requiring careful tuning and substantial computational resources [13]. Each model’s performance varies based on data characteristics such as feature distributions and complexity.
Each model was trained and tested on the dataset, with performance metrics such as sensitivity, specificity, positive likelihood ratio, negative likelihood ratio, positive predictive value, negative predictive value, overall accuracy, and AUC-ROC score calculated for evaluation. The Brier score was used to assess model calibration [14].
The data were split into training (70%) and test sets (30%). The training set was used to develop the models, while the test set was used to evaluate their performance. A random state of 42 was used for the data split to ensure reproducibility. The 2018 onward cohort was used for external validation. Five fold cross validation was used during training.
SHapley Additive exPlanations (SHAP) analysis was subsequently conducted for the best-performing model to identify the most influential features for predicting mortality [15].
3. Results
3.1. Demographics
2004 to 2015 cohort:
The dataset comprises a sample size of 762 patients, with a nearly balanced sex distribution, 51.18% female (n = 390) and 48.82% male (n = 372). The racial composition was predominantly white (79.13%, n = 603), followed by black (20.87%, n = 159). The patients had a mean age of 39.40 years (SD = 18.72). The tumor sizes ranged from 4 to 195 mm, with an average of 76.55 mm (SD = 47.13). The survival time posttreatment varied significantly, averaging 88.08 months (SD = 60.95).
The primary tumor site for most patients was the lower limb and hip (36.22%, n = 276), followed by the trunk (8.66%, n = 66) and the upper limb (5.38%, n = 41). Other notable sites included the head, face, neck (4.46%, n = 34), heart (3.28%, n = 25), and anterior mediastinum (0.52%, n = 4).
Tumor grading revealed a diverse distribution, with the majority being moderately differentiated (grade II) at 29.53% (n = 225), poorly differentiated (grade III) at 18.11% (n = 138), well differentiated (grade I) at 1.57% (n = 12), and undifferentiated or anaplastic (grade IV) at 5.25% (n = 40). A significant portion of the patients (45.54%, n = 347) had a grade of unspecified NOS.
Histologically, synovial sarcoma, NOS, was the most common type, accounting for 38.32% (n = 292) of cases. Other histological types included biphasic synovial sarcoma (7.61%, n = 58), spindle cell synovial sarcoma (5.91%, n = 45), and various other subtypes.
Tumor size classification (T) revealed a variety of presentations: T2NOS (24.8%, n = 189), T2b (16.27%, n = 124), T1a (8.92%, n = 68), T1b (8.53%, n = 65), T2a (6.30%, n = 48), T1NOS (5.91%, n = 45), and several others with smaller frequencies. A notable portion was not specified (20.87%, n = 159).
Most patients had no lymph node involvement (N0, 92.52%, n = 705), while 7.48% (n = 57) had nodal involvement (N1). Regarding metastasis, the majority were nonmetastatic (M0, 90.68%, n = 691), with 9.32% (n = 71) presenting with metastasis (M1).
Staging at diagnosis was diverse: stage IA (16.54%, n = 126), stage IB (8.13%, n = 62), stage IIA (14.17%, n = 108), stage IIB (5.38%, n = 41), stage III (11.55%, n = 88), and stage IV (7.74%, n = 59). A significant proportion of patients had unspecified staging (INOS, 36.49%, n = 278).
Treatment modalities varied, with 67.59% (n = 515) of patients receiving radiation therapy and 32.41% (n = 247) not receiving radiation therapy. Chemotherapy was administered to 51.84% (n = 395) of patients, 48.16% (n = 367) of whom did not receive it. Surgical intervention was the most common treatment, performed on 93.18% (n = 710) of patients.
Regarding outcomes, 72.95% (n = 556) of patients were alive at the last follow-up, whereas 26.25% (n = 200) had succumbed to soft tissue-related conditions, including cardiac involvement. The remaining patients were lost to follow-up or had unspecified outcomes.
2018+ cohort:
The dataset consisted of 375 patients. The average age of the patients was 39.91 years, with a standard deviation of 19.78 years. The average tumor size was 141.60 mm, with a standard deviation of 244.67 mm.
In terms of categorical variables, 64% of the patients were female (240 patients), while 36% were male (135 patients). Regarding race, 72% of the patients were White (270 patients), 16% were categorized as Other (60 patients), and 12% were Black (45 patients). The most common tumor site was the lower limb and hip, accounting for 53.33% of cases, followed by other locations like the upper limb, shoulder, and trunk. The predominant tumor histology was synovial sarcoma, spindle cell, which represented 58.67% of the cases.
For the T (Tumor) classification, 38.13% of the patients (143 individuals) were classified as T1, making it the most common category. T2 followed with 29.87% (112 patients), while T3 accounted for 14.13% (53 patients). T4 was present in 9.33% of cases (35 patients), and TX, indicating that the tumor could not be assessed, appeared in 8% of cases (30 patients). Only 0.53% of patients (2 individuals) had T0, meaning no evidence of a tumor.
In the N (Nodes) classification, 95.2% of the patients (357 individuals) had N0, indicating no regional lymph node involvement. N1, representing regional lymph node involvement, occurred in 4.53% of patients (17 individuals), while NX (nodes could not be assessed) was noted in 0.27% (1 patient).
For the M (Metastasis) classification, 86.67% of the patients (325 individuals) were classified as M0, meaning no distant metastasis, while 13.07% (49 patients) had M1, indicating the presence of distant metastasis. A small percentage, 0.27% (1 patient), was classified as M1a, representing a more specific type of metastasis.
In terms of staging, 19.47% of patients were in Stage II, followed by 17.07% in Stage IA, and 17.07% in Stage IB.
Regarding radiation therapy, 56.8% of the patients (213 individuals) received radiation, while 43.2% (162 patients) did not. For chemotherapy, 50.67% of patients (190 individuals) underwent this treatment, whereas 49.33% (185 patients) did not receive chemotherapy. Surgery was performed on 83.2% of the patients (312 individuals), while 16.8% (63 patients) did not have surgery.
3.2. Model Performance
The support vector classifier (SVC) model demonstrated the following performance metrics on the test dataset. The sensitivity was 53.26% (95% CI: 42.56% to 63.74%). The specificity was 86.76% (95% CI: 79.89% to 91.96%). The positive likelihood ratio was 4.02 (95% CI: 2.51 to 6.44), while the negative likelihood ratio was 0.54 (95% CI: 0.43 to 0.68). The positive predictive value was 73.13% (95% CI: 62.96% to 81.34%), and the negative predictive value was 73.29% (95% CI: 68.60% to 77.51%). The overall accuracy of the model was 73.25% (95% CI: 67.00% to 78.87%). The AUC-ROC was 0.8153 (95% CI: 0.7578 to 0.8677). The Brier score was 0.1715.
The k-nearest neighbors (k-NN) classifier demonstrated the following performance metrics on the test dataset. The sensitivity was 47.83% (95% CI: 37.30% to 58.50%). The specificity was 91.18% (95% CI: 85.09% to 95.36%). The positive likelihood ratio was 5.42 (95% CI: 3.03 to 9.69), while the negative likelihood ratio was 0.57 (95% CI: 0.47 to 0.70). The positive predictive value was 78.57% (95% CI: 67.23% to 86.76%), and the negative predictive value was 72.09% (95% CI: 67.84% to 75.98%). The overall accuracy of the model was 73.68% (95% CI: 67.46% to 79.28%). The AUC-ROC was 0.7862 (95% CI: 0.7250 to 0.8411). The Brier score was 0.1816.
The Gaussian naive Bayes classifier demonstrated the following performance metrics on the test dataset. The sensitivity was 53.26% (95% CI: 42.56% to 63.74%). The specificity was 84.56% (95% CI: 77.37% to 90.18%). The positive likelihood ratio was 3.45 (95% CI: 2.23 to 5.34), while the negative likelihood ratio was 0.55 (95% CI: 0.44 to 0.70). The positive predictive value was 70.00% (95% CI: 60.11% to 78.33%), and the negative predictive value was 72.78% (95% CI: 68.01% to 77.09%). The overall accuracy of the model was 71.93% (95% CI: 65.62% to 77.66%). The AUC-ROC was 0.7890 (95% CI: 0.7288 to 0.8444). The Brier score was 0.1978.
The gradient boosting model demonstrated the following performance metrics on the test dataset. The sensitivity was 59.78% (95% CI: 49.04% to 69.88%). The specificity was 77.21% (95% CI: 69.23% to 83.96%). The positive likelihood ratio was 2.62 (95% CI: 1.84 to 3.73), while the negative likelihood ratio was 0.52 (95% CI: 0.40 to 0.68). The positive predictive value was 63.95% (95% CI: 55.52% to 71.61%), and the negative predictive value was 73.94% (95% CI: 68.52% to 78.72%). The overall accuracy of the model was 70.18% (95% CI: 63.78% to 76.04%). The AUC-ROC was 0.7809 (95% CI: 0.7156 to 0.8377). The Brier score was 0.2253.
The AUC-ROC curves of the models are shown in Figure 1.
The best-performing model, the Support Vector Classifier (SVC), underwent external validation using a cohort of patients from 2018 onwards. The model demonstrated strong performance, achieving an AUC-ROC of 0.8179 (95% CI: 0.7632 to 0.8666) on the external validation dataset. This indicates that the model maintained a high level of accuracy in distinguishing between outcomes in this independent cohort, reinforcing its robustness and generalizability.
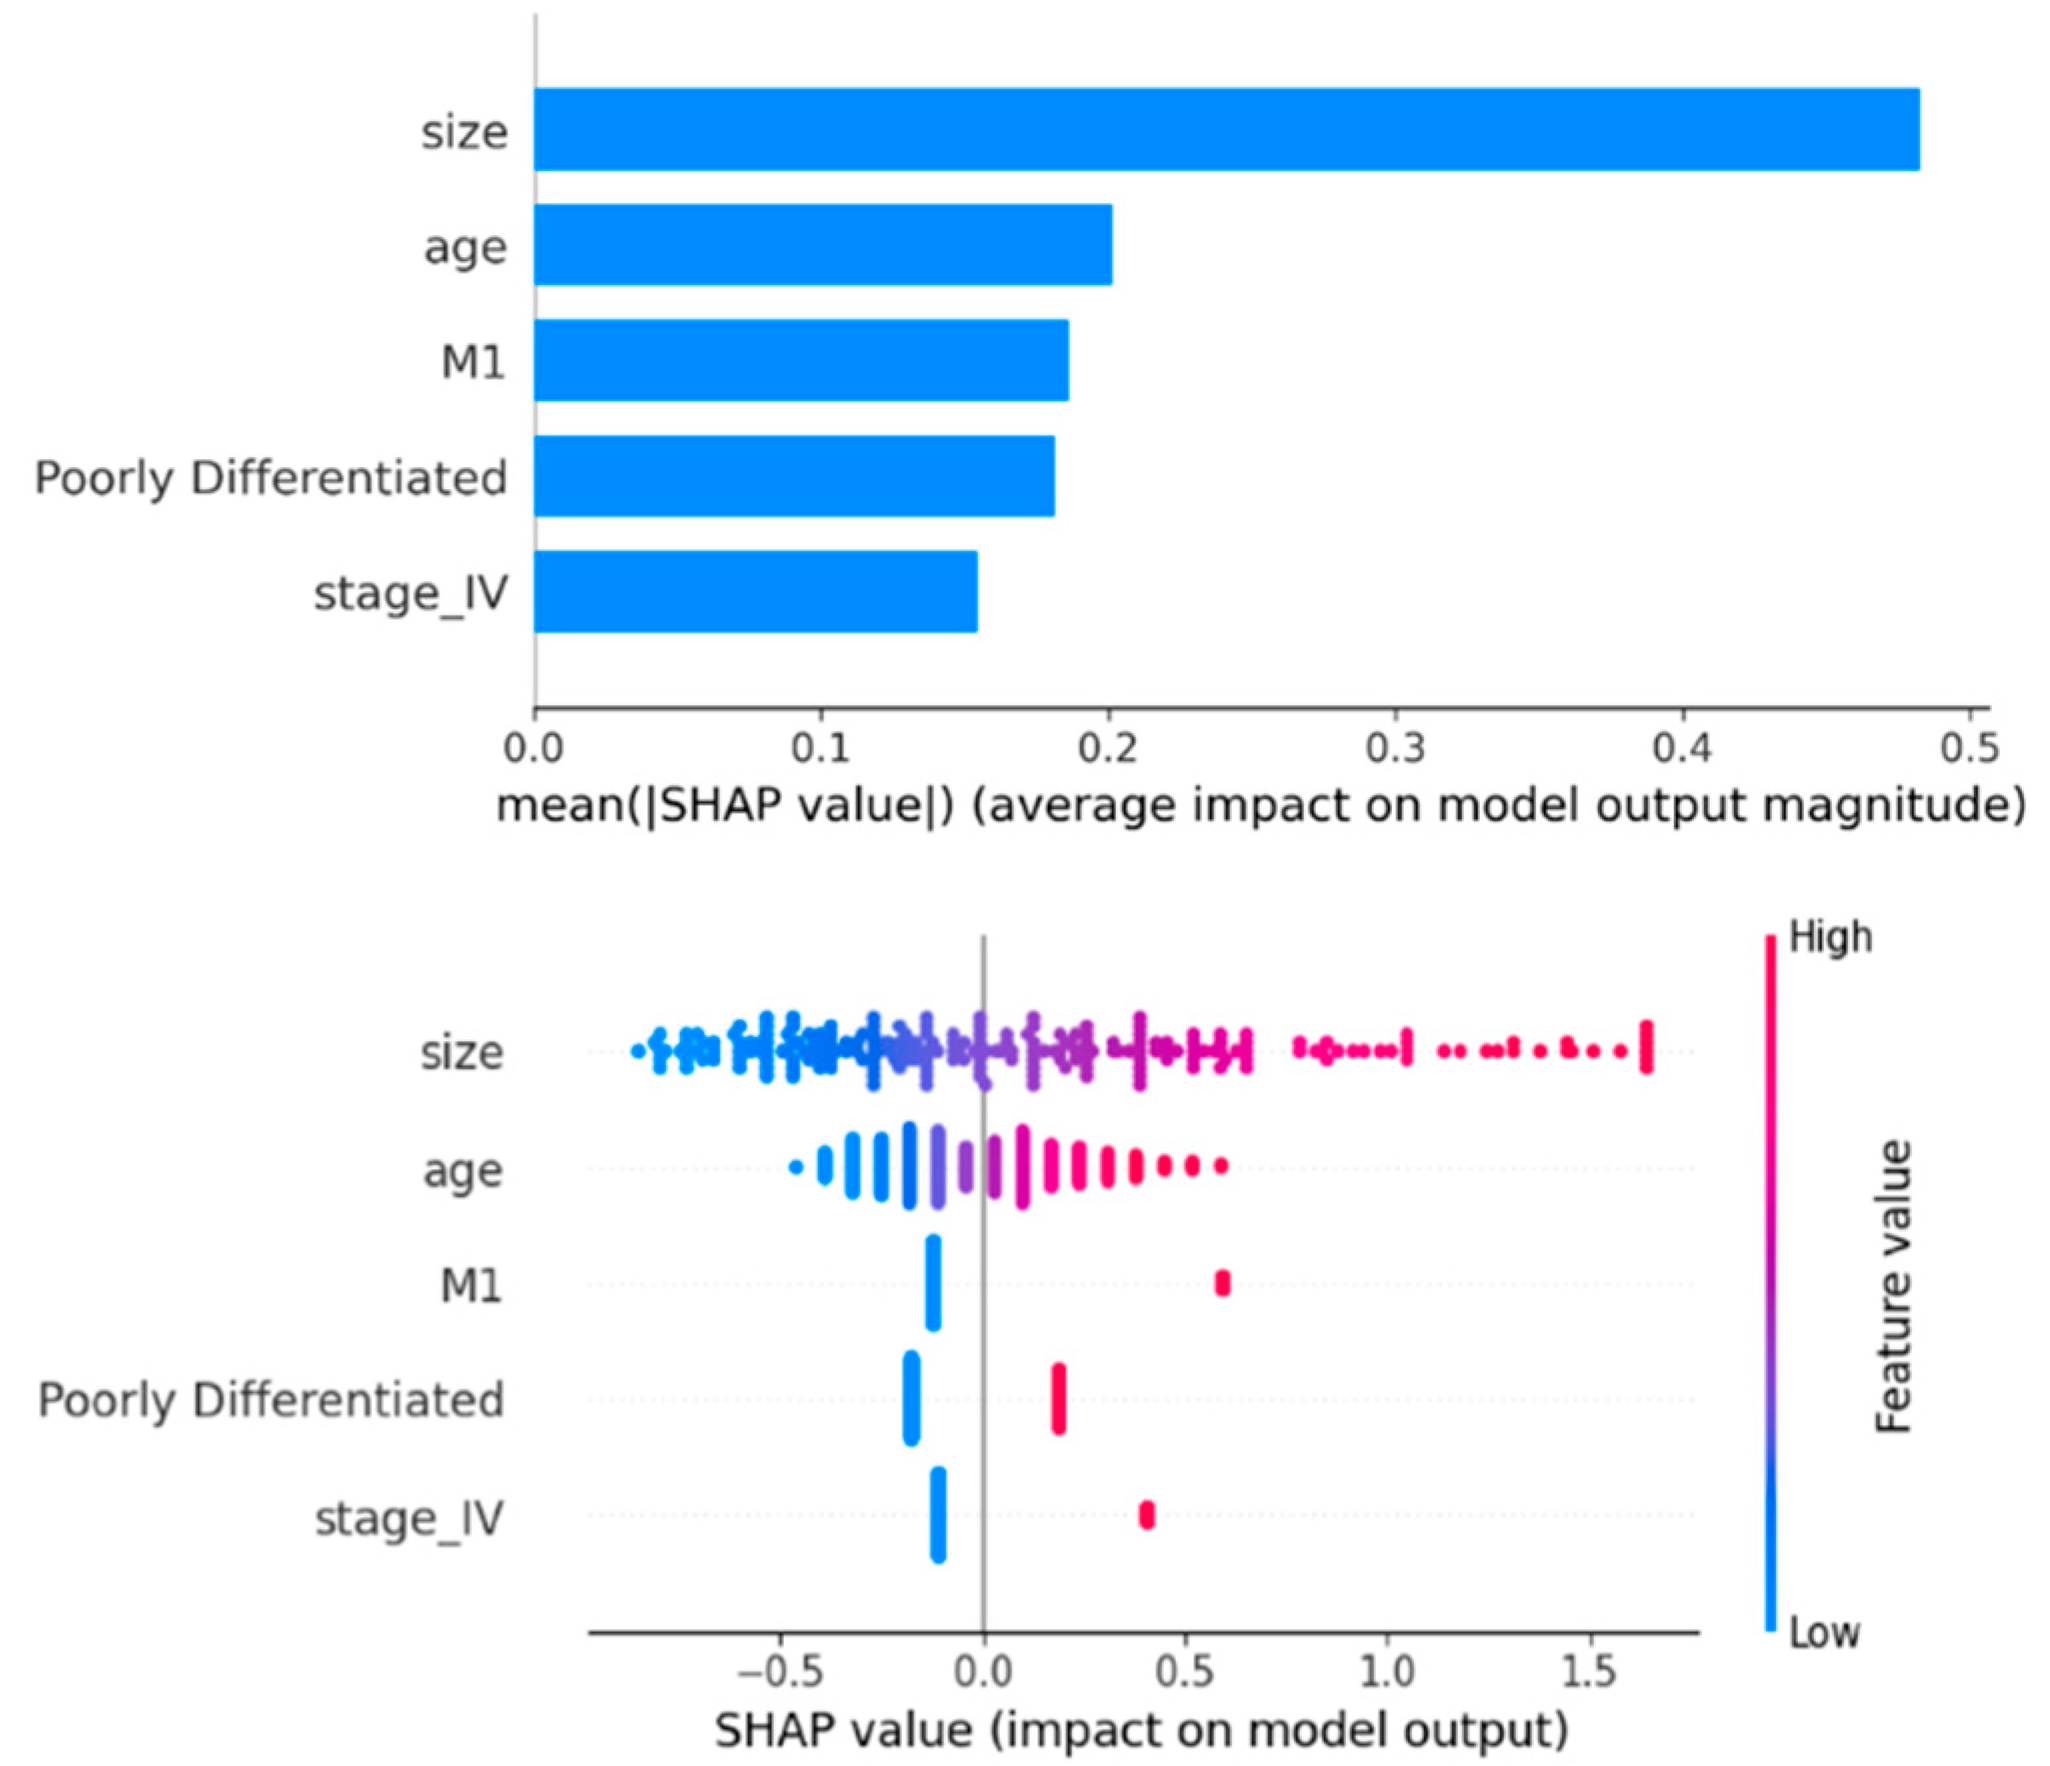
3.3. Feature Importance
The SHAP analysis for the SVC model identified key features influencing mortality predictions. Tumor size had the greatest impact, with larger sizes increasing mortality risk. Age was the second most important feature, where older age corresponds to higher mortality risk. The presence of metastasis (M1) significantly increased mortality risk, while its absence decreased it. Poorly differentiated tumors were associated with increased mortality, and advanced cancer stage (stage IV) also increased mortality risk (Figure 2).
4. Discussion
The models in this study demonstrated acceptable accuracy in predicting the mortality of patients with synovial sarcoma. The SVC model achieved an AUC-ROC greater than 0.8, which is considered good for prediction purposes [16]. The SVC model is known for its versatile ability to handle small- to moderate-sized datasets and has already shown positive results with biological data [17].
To clinically interpret the results, given a pretest probability of 0.5 (50%), a positive test result with a likelihood ratio (LR+) of 4.02 increases the probability that the patient has the condition to approximately 80%. This means the test strongly supports the presence of the disease. On the other hand, if the result is negative, with a negative likelihood ratio (LR−) of 0.54, the probability decreases to around 35%, meaning the disease is less likely but still possible. For a pretest probability of 0.8 (80%), a positive test result further raises the probability, bringing it close to 95%, strongly confirming the presence of the condition. If the result is negative, however, the probability drops to around 60%, reducing the likelihood but not ruling out the condition completely, given the initially high pretest probability. As a result, the positive prediction of the models (patient’s death) in this study is more valuable and clinically useful than negative results.
Different studies have identified various prognostic factors in patients with synovial sarcoma. One study indicated that increased age, larger tumor size, and advanced stage worsen the prognosis [18]. Another study highlighted increased age, tumor location, and tumor size across a wide range of ages [19]. The findings of this study align with previous research, identifying advanced age and larger tumor size as the most significant prognostic factors.
SS is relatively prevalent among young patients [20]. In this study, the mean age of the patients was 39.4 years, which falls within the productive years of life. Therefore, early risk stratification and consequent aggressive treatment are of utmost importance and may be beneficial.
External validation is crucial to ensure that the model is not overfitting and can be generalized to real-world scenarios beyond the training data [21]. Unfortunately, for rare diseases, the lack of available external datasets is a significant obstacle for external validation. However, this study successfully externally validated its model using a temporally distinct dataset from a cohort of patients in 2018 and beyond. This demonstrates that, despite advances in therapeutics, the model trained on data from patients between 2004 and 2015 remains generalizable to more recent populations. Additional measures were also implemented to enhance the model’s generalizability. First, four different algorithms showed nearly identical results. Second, some algorithms, such as ensemble tree-based models such as gradient boosting, are resilient against overfitting. Using a limited number of features and cross-validation also reduces the problem of overfitting. Finally, it should be noted that the SEER database includes patients from a wide population and is representative, at least for the US population.
Other limitations include the small number of patients from minority ethnicities, nonbinary sexual identities, and the lack of generalizability to other parts of the world. More data are needed to develop and further externally validate models.
5. Conclusions
Machine learning models can accurately risk stratify patients with synovial sarcoma. Predicting mortality risk is crucial for individualized treatment.
Author Contributions
Conceptualization, M.R., K.S., and A.T.; methodology, M.R.., A.S., and A.T.; software, S.N.J., S.R., D.B., and A.T.; validation, S.N.J., S.R., and D.B.; formal analysis, S.R., A.S., and A.T.; investigation, A.S. and K.S.; resources, A.T.; data curation, S.N.J., S.R., and D.B.; writing—original draft preparation, A.T.; writing—review and editing, S.N.J., S.R., M.R.., D.B., A.S., K.S., and A.T.; visualization, S.N.J., D.B., and A.T.; supervision, A.T.; project administration, A.T. All authors have read and agreed to the published version of the manuscript.
Funding
This research received no external funding.
Data Availability Statement
The data are available online from the SEER dataset upon request from the corresponding authorities.
Acknowledgments
None.
Conflicts of Interest
The authors declare no conflicts of interest.
References
- Aytekin, M.N.; Öztürk, R.; Amer, K.; Yapar, A. Epidemiology, incidence, and survival of synovial sarcoma subtypes: SEER database analysis. Journal of Orthopaedic Surgery 2020, 28(2), 2309499020936009. [Google Scholar] [CrossRef] [PubMed]
- Wang, S.; Song, R.; Sun, T.; Hou, B.; Hong, G.; Mallampati, S.; et al. Survival changes in patients with synovial sarcoma, 1983–2012. Journal of Cancer 2017, 8(10), 1759. [Google Scholar] [CrossRef]
- Zhang, H.; Huang, W.; Feng, Q.; Sun, W.; Yan, W.; Wang, C.; et al. Clinical significance and risk factors of local recurrence in synovial sarcoma: A retrospective analysis of 171 cases. Frontiers in Surgery 2022, 8, 736146. [Google Scholar] [CrossRef] [PubMed]
- de Silva, M.C.; McMahon, A.D.; Reid, R. Prognostic factors associated with local recurrence, metastases, and tumor-related death in patients with synovial sarcoma. American Journal of Clinical Oncology 2004, 27(2), 113–121. [Google Scholar] [CrossRef] [PubMed]
- Doll, K.M.; Rademaker, A.; Sosa, J.A. Practical guide to surgical data sets: Surveillance, epidemiology, and end results (SEER) database. JAMA Surgery 2018, 153(6), 588–589. [Google Scholar] [CrossRef] [PubMed]
- Rajkomar, A.; Dean, J.; Kohane, I. Machine learning in medicine. New England Journal of Medicine 2019, 380(14), 1347–1358. [Google Scholar] [CrossRef] [PubMed]
- Kourou, K.; Exarchos, K.P.; Papaloukas, C.; Sakaloglou, P.; Exarchos, T.; Fotiadis, D.I. Applied machine learning in cancer research: A systematic review for patient diagnosis, classification and prognosis. Computational and Structural Biotechnology Journal 2021, 19, 5546–5555. [Google Scholar] [CrossRef] [PubMed]
- Kourou, K.; Exarchos, T.P.; Exarchos, K.P.; Karamouzis, M.V.; Fotiadis, D.I. Machine learning applications in cancer prognosis and prediction. Computational and Structural Biotechnology Journal 2015, 13, 8–17. [Google Scholar] [CrossRef] [PubMed]
- Seger, C. An investigation of categorical variable encoding techniques in machine learning: Binary versus one-hot and feature hashing. 2018.
- Suthaharan, S.; Suthaharan, S. Support vector machine. Machine learning models and algorithms for big data classification: Thinking with examples for effective learning. 2016, 207–35.
- Kramer, O.; Kramer, O. K-nearest neighbors. Dimensionality reduction with unsupervised nearest eighbors. 2013, 13–23. [Google Scholar]
- Chen, S.; Webb, G.I.; Liu, L.; Ma, X. A novel selective naïve Bayes algorithm. Knowledge-Based Systems 2020, 192, 105361. [Google Scholar] [CrossRef]
- Ke, G.; Meng, Q.; Finley, T.; Wang, T.; Chen, W.; Ma, W.; et al. Lightgbm: A highly efficient gradient boosting decision tree. Advances in Neural Information Processing Systems 2017, 30. [Google Scholar]
- Rufibach, K. Use of Brier score to assess binary predictions. Journal of clinical epidemiology 2010, 63(8), 938–939. [Google Scholar] [CrossRef] [PubMed]
- Van den Broeck, G.; Lykov, A.; Schleich, M.; Suciu, D. On the tractability of SHAP explanations. Journal of Artificial Intelligence Research 2022, 74, 851–886. [Google Scholar] [CrossRef]
- Lee Y-h Bang, H.; Kim, D.J. How to establish clinical prediction models. Endocrinology and Metabolism 2016, 31(1), 38–44. [Google Scholar] [CrossRef] [PubMed]
- Abdar, M.; Acharya, U.R.; Sarrafzadegan, N.; Makarenkov, V. NE-nu-SVC: A new nested ensemble clinical decision support system for effective diagnosis of coronary artery disease. IEEE Access 2019, 7, 167605–167620. [Google Scholar] [CrossRef]
- Pan, M.; Merchant, M. Risk factors including age, stage and anatomic location that impact the outcomes of patients with synovial sarcoma. Medical Sciences 2018, 6(1), 21. [Google Scholar] [CrossRef] [PubMed]
- Vlenterie, M.; Ho, V.K.; Kaal, S.E.; Vlenterie, R.; Haas, R.; Van Der Graaf, W.T. Age as an independent prognostic factor for survival of localised synovial sarcoma patients. British Journal of Cancer 2015, 113(11), 1602–1606. [Google Scholar] [CrossRef] [PubMed]
- Gazendam, A.M.; Popovic, S.; Munir, S.; Parasu, N.; Wilson, D.; Ghert, M. Synovial sarcoma: A clinical review. Current Oncology 2021, 28(3), 1909–1920. [Google Scholar] [CrossRef] [PubMed]
- Staartjes, V.E.; Kernbach, J.M. Significance of external validation in clinical machine learning: Let loose too early? The Spine Journal 2020, 20(7), 1159–1160. [Google Scholar] [CrossRef] [PubMed]
Figure 1.
Comparison of the AUC-ROC curves of the different models.
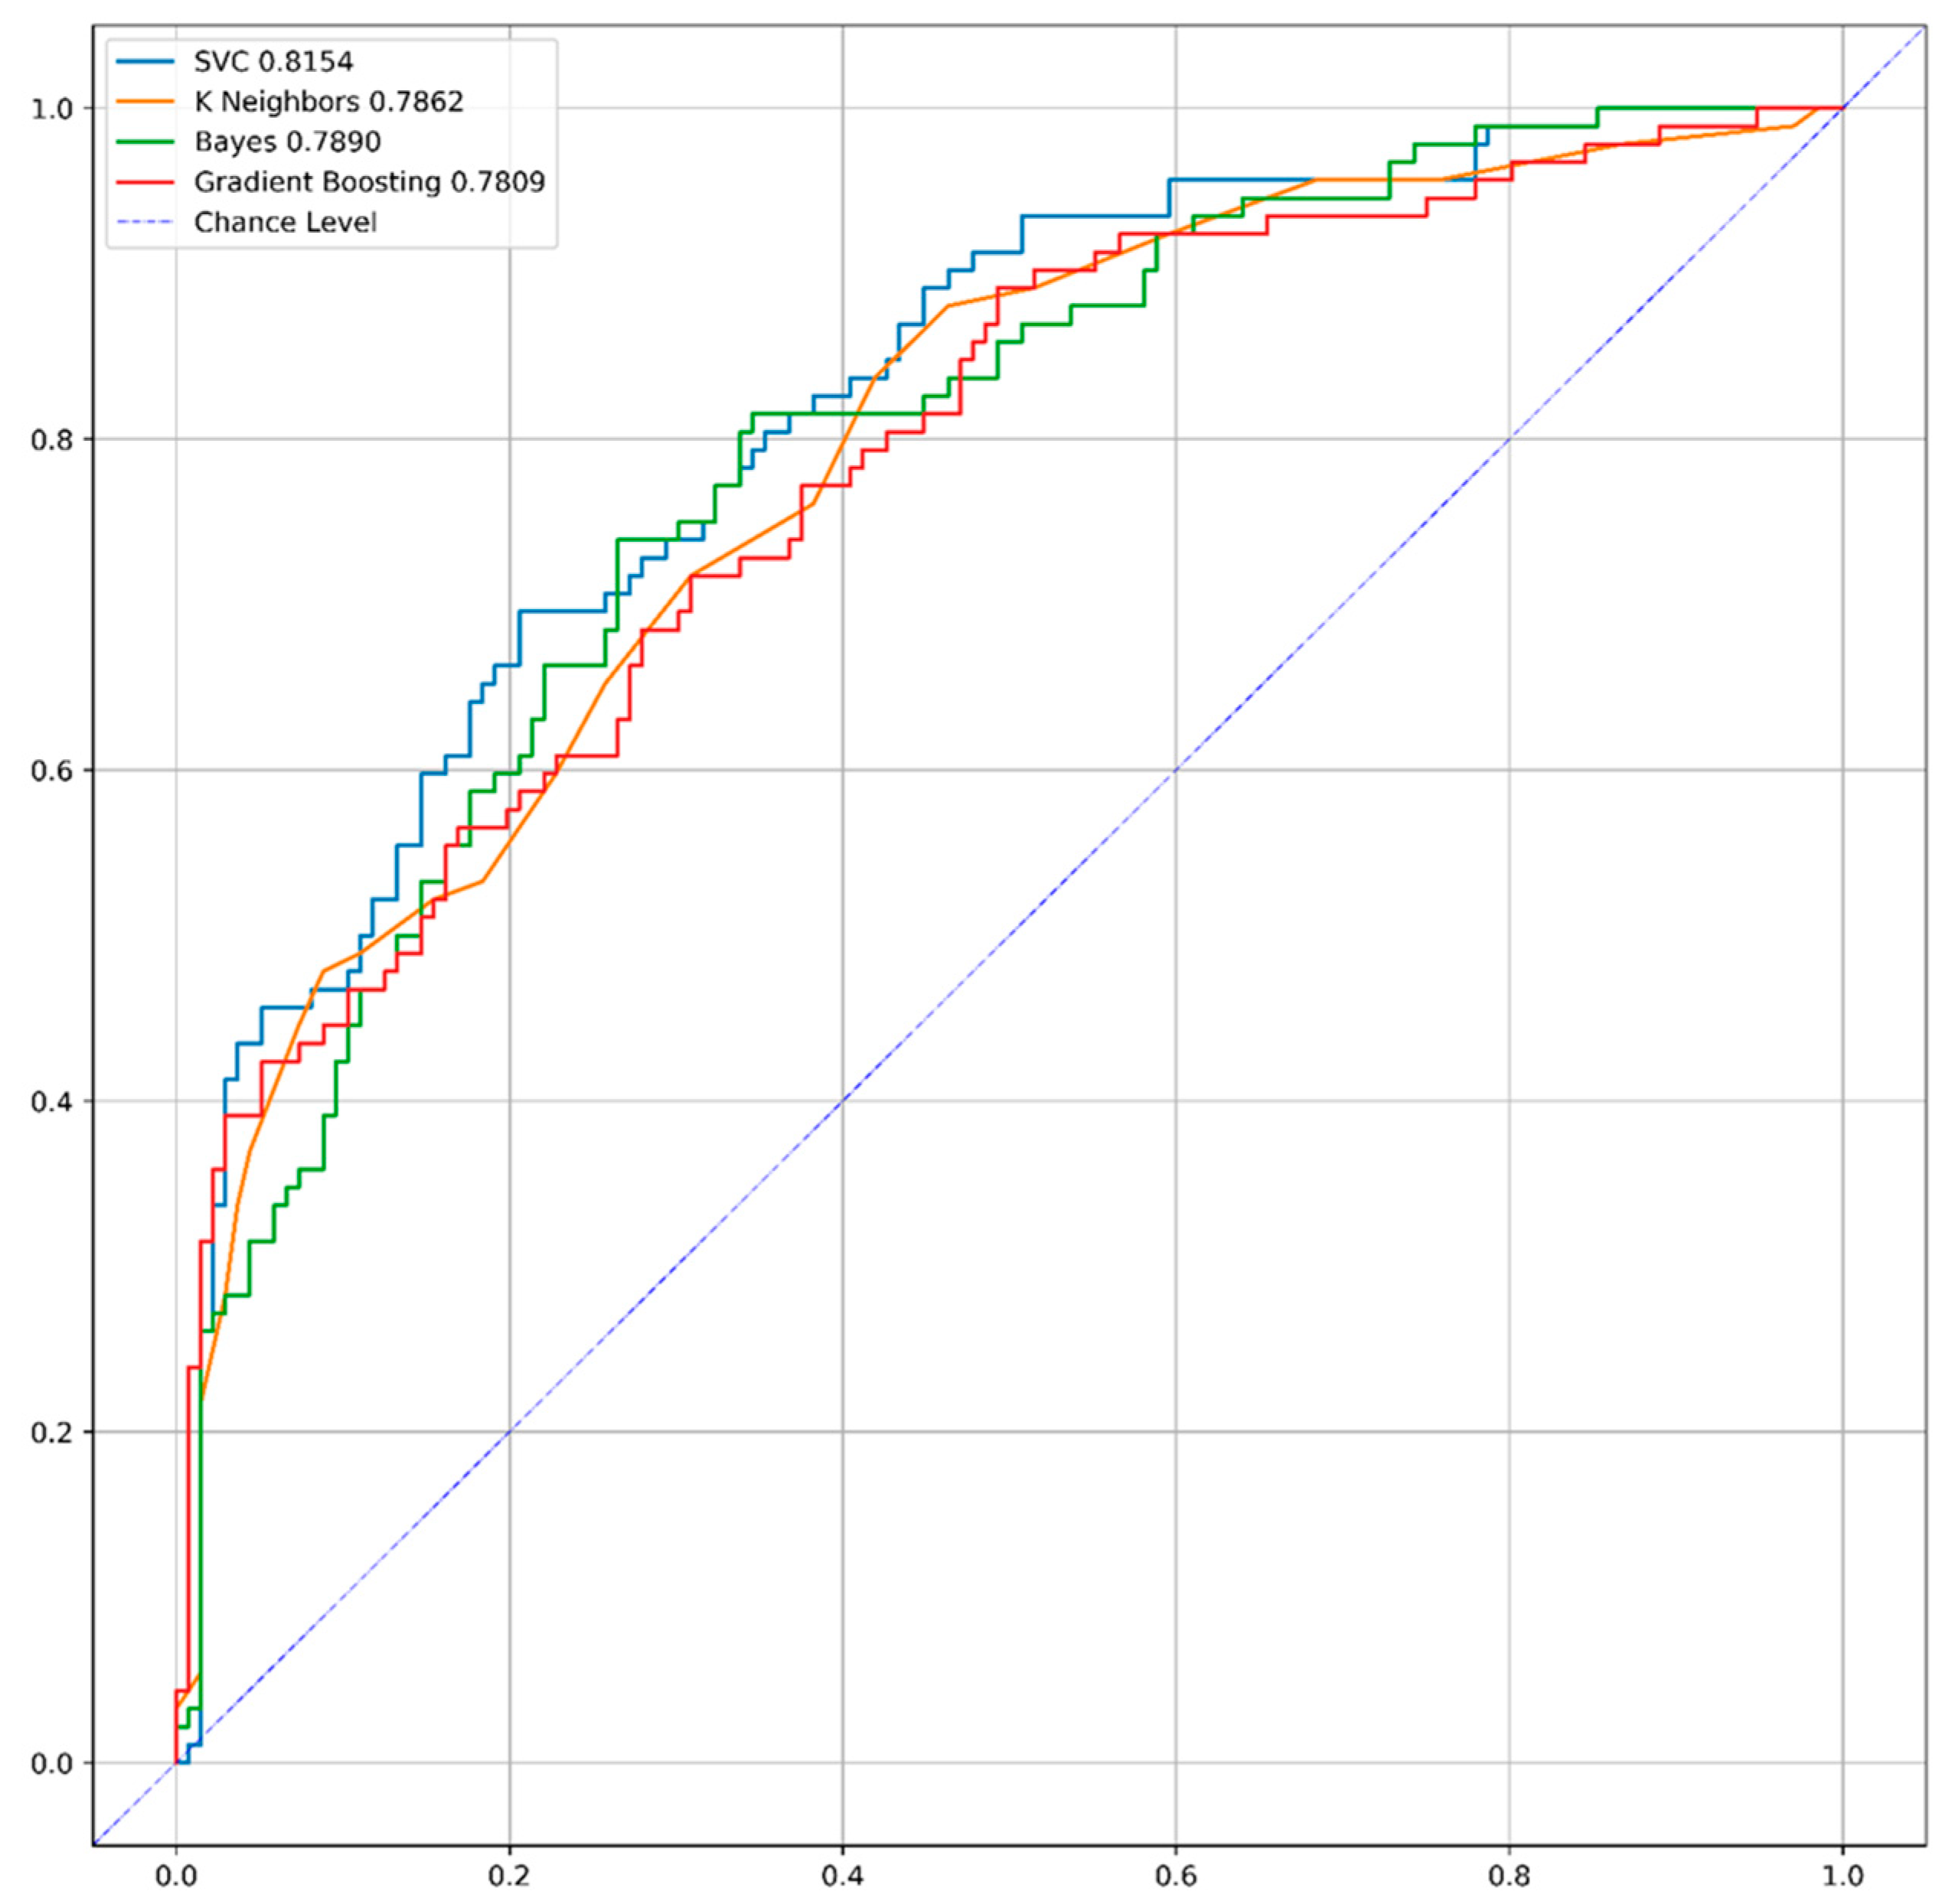
Figure 2.
SHAP plot of the effects of predicting factors on model predictions.
Disclaimer/Publisher’s Note: The statements, opinions and data contained in all publications are solely those of the individual author(s) and contributor(s) and not of MDPI and/or the editor(s). MDPI and/or the editor(s) disclaim responsibility for any injury to people or property resulting from any ideas, methods, instructions or products referred to in the content. |
© 2024 by the authors. Licensee MDPI, Basel, Switzerland. This article is an open access article distributed under the terms and conditions of the Creative Commons Attribution (CC BY) license (https://creativecommons.org/licenses/by/4.0/).
Copyright: This open access article is published under a Creative Commons CC BY 4.0 license, which permit the free download, distribution, and reuse, provided that the author and preprint are cited in any reuse.


