
Submitted:
15 October 2024
Posted:
18 October 2024
You are already at the latest version
Abstract
Although corn is the most important and nitrogen (N)-fertilized crop, there is a lack of long-term data on the effects of organic and inorganic N fertilizer on N balance and losses for corn systems under different tillage systems. From 2012 to 2023 we assessed the effects of N sources on grain yields from cultivated continuous corn receiving irrigation at a site with minimal erosion in Fort Collins, Colorado, USA, and compared these effects to no-till (NT) and strip till (ST) systems receiving inorganic N. An N balance accounting for N and carbon (C) sequestration found a system nitrogen use efficiency (NUESys) for organic N fertilizer (manure) with tillage of 86.3%, which was higher than the NUESys of 60.2% with inorganic N fertilizer (enhanced efficiency fertilizer, EEF). Conventional tillage with manure use is a good management practice that contributed to higher grain yields (2 of 11 yr.), C sequestration (P<0.05), soil organic N content (P<0.05), and soil phosphorus (P) content than inorganic N fertilizer with tillage (P<0.05). Tilled systems, whether receiving organic or inorganic N fertilizer, had higher yields and grain N content than NT and ST systems receiving inorganic N fertilizer (P<0.05). The grain production of the cultivated system receiving organic N fertilizer did not decrease with time, while the yields of the cultivated system receiving inorganic N fertilizer decreased with time (P<0.05), suggesting that cultivated systems receiving organic N fertilizer may be more sustainable and better able to adapt to a changing climate. Additionally, a combination of manure (30% of N input) with EEF (70% of N input) contributed to a synergistic effect that increased agronomic productivity (harvested grain yields).
Keywords:
EEF
; manure nitrogen
; nitrogen use efficiencies
; phosphorus
; soil and water conservation
; sustainability
1. Introduction
One of the most urgent issues confronting humanity in the 21st century is the need to increase agricultural production to feed the continuously growing global population while adapting agriculture to a changing climate using soil and water conservation practices that contribute to sustainable systems and minimize losses of agrochemicals to the environment [1]. Corn (Zea mays L.) is the most nitrogen (N)-fertilized crop in the United States and there is a need to continue increasing N use efficiencies (NUE) to reduce N losses from corn systems [2]. Although to date hundreds of millions of dollars have been invested in countless studies on N management, the national surplus of N not used by crops was recently estimated to be 41% (27 to 55%), indicating there remains a need to increase NUE to reduce losses of this surplus N to the environment [3].
Only a few long-term (8+ years) studies have been conducted that monitor NUE of corn while conducting an N mass balance, and findings have been mixed. A 30-yr. study on continuous corn under tillage and irrigation monitored soil N in the top 30 cm of soil and found that more N is being harvested with the corn compartments than was applied as N inputs [4]. In contrast, a 22-yr. A continuous corn study under tillage and irrigation that monitored soil N in the top 120 cm found significant N losses to the environment, with up to 60% of the applied inorganic N fertilizer, 41% of the applied swine manure N, 30% of the applied inorganic N fertilizer when applied with P and potassium (K) fertilizers, and 35 to 43% of N lost from combinations of manure and inorganic N fertilizer [5]. An 8-yr. no-till dryland continuous corn study monitoring soil N in the 0-20 cm soil profile found N losses ranging from 19 to 31% [6]. A 13-yr. study of an irrigated no-till continuous corn system that monitored soil N in the top 120 cm found that N losses from the system ranged from 19 to 57% for inorganic N fertilizer rates ranging from 67 to 246 kg N fertilizer ha−1 y−1, respectively [7]. Few studies have conducted a long-term N balance accounting for soil N changes, especially down to 120 cm.
We only found one long-term N balance for corn systems where manure inputs had been monitored [5]. However, we did find a few long-term manure studies that had monitored effects of manure inputs on yields. Manure-N-based inputs have been reported to increase yields compared to inorganic N fertilizer, including a 10 yr. study with composed and uncomposed beef feedlot manure [8]; a 25 yr. study mixing swine manure, plant residues, and soil [9]; a 23 yr. study; pig manure, [10] and a 28 yr. study with dairy cattle manure [11]. A long-term (100 yr.) non-irrigated manure study showed that manure can provide more stabilized yields than inorganic N fertilizer systems [12]. Other long-term studies have found that the manure-treated plots had similar yields to inorganic N fertilizer (10 yr. study with cattle manure and swine effluent [13]; 10 yr. study with broiler litter [14]). Other researchers that have found similar yields with manure-treated plots have found that in the years with the poorest yields, the non-irrigated manure plots produced higher yields than the plots receiving inorganic N fertilizer (8 yr. non-irrigated study) [15].
Numerous benefits have been reported from using manure inputs such as broiler litter and swine and cattle manures. Long-term studies ranging from 10 to 70 yr. in duration have found that compared to inorganic N fertilizer, manure applications increase soil properties that are beneficial to soil productivity, such as soil cation exchange capacity, organic matter, and total nitrogen [5,9,10,14,16,17]. However, some long-term studies ranging from 10 to 100 yr. with broil litter and cattle manure have found that manure applications can increase the potential for increased losses of P and N from the system [8,12,14]. It has been established that systems receiving large applications of manure changed from serving as sinks for P to sources of P to the environment [18,19,20].
Conservation practices such as NT and ST have been recommended to improve sustainability of agricultural systems [1]. There is a lack of long-term studies that have conducted an N balance assessing N uptake and dynamics of tillage management practices. There is also a need to compare the long-term yields of intensively cultivated systems that are receiving incorporated manure N (tilled system receiving organic N fertilizer) to those of a tilled system receiving inorganic N fertilizer, NT, and ST systems. The review of literature conducted in metadata analyses by Pittelkow et al. [21] and Ogle [22] showed that the harvested grain yields of corn systems under NT are lower than those of corn under intensive cultivation [34]. Delgado et al. [26] compared the long-term yields of conventional tillage (CT), NT, and ST systems that received inorganic N fertilizer and found that after five years of higher yields with CT, the NT yields started to increase and were similar to or greater than CT and ST. However, since Pittelkow et al. [21] and Ogle et al. [22] found that over time NT yields continue to decline, there is a need to compare the effects of longer time periods of NT with CT and ST to see if these improved NT yields are maintained or decline over a longer period of implementation. Additionally, there is a need to compare the corn yields of NT, ST, and CT systems with inorganic N fertilizer to the corn yields of systems receiving manure (organic N fertilizer) that could potentially contribute to improved soil properties such as increased carbon sequestration [5,9,10,14,16,17] and have more stable yields with time [12].
Our review of the scientific literature found only one long-term manure N balance study that measured changes in N soil pools down to 120 cm, N uptake, and N removal in the aboveground compartment, and compared it to inorganic N fertilizer in an irrigated and tilled corn system [5]. However, we did not find any long-term manure study that conducted an N balance and that compared the harvested grain yields and N content of the harvested grain yields of the tilled system receiving organic N fertilizer and tilled system receiving inorganic N fertilizer to long-term ST and NT studies, making the present work a unique study and a new contribution. The objective was to assess the long-term N balance from 2012 to 2017 as well as the NUE of the system (NUESys) and N losses from the system (NLsys) while accounting for N inputs, N outputs, and changes in soil N of an irrigated, tilled continuous corn system during this period. Additionally, we compared the yields of the tilled system receiving organic N fertilizer and tilled system receiving inorganic N fertilizer to those of the NT and ST from 2012 to 2023 and conducted a lot of additional assessment on effects of tilled systems receiving organic fertilizer and tilled systems receiving inorganic N fertilizer. We hypothesized that a) there will not be C and N sequestration with the tilled system receiving inorganic N fertilizer, b) the NLsys with tilled systems receiving inorganic N fertilizer will be higher than tilled systems receiving organic N fertilizer, and c) tilled systems receiving organic N fertilizer will contribute to C and N sequestration via the manure inputs. There is a need to conduct these additional long-term studies.
2. Materials and Methods
2.1. Site Information
This study was conducted at the Halvorson long-term research plots at Colorado State University’s Agricultural Research, Development and Education Center (ARDEC) near Fort Collins, Colorado (40◦39’6´N, 104◦59´57´W, 1535 m above sea level) on a Fort Collins clay loam soil (fine-loamy, mixed, mesic Aridic Haplustalfs) with a 1 to 2% slope. The site has a semiarid temperate climate, and had average minimum, mean, and maximum air temperatures; growing degree days; and precipitation of 10.5 °C, 18.7 °C, 27 °C, 1341 °C, and 199 mm, respectively, during the planting to physiological maturity (R6, black layer) stages (Tables S1, S2) of the 2012 to 2023 growing seasons. The Halvorson plots area is 162.5 m wide by 162.5 m long with different crop rotations established in 2000 in an area that was previously in cultivated corn for seven years.
2.2. Manure and Inorganic N Fertilizer Application
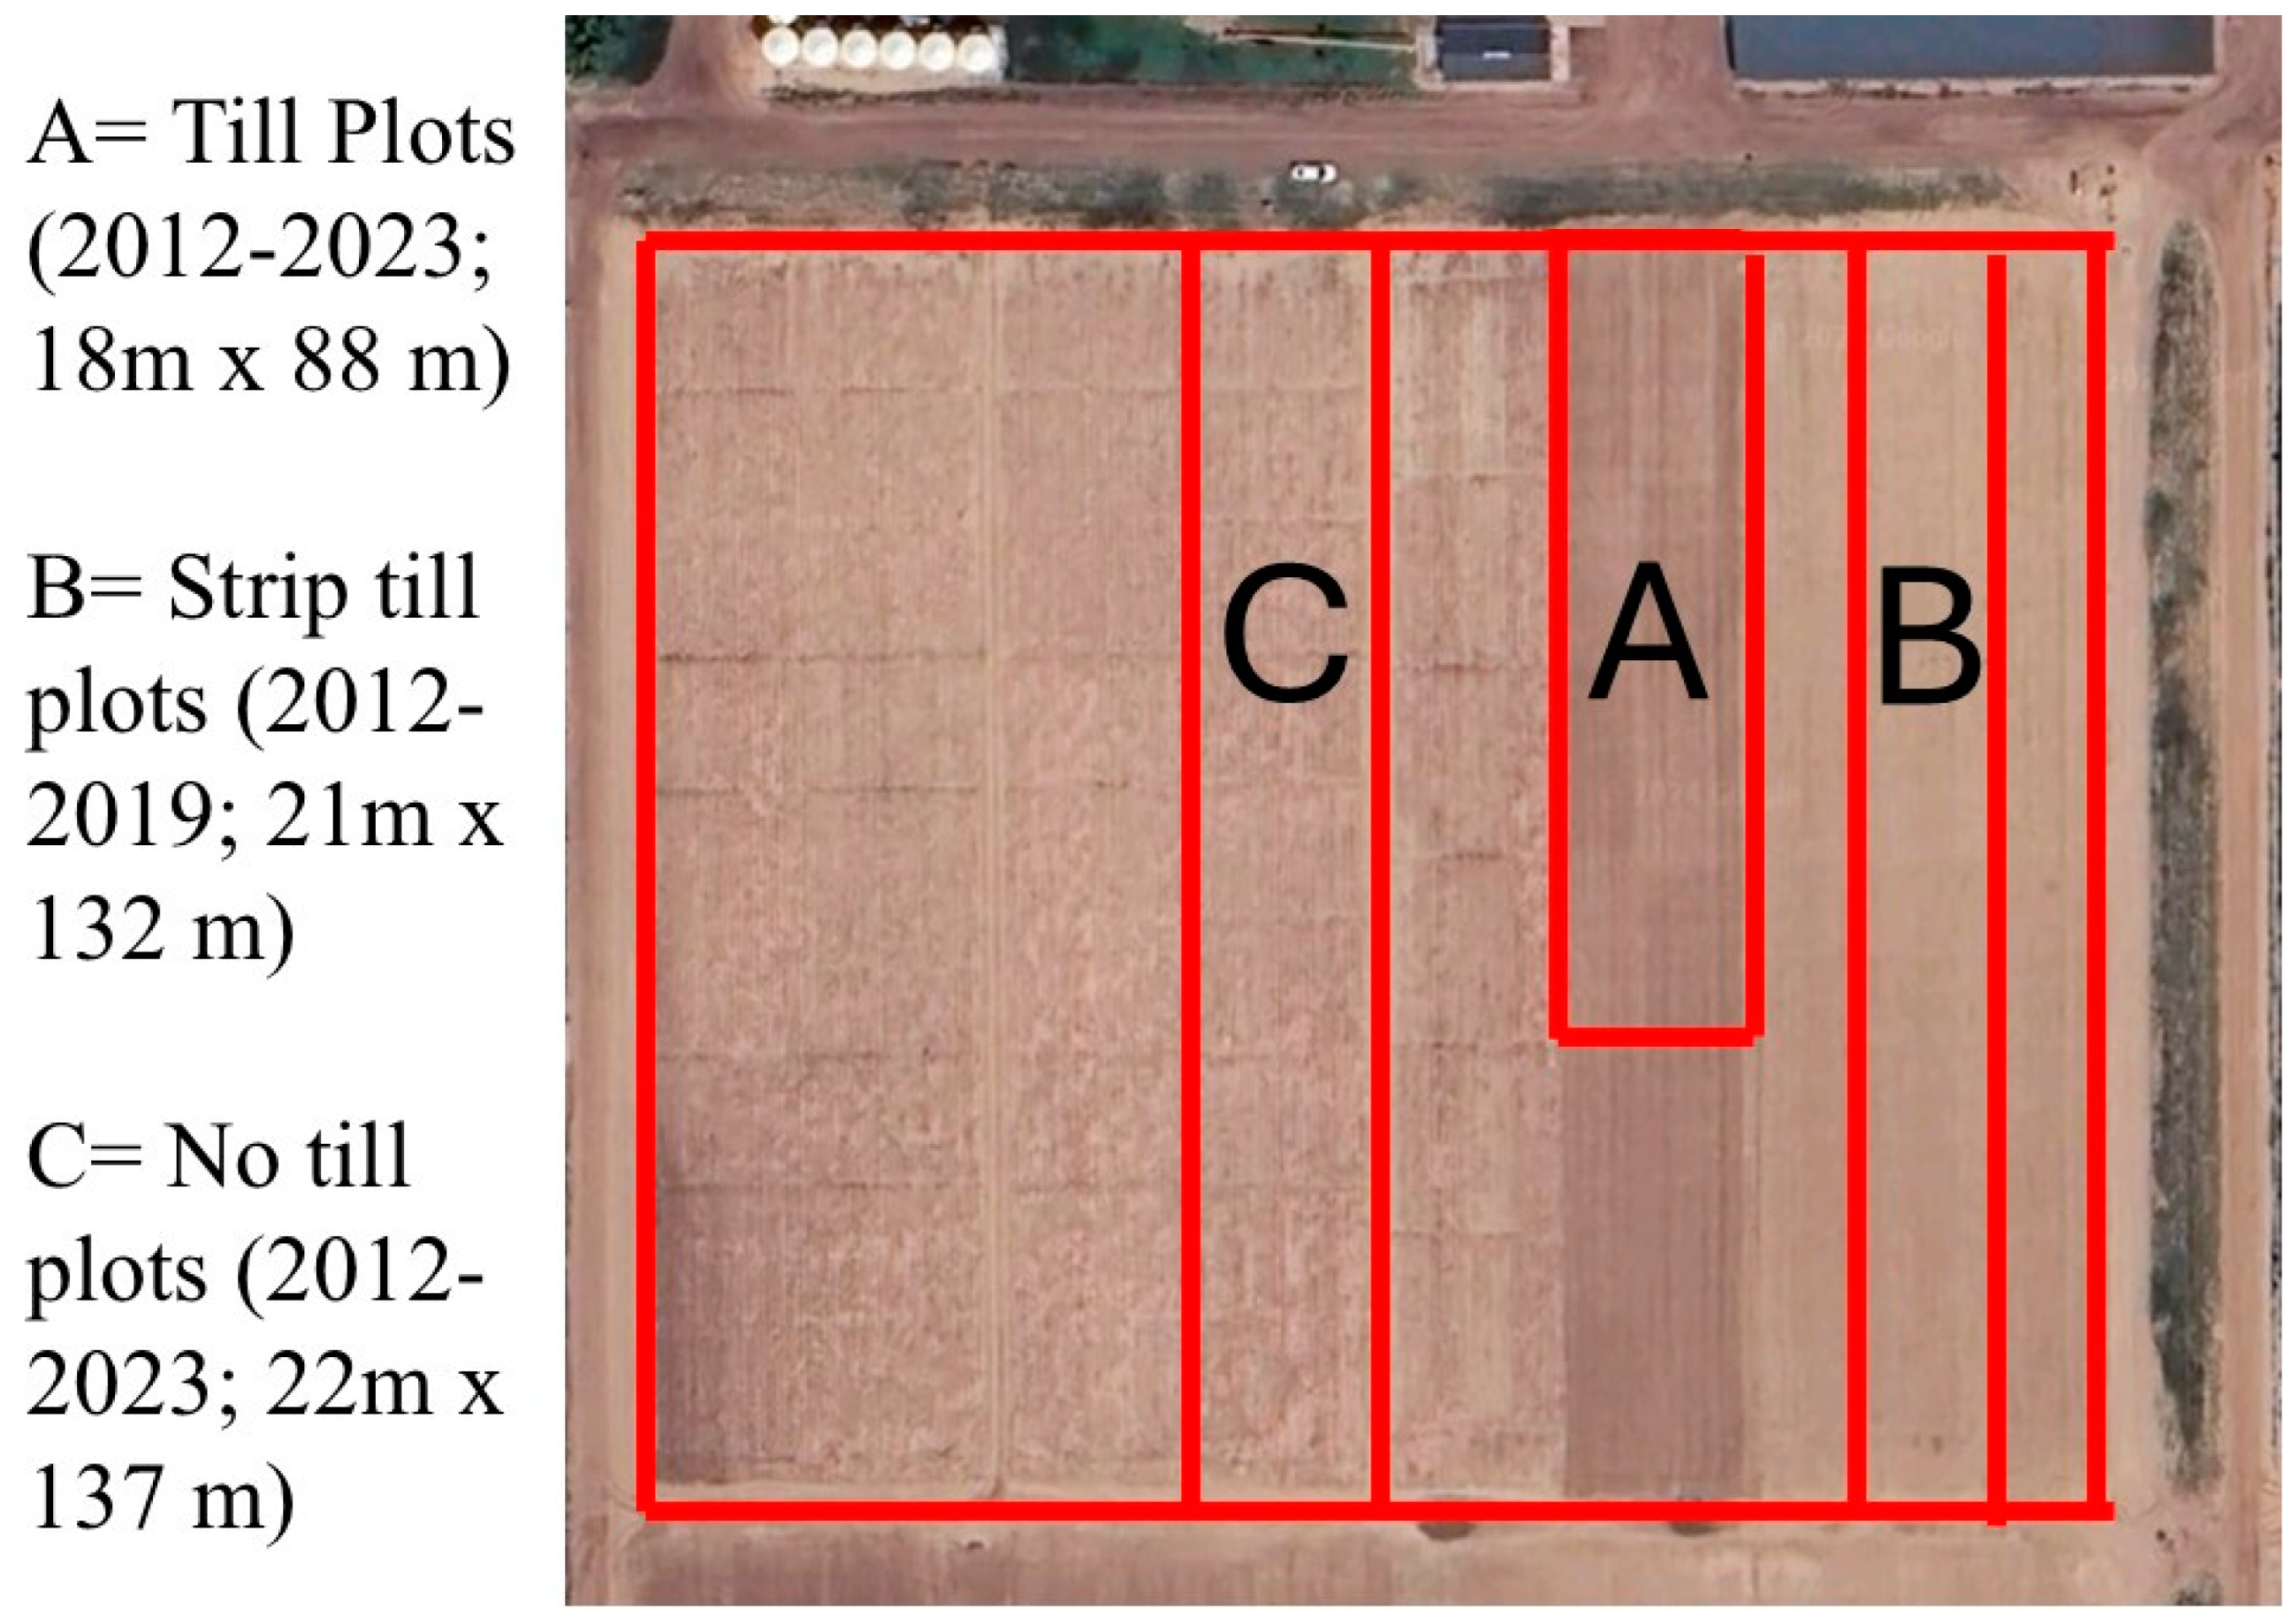
The primary rotation used for this study to assess the long-term effects of nitrogen sources on yields, nitrogen use efficiencies, and soil of tilled continuous corn was the nitrogen sources with tillage study (18 m wide by 88 m long; Figure 1). The nitrogen sources with tillage study was divided into a randomized block design with four replicates (n = 4). The treatments were established in 2012, and prior to the start of this study, the area was in cultivated continuous corn from 2000 to 2008, in strip till continuous corn from 2009 to 2011, and in cultivated plots from 2012 to 2023.
The continuous corn NT plots have been in NT since 2000 to 2023 in a randomized block design with six N rate treatments and three replicates (n = 3), 22 m wide by 137 m long (Figure 1). The NT plots had been managed similarly to the ST and the nitrogen sources with tillage. The NT plots were approximately 23 m to the west from the nitrogen sources with tillage study (Figure 1). The weed, pest management, and irrigation were similar for the NT, ST, and nitrogen sources with tillage study, and detailed information can be found in the supplementary material (Table S1, S2, S3, and S4).
The continuous corn ST plots used for this study were previously in full cultivation from 2001 to 2008 and changed to ST plots from 2009 to 2019. The ST plots were a completely randomized design with different N treatments and four replicates (n = 4), 21 m wide by 132 m long, that had been managed similarly to the NT and the nitrogen sources with tillage study except for the tillage, since 2000. The ST plots were located approximately 13 m to the east of the nitrogen sources with tillage study (Figure 1). Additional information about the NT, ST, and the nitrogen sources with tillage study can be also found in the Delgado et al. (2024; [23]) publication that presented the results from the assessment of the N rates for the CT, NT, and ST studies. Our manuscript is presenting the long-term assessment of the different N sources on yields, nitrogen use efficiencies, and soil of tilled continuous corn, and compared the yields and N uptake to the yields and N uptake of a similar N rate of 202 kg N ha-1 with NT and ST (Figure 1) that has not been reported previously.
For the nitrogen sources with tillage study, all the plots were tilled. The treatments were: i) an average application of 186 kg N ha-1 of dry dairy manure (TDM; Table S3; an application rate that represented 45% of the total manure N applied released during the first growing season [24,25,26]); ii) an average application of 185 kg N ha-1 of DM with AgrotainPlus (TDMAP), which contains a urease inhibitor containing the active ingredient N-(n-butyl)-thiophosphoric triamide and the nitrification inhibitor dicyandiamide (Table S3); iii); 179 kg N ha-1 of urea fertilizer (TUF); iv) 179 kg N ha-1 of the enhanced efficiency fertilizer SUPERU (TSU), which is a urea fertilizer that contains dicyandiamide and N-(n-butyl)-thiophosphoric triamide (Table S3); and v) a control of zero nitrogen (TC0N) fertilizer input (0 kg N ha-1; Table S3).
For mechanical reasons, the plot size varied slightly, with each TDM, TDMAP, TUF, and TSU plot being 4.6 m wide and 21.3 m long with six corn rows with 76-cm spacing. The TDM and TDMAP plots were longer than the TUF and TSU plots, which were 4.6 m wide and 15.2 m long. The TC0N plots were 9.1 m wide with 12 rows, and 6.1 m long. However, the area sampled for yield data was consistent for a total sample area of 11.6 m2 from each experimental unit. The TDMAP treatment was changed in 2017 to 30% of the rate of TDM (an average application of 55 kg N ha-1) plus 70% of the rate of TSU (an average application of 117 kg N ha-1) for a total of 172 kg N ha-1. In other words, for the 2017 to 2023 period, the TDMAP treatment was changed to a TDMSU treatment. Additionally, the 179 kg N ha-1 TUF treatment was changed in 2021 to 179 kg N ha-1 TSU, so the TSU area doubled to cover an area 9.1 m wide by 15.2 m long. However, we continued collecting soil and plant samples at the original TSU area that had been receiving 179 kg TSU N ha-1 since 2012. Each year post corn emergence, TSU and TUF were surface broadcasted in the years 2012 to 2014 and 2018. They were surface banded in the years 2015 to 2017 and 2019 to 2020, and TSU was surface banded from 2021 to 2023. Immediately after fertilizer application, the plots were irrigated to incorporate the surface-applied fertilizer.
The dairy manure was obtained from the same commercial dairy operation since 2012 and it was composted for about 30 d from mid-February to mid-March. The composted solid manure’s water, total N% and total C% content was determined the week before application to be approximately 179 kg of available N rate ha-1. To get the final manure N input, a tractor loader tared using a weighbridge for the tractor and empty loader was used. After the manure was moved from the compost pile, it was returned to the weighbridge and adjusted until the manure content in the loader was one fourth of the intended full-plot application. A few hundred grams of manure were subsampled from the bucket into a small, steel can and sealed with a lid and weighed. The composted solid manure’s water, total % N and total % C content was determined again to calculate the final applied manure N rate (Table S3).
The loader delivered the bucket of manure to its assigned one quarter of the plot area where it was distributed as uniformly as possible across the soil surface by hand using pitch forks. This process was repeated four times for each TDM, TDMAP, and TDMSU plot. For the TDMAP plots only, immediately after manure application AP was dissolved in water and applied to the TDMAP plots (2012 to 2015) with a field sprayer before manure incorporation (see Table S3 for manure, AP, UF, and SU rates). The manure was applied each year about one month before planting, and on the same day of manure application to the treatments a rotor-tiller was used to incorporate the manure to a depth of 15 cm, simulating moldboard plow tillage (Table S3). Thus, all these treatments were tilled (cultivated) plots. The TUF, TSU, and TC0N plots were also rototilled at the same time so all plots had a similar tillage effect.
Figure 1.
Map of the location of the long-term effects of nitrogen sources with tillage study (A), strip till (B) and no-till (C) continuous corn rotation.
Figure 1.
Map of the location of the long-term effects of nitrogen sources with tillage study (A), strip till (B) and no-till (C) continuous corn rotation.
2.3. General Management, Plant and Soil Sample Collection, and Chemical Analysis
Corn was planted at a rate of 91,400 seed ha-1 close to the end of April or first week of May. Two adjacent rows, each 7.6 m long, for a total sample area of 11.6 m2 from each experimental unit was selected randomly at the beginning of the growing season and plant populations were counted. From adjacent rows to the 11.6 m2 sampling area, ten randomly plant samples were collected at R5.5 for silage (dent) and 15 randomly plant samples were collected at the R6 (physiological maturity) stage, which traditionally occurred in September. Plant populations were used to convert the R5.5 and R6 sampling to yields per hectare. R5.5 and R6 samples were divided into stalks, leaves, cobs, and grain to assess silage (R5.5) and biomass production of stalks, leaves and grain at R6.
After the drydown process, which usually occurred in October, harvested yields were collected by manually removing the ears from all plants in the 11.6 m2 sampling area from each experimental unit. All harvested ears were air-dried and mechanically threshed; the grain was then subsampled and oven-dried. (All oven-dried samples were left in a 60° C oven for at least 48 h.). After the collection of hand samples to assess harvested grain, all plots were harvested with a small plot harvester. Then a silage system was simulated by shredding and windrowing the corn stover and bailing it out, leaving just about 5-cm tall stalk stubs.
Each fall, after hand harvest of the corn plots as well as harvesting with a small-plot harvester, we collected soil samples using a tractor-mounted Giddings hydraulic sampler. At the same location, two cores were collected within each experimental unit. The first sample corer (approximately 5 cm wide) sampled the top 30 cm, and was divided into depth segments of 0 to 7.6, 7.6 to 15, and 15 to 30 cm. A second, narrower corer (approximately 2.7 cm wide) collected samples at depth segments of 30 to 61, 61 to 91, 91 to 122, 122 to 152, and 152 to 183 cm. Soil samples were brought to the laboratory and left open to air dry in weighing boats with fans blowing over them at room temperature for several weeks. Dry soil samples were passed through a 2-mm sieve and picked clean of crop residue and root matter larger than 2 mm in diameter. Picked samples were then grinded in a flail grinder. Because some organic matter that is longer than 2 mm can pass through the sieve if thin enough and oriented correctly (as in long pieces of essentially root material), such material was picked out if it passed through the sieve. Sieved and picked soil samples (2012 to 2017) were ground to pass a 150-μm screen and analyzed for total N using an Elementar Vario Macro C–N analyzer. A similar process to collect the soil samples was conducted for the spring 2012 soil samples collected before manure application. Soil samples were analyzed for total carbon, total nitrogen, inorganic carbon, extractable soil phosphorous (P), and inorganic nitrogen (NO3-N and NH4-N).
Aboveground plant samples and manure samples were also analyzed for carbon and nitrogen content with the Elementar Vario Macro C–N analyzer. We measured an average dry manure C content of 16.7% for the manure applied to the TDM treatment, which is similar to the 17% C content reported in the literature for feedlot cattle manure [27]. Manure samples from the 2012, 2014, and 2018 growing seasons were sent to the CSU Soil, Water, and Plant Testing Laboratory for phosphorus analysis, which found a total average % P content of 0.45% ± 0.17% for all years.
Since no other indicators of macro or micronutrient deficiencies in the plots were visually observed over the years other than N deficiencies in the control (non-N-fertilized) plots, we focused on N analysis and N budgets. Additional details of plant, soil, and irrigation sampling and analysis, as well as management information about irrigation, N inputs/applications, pesticide applications, and plant sampling operation are shown in Tables S4 and S5, and Figure S1. Each of the soil N pools was expressed on the basis of an equivalent mass as described by Ellert et al. (2001)[28] and others that have used the equivalent soil mass procedure to conduct soil N balance as done by Delgado et al. (2023) [7]. A Valley® linear-move sprinkler was used to irrigate the corn as needed and irrigation samples were collected each time to determine background NO3-N and NH4-N content in water.
2.4. Weather
Weather data was collected at the ARDEC research station from 2012 to 2023 (COlorado AGricultural Meteorological nETwork [CoAgMet] station #: FTC03). In the few instances where temperature or precipitation data was missing, this was supplemented by the CoAgMET station FCL01, which is located about 9 miles away from FTC03 on CSU’s main campus. The data from CoAgmet station #FTCO3 and FCL01 was used to calculate the growing degree days. Additional information about weather is also shown in Tables S1 and S2.
2.5. N Budgets, NUE, Statistical Analysis, and Comparison to No-Till and Strip Till Treatments
Differences due to treatments within the nitrogen sources with tillage study were determined by analysis of variance using function aov in R (R version 4.1.0) with mean separation using Least Significant Differences (LSD) analysis [29]. Additionally, we conducted a t-test analysis using a t-test (function t.test) in R [29] by year to determine if from 2012 to 2023 the harvested grain yields and N content of the harvested grain yields for the TDM, TDMAP, TSU, TUF, NT202, and ST202 treatments were different. The differences between the control, non-fertilized plots under (TC0N), NT (NTC0N), and ST (STC0N) were also tested. The following t-tests in R [41] were done: TDM vs. NT; TDM vs. ST; TDMAP vs. NT; TDMAP vs. ST202; TDMSU vs. NT202; TDMSU vs. ST202; TSU vs. NT202; TSU vs. ST202; TUF vs. NT202; TUF vs. ST202; and NT202 vs. ST202; TC0N vs. NTC0N; TC0N vs. STC0N; and NTC0N vs. STC0N. A similar t-test assessment to look for differences in effects of tillage systems such as CT, NT, and ST was done by Delgado et al. (2024, [23]) where the means plus the confidence intervals at P <0.05 were used to assess the effects of N rates by years between these tilled systems. We are using the t-test in our case to assess the yield differences between the N sources with tillage study and the NT and ST studies. Detailed information about the statistical assessment of NT and ST long-term rotations has been provided in previous publications by Delgado et al. [7,23,30], but no long-term comparison of the nitrogen sources with tillage study and ST and NT results from 2012 to 2023 has been conducted.
We used the method used by Delgado et al (2023, [7]) where a regression analysis was used to assess changes in soil properties with time and soil depth, and an assessment was conducted on the changes in agronomic productivity (e.g., grain yields) with time. An N budget similar to that conducted by Delgado et al. (2023) [7] was done for the manure plots (TDM, TDMAP, TUF, TSU, and TC0N) from 2012 to 2017 [7]. For the N budget, all inputs of N with the fertilizer and/or manure were accounted for, and the changes in total soil N, soil organic N and soil inorganic N were determined. Estimated atmospheric wet and dry deposition were also accounted for, as well as the N input with background irrigation N, following the Delgado et al. (2023) [7] approach (Table S4). For a detailed description of how the N budget analysis was conducted, see Table S4 in the supplementary materials and Delgado et al. (2023) [7]. The NUESys and NLsys were calculated similarly to how it was done in Delgado et al. (2023; Table S4) [7]. The NUE analyses were calculated using the traditional method of subtracting the N uptake using the control plots.
Similar to the approach taken by Delgado et al. (2023, [7]),no plant biomass outliers were removed to conduct the 2012 to 2017 N balance and to assess the NUESys, nor to calculate the N losses from the system (NLSys) [7]. To assess the N balance, N losses, and NUESys, the total N removed from each individual experimental unit was accounted for, independent of hail and/or other factors. Plant biomass outliers were only removed to assess the changes in corn dry biomass production and N content trends from 2012 to 2023. The years 2012 (bird damage), 2016 (severe bird damage), 2018 (minimal grain yield impact from minor hail damage), 2019 (bird damage) and 2022 (severe hail damage) were not used to assess changes in agronomic productivity (e.g., grain yields) with time because yields were significantly reduced due to hail, or in the case of 2018, minimally impacted. Or, in the case of bird damage, plants around the sampled plants were damaged. Since the experimental units were of sufficient size to enable us to sample corn plants that were not affected by bird damage, in cases where there was significant corn crop damage in a sample row or for a given year, another plant within the experimental units would be sampled at random from the adjacent row instead. We believe that this strategy allows us to assess the effects of treatments on yields with the ANOVA assessment. This was especially true for the NT and ST plots that had about twice the area of the nitrogen-sources-with-tillage study. Independently of bird damage to yields for a given year; however, in order to be conservative in the case of using linear regression to assess changes in production with time, we removed the years when we observed bird damage, and also the years were there was hail damage and entire plots were severed or minimally impacted by hail (2018, minimal impact; 2022, severe impact).
For the statistical analysis of soil response variables, we identified outliers using an R Core Team language regression analysis [29] for each response variable versus the number of days since the start of the study. The regression analysis was done by treatment level and soil depth segment. For each fit, studentized residuals were calculated using the function rstudent(), and observations having a studentized residual with absolute value greater than or equal to 3 were marked as outliers and removed from the dataset. In 2014, a large level of soil NH4–N was detected, which was identified as substantial noise in the NH4–N analysis, with the control (non-fertilized) soils having an impossible value of 1,740 kg ha-1 of available NH4-N (0 to 180 cm depth). Since the yields of the control plots in 2014 were low, as in other years, and we did not know the source of this noise, the 2014 fall soil samples were not used for any analyses. For full transparency, all datasets, including versions with and without outliers removed, have been provided with this paper as supplementary material so readers could see both the entire data collection, as well as the datasets that were used for this study.
3. Results
3.1. Changes in Soil N and C Pools, N Balance, and N and C Sequestration
The changes in inorganic N expressed in total equivalent soil mass (inorganic Nem) from 2012 to 2017 were −77, 50, and 107 kg inorganic Nem ha-1 for the TC0N, TDM, and TSU, respectively. These changes in inorganic Nem reflect the sum of the changes in NO3-N expressed in equivalent soil mass (NO3-Nem) and NH4-N expressed in equivalent soil mass (NH4-Nem). The changes in soil organic N expressed in equivalent soil mass (soil organic Nem) were 0, 708, and −597 kg soil organic Nem ha-1 for TC0N, TDM, and TSU, respectively. Thus, the total changes in total soil N expressed in equivalent soil mass (total soil Nem) were −77, 758, and −490 kg N ha-1 for TC0N, TDM, and TSU, respectively. These changes in total soil Nem suggest that N from the soil organic Nem pool of the TSU treatment was being lost. These findings of soil organic Nem losses are in agreement with the soil organic Cem losses, suggesting there is active soil microbial biomass in a tilled system that is not only contributing to these dynamics and transformations (and thus contributing to N cycling) but also in this case to N losses from the system (e.g., losses of N from the organic N pool).
This loss of N from the total soil Nem of TSU agrees with a previous N balance study conducted for a no-till continuous corn system at this site that found N is being lost from the total soil Nem and soil organic Nem pools [7]. The loss of 98 kg N ha-1yr-1 from the TSU treatment in this five-yr. N balance study is four times higher than the loss observed in the NT study (24 kg N ha-1yr-1) that was conducted with a 13-yr. N balance at this site [7]. The greater N losses from the total soil Nem and soil organic Nem pools observed with the TSU treatment than with the NT studies agree with findings from various studies that have reported greater C losses from tilled systems than no-till systems [31,32,33,34]. We did not detect N being lost from the soil organic Nem pool with the TC0N using the Delgado et al. (2023) [7] peer-reviewed method that used the P<0.18 level. We suggest that five years was not enough time to detect these changes in soil organic Nem loss from the TC0N at P<0.18. The negative N loss detected in total soil Nem with TC0N (−77 kg total soil Nem ha-1) suggests that the control plots are also losing N from the soil organic Nem pool at this site. The NH4-Nem of TC0N increased across the soil profile while the NO3-Nem decreased across the soil profile, an additional indication that N was being lost from the soil organic Nem with TC0N and/or that a significant amount was removed with the harvested grain and bailed out of the TC0N. In contrast to these findings of losses of soil organic Nem with no-till and tilled systems fertilized with inorganic N, the TDM is sequestering N in the soil at a rate of 126 kg N ha-1 yr-1.
While the 2012 to 2017 losses of TSU soil organic Nem were occurring, TSU was also losing −1190 kg ha-1 of soil organic C expressed in equivalent soil mass (soil organic Cem; −198 kg C ha-1yr-1). We were not able to detect the loss of soil organic Cem from the TC0N at P<0.18. We suggest that five years was not enough time to detect these changes in soil organic Cem loss from the TC0N at P<0.18. In contrast, we found that the manure-fertilized plots are sequestering C in the soil at a rate of 2830 kg C ha-1 y-1, for a total of 17,000 kg C ha-1 sequestered from spring 2012 to fall 2017. The dry manure C content of 16.7% for the TDM measured in our laboratory was similar to the C content of 17% that has been reported in the literature for feedlot cattle manure [27].
The TDM plots received a total of 424,000 kg dry manure ha-1, which contained 62,300 kg C ha-1 and 4538 kg N ha-1, respectively. Although we don’t know how much C was sequestered from the manure versus how much was sequestered from crop residue (e.g., roots), if we divide the C sequestration by the total C applied with the manure, we estimate that about 27% of the applied C with manure was sequestered in the soil. If we also account for the fact that applying inorganic N and tilling the system (TSU) generates a loss of 1190 kg C ha-1, then TDM sequestered 43% of the applied C with manure compared to the tilled system receiving inorganic fertilizer. This is important for farmers to know if they are interested in seeking potential compensation for sequestering C in their agricultural system.
The total organic or inorganic N fertilizer inputs were 2097, 1070, and 0 kg N ha-1 with TDM, TSU, and TC0N, respectively. We applied an additional 121 kg N ha-1 with the irrigation water to all the plots. Using the same method as Delgado et al. (2023) [7], we found that the estimation of atmospheric N inputs at the site was 31.2 kg N ha-1 for 2012 to 2017.
The amount of N removed with the harvested grain was 373, 809, and 855 kg N ha-1 for the TC0N, TDM, and TSU treatments, respectively; with bailing and removal of crop residue after harvesting, the amount of N removed was 193, 436, and 373 kg N ha-1 for the TC0N, TDM, and TSU treatments, respectively. An N balance accounting for changes in the soil N pools in the 0 to 120 cm soil profile found that the system nitrogen use efficiency (NUESys) for TDM is 86.3%, which is higher than the NUESys for TSU (60.2%). The TDM loss of 13.7% of the N inputs to the environment is lower than the 39.8% observed with TSU. For total N mass loss, the N balance found that the N loss from TSU from 2012 to 2017 of 488 kg N ha-1 was higher than that of TDM, which was 309 kg N ha-1. The higher NUESys of TDM compared to TSU was not just because TDM removed more nitrogen (a total of 1250 kg N ha-1 compared to 1230 kg N ha-1 removed with TSU); rather, the N balance reveals that the key reason is that TDM sequestered a large amount of N in the soil organic N (708 kg N ha-1) while TSU resulted in a loss of 597 kg N ha-1 of soil organic N from 2012 to 2017. This loss is the mineralization of practically 100 kg N ha-1 that was available for corn uptake but instead escaped to the environment.
Although the manure system (TDM) was sequestering C and N, it still had an average loss of 300 kg N ha-1, for an average 50 kg N ha-1yr-1, exceeding the average loss of 40 kg N ha-1 yr-1 under no tillage with the 202 kg N ha-1 rate reported by Delgado et al. (2023) [7] at this site. These findings show that tilled systems (TSU) are losing significant C and N at a higher rate than the no-till system at this site, and that although on a percentage basis the manure system is sequestering C and N, with significant increases in total N balance, the amount of N lost from the system is still significantly higher than the amount of N lost with a no-till system. The rate of soil organic Cem and soil organic Nem sequestration for the 0 to 7.6 cm and 7.6 to 15 cm depths was higher with manure (TDM, TDMAP) than the rate of soil organic Cem and soil organic Nem losses with inorganic N (TSU, TUF, P<0.05, Table S25).
3.2. Effects of Organic and Inorganic N Inputs on Soil Parameters: 2012 to 2017
For the 2012 to 2017 period, we did not detect any differences in total inorganic C expressed in equivalent soil mass at any of the depths from 0 to 120 cm (P<0.05, Table S6). In contrast, total extractable P expressed in equivalent soil mass (extractable Pem) started to increase quickly after the first year of manure application, and extractable Pem was significantly higher for TDM, TDMAP, and TDMSU (the manure treatments) than the other treatments (P<0.05, Table S6). This signal of higher extractable Pem was also observed for the 7.6 to 15 cm and 15 to 30 cm depths with just one application of manure. Higher extractable Pem content was constantly observed with the manure treatments in 2013, 2014, and 2016 (P<0.05, Table S6). For example, in 2016 the average extractable Pem for the manure treatments was 103, 103, and 27 kg P ha-1 for the 0 to 7.6, 7.6 to 15, and 15 to 30 cm depths, respectively (P<0.05, Table S6), which was higher than the average extractable Pem for TSU and TC0N of 13, 9, and 5 kg P ha-1 for the 0 to 7.6, 7.6 to 15, and 15 to 30 cm depths, respectively (P<0.05, Table S6). All manure-treated plots had significantly higher extractable Pem than the inorganic-N-fertilized treatments and the control plots receiving no inorganic N fertilizer or manure (extractable Pem of TDM, TDMAP, and TDMSU > extractable Pem of TSU, TUF and TC0N; P<0.05).
Similarly to extractable Pem, we detected significant increases in soil organic Cem at the 0 to 7.6 cm soil depth with the TDM and TDMAP treatments in 2012, which were higher than TSU, TUF, and TC0N in 2012, and through 2013 to 2017 (P<0.05, Table 1, Table S6; Figure 2). By 2015, the average soil organic Cem of TDM and TDMAP was 16,800, 17,200, and 29,900 kg C ha-1 at the 0 to 7.6, 7.6 to 15, and 15 to 30 cm depths, respectively, which exceeded the average soil organic Cem of the TUF, TSU, and T0N of 11,400, 11,900 and 21,300 kg C ha-1 at the 0 to 7.6, 7.6 to 15, and 15 to 30 cm depths, respectively (P<0.05, Table 1, Table 2; Figure 2, Figure 3; Table S6). Similarly to the observed immediate increases in extractable Pem and soil organic Cem, there was also an immediate increase in soil organic Nem in 2012, that continued during 2013, 2015, 2016, and 2017 (P<0.05, Table 2, Table S6; Figure 3). The average soil organic Nem values for TDM and TDMAP were 1,850 and 1,910 kg N ha-1 for the 0 to 7.6 and 7.6 to 15 cm soil depths, respectively, which exceeded the average soil organic Nem values of 1,380 and 1,440 for TSU, TUF, and TC0N, respectively (P<0.05, Table S6).
The total soil C expressed in equivalent soil mass (total soil Cem) with the TDM was higher than the total soil Cem for TC0N, TSU, and TUF in the top 30 cm in 2014, 2015, and 2017 (P<0.05, Table S6). The average total soil Nem with TDM and TDMAP was higher from 2012 to 2017 than with TC0N, TSU, and TUF. In 2017, the average total soil Nem values for TDM and TDMAP of 1,876 and 1,940 kg N ha-1 at the 0 to 7.6 and 7.6 to 15 cm depths, respectively, were higher than those of the TC0N, TSU, and TUF treatments, which averaged 1,410 and 1,470 kg N ha-1 for the 0 to 7.6 and 7.6 to 15 cm depths, respectively (P<0.05, Table S6).
3.3. Effects of Organic and Inorganic N Inputs on Soil Parameters: 2012 to 2022
Similarly to the changes that we observed in extractable Pem (Table 3) we detected changes in inorganic Nem in 2013, 2018, 2019, and 2022, when lower inorganic Nem was detected for TC0N at various depths from 0 to 120 cm (P<0.05, Table S6). We also detected differences in inorganic Nem between the organic and inorganic N inputs at the lower depths of 30 to 61 cm, and occasionally at even greater depths, in 2013, 2018, and 2019 (P<0.05, Table S6). This suggests that inorganic NO3 was being moved to lower depths and perhaps leaching out of the system, in agreement with findings by Delgado et al. (2023) [7]. The differences in NO3-Nem were observed constantly from 2013 to 2019 and from 2021 to 2022 in fall soil sampling events, with TC0N constantly having the lower NO3-Nem content. This supports the conclusion that organic and inorganic N fertilizer inputs increased NO3-Nem levels above background levels and that NO3-Nem is one of the pathways for movement of inorganic Nem through the soil profile and out of the system. The data shows constantly higher NO3-Nem levels above control levels at the 30 to 61 cm depths, and even up to the 150 to 180 cm soil depths (P<0.05, Table S6). The inorganic N fertilizer sources consistently had higher concentrations at the lower depths, and we only detected higher concentrations for the manure treatments at the 15 to 30 cm depth. These results suggest that among all the organic and inorganic N inputs, the inorganic N fertilizer sources were more mobile, contributing to the movement of NO3-Nem to greater soil depths, and thus higher NO3-Nem than the non-fertilized TC0N and manure plots (TDM and TDMAP) at this site (P<0.05, Table S6).
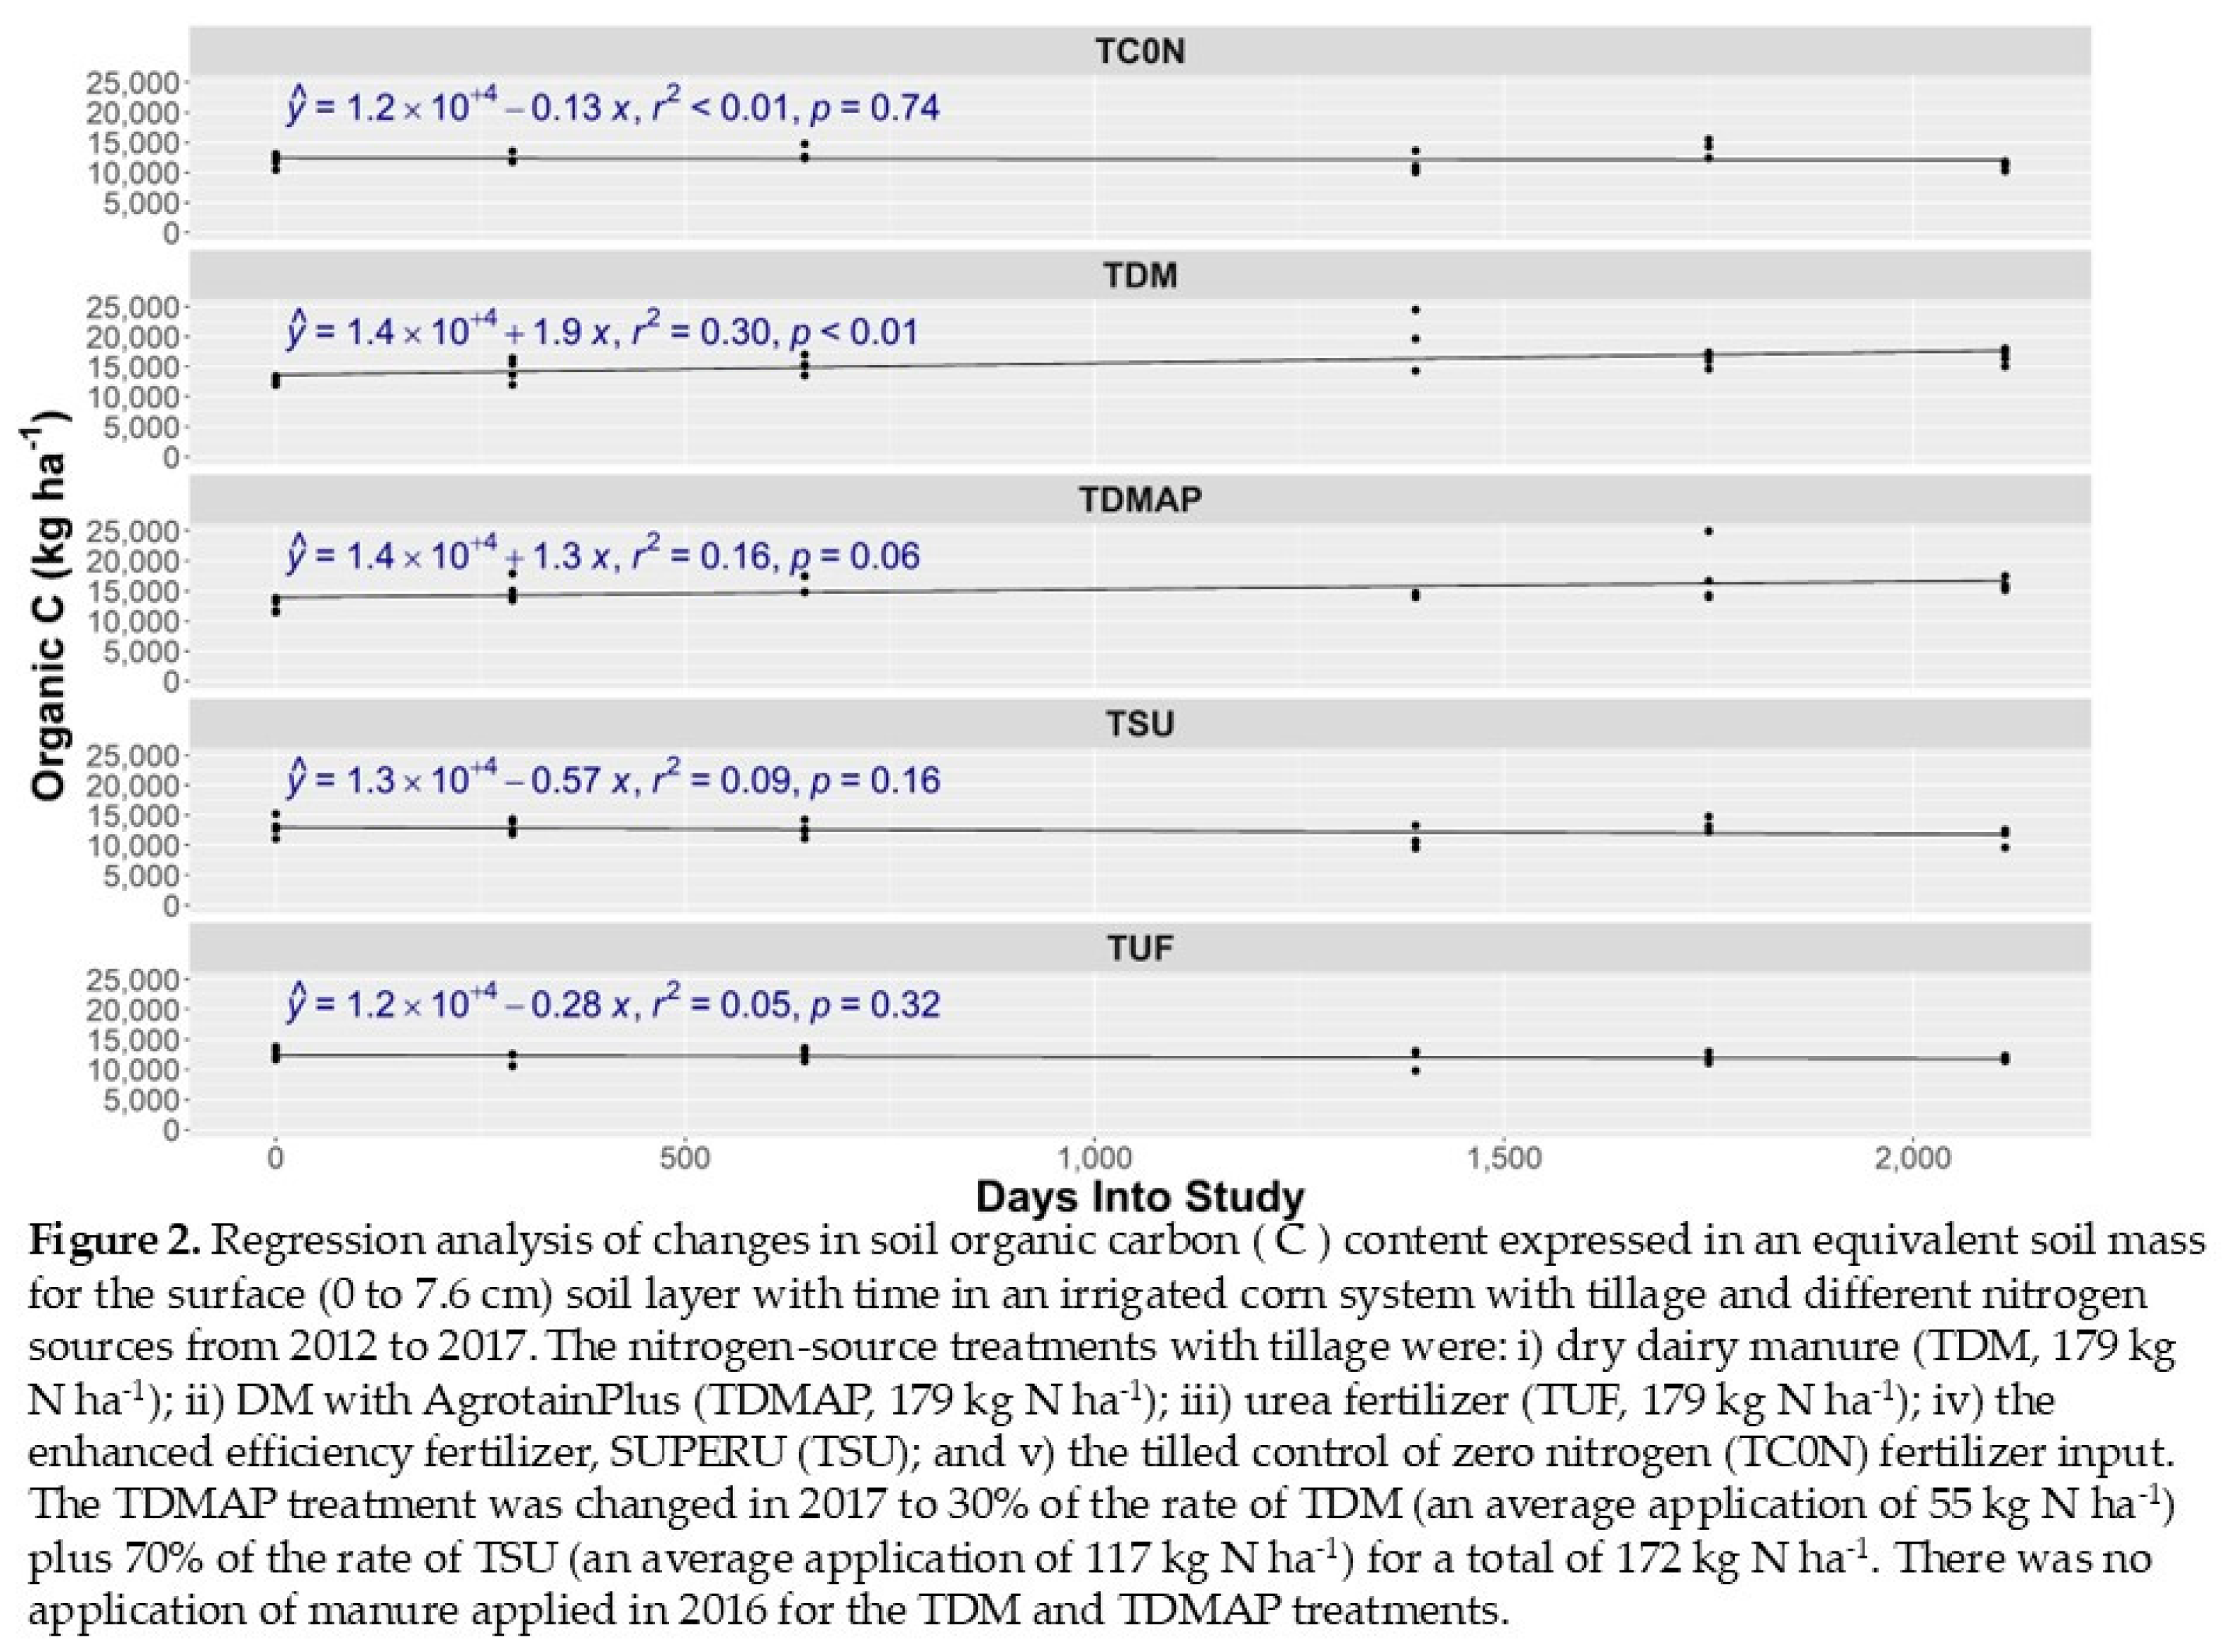
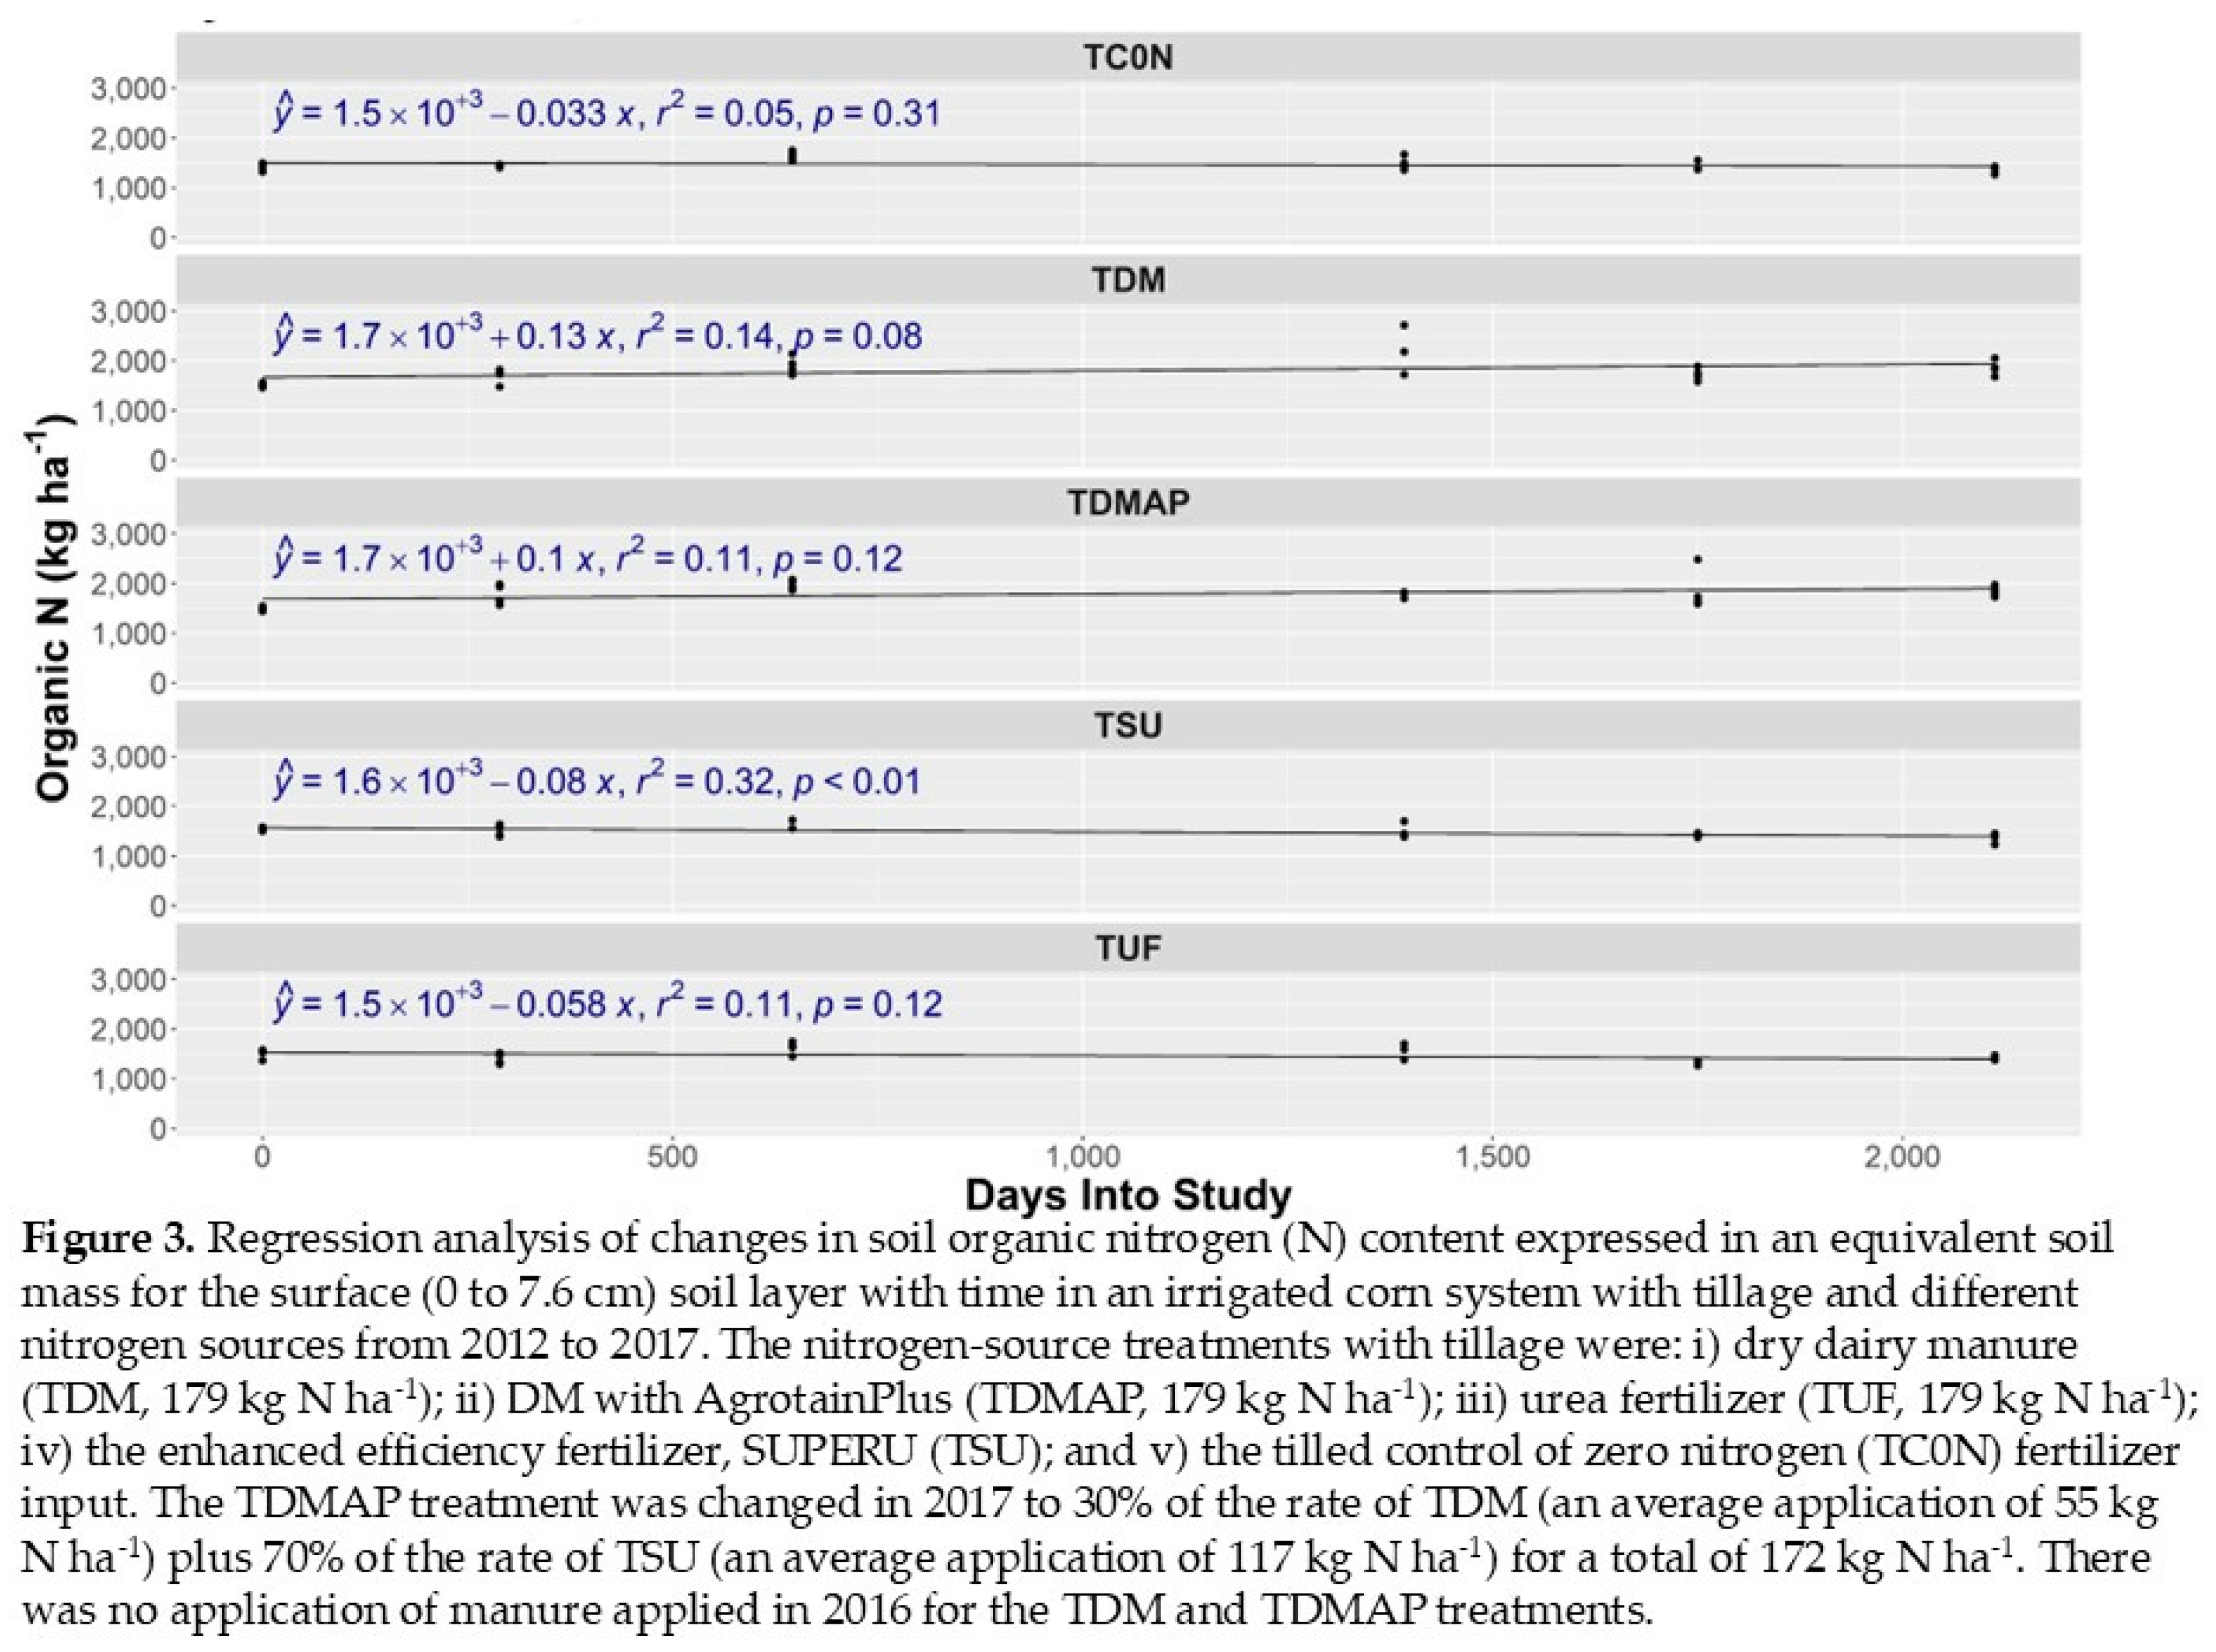

Table 1.
Differences in soil organic carbon (C) content expressed in equivalent soil mass at the surface (0 to 7.6 cm) soil layer among treatments receiving different nitrogen sources (nitrogen sources with tillage study) in an irrigated, continuous corn system grown from 2012 to 2023¥ β.
Table 1.
Differences in soil organic carbon (C) content expressed in equivalent soil mass at the surface (0 to 7.6 cm) soil layer among treatments receiving different nitrogen sources (nitrogen sources with tillage study) in an irrigated, continuous corn system grown from 2012 to 2023¥ β.
| Year$ | TDM | TUF | TSF | TC0N | |
| ----------------------------------------------------- kg C ha-1 ----------------------------------------------------------- | |||||
| 2012-Spring | 12,575 aA | 12,523 aA | 12,685 aA | 13,011 aA | 11,934 aA |
| 2012-Fall | 14,377 abAB | 15,100 aA | 11,555 bB | 13,060 abAB | 12,231 abAB |
| 2013-Fall | 15,257 abAB | 16,135 aA | 12,661 bB | 12,594 bB | 13,056 bB |
| 2015-Fall | 19,473 aA | 14,186 abAB | 11,870 bB | 11,016bB | 11,263 bB. |
| 2016-Fall | 16,217 aAB | 17,465 aA | 11,924 aB | 13,322 aAB | 13,662 aAB |
| 2017-Fall | 16,670aA | 16,045 aA¶ | 11,752 bB | 11,474 bB | 11184 bB |
¥The nitrogen-source treatments with tillage were: i) dry dairy manure (TDM, 179 kg N ha-1); ii) DM with AgrotainPlus (TDMAP, 179 kg N ha-1); iii) urea fertilizer (TUF, 179 kg N ha-1); iv) the enhanced efficiency fertilizer, SUPERU (TSU); and v) the tilled control of zero nitrogen (TC0N) fertilizer input. There was no application of manure applied in 2016 for the TDM and TDMAP treatments. βWithin a year, treatments with different letters are significantly different; capital letters indicate differences are significant at α = 0.10, and lowercase letters indicate differences at α = 0.05. ¶The TDMAP treatment was changed in 2017 to 30% of the rate of TDM (an average application of 55 kg N ha-1) plus 70% of the rate of TSU (an average application of 117 kg N ha-1) for a total of 172 kg N ha-1.
Table 2.
Differences in soil organic nitrogen (N) content expressed in equivalent soil mass at the surface (0 to 7.6 cm) soil layer among treatments receiving different nitrogen sources (nitrogen sources with tillage study) in an irrigated, continuous corn system grown from 2012 to 2023¥ β.
Table 2.
Differences in soil organic nitrogen (N) content expressed in equivalent soil mass at the surface (0 to 7.6 cm) soil layer among treatments receiving different nitrogen sources (nitrogen sources with tillage study) in an irrigated, continuous corn system grown from 2012 to 2023¥ β.
| Year$ | TDM | TUF | TSF | TC0N | |
| ----------------------------------------------------- kg N ha-1 ----------------------------------------------------------- | |||||
| 2012-Spring | 1503 aA | 1482 aA | 1502 aA | 1542 aA | 1425 aA |
| 2012-Fall | 1693 abAB | 1782 aA | 1403 cC | 1503 bcBC | 1431 bcC |
| 2013-Fall | 1904 aA | 1974 aA | 1619 bB | 1606 bB | 1637 bB |
| 2015-Fall | 2205 aA | 1777 abAB | 1555 bB | 1480bB | 1486 bB |
| 2016-Fall | 1728 abAB | 1858 aA | 1305 bB | 1410 abB | 1435 abAB |
| 2017-Fall | 1854aA | 1845 aA | 1407 bB | 1373 bB | 1369 bB |
¥The nitrogen-source treatments with tillage were: i) dry dairy manure (TDM, 179 kg N ha-1); ii) DM with AgrotainPlus (TDMAP, 179 kg N ha-1); iii) urea fertilizer (TUF, 179 kg N ha-1); iv) the enhanced efficiency fertilizer, SUPERU (TSU); and v) the tilled control of zero nitrogen (TC0N) fertilizer input. There was no application of manure applied in 2016 for the TDM and TDMAP treatments. βWithin a year, treatments with different letters are significantly different; capital letters indicate differences are significant at α = 0.10, and lowercase letters indicate differences at α = 0.05. ¶The TDMAP treatment was changed in 2017 to 30% of the rate of TDM (an average application of 55 kg N ha-1) plus 70% of the rate of TSU (an average application of 117 kg N ha-1) for a total of 172 kg N ha-1.
Table 3.
Differences in total soil extractable phosphorous (P) expressed in equivalent soil mass at the surface (0 to 7.6 cm) soil layer among treatments receiving different nitrogen sources (nitrogen sources with tillage study) in an irrigated, continuous corn system grown from 2012 to 2023¥ β.
Table 3.
Differences in total soil extractable phosphorous (P) expressed in equivalent soil mass at the surface (0 to 7.6 cm) soil layer among treatments receiving different nitrogen sources (nitrogen sources with tillage study) in an irrigated, continuous corn system grown from 2012 to 2023¥ β.
| Year$ | TDM | TUF | TSF | TC0N | |
| ----------------------------------------------------- kg P ha-1 ----------------------------------------------------------- | |||||
| 2012-Spring | 38 aA | 18 abB | 17 abB | 14 bB | 21 abAB |
| 2012-Fall | 54 aA | 72 aA | 7 bB | 9 bB | 9 bB |
| 2013-Fall | 78 aA | 91 aA | 13 bB | 18 bB | 13 bB |
| 2016-Fall | 103 aA | 104 aA | 9 bB | 16 bB | 15 bB |
¥The nitrogen-source treatments with tillage were: i) dry dairy manure (TDM, 179 kg N ha-1); ii) DM with AgrotainPlus (TDMAP, 179 kg N ha-1); iii) urea fertilizer (TUF, 179 kg N ha-1); iv) the enhanced efficiency fertilizer, SUPERU (TSU); and v) the tilled control of zero nitrogen (TC0N) fertilizer input. There was no application of manure applied in 2016 for the TDM and TDMAP treatments. βWithin a year, treatments with different letters are significantly different; capital letters indicate differences are significant at α = 0.10, and lowercase letters indicate differences at α = 0.05. ¶The TDMAP treatment was changed in 2017 to 30% of the rate of TDM (an average application of 55 kg N ha-1) plus 70% of the rate of TSU (an average application of 117 kg N ha-1) for a total of 172 kg N ha-1.
We did not detect practically any differences in NH4-Nem among the treatments (TDM, TDMAP, TC0N, TUF, and TSU) in all sampled soil depths (0 to 180 cm) from spring 2012 to fall 2022 (P<0.05, Table S6). Only on one occasion in the fall of 2021 at a depth of 15 to 30 cm did we identify a difference in NH4-Nem between the control and SU treatments (P<0.05, Table S6). Although there were no differences among treatments, the NH4-Nem was increasing for TDM, TSU, and TC0N (P<0.05, Table S9). Additionally, soil organic Nem and Cem were increasing for the manure treatments (TDM, TDMAP) and were decreasing for the inorganic-N-fertilized or non-fertilized treatments (TC0N, TUF and TSU; P<0.05, Table S9). This strongly suggests that the microbial biomass was active and playing a major role in sequestering C and/or N, increasing soil organic matter C and N for the manure treatments (TDM, TDMAP, TDMSU; P<0.05, Table S9), and releasing C and N from the soil organic matter with the inorganic-N-fertilized treatments and/or non-fertilized treatments (TC0N and TSU; P<0.05, Table S9). Additionally, the differences that we saw among treatments in NO3-Nem from 2012 to 2017 are also an indicator that the microbial biomass was active and contributing to the mineralization process that contributed to these changes in C and N content of the soil organic matter. These changes suggest there was increased mineralization and/or nitrification from the added N fertilizer (manure N and inorganic N) that was contributing to changing NH4-N to NO3-N and/or also being taken up by the corn growing in these plots. Delgado et al. (2023) [7] also found that NH4-Nem was increasing for the no-till plots at this site; however, we suggest that our data support that there was a quick transformation of NH4-Nem to NO3-Nem, contributing to no significant difference due to treatments in NH4-Nem, but contributing to significant differences due to treatments in NO3-Nem (P<0.05, Table S6).
3.4. Effects of Organic and Inorganic N Inputs on Yields and N Uptake (2012-2023)
Silage (R5.5): We found that all organic and inorganic N inputs increased silage yields beyond TC0N during 2012, from 2015 to 2018, and in 2022 (P<0.05, Table S10). In 2013, 2014, 2019, and 2022, the two manure treatments had higher silage yields than TC0N (P<0.05, Table S10). In 2021, only the TDMSU silage yields were higher than those of TC0N (P<0.05, Table S10). In 2019 and 2021, the silage production of TSU was higher than that of TC0N (P<0.05, Table S10). In 2020 and 2023, the organic and inorganic N inputs did not increase the silage yields above TC0N (P<0.05, Table S10). In summary, for the vast majority of years from 2012 to 2023, both organic and inorganic N inputs increased the silage yields over those of TC0N (P<0.05, Table S10). Among organic and inorganic comparisons in 2021 and 2022, the TDMSU had higher silage production than TSU, suggesting a positive effect of adding manure with EEF vs. adding the EEF alone (P<0.05, Table 4, Table S10).
Physiological maturity (R6): We found that all organic and inorganic N inputs increase total aboveground biomass production above those of TC0N every year from 2012 to 2023 (P<0.05, Table S10). Comparison of organic and inorganic N inputs revealed that in 2016 the R6 aboveground biomass production with TUF and TSU were higher than with the TDM and TDMAP; however, this was the year that we did not apply manure, showing that the manure application from 2012 to 2015 did not have sufficient recycling of N to maximize aboveground production (P<0.05, Table S10). When organic and inorganic N inputs were applied only in 2020, 2021, and 2022, total biomass production at R6 with TDMSU was higher than TSU, supporting the hypothesis that there was a positive interaction effect of adding manure with EEF vs. EEF alone (P<0.05, Table S10).
Harvested grain: We found that all organic and inorganic N inputs increased harvested grain yields above those of TC0N every year from 2012 to 2023 (P<0.05, Table S10). Comparison of organic and inorganic N inputs revealed that in 2016 the TUF and TSU harvested grain yields were higher than those of the manure treatments; however, this was the year that we did not apply manure (P<0.05, Table S10), showing that the manure application from 2012 to 2015 did not have sufficient recycling of N to maximize harvested grain production (P<0.05, Table S10). Comparison of organic and inorganic N inputs when N inputs were applied, found that in 2014 harvested yields of TDM were higher than those of TUF (P<0.05, Table S10) and that in 2023 the harvested yields of TDMSU and TDM were higher than TSU, suggesting a positive effect of adding manure with EEF compared to EEF alone (P<0.05, Table S10).
N uptake at R5.5: We found that all organic and inorganic N inputs increased total N uptake aboveground silage (R5) production above that of TC0N every year from 2012 to 2022, except in 2016 and 2020 (P<0.05, Table S10). A comparison of organic and inorganic N inputs found that only in 2016 was the N uptake from inorganic N sources (TSU and TU) with silage production higher than that of TC0N, but the organic manure treatments were not higher than TC0N (P<0.05, Table S10). This shows that the N cycling from the applied manure from 2012 to 2015 did not cycle enough N to maximize N uptake with the manure treatments to increase N uptake beyond that of the control plots, but it was high enough to have N uptake with the manure treatments in the year that the manure was not applied, so it was not different from the plots with inorganic N inputs (P<0.05, Table S10). There were no differences in N uptake in 2020 among treatments (P<0.05, Table S10). In 2023, only TDMSU had significantly higher N uptake than TC0N, but it was not different from TDM and TSU (P<0.05, Table S10). However, the TDM and TSU treatments did not have higher N uptake than TC0N (P<0.05, Table S10).
N uptake at R6.0: We found that all organic and inorganic N inputs increased total N uptake aboveground biomass production at R6 beyond TC0N every year from 2012 to 2023 (P<0.05, Table S10). Comparison of organic and inorganic N inputs revealed that in 2016 the N uptake of aboveground biomass at R6 from TSU and TUF was higher than that of TDM, and that it was higher for TSU than TDMAP. This shows that the N cycling from the applied manure from 2012 to 2015 did not cycle enough N to maximize N uptake with the manure treatments at R6 (P<0.05, Table S10). Since the N uptake from TC0N in 2016 (the year that manure N was not applied) was 91 kg N ha-1 and the N uptake average for TDM and TDMAP in 2016 was 167 kg N ha-1, we estimate that the applied manure from 2012 to 2015 was cycling 76 kg N ha-1 that was taken up by the TDM and TDMAP aboveground biomass at R6 (167 kg N ha-1 − 91 kg N ha-1 = 76 kg N ha-1). Since we did not apply manure N in 2016 to the TDM and TDMAP plots, and the average N uptake of the TDM and TDMAP was 76 kg N ha-1 higher than the control (non-N-fertilized plots; TC0N), this clearly shows that N was being cycled from manure N sources at a high N rate, illustrating the importance of accounting for N sources applied in previous years (P<0.05, Table S10). Additionally, among organic and inorganic comparisons, when N inputs were applied only in 2021, we detected a difference among N inputs, with TDMSU resulting in higher N uptake than the TDM and TSU treatments, supporting the hypothesis that manure applications with EEF had a positive effect of recovering N compared to EEF alone (P<0.05, Table S10).
N uptake at harvest of grain: We found that all organic and inorganic N inputs increased total N uptake content by the harvested grain above TC0N every year from 2012 to 2022 (P<0.05, Table S10). Comparison of organic and inorganic N inputs found that in 2016 when manure was not applied, the harvested grain N uptake from TSU and TUF were higher than with TDM and TDMAP (P<0.05, Table S10). This shows that the N cycling from the applied manure from 2012 to 2015 did not cycle enough N to maximize N uptake by the harvested grain (P<0.05, Table S10). Since the harvested grain N uptake from TC0N was 61 kg N ha-1 and the N uptake average from the two manure treatments was 87 kg N ha-1, the N cycling from the applied manure from 2012 to 2015 absorbed by the grain was estimated at 26 kg N ha-1 (87 kg N ha-1 − 61 kg N ha-1 = 26 kg N ha-1). Additionally, among organic and inorganic comparisons, when N inputs were applied only in 2014 and 2023, the N content of the grain yield of TDM and TDMAP was higher than that of TSU and TUF (P<0.05, Table S10). In 2023, TDM and TDMSU resulted in higher harvested grain N uptake than TSU (P<0.05, Table S10).
NUEs: The NUE of the total aboveground biomass at R6 was not significantly different among treatments in 8 of the 12 years in the 2012 to 2023 period (P<0.05, Table S10); only in 2018 (TUF > TDM), 2019 (TDM > TUF), 2020 (TDMSU > TUF) and 2021 (TDMSU > TSU and TDM) (P<0.05, Table S10). Since we only had TDMSU since 2017, in two of the seven years TDMSU had higher NUE than the other treatments (TDM, TSU, and/or TUF; P<0.05, Table S10). These results suggest that the application of manure with EEF may contribute to increased NUE of manure systems beyond SU alone or manure alone. Similarly, in eight of the 11 years there were no significant differences in silage NUE among treatments (P<0.05, Table S10). Due to the onset of the covid pandemic, silage samples were not collected in 2020; silage NUEs were only significant in 2012 (TUF > TDMA), 2015 (TSU and TUF > TDM), and 2022 (TDMSU > TDM and TSU). This suggests that when we detected the differences in three of the 12 years, the advantages in NUE were for the inorganic N fertilizer treatments or a combination of inorganic fertilizer and manure treatments, rather than the organic (manure) treatments (P<0.05, Table S10). We suggest that the continued N cycling from manure contributes to increased availability of N and increased NUE at the later harvesting stages of R6 and harvested grain, with relative advantages to TDM and/or TDMSU compared to just inorganic N fertilizer, which can potentially be vulnerable to losses early in the growing season via various loss mechanisms, while the manure can function as a slow-release fertilizer and continue to cycle N from manure from the R5.5 to R6 stages and then move the N that was taken up to the harvested grain.
The NUE of the harvested grain was more dynamic with only five of the 12 years (less than half) not being significant (P<0.05, Table S10). We found differences in 2012 (TSU > TDMA and TDM; TUF>TDMA), 2013 (TDMA > TUF); 2014 (TDM and TDMA > TUF and TSU); 2017 (TDMSU > TUF, TDM); 2018 (TSU > TDM); 2021 (TDMSU>TDM) and 2023 (TDMSU, TDM > TSU). In the first year (2012), the NUE was higher with TSU and TUF than with TDM. Out of the other six years that we saw differences in NUE, in four years the NUE was higher with one or both of the manure treatments than at least one of the inorganic N treatments. In three of the seven years that we had the TDMSU treatment, TDMSU had higher NUE for the harvested grain. This supports the conclusion that after a year of manure applications, the cycling of the N from previous application starts contributing to higher N uptake and higher NUE compared to other treatments. It also supports the conclusion that combined applications of manure and EEF contribute to increased NUE compared to other treatments (P<0.05, Table S10).
3.5. Harvested Grain Yields and Harvested Grain Yield N Content from 2012 to 2023: TDM and TSU vs. NT and ST
We compared the grain yields and grain yield N content of TDM and TSU to those of NT202 and ST202 by year. From 2012 to 2023, the grain yields of TDM were higher than the yields of NT202 in 2014, 2021, 2022, and 2023 (P<0.05, Table S11). The NT202 treatment resulted in higher yields than those of TDM only in 2016, when there was no manure applied to the TDM (P<0.05, Table S11). Thus, in four of the 11 years that manure was applied, the average yields of TDM were higher than those of NT202 (P<0.05, Table S11). In the 11 years that manure was applied, the average yield of TDM (11,000 kg ha-1) was higher than the average yield with NT202 (9,820 kg ha-1; Table S11). The comparison between TDM and ST202 was done only from 2012 to 2019 when the ST study was stopped. The yields of TDM were higher than yields of ST202 only in 2014 (P<0.05, Table S12). The ST202 treatment had higher yields than TDM only in 2016, when there was no manure applied to the TDM (P<0.05, Table S12). The yield of TDM was higher than that of ST202 in only one of the 7 years (P<0.05, Table S12). In the 7 years that manure was applied, the average yield of TDM (10,800 kg ha-1) was higher than the average yield of ST202 (10,100 kg ha-1; Table 5, Table S12).
During the 2012 to 2020 period, the grain yield of TUF was higher than that of NT202 in 2017 and 2019, suggesting a small advantage of TUF over the NT202 plots (P<0.05, Table S13). In the 9 years that urea was applied and tillage was implemented, the average yield of TUF (10,700 kg ha-1) was higher than that of NT202 (Table S13; 9,830 kg ha-1). These studies suggest that compared to NT202, tilling and TUF contribute to higher yields (P<0.05, Table S13). The yields were not higher with the NT202 than TUF in any of the 9 years of this period (P<0.05, Table S13).
For the 2012 to 2019 period, the grain yield of TUF was higher than that of ST202 in 2017 and 2019 (P<0.05, Table S17). In two of 8 years, TUF had higher average yields than ST202, suggesting a small advantage of the TUF over the ST202 plots. In the 8 years that urea was applied and tillage was implemented, the average yield of TUF (10,800 kg ha-1) was higher than that of ST202 (Table S17; 10,200 kg ha-1). These studies suggest that compared to ST202, tilling and UF contributes to higher yields. The grain yield was not higher with the NT202 than the TUF in any of the 8 years of this period (P<0.05, Table S17).
During the 2012 to 2016 period, the grain yields of TDMAP were higher than with NT202 in 2013 and 2014 (P<0.05, Table S14), suggesting a small advantage of TDMAP over the NT202 plots. These studies suggest that compared to NT202, the combination of tillage and manure with AgrotainPlus contributes to higher yields. The NT202 treatment had higher yields than TDMAP only in 2016, the year that the manure was not applied to the TDMAP plots (P<0.05, Table S14). In the four years that manure was applied with AgrotainPlus, the average yield of TDMAP (11,300 kg ha-1) was higher than that of NT202 (10,200 kg ha-1; Table S14).
For the 2012 to 2016 period, the grain yields of TDMAP were higher than those of ST202 in 2014 (P<0.05, Table S18), suggesting a small advantage of TDMAP over the ST202 plots. These studies suggest that compared to ST202, tilling and manure application with AgrotainPlus contributes to higher yields. The ST202 had higher yields than the TDMAP only in 2016, the year that the manure was not applied to the TDMAP plots. In the four years that manure was applied with AgrotainPlus, the average yield of TDMAP (11,300 kg ha-1) was higher than that of ST202 (10,400 kg ha-1; Table S18).
For the 2012 to 2023 period, the grain yield of TSU was higher than that of NT202 in 2013, 2017, 2020, and 2023 (P<0.05, Table S15). In four of 12 years, TSU had higher average yields than NT, suggesting a small advantage with TSU over the NT202 plots. In the 12 years that SU was applied and tillage was implemented, the average yield of TSU (10,800 kg ha-1) was higher than that of NT202 (9820 kg ha-1; Table S15).
For the 2012 to 2019 period, the grain yields of TSU were higher than those of ST202 in 2017, 2018, and 2019 (P<0.05, Table S16); however, in 2016 the yields of ST202 were higher than those of TSU (P<0.05, Table S16). In three of the eight years, TSU had higher average yields than ST202. In the 8 years that SU was applied and tillage was implemented, the average yield of TSU (11,000 kg ha-1) was higher than those of ST202 (10,200 kg ha-1; Table S16). These studies suggest that compared to no till and strip tillage, tilling and adding manure and/or SU contributes to higher yields.
For the 2017 to 2023 period, the grain yields of TDMSU were higher than those of NT202 in four of the seven years (2017, 2020, 2021, and 2023; P<0.05, Table S23), suggesting an advantage of TDMSU over the NT202 plots. These studies suggest that compared to NT202, tilling and manure application with SU contributes to higher yields. The NT202 did not have higher yields than the TDMSU in any of the seven years. For the 2017 to 2019 period, the yields of TDMSU were higher than those of ST202 in two of the three years (2017 and 2019; P<0.05, Table S24), suggesting an advantage of TDMSU over the ST202 plots. These studies suggest that compared to ST202, tilling and manure application with SU contributes to higher yields. The ST202 did not have higher yields than TDMSU in any of the seven years.
These results are agreement with studies at this site that found that cultivation contributed to higher yields than no till from 2001 to 2007 [23]. These plots, which had been under no tillage since 2000 and were found to have lower yields than cultivated plots support the conclusions of other studies that have found that grain yields of NT start to decrease compared to cultivated systems [21,22,35,36,37,38,39]. This result shows that after almost two decades of NT, the average yield is lower compared to cultivated systems (P<0.05, Tables S11, S13, S14, and S15). Additionally, on average cultivated systems had higher yields than strip till systems (P<0.05, Tables S12, S16, S17, and S18). Our assessment comparing NT and ST found that there were no differences between long-term no till and long-term strip till from 2012 to 2019, which aligns with findings from Delgado et al. [7] (P<0.05; Table 19).
3.6. Harvested Grain N Content from 2012 to 2023: TDM and TSU vs. NT and ST
The TDM achieved greater grain yield N content than the NT202 treatment in 2014 and 2021 and was also higher than ST202 in 2014 and 2017 (P<0.05, Tables S11 and S12). The ST202 treatment had greater grain N than TDM in the year that there was not a manure application (P<0.05, Table S12). The data suggest that average grain N for manure is higher with TDM than the NT202 and ST202 treatments (P<0.05, Tables S11 and S12).
For the 2012 to 2020 period, the grain yield N content of TUF was higher than the grain N of NT202 in 2013, 2015, and 2017 (P<0.05, Table S13), suggesting an advantage of the TUF over the NT202 plots. The grain N was not higher with NT202 than TUF in any of the 9 years (P<0.05, Table S13). For the 2012 to 2019 period, the grain N of TUF was higher than the grain N of ST202 in 2017, 2018, and 2019 (P<0.05, Table S17), suggesting an advantage of the TUF over the ST202 plots. These studies suggest that compared to ST202, tillage and UF application contributes to higher grain N. The grain N was not higher with NT202 than TUF in any of the 8 years.
For the 2012 to 2016 period, the grain yield N content of TDMAP was higher than that of NT202 in 2013 and 2014 (P<0.05, Table S4), suggesting an advantage of TDMAP over NT202, and that tillage and manure contributes to higher grain N. The grain N was not higher with NT202 than TDMAP in any of the 4 years, including 2016 when manure was not applied. For the 2012 to 2016 period, the grain N of TDMAP was higher than that of ST202 in 2014 (P<0.05, Table S18), suggesting an advantage of TDMAP over the ST202. The ST202 treatment had higher grain N than TDMAP only in 2016, the year that the manure was not applied to the TDMAP plots (P<0.05, Table S18).
For the 2017 to 2022 period, the grain N of TDMSU was higher than that of NT202 in four of the six years (2017, 2019 to 2021; P<0.05, Table S23), suggesting an advantage of TDMSU over the NT202 plots. These studies suggest that compared to NT202, tilling and manure application with SU contributes to higher grain N. The NT202 did not have higher grain N than TDMASU in any of the six years. For the 2017 to 2019 period, the grain N of TDMSU was higher than that of ST202 in all years (P<0.05, Table S24), suggesting an advantage of TDMSU over the ST202 plots. These studies suggest that compared to ST202, tilling and manure application with SU contributes to higher grain N. The ST202 did not have higher grain N than TDMASU in any of the seven years.
3.7. Comparison of Controls: Zero N Fertilizer with Tillage (TC0N), No Till (NT0N), and Strip Till (ST0N) from 2012 to 2023
The grain yield was higher in eight out of 12 years with TC0N than with NTC0N (P<0.05, Table S20), and higher with TC0N than STC0N in five of the eight years (P<0.05, Table S21). The grain N content was higher with TC0N than NTC0N in four out of 12 years (P<0.05, Table S20) and higher with TC0N than STC0N in five of the eight years (P<0.05, Table S21). There were no differences in grain yield and grain N between NTC0N and STC0N (P<0.05, Table 6, Table S22). These results are in agreement with previous studies conducted at this site showing greater N cycling from background N sources such as soil organic Nem in tillage management than with no till and strip till management [7].
3.8. Summary of Agronomic Production System Results from 2012 to 2023
Analysis of the effects of organic and inorganic N inputs on aboveground biomass production at silage (R5), physiological maturity (R6), and harvest of grain shows that during the first 8 years of the 2012 to 2023 period (excluding 2016, when no manure was applied), the grain yield of TDM was higher than that of TUF in only one year (2014). However, from 2020 to 2023, there were significantly higher yields with the manure treatments than the inorganic N fertilizer treatments. Significant agronomic yield increases were found in 2020 for aboveground biomass at R6 (DMSU > SU); in 2021 for biomass at R6 (DMSU > SU); in 2022 for biomass at R6 (DMSU >SU) and silage yields (DMSU and DM > SU); and in 2023 for grain yield (DMSU and DM > SU). These results suggest that there is a synergistic effect when DM is applied with SU, contributing to higher aboveground biomass production and harvested yields than DM or SU alone.
Table 6.
Differences in harvested grain yields of corn grown in an irrigated system among different tillage management systems receiving zero N fertilizer input (control) from 2012 to 2023¥ β.
Table 6.
Differences in harvested grain yields of corn grown in an irrigated system among different tillage management systems receiving zero N fertilizer input (control) from 2012 to 2023¥ β.
| Year$ | TC0N | NTC0N | SNTC0N |
| ----------------------------------------------- kg dry weight ha-1 -------------------------------------------------- | |||
| 2012 | 6589 a | 4789 b | 4160 b |
| 2013 | 9256 a | 5694 b | 5851 b |
| 2014 | 7879 a | 4952 b . | 5057 b. |
| 2015 | 6256 a | 5989 a | 5668 a |
| 2016 | 6129a | 4906 b | 5815 ab |
| 2017 | 6739 a | 5359 b | 5965 b |
| 2018 | 7099 a | 5158 a | 5727 ba |
| 2019 | 5842 a | 3959 b | 5126 ab |
| 2020 | 6565 a | 4175 a | NA |
| 2021 | 8408 a | 6346 b | NA |
| 2022 | 5220 a | 4054 a | NA |
| 2023 | 6473 a | 4640 b | NA |
¥The treatments were: i) tillage with zero nitrogen (TC0N) fertilizer input (control); ii) no-till zero nitrogen (NTC0N) fertilizer input (control); and iii) strip till with zero nitrogen (STC0N) fertilizer input (control) βWithin a year, treatments with different letters are significantly different; lowercase letters indicate differences at α = 0.05.
Tilled systems receiving manure applications at this site with minimal erosion and irrigated with an aboveground sprinkler had higher agronomic productivity for continuous corn than tilled systems that received inorganic N fertilizer applications. When long-term comparisons of the manure systems with tillage were compared to long-term NT and ST systems that were receiving inorganic N fertilizer, tilled systems with manure applications had the advantage in agronomic productivity. Similarly, when the long-term inorganic systems that received inorganic N fertilizer as an input were compared to the long-term NT and ST systems, tilled systems receiving inorganic N fertilizer had an advantage over NT and ST systems receiving inorganic N fertilizer.
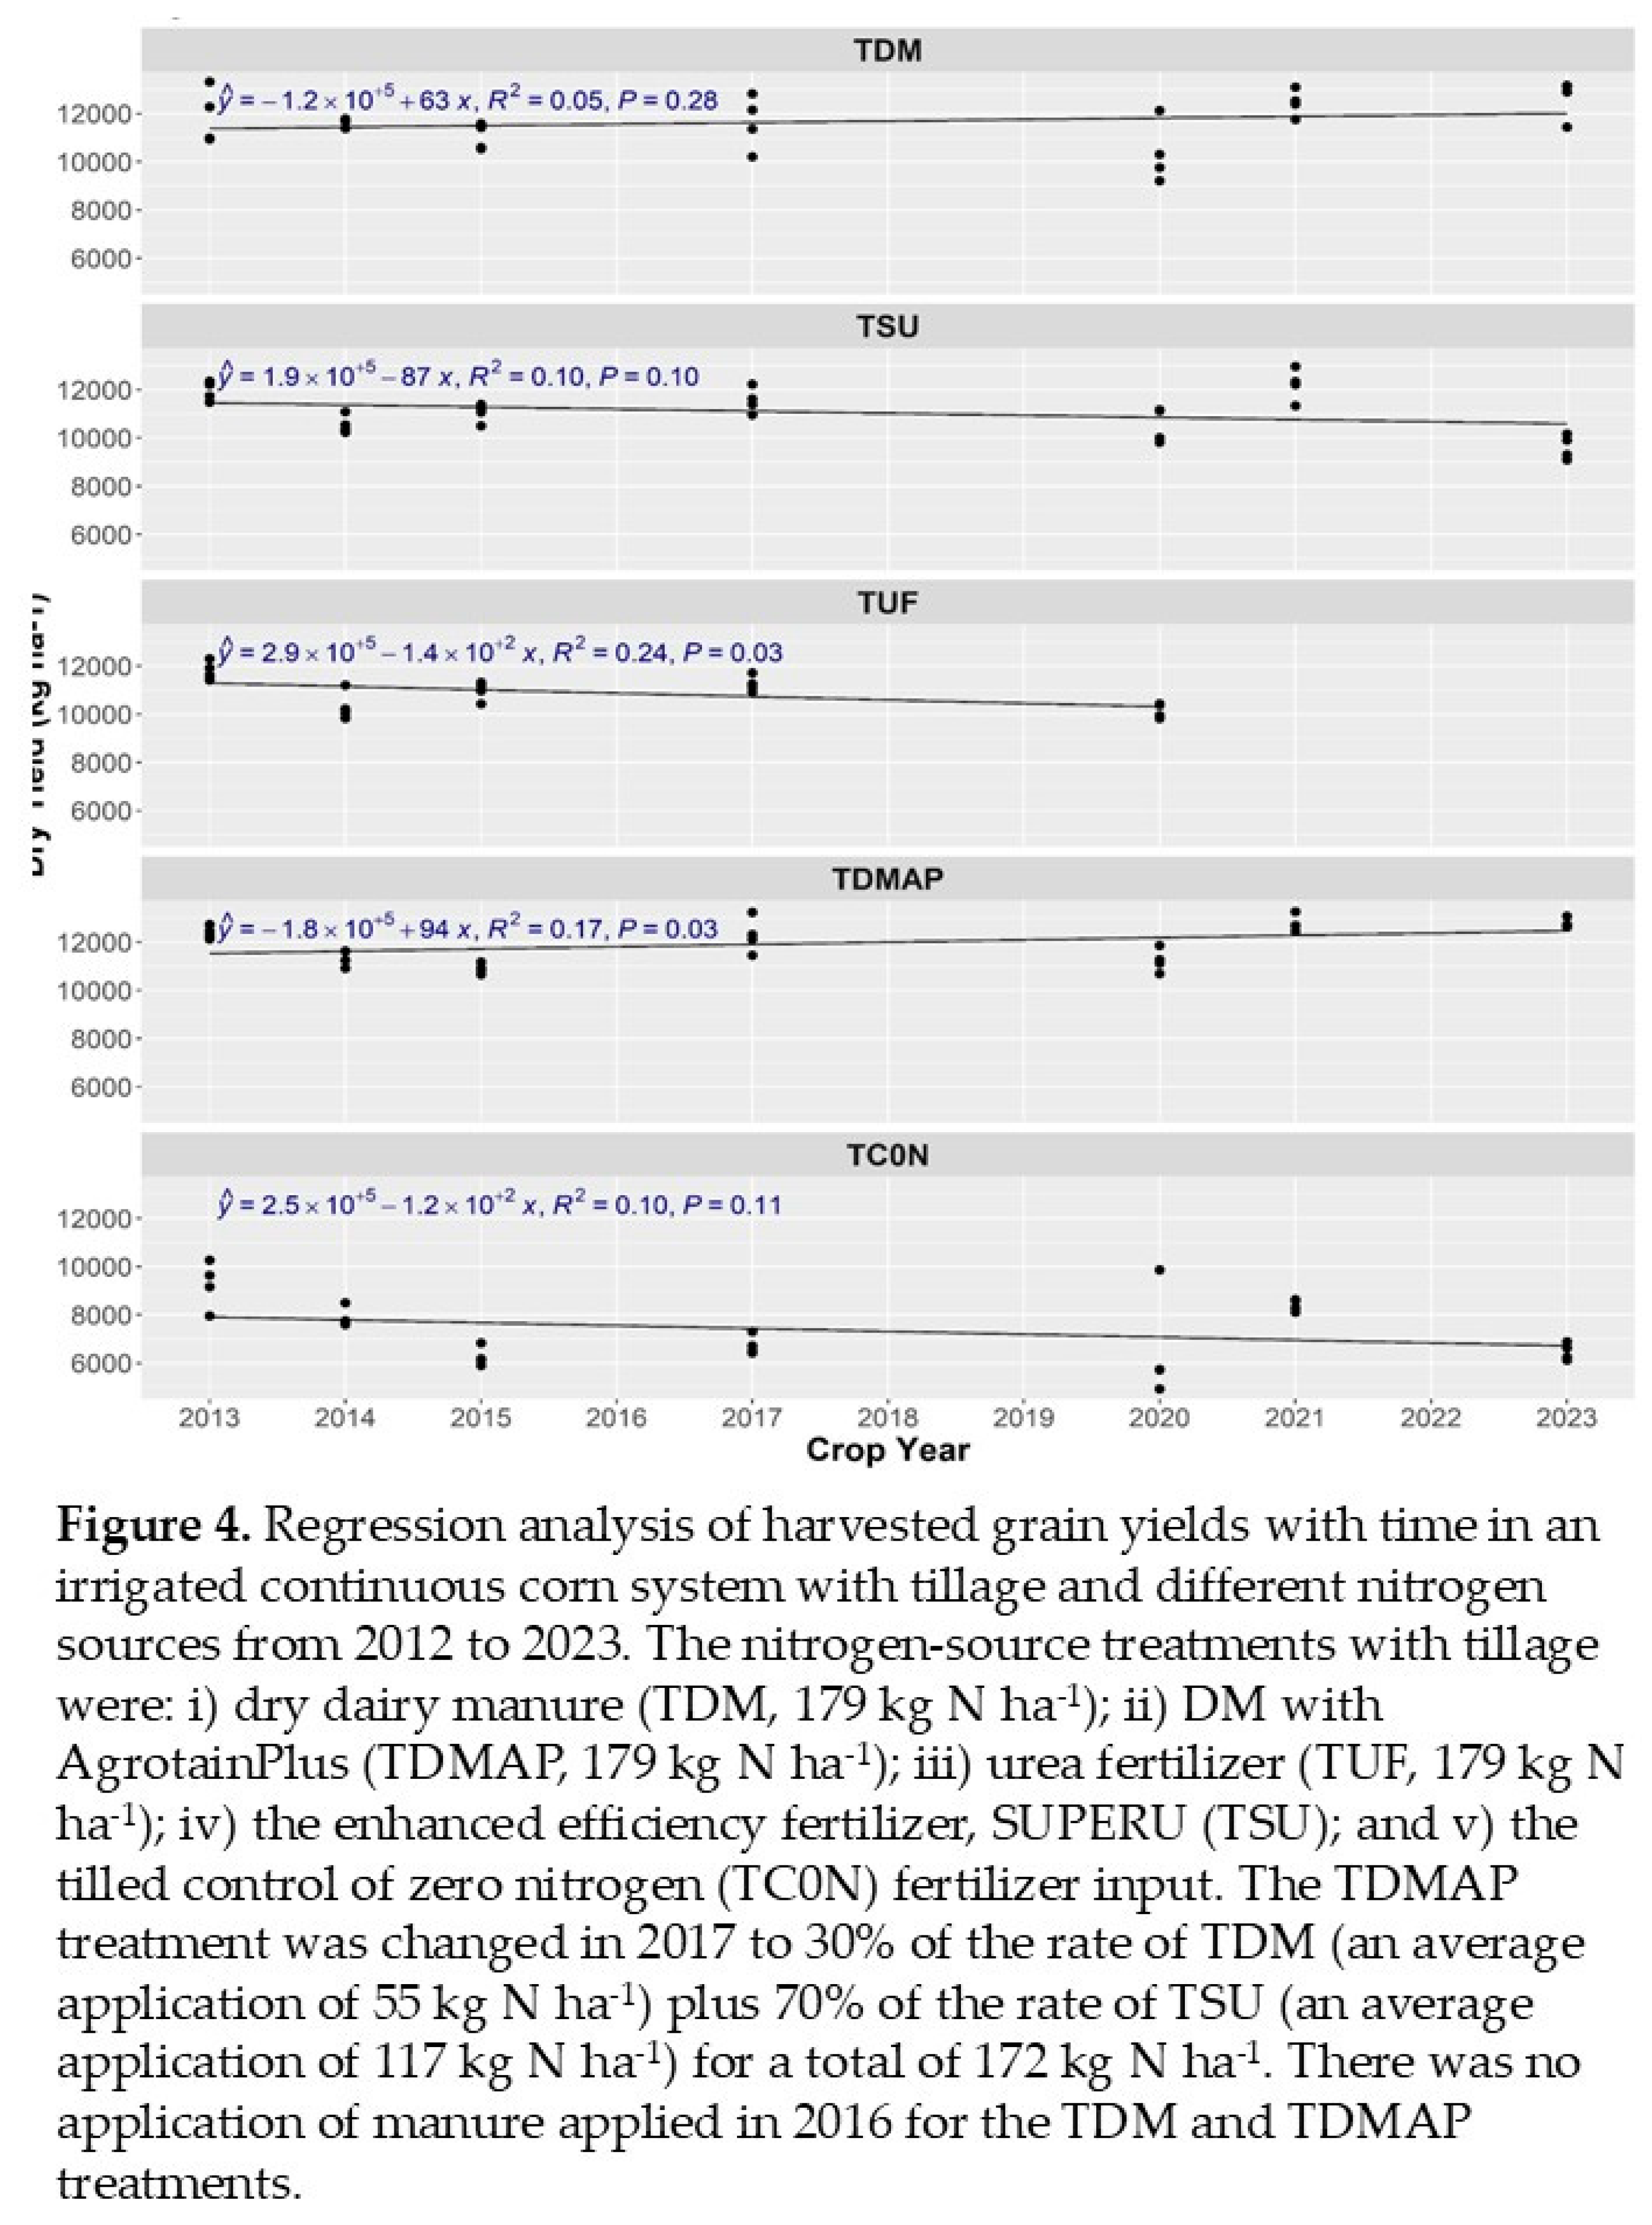
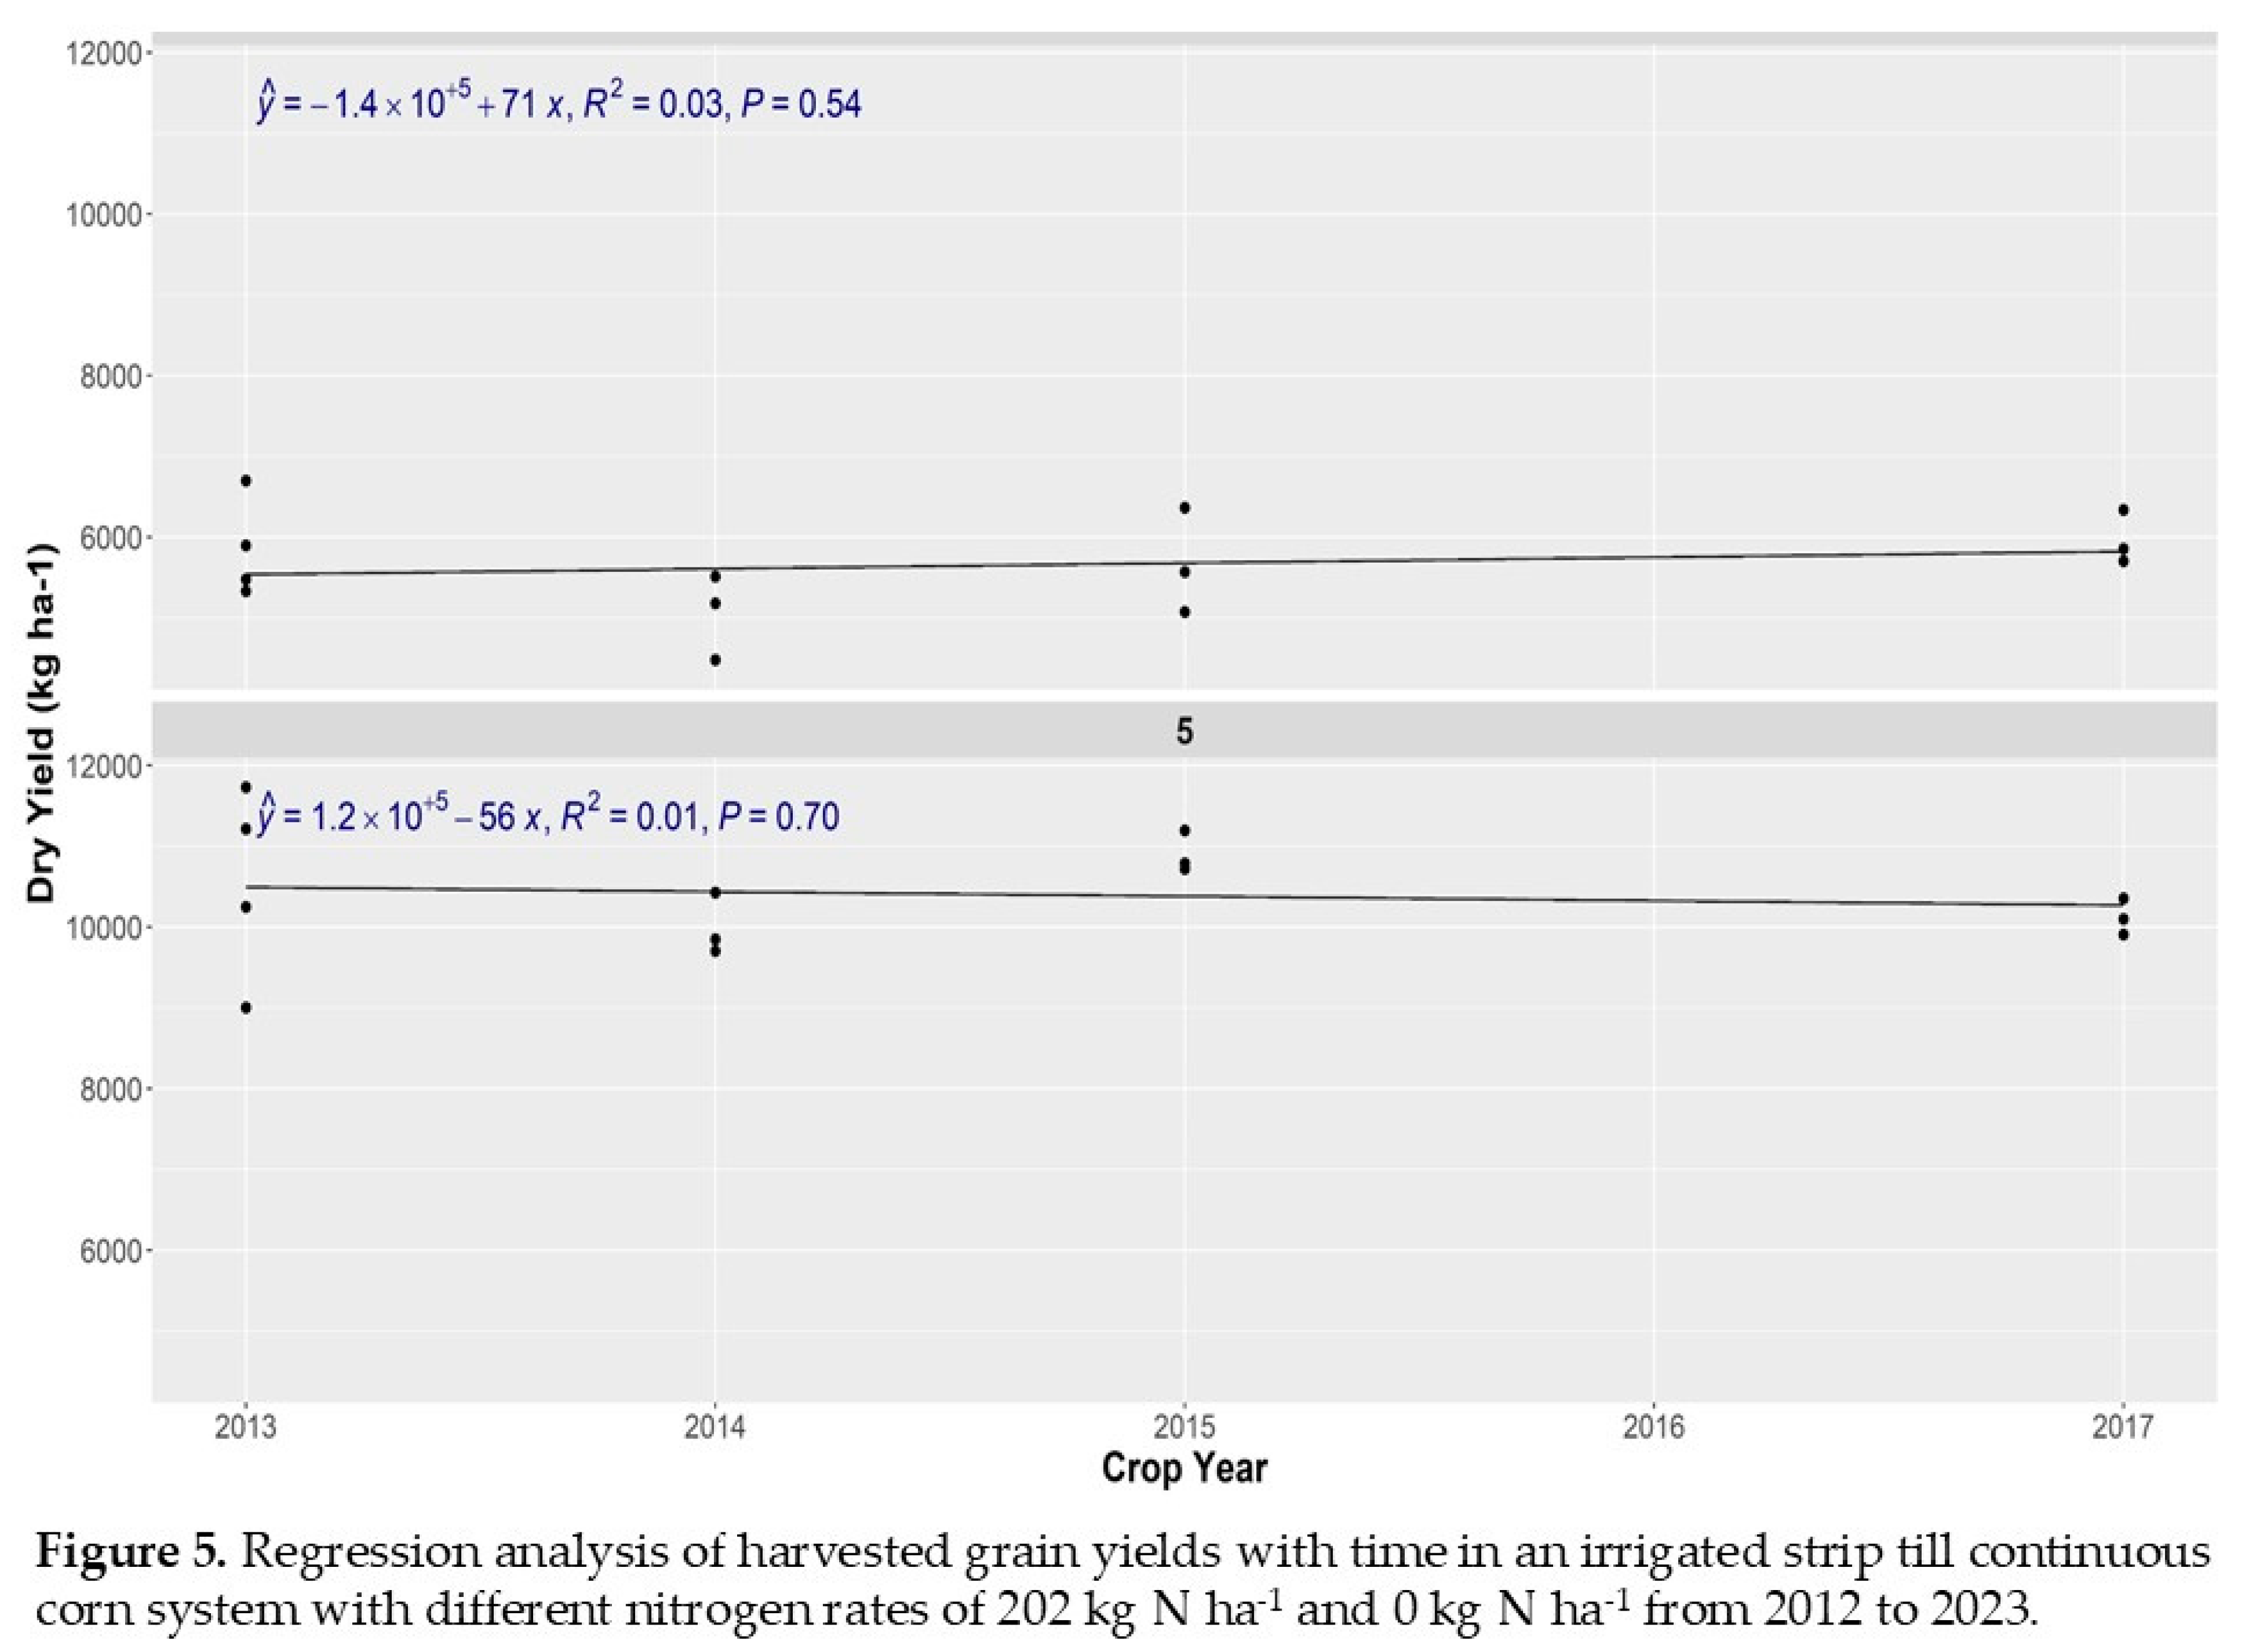
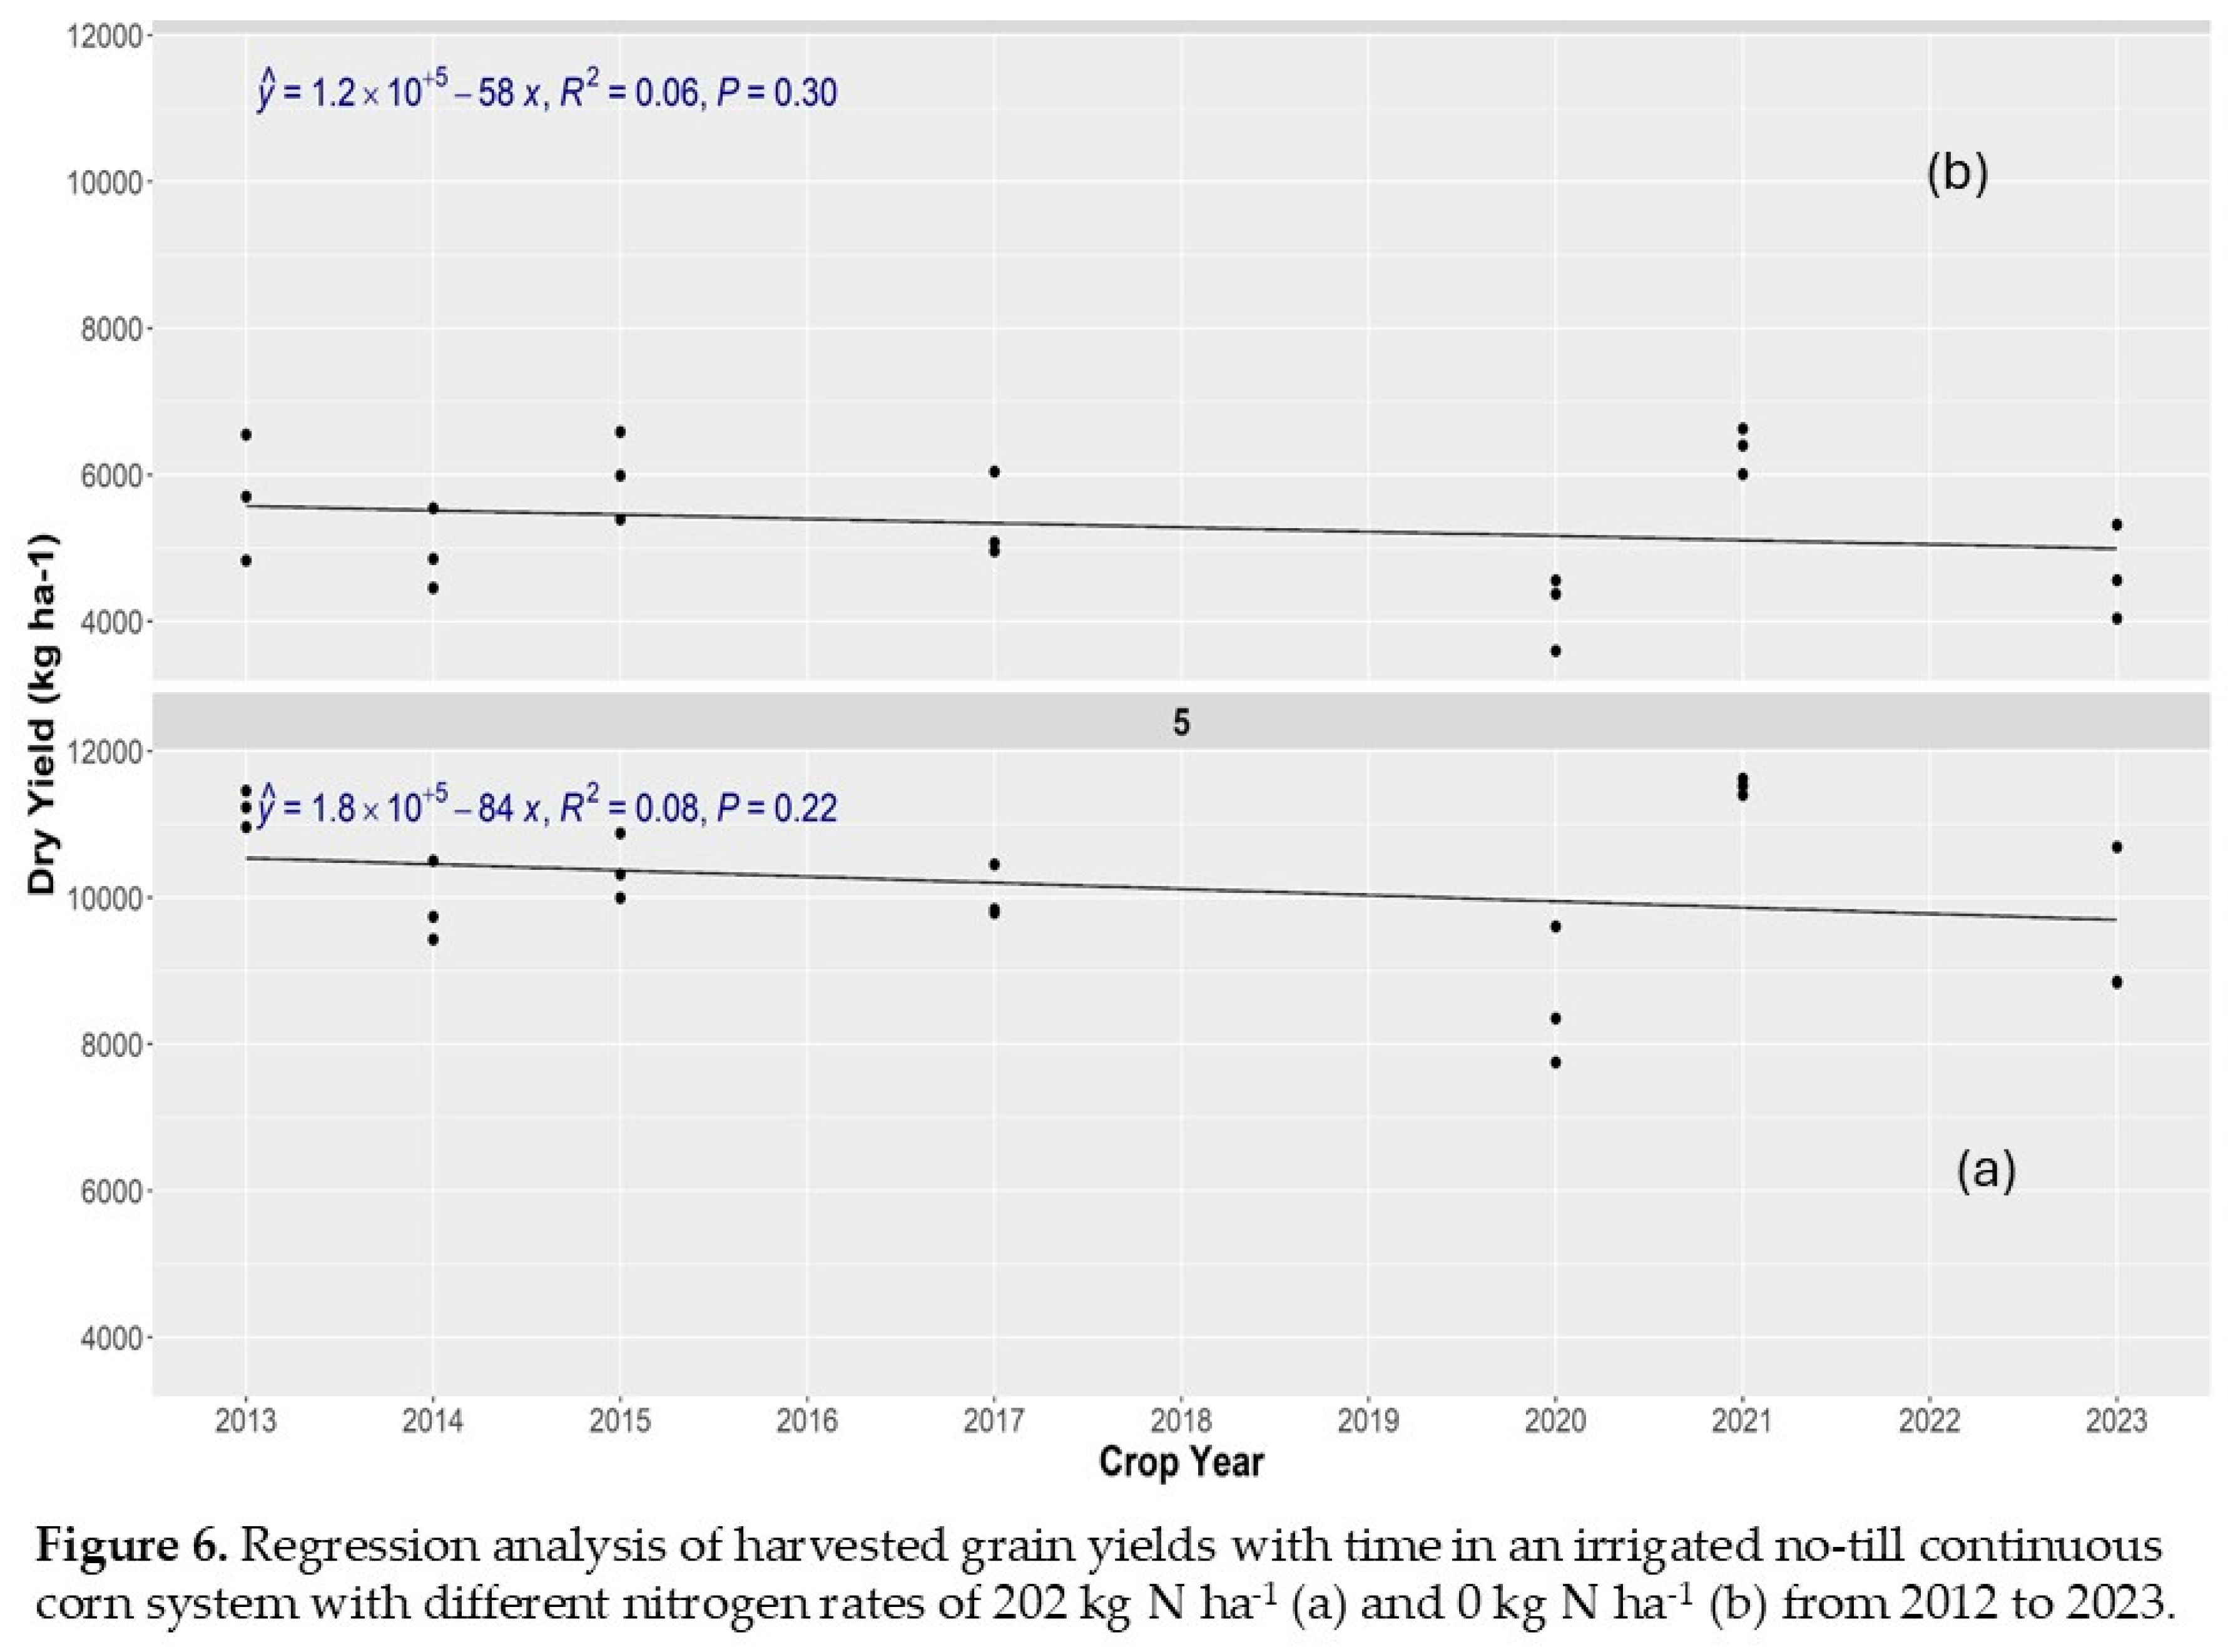
We conducted a long-term analysis of the harvested yields with time. Regarding agronomic sustainability, our findings were that the yields of the manure treatments were stable with time and/or were increasing when compared to the yields of the inorganic-N-fertilized treatments, which were decreasing with time (Figs 4). We similarly found that the conservation agriculture practices of NT and ST with 202 kg N ha-1 of inorganic fertilizer had stable harvested grain yields that were not decreasing with time. In a previous work we had found that climate change is occurring in Fort Collins and that irrigation is a practice to adapt to climate change [7]; however, the yields were not changing with time. In the present work, which monitored long-term yields of manure and inorganic N systems under tillage and NT and ST, we found that agronomic sustainability was highest for tilled systems receiving manure, followed by NT and ST systems receiving inorganic N, and lowest for tilled systems receiving inorganic N (Figs 5, 6). Regarding yield productivity, we found that tilled systems receiving manure outperformed tilled inorganic N systems, which outperformed NT and ST. We found that although tilled systems receiving inorganic N currently have higher yields, if the agronomic productivity continues to decrease with time, NT and ST systems receiving inorganic N may become more comparable to tilled systems receiving inorganic N in the long term.
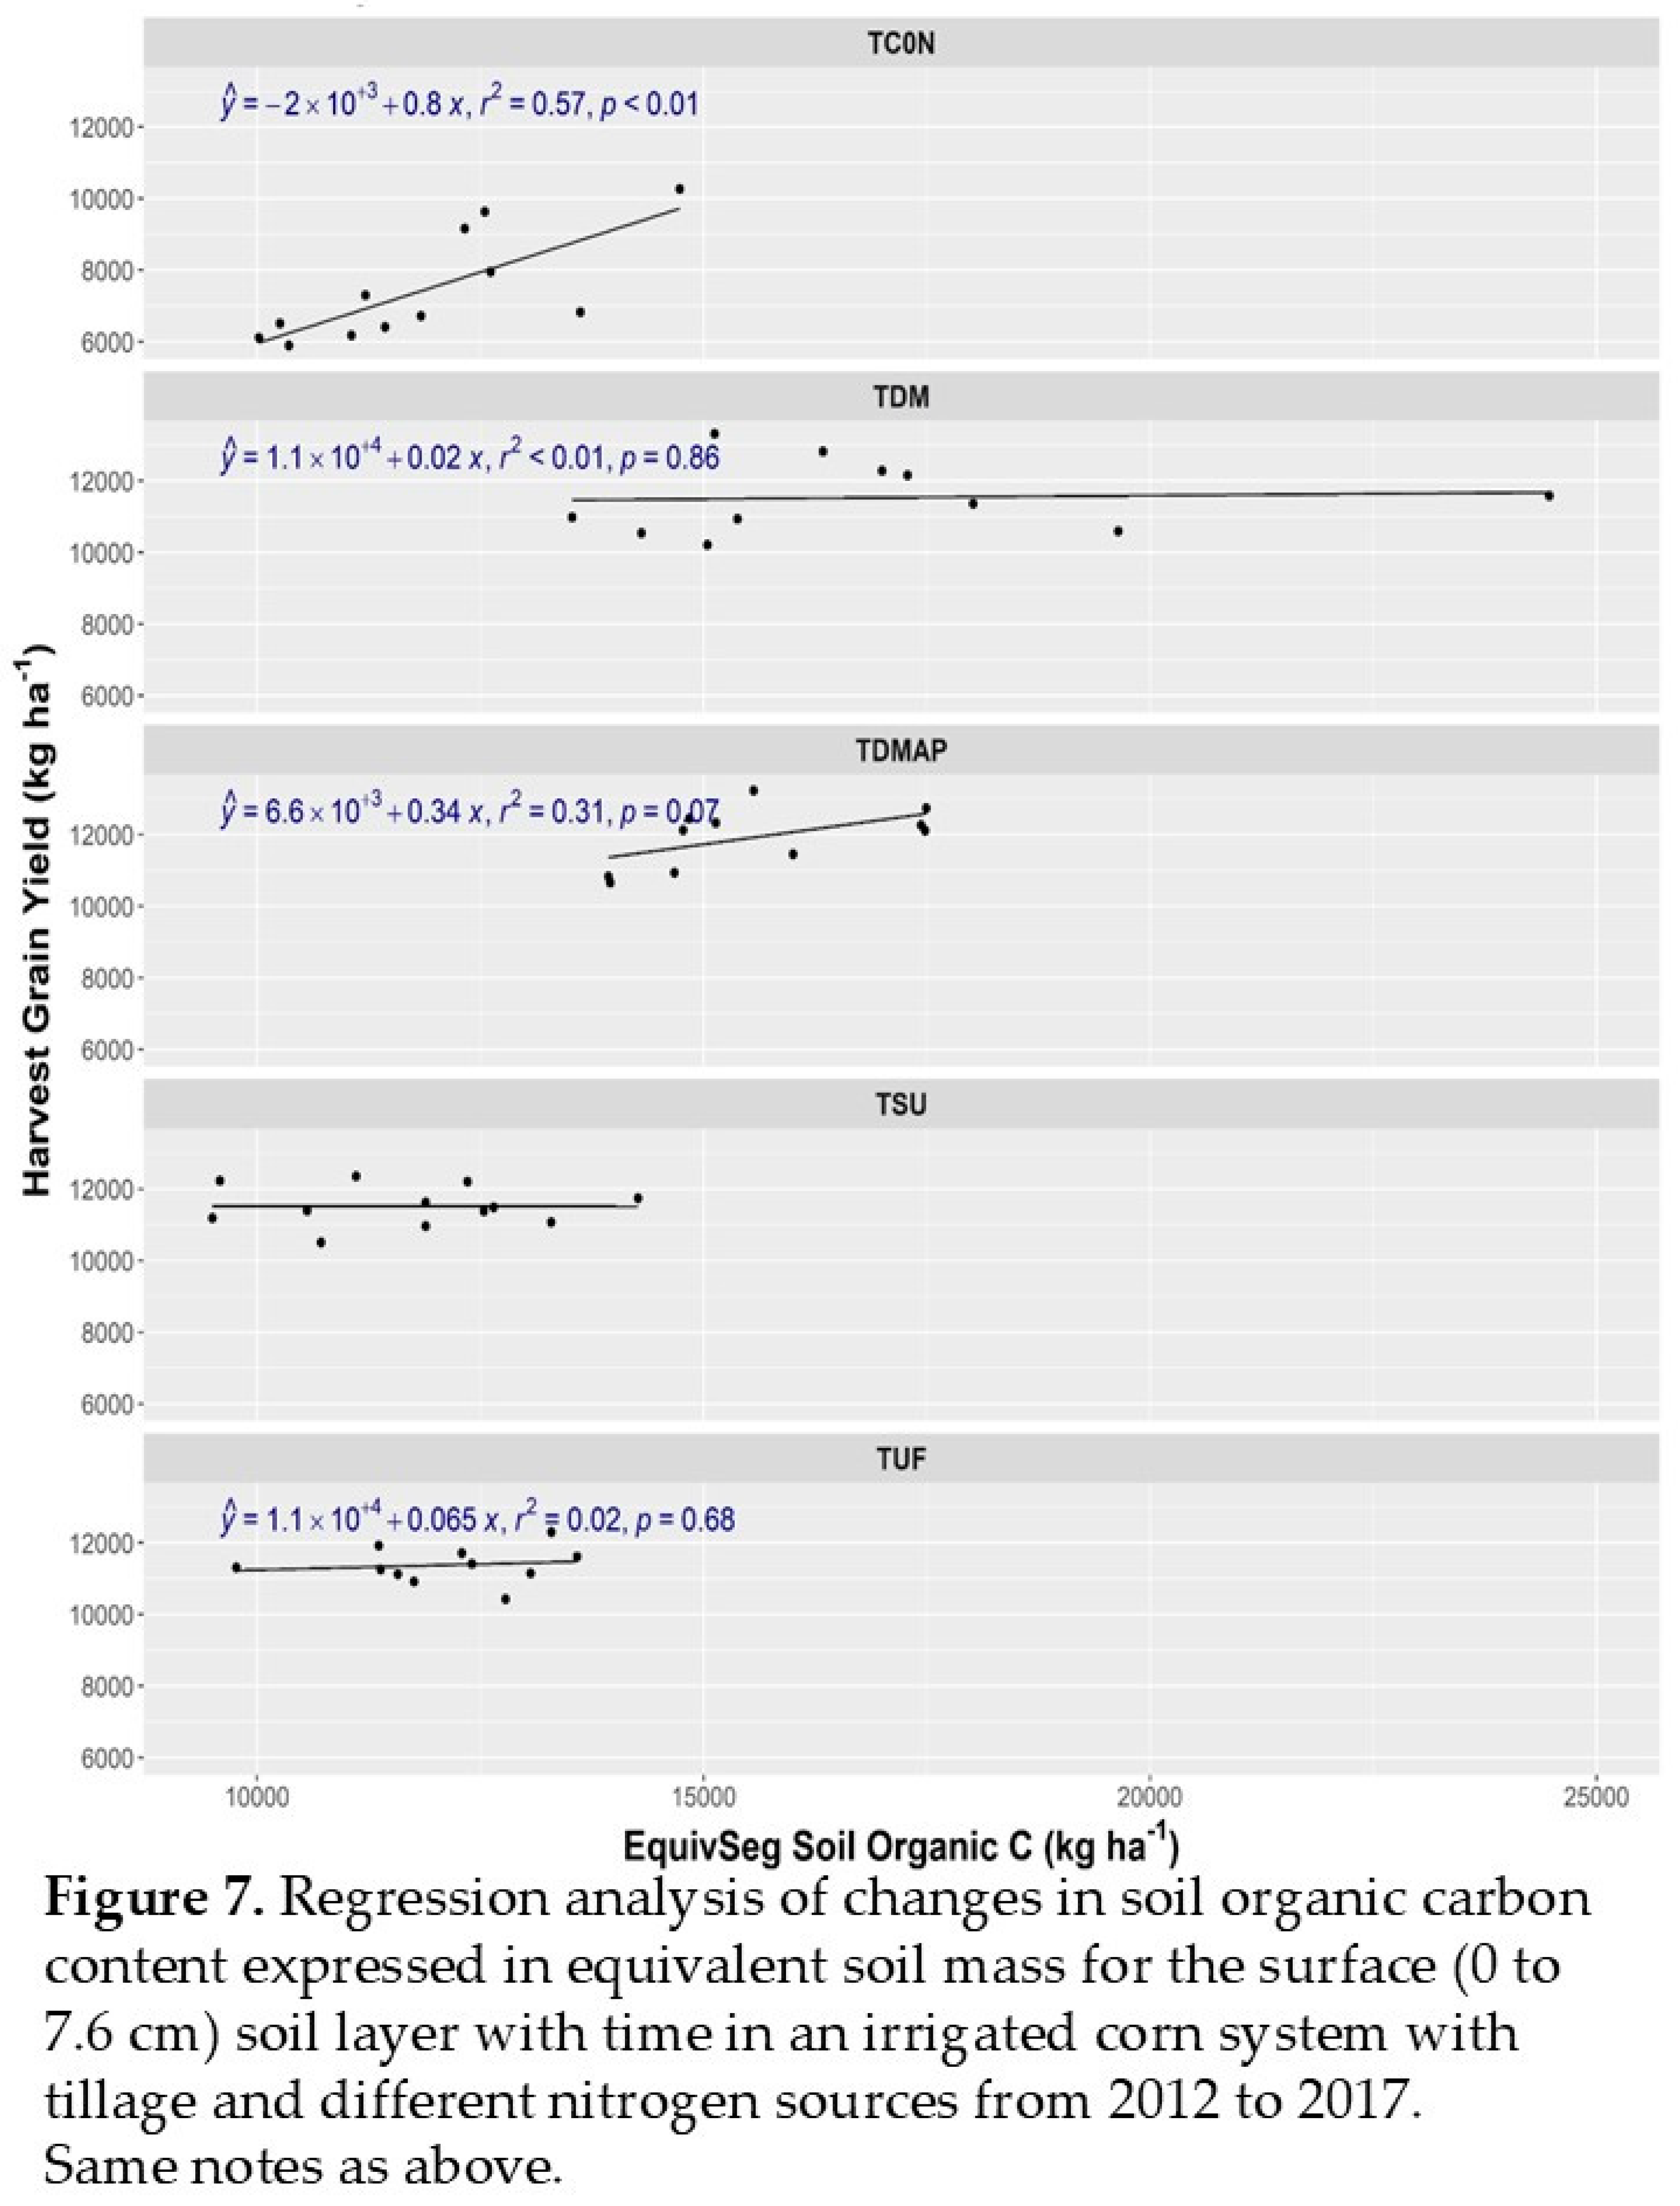
We suggest that one of the reasons for these findings related to agronomic productivity and sustainability with time could be the positive relationships between yields and soil organic C content in the surface soil (Figure 7). As far as agronomic sustainability, the tilled systems receiving manure applications had increased soil organic C and N content. While the tilled systems with manure applications were sequestering C and N in the soil organic matter pool, the tilled systems with inorganic N fertilizer were losing organic C and organic N (Figs. 2, 3). The N cycled from manure applications from current and previous years is significant and contributed to higher N uptake by aboveground biomass (R5.5 and R6) and harvested grain. These desirable increases in N cycling are contributing to higher NUE for the manure systems than the inorganic N fertilizer systems with a tillage system. The mobility of N in the NO3-N pool was higher with the inorganic N fertilizer systems than with the manure systems, and more changes were detected at lower depths with the inorganic N fertilizer systems. These desirable changes in soil health properties such as C sequestration, greater cycling of N, higher system N use efficiencies, and lower N losses are contributing to increased yields and greater yield stability (with no decrease in yields with time) compared to tilled systems receiving inorganic N fertilizer, which are seeing decreasing yields with time (Figure 4). Independently of these effects, the inorganic systems under tillage have higher agronomic productivity as far as grain yield than NT and ST systems (Table 5, Table 6). Although application of manure was identified as a good agronomic management practice to increase yields and sustain productivity with time, the best combination appears to be the enhanced efficiency fertilizer (70% of N input) with manure organic N (30% of N input), a combination which appears to have a synergistic effect that increases agronomic productivity (Table 5).
4. Conclusions
This unique study is the second study that we found in the world literature that conducted an N balance when manure is applied that accounted for changes in soil organic N pools. However, the present work is the only study that conducted an N balance where yields of manure systems under cultivation were compared to yields of no-till and strip till systems. When we put together the responses and relationships of the measured parameters in these studies, our data showed that the agronomic sustainability was highest in tilled systems receiving manure, followed by no-till and strip till systems receiving inorganic N fertilizer (P<0.10). Tilled systems receiving inorganic N fertilizer had the lowest agronomic sustainability among the systems we examined (P<0.10). This supports the conclusion that organic N inputs in a tilled system could potentially contribute to climate change adaptation. However, after two decades of tillage studies at this site, we found that the current agronomic productivity is highest in tilled systems receiving manure, followed by tilled systems receiving inorganic N fertilizer (P<0.10). No-till and-strip till systems receiving inorganic N fertilizer had the lowest agronomic productivity among the systems we examined (P<0.10). We found a correlation between changes in soil organic carbon at the surface layer and changes in productivity with the manure system (P<0.10). This study proved our hypothesis that tilled systems receiving organic N fertilizer (manure) will contribute to higher C and N sequestration compared to tilled systems receiving inorganic N fertilizer. It also proved our hypothesis that the N losses from a tilled system receiving organic N fertilizer at a site that has minimal erosion will be lower than those of a tilled system receiving inorganic N fertilizer, which has more mobile N, showing the importance of conducting long-term studies.
These long-term studies show that applying manure (N) to a system that is under minimal soil erosion contributes to significant C sequestration and stable grain yield with time compared to tilled systems receiving inorganic N fertilizer. The tilled systems receiving manure applications also had higher grain yield than NT and ST systems fertilized with inorganic N fertilizer; all these systems had the same management practices (irrigation, weed control, and pest management) and similar N rates. The increases in organic C and N in soil organic pools increase the N cycling and uptake by the corn crop, which increases the NUE of these tilled systems receiving organic N fertilizer compared to tilled systems receiving inorganic N fertilizer applications. The N losses from the manure system were lower those from inorganic N fertilizer systems, which are receiving N in a form that is more mobile and dynamic. Among other effects, mobile N fertilizer input contributes to greater N losses by moving NO3-N to lower depths to levels above the background concentration of the non-fertilized plots, showing that NO3-N leaching is a potential mechanism for N losses from this tilled system receiving inorganic N fertilizer.
A good agronomic management practice is the application of manure (30% of N input) in combination with inorganic N fertilizer (70% of N input) using an EEF as a source of N. This appears to cause a synergistic effect that is contributing to higher grain yield and increased agronomic productivity and C and N sequestration at this site. Although manure applications appear to be a good management practice that increases agronomic productivity, the combination of manure (30% of the N rate) and EEF (70% of the N rate) appears to offer even more agronomic benefits. We found that at this long-term research site that although neither tillage nor NT contributed to C and N sequestration, when we add manure to this site that has minimal erosion, we can improve soil health by increasing C and N sequestration, N cycling, and agronomic productivity. Long-term research demonstrates the importance of monitoring agricultural systems and good management practices to determine changes in agronomic productivity over the long term.
Supplementary Materials
Supporting information (databases and metadata) can be downloaded at: Preprints.org.
Author Contributions
Conceptualization: J.A.D.; methodology: J.A.D.; software: J.A.D. and R.E.D; validation: J.A.D. and R.E.D.; formal analysis: J.A.D. and R.E.D.; investigation: J.A.D., R.E.D., A.D.H., C.E.S., S.J.D., D.K.M., B.A.F. and A.B.; data curation: J.A.D., R.E.D. and A.D.H.; writing—original draft: J.A.D.; writing—review and editing: J.A.D., R.E.D., A.D.H., C.E.S., S.J.D., D.K.M., B.A.F. and A.B.; visualization: J.A.D., and R.E.D.; supervision: J.A.D., A.D.H., C.E.S., S.J.D. and D.K.M.; project Administration: J.A.D., A.D.H., C.E.S., S.J.D., D.K.M., B.A.F., R.E.D and A.B. All authors have read and agreed to the published version of the manuscript.
Funding
This research received no external funding.
Data Availability Statement
The datasets associated with this paper will be made available in the AgData Commons repository at a later date (https://agdatacommons.nal.usda.gov/) and are also included as Supplementary Materials.
Conflicts of Interest
The authors declare no conflicts of interest.
References
- Delgado, J.A.; Groffman, P.M.; Nearing, M.A.; Goddard, T.; Reicosky, D.; Lal, R.; Kitchen, N.R.; Rice, C.W.; Towery, D.; Salon, P. Conservation practices to mitigate and adapt to climate change. J. Soil Water Conserv. 2011, 66, 118A–129A. [CrossRef]
- Ribaudo, M.; Delgado, J.; Hansen, L.; Livingston, M.; Mosheim, R.; Williamson, J. Nitrogen in Agricultural Systems: Implications for Conservation Policy. Economic Research Report # 127. USDA-ERS: Washington, D.C., USA, 2011; pp. 1–82.
- Zhang, J.; Cao, P.; Lu, C. Half-century history of crop nitrogen budget in the conterminous United States: Variations over time, space and crop types. Glob. Biogeochem. Cycl. 2021, 35: e2020GB006876. [CrossRef]
- Fu, X.; Wang, J.; Sainju, U.M.; Liu, W. Soil nitrogen fractions under long-term crop rotations in the Loess Plateau of China. Soil Till. Res. 2019, 186, 42–51. [CrossRef]
- Yang S-M; Malhi, S.S; Li, F-M; Suo, D-R; Xu, M-G; Wang, P; Xiao, G-J; Jia, Y; Guo, T-W; Wang, J.G. Long-term effects of manure and fertilization on soil organic matter and quality parameters of a calcareous soil in NW China. J. Plant Nutr. Soil Sci. 2007, 170, 234–243. [CrossRef]
- Sainju, U.M.; Lenssen, A.W; Allen, B.L.; Stevens, W.B.; Jabro, J.D. Nitrogen balance in dryland agroecosystem in response to tillage, crop rotation, and cultural practice. Nutr. Cycl. Agroecosyst. 2018, 110, 467–483. [CrossRef]
- Delgado, J.A.; Halvorson, A.D.; D’Adamo, R.; Stewart, C.E.; Floyd, B.; Del Grosso, S. Long-term nitrogen balance of an irrigated no-till soil-corn system. J. Nutr. Cycl. 2023, 126, 229–243. [CrossRef]
- Ferguson, R.B.; Nienaber, J.A.; Eigenberg, R.A.; Woodbury, B.L. Long-term effects of sustained beef feedlot manure application on soil nutrients, corn silage yield, and nutrient uptake. J. Environ. Qual. 2005, 34, 1672–1681.
- Zhu, P.; Ren, J.; Wang, L.; Zhang, X.; Yang, X.; MacTavish, D. Long-term fertilization impacts on corn yields and soil organic matter on a clay-loam soil in Northeast China. J. Plant Nutr. Soil Sci. 2007, 170, 219–223. [CrossRef]
- Huang S.; Zhang, W.; Yu, X.; Huang, Q. Effects of long-term fertilization on corn productivity and its sustainability in an Ultisol of southern China. Agric., Ecosyst. Environ. 2010, 138, 44–50. [CrossRef]
- Nyiraneza, J.; Chantigny, M.H.; N’Dayegamiye, A.; Laverdière, M.R. Dairy cattle manure improves soil productivity in low. [CrossRef]
- Saurav Das, B.M.; Nielsen, R.; Hergert, G.W. Maize yields from manure and mineral fertilizers in the 100-year-old Knorr–Holden Plot. Agron. J. 2021, 113, 5383–5397.
- Schlegel, A.J.; Assefa, Y.; Bond, H.D.; Wetter, S.M.; Stone, L.R. Corn response to long-term applications of cattle manure, swine effluent, and inorganic nitrogen fertilizer. Agron. J. 2015, 107, 1701–1710.
- Netthisinghe, A.M.P.; Woosley, P.B.; Gilfillen, R.A.; Willian, T.W.; Sistani, K.R.; Rowland, N.S. Corn grain yield and soil properties after 10 years of broiler litter amendment. Agron. J. 2016, 108, 1816–1823. [CrossRef]
- Grover, K.K.; Karsten, H.D.; Rot, G.W. Corn grain yields and yield stability in four long-term cropping systems. Agron. J. 2009, 101, 940–946. [CrossRef]
- Mikha, M.M.; Hergert, G.W.; Benjamin, J.G.; Jabro, J.D.; Nielsen, R.A. Long-term manure impacts on soil aggregates and aggregate-associated carbon and nitrogen. Soil Sci. Soc. Am. J. 2015, 79, 626–636. [CrossRef]
- Xiang, Y.; Cheng, M.; Wen, Y.; Darboux, F. Soil organic carbon sequestration under long-term chemical and manure fertilization in a cinnamon soil, Northern China. Sustainability 2022, 14, 5109. [CrossRef]
- Sharpley, A.N.; Weld, J.L.; Beegle, D.B.; Kleinman, P.J.A.; Gburuk, W.J.; Moore, JR.; P.A.; Mullins, G. Development of phosphorus indices for nutrient management planning strategies in the United States. J. Soil Water Conserv. 2003, 53, 137-151.
- Sharpley, A.N.; Kleinman, P.J.A.; McDsowell, R.W.; Gitau, M.; Bryant, R.B. Modeling phosphorus transport in agricultural watersheds, processes and possibilities. J. Soil Water Conserv. 2002, 57:425-439.
- Sharpley, A.N.; Daniel, T.; Sims, T.; Lemunyon, J.; Stevens, R.; Parry, R. Agricultural phosphorus and eutrophication. ARS-149. USDA-ARS: Washington, D.C., USA, 1999; pp. 1-37.
- Pittelkow, C.M.; Linquist, B.A.; Lundy, M.E.; Liang, X.; van Groenigen, K.J.; Lee, J.; van Gestel, N.; Six, J.; Venterea, R.T.; van Kessel, C. When does no-till yield more? A global meta-analysis. Field Crops Res. 2015, 183, 156-168. [CrossRef]
- Ogle, S.M.; Swan, A.; Paustian, K. No-till management impacts on crop productivity, carbon input and soil carbon sequestration. Agric. Ecosyst. Environ., 2012, 149, 37-49. [CrossRef]
- Delgado, J.A.; D’Adamo, R.E.; Villacis, A.H.; Halvorson, A.D.; Stewart, C.E.; Floyd, B. A.; Del Grosso, S.J.; Manter, D.K.; Alwang, J. Long-term effects of nitrogen and tillage on yields and nitrogen use efficiency in irrigated corn. Agronomy 2024. [CrossRef]
- Davis, J.G.; Westfall, D.G.; 2014. Fertilizing corn. Fact sheet no. 0.538. Colo¬rado State University Extension: Fort Collins, CO, USA; pp.1-5.
- Eghball, B.; Power, J.F. Phosphorus- and nitrogen-based manure and compost applications: Corn production and soil phosphorus. Soil Sci. Soc. Am. J. 1999, 63, 895–901. [CrossRef]
- Waskom, R.M.; Davis, J.G. Best management practices for manure uti¬lization. Colorado State Univ. Extension Bull. 1999, 568A:1–30.
- De Rosa, D.; Biala, J.; Nguyen, T., et al. (2022). Environmental and economic trade-offs of using composted or stockpiled manure as partial substitute for synthetic fertilizer. J. Environ. Qual. 51, 589–601. [CrossRef]
- Ellert, B.H.; Janzen, H.H.; McConkey, B.G. Measuring and comparing soil carbon storage. In Assessment Methods for Soil Carbon; Lal, R.; Kimble, J.M.; Follett, R.F.; Stewart, B.A., Eds.; Lewis Publishers: Boca Raton, FL, USA, 2001; pp. 131–146.
- R Core Team. R: A Language and Environment for Statistical Computing; R Foundation for Statistical Computing: Vienna, Austria, 2021. Available online: https://www.R-project.org (accessed on 4 August 2024).
- Delgado, J.A.; D’Adamo, R.E.; Villacis, A.H.; Halvorson, A.D.; Stewart, C.E.; Alwang, J.; Del Grosso, S.J.; Manter, D.K.; Floyd, B.A. Climate change and its positive and negative impacts on irrigated corn yields in a region of Colorado (USA). Crops 2024, 4, 366–378. [CrossRef]
- Tiessen, H.; Stewart, J.W.B.; Bettany, J.R. Cultivation effects on the amounts and concentration of carbon, nitrogen, and phosphorus in grassland soils. Agron. J. 1982, 74, 831–835. [CrossRef]
- Odell, R.T.; Melsted, S.W.; Walker, W.M., Changes in organic carbon and nitrogen of Morrow Plot soils under different treatments, 1904–1973. Soil Sci. 1984, 137, 160–171. [CrossRef]
- Havlin, J.L.; Kissel, D.E.; Maddux, L.D.; Claasen, M.M.; Long, J.H. Crop rotation and tillage effects on soil organic carbon and nitrogen. Soil Sci. Soc. Am. J. 1990, 54, 448–452. [CrossRef]
- Hussain, I.; Olson, K.R.; Ebelhar, S.A. 1999. Long-term tillage effects on soil chemical properties and organic matter fraction. Soil Sci. Soc. Am. J. 63, 1335–1341. [CrossRef]
- Gagnon, B.; Ravelojaona, N.; St. Luce, M.; Ziadi, N. Agronomic and economic performance of 26-year corn–soybean rotation affected by tillage and fertilization in eastern Canada. Agron. J., 2022, 114, 1447-1460. [CrossRef]
- Van den Putte, A.; Govers, G.; Diels, J.; Langhans, C.; Clymans, W.; Vanuytrecht, E.; Merckx, R.; Raes, D. Soil functioning and conservation tillage in the Belgian loam belt. Soil Till. Res., 2012, 122, 1-11. [CrossRef]
- Toliver, D.K.; Larson, J.A.; Roberts, R.K.; English, B.C.; De La Torre Ugarte, D.G.; West, T.O. Effects of no-till on yields as influenced by crop and environmental factors. Agron. J., 2012, 104, 530-541. [CrossRef]
- Rusinamhodzi, L.; Corbeels, M.; van Wijk, M.; Rufinio, M.C.; Nyamangara, J.; Giller, K.E. A meta-analysis of long-term effects of conservation agriculture practices on maize yields under rain-fed conditions. Agron. Sustain. Dev., 2011, 31, 657-673.
- Chen, Y.; Liu, S.; Li, H.; Li, X.F.; Song, C.Y.; Cruse, R.M.; Zhang, X.Y. Effects of conservation tillage on corn and soybean yield in the humid continental climate region of Northeast China. Soil Till Res., 2011, 115, 56-61. [CrossRef]
- Olsen, S.R.; Cole, C.V.; Watanabe, F.S.; Dean, L.A. 1954. Estimation of Available Phosphorus in Soils by extraction With Sodium Bicarbonate. Circular 939. USDA:Washington, DC, USA>.
- Brown, D.M. Heat Units for Corn in Southern Ontario; Food Factsheet Agdex 111.30: 4; Ontario Ministry of Agriculture: Guelph, ON, Canada, 1969.
Table 4.
Differences in harvested grain yields of corn grown in an irrigated system in the nitrogen-sources-with-tillage study from 2012 to 2023¥ β.
Table 4.
Differences in harvested grain yields of corn grown in an irrigated system in the nitrogen-sources-with-tillage study from 2012 to 2023¥ β.
| Year$ | TDM | TUF | TSF | TC0N | |
| ----------------------------------------------- kg dry weight ha-1 ----------------------------------------------------- | |||||
| 2012 | 10,818 aA | 10,715 aA | 11,588 aA | 11,496 aA | 6589 bB |
| 2013 | 11,879 aA | 12397 abA | 11,812 aA | 11,948 aA | 9256 bB |
| 2014 | 11,649 aA | 11,358 abAB | 10,326 bC | 10,554 abBC. | 7879 cD. |
| 2015 | 11,038 aA | 10,902 aA | 10,966 aA. | 11,038 aA. | 6257 bB. |
| 2016 | 7633 bB | 7806 bB | 9769 aA | 9704 aA | 6130 cC |
| 2017 | 11,637aA | 12,282 aA¶ | 11255 aA | 11,550 aA | 6740 bB |
| 2018 | 10,496aA | 11,300 aA¶ | 10,177 aA | 11684 aA | 7099 bB |
| 2019 | 11,637aA | 10,149 aA¶ | 10,173 aA | 9644 aA | 5843bC |
| 2020 | 10,353aB | 11,241 aA¶ | 10,147 aA | 10,532 aAB | 6566 bB |
| 2021 | 12,441aA | 12,774 aA¶ | N/A$ | 9840 aA | 8,408 bB |
| 2022 | 9717 aA | 10,180 aA¶ | N/A$ | 12,215 aA | 5,221 bB |
| 2023 | 12,657 aA | 12,785 aA¶ | N/A$ | 9621 bB | 6574 cC |
¥The nitrogen-source treatments with tillage were: i) dry dairy manure (TDM, 179 kg N ha-1); ii) DM with AgrotainPlus (TDMAP, 179 kg N ha-1); iii) urea fertilizer (TUF, 179 kg N ha-1); iv) the enhanced efficiency fertilizer, SUPERU (TSU); and v) the tilled control of zero nitrogen (TC0N) fertilizer input. There was no application of manure applied in 2016 for the TDM and TDMAP treatments. βWithin a year, treatments with different letters are significantly different; capital letters indicate differences are significant at α = 0.10, and lowercase letters indicate differences at α = 0.05. $The 179 kg N ha-1 TUF treatment was changed in 2021 to 179 kg N ha-1 of TSU. ¶The TDMAP treatment was changed in 2017 to 30% of the rate of TDM (an average application of 55 kg N ha-1) plus 70% of the rate of TSU (an average application of 117 kg N ha-1) for a total of 172 kg N ha-1.
Table 5.
Differences in harvested grain yields of corn grown in an irrigated system with different N sources and/or tillage management from 2012 to 2023¥ β.
Table 5.
Differences in harvested grain yields of corn grown in an irrigated system with different N sources and/or tillage management from 2012 to 2023¥ β.
| Year$ | TDM | TUF | TSF | NT202 | ST202 | |
| ------------------------------------------------ kg dry weight ha-1 ------------------------------------------------------- | ||||||
| 2012 | 10,818 a | 10,715 a | 11,588 a | 11,496 a | 9261 a | 9979 a |
| 2013 | 11,879 a | 12397 a | 11,812 ab | 11,948 a | 11,218 b | 10550 b |
| 2014 | 11,649 a | 11,358 a | 10,326 bc | 10,554 ab . | 9890 bc. | 9931 bc |
| 2015 | 11,038 a | 10,902 a | 10,966 a . | 11,038 a. | 10397 a. | 10902 a |
| 2016 | 7633 b | 7806 b | 9769 a | 9704 a | 9830 a | 10814 a |
| 2017 | 11,637ab | 12,282 a¶ | 11255 a | 11,550 b | 10029 c | 10122c |
| 2018 | 10,496a | 11,300 a¶ | 10,177 a | 11,684 a | 10283 a | 10552a |
| 2019 | 11,637ab | 10,149 a¶ | 10,173 a | 9644 ab | 8995b | 8462c |
| 2020 | 10,353ab | 11,241 a¶ | 10,147 a | 10,532 b | 8570 c | NA |
| 2021 | 12,441a | 12,774 a¶ | N/A$ | 9840 b | 11517 b | NA |
| 2022 | 9717 a | 10,180 a¶ | N/A$ | 12,215 a | 8402 b | NA |
| 2023 | 12,657 a | 12,785 a¶ | N/A$ | 9621 b | 9461 b | NA |
¥The treatments were: i) dry dairy manure (TDM, 179 kg N ha-1) in a tilled system; ii) dry dairy manure with AgrotainPlus (TDMAP, 179 kg N ha-1) in a tilled system; iii) urea fertilizer (TUF, 179 kg N ha-1) in a tilled system; iv) the enhanced efficiency fertilizer SUPERU (TSU) in a tilled system; v) urea (NT202; 202 kg N ha-1) in a no-till system; and vi) urea (ST202; 202 kg N ha-1) in a strip till system. $The 179 kg N ha-1 TUF treatment was changed in 2021 to 179 kg N ha-1 of TSU. There was no application of manure applied in 2016 for the TDM and TDMAP treatments. ¶The TDMAP treatment was changed in 2017 to 30% of the rate of TDM (an average application of 55 kg N ha-1) plus 70% of the rate of TSU (an average application of 117 kg N ha-1) for a total of 172 kg N ha-1. βWithin a year, treatments with different letters are significantly different; lowercase letters indicate differences at α = 0.05.
Disclaimer/Publisher’s Note: The statements, opinions and data contained in all publications are solely those of the individual author(s) and contributor(s) and not of MDPI and/or the editor(s). MDPI and/or the editor(s) disclaim responsibility for any injury to people or property resulting from any ideas, methods, instructions or products referred to in the content. |
© 2024 by the authors. Licensee MDPI, Basel, Switzerland. This article is an open access article distributed under the terms and conditions of the Creative Commons Attribution (CC BY) license (http://creativecommons.org/licenses/by/4.0/).
Copyright: This open access article is published under a Creative Commons CC BY 4.0 license, which permit the free download, distribution, and reuse, provided that the author and preprint are cited in any reuse.


