
Submitted:
15 September 2024
Posted:
16 September 2024
You are already at the latest version
Abstract
Aluminium matrix composite’s overall quality is impacted by the friction stir process parameters, which have a major impact on the microstructure, soundness, and particle dispersion inside the stir zone. Although it requires a lot of experimentation, optimizing these factors is vital. For the purpose of optimizing the ultimate tensile strength and microhardness of the AA5083/Silicon carbide and AA5083/Coal composites fabricated by FSP, this work used the Taguchi L9 design of experiments. Three process parameters were investigated at three levels each. For the AA5083/Silicon carbide composite, the results of the ANOVA analysis showed rotational speed has a larger impact on ultimate tensile strength while forAA5083/coal tilt angle has a larger impact on ultimate tensile strength. On the other hand, rotating speed had a greater effect on microhardness and percentage elongation of the AA5083/Coal and AA5083/Silicon carbide composite joints, according to ANOVA analysis. The need for specific process optimization for each composite was highlighted by the fact that different combinations of parameters were best for obtaining the necessary attributes in the AA5083/Silicon carbide and AA5083/Coal composites.
Keywords:
Aluminium alloys
; Composite
; Metal Matrix Composite
; Mechanical Properties
; Friction Stir Welding
; Friction Stir Processing
; Taguchi
; S/N Ratio
; ANOVA
1. Introduction
One of the most important areas of interest in materials science and engineering has been the development of new generation materials with unique and tailored properties. Metal matrix composites (MMCs) represent the most innovative in the field of materials engineering, with the potential to significantly improve aluminium alloy mechanical properties by the incorporation of high-modulus, high-strength ceramic particles into the aluminium matrix [1,2]. When compared to traditional structural materials, aluminium based MMCs have higher specific strength and stiffness, which makes them perfect for several uses in the automotive, aerospace, marine, and recreational sectors [3,4]. Exceptional properties that set them apart from the traditional materials include high elastic modulus, outstanding resistance to corrosion, increased fatigue strength, better low coefficient of thermal expansion and resistance to wear [5,6].
Friction stir processing/FSP is a new solid-state method that fabricates surface composites and improves mechanical properties by using the concepts of friction stir welding/FSW [7,8]. FSP causes microstructural change, densification, and homogeneity all at the same time by subjecting the material in the stir zone/ nugget zone to plastic deformation, mixing, and heat exposure [9]. FSP also, encourages shearing and even dispersion of particles inside the matrix [10]. Thus far, metal matrix composites have been successfully fabricated using FSP.
Specific parameter combinations are used in FSP technique, and each one affects how the processed surface behaves. Depending on the materials used, the desired composite properties, and the equipment available, different process parameters, such as tool geometry, tool rotation speed, traverse speed, preheating temperature, and applied pressure, will apply. Out of all the process parameters that impact FSP, it has been noted that the tool rotation speed and traverse speed [11] have an impact on the evenly distribution of the reinforcing particles, grain refinery, and heat production during the composites’ fabrication, While the tool tilt angle has a major impact on the dispersion of reinforcing particles.
In the stir zone, parameters such tool travel speed, plunge depth, tool rotation rate, and tool angle determine temperatures and microstructure properties [12]. Material flow and temperature distribution behaviour are greatly influenced by tool geometry and welding parameters, which can alter microstructure [13]. Grain size can be refined with lower heat input, but plasticization or softening of the material requires higher heat input. High traverse speeds and low rotating speeds can result in smaller grain sizes, but vice versa because defect may increase [14]. Therefore, it is essential to maximize both traverse and rotational speeds in order to produce a stir zone with fewer defects and smaller grain size. A summary of some of the most important processing parameters is given below.
Rotation speed (rpm): Another significant element that controls the flow and dispersion of the workpiece material is the rotational speed. As the rotation speed of the tool increases a higher dissolution of soluble particles is likely to occur while the insoluble particles are likely to fragment further [15]. Increasing the speed at which the tool rotates can improve the size of the grain and increase the stir zone’s temperature considerably. It is important to note that, the microstructural evolution of the material can be affected by the direction in which the tool rotates [16].
Traverse speed (mm/min): Traverse speed is responsible for moving the material from the front end of the workpiece to the end. The grain size in the FSPed zone of the material being processed may increase when the tool traverse speed is decreased. As a result, it barely affects how much the tool wears. Research also indicates that increasing the traversal speed can enhance the surface composite microhardness of the FSPed zone by increasing the dispersion of the reinforcement particles [17].
Tilt angle (deg): The tilt angle of the FSP tool ensures that the substance that has been stirred stays in the tool shoulder and is propelled to the back of the tool shoulder. The processing temperature may rise when the tool tilt angle is increased [18]. Higher tilt angles can result in larger grain and particle sizes, while lower tilt angles may cause defects in the processed zone [19].
Optimizing AMMCs’ microstructure and properties to meet the demanding needs of many sectors is crucial to achieving all their full potential. Approaches to optimization issues range from traditional to unconventional [20]. Conventional optimization techniques can be widely divided into two categories: mathematical search techniques (e.g., linear programming, nonlinear programming, dynamic programming) and experimental techniques such as statistical design of experiments (e.g., Response surface design approach, or Taguchi method). Non-conventional metaheuristic search methods, like genetic algorithms, tabu search, and simulated annealing, have become more and more popular among scholars in recent years.
In experimental design, the Taguchi method—a well-liked strategy for resolving optimization issues in production engineering—works very well. The Taguchi method, is a robust engineering approach pioneered by Genichi Taguchi, aims to enhance product and process quality through structured experimentation. By employing experimental design called orthogonal array design, signal-to-noise ratio and analysis of variance, this method optimizes factor settings and minimizes variability, resulting in improved product performance and manufacturing efficiency [21,22]. Researchers have used the different design of experiments and FSP in order to determine optimum process parameters for aluminium metal matrix composites, utilizing different grades and reinforcements [23,24,25,26,27,28,29,30,31,32,33].
This journal article presents a comparative study that uses the Taguchi Technique to optimize FSP process parameters for AA5083/Silicon carbide and AA5083/Coal composites that are fabricated via FSP. The study’s goal is to investigate how different reinforcement materials affect the optimization process. The comparative aspect of this study is of paramount importance to evaluate the mechanical properties and determine unique process parameters for each composite. The findings contribute to the broader field of advanced materials development, emphasizing the importance of optimized parameters for achieving superior performance, resource efficiency, and cost-effectiveness in manufacturing.
2. Material and Methods
2.1. Material and Composite Fabrication
Reinforcement and a base material are needed to create AMMCs. The AA5083 aluminium alloy plates, 6 mm thick and nominally composed of magnesium 4.03, zinc 0.01, titanium 0.02, chromium 0.05, silicon 0.15, manganese 0.69, iron 0.16, and copper were used in this investigation [34]. The dimensions of the AA5083 plates were 250 mm long and 55 mm wide. AMMCs composites were made using silicon carbide and coal as reinforcements separately. In the composite fabrication process, two AA5083 plates were friction stir welded together, and the weld joint was then repeatedly drilled with tiny holes. Next, reinforcing particles were added to the holes, followed by closing the holes using pin less FSP tool to prevent particle scattering during subsequent FSP. The final FSP pass was conducted at room temperature. A high-speed steel (AISI 4140) tool with a 20 mm shoulder diameter, a 5.8 mm triangular pin, and a 7 mm probe diameter was used in both the FSW and FSP procedures. Figure 1 depicts the tool with pin and pin-less tool used in the composite’s fabrication procedure.
2.2. Experimental Design Using Taguchi Method
A Taguchi L9 factorial design was used to cut down on the number of experimental runs. MINITAB was used to construct the design matrix. The three parameters taken into account for this study are included in Table 1 together with the relevant levels for each. The design matrix, shown in Table 2, consists of three components (processing parameters) at three distinct levels. As seen from the design matrix in Table 2, nine tests are needed in total, which meant that nine joints for each kind of composite (AA5083/Silicon carbide and AA5083/Coal) had to be fabricated. Using a complete factorial experiment design would have needed 27 experiments; however, the Taguchi approach avoided 18 FSP runs. As a result, expenses and time were greatly reduced.
2.3. Output Results Preparation
Waterjet technology was used to cut the produced AMMCs joints (AA5083/Coal and AA5083/Silicon carbide) perpendicular to the processing direction in order to get specimens for the hardness and tensile testing. Tensile specimens were cut for tensile strength testing and generated in compliance with ASTM E8M-04 standards, while hardness specimens were cut for Vickers microhardness testing in line with ASTM E384 standards. Figure 2 and Figure 3 shows the cut tensile and hardness specimens.
3. Results and Discussions
Since two different reinforcements (silicon carbide and coal) were used to optimize the AMMC fabrication parameters, the data analysis for the fabricated AA5083/Silicon carbide composite will be provided first, and then the analysis for the created AA5083/Coal composite.
3.1. Signal to Noise Ration Analysis
The ultimate tensile strength, % elongation, and microhardness of the fabricated AA5083/Silicon carbide and AA5083/Coal composite joints were assessed using the Taguchi methods to find the optimal parameters. Taguchi’s approach, a single-response optimization strategy, uses the signal-to-noise ratio to evaluate each parameter’s effect on response factors. To optimize the response, the S/N ratio in this investigation was determined using the ‘larger-the-better’ criteria. the impact of each control factor on the response, the means and S/N ratios were computed. The following formula can be used to compute the “larger-the-better” criteria [35]:
where n is the number of experimental repeats and y is the response factor. The desirable output value is represented by ‘Signal (S)’, while the undesired value is represented by ‘Noise (N)’.
The S/N ratio for parameter combinations of the AA5083/Silicon carbide composite is shown in Table 3, while the S/N ratio for parameter combinations of the AA5083/Coal composite is shown in Table 4. Figure 4 (a) and (b) displays their graphical representations.
Figure 4 (a1) shows that best FSP parameters for maximizing ultimate tensile strength in AA5083/Silicon carbide composite joints are rotational speed at level 2, traversal speed at level 1, and tilt angle at level 3. For the same set of parameters, maximal elongation is also obtained see Figure 4 (a2). The best parameters for optimum microhardness are tilt angle at level 3, traversal speed at level 2, and rotational speed at level 2 (see Figure 4 (a3)). Figure 4 (b1) shows that best FSP parameters for maximizing ultimate tensile strength in AA5083/Coal composite joints are rotational speed at level 2, traversal speed at level 3, and tilt angle at level 3. For the same set of parameters, maximal elongation and maximal hardness is also obtained see Figure 4 (b2) and Figure 4 (b3).
3.2. Analysis of Variance
3.2.1. Analysis of Variance Experimental Data for AA5083/Silicon Carbide Composite
- Ranking of contributing factors
Analysing the factors that influence each response factor of the fabricated composite joints is essential. Utilizing the delta ranking approach, MINITAB software displays the most significant factors influencing the response factor of the fabricated AA5083/Silicon carbide composite joint. For three levels and three process parameters, the mean S/N ratio was computed. Table 5, Table 6 and Table 7 show that the fabricated AA5083/Silicon carbide composite joint’s ultimate tensile strength, % elongation, and microhardness are significantly impacted by rotational speed (rank 1), traverse speed (rank 2), and tilt angle (rank 3).
- 2.
- Percentage of contribution factors
Analysing the percentage contributions and F-values of the factors is crucial to gaining a clearer understanding of of individual parameters on the output responses. The % contributions by S/N ratio analysis of variance for microhardness, elongation percentage, and ultimate tensile strength are displayed in Table 8, Table 9 and Table 10. Based on the results, the most significant factor influencing ultimate tensile strength was determined to be rotational speed, which accounted for 57.55% of the output response. Though less significant, rotational speed nonetheless made 12.58% of the total (see Table 8). It was discovered that rotational speed and traverse speed, with percentage contributions of 60.36% and 16.62%, respectively, were significant parameters for percentage elongation (see Table 9). These results are consistent with the ranks that were shown in Table 6. Research by Salehi et al. [11], Chanakyan et al. [24], Syed et al. [33], and Puviyarasan et al. [36] also showed a similar pattern, identifying tool rotational speed as the main factor influencing ultimate tensile strength. Furthermore, it was shown that rotational speed and traverse speed were important factors in microhardness with percentage contributions of 48.17% and 27.40%, respectively (see Table 10). These results are consistent with the ranks that were shown in Table 7. Research by Chanakyan et al. [24], Syed et al. [33], and Butola et al. [37] also showed a similar pattern, identifying tool rotational speed as the main factor influencing microhardness. For percentage elongation and microhardness, the percentage contributions and F-values match the ranks as well.
3.2.2. Analysis of Variance Experimental Data for AA5083/Coal Composite
- Ranking of contributing factors
An analysis of the factors affecting each response element of the fabricated AA5083/Coal composite joint was also carried out. The results shows that the resulting tensile strength of the fabricatedAA5083/Coal composite joint is influenced by the tilt angle (rank 1), traverse speed (rank 2), and rotation speed (rank 3), as seen in Table 1. The percentage elongation and microhardness of the fabricated AA5083/Coal composite joint are influenced by the rotation speed (rank 1), tilt angle (rank 2), and traverse speed (rank 3), as indicated by Tables 12—13.
- 2.
- Percentage of contribution factors
The % contributions by S/N ratio analysis of variance for microhardness, elongation percentage, and ultimate tensile strength are displayed in Table 14, Table 15 and Table 16. Based on the results, the most significant factors influencing ultimate tensile strength are tilt angle and traverse speed, which accounted for 27.0% and 19.3% respectively of the output response (see Table 14). These results are consistent with the ranks that were shown in Table 11. It was discovered that rotational speed and tilt angle, with percentage contributions of 34.4% and 30.0%, respectively, were significant parameters for percentage elongation (see Table 15). These results are consistent with the ranks that were shown in Table 12. The most significant factor influencing microhardness was determined to be rotational speed, which accounted for 44.89% of the output response. Though less significant, tilt angle nonetheless made 9.131% of the total (see Table 16). These results are consistent with the ranks that were shown in Table 13. Research by Chanakyan et al. [24], Syed et al. [33], and Butola et al. [37] also showed a similar pattern, identifying tool rotational speed as the main factor influencing microhardness. The percentage contributions for ultimate tensile strength and % elongation, and microhardness match the rankings and the F-values.
4. Conclusions
To improve FSP parameters for AMMC joint fabrication, a Taguchi L9 factorial design was employed. The process of optimizing the parameters involved fabricating AMMCs with two distinct reinforcements, namely silicon and coal. The fabricated composites were AA5083/Silicon carbide composite and AA5083/Coal composite. Mechanical properties such as hardness, tensile strength, and percent elongation were evaluated after the composites were fabricated.
The Taguchi approach based on the S/N ratio demonstrated that:
- The highest UTS and the % elongation for the AA5083/Silicon carbide composites fabrication process could be achieved if the rotation speed has been set to level 2 on the control panel, the traverse speed at level 1, and the tilt angle was at level 3. The best parameters for optimum microhardness are tilt angle at level 3, traversal speed at level 2, and rotational speed at level 2.
- At the second level of rotational speed, the third level of traversal speed, and the third level of tilt angle, the AA5083/Coal composite joints had the best FSP parameters to enhance the ultimate tensile strength, percentage elongation, and micro hardness.
The Taguchi approach based on the ANOVA demonstrated that:
- AA5083/Silicon carbide and AA5083/Coal composite joints, rotating speed has a larger impact on percentage elongation and microhardness, according to an ANOVA study. The ultimate tensile strength of AA5083/Silicon carbide is more affected by rotating speed, whereas the ultimate tensile strength of AA5083/coal tilt angle is more affected by tilt angle.
Based on the results the conclusion was drawn that:
- The best processing parameters, for fabricating AA5083/Coal composite, were a tilt angle of 2 degrees, a traverse speed of 60 mm/min, and a rotation speed of 900 rpm.
- The best processing parameters used when fabricating AA5083/Silicon carbide composite that yielded maximum microhardness was at a rotational speed of 900rpm, traversal speed of 45mm/min, and tilt angle of 2 degrees, while the best combination of parameters to attain the maximum ultimate tensile strength and percentage elongation of the composite was achieved at a rotational speed of 900 rpm, traverse speed of 30mm/min, and tilt angle of 2 degrees.
Author Contributions
Conceptualization, V.M.; methodology, S.M.; software, O.M.; validation, O.M., V.M. and S.M.; formal analysis, S.M.; investigation, O.M.; resources, V.M.; data curation, S.M., and OM.; writing—original draft, O.M.; writing—review and editing, S.M. and V.M..; visualization, O.M.; supervision, V.M and S.M.; project administration, V.M. All authors have read and agreed to the published version of the manuscript.
Funding
This research was funded by CPUT.
Data Availability Statement
Not applicable.
Acknowledgments
The authors would like to thank the Cape Peninsula University of Technology for providing them with unrestricted access to the equipment required for the study.
Conflicts of Interest
The authors declare no conflict of interest.
References
- Clyne, T.W.; Withers, P.J. An Introduction to Metal Matrix Composites; Cambridge University Press: Cambridge, UK, 1993. [CrossRef]
- Rohatgi, P.K., Asthana, R.; Das, S. Solidification, structures, and properties of cast metal-ceramic particle composites. International metals reviews; 1986; 31(1), pp.115-139.
- Zhang, W.; Hu, Y.; Wang, Z.; Yang, C.; Zhang, G.; Prashanth, K.; Suryanarayana, C. A novel high-strength Al-based nanocomposite reinforced with Ti-based metallic glass nanoparticles produced by powder metallurgy. Mater. Sci. Eng. A 2018, 734, 34–41. [CrossRef]
- Jeyasimman, D.; Sivasankaran, S.; Sivaprasad, K.; Narayanasamy, R.; Kambali, R. An investigation of the synthesis, consolidation and mechanical behaviour of Al 6061 nanocomposites reinforced by TiC via mechanical alloying. Mater. Des. 2014, 57, 394–404. [CrossRef]
- Scudino, S.; Liu, G.; Prashanth, K.; Bartusch, B.; Surreddi, K.; Murty, B.; Eckert, J. Mechanical properties of Al-based metal matrix composites reinforced with Zr-based glassy particles produced by powder metallurgy. Acta Mater. 2009, 57, 2029–2039. [CrossRef]
- Kumar, K.R.; Kiran, K.; Sreebalaji, V. Micro structural characteristics and mechanical behaviour of aluminium matrix composites reinforced with titanium carbide. J. Alloy. Compd. 2017, 723, 795–801. [CrossRef]
- Dolatkhah, A.; Golbabaei, P.; Givi, M.B.; Molaiekiya, F. Investigating effects of process parameters on microstructural and mechanical properties of Al5052/SiC metal matrix composite fabricated via friction stir processing. Materials & Design,2012; 37, pp.458-464.
- Saini, N.; Dwivedi, D.; Jain, P.; Singh, H. Surface Modification of Cast Al-17%Si Alloys Using Friction Stir Processing. Procedia Eng. 2015, 100, 1522–1531. [CrossRef]
- Zykova, A.P.; Tarasov, S.Y.; Chumaevskiy, A.V.; Kolubaev, E.A. A Review of Friction Stir Processing of Structural Metallic Materials: Process, Properties, and Methods. Metals 2020, 10, 772. [CrossRef]
- Gangil, N.; Siddiquee, A.N.; Maheshwari, S. Aluminium based in-situ composite fabrication through friction stir processing: A review. J. Alloy. Compd. 2017, 715, 91–104. [CrossRef]
- Salehi, M.; Saadatmand, M.; Mohandesi, J.A. Optimization of process parameters for producing AA6061/SiC nanocomposites by friction stir processing. Transactions of Nonferrous Metals Society of China, 2012; 22(5), pp.1055-1063.
- Pashazadeh, H.; Teimournezhad, J.; Masoumi, A. Numerical investigation on the mechanical, thermal, metallurgical and material flow characteristics in friction stir welding of copper sheets with experimental verification. Mater. Des. 2014, 55, 619–632. [CrossRef]
- Sidhu, M.S.; Chatha, S.S. Friction stir welding–process and its variables: A review. International Journal of Emerging Technology and Advanced Engineering, 2012; 2(12), pp.275-279.
- Carlone, P.; Palazzo, G.S. Influence of Process Parameters on Microstructure and Mechanical Properties in AA2024-T3 Friction Stir Welding. Met. Microstruct. Anal. 2013, 2, 213–222. [CrossRef]
- Pasebani, S.; Charit, I.; Mishra, R.S. Effect of tool rotation rate on constituent particles in a friction stir processed 2024Al alloy. Mater. Lett. 2015, 160, 64–67. [CrossRef]
- Nascimento, F.; Santos, T.; Vilaça, P.; Miranda, R.; Quintino, L. Microstructural modification and ductility enhancement of surfaces modified by FSP in aluminium alloys. Mater. Sci. Eng. A 2009, 506, 16–22. [CrossRef]
- Ramezani, N.M.; Davoodi, B.; Aberoumand, M.; Hajideh, M.R. Assessment of tool wear and mechanical properties of Al 7075 nanocomposite in friction stir processing (FSP). J. Braz. Soc. Mech. Sci. Eng. 2019, 41, 182. [CrossRef]
- Abbasi, M.; Bagheri, B.; Keivani, R. Thermal analysis of friction stir welding process and investigation into affective parameters using simulation. J. Mech. Sci. Technol. 2015, 29, 861–866. [CrossRef]
- Vigneshkumar, M.; Padmanaban, G.; Balasubramanian, V. Influence of tool tilt angle on the formation of friction stir processing zone in cast magnesium alloy ZK60/SiCp surface composites. Metallography, Microstructure, and Analysis, 2019; 8, pp.58-66.
- Mukherjee, I.; Ray, P.K. A review of optimization techniques in metal cutting processes. Comput. Ind. Eng. 2006, 50, 15–34. [CrossRef]
- Montgomery, D.C. Design and analysis of experiments. John wiley & sons; 2017.
- Ross, P.J. Taguchi techniques for quality engineering: loss function, orthogonal experiments, parameter and tolerance design. McGraw-Hill; 1988.
- Saravanakumar, S.; Prakash, K.; Dinesh, D.; Kumar, P.M.; Fouad, Y.; Soudagar, M.E.M.; Ali, M.M.; Bashir, M.N. Optimizing friction stir processing parameters for aluminium alloy 2024 reinforced with SiC particles: A taguchi approach of investigation. J. Mater. Res. Technol. 2024, 30, 4847–4855. [CrossRef]
- Chanakyan, C.; Sivasankar, S.; Meignanamoorthy, M.; Ravichandran, M.; Mohanavel, V.; Alfarraj, S.; Almoallim, H.S.; Manikandan, V.; Lalvani, J.I.J. Optimization of FSP Process Parameters on AA5052 Employing the S/N Ratio and ANOVA Method. Adv. Mater. Sci. Eng. 2021, 2021. [CrossRef]
- Bauri, R.; Yadav, D.; Kumar, C.S.; Ram, G.J. Optimized process parameters for fabricating metal particles reinforced 5083 Al composite by friction stir processing. Data Brief 2015, 5, 309–313. [CrossRef]
- Rahman, M.Z.; Khan, Z.A.; Siddiquee, A.N.; Abidi, M.H.; Aboudaif, M.K.; Al-Ahmari, A. Mechanical and microstructural characterization of Ti-SiC reinforced AA5083 surface composites fabricated via friction stir process. Materials Research Express, 2021; 8(12), p.126523.
- Rahman, Z.; Siddiquee, A.N.; Khan, Z.A. Effect of Ti/SiC Reinforcement on AA5083 Surface Composites Prepared by Friction Stir Processing. IOP Conf. Series: Mater. Sci. Eng. 2021, 1149, 012001. [CrossRef]
- Jain, V.K.; Yadav, M.K.; Siddiquee, A.N.; Khan, Z.A. Optimization of friction stir processing parameters for enhanced microhardness of AA5083/Al-Fe in-situ composites via Taguchi technique. Material Science, Engineering and Applications, 2021; 1(2), pp.55-61.
- D Ghetiya, N.; Bharti, S.; Patel, K.M.; Kumar, S.; Rahimian Koloor, S.S. An insight on optimization of FSP process parameters for the preparation of AA5083/(SiC-Gr) hybrid surface composites using the response surface methodology. Composites and Advanced Materials, 2023; 32, p.26349833231186162.
- Bharti, S.; Ghetiya, N.D.; Patel, K.M. Parametric optimization of process parameters during friction stir processing of AA5083/(SiC-Gr) hybrid surface composite. Materials Today: Proceedings, 2023; 78, pp.420-425.
- Kaya, N.; Çetinkaya, C.; Karakoç, H.; Ada, H. Effect of process parameters of Al5083/SiC surface composites fabricated by FSP on microstructure, mechanical properties and wear behaviors. Materials Chemistry and Physics, 2024; 315, p.128991.
- Saxena, P.; Bongale, A.; Kumar, S.; Suresh, R. Tribological and Hardness Analyses of Friction-Stir-Processed Composites Using the Taguchi Approach. Materials 2023, 16, 420. [CrossRef]
- Syed, K.; Ali, M.A.; Reddy, K.P.K.; Rao, B.N. Analyzing the Influence of Tool Profile on Friction Stir Process with Taguchi Optimization and Tungsten Nano Powder. International Journal of Vehicle Structures & Systems, 2023; 15(6), pp.802-807.
- Zass, K.; Mabuwa, S.; Msomi, V. Introduction of Coal Reinforcing Particles on the Dissimilar FSW AA608/AA5083 Joint via Friction Stir Processing. Metals, 2023; 13(12), p.1981.
- Ahmadkhaniha, D.; Sohi, M.H.; Zarei-Hanzaki, A.; Bayazid, S.; Saba, M. Taguchi optimization of process parameters in friction stir processing of pure Mg. J. Magnes. Alloy. 2015, 3, 168–172. [CrossRef]
- Puviyarasan, M.; Kumar, V.S. Optimization of friction stir process parameters in fabricating AA6061/SiCp composites. Procedia engineering, 2012; 38, pp.1094-1103.
- Butola, R.; S, R.M.; Murtaza, Q. Fabrication and optimization of AA7075 matrix surface composites using Taguchi technique via friction stir processing (FSP). Eng. Res. Express 2019, 1, 025015. [CrossRef]
Figure 1.
Pin less tool and Pin with tool utilised during the fabrication process.
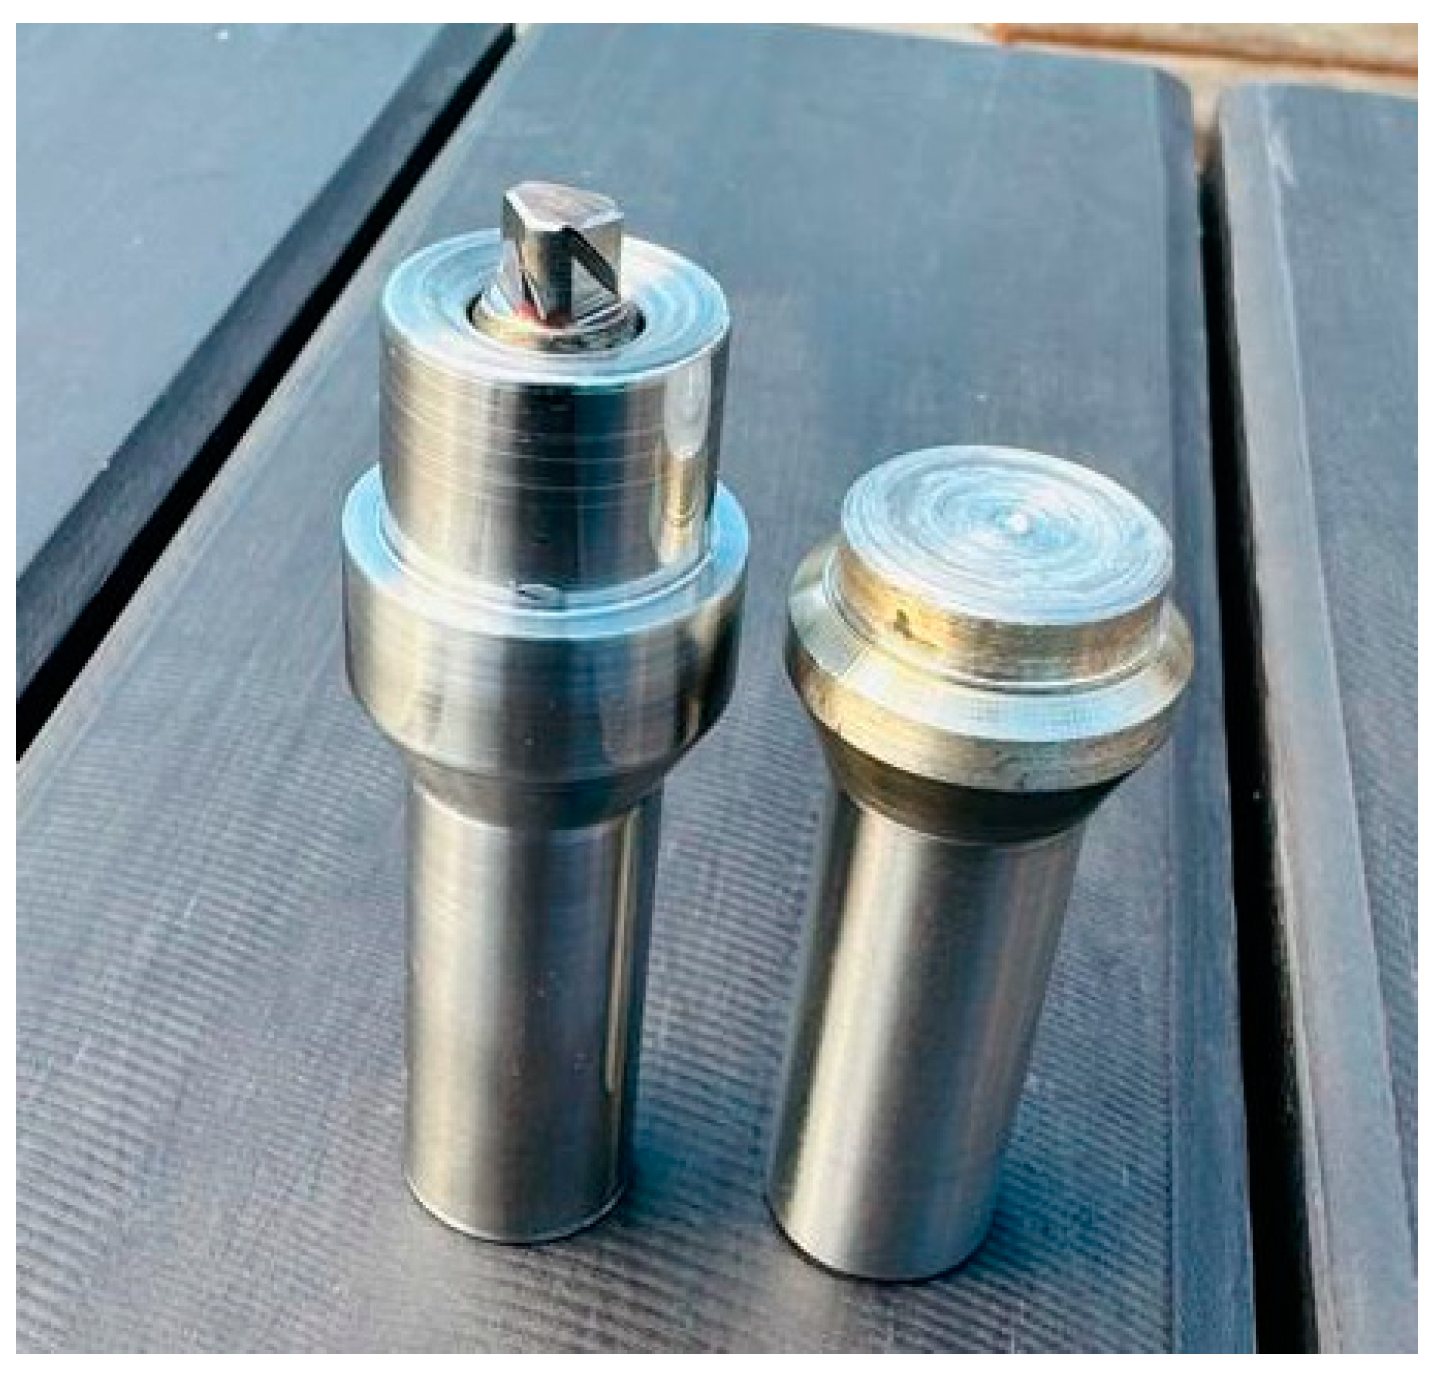
Figure 2.
Tensile specimen.
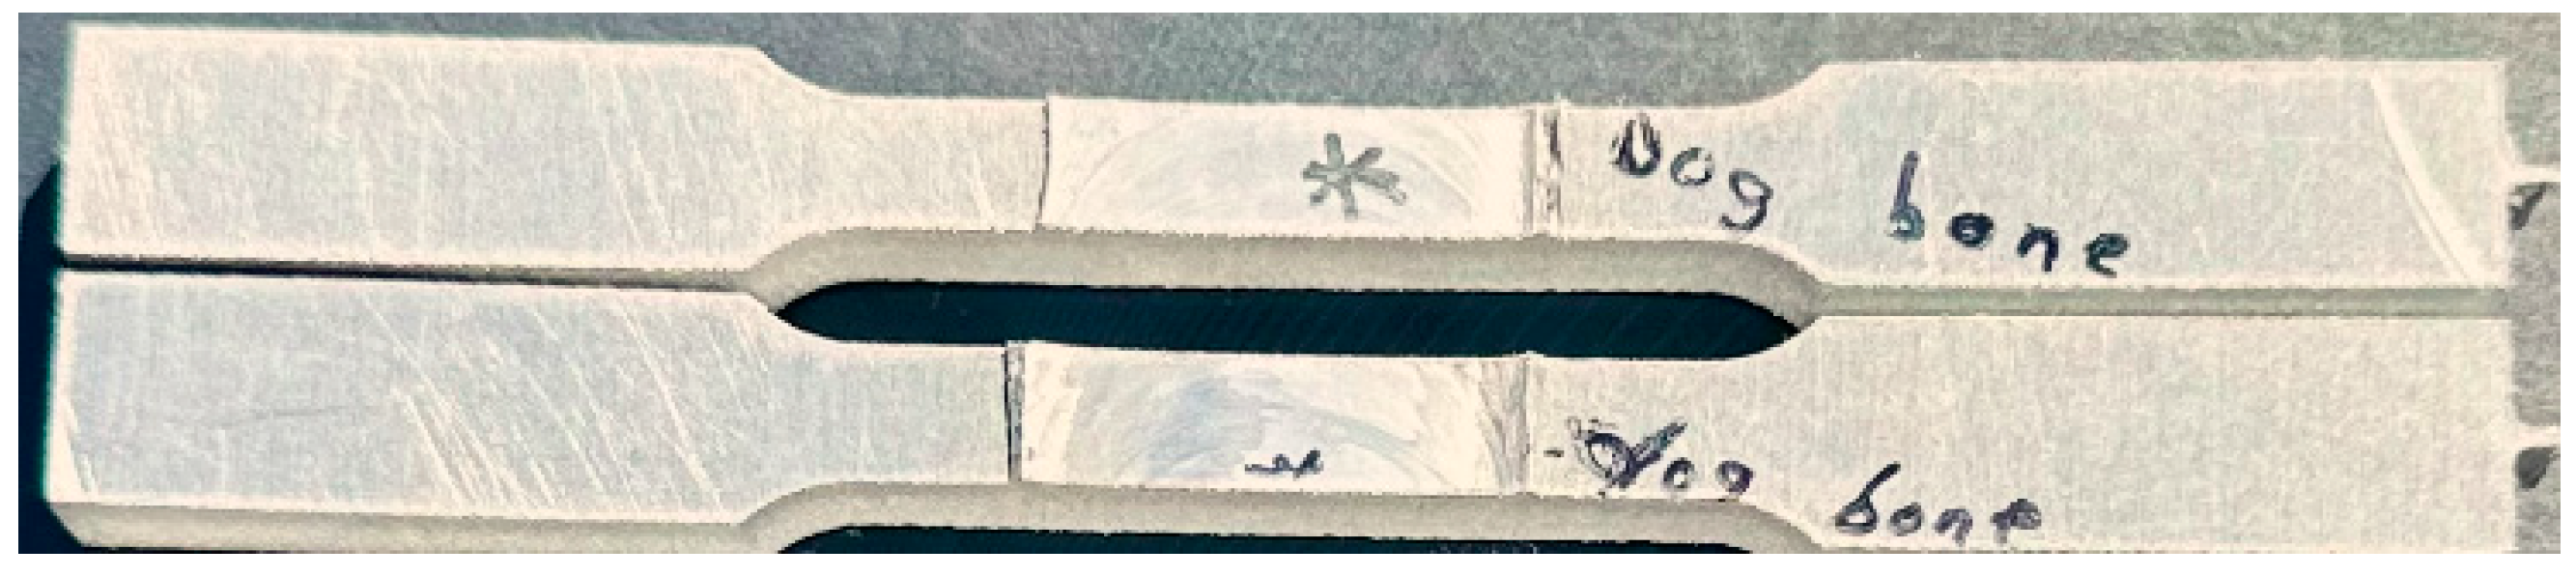
Figure 3.
Hardness specimen.
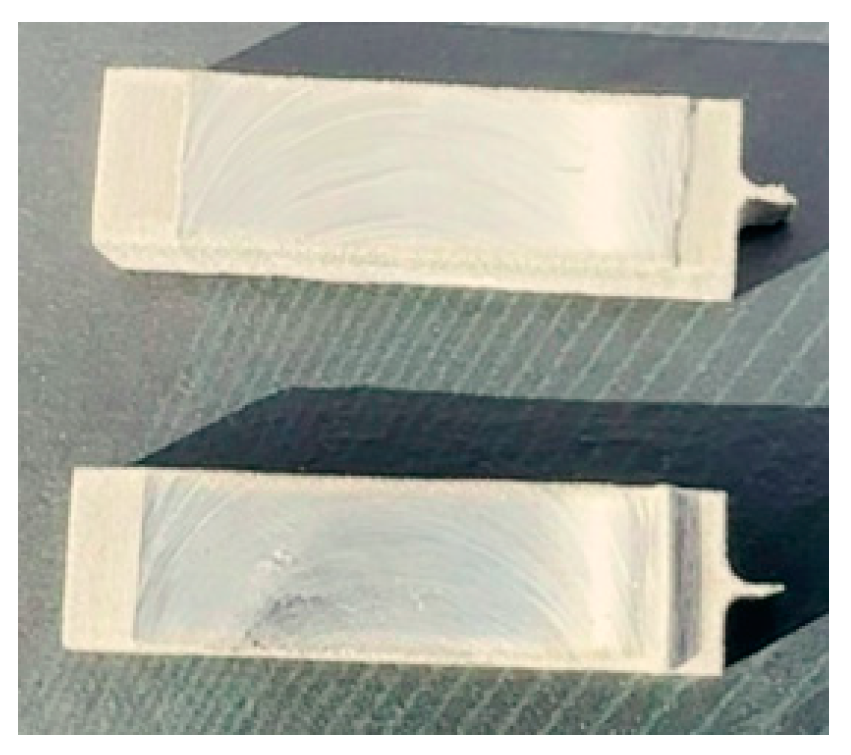
Figure 4.
(a) AA5083/Silicon carbide composite S/N ratio plot (a1) Ultimate tensile strength; (a2) Percentage elongation; (a3) Microhardness: (b) AA5083/Coal composite S/N ratio plot (b1) Ultimate tensile strength; (b2) Percentage elongation; (b3) Microhardness.
Figure 4.
(a) AA5083/Silicon carbide composite S/N ratio plot (a1) Ultimate tensile strength; (a2) Percentage elongation; (a3) Microhardness: (b) AA5083/Coal composite S/N ratio plot (b1) Ultimate tensile strength; (b2) Percentage elongation; (b3) Microhardness.
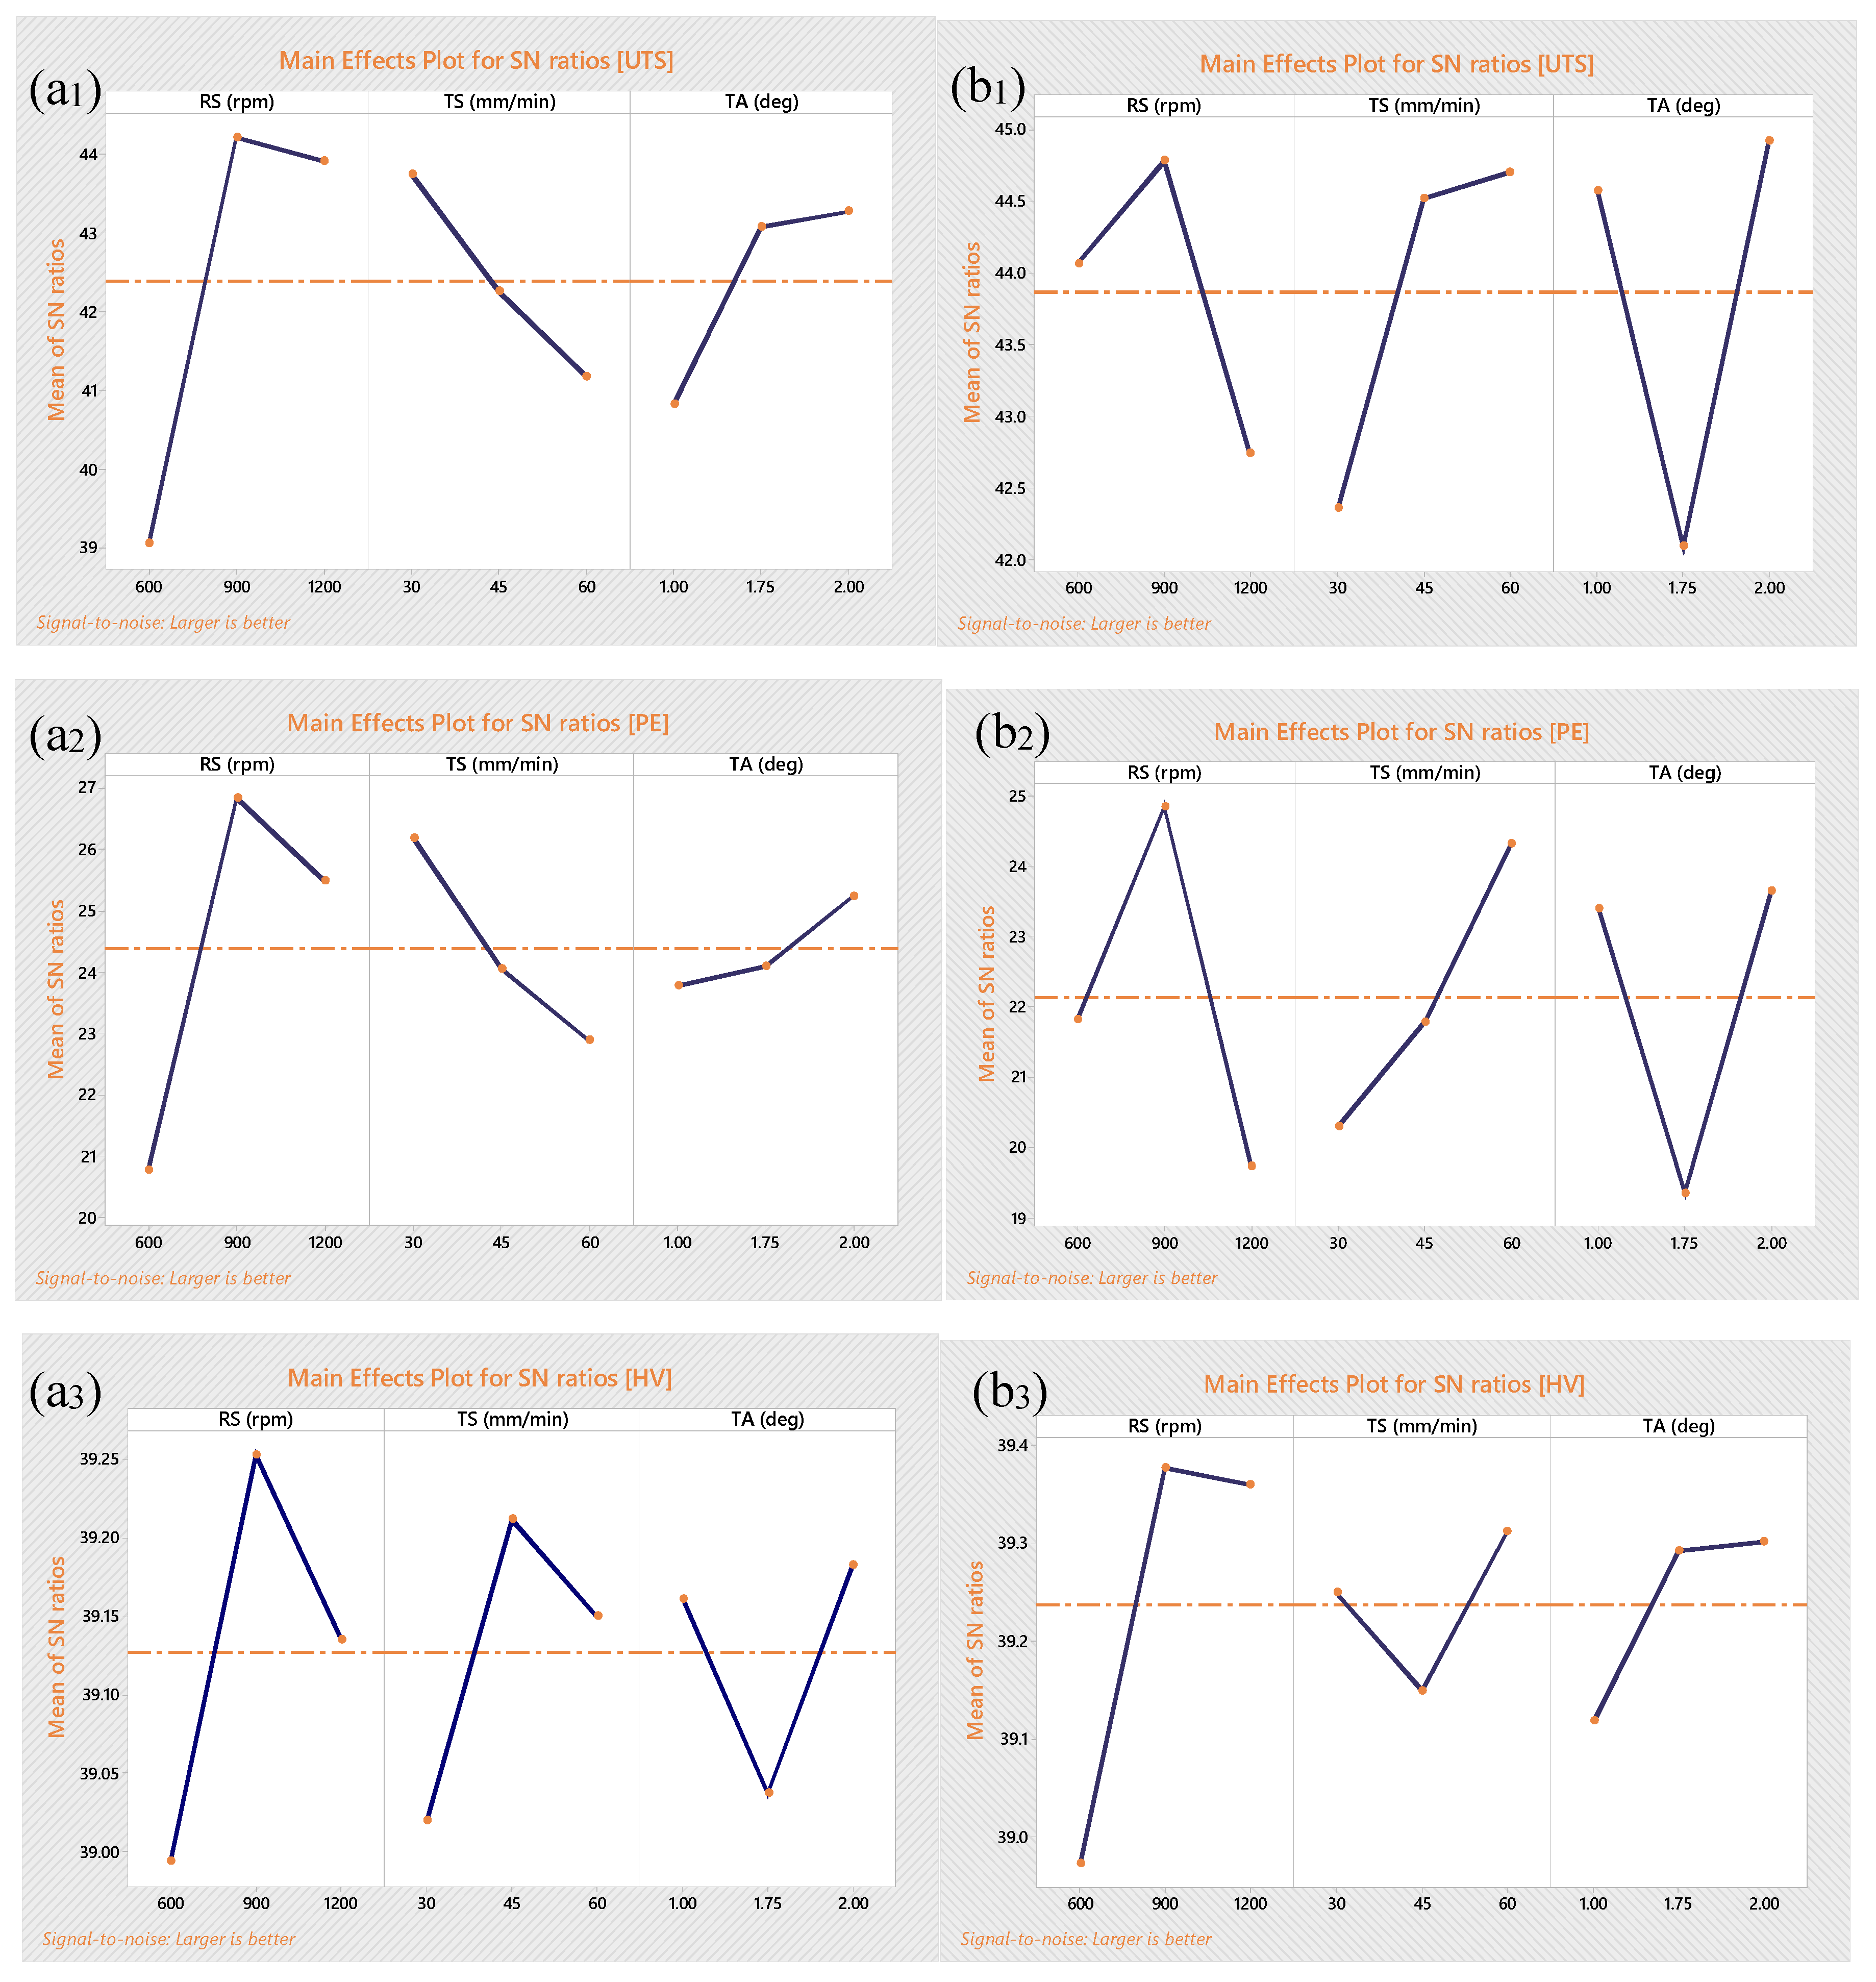

Table 1.
Processing parameters with their levels.
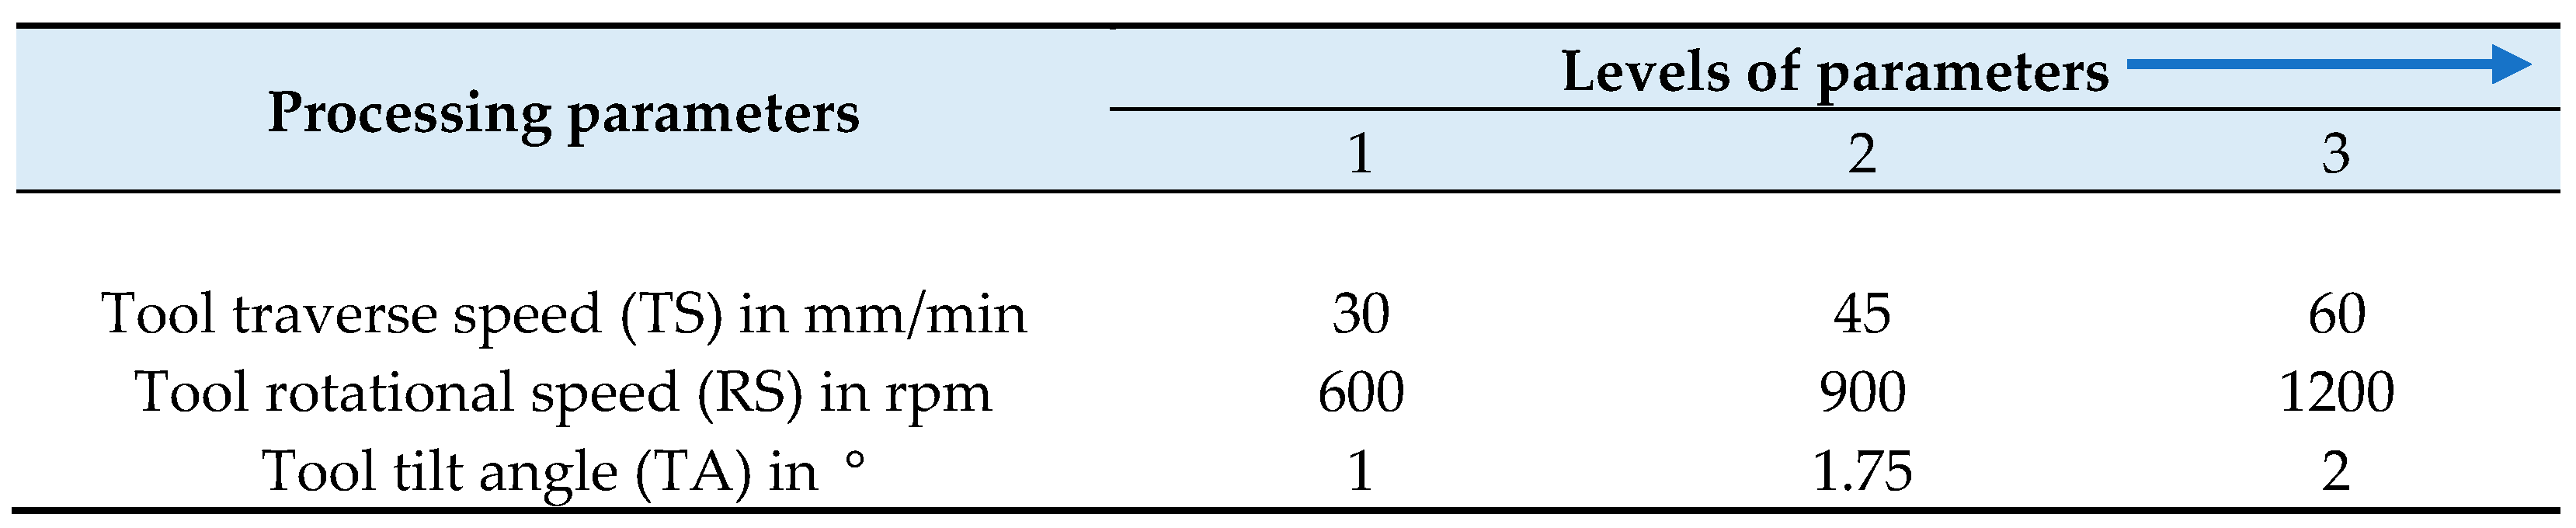
Table 2.
Taguchi L9 design matrix.
| No of tests | Traverse speed [mm/min] | Rotational speed [rpm] | ] |
|---|---|---|---|
| 1. | 30 | 600 | 1 |
| 2. | 45 | 600 | 1.75 |
| 3. | 60 | 600 | 2 |
| 4. | 30 | 900 | 1.75 |
| 5. | 45 | 900 | 2 |
| 6. | 60 | 900 | 1 |
| 7. | 30 | 1200 | 2 |
| 8. | 45 | 1200 | 1 |
| 9. | 60 | 1200 | 1.75 |
Table 3.
AA5083/Silicon carbide composite experimental results with relevant S/N ratio.
| TS (mm/min) |
RS (rpm) |
TA ) |
MH (HV) |
UTS (MPa) |
PE (%) |
S/N ratio For HV |
S/N ratio For UTS |
S/N ratio For PE |
|---|---|---|---|---|---|---|---|---|
| 30 | 600 | 1 | 94.78 | 71.5 | 9.88 | 38.89 | 37.09 | 19.89 |
| 45 | 600 | 1.75 | 89.57 | 114 | 11.75 | 39.04 | 41.14 | 21.40 |
| 60 | 600 | 2 | 89.57 | 88 | 11.23 | 39.04 | 38.89 | 21.01 |
| 30 | 900 | 1.75 | 89.39 | 210 | 29 | 39.03 | 46.44 | 29.25 |
| 45 | 900 | 2 | 94.80 | 145 | 18.45 | 39.37 | 43.23 | 25.32 |
| 60 | 900 | 1 | 92.95 | 141 | 19.9 | 39.37 | 42.98 | 25.98 |
| 30 | 1200 | 2 | 90.56 | 243 | 29.5 | 39.14 | 47.71 | 29.39 |
| 45 | 1200 | 1 | 93.65 | 132 | 18.7 | 39.22 | 42.41 | 25.44 |
| 60 | 1200 | 1.75 | 89.56 | 121 | 12.08 | 39.04 | 41.66 | 21.64 |
Table 4.
AA5083/Coal composite experimental results with relevant S/N ratio.
| TS (mm/min) |
RS (rpm) |
TA ) |
MH (HV) |
UTS (MPa) |
PE (%) |
S/N ratio For HV |
S/N ratio For UTS |
S/N ratio For PE |
|---|---|---|---|---|---|---|---|---|
| 30 | 600 | 1 | 93.62 | 167 | 11.95 | 38.66 | 44.45 | 21.55 |
| 45 | 600 | 1.75 | 88.34 | 109 | 7 | 38.92 | 40.75 | 16.90 |
| 60 | 600 | 2 | 92.65 | 224 | 22.43 | 39.34 | 47.01 | 27.02 |
| 30 | 900 | 1.75 | 96.27 | 134 | 12.18 | 39.67 | 42.54 | 21.71 |
| 45 | 900 | 2 | 90.65 | 242 | 20.73 | 39.15 | 47.68 | 26.33 |
| 60 | 900 | 1 | 92.43 | 161 | 21.18 | 39.32 | 44.14 | 26.52 |
| 30 | 1200 | 2 | 95.33 | 101 | 7.6 | 39.42 | 40.09 | 17.62 |
| 45 | 1200 | 1 | 93.09 | 181 | 12.75 | 39.38 | 45.15 | 22.11 |
| 60 | 1200 | 1.75 | 95.85 | 141 | 9.38 | 39.28 | 42.98 | 19.44 |
Table 5.
Table of Responses for the S/N ratio of ultimate tensile strength parameters.
| Level | Traverse speed (mm/min) | Rotational speed(rpm) | ) |
|---|---|---|---|
| 1 | 43.75 | 39.04 | 40.83 |
| 2 | 42.26 | 44.22 | 43.08 |
| 3 | 41.18 | 43.93 | 43.28 |
| Delta | 2.57 | 5.18 | 2.45 |
| Rank | 2 | 1 | 3 |
Table 6.
Table of Responses for the S/N ratio of percentage elongation parameters.
| Level | Traverse speed (mm/min) | Rotational speed(rpm) | ) |
|---|---|---|---|
| 1 | 26.18 | 20.77 | 23.77 |
| 2 | 24.05 | 26.85 | 24.10 |
| 3 | 22.88 | 25.49 | 25.24 |
| Delta | 3.30 | 6.08 | 1.47 |
| Rank | 2 | 1 | 3 |
Table 7.
Table of Responses for the S/N ratio of microhardness parameters.
| Level | Traverse speed (mm/min) | Rotational speed(rpm) | ) |
|---|---|---|---|
| 1 | 39.02 | 38.99 | 39.16 |
| 2 | 39.21 | 39.25 | 39.04 |
| 3 | 39.15 | 39.14 | 39.18 |
| Delta | 0.19 | 0.26 | 0.15 |
| Rank | 2 | 1 | 3 |
Table 8.
Contribution of individual factor to the variation of ultimate tensile strength.
| Source | Degree of freedom (DF) | Seq SS | F-value | P-value | Percentage contribution |
|
|---|---|---|---|---|---|---|
| TS (mm/min) | 2 | 9.9970 | 0.61 | 0.621 | 11.32 | |
| RS (rpm) | 2 | 50.823 | 3.10 | 0.244 | 57.55 | |
| TA () | 2 | 11.110 | 0.68 | 0.596 | 12.58 | |
| Error | 2 | 16.379 | 18.55 | |||
| Total | 8 | 88.308 | ||||
Table 9.
Contribution of individual factor to the variation of percentage elongation.
| Source | Degree of freedom (DF) | Seq SS | F-value | P-value | Percentage contribution |
|
|---|---|---|---|---|---|---|
| TS (mm/min) | 2 | 16.831 | 0.85 | 0.540 | 16.62 | |
| RS (rpm) | 2 | 61.127 | 3.10 | 0.244 | 60.36 | |
| TA () | 2 | 3.5830 | 0.18 | 0.846 | 3.538 | |
| Error | 2 | 19.734 | 19.49 | |||
| Total | 8 | 101.275 | ||||
Table 10.
Contribution of individual factor to the variation of microhardness.
| Source | Degree of freedom (DF) | Seq SS | F-value | P-value | Percentage contribution |
|
|---|---|---|---|---|---|---|
| TS (mm/min) | 2 | 0.05777 | 4.25 | 0.191 | 27.40 | |
| RS (rpm) | 2 | 0.10103 | 7.39 | 0.119 | 48.17 | |
| TA () | 2 | 0.03729 | 2.73 | 0.268 | 17.78 | |
| Error | 2 | 0.01367 | 6.452 | |||
| Total | 8 | 0.20975 | ||||
Table 11.
Table of Responses for the S/N ratio of ultimate tensile strength parameters.
| Level | Traverse speed (mm/min) | Rotational speed (rpm) | ) |
|---|---|---|---|
| 1 | 42.36 | 44.07 | 44.58 |
| 2 | 44.53 | 44.78 | 42.09 |
| 3 | 44.71 | 42.74 | 44.92 |
| Delta | 2.35 | 2.04 | 2.83 |
| Rank | 2 | 3 | 1 |
Table 12.
Table of Responses for the S/N ratio of percentage elongation parameters.
| Level | Traverse speed (mm/min) | Rotational speed (rpm) | ) |
|---|---|---|---|
| 1 | 20.29 | 21.82 | 23.39 |
| 2 | 21.78 | 24.85 | 19.35 |
| 3 | 24.33 | 19.72 | 23.65 |
| Delta | 4.03 | 5.13 | 4.30 |
| Rank | 3 | 1 | 2 |
Table 13.
Table of Responses for the S/N ratio of microhardness parameters.
| Level | Traverse speed (mm/min) | Rotational speed (rpm) | ) |
|---|---|---|---|
| 1 | 39.25 | 38.97 | 39.12 |
| 2 | 39.15 | 39.38 | 39.29 |
| 3 | 39.31 | 39.36 | 39.30 |
| Delta | 0.16 | 0.40 | 0.18 |
| Rank | 3 | 1 | 2 |
Table 14.
Contribution of individual factor to the variation of ultimate tensile strength.
| Source | Degree of freedom (DF) | Seq SS | F-value | P-value | Percentage contribution |
|
|---|---|---|---|---|---|---|
| TS (mm/min) | 2 | 10.233 | 0.47 | 0.682 | 19.3 | |
| RS (rpm) | 2 | 6.4510 | 0.29 | 0.773 | 12.8 | |
| TA () | 2 | 14.329 | 0.65 | 0.605 | 27.0 | |
| Error | 2 | 21.969 | 41.5 | |||
| Total | 8 | 52.982 | ||||
Table 15.
Contribution of individual factor to the variation of percentage elongation.
| Source | Degree of freedom (DF) | Seq SS | F-value | P-value | Percentage contribution |
|
|---|---|---|---|---|---|---|
| TS (mm/min) | 2 | 24.97 | 1.52 | 0.397 | 21.5 | |
| RS (rpm) | 2 | 39.93 | 2.43 | 0.292 | 34.4 | |
| TA () | 2 | 34.89 | 2.12 | 0.320 | 30.0 | |
| Error | 2 | 16.44 | 14.1 | |||
| Total | 8 | 116.23 | ||||
Table 16.
Contribution of individual factor to the variation of microhardness.
| Source | Degree of freedom (DF) | Seq SS | F-value | P-value | Percentage contribution |
|
|---|---|---|---|---|---|---|
| TS (mm/min) | 2 | 0.04040 | 0.14 | 0.874 | 5.792 | |
| RS (rpm) | 2 | 0.31316 | 1.12 | 0.472 | 44.89 | |
| TA () | 2 | 0.06369 | 0.23 | 0.815 | 9.131 | |
| Error | 2 | 0.28026 | 40.18 | |||
| Total | 8 | 0.69751 | ||||
Disclaimer/Publisher’s Note: The statements, opinions and data contained in all publications are solely those of the individual author(s) and contributor(s) and not of MDPI and/or the editor(s). MDPI and/or the editor(s) disclaim responsibility for any injury to people or property resulting from any ideas, methods, instructions or products referred to in the content. |
© 2024 by the authors. Licensee MDPI, Basel, Switzerland. This article is an open access article distributed under the terms and conditions of the Creative Commons Attribution (CC BY) license (http://creativecommons.org/licenses/by/4.0/).
Copyright: This open access article is published under a Creative Commons CC BY 4.0 license, which permit the free download, distribution, and reuse, provided that the author and preprint are cited in any reuse.


