

Submitted:
12 September 2024
Posted:
14 September 2024
You are already at the latest version
Abstract
Background: Obesity and Type 2 diabetes (T2D) promote inflammation, increasing the risk of colorectal cancer (CRC). High-fat diet (HFD)-induced obesity plays a key role in these diseases through biological mechanisms. This study examined the effect of genetic background on the multimorbidity of intestinal cancer, T2D, and inflammation due to HFD-induced obesity. Methods: A cohort of 357 Collaborative Cross (CC) mice from 15 lines was fed either a control chow diet (CHD) or HFD for 12 weeks. Body weight was tracked biweekly, and blood glucose was assessed at weeks 6 and 12 via intraperitoneal glucose tolerance tests (IPGTT). At the study's endpoint, intestinal polyps were counted, and cytokine profiles were analyzed to evaluate the inflammatory response. Results: HFD significantly increased blood glucose levels and body weight, with males showing higher susceptibility to T2D and obesity. Genetic variation across CC lines influenced glucose metabolism, body weight, and polyp development. Mice on HFD developed more intestinal polyps, with males showing higher counts than females. Cytokine analysis revealed diet-induced variations in pro-inflammatory markers like IL-6, IL-17A, and TNF-α, differing by genetic background and sex. Conclusions: Host genetics plays a crucial role in susceptibility to HFD-induced obesity, T2D, CRC, and inflammation. Genetic differences across CC lines contributed to variability in disease outcomes, providing insight into the genetic underpinnings of multimorbidity. This study supports gene-mapping efforts to develop personalized prevention and treatment strategies for these diseases.
Keywords:
Intestinal cancer developments
; obesity
; type 2 diabetes
; host genetic background
; collaborative cross mice
1. Introduction
Colorectal cancer (CRC) is a heterogeneous disease known as colorectal adenocarcinoma, bowel cancer, colon cancer, or rectal cancer. CRC occurs in the colon (approximately 41% in the proximal colon, approximately 22% in the distal colon, and 28% in the rectum) and parts of the gastrointestinal system [1]. According to the International Agency for Research on Cancer (IARC), it was estimated that CRC accounted for 11% of all incident cancers in the world, which made it the third most common cancer in men and the second in women and is expected to cause many deaths [2]. Nonmodifiable risk factors of CRC are related to heredity and medical history [3]. The fact that up to 30% of CRC patients have a family history of the disease makes this reason one of the most actionable risk factors [4,5,6]. Finally, most CRC clustered in families reflects the interaction between environmental factors and genetic variation [7]. The diagnosis of CRC usually starts with polyp development. This noncancerous growth develops in the inner lining of the colon or rectum and can be detected and diagnosed by colonoscopy in higher prevalence in older age groups [8].
It is believed that one of the leading causes of CRC development is obesity. Obesity is defined as an abnormal excessive accumulation of body fat and primarily assessed by body mass index (BMI). Obesity and related metabolic disturbances are closely associated with pathologies that represent a significant burden to global health. Its prevalence increased dramatically; two-thirds of the population in the U.S. are considered obese [9]. Obesity can lead to a variety of complex and serious diseases such as cardiovascular diseases, diabetes, and an increased risk of cancer development [10]. In addition, excess body fat, particularly abdominal or visceral adiposity, can cause metabolic syndrome, characterized by disturbance of triglyceride, dyslipidemia, and dysglycemia [11,12,13]. Moreover, it increases the chance of insulin resistance, which is a significant factor in developing type 2 diabetes (T2D). Insulin resistance in obesity and diabetes is caused by a decreased insulin stimulant glucose transporter, metabolism in adipocytes, skeletal muscle and by suppression of hepatic glucose secretion [14].
High-fat diet (HFD) plays a part in the disease risk for obesity and T2D through biological mechanisms, including inflammation. Particularly, elevated levels of saturated fatty acids (SFA) correlate with the production of inflammatory cytokines [15]. A large body of evidence exists showing that inflammation drives the development of insulin resistance by pro-inflammatory mediators. Exemplifying the role of these pro-inflammatory factors in the pathogenesis of T2D is a mouse model of diet-induced obesity, where inhibition of TNF-α prevents the onset of obesity-associated insulin resistance [16,17]. Reciprocally, T2D leads to a hyperinflammatory response to the body organs and impairs the resolution of inflammation and tissue repair, which accelerates the effect of cell proliferation. The relationship between BMI and CRC development was previously studied in animal models in both APCmin mice, a model for spontaneous colorectal cancer development, and mice treated with azoxymethane, a carcinogen used to induce colorectal cancer. It was observed that after feeding these mice a high-fat diet, their BMI increased and the colon polyp formation [18,19]. Epidemiological and molecular evidence links obesity and metabolic status with inflammation and increased risk of T2D and other chronic diseases. Hyperglycemia associated with T2D can activate several pathways that increase inflammation, oxidative stress, and apoptosis [20]. The presence of inflammatory cytokines, including elevation in serum levels of IL-6 and TNF-ά, has been demonstrated in diabetes and obesity [21].
Systems genetics is an approach to understanding the flow of biological information that underlies complex traits. The advantage of systems genetics is that it allows an analysis of molecular interactions in a context that is the most relevant to the clinical trait, namely, multiple genetic perturbations (as in a natural population) rather than an individual genetic perturbation (as in a transgenic mouse) [22]. Comparative mapping showed that mouse models can recapitulate human conditions and that the majority of genes in mice have orthologous in the human genome [23]. Finally, previous studies of familial heritability and genome-wide associations study (GWAS) had confirmed a significant role of genetic factors in CRC development [24], and these findings support our research rationale and the design. The rationale behind this study was to explore the genetics of host susceptibility to the multimorbidity of T2D, Obesity, and intestinal cancer to a high-fat diet in a cohort of CC lines.
To comprehend the host immune response, animal models are essential [25,26]. The scientific team must determine whether sufficient data to support using an animal model for research, whether ethical concerns are addressed, and whether the information gathered from animal work will significantly advance scientific understanding before selecting an animal model for study [27]. To create the disease state, these models require artificial manipulation of the host and may range from fish to mice [28,29]. In previous report, it was demonstrated that genetically highly diverse sets of recombinant inbred mouse lines (RIL) can be used as a platform for the identification of risk genes in complex human diseases [30,31]. Recently, a mouse genetically diverse RIL, named the Collaborative Cross (CC), the next generation of mouse genetic reference population, allows time and cost-efficient mapping of target regions as quantitative trait loci (QTLs) that are responsible for the genetic variance of a specific complex trait [30,32]. The CC is a large panel of recombinant inbred (RI) mouse strains derived from a highly genetically diverse set of eight founders. Three founders of the CC strain are wild-derived, and five of the m are of inbred lines. A specific strategic breeding method was developed to create the genomes of all the CC founder strains.
Previous results and reports from our research, of using the CC mouse model population, confirmed that different CC lines respond differently to HFD, where male and female mice of the different CC lines varied significantly in T2D development and progression response to diet challenges, chow diet (CHD) and HFD. Furthermore, a result from a recent study from our lab has shown the effect of the host genetic background on the comorbidity between T2D and obesity [33,34]. Finally, to study the multimorbidity of obesity and T2D developments due to high fat diet, and intestinal cancer, we assessed CC mice that provide a unique and powerful platform and resource as a step towards identifying the role of genetic factors underlying this multimorbidity.
2. Material and Methods
2.1. Ethical statement
It is essential to state that all experiments involving animals in this research are compatible with the national standards for the care and use of laboratory animals and were approved by the Institutional Animal Care and Use Committee (IACUC) of Tel Aviv University, Israel, with approval ID: 01-19-013 and 01-20-015.
2.2. Collaborative Cross Mouse Study Cohort
The study was conducted on 357 genetically different CC mice originating from 15 different CC lines of both sexes to assess the development of intestinal polyps. The CC mice were supplied by the animal facility of Tel Aviv University and raised in the facility. They were maintained under the ethical standards of humidity and temperature (21-23 °C). The use and distribution of mice in different experimental groups have been presented in Supplementary Table 1 A-C.
2.3. Study Design
The experiment begins when the mice reach the age of 8 weeks, for 12 weeks. During this period, some mice were on a standard chow diet (CHD), while others were on a high-fat diet (HFD). In addition, body weight was recorded bi-weekly, and at the end of the study, a glucose tolerance test and tissue collection (small intestine and colon) were conducted.
2.4. Dietary Challenge
Mice were weaned at the age of 4 weeks and maintained until eight weeks of age on a standard rodent chow diet (TD.2018SC, 18% Kcal from fat, 24% from protein, and 58% from carbohydrates (Teklad Global, Harlan Inc., Madison, WI, USA)). the experiment began when the mice were eight weeks old. Half of the experimental mice were maintained on CHD throughout the experiment. In contrast, the second half was transferred to a High-fat Western diet (TD. 88137, 42.0% Kcal from fat, 15.3% from protein, and 42.7% from carbohydrates, mainly sucrose, (Teklad Global, Harlan Inc)) and maintained on it for 12 weeks.
2.5. Intraperitoneal Glucose Tolerance Test (IPGTT)
IPGTT was used to detect disturbances in glucose metabolism (Blood Glucose (BG) level) and reveal instances of Type 2 Diabetes among the groups. IPGTT on the experimental and control mice was conducted at two-time points during the experiment (weeks 6 and 12 starting from week 8, referred to as week 0). The body's response to a glucose load was assessed during 3 hours of IPGTT. At each time, the mice were deprived of food for six hours (6:00 am-12:00 am), with free access to water. Then, blood glucose (fasting blood glucose) was determined, and a solution of glucose (2.5gm glucose per kg) was administered by intraperitoneal (IP) injection. Blood glucose levels were measured at different time points during the following 3 hrs. (times 0, 15, 30, 60, 120, and 180 min after glucose injection). After the IPGTT assessment, the mice were returned to their cages with free access to food and water for overnight recovery.
2.6. Tissue Collection
At the terminal point of the experiment (20 weeks mice), the mice from different lines were sacrificed by CO2, weighted, and the tissues, including the Spleen, Liver, Kidneys, Intestines, and whole blood, for serum preparation.
2.7. Area Under the Curve (AUC)
AUC was calculated using the trapezoid role from 0 to 180 min after glucose injection to evaluate glucose clearance activity quantitatively. AUC between any two-time points is calculated as (Time difference in minutes between sequential reads) *(Glucose level 1st time point + Glucose level 2nd time point)/2). The total AUC value of the 180 minutes IPGTT will be calculated as the sum of the AUC between each two-time point, total AUC0-180 = AUC0-15 + AUC15-30 + AUC30-60 + AUC60-120 + AUC120 [32].
2.8. Polyp Count in Small and Large Intestine
After 12 weeks of the experimental period, the mice were terminated, and the small intestines and colon were extracted. The weight of the small and colon was determined, and the small intestines were divided into three segments (SB1, 2, and 3), while the colon was kept as a whole and spread over 3mm paper. The intestines were fixated in 10% Neutral Buffered Formalin (NBF) overnight and stained by methylene blue, as shown in Supplementary Figure 1. The samples were then examined by binuclear. The number and sizes of polyps in each of the four intestinal regions will be recorded as described in Rudling et al. [35] and Dorman et al. [36]. Supplementary Figure 1 shows the polyp counts process of CC lines maintained on 42% HFD for 12 weeks on CHD. The polyp number was used as a trait for assessing the severity of intestinal cancer development.
Figure 1.
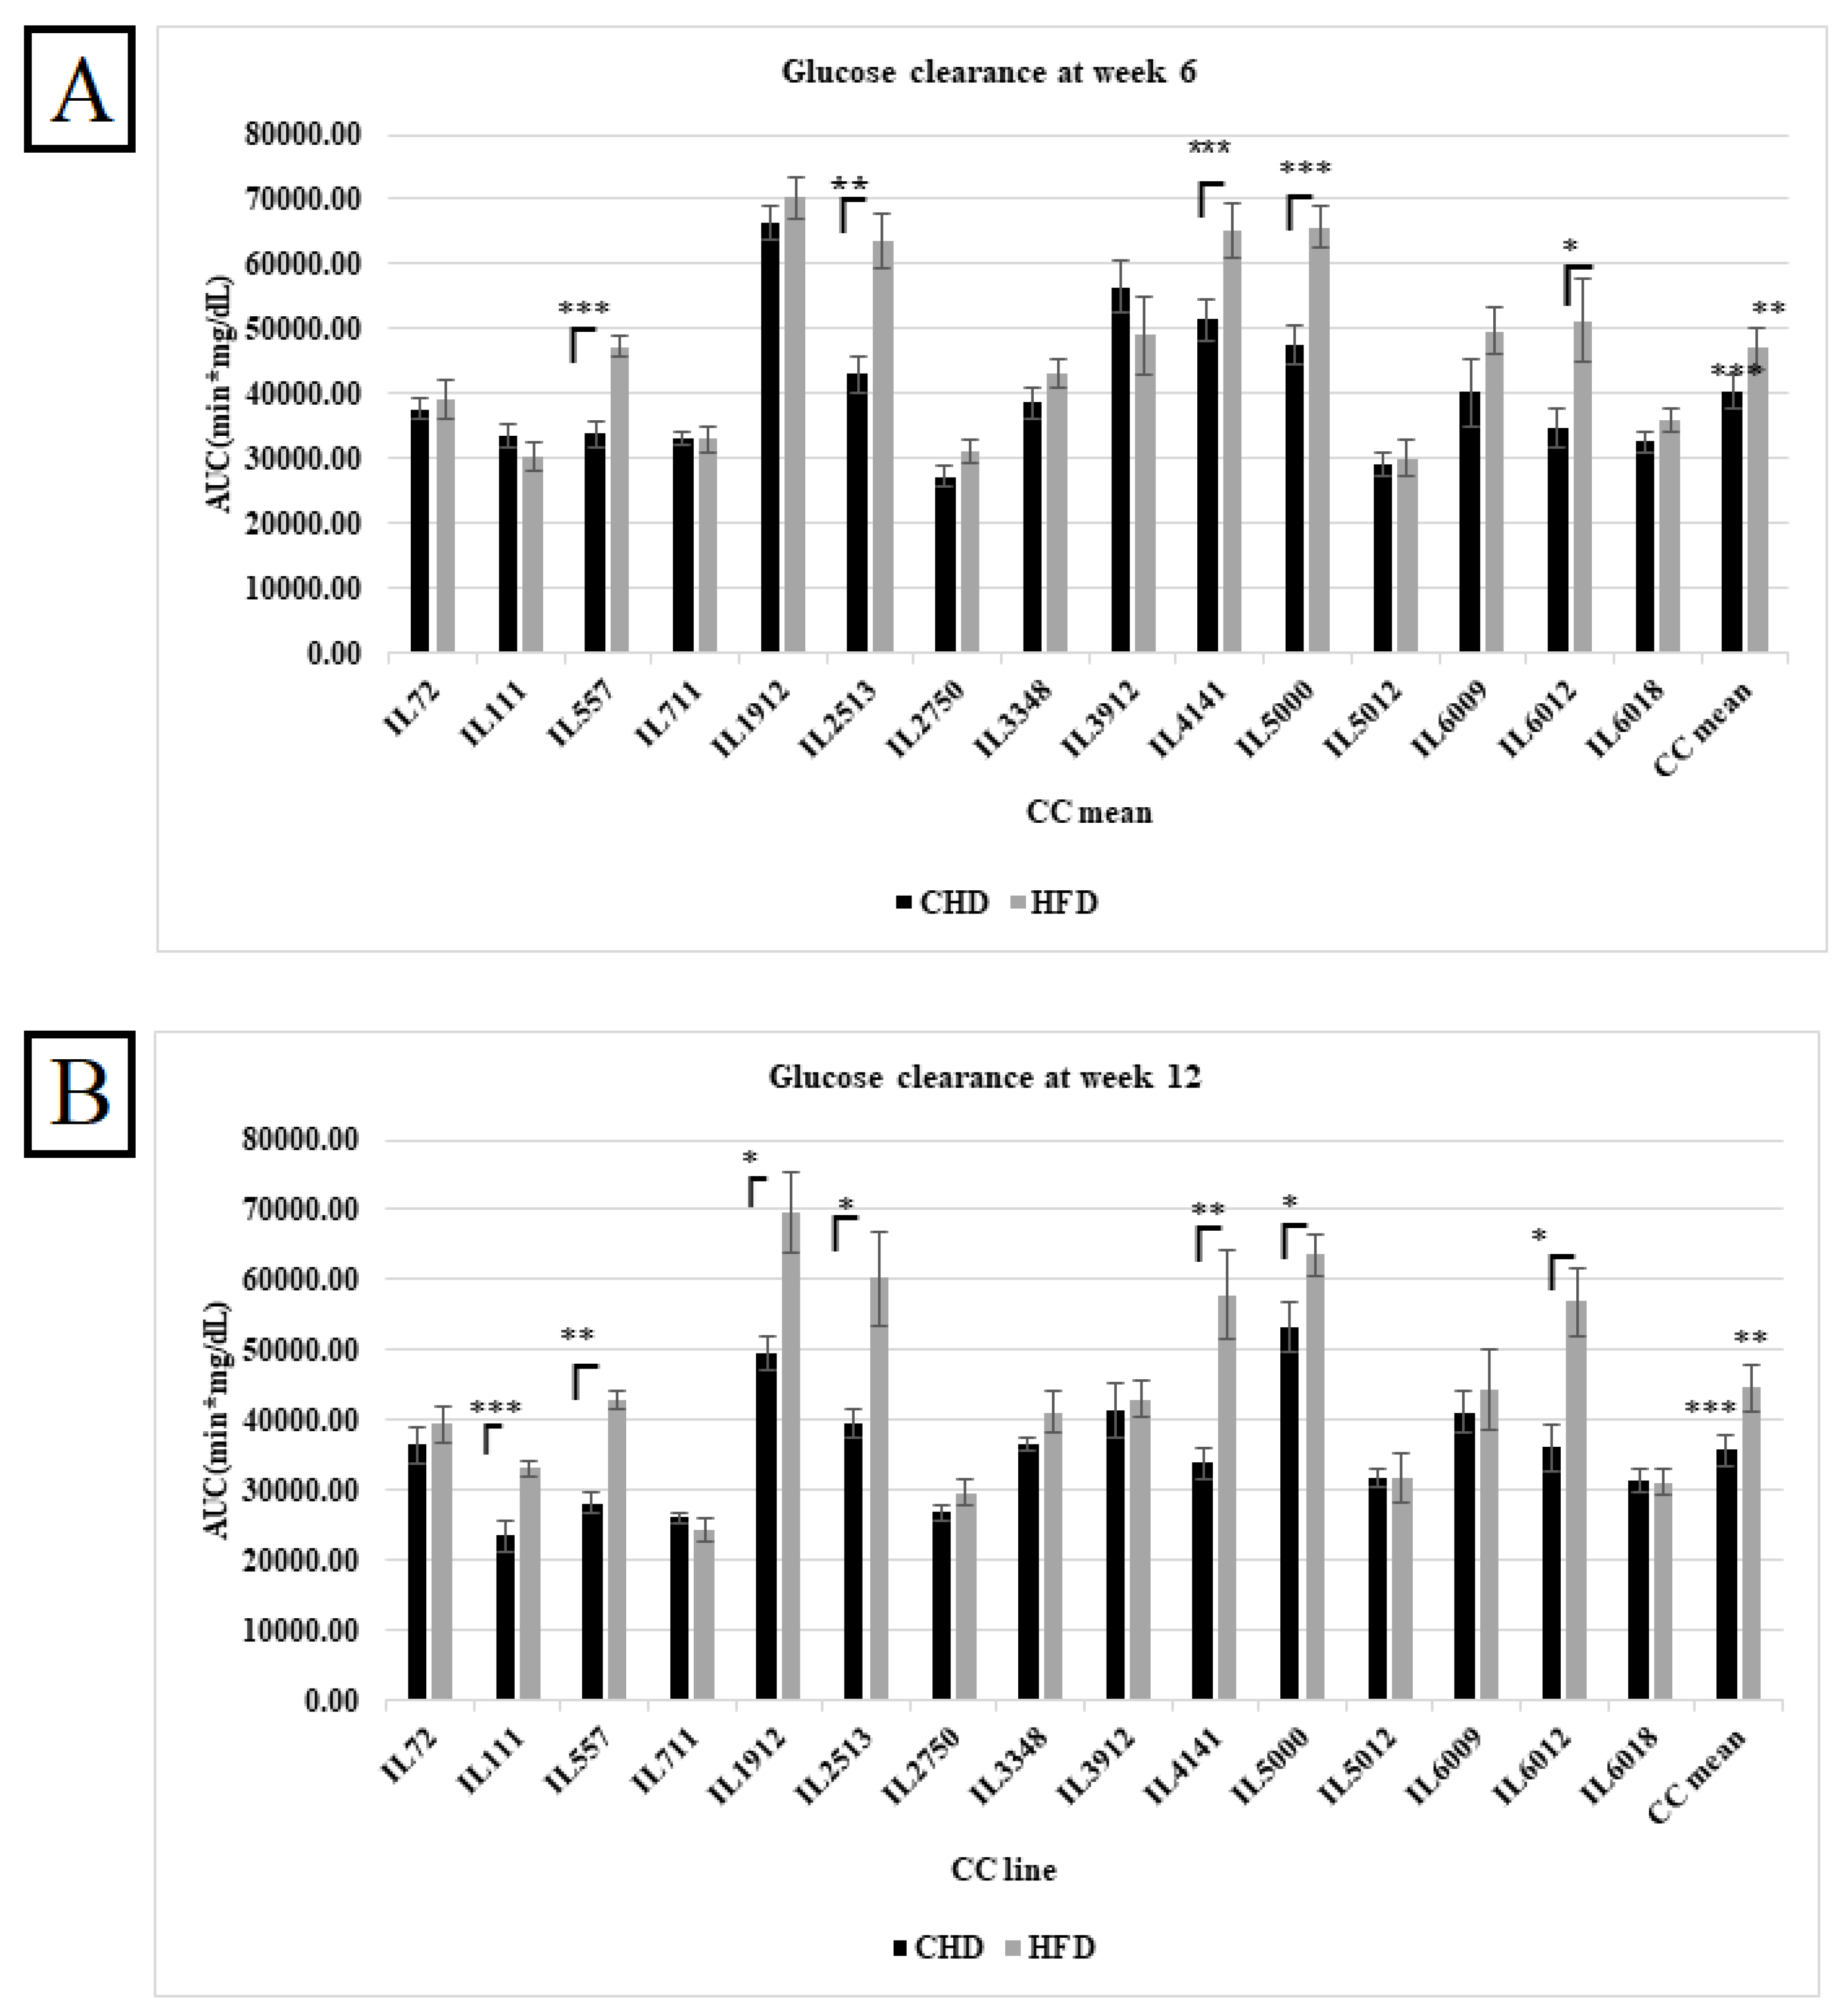
A. Total AUC (min*mg\dl) in the overall population of fifteen different CC lines following six weeks of dietary challenge HFD Vs. CHD in the overall population. The X-axis represents the different CC lines, and the Y-axis represents the AUC values. Data analyzed by One-way Analysis of Variation (ANOVA) P < 0.05. B. Total AUC (min*mg\dl) in the overall population of fifteen different CC lines following six weeks of dietary challenge HFD Vs. CHD in the overall population. The X-axis represents the different CC lines, and Y- axis represents the total AUC values (min*mg\dl). Data was analyzed by One-way Analysis of Variation (ANOVA) with P < 0.05.
Figure 1.
A. Total AUC (min*mg\dl) in the overall population of fifteen different CC lines following six weeks of dietary challenge HFD Vs. CHD in the overall population. The X-axis represents the different CC lines, and the Y-axis represents the AUC values. Data analyzed by One-way Analysis of Variation (ANOVA) P < 0.05. B. Total AUC (min*mg\dl) in the overall population of fifteen different CC lines following six weeks of dietary challenge HFD Vs. CHD in the overall population. The X-axis represents the different CC lines, and Y- axis represents the total AUC values (min*mg\dl). Data was analyzed by One-way Analysis of Variation (ANOVA) with P < 0.05.
2.9. Heritability
Heritability measures the fraction of phenotype variability attributed to genetic variation. Here, we used the ANOVA results to calculate the broad-sense heritability using the formula below:
3. Results
This study assessed 357 CC mice originating from 15 genetically different CC lines. The mice were divided into four dietary challenge groups. The total number of females and males were 168 and 189, respectively, with an average of 10 mice per line in each group. Briefly, the 357 mice were maintained for 12 weeks under two different dietary challenges of HFD Vs CHD. The four groups (female HFD, CHD, and male HFD, CHD) undergo IPGTT at two different time points at weeks 6 and 12 and are presented as areas under the curve (AUC) to assess the effect of diet on glucose clearance and diabetes development. Furthermore, the body weight of the mice was bi-weekly evaluated to define the impact of diet on body weight and obesity development. At the endpoint of the experiment, small and large intestines were extracted for polyp count.

Table 1.
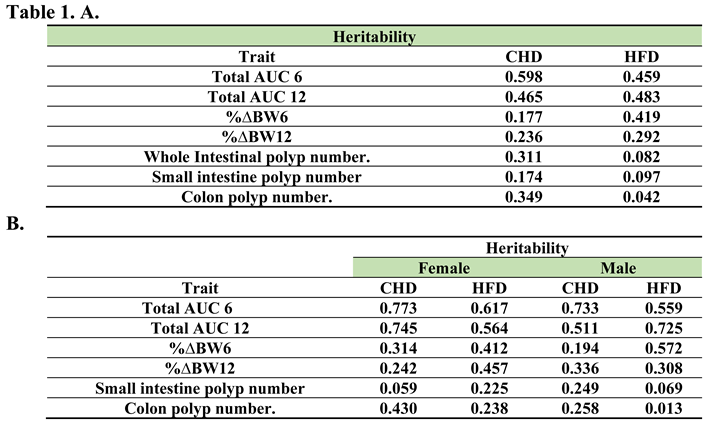
A. Heritability values for all tested traits (%ΔBW6-12, total AUC6-12, whole intestinal polyp number, small intestine polyp number, colon polyp number and alveolar bone volume for both diets. Heritability was calculated from the ANOVA results using the formula . The values range between (-1,1). B. Heritability values for all tested traits (%ΔBW6-12, total AUC6-12, whole intestinal polyp number, small intestine polyp number, colon polyp number and alveolar bone volume for both diets and sexes separately. Heritability was calculated by the ANOVA results using the formula . The values range between (-1,1).
Table 1.
A. Heritability values for all tested traits (%ΔBW6-12, total AUC6-12, whole intestinal polyp number, small intestine polyp number, colon polyp number and alveolar bone volume for both diets. Heritability was calculated from the ANOVA results using the formula . The values range between (-1,1). B. Heritability values for all tested traits (%ΔBW6-12, total AUC6-12, whole intestinal polyp number, small intestine polyp number, colon polyp number and alveolar bone volume for both diets and sexes separately. Heritability was calculated by the ANOVA results using the formula . The values range between (-1,1).
3.1. Assessments of Glucose Clearance in CC cohort as a Response to Diet at Different Time Points
After weeks 6 and 12 of the experiment, an IPGTT) for 180 min of the different CC lines under HFD and CHD was performed to assess the diabetogenic response. These results were converted into the total AUC of the different CC lines under HFD and CHD. The results in Figures 1A and 1B show the effect of HFD and CHD on glucose clearance in different CC lines at weeks 6 and 12, respectively, regardless of sex. Overall, results displayed an elevation in total AUC on HFD compared with CHD with P values < 0.01, as shown in Figure 1. In week 6, five different CC lines, including IL557, IL2513, IL4141, IL5000, and IL6012, displayed a significant increase in AUC under HFD compared to CHD. These differences between the CC lines indicate the importance of the host's genetic background in determining the response to the same stimulant.
3.2. Glucose Tolerance Assessments in Response to Diet and Sex at Different Time Points
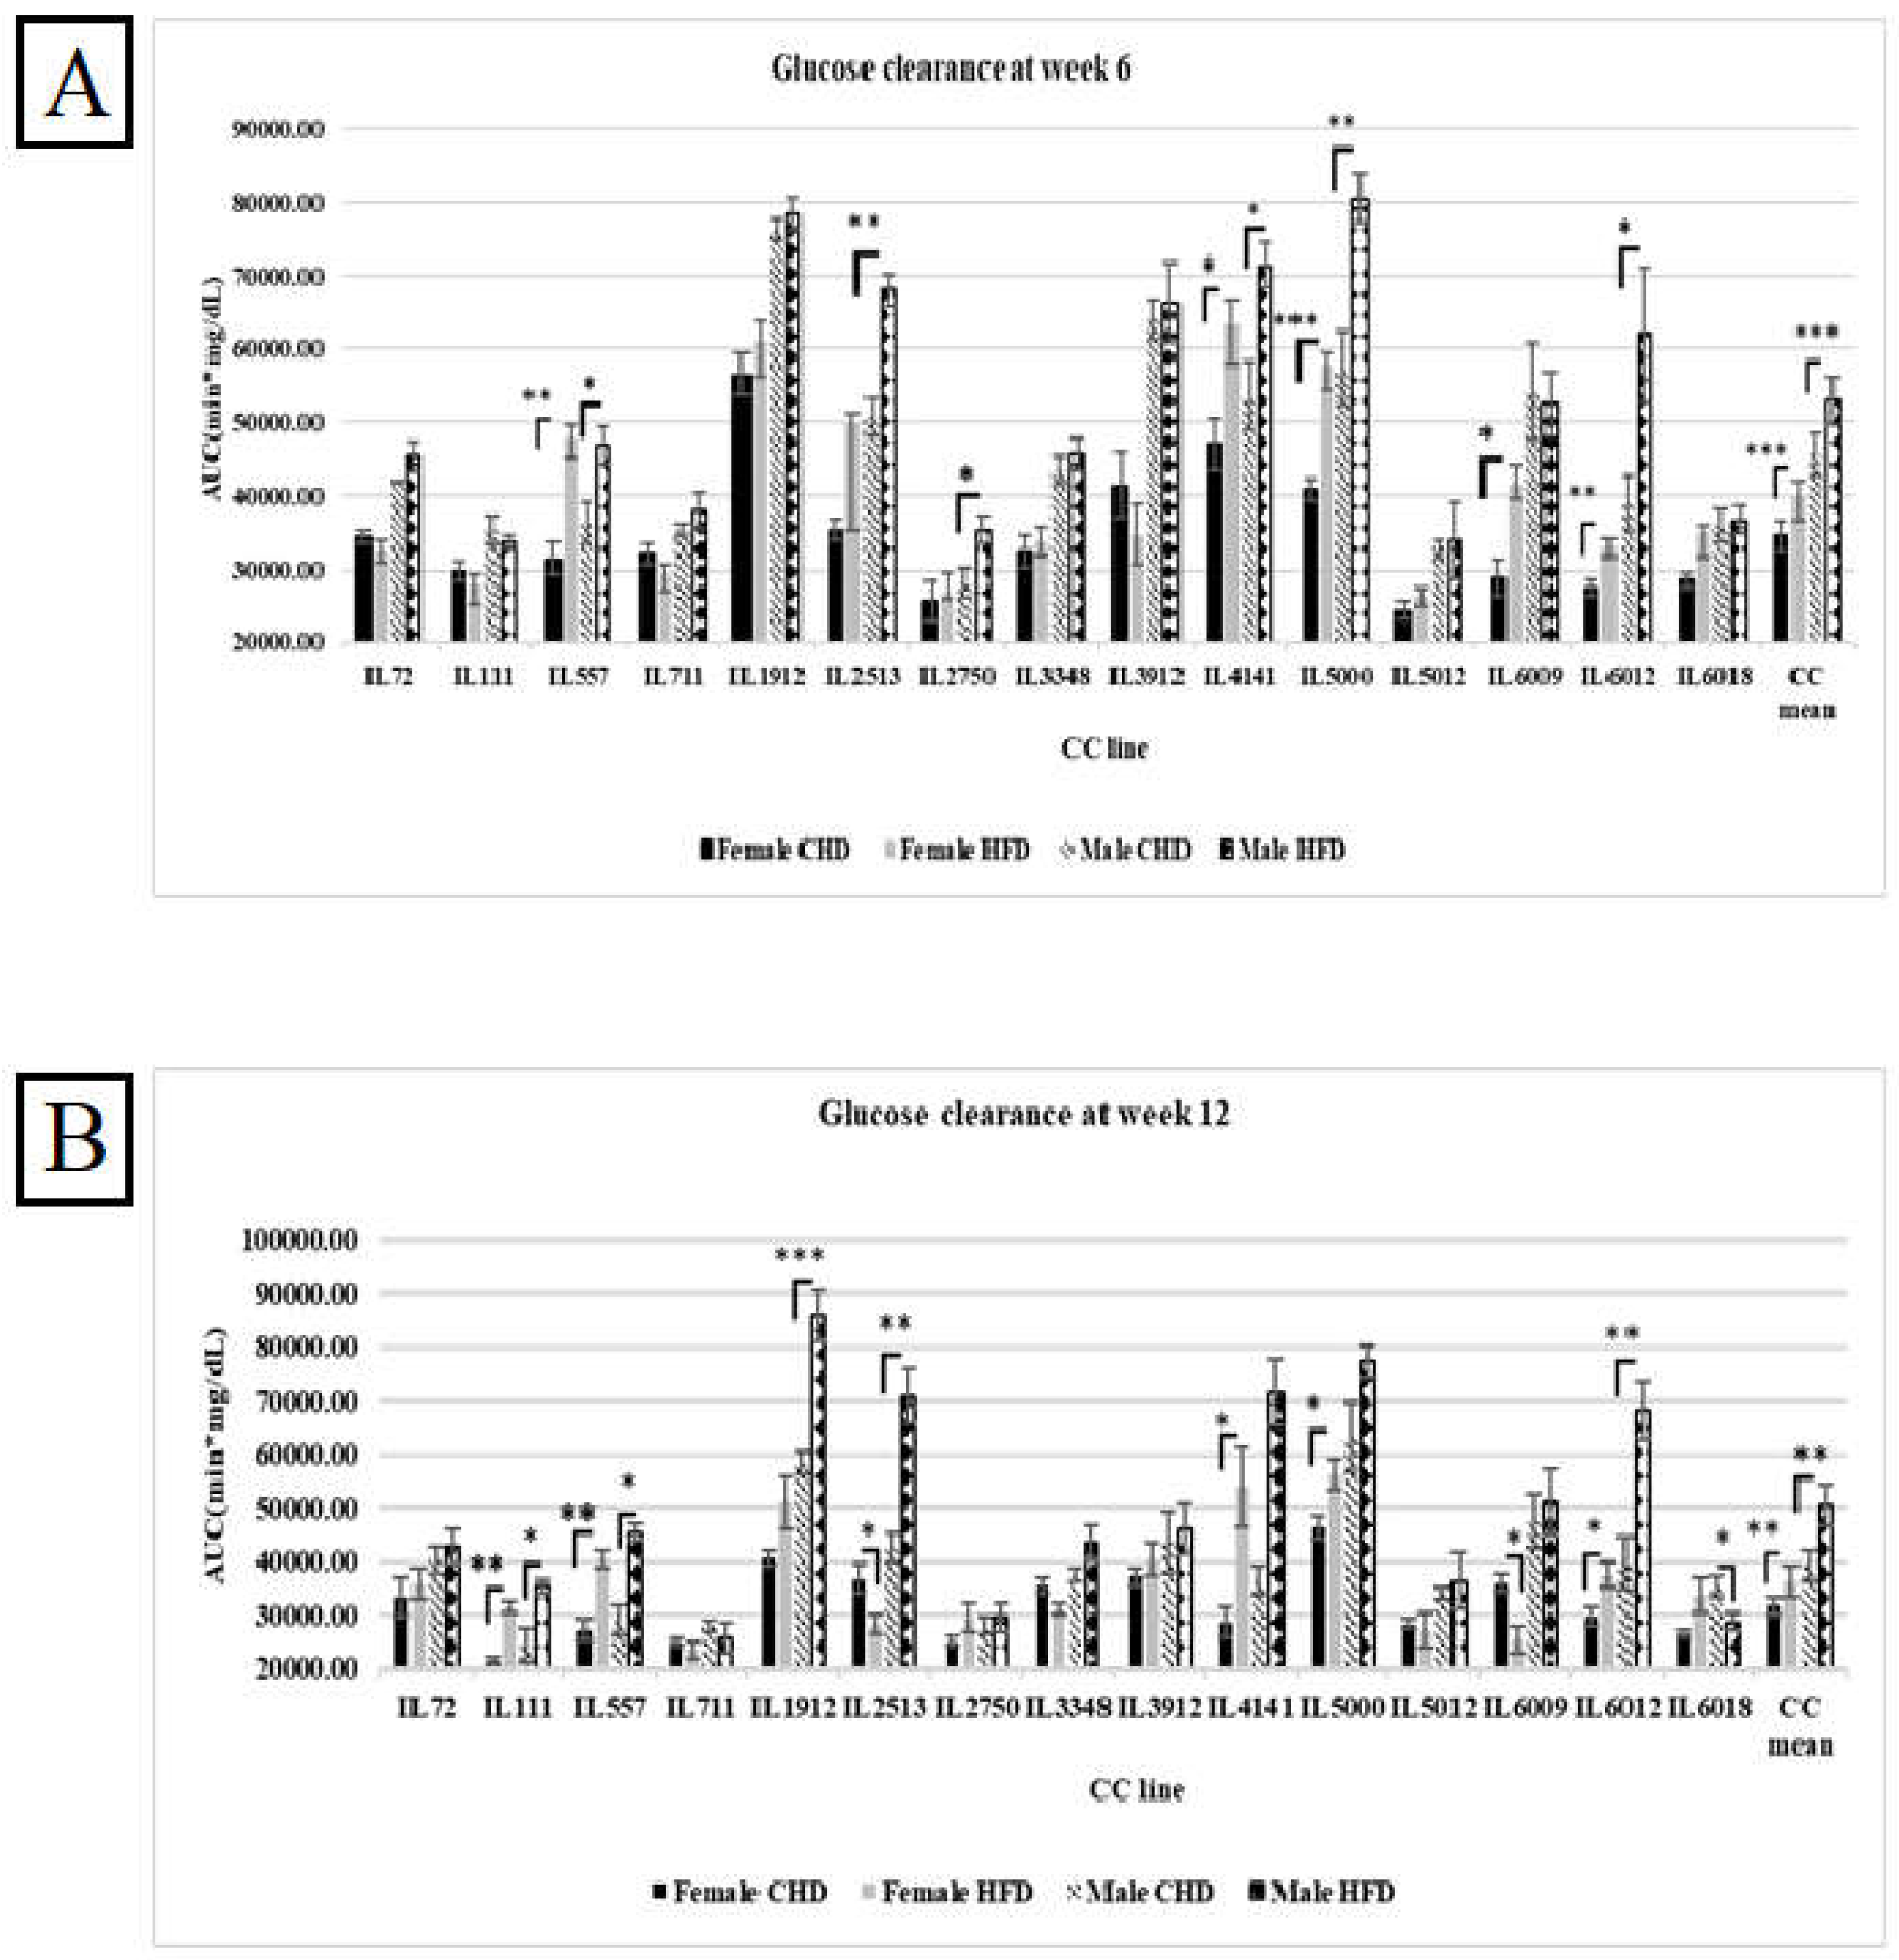
Our results have shown variation between the different CC lines and among both sexes as a response to HFD and CHD. As shown in Figure 2A, at week 6, the total AUC in the overall female and male populations was significantly higher in response to HFD (40054.48± 3425.76(mg/dL*min), 52995.45±3281.15 (mg/dL*min), respectively). On the other hand, the male population showed slower glucose clearance, with total AUC values higher than in the female population. This result supports the evidence that males are more susceptible to developing T2D than females. Moreover, females of five different CC lines (IL557, IL4141, IL5000, IL6009, and IL6012) showed a significant increase in total AUC values in response to HFD with P values < 0.05. In contrast, CC lines (IL3912, IL72, IL111, and IL711) showed an opposite effect. Regarding the male population, five different CC lines (IL 557, IL2513, IL4141, IL5000, IL6012) showed significant elevation in total AUC values with P value <0.05 due to HFD intake. However, in the male population, the total AUC of the same CC lines decreased in total AUC under HFD maintenance Vs. CHD maintenance 52565.62(mg/dL*min) Vs. 54118.12(mg/dL*min), respectively. Interestingly, after another six weeks under HFD, some of the CC lines of both populations behaved differently, as shown in Figure 2B. The total AUC at week 12 in the female population of lines IL2513, IL6009, and IL6018 decreased due to HFD and increased under CHD compared with the total AUC at week 6. In addition, more CC lines showed an increase in total AUC at week 12, like IL111, in both populations. These variations in glucose clearance under the same environmental factors support the effect of genetic factors as well as sex effect on T2D development.
Figure 2.
A. Total AUC (min*mg\dl) of fifteen different CC lines following six weeks of dietary challenge HFD Vs. CHD in male and female populations. The X-axis represents the different CC lines, and the Y-axis represents the AUC values. Data was analyzed by One-way Analysis of Variation (ANOVA) P < 0.05. B. Total AUC (min*mg\dl) of fifteen different CC lines following four months of dietary challenge HFD Vs. CHD in male and female populations. The X-axis represents the different CC lines, and the Y- Y-axis represents the AUC values. Data was analyzed by One-way Analysis of Variation (ANOVA) P < 0.05.
Figure 2.
A. Total AUC (min*mg\dl) of fifteen different CC lines following six weeks of dietary challenge HFD Vs. CHD in male and female populations. The X-axis represents the different CC lines, and the Y-axis represents the AUC values. Data was analyzed by One-way Analysis of Variation (ANOVA) P < 0.05. B. Total AUC (min*mg\dl) of fifteen different CC lines following four months of dietary challenge HFD Vs. CHD in male and female populations. The X-axis represents the different CC lines, and the Y- Y-axis represents the AUC values. Data was analyzed by One-way Analysis of Variation (ANOVA) P < 0.05.
3.3. Effect of HFD on the Body Weight Changes at Two Different Time Points
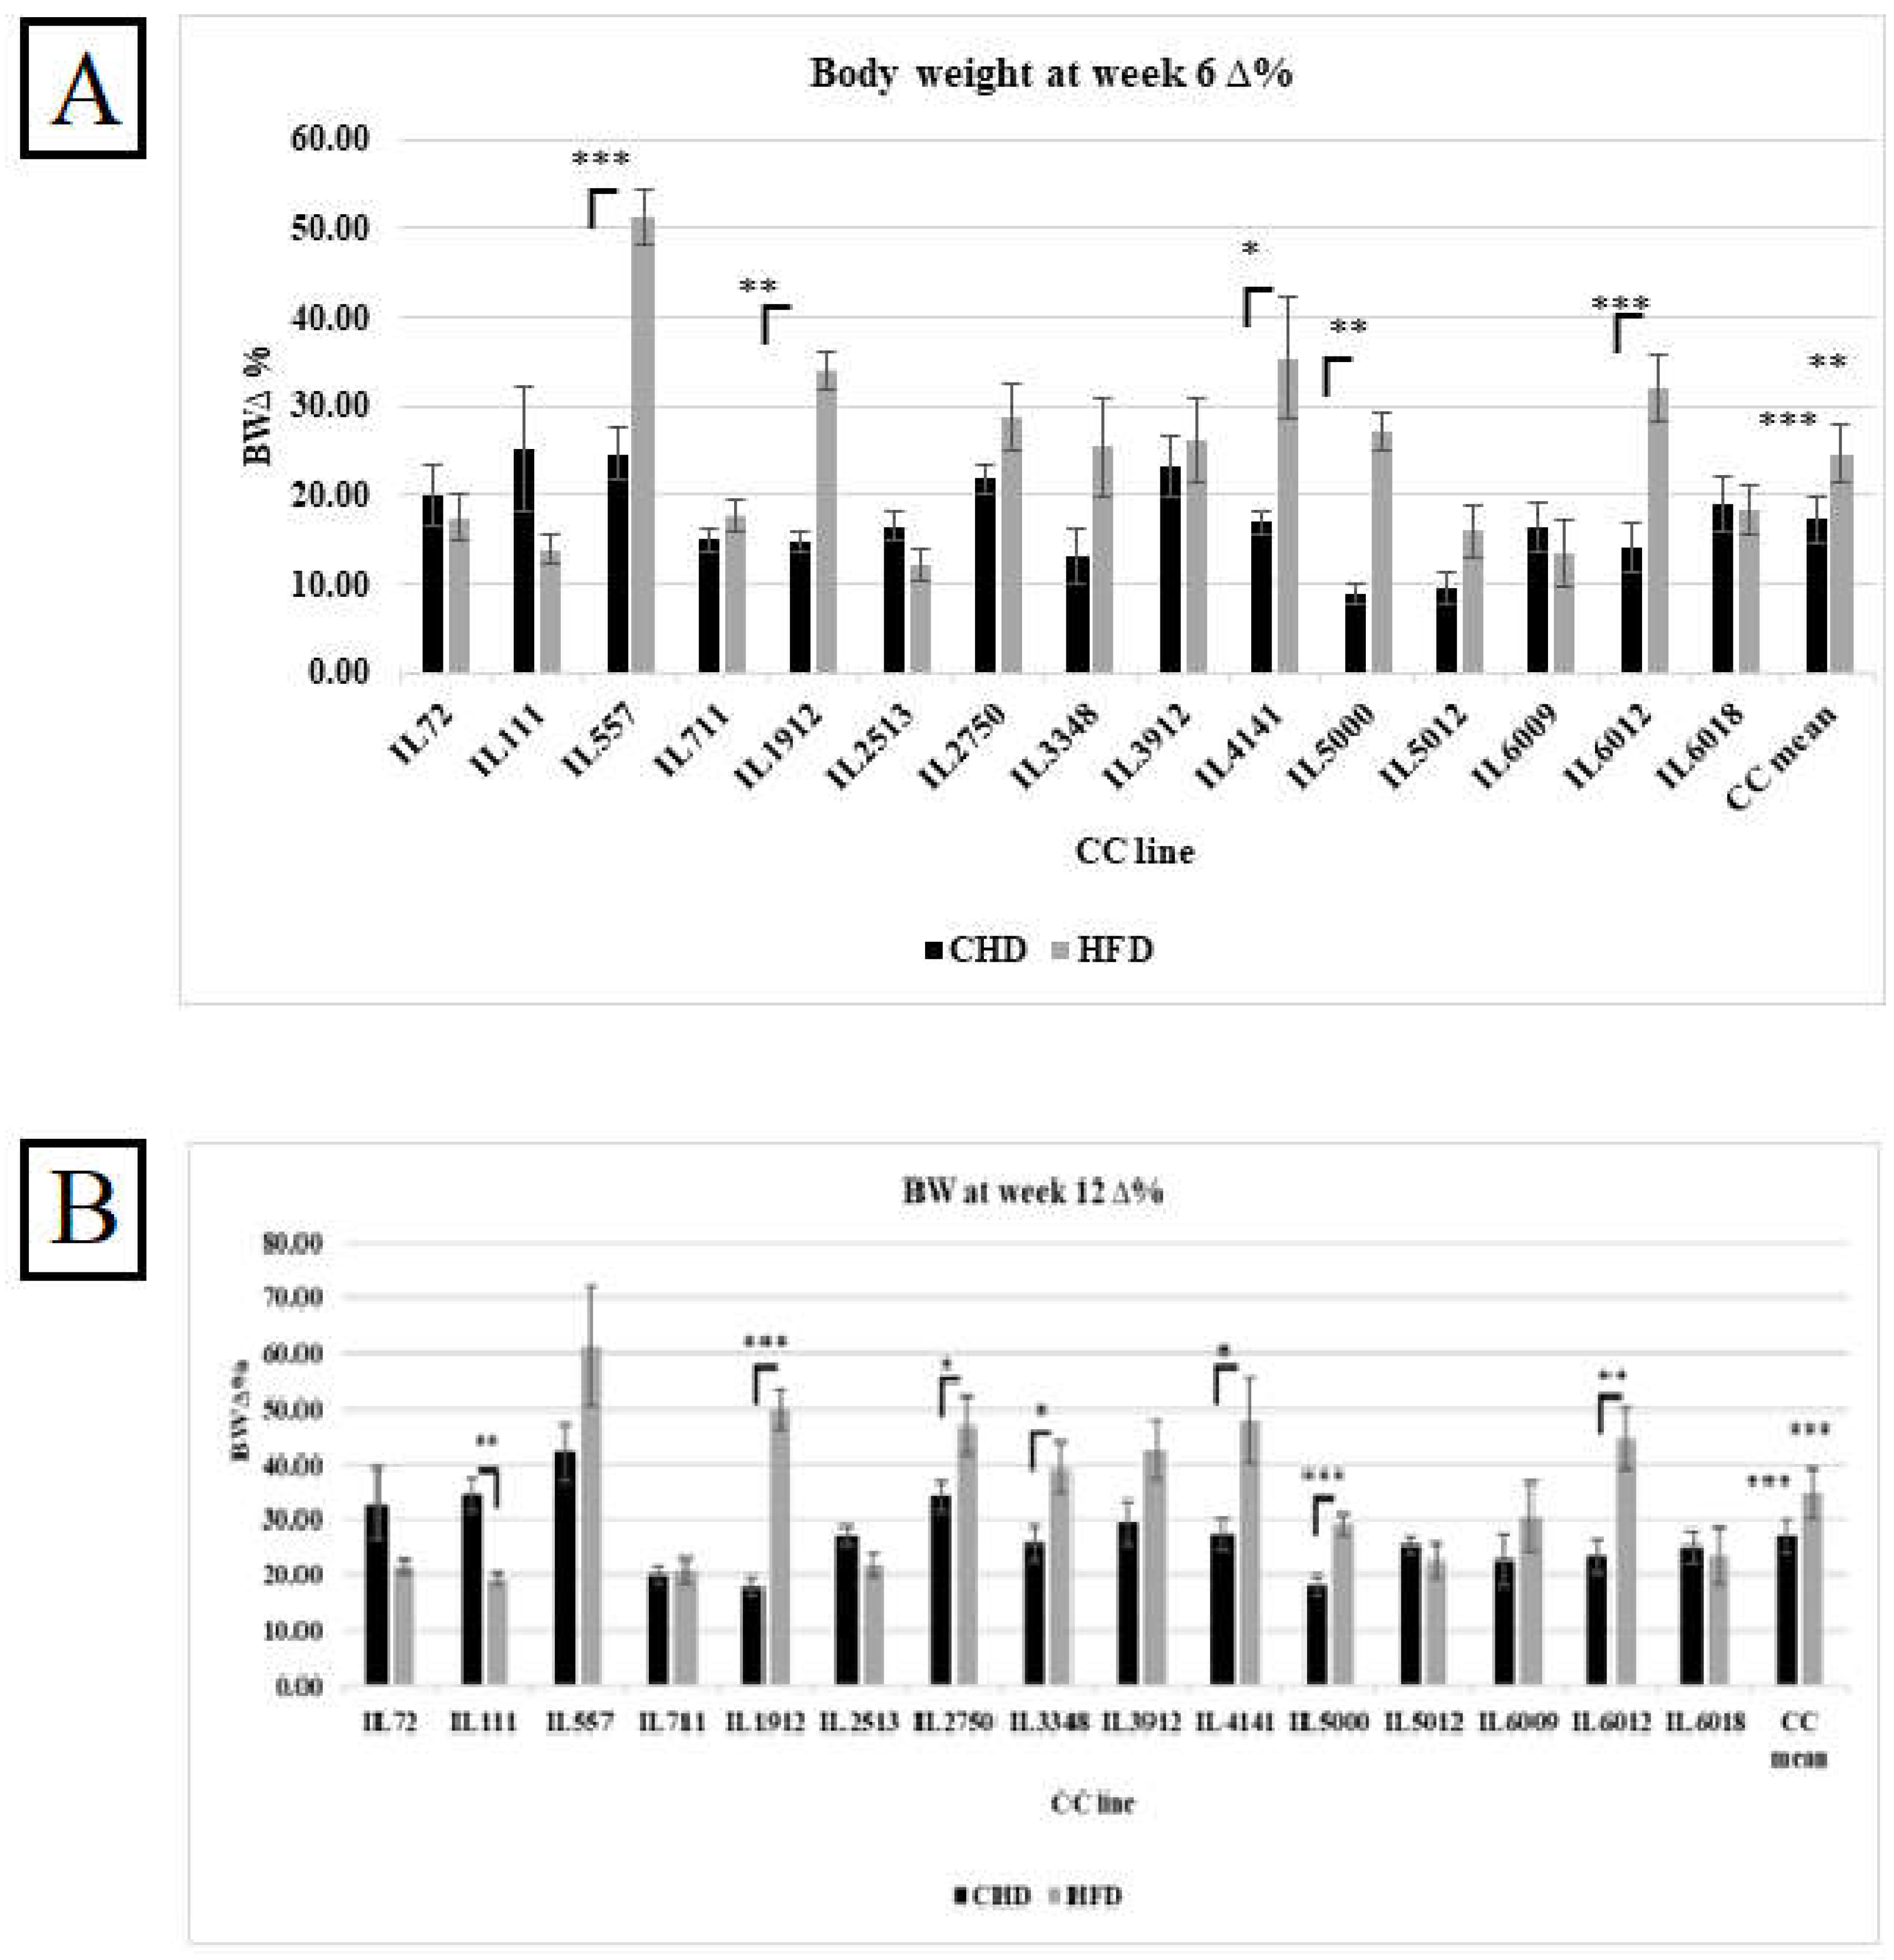
The %ΔBW reflects the percentage of body weight change due to CHD and HFD consumption at two different experimental time points of 15 different CC lines, as presented in Figures 3A and 3B respectively. The entire population has shown a significant increase in %ΔBW on HFD compared with CHD at both experimental time points. Additionally, individual CC lines displayed different responses to HFD. On the one hand, CC lines IL557, IL1912, IL4141, IL5000, and IL6012 increased significantly in %ΔBW on HFD in both weeks compared with CHD. On the other hand, IL111 revealed the opposite response. The %ΔBW decreased significantly on HFD at week 12 compared with CHD (19.26 Vs. 34.62, respectively). The main reason for this variation and dissimilarity between the CC lines is the genetic background of each CC line.
Figure 3.
A. Percentage body weight changes (%ΔBW ) following six weeks of diet challenge ( CHD Vs. HFD) for the entire population of fifteen different CC lines (The X-axis). The Y-axis represents %ΔBW calculated as BW6(g) -BW0 (g)/BW0*100. B. Percentage body weight changes (%ΔBW ) following 12 weeks of diet challenge ( CHD Vs. HFD) for the entire population of fifteen different CC lines (The X-axis). The Y-axis represents %ΔBW calculated as BW12(g) -BW0 (g)/BW0*100.
Figure 3.
A. Percentage body weight changes (%ΔBW ) following six weeks of diet challenge ( CHD Vs. HFD) for the entire population of fifteen different CC lines (The X-axis). The Y-axis represents %ΔBW calculated as BW6(g) -BW0 (g)/BW0*100. B. Percentage body weight changes (%ΔBW ) following 12 weeks of diet challenge ( CHD Vs. HFD) for the entire population of fifteen different CC lines (The X-axis). The Y-axis represents %ΔBW calculated as BW12(g) -BW0 (g)/BW0*100.
3.4. Effect of HFD and Sex on the Body Weight Changes at Two Different Time Points
The results showed an effect of HFD on body weight changes, variability in response between the different CC lines, and differences among both populations. As presented in Figure 4A, both populations maintained for six weeks under HFD showed elevation in body weight changes compared with CHD, while the male population showed more susceptibility to HFD compared with the female population, with an average of 25.81% and 22.88%, respectively. However, some CC lines behaved differently on HFD consumption, and the body weight change decreased significantly, like the CC line IL6009, with an average of 16.15% on CHD and 3.56% on HFD. Regarding the male population, the dissimilarity between the CC lines was also observed significantly. Some lines showed a decrease in body weight change, such as line IL6018, with an average of 22.12% on CHD, 11.69% on HFD, IL111 30.67% on CHD, and Vs.11.76% on HFD. After 12 weeks, the CC mice respond strongly to HFD intake. As shown in Figure 4B, the %ΔBW12 of both populations increased significantly to 33.24% in females and 35.85% in males due to HFD. Furthermore, the maintenance of the mice on HFD for an additional six weeks led to new results and variations between the different CC lines. For example, four CC lines in the male population, IL72, IL111, IL2513, and IL6018, decreased significantly under HFD compared with CHD with a P value < 0.05, as presented in Supplementary Table S2. In the female population, the %ΔBW of IL 5012 increased significantly on HFD at week 12 than its value at week 6 (27.59% and 18.88%, respectively).
3.5. Intestinal Polyp Development due to HFD Consumption in Different CC Lines
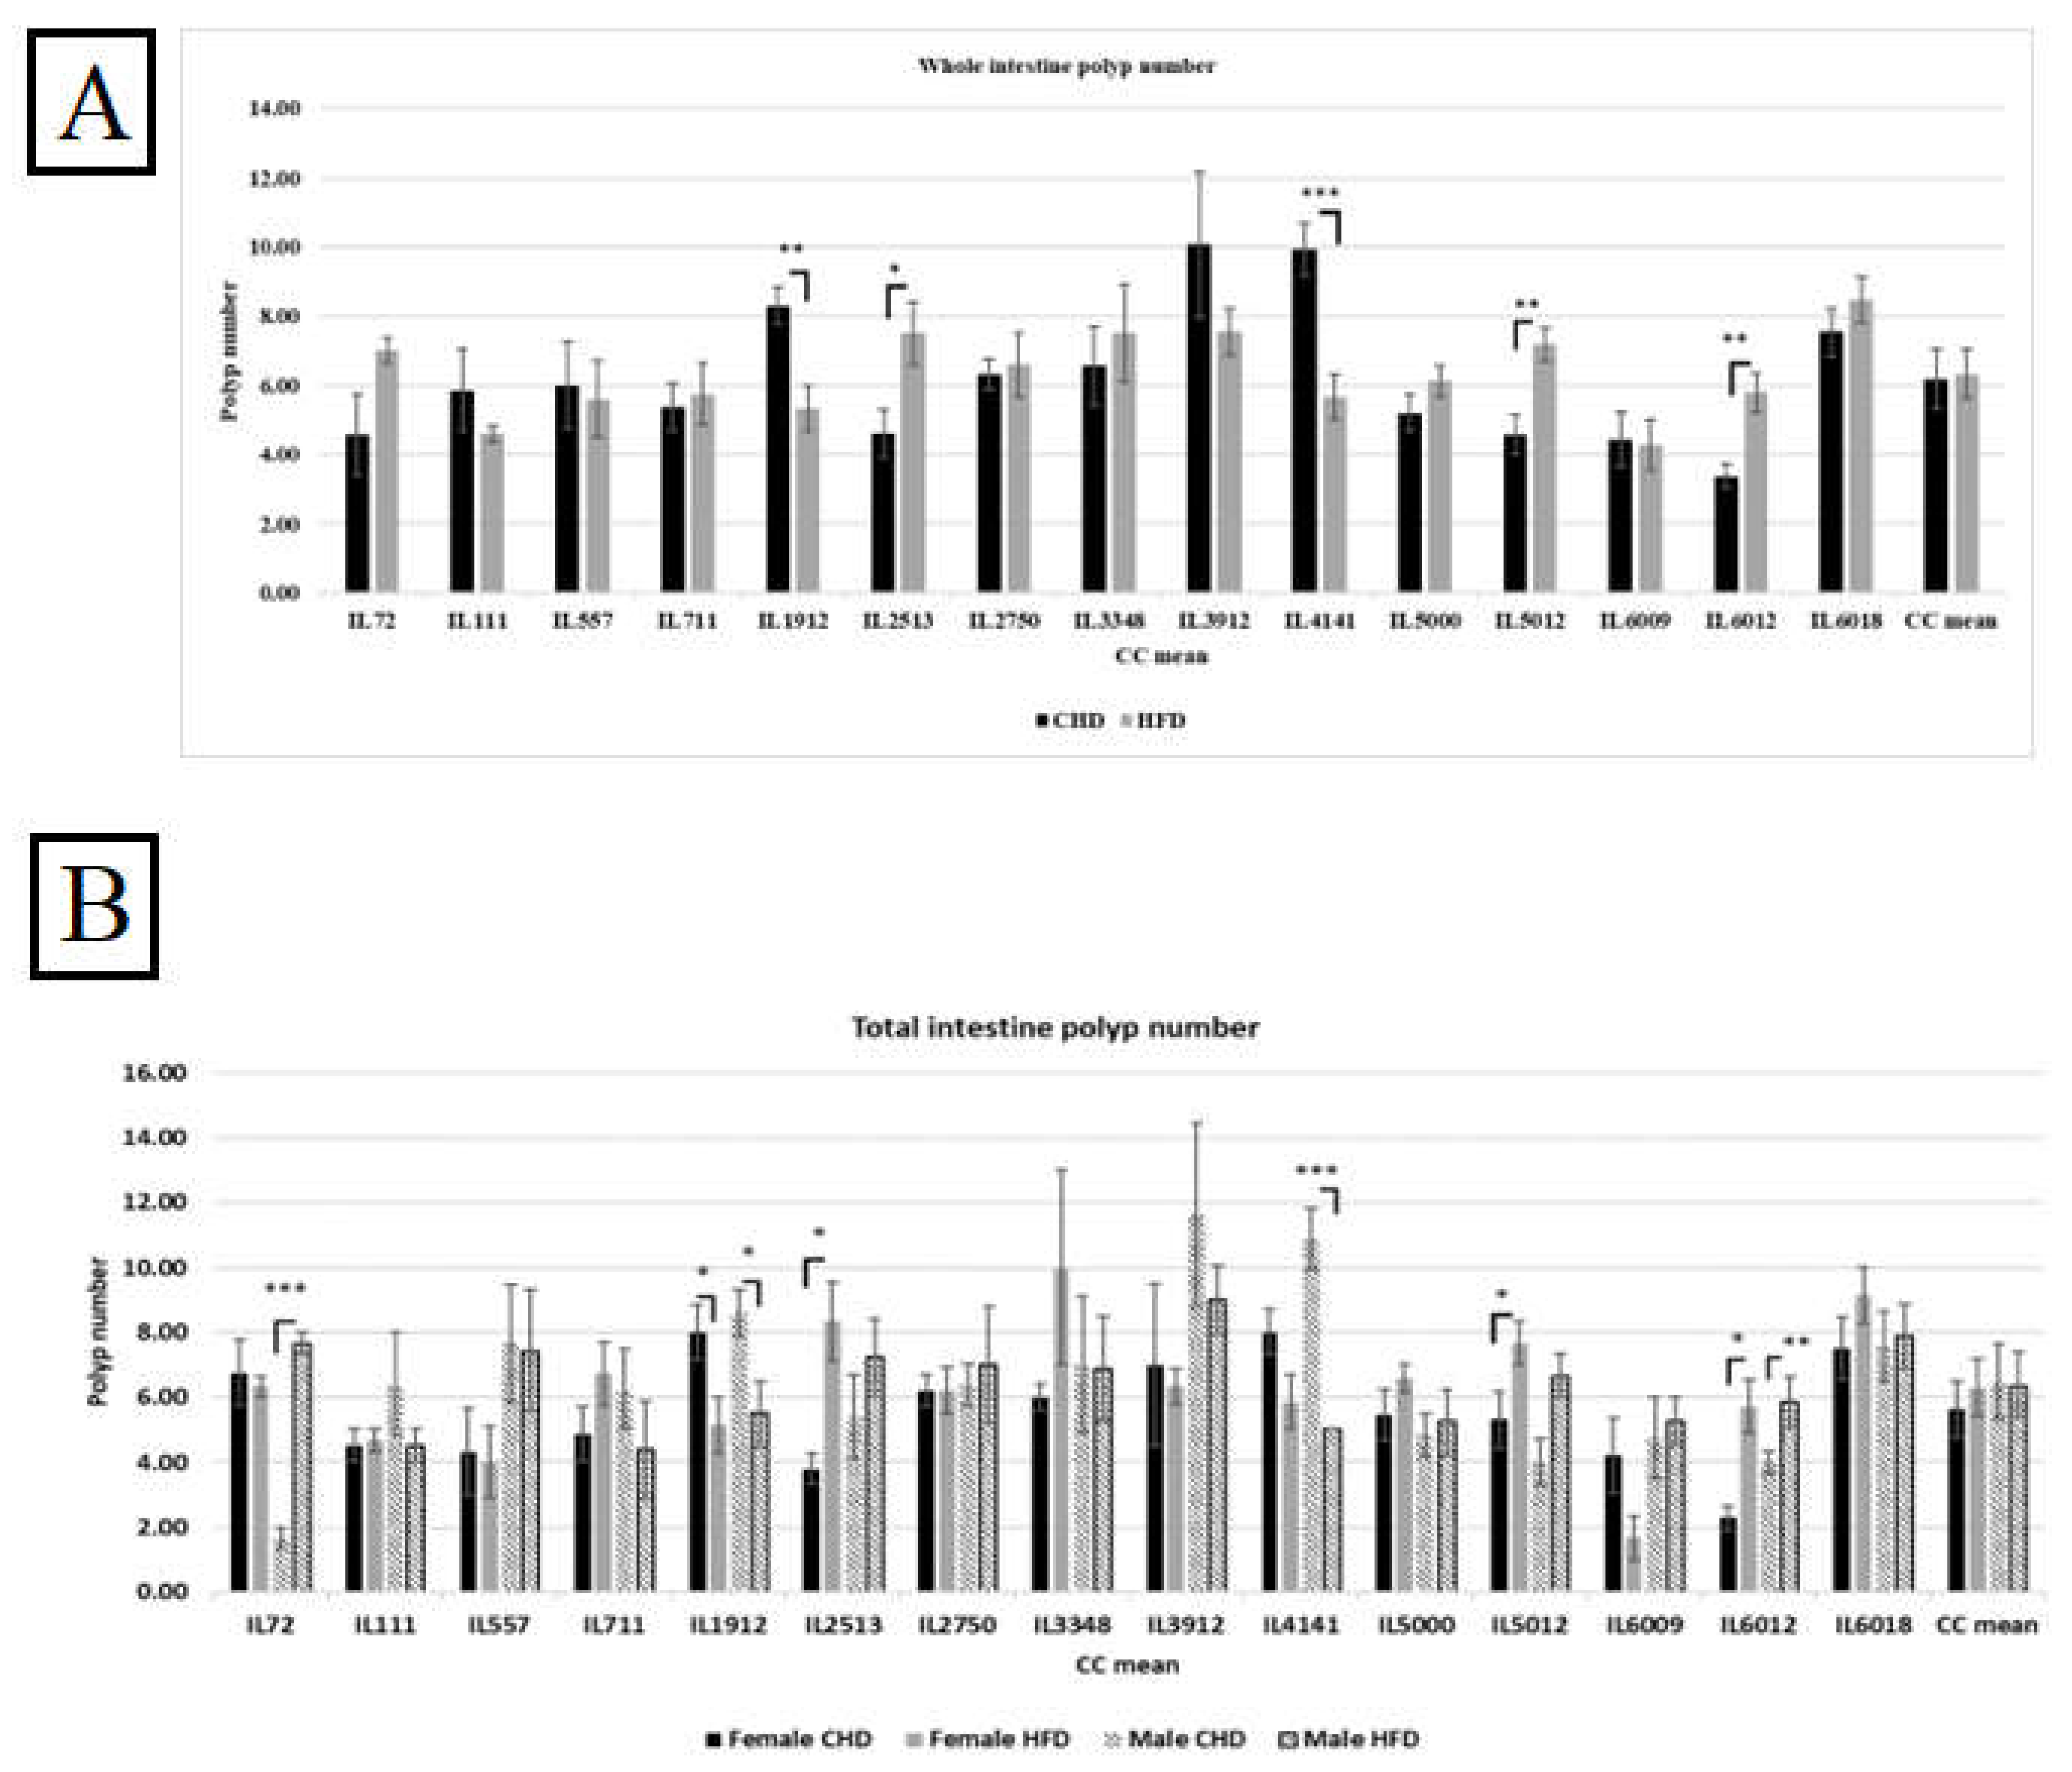
At the end of 12 weeks of the experimental period, the small intestine and colon were extracted and washed, and the small intestine was divided into three segments, while the large intestine was kept uncut. The intestines were stained with methylene blue at 0.02%, and polyp was counted. The sum of polyps in the small intestine and the large intestine displays the total polyps count in the whole intestine. The entire population revealed higher polys when maintained on HFD compared with CHD. As presented in Figure 5A, six different CC lines showed elevation in total intestinal polyp count, and three CC lines presented a significant increase in polyp number, IL2513, IL5012, and IL6012, with a P value < 0.05. Moreover, other CC lines, IL1912 and IL4141, increased in polyp due to CHD consumption. Our results have shown variation between the different CC lines due to different diets.
Figure 5.
A. The whole intestinal polyps count in the entire population of 15 different CC lines after being maintained for 12 weeks on HFD Vs. CHD. The X-axis represents the different CC lines, and Y- the axis represents the polyp number development. Total intestinal polyps = Total small intestine polyp+ colon polyps’ number. Data was analyzed by One-way Analysis of Variation (ANOVA). B. Intestinal polyps count of both populations (female and male) of 15 different CC lines after being maintained for four months on HFD Vs. CHD. The X-axis represents the different CC lines, and the Y-axis represents the polyp number development. Total intestinal polyps = Total small intestine polyp+ colon polyps’ number. Data was analyzed using a one-way analysis of variation (ANOVA).
Figure 5.
A. The whole intestinal polyps count in the entire population of 15 different CC lines after being maintained for 12 weeks on HFD Vs. CHD. The X-axis represents the different CC lines, and Y- the axis represents the polyp number development. Total intestinal polyps = Total small intestine polyp+ colon polyps’ number. Data was analyzed by One-way Analysis of Variation (ANOVA). B. Intestinal polyps count of both populations (female and male) of 15 different CC lines after being maintained for four months on HFD Vs. CHD. The X-axis represents the different CC lines, and the Y-axis represents the polyp number development. Total intestinal polyps = Total small intestine polyp+ colon polyps’ number. Data was analyzed using a one-way analysis of variation (ANOVA).
3.6. Intestinal Polyp Development Under the Influence of Diet and Sex in Different CC Lines
Our results showed a variation in both sexes from different CC lines and in polyp development due to diet intake. Moreover, results shown in Figure 5B present an elevation in polyp count in the female population under HFD maintenance compared with CHD. However, the male population developed more polyps than females under the same diet. Additionally, we noticed the variation between the different CC lines of the same population. Within the female population, three CC lines, IL2513, IL5012, and IL6012, respond significantly to HFD and increase the polyp number with P values < 0.05 compared with CHD. The results in Supplementary Table S3 present the female lines IL1912 (P<0.05) and IL 6009, revealing an increase in polyp number due to CHD. The same pattern showed in the male population, where two different CC lines IL72, and IL6012, increased in polyp number due to HFD consumption, while IL1912 and IL4141 showed more polyps number on CHD than on HFD. The dissimilarity between the CC lines and among the sexes supports our idea that genetic elements influence the presence and development of CRC.
3.7. Small Intestinal Polyp Development under the Influence of Diet in Different CC Lines
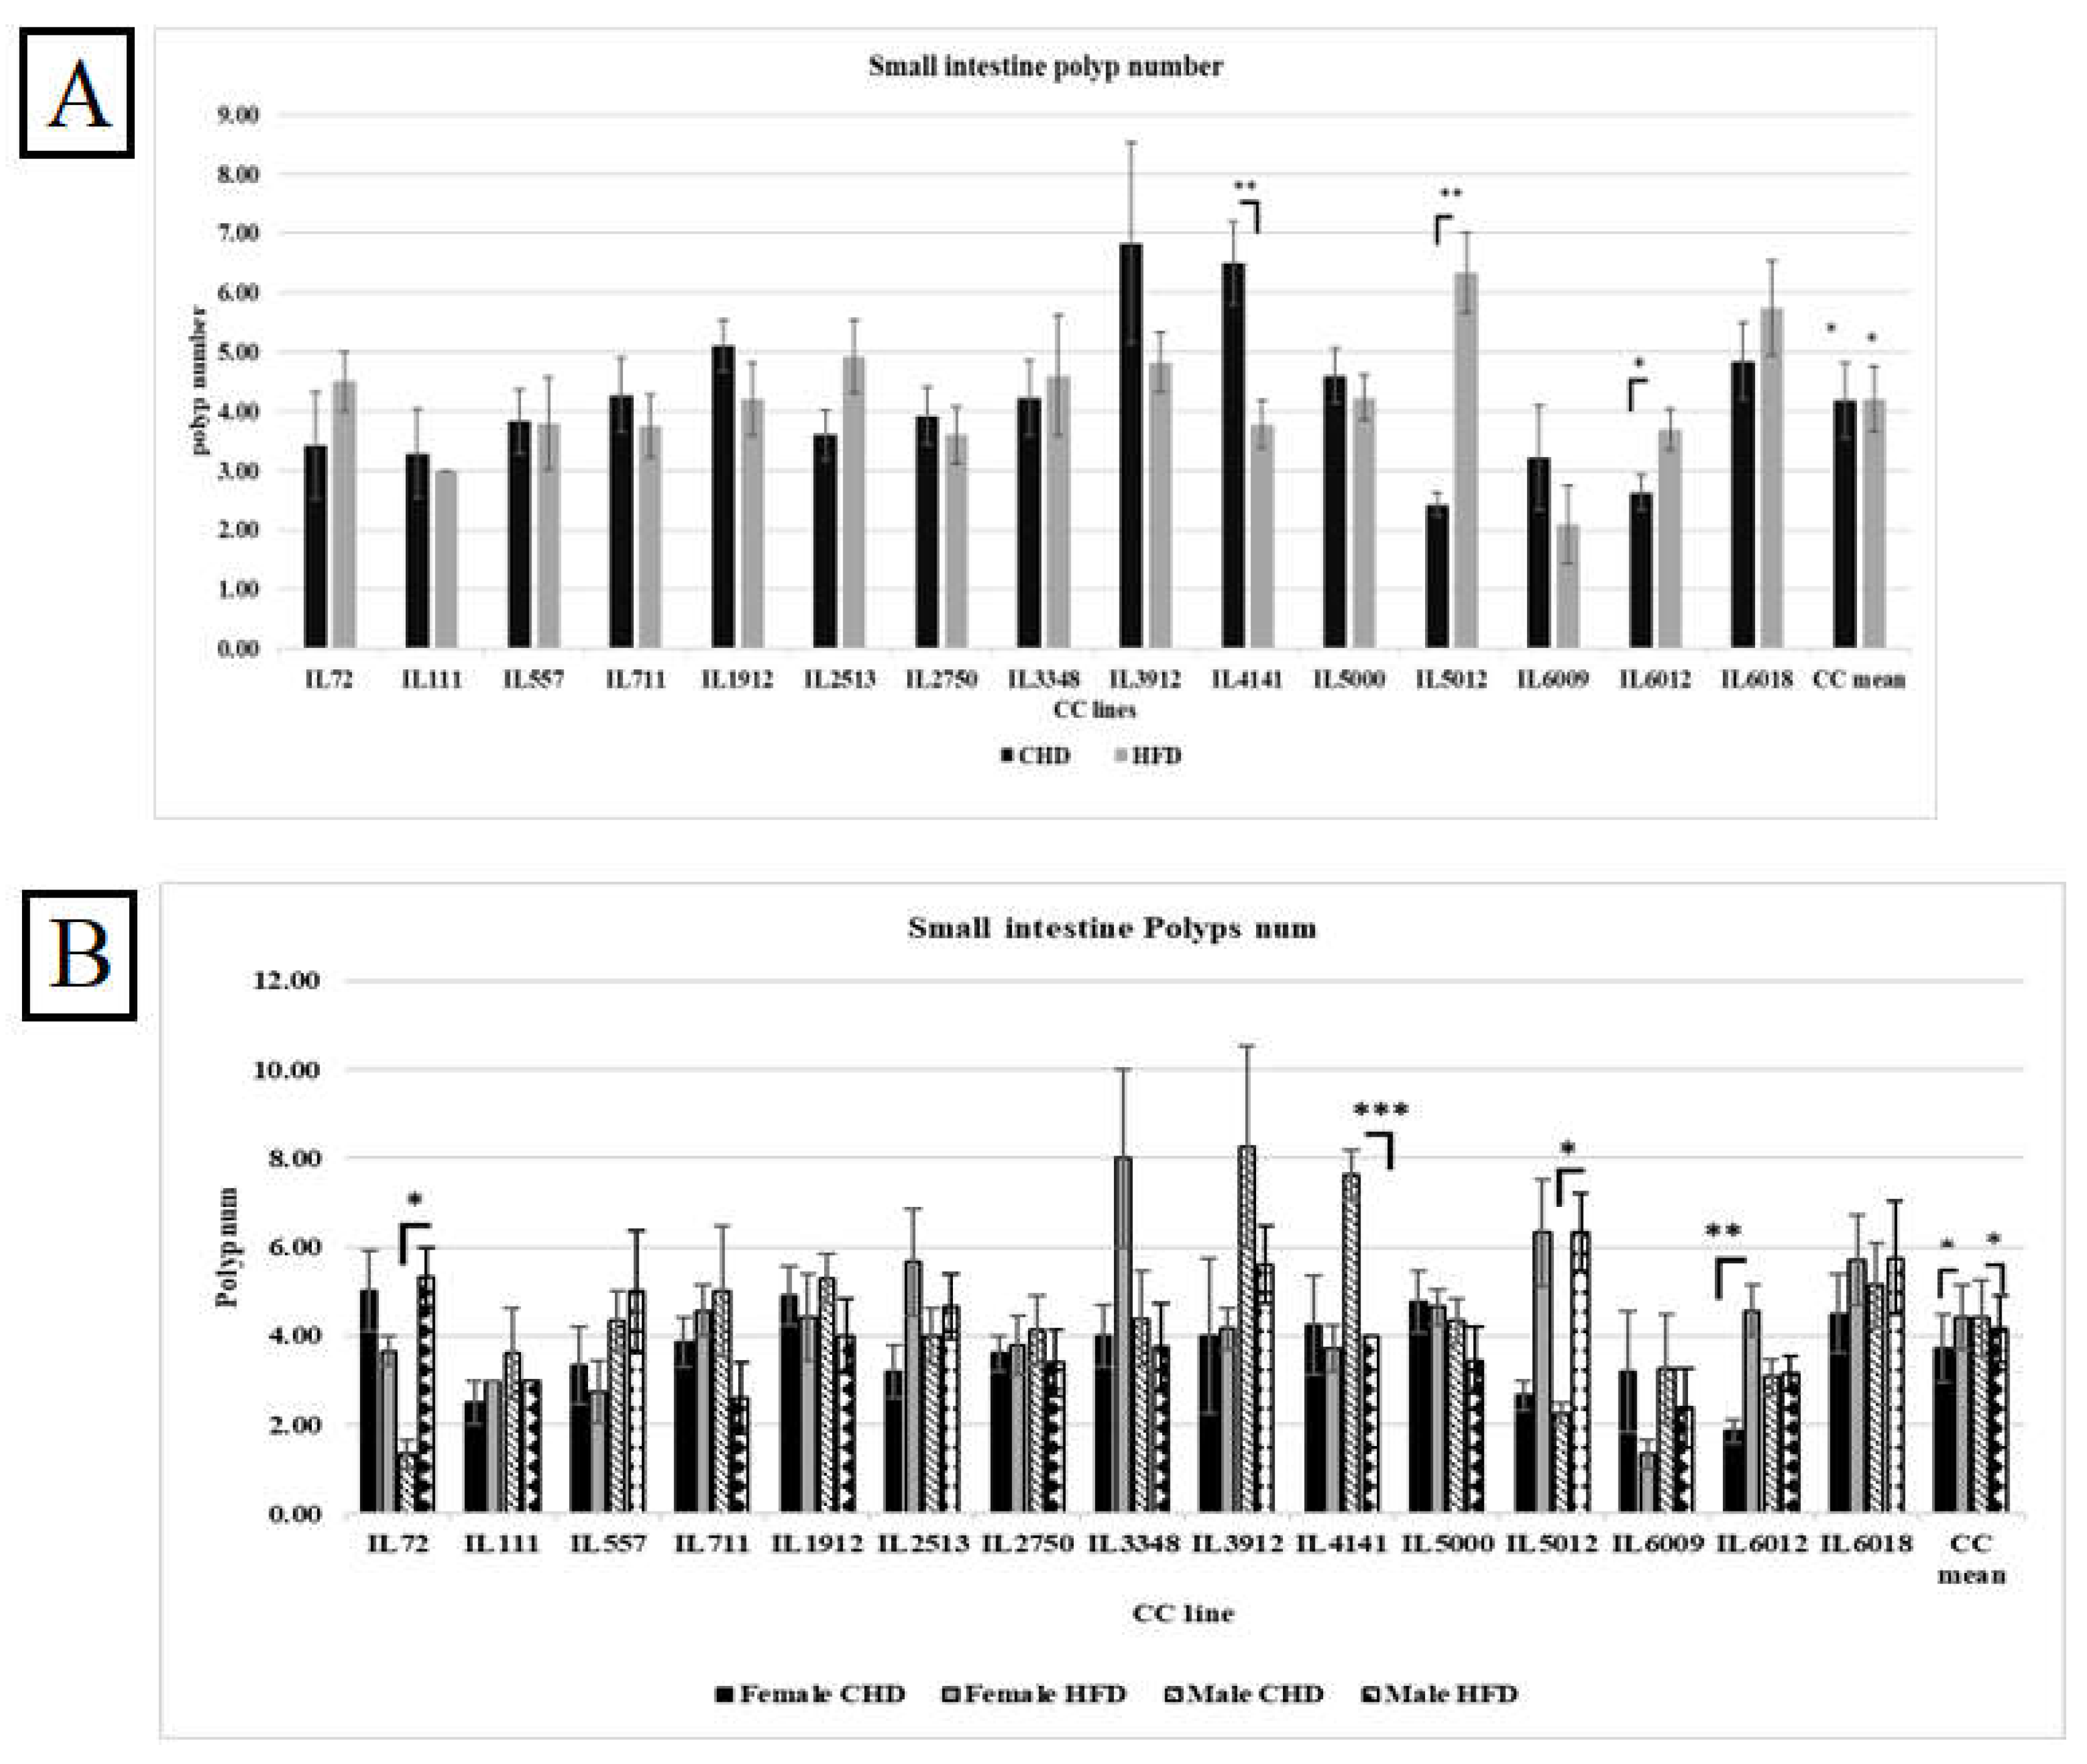
As presented in Figure 6A, the consumption of HFD in the entire population increased polyp number significantly with P value < 0.01. The different CC lines behaved differently in response to HFD. In addition, some CC lines weren’t affected by diet challenges such as IL557. The fact that Individual CC lines respond differently to diet under the same environmental factors confirms the importance of studying the susceptible genetic factors.
Figure 6.
A. The small intestine Polyps number among the entire population of 15 different CC lines was maintained for 12 weeks on HFD Vs. CHD. The X-axis represents the different CC lines, and the Y-axis represents the polyp number development. Data was analyzed using a one-way analysis of variation (ANOVA).
Figure 6.
A. The small intestine Polyps number among the entire population of 15 different CC lines was maintained for 12 weeks on HFD Vs. CHD. The X-axis represents the different CC lines, and the Y-axis represents the polyp number development. Data was analyzed using a one-way analysis of variation (ANOVA).
3.8. Small Intestinal Polyp Development Under The Influence Of Diet And Sex In Different CC lines
Figure 6B shows the polyp number in the small intestine of the different CC lines in both populations. Surprisingly, the polyp number under CHD was significantly higher in males than under HFD, with a P value < 0.05. On the contrary, the female population displayed a significant polyp number in response to HFD, with a mean of 4.34±0.21 (P<0.05). Moreover, the variation in response to HFD between different CC lines in the male population was revealed by three CC lines. IL72 and IL 5012 in the male population showed significant elevation of polyp number on HFD (5.33±0.66, 6.33±0.88 respectively) compared with CHD (1.33±0.33, 2.25±0.25 respectively). The variety of results between the different CC lines proves the genetic makeup of intestinal cancer development.
3.9. Colon polyp Development Under The Influence Of Diet In The Overall Population, Regardless Of Sex
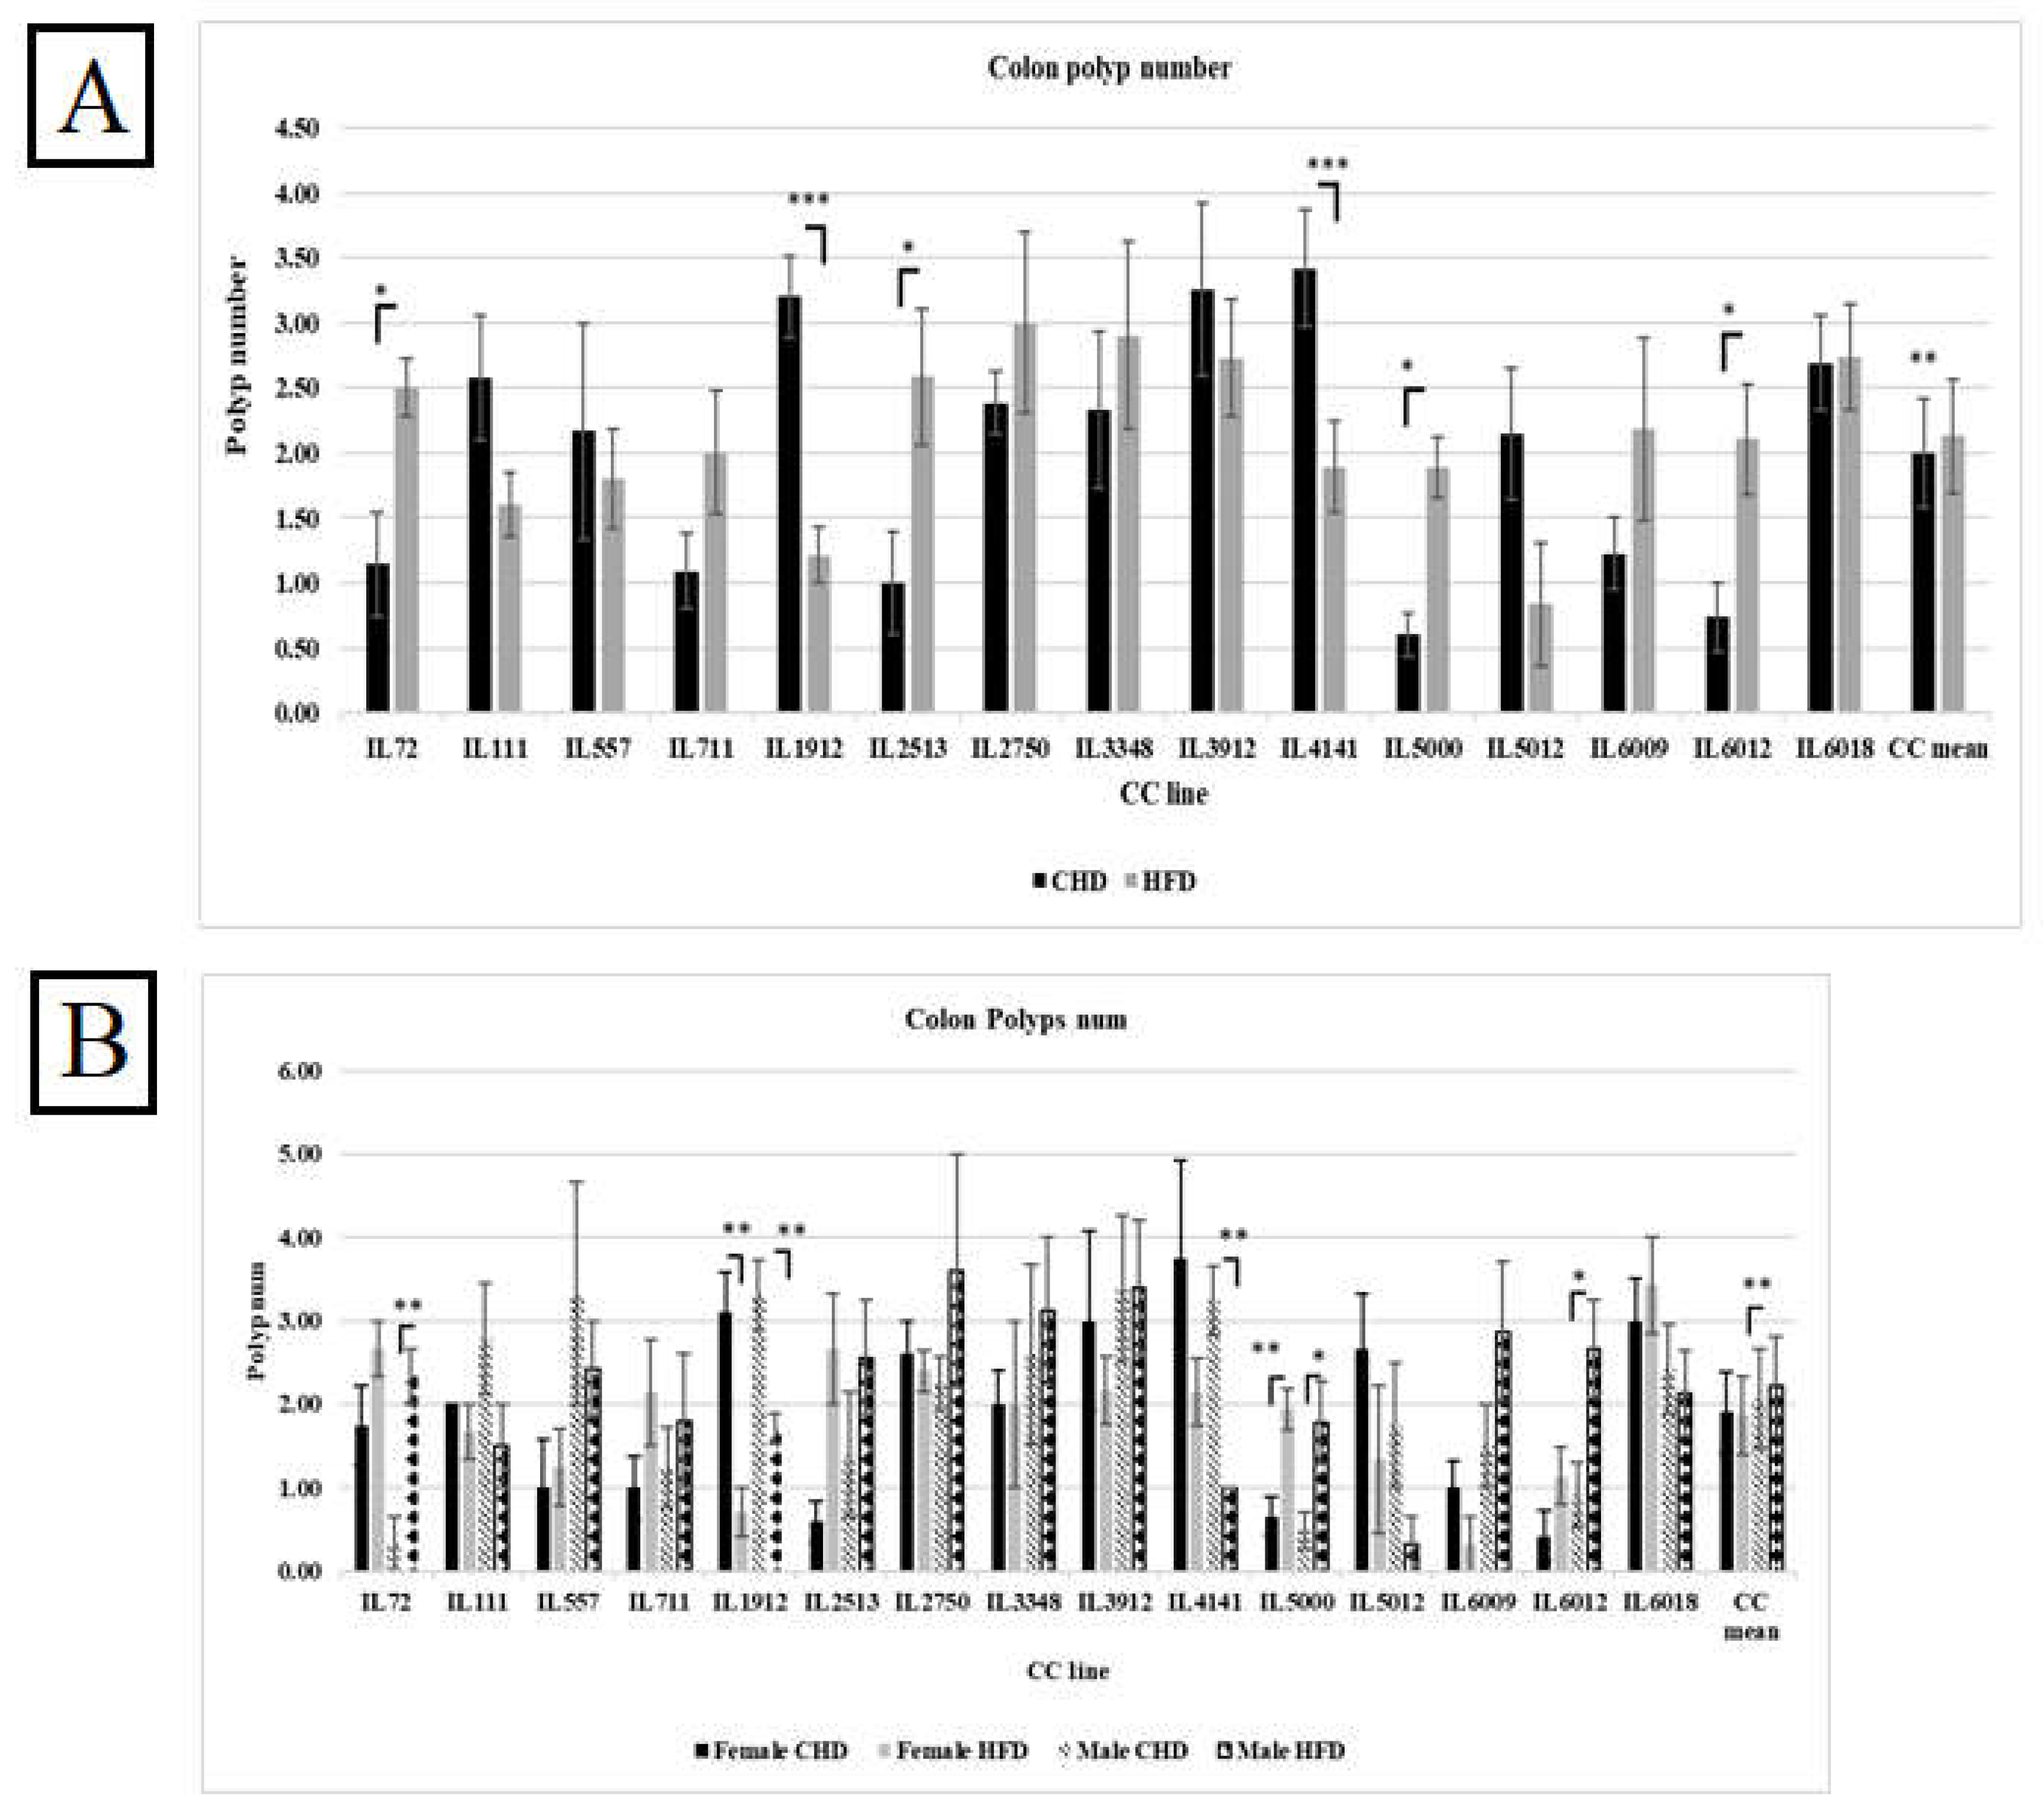
Our results in Figure 7A indicate an increase in polyp counts in the overall population as a response to HFD compared with CHD (2.13Vs.1.99, respectively). However, when we compared the effect of diet between the different CC lines, we found variation and dissimilarity in response to diet. As shown in Supplementary Table 4, CC lines, including IL72, IL2513, IL5000, and IL 6012, developed significantly more polyps under HFD when compared with CHD (P< 0.05). While CC lines IL1912 and IL4141 significantly increased the polyp number under CHD compared with HFD (P< 0.05). Since the environmental factors are constant, we observe a difference in response between different CC lines. These results confirm and support the role of genetic background in disease development.
3.10. Colon polyp Development Under The Influence Of Diet And Sex In Different CC lines
The results showed variation in response to diet between the different CC lines within the same population. As presented in Figure 7B, males of the three CC lines IL72, IL5000, and IL6012 had significantly increased polyp counts in the colon on HFD maintenance with a P value <0.05. On the contrary, in the male population, the polyp number of IL4141 as well as IL1912 on CHD were highly significant than on HFD (3.25±0.41,1±0.00 respectively, and 3.30±0.42, 1.71±0.184 respectively) with P value < 0.01. Regarding the female population, IL5000 significantly developed more polyps under HFD than CHD (1.94±0.25,0.67±0.23, respectively). IL1912 in the female population developed significantly more polyps on CHD than on HFD (3.10±0.48,0.71±0.28 respectively) with P value <0.01. The fact that the whole experiment took place under the same environmental condition and still got the differences in response indicates that the reason for the variation is the genetic background of each CC line.
Figure 7.
Total colon polyps number in 15 different CC lines for both population females and males maintained for four months under dietary challenge HFD (42%) Vs. CHD (18%). The X-axis presents the different CC lines and the mean of the entire population; the Y-axis presents the number of polyps in the colon for both females and males. Data was analyzed using a one-way analysis of variation (ANOVA).
Figure 7.
Total colon polyps number in 15 different CC lines for both population females and males maintained for four months under dietary challenge HFD (42%) Vs. CHD (18%). The X-axis presents the different CC lines and the mean of the entire population; the Y-axis presents the number of polyps in the colon for both females and males. Data was analyzed using a one-way analysis of variation (ANOVA).
3.11. Assessment of Cytokines Profile of the CC Lines Under Dietary Challenge
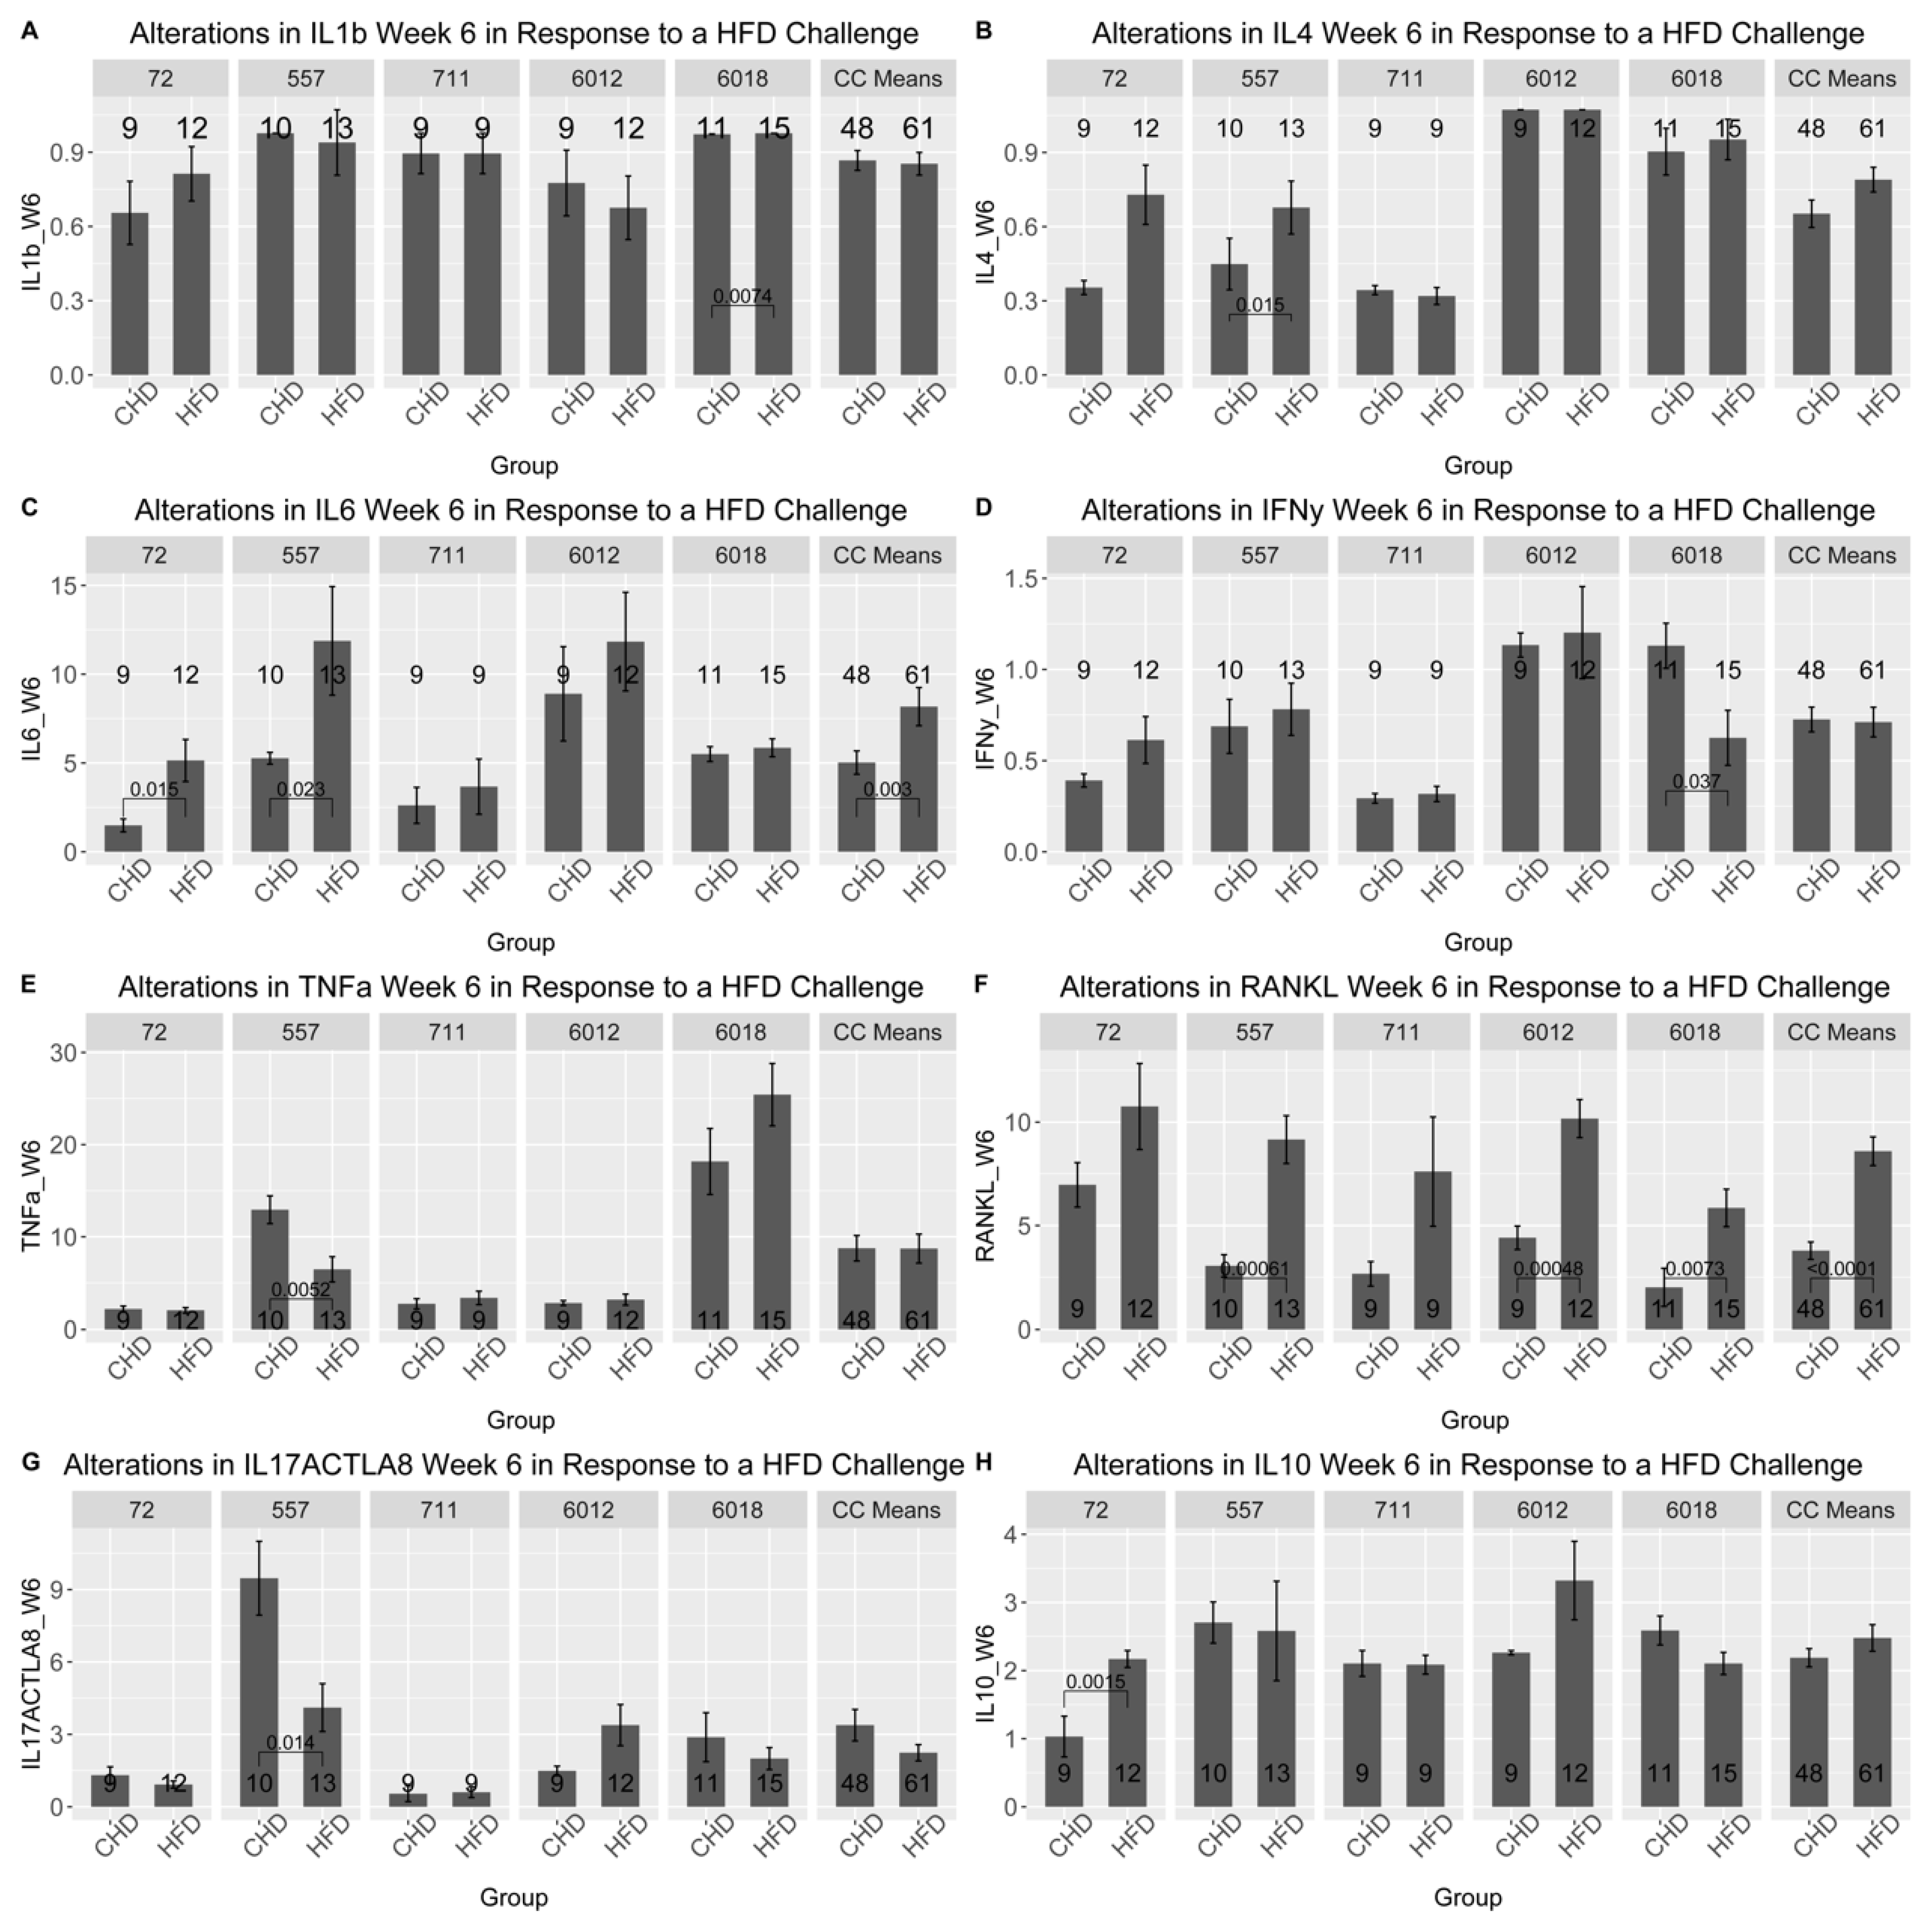
The results of the cytokines profile were obtained after the analysis of the blood serum of five different CC lines at two different time points (at weeks 6 and week 12). As presented in Figure 8 and Supplementary Figures 2-6, the five different CC lines showed different cytokines profiles as a result of dietary challenges at weeks 6 and 12, as well as in both populations. At week 6, the RANKL cytokine in the male population of all CC lines increased significantly under HFD compared with CHD. Moreover, cytokine IL-6 significantly increased CC lines IL72, IL557 and IL711. Interestingly, CC lines IL6012 and IL6018 revealed different levels of the cytokine TNF-α as a response to HFD consumption. In contrast, the level of TNF-α increased significantly in IL6018, contrary to IL6012, which decreased substantially under HFD intake. Additionally, the CC lines showed different results over time. Under HFD, the IL-6 cytokine of CC line IL711 at week 12 decreased significantly compared with CHD. In the female population, different cytokine profiles showed different expression levels. In line IL557 maintained on HFD showed more changes in cytokine concentration over time compared with their counterparts maintained on CHD. Furthermore, this CC line displayed a significant increase in the level of IL1-β and IL-4 and a significant decline in both RANKL and IL-17A cytokine concentration due to HFD maintenance for six weeks. In contrast, CC line IL6012 revealed a substantial elevation of IL-17A, RANKL, and TNF-α due to HFD intake. Some CC lines showed a curve inversion after 12 weeks of the dietary challenge. In CC line 557 at week 6, a significant decrease in IL-6 and RANKL on HFD was observed. The different cytokine levels between the different CC lines confirm the importance of genetics in the development of various complex diseases that have been studied in the current research.
Figure 8.
Cytokines profiles for ten different proinflammatory cytokines in male and female mice of 5 different CC lines at week six during the dietary challenge of either HFD (42%) or CHD (18%). The X-axis presents the different proinflammatory cytokines, and the Y-axis presents cytokines levels in blood serum for both female and male mice. Data was analyzed by One-way Analysis of Variation (ANOVA).
Figure 8.
Cytokines profiles for ten different proinflammatory cytokines in male and female mice of 5 different CC lines at week six during the dietary challenge of either HFD (42%) or CHD (18%). The X-axis presents the different proinflammatory cytokines, and the Y-axis presents cytokines levels in blood serum for both female and male mice. Data was analyzed by One-way Analysis of Variation (ANOVA).
3.12. Correlation Analysis Between The Studied Phenotypes
To clarify and better understand the correlation and the coexistence of multiple disease conditions in an individual, we aimed to study the effect of host genetic background on disease multimorbidity. We focused on the development of colorectal cancer, T2D development, and obesity caused by HFD consumption. The coefficient values can range from +1 to -1, where +1 indicates a strong positive correlation, -1 indicates an entirely negative relation and 0 value indicates no existence of correlation. The color in the heatmap shows the level of the values of measured traits in each Figure. The red color shows the highest values, the light blue color shows the lowest values, and other colors between these two extremes show intermediate values.
The heatmap in Supplementary Figure 7A represents the correlations between the tested phenotypes (Total AUC 6,12, %ΔBW6,12, Total small intestine polyps, Total colon polyp count) in each experimental group (Female CHD vs. female HFD and Male CHD Vs vs. male HFD) of overall population for 15 different CC lines. According to the correlation matrix for the overall female population, there is a strong positive correlation between total AUC 6 and total AUC 12 under HFD with coefficient value (0.79), the same pattern seen between the body weight changes at week 6 and body weight changes at week 12 (%ΔBW). Moreover, the relation between the total small intestine polyp number ranged from negative correlation to positive correlation. Interestingly, our results showed a stronger correlation between the traits as CC lines were analyzed individually. For example, Supplementary Figure 7B showed a strong effect of HFD on multimorbidity and disease development. Under HFD, the total intestinal and colon polyps correlated significantly and strongly with total AUC 6 and %ΔBW6. Moreover, this relation converted from a negative on CHD to a positive relation on HFD. The female population under HFD showed a stronger correlation than the male population under the same diet. In contrast, IL 5012 Supplementary Figure 7C. The significant variation in the correlation between the different traits and the different CC lines demonstrates the effect of genetic factors on diseases' multi-morbidities.
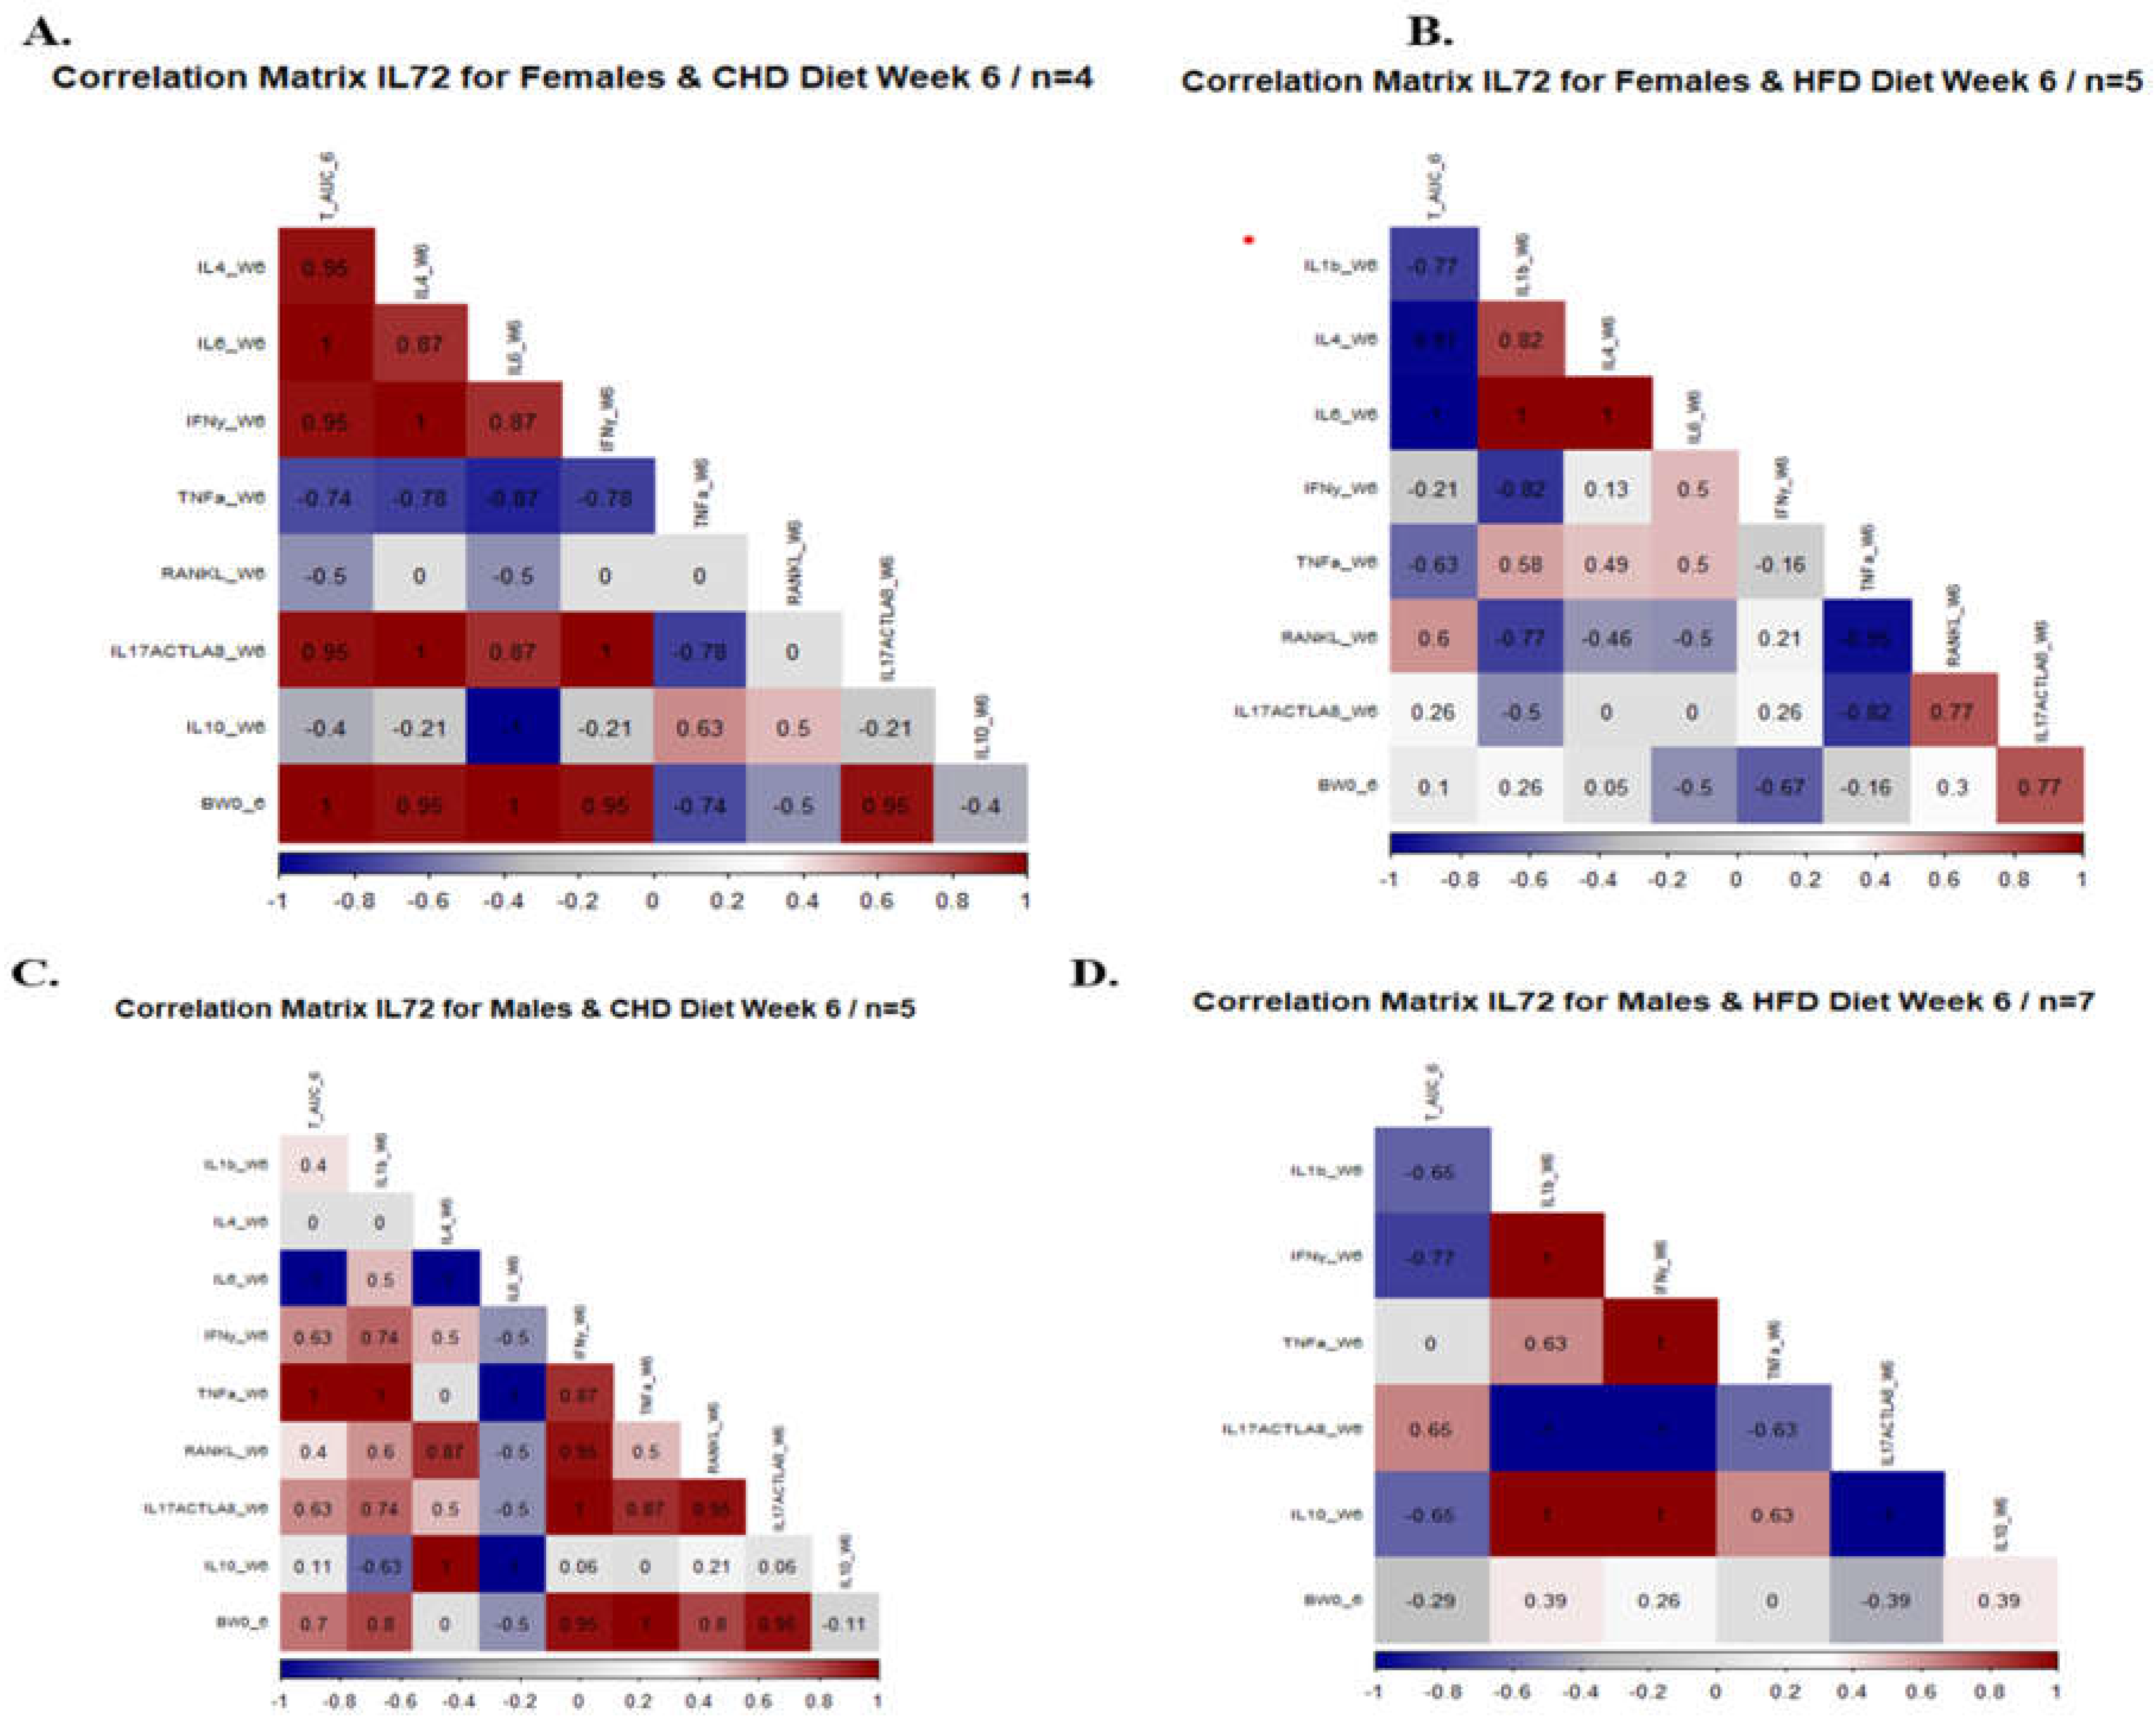
In the sixth week of the experiment, we analyzed the mice’s serum to determine the effect of diet on the concentration of inflammatory cytokines and its relationship with the total AUC 6 and %BW 6. For example, the maintenance of HFD strengthens the relationship between the different cytokines in the female population. As presented in Figure 9 and Supplementary Figure 8. The correlation matrix of the female population showed conversion from weak relation to strong positive correlation after 6 weeks under HFD compared with CHD. All over the project, we focused on the response of each CC line separately due to HFD intake. Supplementary Figure 8 presented the correlation matrix between the cytokine level and phenotypes (total AUC 6 and % BW) of each CC line individually for both male and female populations under dietary challenge. The male population of CC lines IL557 and IL711 on HFD revealed a positive, strong correlation between total AUC 6, IL-6 (0.56, 0.5 respectively), and IL-10 (0.7,0.77 respectively),
The correlation between different phenotypes and the inflammatory cytokines were presented in Supplementary Figure 9 of both populations and different CC lines. Comparing both populations, the female population showed a strong positive correlation between the %ΔBW and total AUC 12. The male population revealed the effect of diet on disease development by changing the heatmap from a negative correlation under CHD to a positive correlation under HFD, as described in Supplementary Figure 9.
3.13. Heritability
The heritability was calculated from the results of One Way ANOVA for different tested traits that were calculated by diet only as well as by sex and diet. Table 1A shows the different diet traits calculated separately for diet (CHD, HFD). The heritability in total AUC displayed an estimated value larger than 0.45 under both diets. Additionally, the % ΔBWT of both weeks showed estimated values of more than 0.17 under both diets. However, the highest value shown in week 6 under HFD was 0.41. The whole intestinal polyp and colon polyp numbers revealed higher estimated values under CHD (0.311,0.349,0.174, respectively) compared with values under HFD (0.082, 0.042, 0.097, respectively). Furthermore, the BV showed relatively the lowest estimated values and consequently leaned toward 0 in both diets. Table 1B presents the different phenotypes calculated by sex and diet separately. The female population displayed higher values of more than 0.56 of total AUC under both diets. Similarly, in the male population, the total AUC of both tested weeks 6 and 12 during the experimental procedure revealed higher values of more than 0.511 under both diets. Additionally, both sexes maintained under HFD showed higher values of %ΔBWT6-12 up to 0.33 compared with a maximum value of 0.33 under CHD. Moreover, the small intestine polyp number in the female population maintained on HFD showed higher heritability values compared with females under CHD (0.225, 0.059, respectively). In contrast, the male population's polyps in the small intestine displayed lower heritability values under HFD compared with CHD (0.069, 0.249, respectively). On the other hand, our calculated results revealed higher estimated values in colon polyp numbers in both populations under CHD compared with HFD.
4. Discussion
Obesity is presently considered as one of the leading public health concerns since it is involved in global burden of chronic diseases, including cardiovascular diseases, diabetes type 2, and particular type of cancers [37]. Since 1980 the prevalence of obesity doubled worldwide as well as about a third of the global population has been determined to be obese or overweight [38]. Dramatic obesity rate enhancement has been shown in both populations of male and female as well as in older individuals, especially in older women [39]. Several environmental risk factors are involved in obesity development, including excessive fat intake, low physical activity, and age [40]. In addition, studies showed that around 40%-70% of obesity development is caused by genetic factors, which play a crucial role in its development [41]. Over 400 genes associated with T2D have been identified by the GWAS [42,43]. However, only 5% of these genes are in obesity progression [44].
Obesity is a complex condition and one of the main reasons for T2D development. Both obesity and T2D are associated with metabolic disturbance and may contribute to chronic inflammation. These conditions are induced by maintenance on a high-fat diet (HFD). The HFD plays a crucial role in the development of obesity and subsequently increases the risk for the development of T2D through various biological mechanisms. Particularly the elevation of saturated fatty acids (SFA), which may produce inflammatory cytokines. Moreover, inflammation, obesity, and diabetes are associated with insulin resistance in metabolic and adipose tissue. Inflammation increases cytokine production, alters the concentration of circulated adipokines in the liver and skeletal muscle tissue, and contributes to insulin resistance [45]. Initiating an increase in insulin production from the pancreatic beta cells to maintain normal glucose levels may lead to circulating hyperinsulinemia.
Based in our previous and current results, both sexes behaved differently in response to HFD as displayed by %ΔBWT changes and level of proinflammatory cytokines, as well as in the development of polyps in the intestine. An increase was shown in the %ΔBWT when comparing the male population to the female population. However, different CC lines respond differently to the die [33]. The variation in response among the lines further reveals the influence of the genetic makeup/background. The effect of diet on body weight changes stems from the genetic differences of each CC line, supported by our results, as also revealed by Abu-Toamih-Atamni et al. [32].
In this study, we assessed the blood glucose clearance using AUC measurements to identify early stages of diabetes development. Although our data indicated higher AUC values in the populations under HFD maintenance, the male population showed more significant values than the female population. These values explain that male cells take longer to absorb blood glucose and become more sensitive to diabetes than females. Furthermore, it’s essential to realize that different CC lines presented different patterns of AUC values in response to diet. The males of IL1912 on HFD showed significantly higher AUC values than IL6018, which showed substantially lower AUC values at HFD. Compared with the female population, IL4141 presented highly significant AUC values under HFD, while IL2513 showed significantly low AUC values under HFD. On the other hand, interestingly, males and females of IL2750 were resistant to the HFD challenge and did not show any significant variation in their AUC values, as corroborated by Yosief et al. [46].
Previous studies have shown the importance of the host genetic background in developing multiple polyps. The more polyps there are, the greater the chance that they contain cancerous cells [47]. Focusing on the genetic factors, our ultimate aim is to be able to predict the intestinal cancer at early stages by identifying specific genes underlining the multimorbidity of intestinal cancer, obesity and T2D by using the CC model and its accompanied power of huge genetic diversity [48]. Our results have demonstrated the differences of the responses of the fifteen studied CC lines to dietary challenges and have suggested that the different host genes lead to different phenotypes, which is variant between both sexes.
Our results have shown that no significant variation on the overall polyp numbers/counts in the whole intestine due to dietary challenge. However, both overall population as well as different CC lines displayed variant responses when the polyps number counted into two different intestinal segments (small intestine and colon). In the small intestine overall, female population showed a significant increase in polyp number compared with male population under HFD. However, in the colon segment the polyp number remained significantly higher in male population than female population under the influence of HFD consumption. This effect varies between the mice with a different genetic structure. For instance, the small intestine polyp number in the male population of CC lines IL72 and IL5012 elevated under the HFD, compared with IL1414 which showed lower polyp number under HFD compared with CHD. The heterogeneity in the outcome proves the influence of the host genetic makeup on the development of these disease as corroborated earlier by Lone et al. [49]
Multimorbidity, which is defined as the co-existence, of two or more chronic conditions, is common in primary care patients, with at least 50% of patients over 50 years of age having two or more chronic disease [50]. In order to study the link and the multimorbidity of intestinal cancer, obesity and T2D, our current study comprises a comprehensive picture of the susceptibility and the resistance of these different CC lines for the diet [51]. The heatmap analysis emphasizes the strong correlation between these phenotypes. A significant correlation was observed between the total AUC12, %ΔBWT, polyp number and part of inflammatory cytokines. While the direction of each correlation varied between male and female population. For example, a strong correlation was observed between total AUC12, %ΔBWT and different cytokines in female population, in contrast to male population the correlation was weak. Moreover, a strong correlation was observed between the colon polyp number and IL-17A cytokines in both populations. The CC mice belonging to IL711 under the effect of HFD presented stronger correlation values between total AUC, %ΔBWT and cytokines compared to other CC lines.
Clearly, our findings highlight the impact of the host genetic background on the development of various diseases, as a result of HFD consumption. As we branched out and delve deeper into details in our results; the huge differences and diversity between the different strains under the same environmental conditions was observed, especially in how chronic multiple diseases developed simultaneously in each strain. This multimorbidity will help us to understand clearly the mechanism of each disease and how it relates to other diseases. Identifying one gene will help us to predict the development of many diseases, and that gives us the opportunity to prevent it at early stages.
In conclusion, the data promises to elucidate the nature of the genes involved in resistance and rate of development of intestinal cancer, T2D, and obesity induced by HFD. Once obtained, such data can be used to predict individual risk of developing these diseases and allow the development of a genetically based strategy for their prevention and treatment.
Supplementary Materials
The following supporting information can be downloaded at preprints.org.
Author Contributions
AG was involved in data collection and analysis, writing the first version of the paper; KM was involved in data analysis and writing the first draft of the paper; OZ was involved in data collection and analysis and writing the first and final version of the paper; SK was involved in data collection and analysis and writing the first and final version of the paper, YHD was involved in project design, supervision of the team and project execution, IML was involved in data collection and analysis and writing the first and final version of the paper, FAI was involved in project design, supervision of the team and project execution, writing the first and final version of the paper. .
Funding
This report was supported by the Binational Science Foundation (BSF) grant number 2015077, the German Israeli Science Foundation (GIF) grant I-63-410.20-2017, the Israeli Science Foundation (ISF) grant 1085/18, and the Core Fund from Tel-Aviv University.
Institutional Review Board Statement
not applicable.
Informed Consent Statement
animals in this research are compatible with the national standards for the care and use of laboratory animals and were approved by the Institutional Animal Care and Use Committee (IACUC) of Tel Aviv University (approval numbers: 01-19-013 and 01-20-015), which adhered to the Israeli guidelines that follow the National Institutes of Health of USA animal care and use protocols.
Data Availability Statement
All data presented in this figure is freely available.
Acknowledgments
The authors declare no competing financial interests or other associations that may pose a conflict of interest (e.g., pharmaceutical stock ownership, consultancy).
Conflicts of Interest
On behalf of all authors, the corresponding author states that there are no conflicts of interest.
References
- Cheng L, Eng C, Nieman LZ, Kapadia AS, Du XL. Trends in colorectal cancer incidence by anatomic site and disease stage in the United States from 1976 to 2005. Am J Clin Oncol. 2011;34(6):573-580. [CrossRef]
- Abualkhair WH, Zhou M, Ahnen D, Yu Q, Wu X-C, Karlitz JJ. Trends in Incidence of Early-Onset Colorectal Cancer in the United States Among Those Approaching Screening Age. JAMA Netw Open. 2020;3(1):e1920407. [CrossRef]
- Arnold M, Sierra MS, Laversanne M, Soerjomataram I, Jemal A, Bray F. Global patterns and trends in colorectal cancer incidence and mortality. Gut. 2017;66(4):683-691. [CrossRef]
- Patel SG, Ahnen DJ. Familial colon cancer syndromes: an update of a rapidly evolving field. Curr Gastroenterol Rep. 2012;14(5):428-438. [CrossRef]
- Lowery JT, Ahnen DJ, Schroy PC, et al. Understanding the contribution of family history to colorectal cancer risk and its clinical implications: A state-of-the-science review. Cancer. 2016;122(17):2633-2645. [CrossRef]
- Jones WF, Ahnen DJ, Schroy PC. Improving on-time colorectal cancer screening through lead time messaging. Cancer. 2020;126(2):247-252. [CrossRef]
- Peters U, Hutter CM, Hsu L, et al. Meta-analysis of new genome-wide association studies of colorectal cancer risk. Hum Genet. 2012;131(2):217-234. [CrossRef]
- Corley DA, Jensen CD, Marks AR, et al. Variation of adenoma prevalence by age, sex, race, and colon location in a large population: implications for screening and quality programs. Clin Gastroenterol Hepatol. 2013;11(2):172-180. [CrossRef]
- Wisse BE. The inflammatory syndrome: the role of adipose tissue cytokines in metabolic disorders linked to obesity. J Am Soc Nephrol. 2004;15(11):2792-2800. [CrossRef]
- Flegal KM, Carroll MD, Ogden CL, Johnson CL. Prevalence and trends in obesity among US adults, 1999-2000. JAMA. 2002;288(14):1723-1727. [CrossRef]
- Agha M, Agha R. The rising prevalence of obesity: part A: impact on public health. Int J Surg Oncol (N Y). 2017;2(7):e17. [CrossRef]
- DeFronzo RA, Ferrannini E. Insulin resistance. A multifaceted syndrome responsible for NIDDM, obesity, hypertension, dyslipidemia, and atherosclerotic cardiovascular disease. Diabetes Care. 1991;14(3):173-194. [CrossRef]
- Després J-P. Is visceral obesity the cause of the metabolic syndrome? Ann Med. 2006;38(1):52-63. [CrossRef]
- Liew CW, Boucher J, Cheong JK, et al. Ablation of TRIP-Br2, a regulator of fat lipolysis, thermogenesis and oxidative metabolism, prevents diet-induced obesity and insulin resistance. Nat Med. 2013;19(2):217-226. [CrossRef]
- Silva Figueiredo P, Carla Inada A, Marcelino G, et al. Fatty acids consumption: the role metabolic aspects involved in obesity and its associated disorders. Nutrients. 2017;9(10). [CrossRef]
- Tan BL, Norhaizan ME. Effect of High-Fat Diets on Oxidative Stress, Cellular Inflammatory Response and Cognitive Function. Nutrients. 2019;11(11). [CrossRef]
- Li B, Leung JCK, Chan LYY, Yiu WH, Tang SCW. A global perspective on the crosstalk between saturated fatty acids and Toll-like receptor 4 in the etiology of inflammation and insulin resistance. Prog Lipid Res. 2020;77:101020. [CrossRef]
- Chen J, Huang X-F. High fat diet-induced obesity increases the formation of colon polyps induced by azoxymethane in mice. Ann Transl Med. 2015;3(6):79. [CrossRef]
- Ngo HT, Hetland RB, Nygaard UC, Steffensen I-L. Genetic and Diet-Induced Obesity Increased Intestinal Tumorigenesis in the Double Mutant Mouse Model Multiple Intestinal Neoplasia X Obese via Disturbed Glucose Regulation and Inflammation. J Obes. 2015;2015:343479. [CrossRef]
- Brownlee M. The pathobiology of diabetic complications: a unifying mechanism. Diabetes. 2005;54(6):1615-1625. [CrossRef]
- Dandona P, Aljada A, Bandyopadhyay A. Inflammation: the link between insulin resistance, obesity and diabetes. Trends Immunol. 2004;25(1):4-7. [CrossRef]
- Civelek M, Lusis AJ. Systems genetics approaches to understand complex traits. Nat Rev Genet. 2014;15(1):34-48. [CrossRef]
- Lone IM, Iraqi FA. Genetics of murine type 2 diabetes and comorbidities. Mamm Genome. 2022;33(3):421-436. [CrossRef]
- Dai J, Gu J, Huang M, et al. GWAS-identified colorectal cancer susceptibility loci associated with clinical outcomes. Carcinogenesis. 2012;33(7):1327-1331. [CrossRef]
- Lone MI, Nazam N, Hussain A, Singh SK. Genotoxicity and immunotoxic effects of 1, 2-dichloroethane in Wistar rats. … Science and Health …. 2016.
- Lone MI, Nabi A, Dar NJ, et al. Toxicogenetic evaluation of dichlorophene in peripheral blood and in the cells of the immune system using molecular and flow cytometric approaches. Chemosphere. 2017;167:520-529. [CrossRef]
- Lone MI, Nazam N, Shaikh S, Ahmad W. Genotoxicity of an organochlorine pesticide dichlorophene by micronucleus and chromosomal aberration assays using bone marrow cells of Rattus norvegicus. Caryologia. 2013.
- Ali MN, Nazam N, Lone MI, Shaikh S. Evidence of apoptosis in some cell types due to pentachlorophenol (PCP) in Heteropneustes fossilis. Saudi journal of biological …. 2013.
- Taler K, Zatari N, Lone MI, Rotem-Bamberger S, Inbal A. Identification of Small Molecules for Prevention of Lens Epithelium-Derived Cataract Using Zebrafish. Cells. 2023;12(21). [CrossRef]
- Churchill GA, Airey DC, Allayee H, et al. The Collaborative Cross, a community resource for the genetic analysis of complex traits. Nat Genet. 2004;36(11):1133-1137. [CrossRef]
- Lone IM, Zohud O, Midlej K, et al. Narrating the Genetic Landscape of Human Class I Occlusion: A Perspective-Infused Review. J Pers Med. 2023;13(10). [CrossRef]
- Abu-Toamih-Atamni HJ, Lone IM, Binenbaum I, et al. Mapping novel QTL and fine mapping of previously identified QTL associated with glucose tolerance using the collaborative cross mice. Mamm Genome. November 17, 2023. [CrossRef]
- Qahaz N, Lone IM, Khadija A, et al. Host genetic background effect on body weight changes influenced by heterozygous smad4 knockout using collaborative cross mouse population. Int J Mol Sci. 2023;24(22). [CrossRef]
- Ghnaim A, Lone IM, Nun NB, Iraqi FA. Unraveling the host genetic background effect on internal organ weight influenced by obesity and diabetes using collaborative cross mice. Int J Mol Sci. 2023;24(9). [CrossRef]
- Rudling R, Hassan AB, Kitau J, Mandir N. A simple device to rapidly prepare whole mounts of murine intestine. Cell …. 2006.
- Dorman A, Baer D, Tomlinson I, Mott R, Iraqi FA. Genetic analysis of intestinal polyp development in Collaborative Cross mice carrying the Apc (Min/+) mutation. BMC Genet. 2016;17:46. [CrossRef]
- Kopelman PG. Obesity as a medical problem. Nature. 2000;404(6778):635-643. [CrossRef]
- Ataey A, Jafarvand E, Adham D, Moradi-Asl E. The relationship between obesity, overweight, and the human development index in world health organization eastern mediterranean region countries. J Prev Med Public Health. 2020;53(2):98-105. [CrossRef]
- Organization WH. Obesity: preventing and managing the global epidemic: report of a WHO consultation. 2000.
- Heymsfield SB, Wadden TA. Mechanisms, pathophysiology, and management of obesity. N Engl J Med. 2017;376(3):254-266. [CrossRef]
- Wu Y, Duan H, Tian X, et al. Genetics of Obesity Traits: A Bivariate Genome-Wide Association Analysis. Front Genet. 2018;9:179. [CrossRef]
- Chen J, Wang X, He Q, et al. YAP activation in renal proximal tubule cells drives diabetic renal interstitial fibrogenesis. Diabetes. 2020;69(11):2446-2457. [CrossRef]
- Chen J, Sun M, Adeyemo A, et al. Genome-wide association study of type 2 diabetes in Africa. Diabetologia. 2019;62(7):1204-1211. [CrossRef]
- Bogardus C. Missing heritability and GWAS utility. Obesity (Silver Spring). 2009;17(2):209-210. [CrossRef]
- Kojta I, Chacińska M, Błachnio-Zabielska A. Obesity, bioactive lipids, and adipose tissue inflammation in insulin resistance. Nutrients. 2020;12(5). [CrossRef]
- Yosief RHS, Lone IM, Nachshon A. Identifying genetic susceptibility to Aspergillus fumigatus infection using collaborative cross mice and RNA-Seq approach. Animal Models and …. 2024.
- Grahn SW, Varma MG. Factors that increase risk of colon polyps. Clin Colon Rectal Surg. 2008;21(4):247-255. [CrossRef]
- Zohud O, Lone IM, Nashef A, Iraqi FA. Towards system genetics analysis of head and neck squamous cell carcinoma using the mouse model, cellular platform, and clinical human data. Anim Models Exp Med. 2023;6(6):537-558. [CrossRef]
- Lone IM, Nun NB, Ghnaim A, Schaefer AS, Houri-Haddad Y, Iraqi FA. High-fat diet and oral infection induced type 2 diabetes and obesity development under different genetic backgrounds. Anim Models Exp Med. 2023;6(2):131-145. [CrossRef]
- Zohud O, Midlej K, Lone IM, Nashef A, Abu-Elnaaj I, Iraqi FA. Studying the Effect of the Host Genetic Background of Juvenile Polyposis Development Using Collaborative Cross and Smad4 Knock-Out Mouse Models. Int J Mol Sci. 2024;25(11). [CrossRef]
- Lone IM, Midlej K, Nun NB, Iraqi FA. Intestinal cancer development in response to oral infection with high-fat diet-induced Type 2 diabetes (T2D) in collaborative cross mice under different host genetic background effects. Mamm Genome. 2023;34(1):56-75. [CrossRef]
Figure 4.
A. Percentage body weight changes (%ΔBW ) following six weeks of diet challenge ( CHD Vs. HFD) of both populations of fifteen different CC lines (The X-axis). The Y-axis represents %ΔBW calculated as BW6(g) -BW0 (g)/BW0*100. B. Percentage body weight changes (%ΔBW ) following 12 weeks of diet challenge ( CHD Vs. HFD) of both populations (Female and Male) of fifteen different CC lines (The X-axis). The Y-axis represents %ΔBW calculated as BW12(g) -BW0 (g)/BW0*100.
Figure 4.
A. Percentage body weight changes (%ΔBW ) following six weeks of diet challenge ( CHD Vs. HFD) of both populations of fifteen different CC lines (The X-axis). The Y-axis represents %ΔBW calculated as BW6(g) -BW0 (g)/BW0*100. B. Percentage body weight changes (%ΔBW ) following 12 weeks of diet challenge ( CHD Vs. HFD) of both populations (Female and Male) of fifteen different CC lines (The X-axis). The Y-axis represents %ΔBW calculated as BW12(g) -BW0 (g)/BW0*100.
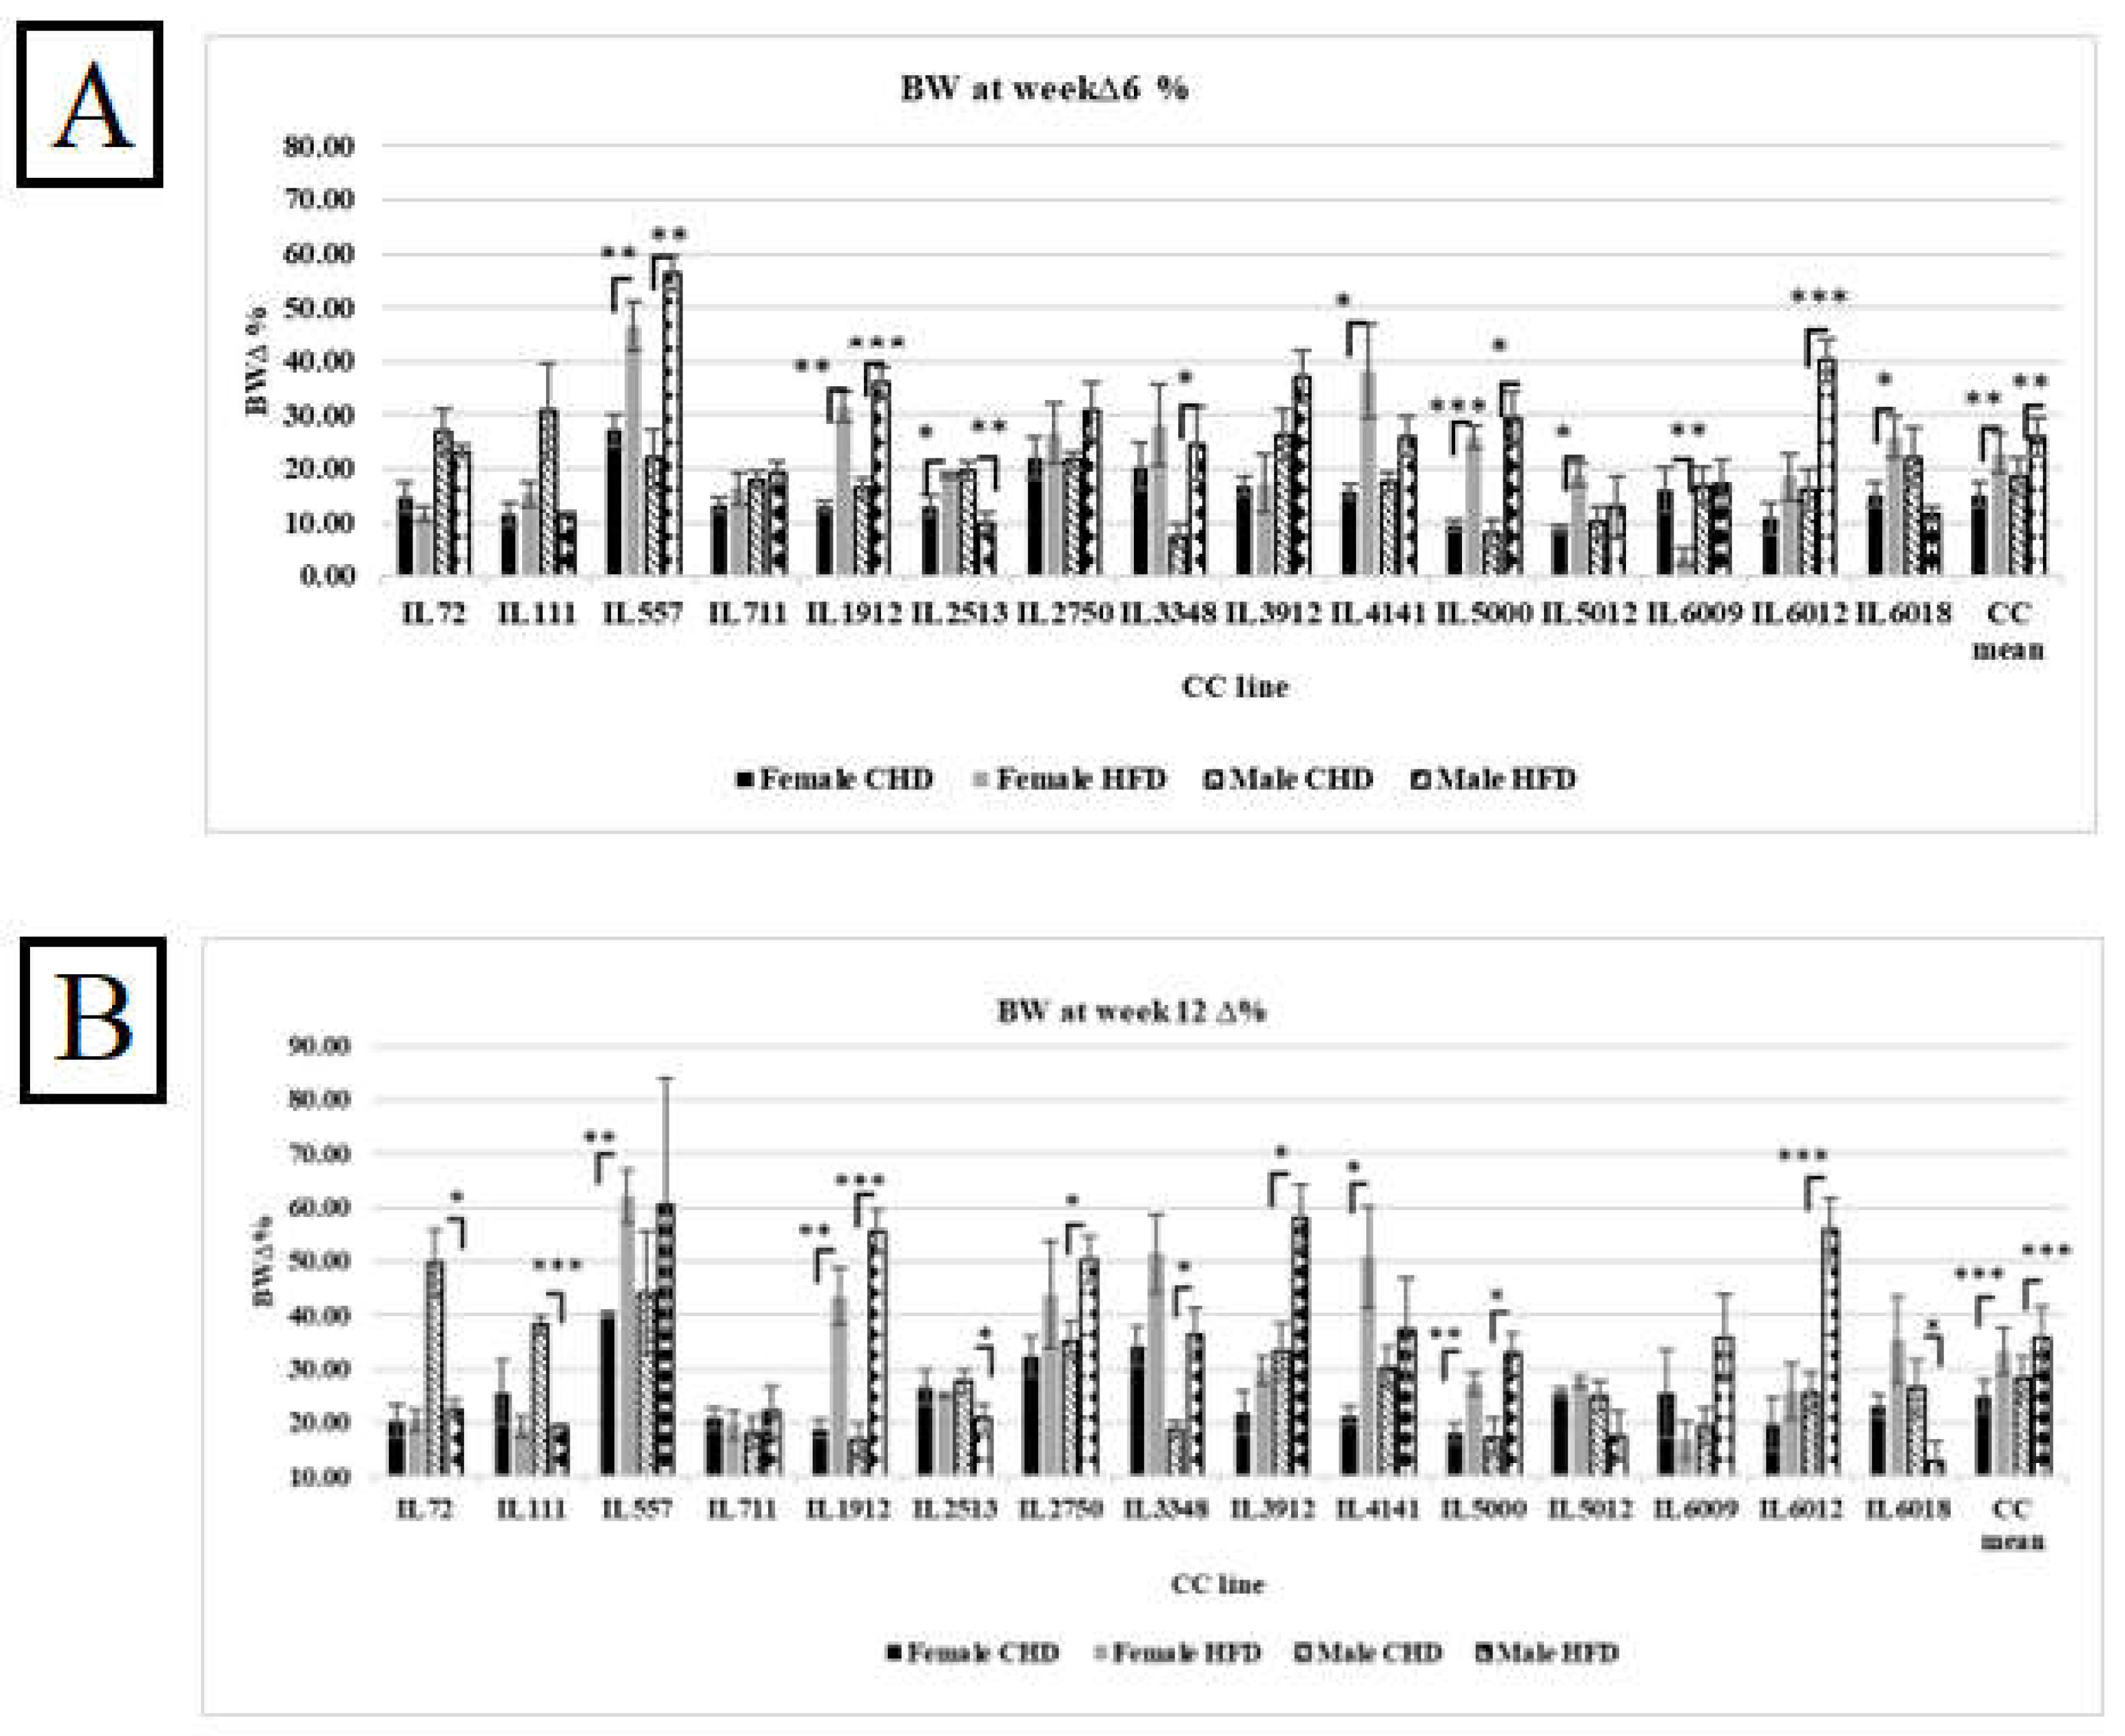
Figure 9.
Correlation matrix between different inflammatory cytokines, % ΔBWT6, total AUC 6, for both populations Female and Male. As well as a correlation matrix of three different CC lines (IL 557, IL711, IL72) of both populations after six weeks of diet challenge CHD Vs. HFD intake.
Figure 9.
Correlation matrix between different inflammatory cytokines, % ΔBWT6, total AUC 6, for both populations Female and Male. As well as a correlation matrix of three different CC lines (IL 557, IL711, IL72) of both populations after six weeks of diet challenge CHD Vs. HFD intake.
Disclaimer/Publisher’s Note: The statements, opinions and data contained in all publications are solely those of the individual author(s) and contributor(s) and not of MDPI and/or the editor(s). MDPI and/or the editor(s) disclaim responsibility for any injury to people or property resulting from any ideas, methods, instructions or products referred to in the content. |
© 2024 by the authors. Licensee MDPI, Basel, Switzerland. This article is an open access article distributed under the terms and conditions of the Creative Commons Attribution (CC BY) license (http://creativecommons.org/licenses/by/4.0/).
Copyright: This open access article is published under a Creative Commons CC BY 4.0 license, which permit the free download, distribution, and reuse, provided that the author and preprint are cited in any reuse.


