
Submitted:
13 September 2024
Posted:
13 September 2024
You are already at the latest version
Abstract
COPD is a "heterogeneous lung condition characterized by chronic respiratory symptoms. It is a leading cause of death and illness and is associated with a substantial economic burden worldwide. Furthermore, it is marked by frequent exacerbations, which significantly contribute to morbidity and mortality, as well as the overall burden. These exacerbations are frequently triggered by bacterial infections.So far, the most commonly implicated Bacteria are Pseudomonas aeruginosa, Klebsiella pneumoniae, Haemophilus influenzae, Moraxella catarrhalis, and Streptococcus pneumoniae.The advent of culture-independent techniques, such as next-generation sequencing techniques (NGS), allows us to characterise the lung microbiome in different disease states.
Keywords:
COPD
; the lung microbiome
; sequencing of the bacterial 16S ribosomal RNA gene
1. Introduction
COPD is a “heterogeneous lung condition characterized by chronic respiratory symptoms (such as dyspnea, cough, sputum production, and/or exacerbations) due to abnormalities of the airways (bronchitis, bronchiolitis) and/or alveoli (emphysema) that cause persistent, often progressive, airflow obstruction.” [1] It is a leading cause of death and illness and is associated with a substantial economic burden worldwide. Furthermore, it is marked by frequent exacerbations, which significantly contribute to morbidity and mortality, as well as the overall burden. These exacerbations are frequently triggered by bacterial infections.So far, the most commonly implicated Bacteria are Pseudomonas aeruginosa, Klebsiella pneumoniae, Haemophilus influenzae, Moraxella catarrhalis, and Streptococcus pneumoniae [2].The advent of culture-independent techniques, such as next-generation sequencing techniques (NGS), allows us to characterise the lung microbiome in different disease states. The most common method utilises sequencing of the bacterial 16S ribosomal RNA gene, which is part of a subunit of prokaryotic ribosomes and encodes for bacterial rRNA. It is acquired from microbial samples and compared with sequences from established databases, allowing us to determine the potential microbial species present in the sample. This enables us to characterise the bacterial lung microbiome relativelyeasy.[3]However, exploring the lung microbiome is a relatively new field, and until recently, the lung has even been considered sterile [4]. Even less is known about the microbiome shifts during exacerbations, and its role in disease pathogenesis remains poorly understood.Further characterising these changes may lead to a better understanding of AECOPD and allow for the finding of new biomarkers and treatment strategies.
2. Materials and Methods
Utilising the PICO (Population, Intervention, Comparison, Outcome) tool, we define the aim of this study as to provide a systematic review of the current evidence on the microbiome of patients with exacerbated as compared with stable COPD as determined by 16s rRNA sequencing.
2.1. Definition of Inclusion and Exclusion Criteria
Considered will be observational studies focused on the COPD lung microbiome published in English between 2014 and 2024. The patients included must be human, older than 18 years and have been diagnosed with COPD or AECOPD according to GOLD guidelines. The samples needed for this study should be (spontaneous or induced) sputum samples and must be explored by 16S rRNA gene sequencing. Included will be studies that compare exacerbated samples with those from a stable state. Studies using different types of samples (e.g., bronchoalveolar lavage (BAL)) will be excluded. (Systematic) Reviews, meta-analyses, case reports, guidelines, recommendations or protocols, randomized controlled trialswill be excluded. Studies including subjects with (at least acute) concomitant asthma will also be excluded.
A search of three electronic databases, includingPubMed, Embase, and Cochrane Library using the advanced search tool with the Mesh terms “COPD” AND “Exacerbation” AND “Microbiome” AND “Sequencing” was conducted. This primary search included 78 studies on PubMed, 83 on Embase, and 15 on the Cochrane Library. A totalof 176 studies. After applying additional filters, meaning a publication year in the last ten years/2014-2024 and excluding all languages except English,73 studies on PubMed, 81 on Embase, and 15 in the Cochrane Library remained. A total of169 studies. Sixty-five duplications were identified and excluded, leaving 104 remaining studies. These were further screened by title and abstract for inclusion and exclusion criteria, identifying 16 studies to be evaluated for eligibility in full text. The PRISMA (Preferred Reporting Items for Systematic Reviews and Meta-Analyses)flowchart can be found in Figure 1.
2.1.1. Characteristics of Excluded Studies
Three of these were unavailable to this author(Tait et al., 2018; López Caro et al., 2019; Keir et al., 2022) [52,53,54]. We excluded seven others.Three studies failed to exclude subjects with asthma (Tangedal et al., 2019; Bouquet et al., 2020; Goolam et al., 2021) [5,6,7]. Three did not fulfil the diagnostic criteria (Huang et al., 2014;O’Farrell et al., 2019; Yang et al., 2022) [8,9,10].. Some examples can be found in Table 1.
2.1.2. Characteristics of Included Studies
Below are the main criteria for patient selection and a summary of the characteristics of the included population, where available. Table 2 displays the other main characteristics of the included studies.
Z. Wang et al. (2016) explored samples collected in the BEAT-COPD study. Inclusion criteria were defined as COPD diagnosed according to GOLD guidelines, age ≥40 years, at leastone exacerbation in the preceding 12 months, and reasons for exclusion were asthma, currently active pulmonary tuberculosis, or any other clinically relevant lung disease and a documented inability to produce sputum after induction. Subjects mainly were current or ex-smokers, with a mean pack-year history of 49. [11,12]
Mayhew et al. (2018) used a subgroup of the AERISstudy group.Inclusion criteriawere patients 40-85 years of agediagnosed using FEV1≤ 80% of predicted normal and FEV1/FVC<0.7andat least moderate COPD, with≥10 pack-years and≥1 exacerbation requiring antibiotics, oral corticosteroids or hospitalization in the previous year, and exclusion criteria included α-1 antitrypsin deficiency,asthma, other respiratory disorders, previous lung surgery and anunresolved moderate or severe AECOPDor the last dose of oral corticosteroids or antibacterial, antiviral or respiratory investigational drug or relevant vaccine at least 30 days prior. [13,14]
Jubinville et al. (2018) required an FEV1/FVC index <0.7, ≥1 exacerbation in the last six months, ≥10 pack-years and a stable clinical condition and no antibiotics in the month previousto baseline sputum and excluded patients with infectious diseasesor diagnosed with acute asthma. [15]
J. Wang et al. (2022) included patientsdiagnosedvia the GOLD definition with COPD or AECOPD and excluded patients with a history of other respiratory illnesses. Patientsoverall were not different in gender,age, BMI, current smoker, comorbid conditions, medications, or exacerbation frequency between groups, as well as smoking index among the COPD groups [16].
Su et al. (2023) required COPD or AECOPD to be diagnosed using the GOLD guidelines and≥40years of age. Patients on chronic treatment with oral corticosteroids, immunosuppressive drugs, or antibiotics within four weeks before enrolment and all other respiratory illnesses, including asthma, were excluded [17].
Xue et al. (2023) also requiredthe use of GOLD guidelines for the diagnosis as well as assessment of the severity of COPD and AECOPD,no antibiotic use before admissionand no presence of other respiratory diseases. The average age was 72.4 years, 97.1% of patients were male, and most were current or ex-smokers. [18]
3.1. Community Diversity
During AECOPD, several studies observed that the alpha diversity (within a sample) significantly decreased compared to stable disease. Z. Wang et al. (Faith’s phylogenetic diversity (PD)), Su et al. (Shannon index (SHI), Simpson’s index (SII); p<0.05), and Xue et al. (Observed features (OF), SHI and PD; p<0.0001)[11,17,18]. In contrast, Mayhew et al. andJ. Wang et al.found only aninsignificant decreased alpha diversity [13,16].Also, Jubinville et al. only noted significant (and heterogeneous patient-specific) differences between stable state and exacerbation when paired.Furthermore, J. Wang et al. observed a lower alpha diversity (SHI; p=0.092) in individuals experiencing frequent exacerbations (2-3) compared to those with infrequent exacerbations (0-1), but no significant separation in sputum microbiome membership or structure. In addition, they found differentiating OTUs(RFM; AUC of 0.966; specificity 0.966, sensitivity 1.000)[16].
Regarding beta diversity measures (between states), J. Wang et al. found significant changes in community membership (Analysis of similarities (ANOSIM);R=0.29, p< 0.05), as well as structure(Principal coordinates analysis (PCoA)based on Bray-Curtis distance; R=0.22, P<0.05) [16]. Similarly, Su et al. found a significant difference in community structure (PCoA based on Bray-Curtis distance; p=0.001; 38.56 % shared OTUs). In addition,Xue et al. observed significant differences in respiratory microbial composition(Adonis test via Bray–Curtis, Jaccard, Weighted- and Unweighted-Unifrac distances; p= 0.04, 0.001, 0.001, 0.001, respectively). Lastly, both were able to cluster them (PCoA; p<0.05; respectively).[17,18]
3.2. Taxonomic Differences during Exacerbations
At the Phylum Level
Similarly, Z. Wang et al. and Su et al. observed only a nonsignificant increase in the relative abundance of Proteobacteria, while the relative abundance of Firmicutes decreased [11,17]. However, Jubinville et al. found significant and heterogeneous shifts when observing individual subjects (e.g., a 75% shift from Firmicutes to Proteobacteria in one patient). Finally, Su et al. observed significantly decreased Bacteroidetes (p < 0.01) and significantly increased Actinobacteria (p < 0.05). [17].
At the Genus Level
When observing changes of genera in the relative abundance during exacerbation compared with stable disease, the following was found:
A decrease was observed in
Streptococcus (by 3.8%, adj. p=0.58 using paired t-test; insignificant) by Z. Wang et al. [11],
Prevotella, Alloprevotella, Porphyromonasand unidentified_Prevotellaceae (p < 0.01) by Su et al. [17] and
Clostridium_sensu_stricto_13, Eubacterium_nodatum, and Bacteroides, among others (Differential taxon analysis;adjusted p < 0.05, | logFC |> 1) by Xue et al. [18].
While an increase was seen in
Moraxella (5% viapaired t-test with adj.p=0.22 - insignificant) was observed by Z.Wang et al., 95.6% of which corresponds to Moraxella catarrhalis (OTU 861881). Followed by a 3.0% increase in Haemophilus (adj. p=0.57 with paired t-test). This occurred due to the introduction of a new strain of Moraxella in some participants and a significant growth of a pre-existing Moraxella species in others.[11]
This is supported byMayhew et al. [13](p=0.0012, and p=0.0227 paired t-test comparing matched events within an individual). In addition, the probability of a sample being observed in an exacerbation was 2.6-fold higher,with Moraxella >10% (95% CI 2.1 to 38.1).[13].
Rothia (p < 0.05), unidentified_Corynebacteriaceae (p < 0.01) and Stenotrophomonas (p < 0.05) by Su et al. [17], and
Haemophilus, Pseudomonas, Corynebacterium, Klebsiella, Capnocytophaga, and Moraxella, among others(Differential taxon analysis; p < 0.05) by Xue et al. [18].
Importantly, Jubinville et al. were able to identify genera found increased during exacerbation by sequencing (e.g., 88% increase in Streptococcus in one patient) in significant concentrations by qPCRs (e.g., increased S. pneumoniae with a 4 log). With the exception of H. influenzae, which was only detected in high concentrations with qPCR. [15].

Table 3.
The Most Abundant Taxa.
| Su et al. (2022)[68] | AECOPD | Proteobacteria 30.29% |
Firmicutes 29.85% |
Bacteroidetes 14.02% |
Streptococcus 14.31% |
Neisseria 11.60% |
UnidentifiedPrevotellaceae8.90% | Haemophilus 7.49% |
Veillonella 6.37% |
|---|---|---|---|---|---|---|---|---|---|
| Stable | Firmicutes 31.63% | Bacteroidetes 28.94% | Proteobacteria 19.68% | Unidentified_ Prevotellaceae (15.69%) |
Streptococcus14.31% | Neisseria 12.13% |
Veillonella 7.38% |
Haemophilus 3.62% | |
| J. Wang et al. (2018)[67] | AECOPD | Firmicutes 60.99% | Actinobacteria 25.75% | Proteobacteria 5.59% | Streptococcus 26.59% |
Rothia 16.07% |
Staphylococcus 7.83% |
Abiotrophia 5.89% |
Lactobacillus 4.34% |
| Stable | Firmicutes 53.95% | Actinobacteria 33.47% | Bacteroidetes 4.69% | Streptococcus 34.49% |
Rothia 21.04% |
Lactobacillus 12.43% |
Lautropia (6.26%) |
Parvimonas 3.91% |
|
| Jubinville et al. (2018)[66] | AECOPD | Firmicutes 41% |
Proteobacteria 28% |
Bacteroidetes 25% |
Streptococcus 27% |
Prevotella 23% |
Moraxella 16% |
Veillonella 10% |
|
| Author | State | Phylum | Genus | ||||||
Some studies explored discriminative bacteria between states. They found Haemophilusenriched in AECOPD and Prevotella during stable disease (Linear discriminant analysis (LDA); < 0.05) by Su et al. andHaemophilus, Pseudomonas, Corynebacterium, Klebsiella, Moraxella, Neisseria, Gemella, Aggregatibacter, and Fusobacterium dominant during AECOPD (LDA; p<0.05) by Xue et al. [17,18]. In addition, J. Wang et al. found that the most common differentiating features were enriched in the non-AECOPD samples, interestingly including Haemophilus, while Pseudomonas was increased in AECOPD compared with combined healthy control, recovery and stable (RFM; AUC of 0.78; specificity of 0.806, sensitivity of 0.688) [16].
3.3. Potential Interactions within the Microbiome
Z. Wang et al. performed an OTU network analysis to elicit possible interactions between OTUs and found a few highly connected nods they termed “hub” OTUs. These formed co-exclusions and co-existence (mutual cooperative relationship) patterns. The highest degree of connectivity was found in co-exclusive connections, with the highest impact made by Haemophilus (33 OTUs), followed by Moraxella. Consequently, if they increased in abundance, the microbial alpha diversity decreased. (Shannon’s H versus OTU 240755 adj. p=1.6e−21, r=−0.43 and OTU 861881 adj. p=8.8e−8, r=−0.24; respectively). [11]
3.4. Microbiome Stability
Z. Wang et al. found the microbiome varied less between the same individual over time (weighted UniFrac ± sd 0.272 ± 0.181, p = 2.2e−16) compared to different individuals within the same state (weighted UniFrac ± sd 0.387 ± 0.186; using t-test). In addition, the similarity in bacterial composition between all pairs of microbiome profiles within a subject was significantly more similar compared to between patients (UniFrac distance p>0.05) for Mayhew et al. Overall, this suggests a relatively stable microbiome within a subject that is distinct between patients. Moreover, exacerbation–exacerbation comparisons were more dissimilar relative to stable–stable ones regarding the relative abundance of pre-existing bacteria (weighted UniFrac distance p<0.05), but not complete removal or appearance of novel species (unweighted UniFrac), implicating an outgrowth in preexisting bacteria in dysbiosis [11,13]. However, as mentioned above, the longitudinal samples are heterogeneous, possibly due to destabilisation of the lung microbiome with frequent exacerbations. This is supported by a more dissimilar microbiome with greater exacerbation frequency in both stable and exacerbation states (r=0.14, P<0.001, Pearson). Correlating the average abundance of taxa with exacerbation frequency, Moraxella was identified to have the highest positive correlation (r=0.23, p=0.016, Pearson) and Lactobacillus with the most negative (r=−0.37, P=0.02, Pearson).
3.5. Exacerbation Phenotypes
Firstly, Xue et al. used unsupervised cluster analysis based on bacterial community (Jaccard similarity index) and found two clusters mainly comprised of acute exacerbation and post-therapy samples, which were enriched by Pseudomonas and Haemophilus with high levels of TNF-α, and Lactobacillus, Lautropia, and Veillonella with high levels of IL-4, IL-5, and IL-25, respectively. Interestingly, the latter had the highest alpha diversity (SHI; p=0.005). Two stable clusters were identified with enriched Neisseria, Actinobacillus, Gemella, and Leptotrichia withhigh levels of IL-4, IL-17A, and IL-23 in one cluster, and Prevotella, Rothia, and Corynebacterium with high levels of IL-6 in the othercluster. [18]
Two studies used previously defined criteria characterisedto group exacerbations into bacterial, viral, or eosinophila dominant subgroups [12]. Z. Wang et al. found that the bacterial subgroup differed most significantly from the eosinophilic subgroup. The bacterial subgroup exhibited decreased alpha diversity (Shannon’s H; p=0.04 using t-test) and a decrease in the Firmicutes (adj. p=6.3e−5 using t-test), as well as an increase in the Proteobacteria (adj. p=2e−4 using t-test) in comparison. This trend was also visible at the genus level, where there was a decrease in Streptococcus (adj. p=0.002 using t-test) and an increase in Haemophilus (adj. p=0.008 using t-test). Similarly, Mayhew et al. also found distinct microbiome compositions (PCoA; UFD) with an increased proportion of Proteobacteria (p<0.001) within the bacterial subgroup when compared to the eosinophilic one [64].Furthermore, the former found that the Proteobacteria:Firmicutes ratio was decreased in the eosinophilic subgroup compared to all other subgroups. It is important to note that individual samples within the two subgroups remained relatively different from each other (PCoA), and the prediction of phenotypes only moderately improved compared with using clinical data only [11].
When exploring the phenotypes transition in individuals,Mayhew et al. foundthat bacterial and eosinophilic exacerbation phenotypeswere likely to repeat(Markov models;p= 9.25E-11 and p=1.42E-3, respectively (χ2 test, df=3)). Within the bacterial phenotype, the transition was again not randomwhen observed forHaemophilusinfluenzaepositive versus negative exacerbations(p=1.42E-12, χ2 test, df=5). The Haemophilus influenza positive exacerbations were more likely to repeat and less likely to transition to negative bacterial exacerbations compared with negative ones (p=2.62E-4, Fisher’s exact test). In addition, when comparing moderate(>3% and <6%) with high sputum eosinophilic exacerbations(>6%), higher eosinophilia levels were likely to repeat in subsequent exacerbations(p=0.02, Fisher’s exact test).This shows a relatively stable microbiome over time. [15].
Conversely, J. Wang et al. observed no significant differences in alpha nor beta diversity between eitherblood-eosinophilic or sputum-eosinophilic compared to non-eosinophilic AECOPD samples. Importantly, they were able to differentiate sputum-eosinophilic from non-sputum-eosinophilic exacerbations using only 15 OTUs (RFM; AUC0.786; specificity 0.857, sensitivity 0.769) and blood-eosinophilic from non-blood-eosinophilic exacerbations (RFM; AUC of 0.870; specificity 0.778, sensitivity 0.917), when using a total of 15 OTUs.[16]
3.6. Correlation with Clinical Indices
Correlations (Spearman correlation analysis) between taxa and clinical indices were observed by Xue et al.and Su et al. Significant positive correlations were observed between Corynebacterium and PCT(p<0.05), as well as Klebsiella and the percentage of eosinophils (p<0.05) andVeillonella with FEV1/FVC (p<0.05). Most significantly correlated with the percentages of sputum neutrophils (adj. p=0.002) and macrophages (adj. p=0.005) was Moraxella according to Z. Wang et al. [11].Negative correlations were found between Haemophilus and Prevotella with the mMRC Dyspnoea scale (p < 0.05). CRP was positively correlated with Staphylococcus and negatively with Alloprevotella (p<0.05). In addition, Porphyromonas together with Gemella, Rothia (p<0.05), Leptotrichia, Prevotella, and Fusobacterium (p<0.01) was significantly negatively correlated with TNF-α, which in turn was significantly positively correlated with Pseudomonas (p<0.01). [17,18] As mentioned above, Z. Wang et al.conducted a network analysis, which they expanded to include clinical variables. Most connections were formed by sputum Interleukin (IL)-8/chemokine (C-X-C motif) ligand (CXCL)8(negative correlation to 15 OTUs) and was linked with a lower microbiome alpha diversity(General linear mixed model (GLMM); Shannon´s H, OF and Chao1 p<0.001 and PD p<0.05 respectively). [11]
3.7. Functional Analysis
Two studies evaluated the functional differences between exacerbated and stable disease.Both found most functions decreased (f.e. replication and repair, translation (Phylogenetic Investigation of Communities by Reconstruction of Unobserved States (PICRUSt)) p<0.05). etc.). On the other hand, membrane transport as well as cxc signal transduction (PICRUSt) analysis; p<0.05), ppGpp, fatty acid super-pathway, and mycolate biosynthesis (PICRUSt2;p<0.05). [17,18].
3.8. The Impact of Treatment
While studying the microbiome’s response to the most important COPD medications, Z. Wang et al. observed that subjects treated with only Corticosteroids had a prolonged (into recovery) decreased α diversity (Shannon´s H), at the phylum level, Proteobacteria increased over Firmicutes and at the genus level Streptococcus decreased. Haemophilus and Moraxella were increased (p<0.05). The opposite was found with antibiotics (with or without steroids). In addition, both Su et al.(SHI and SII; p<0.05) and J. Wang (SHI; p=0076) observed the lowest alpha diversity in recovery samples. On the contrary, J. Wang identified no difference after antibiotic use, as well as Xue et al., including with corticosteroids or both.[11,16,17,18]
4. Discussion
4.1. Summary of Main Results in Context of the Current State of Research
Three included studies [11,17,18] and a previous study [19] found that alpha diversity significantly decreased during exacerbations.On the contrary, other authors, such as Mayhew et al. and J. Wang et al.here [13,16] and other studies [8,9,11],did not find significant differences between exacerbation and stable state. This difference might be explained by the results of another included study, which found the changes in diversity only significant in evolution within the same patients [11]. Another study included in this review found that the alpha diversity decreased with frequent exacerbations [16]. This is supported by one other study [20].Moreover, differences between GOLD severity grades were found [13,16]. In conclusion, suggesting a diverse microbial community might be critical for maintaining lung health. Furthermore, the lung microbiome differed significantly between stable and exacerbated disease in all studies reporting on it [16,17,18], as well as another study [8].
Previous studies found a significant increase in the relative abundance of Proteobacteria [8], with a decreased relative abundance of Firmicutes [7,9]. In contrast, only two of our studies found similar but statistically insignificant changes [11,17]. However, the changes became significant when observed within the evolution of the same patient for Jubinville et al. [6]. Su et al. observed significantly decreased Bacteroidetes and increased Actinobacteria. This obscuring of changes when analysed in groups is supported by another study [8]. Previously, Haemophilus, Pseudomonas [9], and Moraxella [5] were commonly identified as having increased abundance during exacerbation.Moraxella was found to have significantly increased by Mayhew et al., and Xue et al. found all three genra, among others, significantly increased [13,18]. Furthermore, when exploring discriminative bacteria for exacerbations, they were also found [68,69]. However, Hemophilus was found dominant in the stable state by another study included instead [16].Tangedal et al. found no differentiating taxa [8].
In support of the “keystone pathogen” hypothesis, which postulates that “certain low-abundance microbial pathogens can orchestrate inflammatory disease by remodelling a normally benign microbiota into a dysbiotic one [21]. Z. Wang et al. discovered several highly connected “hub” OTUS, the most influential ones being Haemophilus and Moraxella, which were associated with numerous co-exclusive connections and a decrease in microbial alpha diversity. Another study associates Escherichia, Haemophilus, and Pseudomonas with a decreased alphadiversity [6].
Furthermore, the commonly implicated genera in AECOPD are also associated with inflammatory indices, such as Pseudomonas and TNF-α [18] and Moraxella, with the percentages of sputum macrophages and neutrophils [65]. Neutrophils are most attracted by Interleukin (IL)-8/chemokine (C-X-C motif) ligand (CXCL)8 [22], which, in turn, was negatively associated with alpha diversity and had a high degree of microbiota connectivity in one of the included studies [14].This hints at the role of the microbiome in inducing the host inflammatory reaction.
Evidence shows that the different states negatively affect the lungs functional capability, decreasing numerous functions. [17,18].
Overall, this suggests that the shift in the microbiome during exacerbation may involve an increase in a few bacteria, leading to a cascade within the microbiome, diminishing other bacteria, likely commensals. Moreover, these pathogens are associated with different inflammatory markers, which likely demonstrate the activated host´s inflammatory response—possibly decreasing the lung’s functional capacity.
Two included studies found the longitudinal microbiome to be relatively stable within patients but distinct between them, likely due to a destabilisation of the microbiome with exacerbation frequency. Lower alpha diversity in frequent exacerbators further supports this [11,13,16].
Xue et al.identified different clusters among the samples with different microbial compositions and inflammatory markers, indicating the existence of different inflammatory endotypes, including in stable disease. Another three studies grouped their samples into subgroups, including those related to eosinophilia. One found pronounced differences between bacterial and eosinophilic exacerbations, with a significant decrease of alpha diversity and Firmicutes, including Streptococcus and an increase of Proteobacteria, including Hemophilus, in the bacterial subtype. [18].Similarly, another study found increased proteobacteria in the bacterial subgroup. They also found that the transition between phenotypes in evolution was likely to repeat for eosinophilic and bacterial subgroups. [13]
Regarding treatment, the effect of corticosteroids might be prolonged, reducing the diversity of samples in recovery. They were also associated with an increase in Proteobacteria, including Haemophilus and Moraxella and might, therefore, have a detrimental effect on lung health. Another study found similar results [61]. On the other hand, two studies that were included found no difference between treatment groups. [14,16,17,18]
4.2. Applicability of Evidence
So far, no study or review has been able to characterise the microbiome shifts in a manner that allows for definitive recommendations. Nevertheless, blood eosinophilia is already recommended as a biomarker to identify patients who benefit from ICS treatment (>300 eosinophils/µL) . This is further supported by the distinct microbiome between these subtypes, their repeatability, and the detrimental effect of corticosteroids, which were identified in some of the included studies.In the future, Interleukin IL-8might also serve as a potential biomarkerfor the microbiome alpha diversity.
4.3. Limitations of Included Studies and in the Retrieval Process of Studies
Most studies we included had small sample sizes, particularly within the stable group, and were collected locally. Although the small sample size was somewhat addressed in longitudinal studies, the cross-sectional studies had limited ability to exclude confounding factors. Viral and fungal data and other “omics” methodologies were mostly missing;therefore,not the entire microbiomewas characterised.
Additionally, our methods only included a few studies. This is mainly because of the novelty of the studied field. We also searched only a limited number of databases. Moreover, although most commonly used, sputum is more prone to contamination than more invasive samples, and 16S rRNA sequencing has a relatively low depth.
5. Conclusions
We have conducted a systematic review to provide an overview of the current evidence on the changes in COPD lung microbiome between exacerbated and stable states, which were consistently found.
A decreased alpha diversity was commonly but not consistently seen during exacerbations and was associated with more frequent exacerbations and severe disease. Therefore, it is likely critical in maintaining respiratory health.
In multiple studies, Haemophilus, Pseudomonas, and Moraxella were seen to increase in abundance and belong to the discriminating bacteria between disease states. Some were also seen to be“hub” OTUs with a disproportionally big impact on the microbiota, significantly decreasing other OTUs and alpha diversity. In addition, they are also often associated with inflammatory markers, suggesting a role in the pathogenesis of exacerbation between dysbiosis and the activation of the host inflammatory response.
However, we were ultimately unable to conclude the exact taxonomic nature of the microbiome shifts. This is likely because even if we found the microbiome within a patient relatively stable over time, it was heterogeneous between patients. There appear to be multiple distinct exacerbation phenotypes within that have been proven to repeat over time. Hence, further exploration of inflammatory endotypes is needed to possibly establish biomarkers for a patient-tailored approach, which holds the potential to significantly advance patient care.
In the future, longitudinal studies with larger sample sizes across more expansive geographic areas would be ideal. These studies should integrate viral and fungal data and other “omics” to enhance our understanding of AECOPD. Additionally, it isessentialto characterise different inflammatory phenotypes further. And the effects of different treatment modalities on the microbiome.
Data Availability Statement
any ideas, methods, instructions or products referred to in the content.
References
- Global Initiative for chronic obstructive lung disease. 2024 GOLD report [Internet]. Global Initiative for Chronic Obstructive Lung Disease - GOLD. 2023. Available from: https://goldcopd.org/2024-gold-report/.
- Ko FW, Chan KP, Hui DS, Goddard JR, Shaw JG, Reid DW, et al. Acute exacerbation of COPD. Respirology [Internet]. 2016 Mar 30;21(7):1152–65. [CrossRef]
- Introduce to 16S rRNA and 16S rRNA Sequencing | CD Genomics Blog [Internet]. 2024 [cited 2024 Jun 8]. Available from: https://www.cd-genomics.com/blog/introduce-to-16s-rrna-and-16s-rrna-sequencing/.
- Whiteside SA, McGinniss JE, Collman RG. The lung microbiome: progress and promise. Journal of Clinical Investigation. 2021 Aug 2;131(15). [CrossRef]
- Tangedal S, Nielsen R, Aanerud M, Persson LJ, Wiker HG, Bakke PS, et al. Sputum microbiota and inflammation at stable state and during exacerbations in a cohort of chronic obstructive pulmonary disease (COPD) patients. Singanayagam A, editor. PLOS ONE. 2019 Sep 17;14(9):e0222449. [CrossRef]
- Bouquet J, Tabor DE, Silver JS, Nair V, Tovchigrechko A, Griffin MP, et al. Microbial burden and viral exacerbations in a longitudinal multicenter COPD cohort. Respiratory Research. 2020 Mar 30;21(1). [CrossRef]
- Goolam Mahomed T, Peters RPH, Allam M, Ismail A, Mtshali S, Goolam Mahomed A, et al. Lung microbiome of stable and exacerbated COPD patients in Tshwane, South Africa. Scientific Reports. 2021 Oct 5;11(1). [CrossRef]
- Huang YJ, Sethi S, Murphy T, Nariya S, Boushey HA, Lynch SV. Airway Microbiome Dynamics in Exacerbations of Chronic Obstructive Pulmonary Disease. Journal of Clinical Microbiology [Internet]. 2014 Aug 1;52(8):2813–23. [CrossRef]
- O’Farrell HE, Shaw JG, Goh F, Bowman RV, Fong KM, Krause L, et al. Potential clinical utility of multiple target quantitative polymerase chain reaction (qPCR) array to detect microbial pathogens in patients with chronic obstructive pulmonary disease (COPD). Journal of Thoracic Disease [Internet]. 2019 Oct [cited 2022 May 3];11(S17):S2254–65. [CrossRef]
- Yang J, Zhang Q, Zhang J, Ouyang Y, Sun Z, Liu X, et al. Exploring the Change of Host and Microorganism in Chronic Obstructive Pulmonary Disease Patients Based on Metagenomic and Metatranscriptomic Sequencing. Frontiers in microbiology. 2022 Mar 16;13. [CrossRef]
- Wang Z, Bafadhel M, Haldar K, Spivak A, Mayhew D, Miller BE, et al. Lung microbiome dynamics in COPD exacerbations. The European Respiratory Journal [Internet]. 2016 Apr 1 [cited 2022 Apr 3];47(4):1082–92. [CrossRef]
- Bafadhel M, McKenna S, Terry S, Mistry V, Reid C, Haldar P, et al. Acute Exacerbations of Chronic Obstructive Pulmonary Disease. American Journal of Respiratory and Critical Care Medicine [Internet]. 2011 Sep 15;184(6):662–71. [CrossRef]
- Mayhew D, Devos N, Lambert C, Brown JR, Clarke SC, Kim VL, et al. Longitudinal profiling of the lung microbiome in the AERIS study demonstrates repeatability of bacterial and eosinophilic COPD exacerbations. Thorax. 2018 Jan 31;73(5):422–30. [CrossRef]
- ClinicalTrials.gov [Internet]. clinicaltrials.gov. [cited 2024 Jul 3]. Available from: https://clinicaltrials.gov/study/NCT01360398.
- Jubinville E, Veillette M, Milot J, Maltais F, Comeau AM, Levesque RC, et al. Exacerbation induces a microbiota shift in sputa of COPD patients. Zoetendal EG, editor. PLOS ONE. 2018 Mar 26;13(3):e0194355. [CrossRef]
- Wang J, Chai J, L S, Zhao J, Chang C. The sputum microbiome associated with different sub-types of AECOPD in a Chinese cohort. BMC Infectious Diseases. 2020 Aug 18;20(1). [CrossRef]
- Su L, Qiao Y, Luo J, Huang R, Li Z, Zhang H, et al. Characteristics of the sputum microbiome in COPD exacerbations and correlations between clinical indices. Journal of Translational Medicine. 2022 Feb 5;20(1). [CrossRef]
- Xue Q, Xie Y, He Y, Yu Y, Fang G, Yu W, et al. Lung microbiome and cytokine profiles in different disease states of COPD: a cohort study. Scientific Reports [Internet]. 2023 Apr 7 [cited 2023 Dec 21];13(1):5715. [CrossRef]
- Toraldo DM, Conte L. Influence of the Lung Microbiota Dysbiosis in Chronic Obstructive Pulmonary Disease Exacerbations: The Controversial Use of Corticosteroid and Antibiotic Treatments and the Role of Eosinophils as a Disease Marker. Journal of Clinical Medicine Research [Internet]. 2019 [cited 2022 Jun 6];11(10):667–75. [CrossRef]
- Li W, Wang B, Tan M, Song X, Xie S, Wang C. Analysis of sputum microbial metagenome in COPD based on exacerbation frequency and lung function: a case control study. Respiratory Research. 2022 Nov 19;23(1). [CrossRef]
- Hajishengallis G, Darveau RP, Curtis MA. The keystone-pathogen hypothesis. Nature Reviews Microbiology. 2012 Sep 3;10(10):717–25. [CrossRef]
- Larsson K. Inflammatory markers in COPD. The Clinical Respiratory Journal. 2008 Sep 3;2:84–7. [CrossRef]
Figure 1.
PRISMA flowchart, showing study selection.
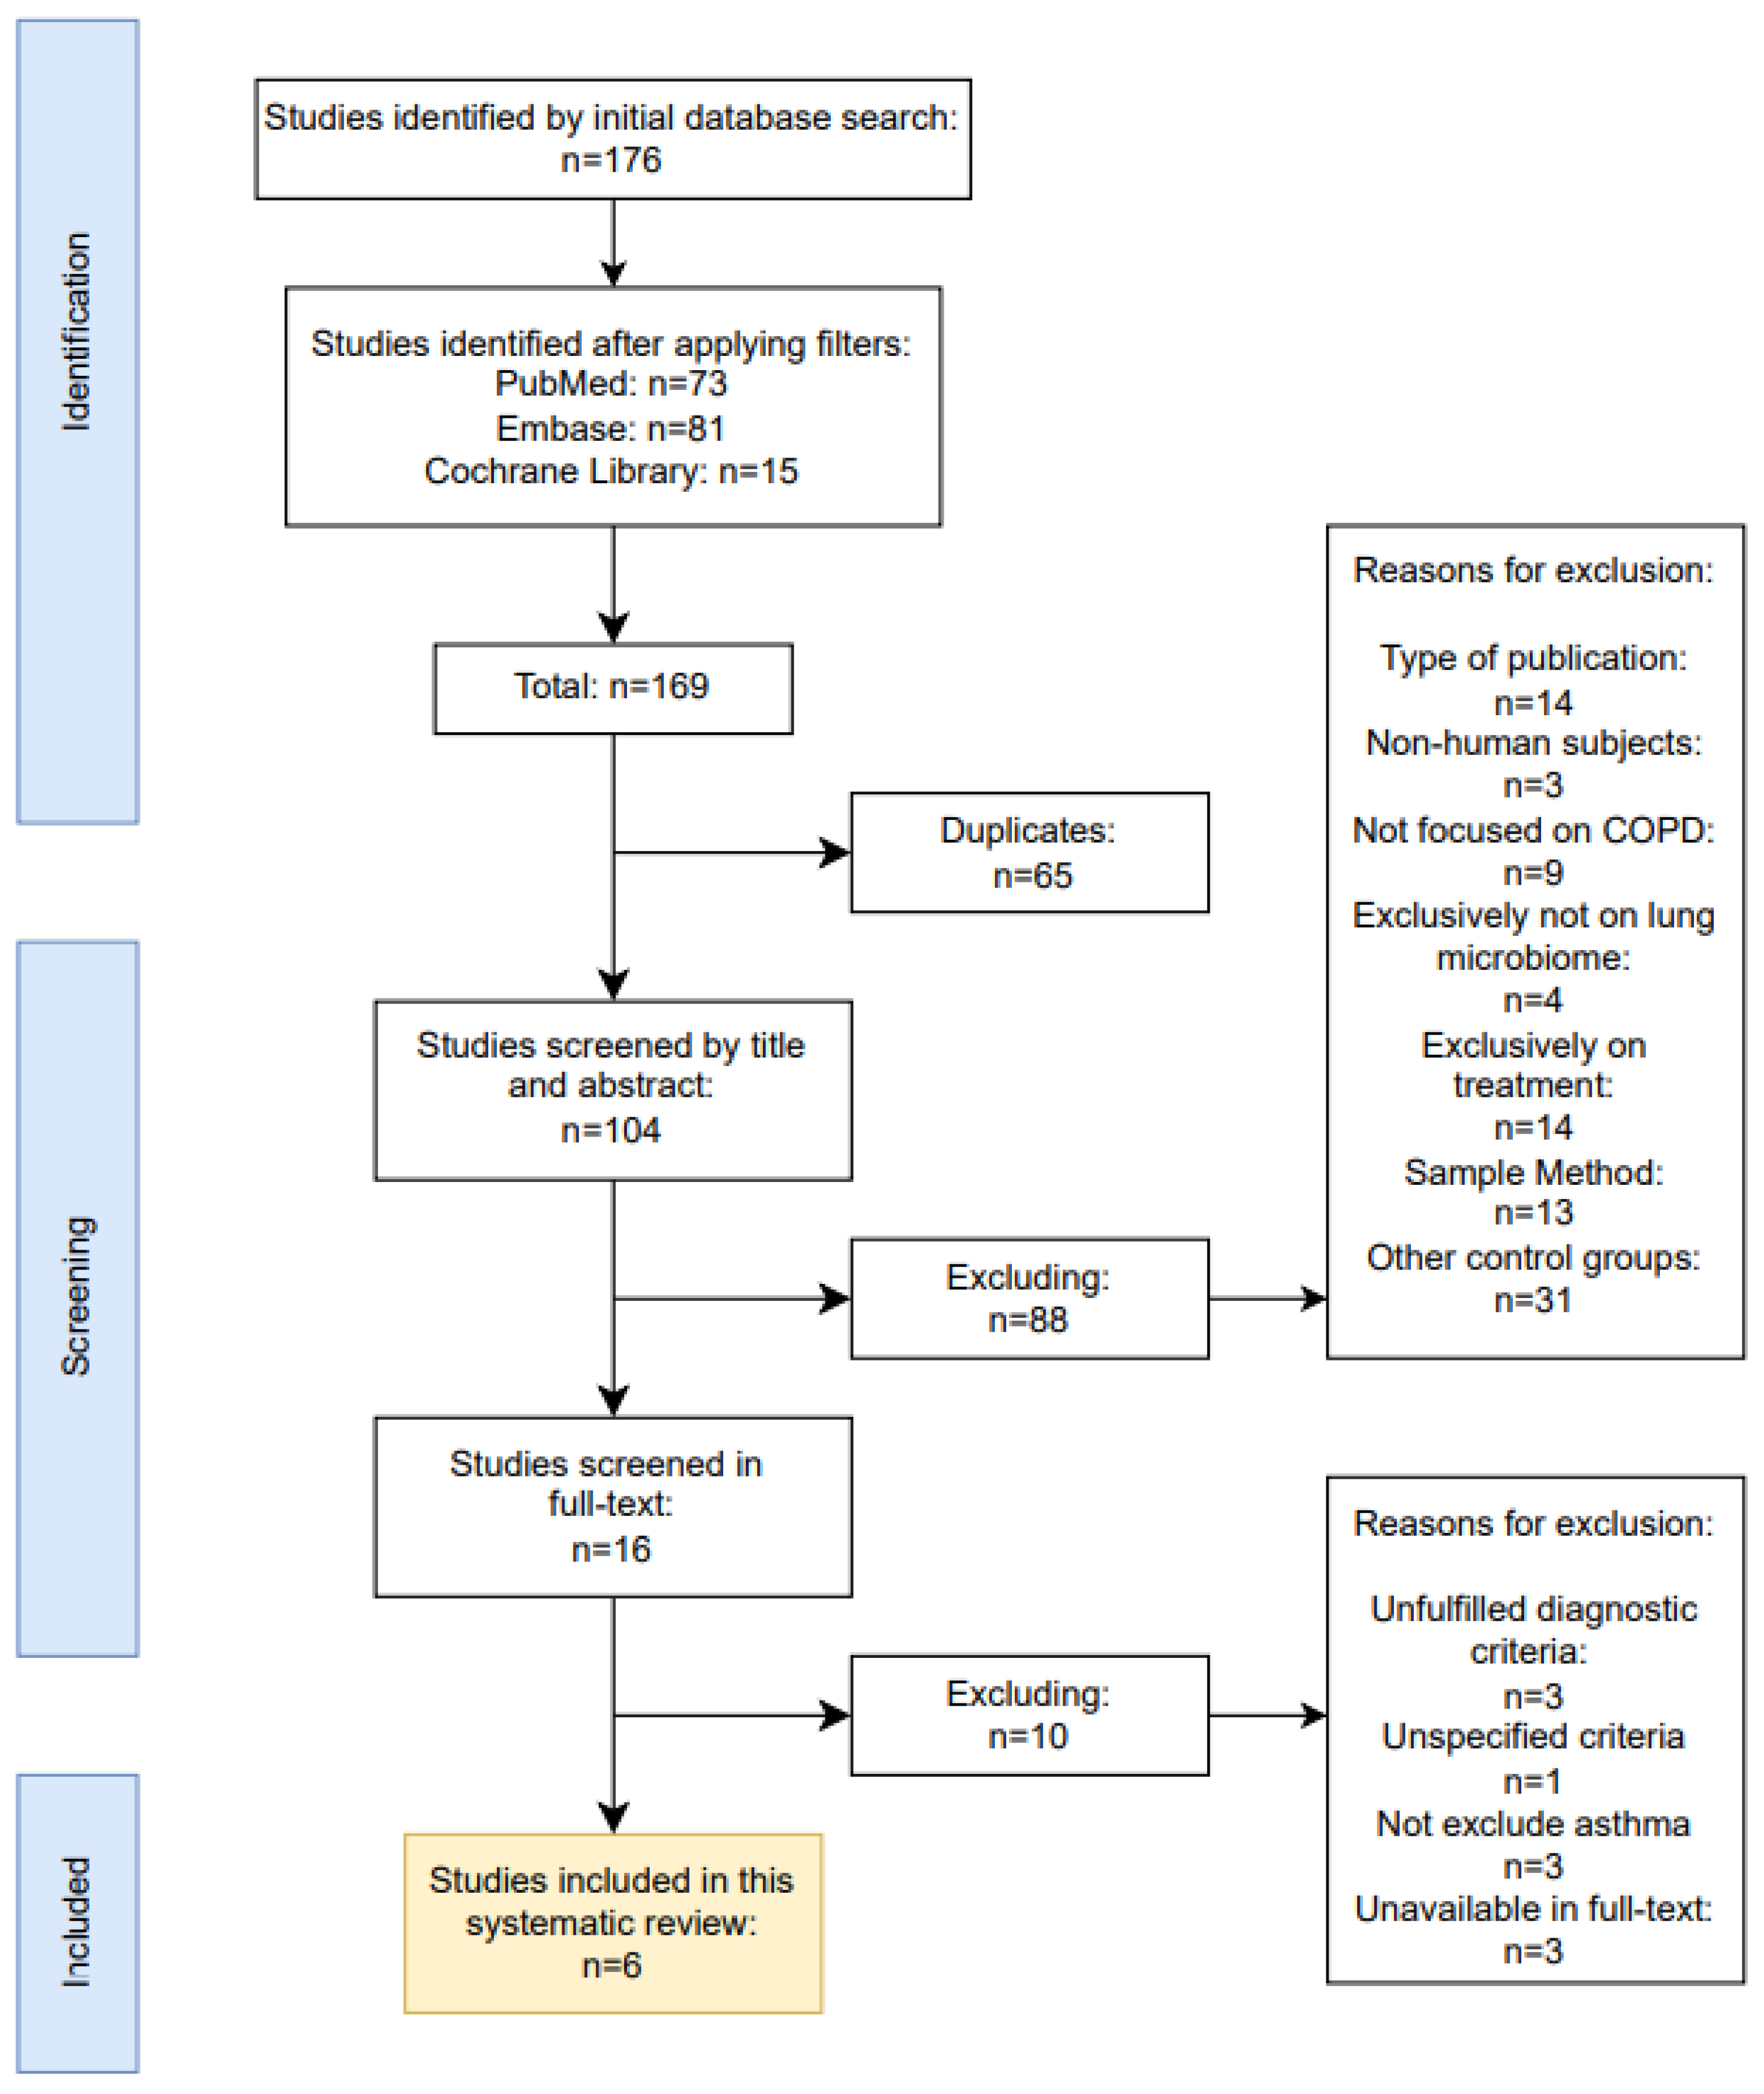
Table 1.
Characteristics of some of the Excluded Studies.
| Reasons for exclusion | Diagnosis criteria unfulfilled | Diagnostic criteria unspecified | Failed to exclude patients with concomitant asthma | Unavailable in full-text |
|---|---|---|---|---|
| Location | South Africa | China | Bulgaria, Czech Republic and USA | Spain |
| Publication year | 2014 | 2022 | 2020 | 2019 |
| Title | Bacterial airway microbiome dynamics in exacerbations of chronic obstructive pulmonary disease | Exploring the Change of Host and Microorganism in Chronic Obstructive Pulmonary Disease Patients Based on Metagenomic and Metatranscriptomic Sequencing | Microbial burden and viral exacerbations in a longitudinal multicenter COPD cohort | Sputum Microbiome Dynamics in Chronic Obstructive Pulmonary Disease Patients during an Exacerbation Event and Post-Stabilization |
| Author | Huang et al. [58] | Yang et al.[60] | Bouquet et al.[56] | López Caro et al.[53] |
Table 2.
Characteristics of Included Studies.
| Outcomes | OTU RA, D, Network analysis (OTU, CI), Eos SG | OTU RA, D, Markov chain analysis | OTU RA, D, quantity, GOLD SG | OTU RA, D, Eos SG, RFM | OTU RA, D, discriminators, CI correlation, functional state | OTU RA, D, CI correlation, functional discriminators state, SG |
|---|---|---|---|---|---|---|
| Sample collection | 376 (137 AE, 106 S*, 136 PT**, 97 R7***; 87 P) |
584 (161 AE, 423 S; 104 P) |
18 (9 AE, 9 S; 9 P) |
68 (36 AE, 4 S****, 18 R**, 10 H) |
76 (28 AE, 23 S, 15 R**, 10 H) |
113 (35 AE, 35 PT, 43 S*****; 35 P) |
| Methods | Cohort | Cohort | Cohort | Cross-sectional | Cross-sectional | Cohort |
| Location | United Kingdom | United Kingdom | Canada | China | China | China |
| Publication year | 2016 | 2018 | 2018 | 2020 | 2022 | 2023 |
| Title | Lung microbiome dynamics in COPD exacerbations | Longitudinal profiling of the lung microbiome in the AERIS study demonstrates repeatability of bacterial and eosinophilic COPD exacerbations | Exacerbation induces a microbiota shift in sputa of COPD patients | The sputum microbiome associated with different sub-types of AECOPD in a Chinese cohort | Characteristics of the sputum microbiome in COPD exacerbations and correlations between clinical indices | Lung microbiome and cytokine profiles in different disease states of COPD: a cohort study |
| Author | Z. Wanget al.[62] | Mayhew et al. [64] | Jubinville et al.[66] | J. Wanget al.[67] | Suet al.[68] | Xue et al.[69] |
Abbreviations: AE – Exacerbation, S – Stable, PT – Post-therapy, R – 6 weeks recovery, P – Patients, H – Healthy, OTU – Operational taxonomic unit, CI – Clinical indices, RA – Relative abundance, D – Diversity,Eo - Eosinophilia, SG – Subgroup, UFD - UniFrac distances, MCA - Markov chain analysis, RFM - Random forest model. Note: *8 weeks free from exacerbation **2 weeks post-therapy ***6 weeks ****3 months free from acute exacerbation ***** 4 weeks free from an exacerbation.3. Results.
Disclaimer/Publisher’s Note: The statements, opinions and data contained in all publications are solely those of the individual author(s) and contributor(s) and not of MDPI and/or the editor(s). MDPI and/or the editor(s) disclaim responsibility for any injury to people or property resulting from any ideas, methods, instructions or products referred to in the content. |
© 2024 by the authors. Licensee MDPI, Basel, Switzerland. This article is an open access article distributed under the terms and conditions of the Creative Commons Attribution (CC BY) license (http://creativecommons.org/licenses/by/4.0/).
Copyright: This open access article is published under a Creative Commons CC BY 4.0 license, which permit the free download, distribution, and reuse, provided that the author and preprint are cited in any reuse.


